Review

Text Mining in Remotely Sensed Phenology Studies: A Review on Research Development, Main Topics, and Emerging Issues

1
Council for Agricultural Research and Economics, Research Centre for Agriculture and Environment (CREA-AA), 00184 Rome, Italy
2
Department of Engineering, Roma Tre University, 00146 Rome, Italy
3
Council for Agricultural Research and Economics, Research Centre for Engineering and Agro-Food Processing (CREA-IT), 00015 Monterotondo, Italy
4
Department of Environmental Biology, University of Rome “La Sapienza”, 00185 Rome, Italy
*
Author to whom correspondence should be addressed.
Remote Sens. 2019, 11(23), 2751; https://doi.org/10.3390/rs11232751
Submission received: 31 October 2019 / Revised: 18 November 2019 / Accepted: 21 November 2019 / Published: 22 November 2019
(This article belongs to the Special Issue Remote Sensing of Vegetation Phenology)

Abstract

:
As an interdisciplinary field of research, phenology is developing rapidly, and the contents of phenological research have become increasingly abundant. In addition, the potentiality of remote sensing technologies has largely contributed to the growth and complexity of this discipline, in terms of the scale of analysis, techniques of data processing, and a variety of topics. As a consequence, it is increasingly difficult for scientists to get a clear picture of remotely sensed phenology (rs+pheno) research. Bibliometric analysis is increasingly used for the study of a discipline and its conceptual dynamics. This review analyzed the last 40 years (1979–2018) of publications in the rs+pheno field retrieved from the Scopus database; such publications were investigated by means of a text mining approach, both in terms of bibliographic and text data. Results demonstrated that rs+pheno research is exponentially growing through time; however, it is primarily considered a subset of remote sensing science rather than a branch of phenology. In this framework, in the last decade, agriculture is becoming more and more a standalone science in rs+pheno research, independently from other related topics, e.g., classification. On the contrary, forestry struggles to gain its thematic role in rs+pheno studies and remains strictly connected with climate change issues. Classification and mapping represent the major rs+pheno topic, together with the extraction and the analysis of phenological metrics, like the start of the growing season. To the contrary, forest ecophysiology, in terms of ecosystem respiration and net ecosystem exchange, results as the most relevant new topic, together with the use of the red edge band and SAR (Synthetic Aperture Radar) data in rs+pheno agricultural studies. Some niche emerging rs+pheno topics may be recognized in the ocean and arctic investigations linked to phytoplankton blooming and ice cover dynamics. The findings of this study might be applicable for planning and managing remotely sensed phenology research; scientists involved in such discipline might use this study as a reference to consider their research domain in a broader dynamical network.

Graphical Abstract

1. Introduction

Phenology is an integrative environmental science embracing biometeorology, ecology, and evolutionary biology [1]; it has become a major concern in current global change research due to its ability to monitor, understand, and predict the periodicity of biological events related to climate [2], from intra- to inter-specific level to global scale.
As discussed by Forrest and Miller-Rushing [3], historically, because of its concrete application in agricultural cultivations, much phenological research has focused on issues, such as pest management, agro-meteorology, and horticulture, overlooking purely phenological topics. Even ecology-based studies with a marked phenological focus did not refer to phenology as a science per se [3].
In the last two decades, the growing attention on the impacts of climate change has exponentially enhanced the interest towards phenology. The recent launch of the USA National Phenology Network (USA-NPN; https://www.usanpn.org/), the Pan European Phenology Project (PEP725; http://www.pep725.eu/), the Phenological Eyes Network in Japan (PEN; http://www.pheno-eye.org), the GLOBE phenology project (https://www.globe.gov/web/phenology-and-climate) confirm the current necessity of understanding phenological dynamics under a changing environment and at multiple geographical scales [4,5].
Plant phenology has been studied at a range of spatial and temporal scales and by employing a variety of tools [6]. Phenological studies can be led through small scale, ground-based studies [7], and large-scale investigations using proxy approaches through remote sensing (the so-called land surface phenology, LSP) [8,9]. Significant limitations exist in monitoring phenology at the ground level, mainly due to the difficulty of (i) harmonizing data records over plant species and phenological events; (ii) using such data at global or regional scales due to the time and efforts consuming nature of field observations; (iii) integrating field data with observations of climatic variables, which have a very coarse spatial resolution; and (iv) extending the phenological events identified from individual species to communities [10].
Remotely sensed phenology (rs+pheno), or LSP, has the potentiality to overcome some of the field observation limits, filling the gap between traditional phenological (field) observations and the large-scale view of global models [11], enabling the mapping and monitoring of phenology at the ecosystem level, and providing an integrative framework at the landscape scale [12]. Satellite observations constitute a spatially aggregated signal from heterogeneous surface conditions that may not be representative of any single plant species response (pixel size from meters—e.g., Sentinel-2, to km—e.g., SPOT (Satellite Probatoire d’Observation de la Terre) Vegetation) [9]. Rs+pheno is defined as the seasonal pattern of variation of vegetation indices (i.e., greening, senescence, dormancy, etc.) in vegetated land surfaces observed from satellite remote sensing [13]. Accordingly, the length of the time series (from 5 years of Sentinel-2 to 30 years of Landsat), the high temporal frequency (from twice daily of MODIS (Moderate Resolution Imaging Spectroradiometer) to 5 days of Sentinel-2), internal consistency, and continuous availability of the satellite measurements are fundamental requirements when dealing with ecosystem responses to climate change dynamics [14].
Large to small scale remote sensing techniques are based on deriving vegetation indices (VIs), leaf area index (LAI), a fraction of absorbed photosynthetically active radiation (fAPAR) from satellite-based sensors [15]. Most studies on vegetation phenology are based on the normalized difference vegetation index (NDVI, [16]) or the enhanced vegetation index (EVI, [15]), measures of ‘greenness’ [17] that can be related to plant canopy absorption of photosynthetically active radiation [18] and Gross Primary Productivity (GPP) [19]. The evolution of remotely sensed VIs through time exhibits a strong correlation with the typical vegetation growth stages. The VIs temporal curves allow to quantify intra-annual changes in the timing and intensity of vegetation activity and to extract useful metrics about the vegetation growing season, such as the timing of the start, the end, and the length of the growing season, at various scales [20].
In the past few decades, within the framework of increasing interest in phenology, rs+pheno studies showed a marked intensification that could be explained by the nonstop development of satellite remote sensing technology and its ability to provide temporally continuous information about the ecosystem responses to climate change at different spatio-temporal scales. Satellite observations are hence becoming increasingly important for phenological investigations, and given the growing interest towards rs+pheno, an overall vision of what has been explored up to now, together with the identification of research trends, key topics, gaps, and new questions may represent an important knowledge tool when framing a research and exploring the state-of-the-art of a scientific issue.
In recent years, bibliometric analysis has played an increasingly important role in the framework of understanding science and technology tendencies [21], thanks to its potentiality to document the development of a wide range of research fields [22,23,24,25]. Some studies started to explore topic frequencies and concept trends in phenological studies, but only for a specific country or a specific subject area. For instance, Adole et al. [26] examined all peer-reviewed literature on Africa’s vegetation phenology to provide a synthesis of such studies and classified them based on the methods and techniques used in order to identify major research gaps; Nagai et al. [27] reviewed remote sensing phenological studies in Japan and discussed current knowledge, problems, and future developments based on these studies; Uribe-Toril et al. [28] in the bibliometric overview of the Forests journal aimed at highlighting the state of the art of forestry, cited as a major research cluster the integration of MODIS and Landsat imagery for mapping forest biomass and phenology. Other bibliometric studies analyzed major topics and concepts in remote sensing research fields either in general [29,30] or based on specific issues, like crop growth monitoring [31], water research [32], archaeology [33], etc.
To the best of our knowledge, this is the first attempt to carry out a broad literature analysis to explore and summarize the remotely sensed phenology (rs+pheno) studies through time at a global level. We performed such analysis through a text mining approach. Text mining is the use of automated methods for exploiting the huge amount of knowledge available in the scientific literature [34]; it consists of deriving high-quality information (in terms of relevance, novelty, and interest) from text through the recognitions of patterns and trends by means of statistical pattern learning [35]. In this review, we performed a bibliometric text mining analysis of rs+pheno research over the last 40 years (1979–2018) aimed at (1) quantifying the distribution of publications and journals for articles covering rs+pheno research, (2) examining the rs+pheno keywords frequency and tendencies, and (3) exploring the rs+pheno research development to identify key topics, new research niches, and emerging issues.

2. Materials and Methods

2.1. Data Retrieving

The rs+pheno literature search was performed using Elsevier Scopus electronic scientific databases. The search terms were ‘phenolog*’ and ‘remote* PRE/0 sens*’ in the title, abstract, and keywords; only peer-reviewed documents published in English between 1979 and 2018 were considered. The subject areas covering ‘medical’, ‘economical’, ‘artistic’, ‘chemical’, ‘veterinary’ issues were excluded. This search yielded documents composed of articles, conference papers, reviews, books chapter, conference reviews, notes, articles in press, books, editorials, and letters.
After recovering the data, a first analysis was performed according to the Scopus statistics on the publications retrieved. We analyzed the temporal trend of the number of rs+pheno papers from 1979 to 2018 with respect to the number of all the scientific papers published in the same time interval.

2.2. Text Mining Analysis

A text mining analysis was performed on the rs+pheno literature data of the last 20-year period to analyze the rs+pheno research evolution through term network extraction and scientific mapping. We focused only on the periods 1999–2008 and 2009–2018 because the number of rs+pheno publications in the periods 1979–1988 and 1989–1998 was too small to allow a comparison among the four decades. To this aim, the VOSviewer software (www.vosviewer.com) was used: first, a network is constructed on the basis of the data made available to VOSviewer; then, accordingly, clustering is performed, and groups of related terms are mapped [36]. The data provided to VOSviewer might be bibliographic data or text data. Bibliographic data are all the information easily retrievable from a publication like Authors, Organizations, Countries, Year of publication, Author keywords, Index keywords, Citations; on the contrary, text data are terms that can be extracted from Abstract and/or Title by means of an ad hoc algorithm. When dealing with bibliographic data, a co-occurrence analysis can be directly performed based on both authors’ and indexed keywords, and a network is constructed accordingly. On the contrary, when analyzing text data, firstly terms need to be identified in the text (i.e., title and abstract). VOSviewer defines a term as a noun phrase, i.e., a sequence of one or more consecutive words within a sentence. For selecting the most relevant terms, the distribution of co-occurrences across all noun phrases is computed. While occurrence expresses the number of times a term occurs in a set of papers (i.e., how many papers cite that term), relevance depends on the co-occurrence of a given term with others: low relevant terms tend to co-occur with several different terms; on the contrary, high relevant terms tend to co-occur always with a specific set of terms. Terms with a low relevance (or with a general meaning) have a more or less equal distribution of their co-occurrences, while terms with a high relevance (or with a specific meaning) have a distribution of their co-occurrences that is significantly biased towards certain noun phrases. In a co-occurrence network, terms with a specific high relevance are clustered together; each cluster may be seen as a scientific domain or topic [37]. Finally, both for bibliographic and text data, a bi-dimensional map is created based on the constructed network of the selected terms, where the smaller the distance between two terms, the larger the number of their co-occurrences and hence their relatedness [38].
Based on bibliographic data, in order to study the evolution of keywords in the last two decades, we analyzed the most used keywords separately for 1999–2008 and 2009–2018. We kept only keywords with a minimum number of occurrence threshold equal to 20, i.e., the number of times a keyword must be present in the dataset to be used in the analysis. The term ‘remote sensing’, ‘phenology’, and ‘vegetation’ were excluded from the mapping in order to avoid overcited keywords. Then, we analyzed the text data for 1999–2008 and 2009–2018 separately. A term minimum number of occurrence threshold equal to 10 was used. For each of the retrieved terms, a relevance score (rel. score) was calculated. Based on this score, among all the terms identified, only the most relevant terms were selected (60% as default choice). The occurrence threshold was chosen based on a subjective criterion in order to have a manageable and, at the same time, a representative number of keywords and terms.
Finally, we analyzed the temporal trend over the last 40 years (1979–2018) of the ten most relevant terms identified in the 2009–2018 decade. To this aim, we trained a topic (i.e., term) model over the entire dataset and extracted for each article the related topics. The topic model was developed according to Lau and Baldwin [39] by jointly training the word2vec (an algorithm able to learn the similarity among words; [40]) and paragraph vectors (an algorithm able to learn the similarity among documents; [41]) models: in the embedding distribution space, a certain document will be placed close to terms describing its related topics. The frequency of each selected term (i.e., the number of publications where it occurred) in a certain year was normalized with respect to the amount of all the rs+pheno articles published in that year. A 5-years moving average over the 40 years trend was used to smooth out short-term fluctuations in time series data and highlight long-term trends. For this analysis, only the most relevant terms identified in 2009–2018 were selected among all the terms.
In order to avoid term repetition and to assure VOSviewer consistency, a thesaurus file was drafted. This file linked synonyms, different terms that express a unique concept, different spellings of the same word or the same abbreviation, plural/singular terms, common/Latin names of plants, etc. with one unique, unambiguous term.

3. Results

In the period analyzed (1979–2018), the Scopus archive search identified 2315 scientific publications (see Supplementary Materials). According to Figure 1, the rs+pheno research field has been significantly increasing (r2 = 0.75) independently from the general tendency of producing more and more publications.
Comprehensively, 117 journals have been used to publish researches about remotely-sensed phenology. Table 1 shows the journals that published more than 20 papers from 1979 to 2018. Among these, the most prestigious journals (impact factor, IF > 5) used in rs+pheno studies were: Global Change Biology (GCB, IF = 8.88), Remote Sensing of Environment (RSE, IF = 8.218), ISPRS-Journal of Photogrammetry and Remote Sensing (ISPRS, IF = 6.942), and IEEE-Transactions on Geoscience and Remote Sensing (IEEE, IF = 5.63); on the contrary, the most cited (H index > 200) were: RSE (H index = 238), GCB (H index = 217), and IEEE-Transactions on Geoscience and Remote Sensing (H index = 216). The most active journals (>100 publications) were: RSE, International Geoscience and Remote Sensing Symposium-IGARSS, Remote Sensing (RS), International Journal of Remote Sensing (IJRS), and Proceedings of SPIE-The International Society for Optical Engineering (SPIE) with, respectively, 232, 166, 150, 148, and 117 papers. It is to be noticed that, among the most publishing, the only journals without remote sensing-like terms in their title were Agricultural and Forest Meteorology (AFM, 57), Global Change Biology (GCB, 30), and Ecological Indicators (EI, 23). According to Figure 2, the journals with the longest history in rs+pheno studies were RSE and IJRS (since 1980), while the most recent was RS (since 2009). However, the latter showed a marked increase in the last three years, twice the other journals. As for the purely ecology-based journals, the first one publishing a paper in rs+pheno was AFM in 1996, followed by GCB in 2003 and EI in 2009; AFM still represents the most active.
From the bibliographic data network analysis, two maps were derived (Figure 3 and Figure 4) with 47 keywords for 1999–2008 and 214 keywords for 2009–2018: the closer the keywords, the higher their relatedness. The comparison between the two keyword maps underlined, on one hand, the growing role of MODIS and time-series data in rs+pheno studies, and, on the other hand, the larger dispersion of terms in the first decade with respect to the higher concentration in the second decade, which was also characterized by a massive enrichment of new research arguments. In particular, in 2009–2018, ‘forestry’, ‘crops’, ‘biology’, ‘ecosystem’, ‘climate change’, and ‘time-series’ represented the main issues around which the other keywords were distributed. Some examples of new major keywords appeared in 2009–2018 were: ‘primary productivity’, ‘growing season’, ‘spatial variability’, ‘biodiversity’, ‘image reconstruction’, ‘harmonic analysis’, ‘trend analysis’, ‘accuracy’, ‘machine learning’, ‘uav’, ‘radar’, etc. According to Figure 3, one of the newest keywords in 1999–2008 was ‘spatial resolution’; while in 2009–2018 (Figure 4), the keywords most used in the recent years were ‘cost efficiency’ and ‘random forest’, while those mainly used at the beginning of the decade were ‘geology’, ‘water supply’, ‘irrigation’, and ‘carbon flux’.
The text data analysis produced the term network maps of Figure 5 and Figure 6, respectively, for the period 1999–2008 (99 terms) and 2009–2018 (383 terms). In the first decade (Figure 5), two groups could be identified, even if quite interspersed. The red cluster was mainly characterized by terms strictly associated to phenology metrics (e.g., greenness, start, end, and length of season), vegetation and canopy indices and their annual profiles (e.g., NDVI time-series, EVI, LAI, fAPAR, amplitude, peak), climate change-related issues (e.g., temperature, trend, interannual variability, drought, fire), and forestry (e.g., canopy, leaf, forest type, tropical forest, boreal forest). The blue cluster was mainly composed of terms related to the classification (i.e., accuracy, mapping, change detection, discrimination, land cover, unsupervised classification), crop modeling (e.g., crops, growth, yield, prediction, cost efficiency, management), and the crop growing season (i.e., months from March to November). It is to be noticed that the only highly cited sensor was Landsat that belongs to the blue cluster.
In the second decade (Figure 6), three groups could be clearly distinguished. The red cluster was mainly characterized by terms associated to phenology climate-based drivers (e.g., precipitation, temperature, LUE (light use efficiency), latitude, altitude, solar radiation), phenology metrics and their trend (e.g., start, end, and length of season, response, increase, delay, MODIS time-series), climate change-related effects (e.g., disturbance, dry season, moisture, fire, resilience, species composition), forest ecophysiology (e.g., carbon, carbon cycle, carbon flux, ecosystem respiration, fAPAR, GPP, net ecosystem exchange (NEE), exchange), ocean and arctic dynamics (e.g., phytoplankton, phytoplankton bloom, ice, ice cover, GIMMS (Global Inventory Modeling and Mapping Studies), and regions like Cerrado, Tropic, Savanna, North America, and Tibetan Plateau. The blue cluster was mainly composed of terms related to phenology applications in agriculture (e.g., yield, food, crop classification, growth stage, sowing date, crop management, low cost), crop types (e.g., crops, wheat, maize, vineyard, soy, barley), water resource (e.g., irrigation, water use, water stress, soil moisture), crop modeling (e.g., assimilation, model result, evapotranspiration, ancillary data, sensitivity analysis), sensor and bands used (e.g., SAR - Synthetic Aperture Radar image, Rapideye, SPOT, Sentinel, MODIS products, backscattering, SWIR - Short Wave Infrared, NIR - Near Infrared, red edge), and regions like Thailandia, Northern China, and Germany. The orange cluster was mainly composed of terms related to classification methods and validation (i.e., endmember, object-oriented, support vector machine (SVM), spectral angle mapper (SAM), random forest, kappa coefficient, accuracy, field survey), spectral data characteristics (e.g., Worldview, Landsat, high spatial resolution, hyperspectral data, coarse spatial resolution, shadow, spectral response, cost efficiency), environmental resources (e.g., conservation, biodiversity, long term change, human activity, urbanization, deforestation, invasion, habitat, land cover, species distribution), and regions like Greece and Japan.
The comparison of the ten most occurrent terms for 1999–2008 and 2009–2018 (Table 2) highlighted that terms like ‘classification’, ‘accuracy’, ‘mapping’, and ‘temperature’ were the most used one, with similar relevance and similar (relative) occurrence, in both decades. On the contrary, ‘SOS’, although present in both decades, in 1999–2008 was characterized by a higher relevance with respect to 2009–2018. ‘LAI’ was the main term in 1999–2008, but it disappeared in 2009–2018; while, ‘response’, ‘trend’, and ‘climate change’ appeared in the last decade. It is to be noticed that the term ‘NDVI’ was not present in the list of ten most occurrent terms. This could probably be explained by the fact that, as largely adopted, NDVI could appear not only as a single term but also as a composed term, like ‘NDVI time-series’, ‘NDVI data’, ‘MODIS NDVI data’, ‘NDVI value’, ‘NDVI image’, etc. As a consequence, the NDVI term occurrence is diluted into the different forms of use.
The comparison of the ten most relevant terms for 1999–2008 and 2009–2018 (Table 3) showed that, apart from terms like crop type that can be recovered as crop classification and carbon flux as carbon uptake, almost all of the terms and related concepts of the first decade tended to lose their relevance in the following decade. In the first decade, the majority of the relevant terms belonged to the agriculture/classification (blue) cluster and were mainly related to crop type (rel. score = 2.14), yield (rel. score = 1.83), and growing season (e.g., July, rel. score = 2.60; May, rel. score = 2.30), and secondarily to image classification (unsupervised classification, rel. score = 2.09); for the phenology/climate (red) cluster, the only most relevant term was related to the geographical area of the analysis, i.e., North America (rel. score = 2.32). On the contrary, the most relevant terms in 2009–2018 were related to the phenology/climate cluster (red), e.g., ecosystem respiration (rel. score = 4.24), NEE – Net Ecosystem Exchange (rel. score = 3.20), and carbon uptake (rel. score = 2.91), followed by terms of the purely agricultural topic (blue): crop classification (rel. score = 2.85), and the use of red edge band (rel. score = 2.53) and SAR images (rel. score = 2.47). The most relevant terms belonging to the classification (orange) cluster was SVM–Support Vector Machine (rel. score = 2.34). Finally, it is to be noticed the presence in 2009–2018 of the term yield prediction (rel. score = 2.28).
Finally, Figure 7 shows the temporal trend of the frequency of the ten most relevant terms identified in 2009–2018 (see Table 3) over the whole study period. The papers, dealing with the selected terms, passed from being 2% to 15% with respect to the total rs+pheno papers. In the early 1980s, only some of the most relevant terms were found, i.e., red edge, major crops, yield prediction. Overall, the majority of the terms were characterized by a gradually growing trend; on the contrary, yield prediction showed a fast increase in the last decade (2009–2018). The terms with the highest frequency were red edge and SAR. The red edge term showed a quite constant trend until the beginning of the last decade when it showed a slight increase. Particularly interesting were the trends of SAR and SVM terms. The former presented a fast growth until its peak around 1995, and then a fast decreasing trend, with a moderate recovery in the last decade. The latter was characterized by an initial interest that ended completely at the end of the 1980s and arose again after the year 2000. It is to be noticed that some terms, like eddy covariance, carbon uptake, and ecosystem respiration, were not taken into consideration until the beginning of the 1990s.

4. Discussion

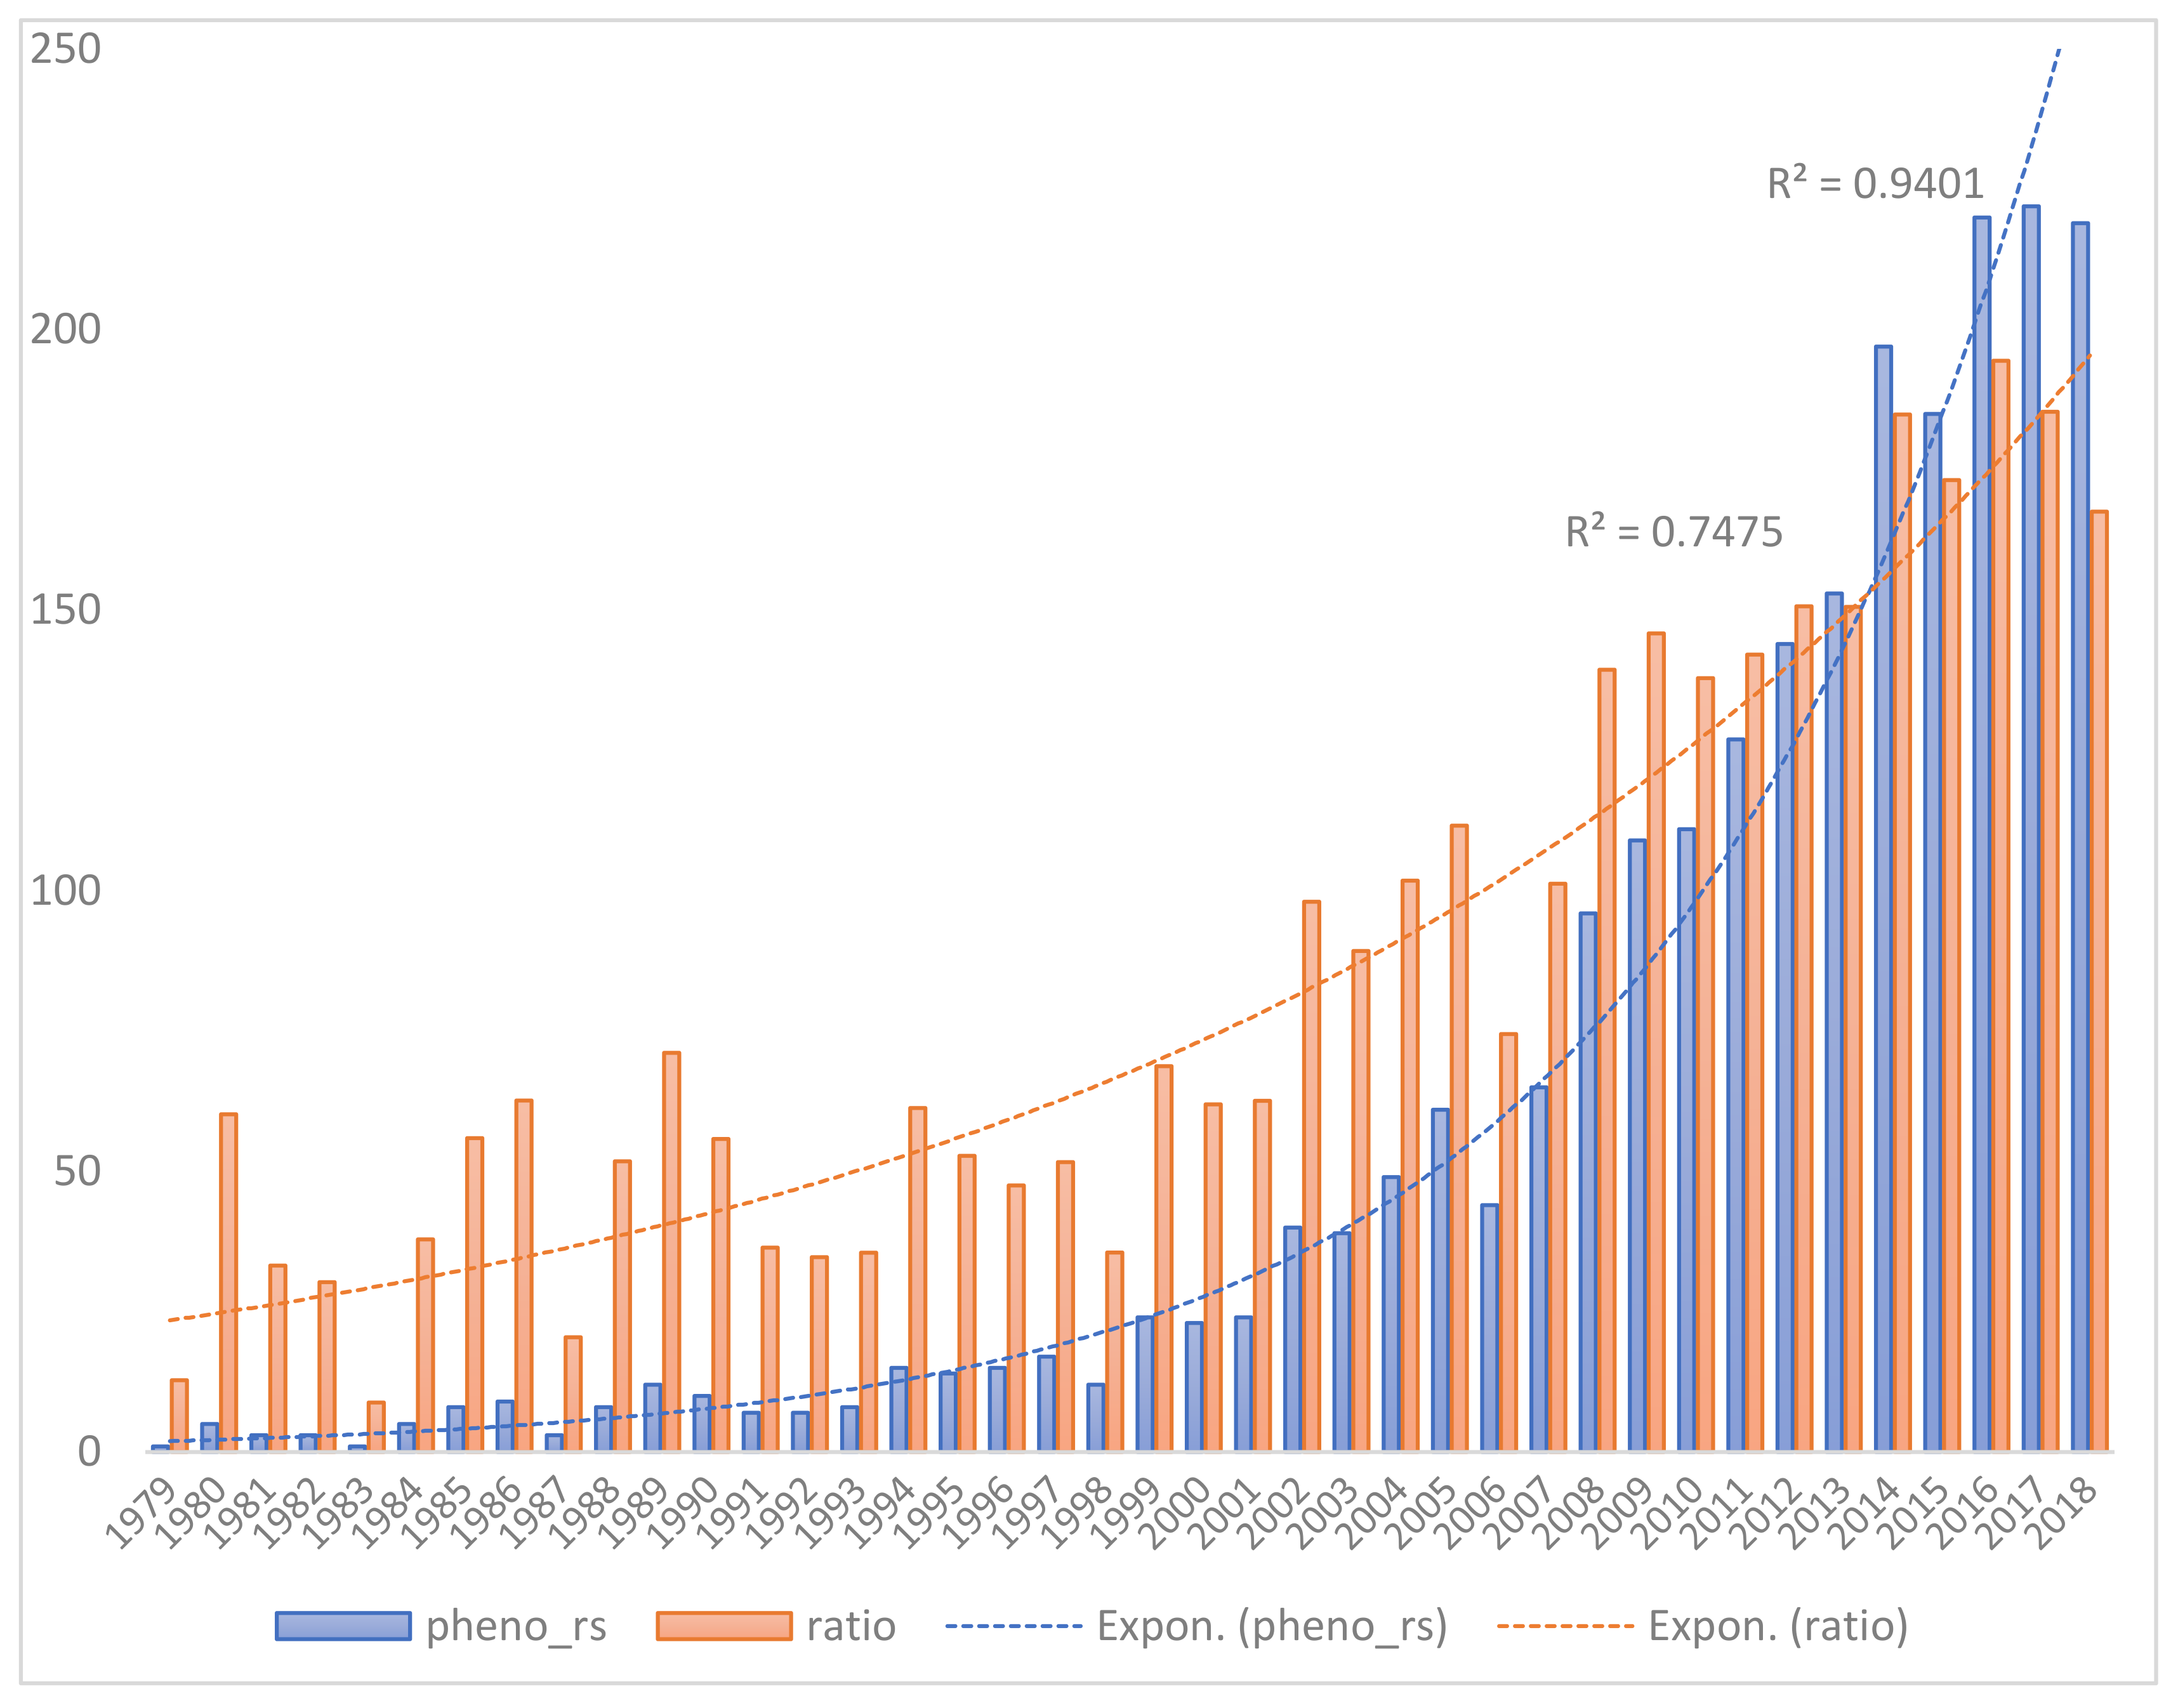
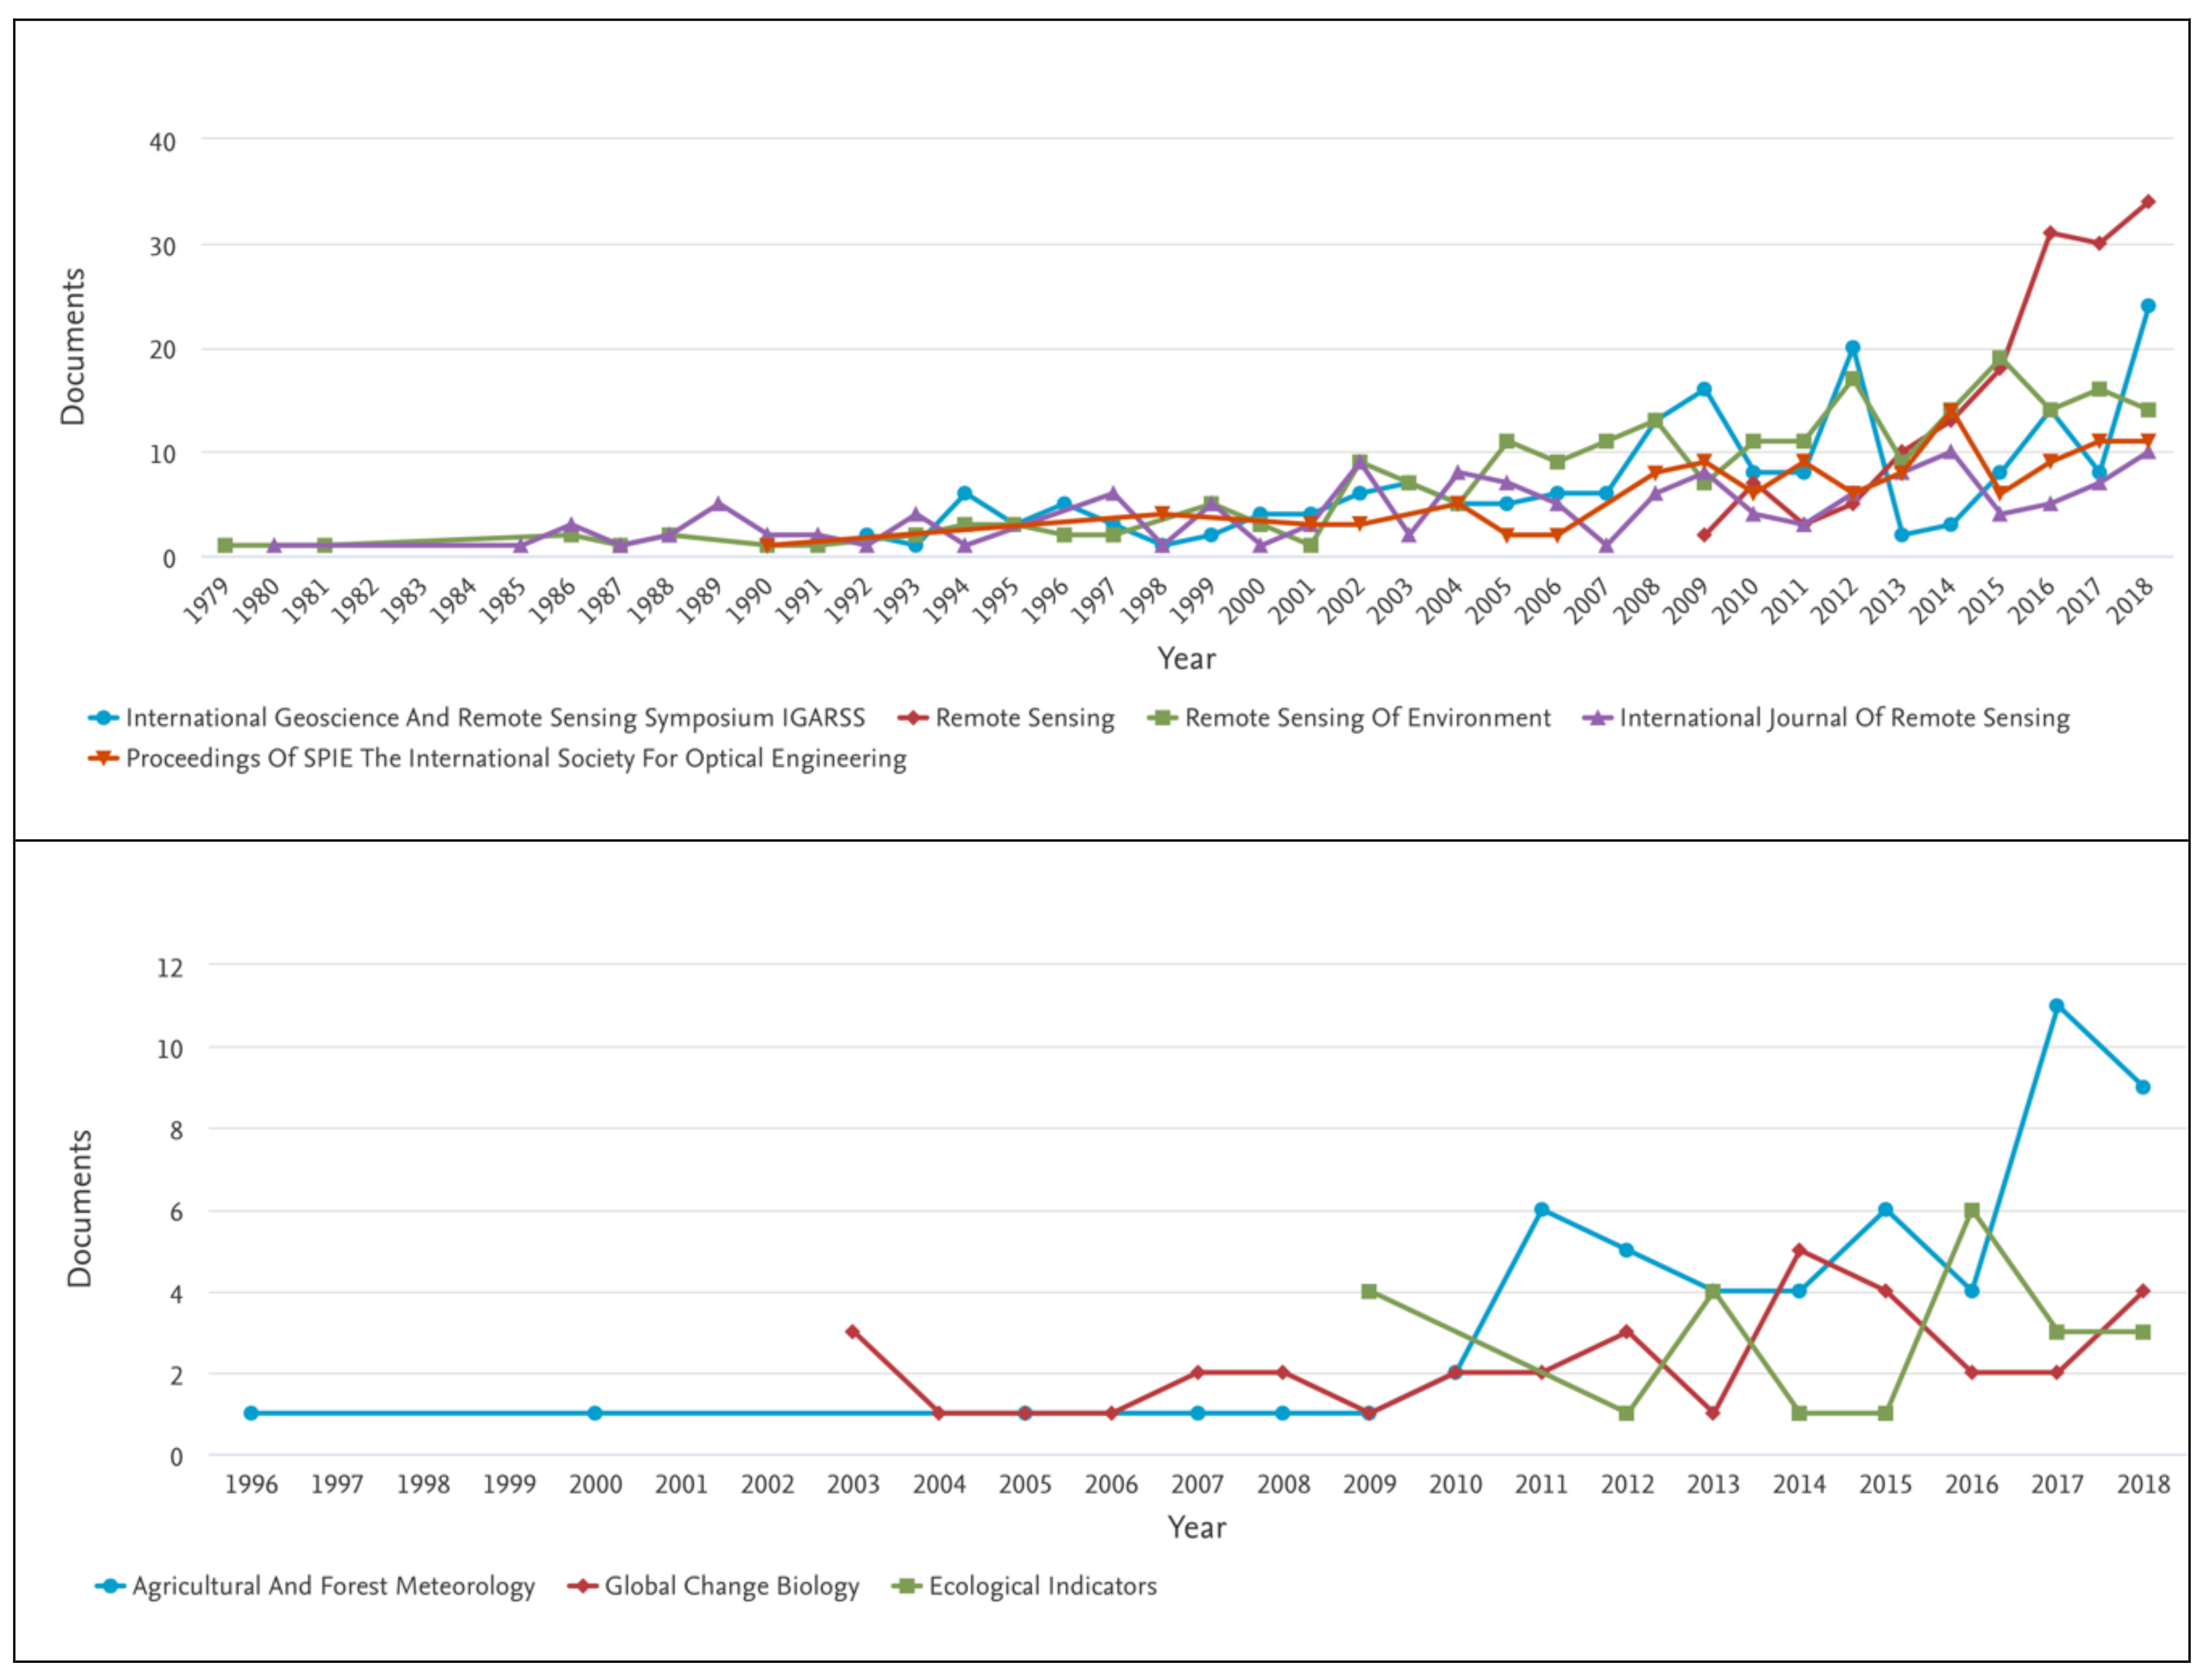
4.1. Publication Trends

Rs+pheno studies have significantly increased in number over the last decade and, as also for other disciplines (e.g., [42,43]), the USA and China are the leading countries in terms of the number of papers. The main peaks may be recognized in correspondence with some critical dates: around 1980 (one year after the publication of the seminal work of [44] about the use of red and NIR for monitoring vegetation), 1985–86 (after Landsat-5 launch in 1984 and the year of the publications of [45] about LAI, and [46] about NDVI for remotely sensed phenology), 1995 (one year after the pivotal work of [20] about the extraction of phenological metrics from NDVI annual profile), 1999 (in 1997, the Kyoto protocol about global warming was signed), 2002–05 (Landsat-7 was launched in 1999, MODIS in 2000, and the EVI was proposed for the first time by [15]), 2008–09 (after the publication of [6] about plant phenology, shifting in response to global change using NDVI data), and 2015 (in 2011, 30 years of Landsat archive became freely available [47]; in 2013, Landsat-8 was launched, and, in 2015, Sentinel-2 was launched).
In this framework, MODIS can be considered the most common satellite used in rs+pheno studies, covering almost all the topics identified, thanks to its very high temporal resolution (twice a day, with a 8- to 16-day and 1-month composite), moderate spatial resolution (250 m), large availability of ready-to-use products, and consistent coverage all over the world. On the contrary, Landsat represents the series of satellites that allows the larger temporal archive since the early 1980s and hence the larger time span for rs+pheno studies; while Sentinel-2 (launched in 2015) is the emerging technology in rs+pheno research, thanks to its high spatial resolution (10 m) and high temporal resolution (every 5 days). Based on such satellites, several ways of integrating the proposed remote sensing VIs into phenological modeling analysis have been suggested through time, e.g., for studying anomalies in spring and autumn phenology [48,49], analyzing the effects of warmer temperatures on the incidence and severity of frost damage [50,51], exploring the role of phenology in fire dynamics [52,53], combining multi-resolution products [54,55], smoothing satellite time-series data [56,57], integrating remotely sensed phenology data and climate [58,59]. While NDVI and EVI represent the most agreed VIs in rs+pheno studies, LAI and FAPAR, although largely used as inputs in crop modeling studies [60,61,62], remain only partially adopted.
The most journals used in rs+pheno studies are characterized by high impact factor (>4) and high H-index (>100), and, apart from RS, by a 30-years long history of rs+pheno publications. Yet, the journals mostly involved are largely biased towards remote sensing applications in ecology and/or biology rather than towards pure ecology and/or biology. This evidence demonstrates how rs+pheno is foremost considered as a subset of remote sensing science rather than a branch of phenology. As an example, the RSE journal also covers ecology and biology but not without remote sensing techniques. Purely ecological/biological journals are only partially used to publish rs+pheno studies. This may be interpreted as that, unlike traditional phenology, rs+pheno is not considered yet as a well-established branch of ecology. Finally, it is to be noticed that the first most-publishing purely ecological journals in rs+pheno were AFM and GCB (or International Journal of Biometeorology—data not shown here), both with a clear climate-based target. However, in the last decade, journals like EI (or Ecological Modeling and Science of the Total Environment—data not shown here), with a wider ecological perspective, have increasingly been used, suggesting a progressive tendency towards a less technical approach, and a new clearance for remotely sensed phenology.

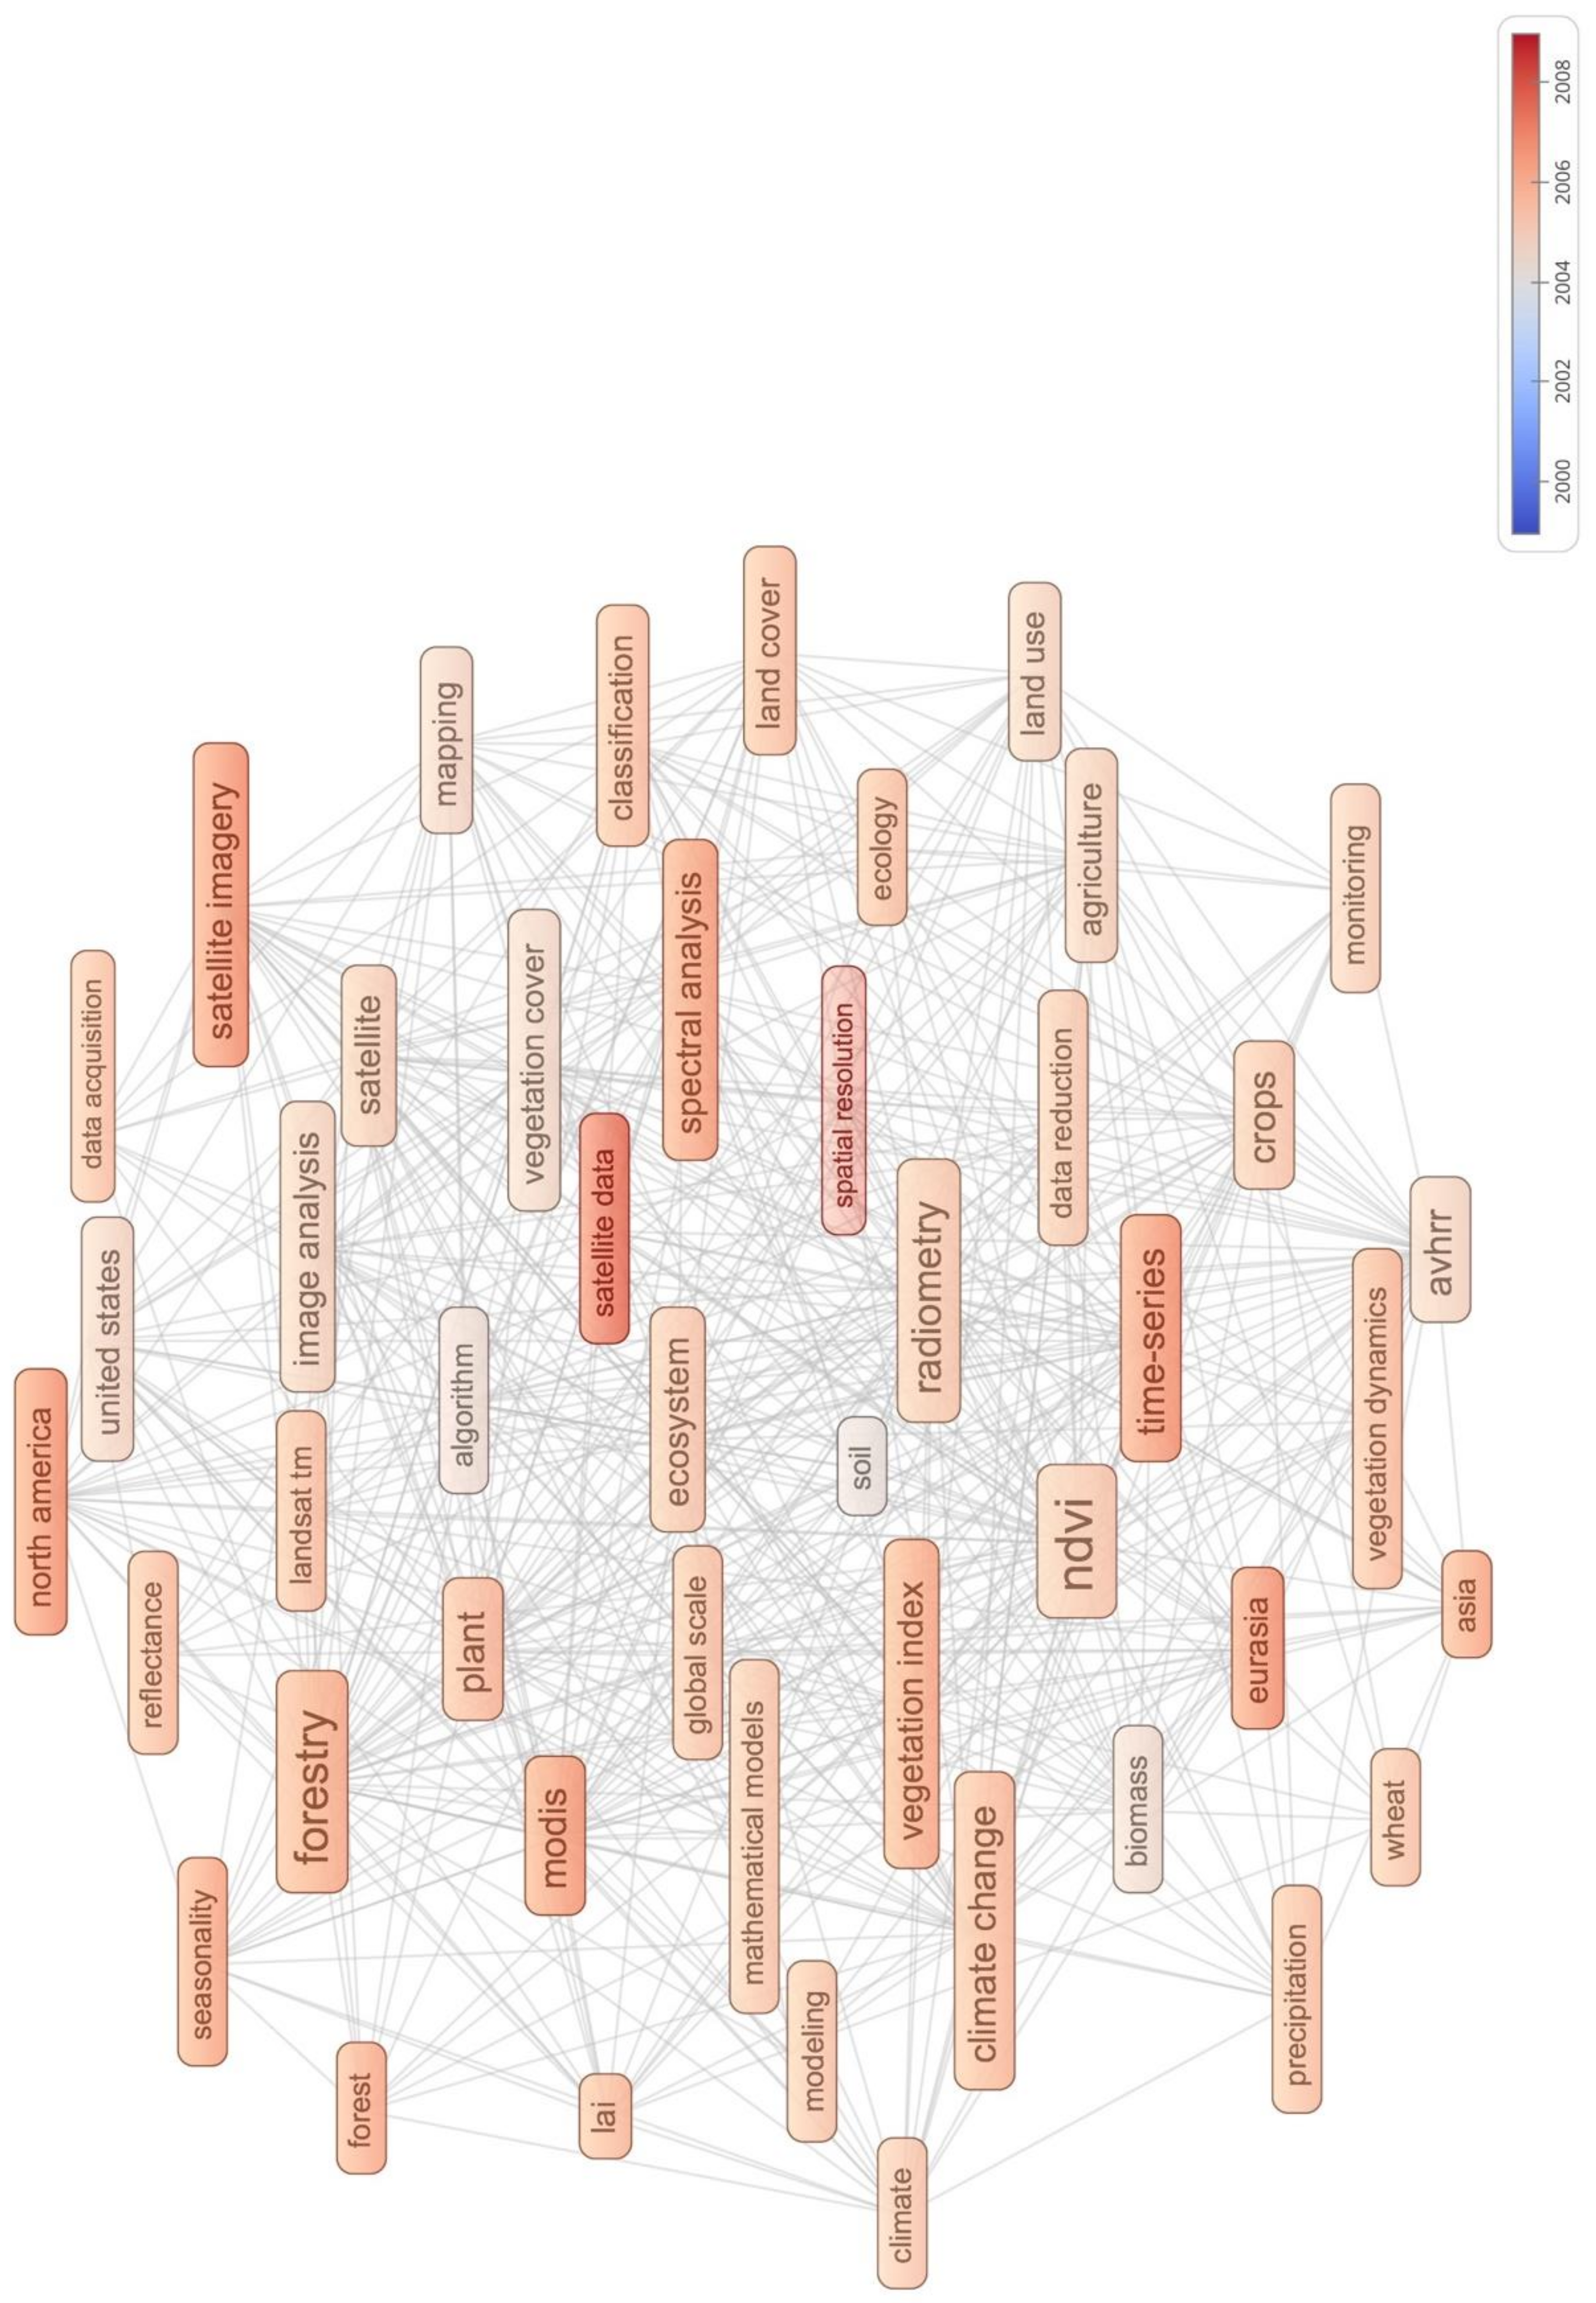
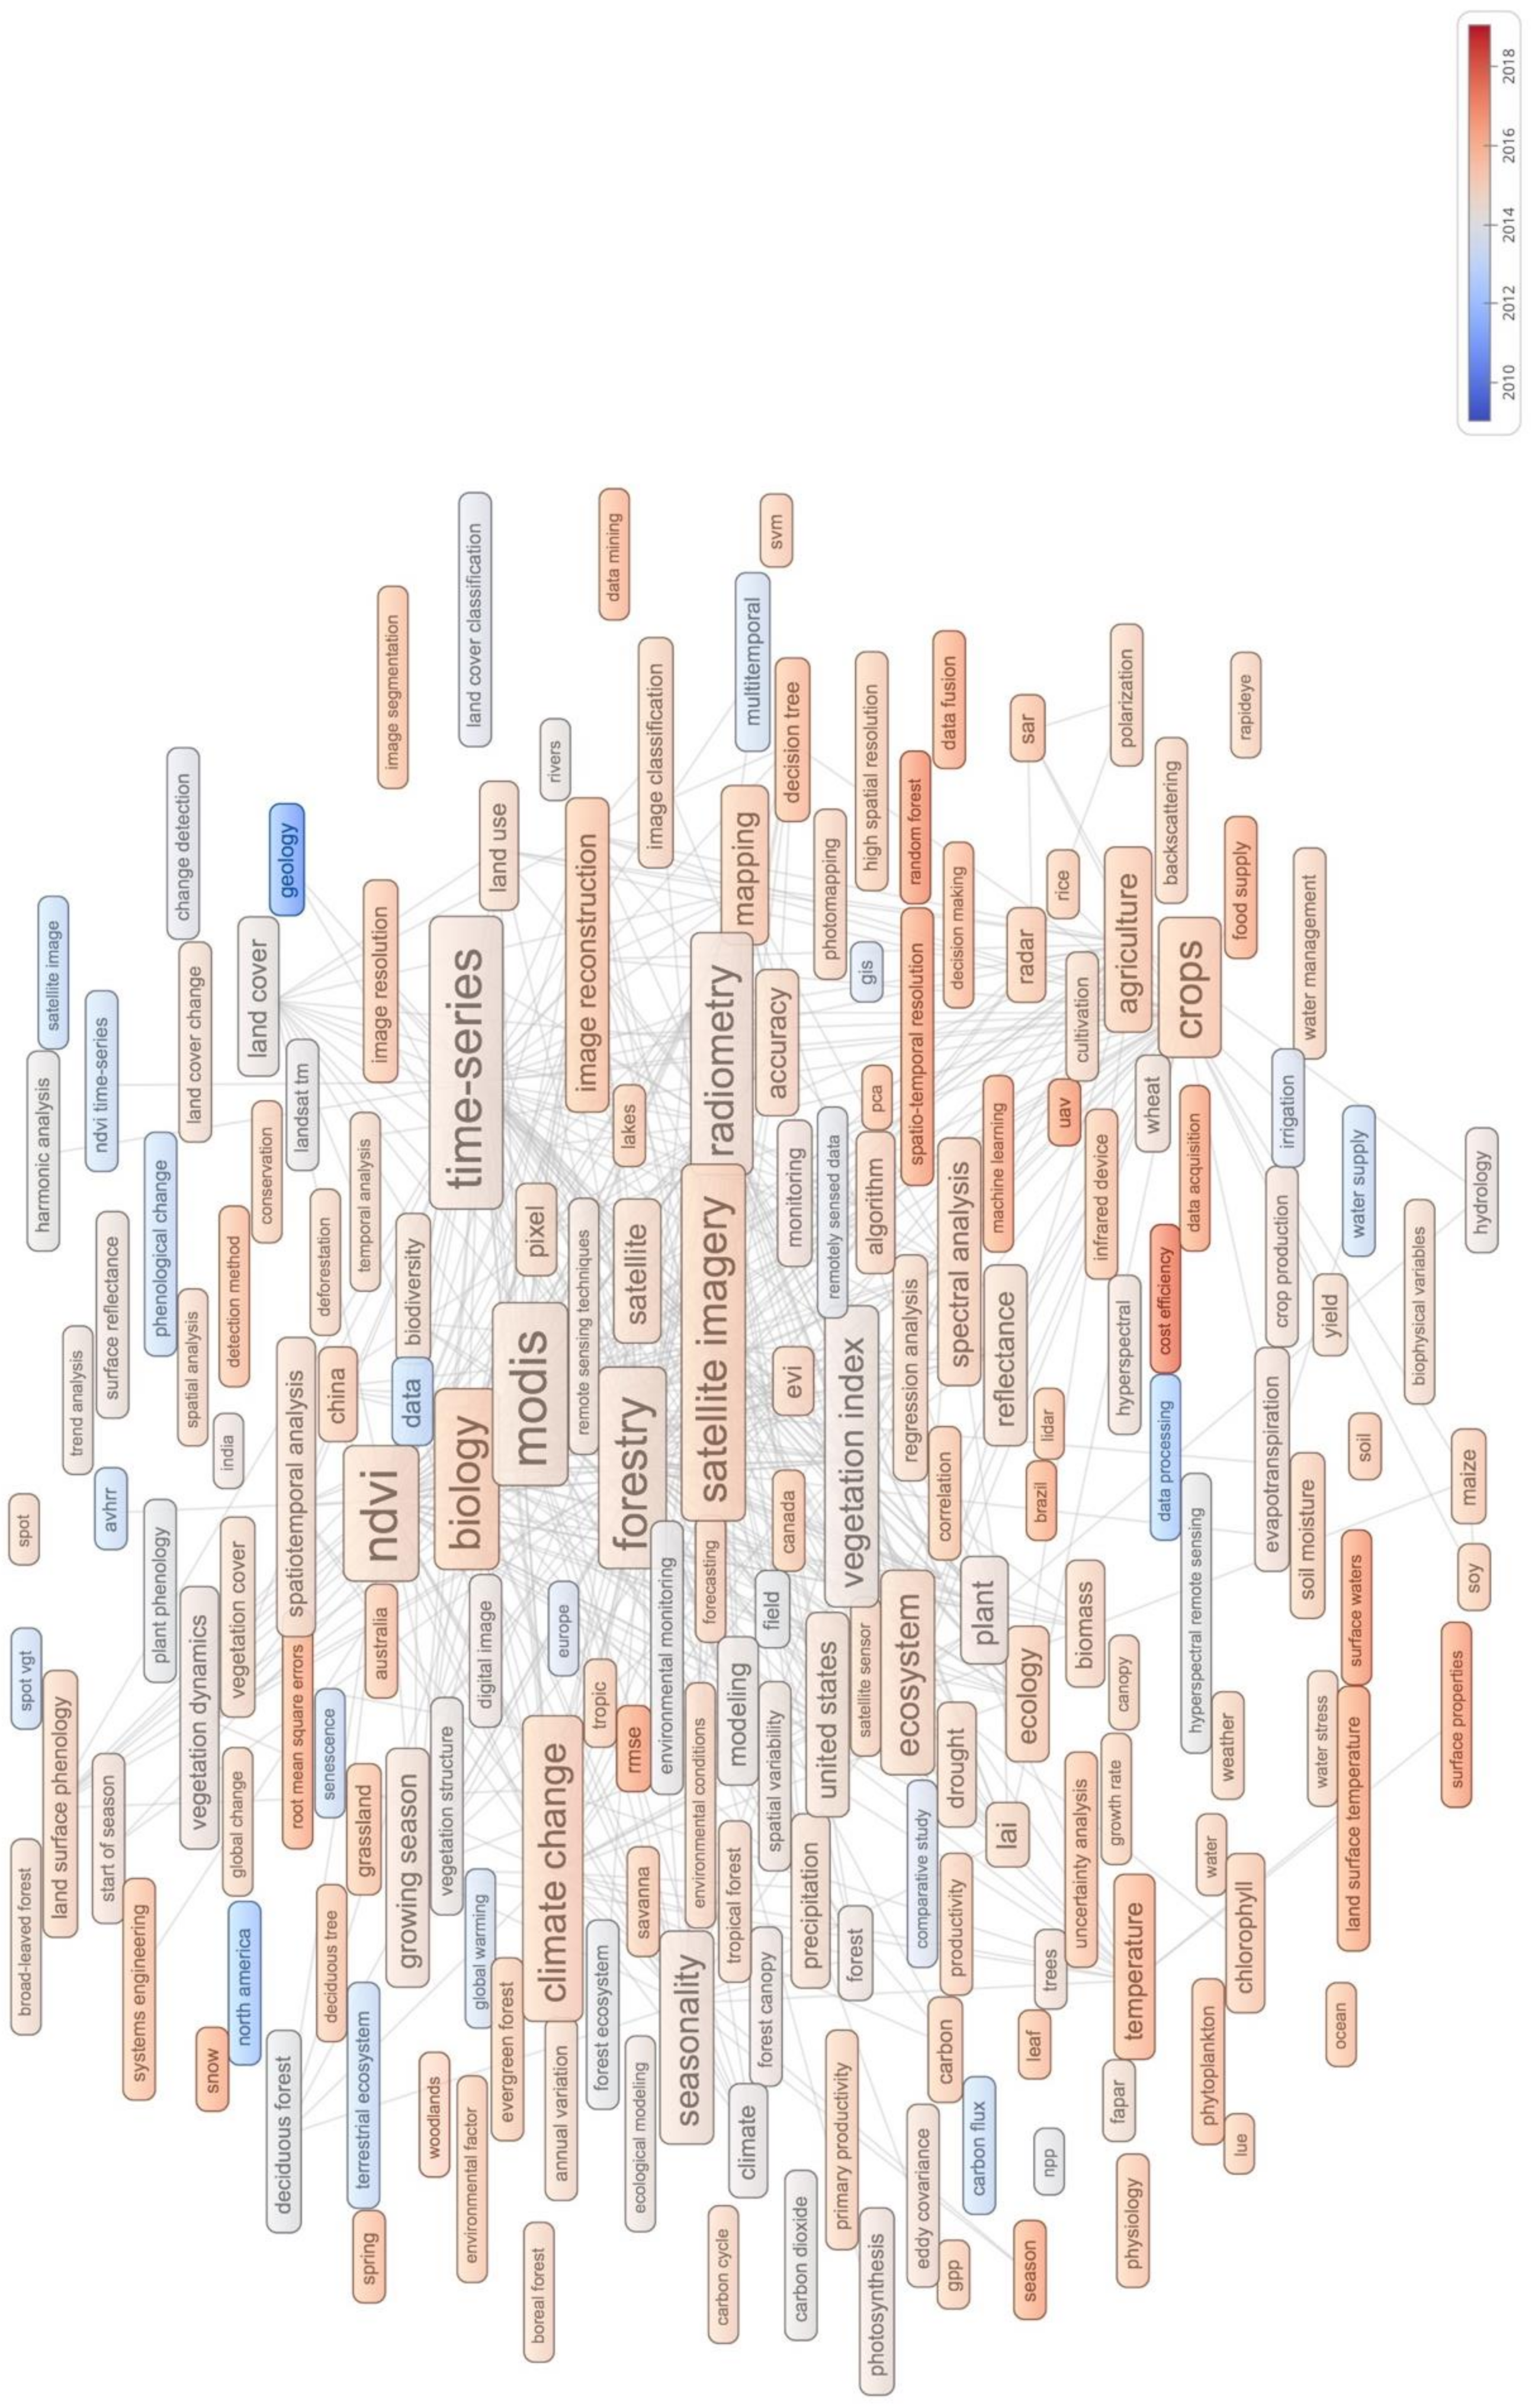
4.2. Major Research Topics

The term network maps for the period 1999–2008 and 2009–2018 allowed to identify the main clusters, i.e., the main scientific domains, or macro-topics, in the rs+pheno field. In the first decade, according to the terms distribution, two groups can be distinguished: one cluster (red) is an expression of a pheno-climatic macro-topic and its application in forestry, the other (blue) represents the research studies related to classification and its application in agriculture. In the second decade, three groups can be distinguished: one cluster (red), like in the previous decade, is expression of a pheno-climatic macro-topic and its implications in forest dynamics, the second cluster (blue) is expression of the agriculture-related domain, and the third cluster (orange) represents the research studies related to the classification field. Such results highlighted that, while in the first decade, agriculture was included in the classification cluster and did not represent an independent macro-topic, in 2009–2018, it arose as a single, standalone research theme, with specific targets and objectives; on the contrary, both in the first and in the second decade, forestry remained linked with the pheno-climatic macro-topic. This suggests that while rs+pheno is a key tool for agricultural studies, forest studies represent a key tool to investigate rs+pheno and climate change impacts.
The term occurrence analysis proved that mapping and its accuracy were the most common topics for both 1999–2008 and 2009–2018. Also, thanks to the increasing availability of new high-resolution satellites and cloud computing platforms, a growing number of papers have been published on thematic mapping, as well as on classification/validation methods. In the framework of both forestry and agriculture rs+pheno studies, classification methods like spectral angle mapper (SAM), object-oriented techniques, random forest, and support vector machine (SVM), among others, have been to be used since 2000. However, the high relevance gained in the last decade by such techniques highlights the recent use of specific classification methods for addressing specific rs+pheno targets, like land cover mapping [63,64,65], phenological characterization [66,67], and anomalies detection [68,69]. The use of ad hoc methodological approaches according to different objectives, scales, sensors, temporal, and spatial resolutions represents an important achievement. The continuous exploitation of new technological resources is one of the main characteristics of rs+pheno science, which guarantees this discipline to be up-to-date and always evolving, according to the availability of innovative instruments, the development of novel methodologies, and the emergence of new questions [70].
The attention towards the phenology metrics detection and extraction also represented the main topic for both 1999–2008 and 2009–2018, with the majority of the studies focusing on harmonic analysis [52,57,63]. The start of the season (SOS) represents the metric most investigated; its study has increased through time to such an extent that it became a major, common topic and, hence, lost its relevance. In the last decade, a large number of papers were published about spring phenology and its response to climate change [51,71,72,73]; on the contrary, end of season (EOS) and length of season (LOS) received far less consideration. As clearly stated by [50], autumn remains a relatively disregarded season in climate change research both in temperate and arctic ecosystems, notwithstanding the role of autumn in determining the length of the growing season [74,75] and in controlling influence on the carbon-uptake period [76]. However, EOS is generally considered to be more variable than SOS phenology and less often observed, making its detection and analysis challenging [75,77].

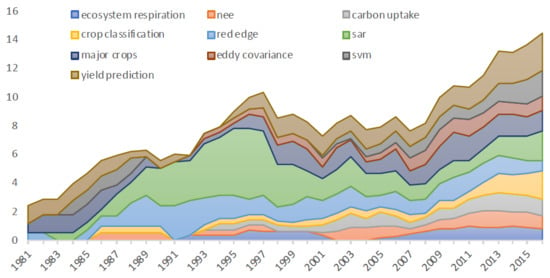
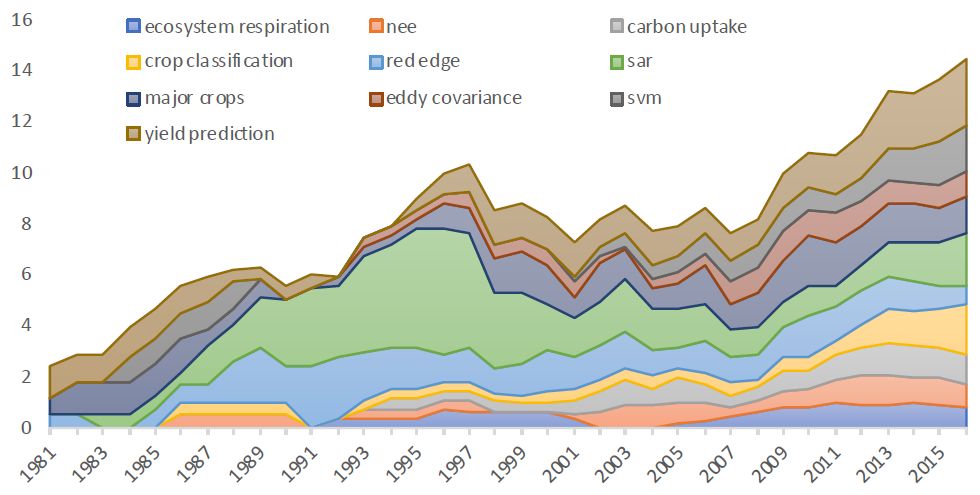
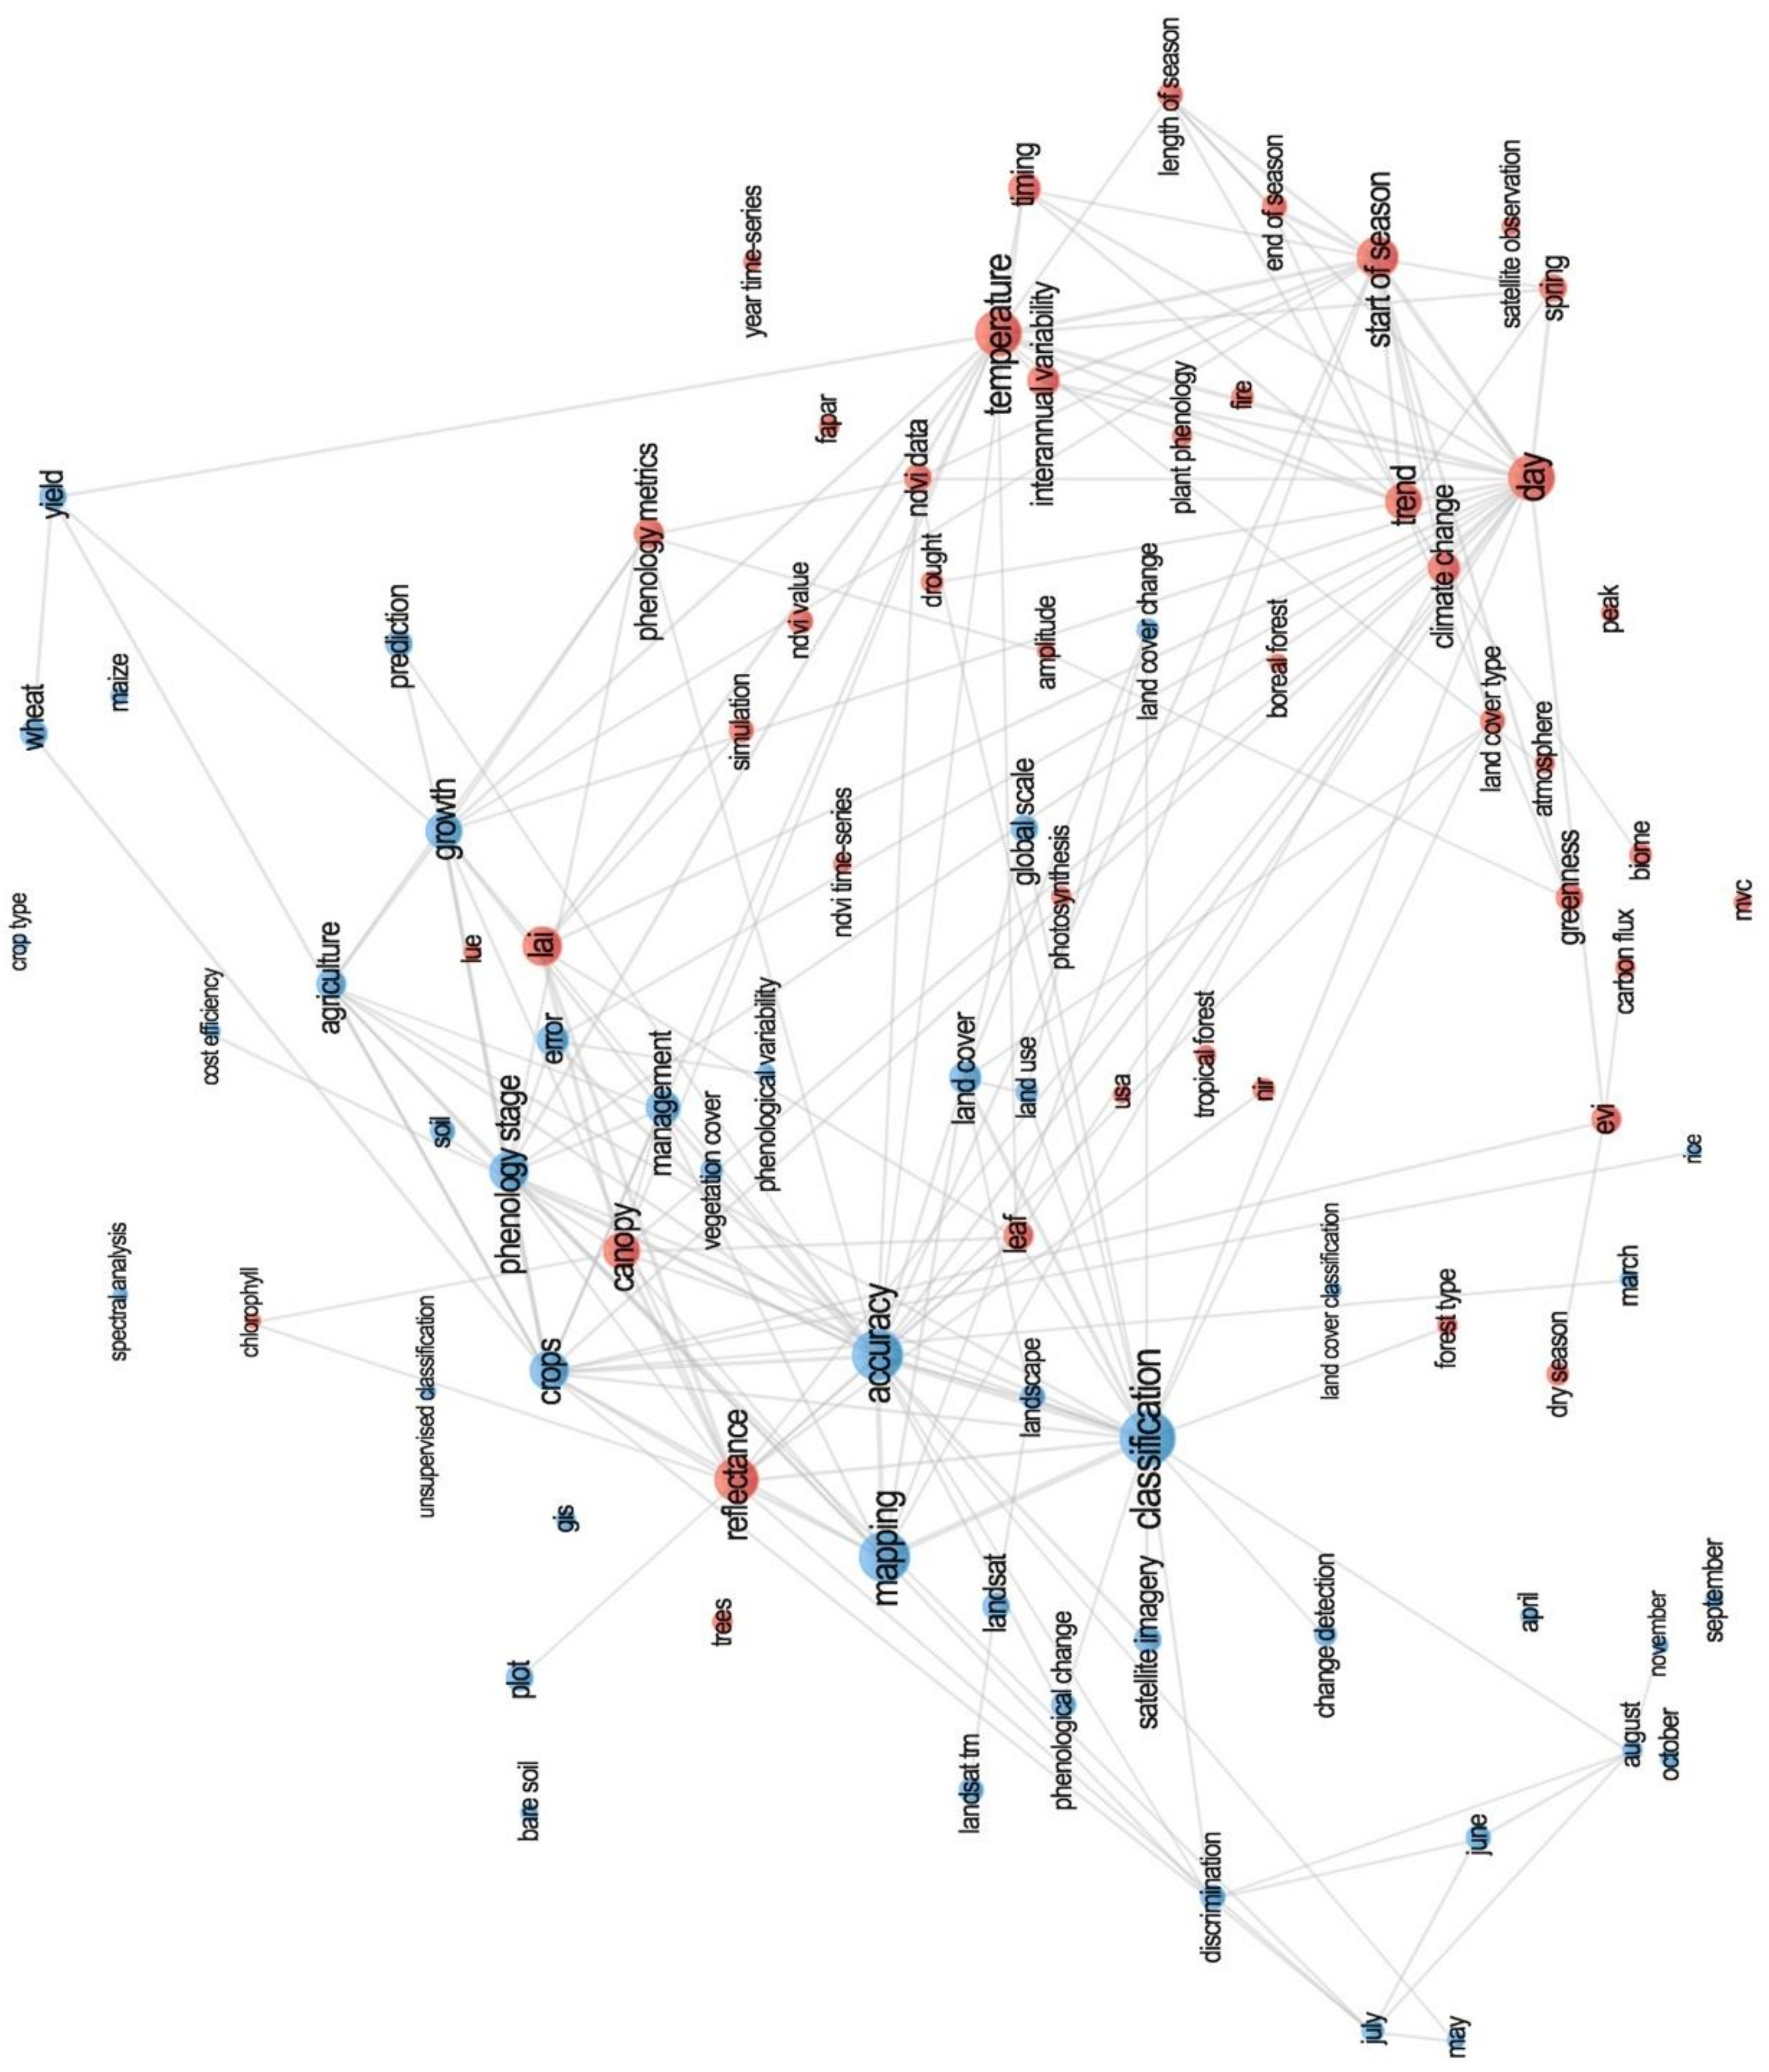
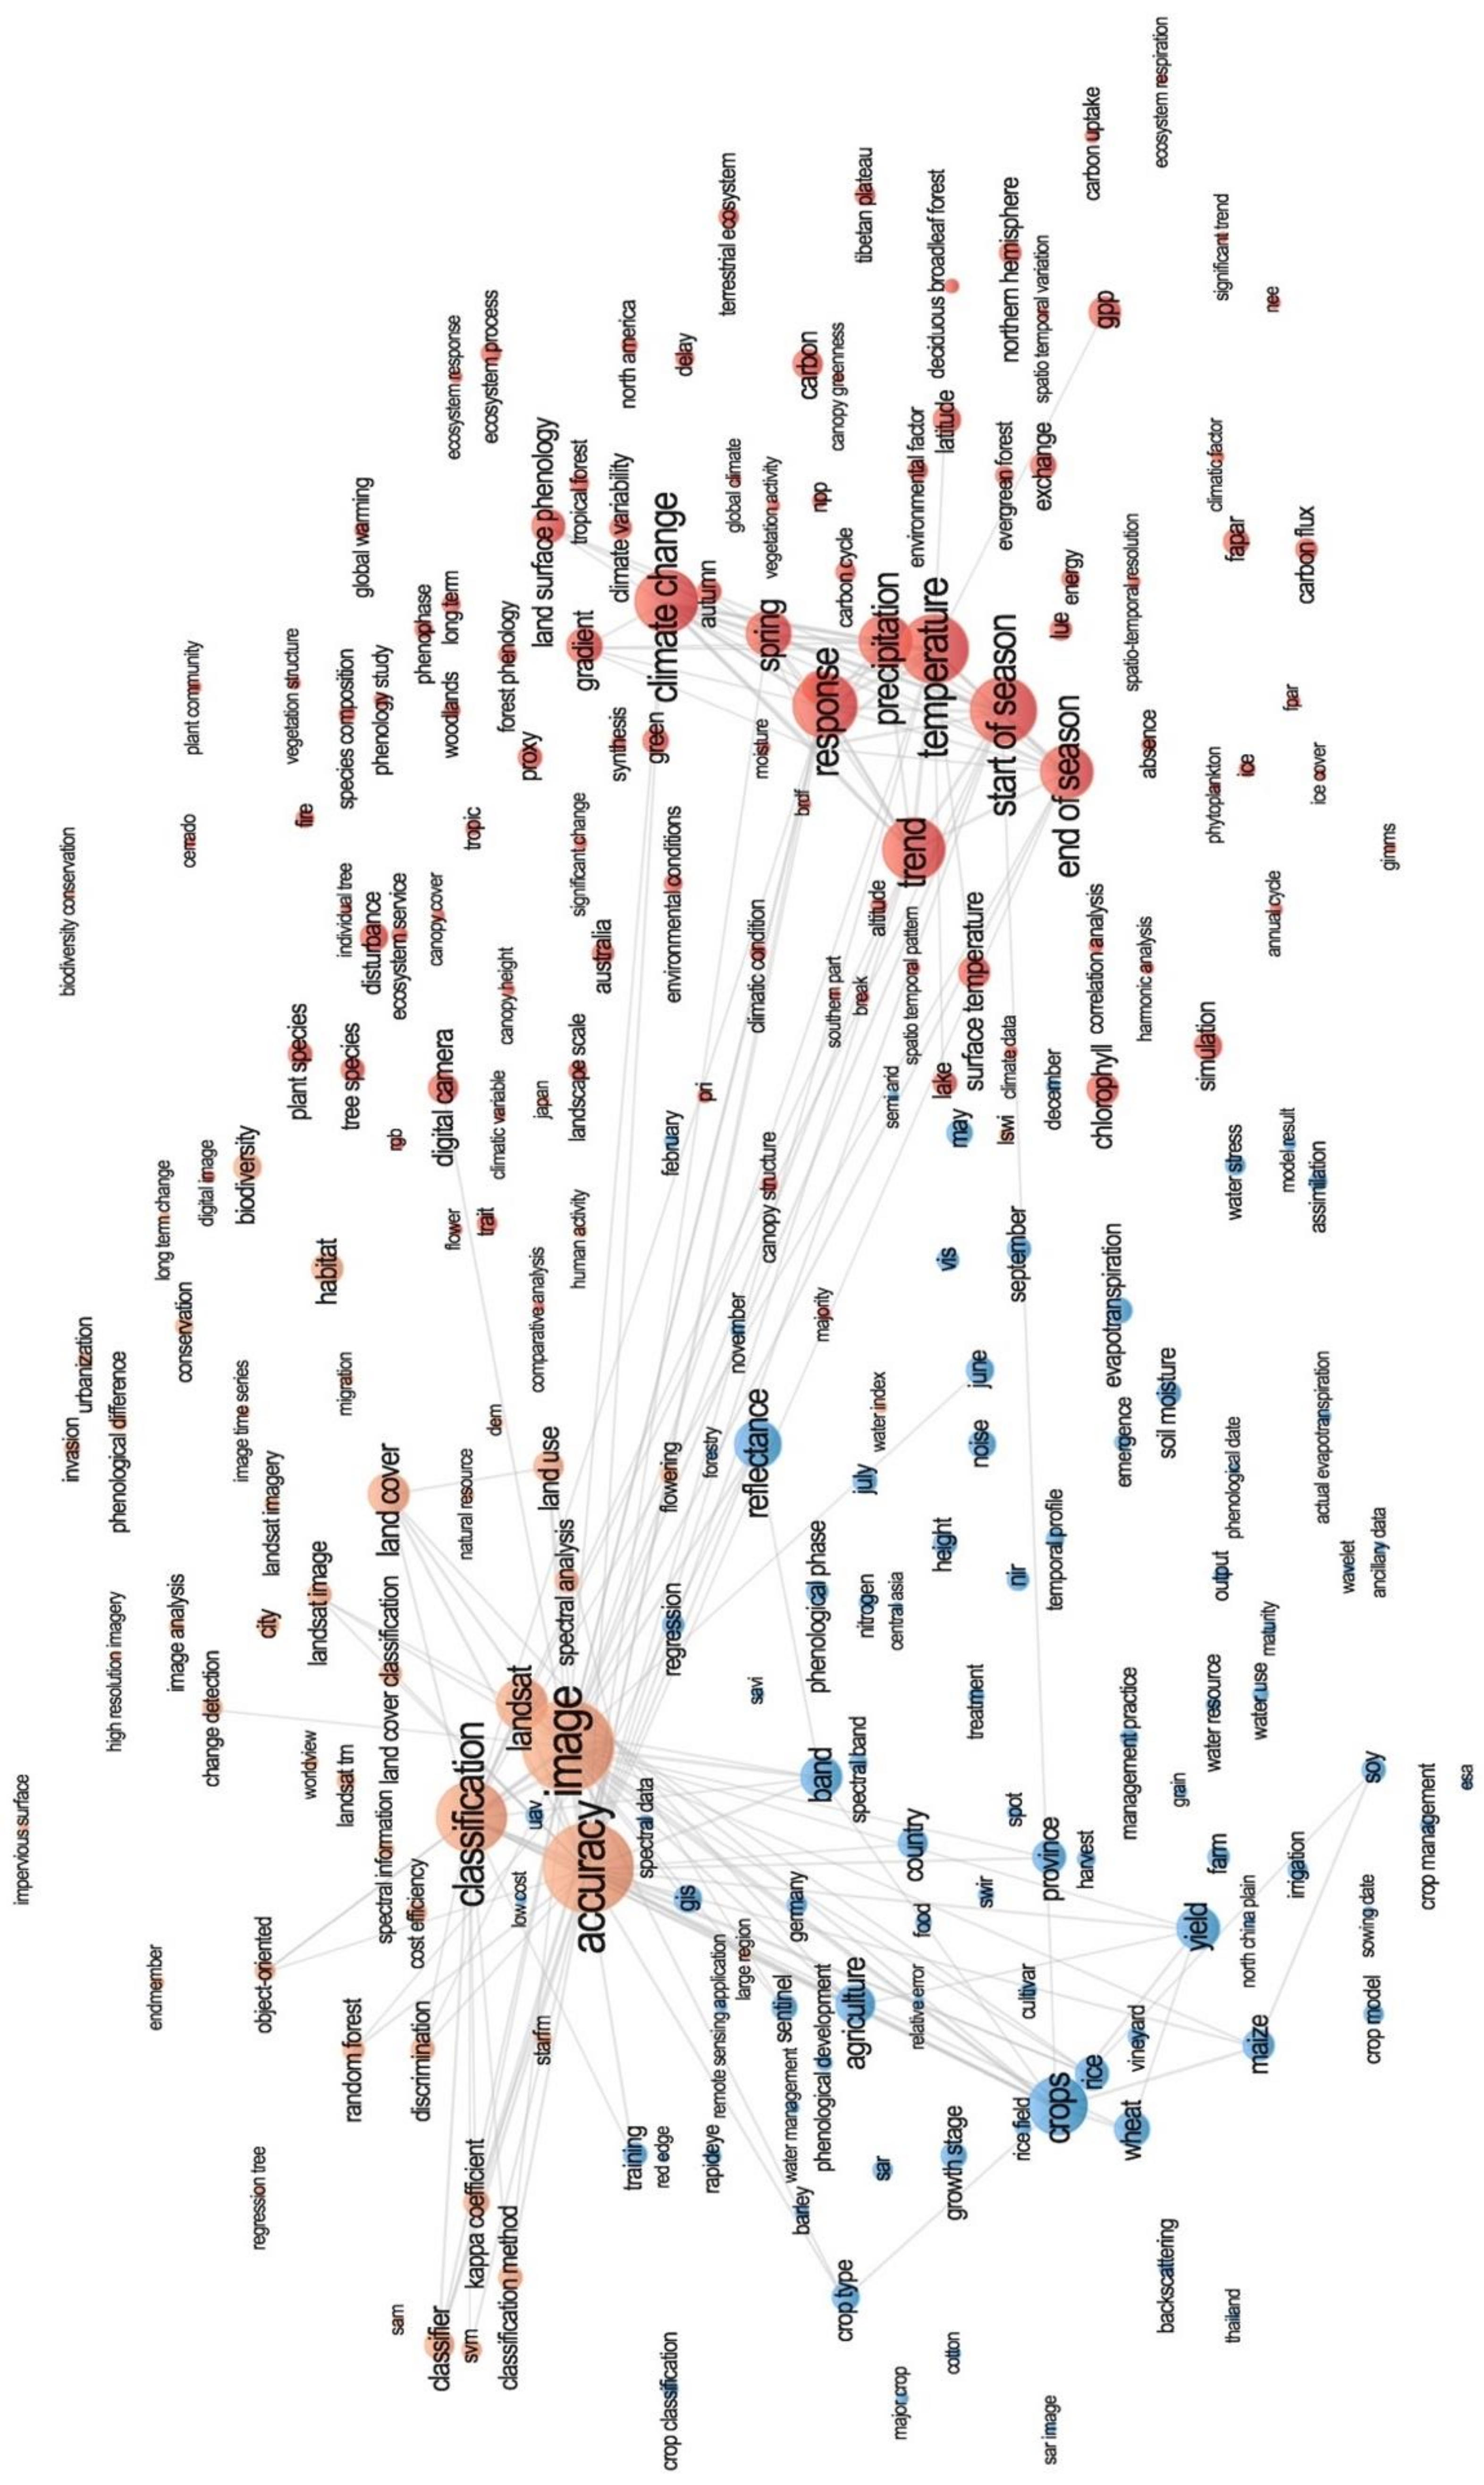
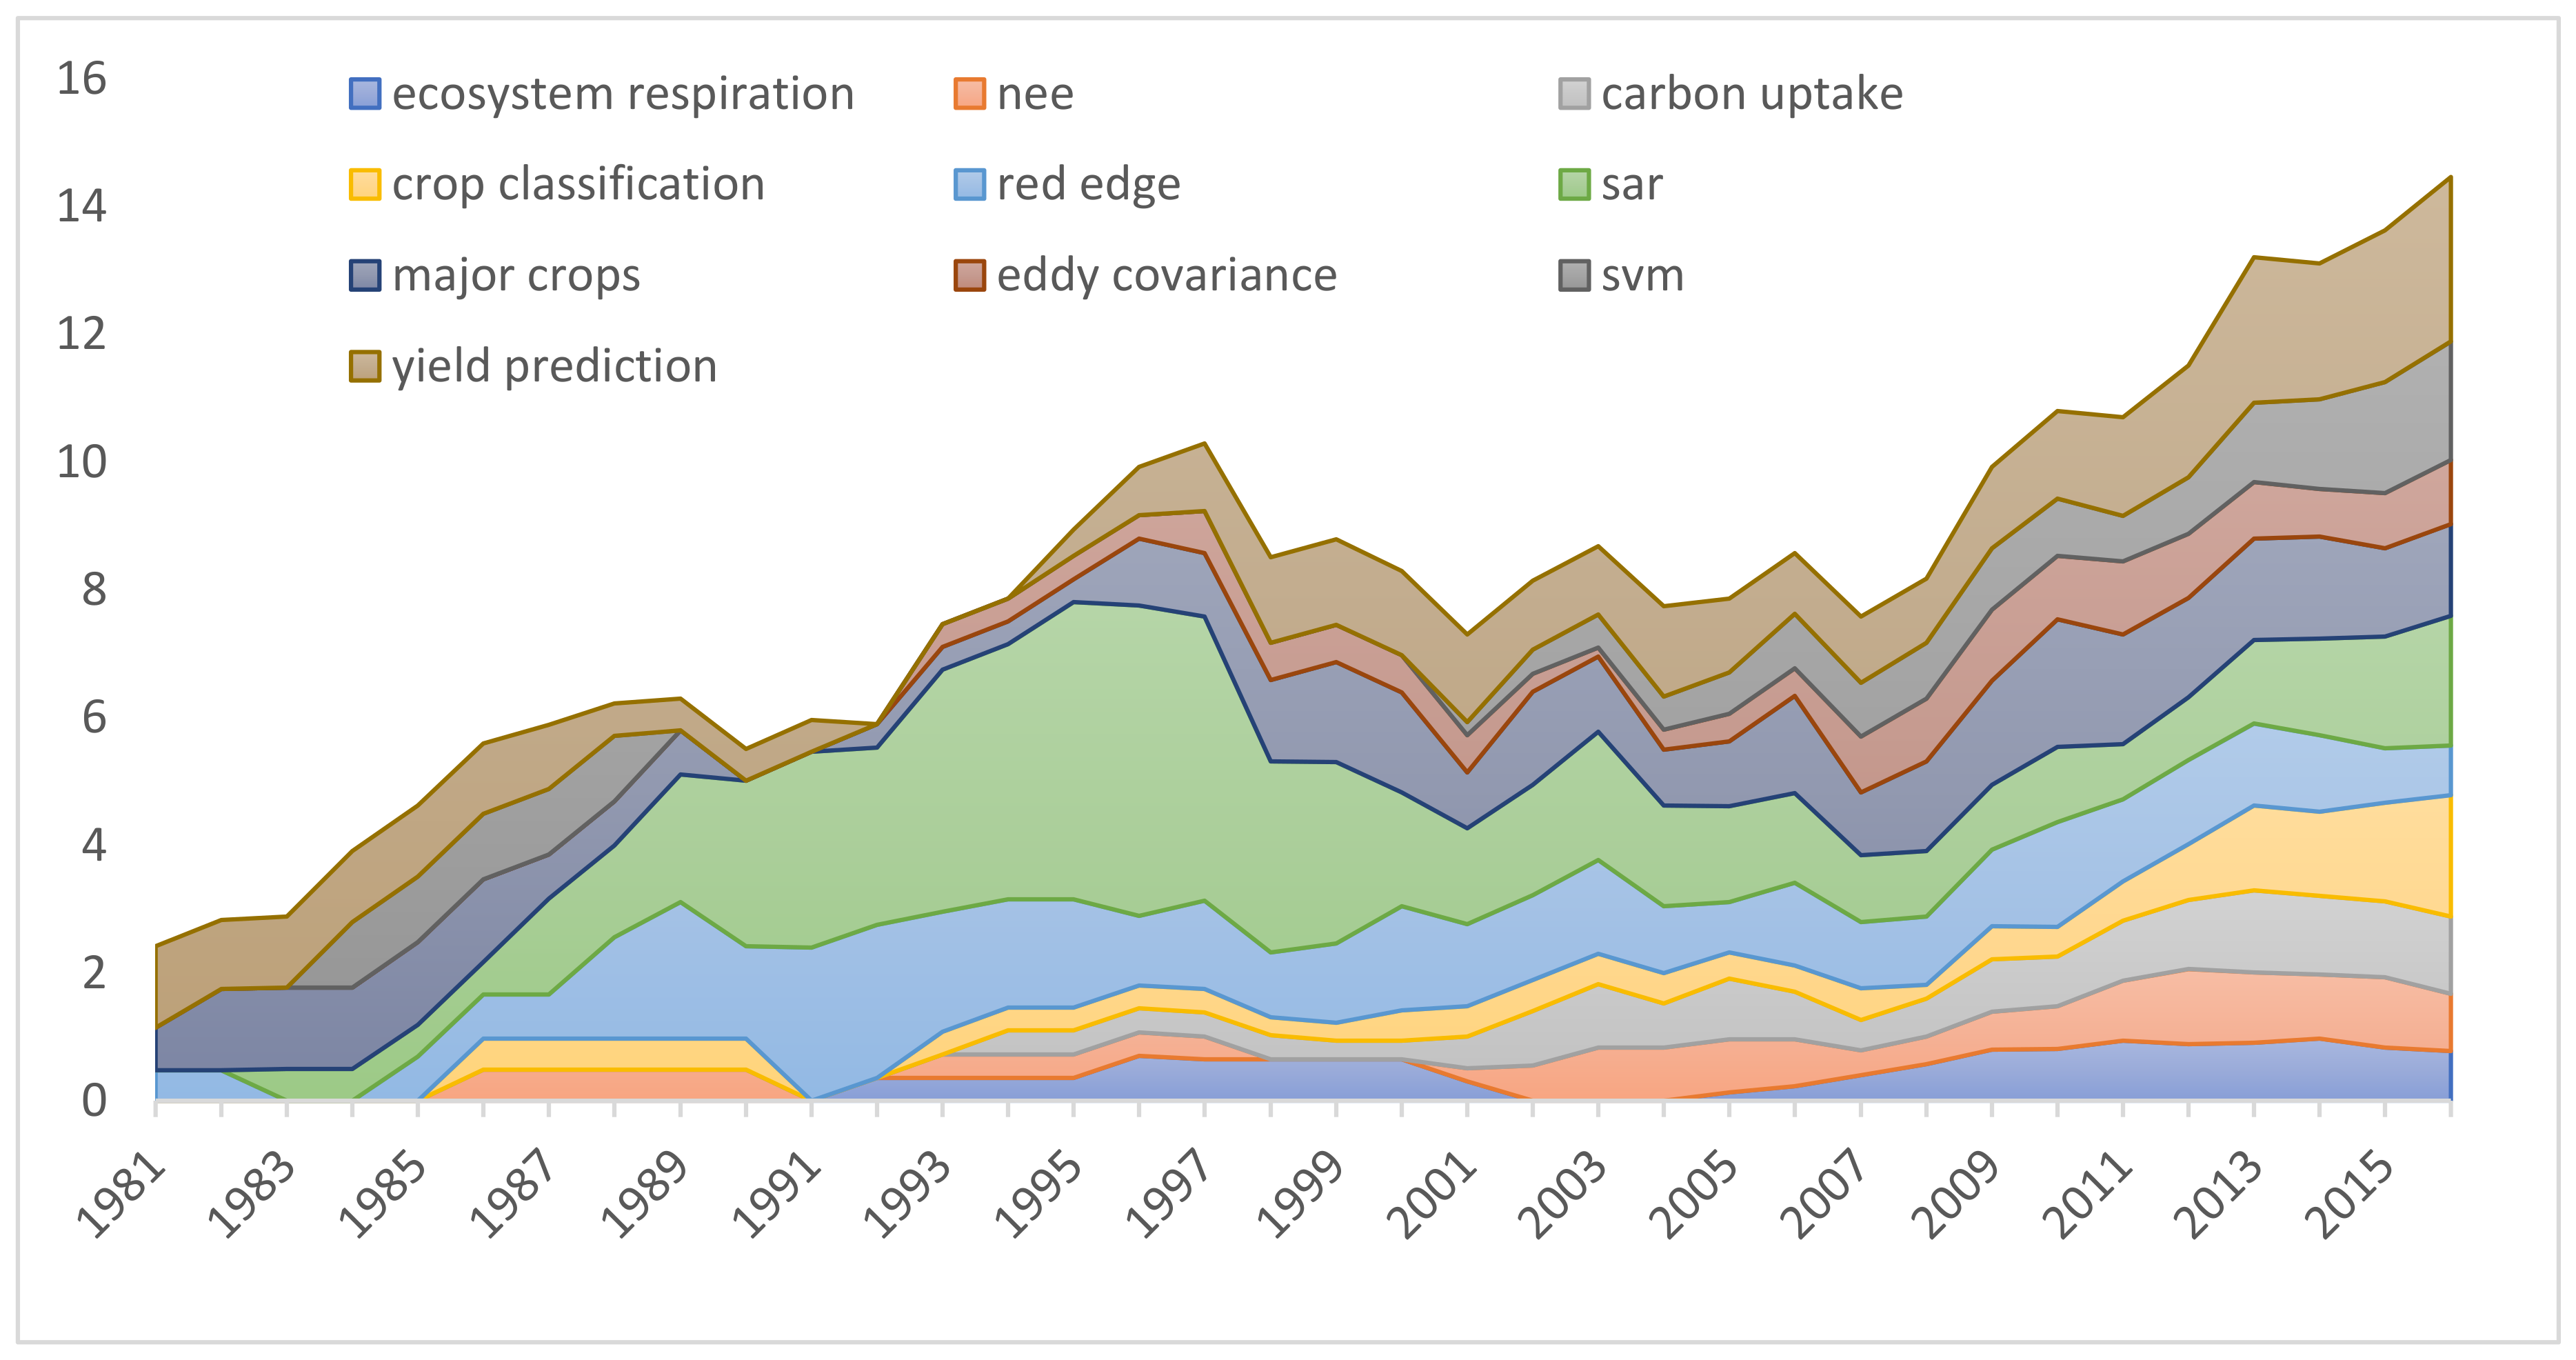
4.3. Emerging Research Topics

The term relevance analysis highlighted how some topics emerged as new research areas in rs+pheno studies, as well as how some relevant issues of the 1999–2008 decade lost their significance. In particular, the attention towards the vegetation growing season that characterized the first decade has increased through time to such an extent that it became a major, common topic and, hence, lost its relevance. On the contrary, some issues related to the climate change/carbon cycle linkage emerged in the 2009–2018 decade, for example, ecosystem respiration, net ecosystem exchange (NEE), and carbon uptake. These represent new research issues that scientists started to face at the beginning of the 1990s, and that in the last decade became the most relevant topic in rs+pheno studies, i.e., the most significant, with specific objectives and questions, mainly dealing with issues like forest ecophysiology [78,79] and biomass estimation and anomalies [73,80]. In this global energy balance context, special attention should be given to themes like ice cover dynamics and phytoplankton blooming. They gained a moderate relevance in the last decade, yet they are becoming increasingly significant, as demonstrated by several recent studies [32,81,82,83]. In particular, as stated by [32], phytoplankton is an essential element of the ocean, influencing global biological, chemical, and physical environments in terms of water heat [81], net primary production, carbon cycling, and climate [81]. As a consequence, rs+pheno research focused on phytoplankton represents an emerging niche research area recognized as a key concern in the framework of the global climate observing system [32].
Some new topics came to light in the last decade, also, within the agricultural main domain. Actually, crop modeling and the use of SAR and red edge represent research issues that have gained some attention since the early 1980s and kept being studied throughout the 40 years. However, the initial interest was likely targeted towards several different research objectives, without a specific rs+pheno focus, to such an extent that these terms gained a high relevance only in the last decade. The use of new sensors and specific optical and radar bands [84,85,86,87], their data fusion [55,88], as well as the application of yield prediction and crop simulation models [89,90,91] may be, hence, considered as a new challenge for the next decade of rs+pheno studies.
Finally, in the last decade, a new front appeared in rs+pheno research, linked with habitat and biodiversity conservation. According to our results, this front was connected with terms associated with anthropogenic activities and human presence. For example, the impacts of urbanization processes on vegetation health status and its seasonal variations have been mostly analyzed in terms of the phenology of urban environments [92,93], effects of urban heat island [94,95], and different phenological responses of rural vs. urban areas [96,97]. At the same time, human management interventions, like deforestation, represent another issue faced in rs+pheno studies, mainly dealing with recolonization [98], mapping [99], and environmental damage estimation [100].
Biodiversity and related ecosystem services issues resulted as connected, also, to studies about environmental disturbance phenomena, like fire. Many papers in rs+pheno studies analyzed the role of wildfires’ behavior both as a driver of vegetation recovery patterns [101,102,103] and as influenced by fuel phenology and flammability [104,105]. In this latter case, a high potential exists for characterizing, classifying, and mapping fuel based on rs+pheno dynamics. Several studies have used variations in remotely sensed VIs profiles, such as the NDVI, as indicative of variations in moisture content and nutrient availability, which in turn are indicators of a marked susceptibility of vegetation to fire [106,107]. In this framework, future research should go beyond the traditional use of NDVI (or similar VIs) as simple biomass proxy and identify fire-prone regions according to their phenological patterns [108].

4.4. Regions of Study

The geographic region of study started to assume an important role in rs+pheno research, mainly during the last ten years. In 1999–2008, boreal and tropical forests were the main ecoregions analyzed; the only countries largely considered were North America (in particular, USA) and Asia, with the former associated with the phenology/climate topic and the latter with the agriculture/classification one. On the contrary, in 2009–2018, the different topics identified involved different study regions, according to their specific characteristics and requirements. For instance, the pheno-climatic cluster included regions like Cerrado, Tropic, Savanna, North America, and Tibetan Plateau, which are broad, highly natural, and homogeneous areas where climate change effects can be clearly identified and monitored [80,109,110,111,112,113]. In the agricultural cluster, Thailandia, Northern China, and Germany were the most occurrent study regions, maybe due to the high food demand/production, water management, and the farming practices typical of these regions [114,115,116]. Finally, the classification cluster included regions like Greece and Japan, where issues related to crop mapping and anthropogenic impacts (e.g., fire, urbanization, invasive species, etc.), also characterizing the cluster, represents a major concern [103,117,118].
Such pieces of evidence highlight the general tendency that rs+pheno studies are moving from global to regional/local scales. The main research questions are not only dealing with large scale dynamics but also with small scale observations, being driven by site-specific characteristics and requirements. While the former seemed to be mainly linked to forestry and climate-based studies (by using platforms like MODIS and GIMMS), the latter was mostly regarding agriculture and classification topics (by using satellites like Rapideye, SPOT, Sentinel, Worldview, and Landsat). In this perspective, the recent advent of very high spatial resolution satellites (like S2) and new missions (like PRISMA—Hyperspectral Precursor and Application Mission, VIIRS—Visible Infrared Imaging Radiometer Suite, and ECOSTRESS onboard the International Space Station) represents a major support tool, able to guarantee, and, at the same time, to boost multi-scale rs+pheno studies.

5. Conclusions

Relations between phenological responses and global change have become a major concern, and several disciplines, like remote sensing science, are contributing to find answers and meet such challenges, with new theories, methods, and technologies. As the number of studies integrating remote sensing and phenology is growing faster in recent years, it is becoming more complex to get a clear picture of knowledge structure, research hotspots, and development in this study area. Analyzing the research development dynamics of rs+pheno studies allowed to disentangle the complexity of this discipline, by identifying key well-established (e.g., climate change impacts), emerging (e.g., ecosystem energy balance, phytoplankton blooming), or underexplored (e.g., autumn and senescence processes) topics. However, the evidence obtained in this review highlighted that, even if rs+pheno research is gaining its position in ecological studies, it is still not considered as a self-explained science. In the framework of scaling from regional phenological patterns down to site-specific, species-level seasonal observations, the continuous availability of new technologies, as well as the growing interdisciplinary component of rs+pheno studies, represent a conditio sine qua non for new scientific questions and new answers, able to ennoble remotely sensed phenology as a purely ecological science. The findings of this study might be applicable for planning and managing remotely sensed phenology research; scientists involved in such discipline might use this study as a reference to consider their research domain in a broader dynamical network.

Supplementary Materials

The following are available online at https://www.mdpi.com/2072-4292/11/23/2751/s1. Excel name: suppl_scopus_db.

Author Contributions

Conceptualization, S.B.; methodology, S.B., E.R., T.T., and M.B.; writing—original draft preparation, S.B.; writing—review and editing, M.B.; supervision, C.R.

Funding

This research received no external funding.

Conflicts of Interest

The authors declare no conflict of interest.

References

  1. Morellato, L.P.C.; Alberton, B.; Alvarado, S.T.; Borges, B.; Buisson, E.; Camargo, M.G.G.; Cancian, L.F.; Carstensen, D.W.; Escobar, D.F.E.; Leite, P.T.P.; et al. Linking plant phenology to conservation biology. Biol. Conserv. 2016, 195, 60–72. [Google Scholar] [CrossRef]
  2. Rosenzweig, C.; Karoly, D.; Vicarelli, M.; Neofotis, P.; Wu, Q.; Casassa, G.; Menzel, A.; Root, T.L.; Estrella, N.; Seguin, B.; et al. Attributing physical and biological impacts to anthropogenic climate change. Nature 2008, 453, 353–357. [Google Scholar] [CrossRef] [PubMed]
  3. Forrest, J.; Miller-Rushing, A.J. Toward a synthetic understanding of the role of phenology in ecology and evolution. Phil. Trans. R. Soc. B 2010, 365, 3101–3112. [Google Scholar] [CrossRef] [PubMed]
  4. Lim, C.H.; An, J.H.; Jung, S.H.; Nam, G.B.; Cho, Y.C.; Kim, N.S.; Lee, C.S. Ecological consideration for several methodologies to diagnose vegetation phenology. Ecol. Res. 2018, 33, 363–377. [Google Scholar] [CrossRef]
  5. Bajocco, S.; Ferrara, C.; Alivernini, A.; Bascietto, M.; Ricotta, C. Remotely-sensed phenology of Italian forests: Going beyond the species. Int. J. Appl. Earth Obs. Geoinf. 2019, 74, 314–321. [Google Scholar] [CrossRef]
  6. Cleland, E.E.; Chuine, I.; Menzel, A.; Mooney, H.A.; Schwartz, M.D. Shifting plant phenology in response to global change. Trends Ecol. Evol. 2007, 22, 357–365. [Google Scholar] [CrossRef]
  7. Workie, T.G.; Debella, H.J. Climate change and its effects on vegetation phenology across ecoregions of Ethiopia. Glob. Ecol. Conserv. 2018, 13, e00366. [Google Scholar] [CrossRef]
  8. Broich, M.; Huete, A.; Paget, M.; Ma, X.; Tulbure, M.; Coupe, N.R.; Evans, B.; Beringer, J.; Devadas, R.; Davies, K.; et al. A spatially explicit land surface phenology data product for science, monitoring and natural resources management applications. Environ. Model. Softw. 2015, 64, 191–204. [Google Scholar] [CrossRef]
  9. D’Odorico, P.; Gonsamo, A.; Gough, C.M.; Bohrer, G.; Morison, J.; Wilkinson, M.; Hanson, P.J.; Gianelle, D.; Fuentes, J.D.; Buchmann, N. The match and mismatch between photosynthesis and land surface phenology of deciduous forests. Agric. For. Meteorol. 2015, 214, 25–38. [Google Scholar]
  10. White, M.A.; Hoffman, F.; Hargrove, W.W.; Nemani, R.R. A global framework for monitoring phenological responses to climate change. Geophys. Res. Lett. 2005, 32, L04705. [Google Scholar] [CrossRef]
  11. Garonna, I.; de Jong, R.; Stöckli, R.; Schmid, B.; Schenkel, D.; Schimel, D.; Schaepman, M.E. Shifting relative importance of climatic constraints on land surface phenology. Environ. Res. Lett. 2018, 13, 024025. [Google Scholar] [CrossRef]
  12. Jeganathan, C.; Dash, J.; Atkinson, P.M. Mapping the phenology of natural vegetation in India using a remote sensing-derived chlorophyll index. Int. J. Remote Sens. 2010, 31, 5777–5796. [Google Scholar] [CrossRef]
  13. Friedl, M.A.; McIver, D.K.; Hodges, J.C.F.; Zhang, X.Y.; Muchoney, D.; Strahler, A.H.; Woodcock, C.E.; Gopal, S.; Schneider, A.; Cooper, A.; et al. Global land cover mapping from MODIS: Algorithms and early results. Remote Sens. Environ. 2002, 83, 287–302. [Google Scholar] [CrossRef]
  14. Restrepo-Coupe, N.; Huete, A.; Davies, K. Satellite Phenology Validation; Chapter 9; Springer: New York, NY, USA, 2009. [Google Scholar]
  15. Huete, A.; Didan, K.; Miura, T.; Rodriguez, E.P.; Gao, X.; Ferreira, L.G. Overview of the radiometric and biophysical performance of the MODIS vegetation indices. Remote Sens. Environ. 2002, 83, 195–213. [Google Scholar] [CrossRef]
  16. Rouse, J.W., Jr.; Haas, R.H.; Schell, J.A.; Deering, D.W. Monitoring Vegetation Systems in the Great Plains with Erts. NASA Spec. Publ. 1974, 351, 309. [Google Scholar]
  17. Schwartz, M.D.; Reed, B.C. Surface phenology and satellite sensor-derived onset of greenness: An initial comparison. Int. J. Remote Sens. 1999, 20, 3451–3457. [Google Scholar] [CrossRef]
  18. Grace, J.; Nichol, C.; Disney, M.; Lewis, P.; Quaife, T.; Bowyer, P. Can we measure terrestrial photosynthesis from space directly, using spectral reflectance and fluorescence? Glob. Chang. Biol. 2007, 13, 1484–1497. [Google Scholar] [CrossRef]
  19. Olofsson, P.; Lagergren, F.; Lindroth, A.; Lindström, J.; Klemedtsson, L.; Kutsch, W.; Eklundh, L. Towards operational remote sensing of forest carbon balance across Northern Europe. Biogeosciences 2008, 5, 817–832. [Google Scholar] [CrossRef]
  20. Reed, B.C.; Brown, J.F.; Vanderzee, D.; Loveland, T.R.; Merchant, J.W.; Ohlen, D.O. Measuring phenological variability from satellite imagery. J. Veg. Sci. 1994, 5, 703–714. [Google Scholar] [CrossRef]
  21. Song, Y.; Wang, J. Mapping Winter Wheat Planting Area and Monitoring Its Phenology Using Sentinel-1 Backscatter Time Series. Remote Sens. 2019, 11, 449. [Google Scholar] [CrossRef]
  22. Grandjean, P.; Eriksen, M.L.; Ellegaard, O.; Wallin, J.A. The Matthew effect in environmental science publication: A bibliometric analysis of chemical substances in journal articles. Environ. Health 2011, 10, 96. [Google Scholar] [CrossRef] [PubMed]
  23. Hendrix, D. An analysis of bibliometric indicators, National Institutes of Health funding, and faculty size at Association of American Medical Colleges medical schools, 1997–2007. J. Med. Libr. Assoc. 2008, 96, 324–334. [Google Scholar] [CrossRef] [PubMed]
  24. Narotsky, D.; Green, P.H.R.; Lebwohl, B. Temporal and geographic trends in celiac disease publications: A bibliometric analysis. Eur. J. Gastroenterol. Hepatol. 2012, 24, 1071–1077. [Google Scholar] [CrossRef] [PubMed]
  25. Van Raan, A.F.J. Comparison of the Hirsch-index with standard bibliometric indicators and with peer judgment for 147 chemistry research groups. Scientometrics 2006, 67, 491–502. [Google Scholar] [CrossRef]
  26. Adole, T.; Dash, J.; Atkinson, P.M. A systematic review of vegetation phenology in Africa. Ecol. Inform. 2016, 34, 117–128. [Google Scholar] [CrossRef]
  27. Nagai, S.; Nasahara, K.N.; Inoue, T.; Saitoh, T.M.; Suzuki, R. Review: Advances in in situ and satellite phenological observations in Japan. Int. J. Biometeorol. 2016, 60, 615–627. [Google Scholar] [CrossRef]
  28. Uribe-Toril, J.; Ruiz-Real, J.; Haba-Osca, J.; de Pablo Valenciano, J. Forests’ First Decade: A Bibliometric Analysis Overview. Forests 2019, 10, 72. [Google Scholar] [CrossRef]
  29. Vijaylakshmi, S.; Ambuja, R. Remote sensing literature in Scopus database: A bibliometric analysis. Int. J. Libr. Inf. Stud. 2013, 3, 70–86. [Google Scholar]
  30. Zhuang, Y.; Liu, X.; Nguyen, T.; He, Q.; Hong, S. Global remote sensing research trends during 1991–2010: A bibliometric analysis. Scientometrics 2013, 96, 203–219. [Google Scholar] [CrossRef]
  31. Wang, L.; Zhang, G.; Wang, Z.; Liu, J.; Shang, J.; Liang, L. Bibliometric Analysis of Remote Sensing Research Trend in Crop Growth Monitoring: A Case Study in China. Remote Sens. 2019, 11, 809. [Google Scholar] [CrossRef]
  32. Zhang, Y.; Zhang, Y.; Shi, K.; Yao, X. Research development, current hotspots, and future directions of water research based on MODIS images: A critical review with a bibliometric analysis. Environ. Sci. Pollut. Res. 2017, 24, 15226–15239. [Google Scholar] [CrossRef] [PubMed]
  33. Agapiou, A.; Lysandrou, V. Remote sensing archaeology: Tracking and mapping evolution in European scientific literature from 1999 to 2015. J. Archaeol. Sci. Rep. 2015, 4, 192–200. [Google Scholar] [CrossRef]
  34. Cohen, K.B.; Hunter, L. Getting Started in Text Mining. PLoS Comput. Biol. 2008, 4, e20. [Google Scholar] [CrossRef] [PubMed]
  35. Srivastava, A.; Sahami, M. Text Mining: Classification, Clustering, and Applications, 1st ed.; Chapman & Hall/CRC: New York, NY, USA, 2009; ISBN 1-4200-5940-8. [Google Scholar]
  36. Van Eck, N.J.; Waltman, L. Software survey: VOSviewer, a computer program for bibliometric mapping. Scientometrics 2010, 84, 523–538. [Google Scholar] [CrossRef] [Green Version]
  37. Van Eck, N.J.; Waltman, L. Text mining and visualization using VOSviewer. ISSI Newsl. 2011, 7, 50–54. [Google Scholar]
  38. Van Eck, N.J.; Waltman, L. Visualizing Bibliometric Networks. In Measuring Scholarly Impact: Methods and Practice; Ding, Y., Rousseau, R., Wolfram, D., Eds.; Springer International Publishing: Cham, Switzerland, 2014; pp. 285–320. ISBN 978-3-319-10377-8. [Google Scholar]
  39. Lau, J.H.; Baldwin, T. An Empirical Evaluation of doc2vec with Practical Insights into Document Embedding Generation. arXiv 2016, arXiv:1607.05368. [Google Scholar]
  40. Mikolov, T.; Chen, K.; Corrado, G.; Dean, J. Efficient Estimation of Word Representations in Vector Space. arXiv 2013, arXiv:1301.3781. [Google Scholar]
  41. Mikolov, T.; Sutskever, I.; Chen, K.; Corrado, G.; Dean, J. Distributed Representations of Words and Phrases and their Compositionality. arXiv 2013, arXiv:1310.4546. [Google Scholar]
  42. Dong, Z.; Wang, M.; Yang, X. Comparative study of China and USA public private partnerships in public transportation. J. Mod. Transp. 2016, 24, 215–223. [Google Scholar] [CrossRef] [Green Version]
  43. Raparelli, E.; Bajocco, S. A bibliometric analysis on the use of unmanned aerial vehicles in agricultural and forestry studies. Int. J. Remote Sens. 2019, 40, 9070–9083. [Google Scholar] [CrossRef]
  44. Tucker, C.J. Red and photographic infrared linear combinations for monitoring vegetation. Remote Sens. Environ. 1979, 8, 127–150. [Google Scholar] [CrossRef] [Green Version]
  45. Asrar, G.; Kanemasu, E.T.; Yoshida, M. Estimates of leaf area index from spectral reflectance of wheat under different cultural practices and solar angle. Remote Sens. Environ. 1985, 17, 1–11. [Google Scholar] [CrossRef]
  46. Justice, C.O.; Townshend, J.R.G.; Holben, B.N.; Tucker, C.J. Analysis of the phenology of global vegetation using meteorological satellite data. Int. J. Remote Sens. 1985, 6, 1271–1318. [Google Scholar] [CrossRef]
  47. Wulder, M.A.; Masek, J.G.; Cohen, W.B.; Loveland, T.R.; Woodcock, C.E. Opening the Archive: How Free Data Has Enabled the Science and Monitoring Promise of Landsat. Remote Sens. Environ. 2012, 122, 2–10. [Google Scholar] [CrossRef]
  48. Rodriguez-Galiano, V.F.; Sanchez-Castillo, M.; Dash, J.; Atkinson, P.M. Modelling anomalies in the spring and autumn land surface phenology of the European forest. Biogeosci. Discuss 2015, 12, 11833–11861. [Google Scholar] [CrossRef] [Green Version]
  49. Woldendorp, G.; Hill, M.J.; Doran, R.; Ball, M.C. Frost in a future climate: Modelling interactive effects of warmer temperatures and rising atmospheric [CO2] on the incidence and severity of frost damage in a temperate evergreen (Eucalyptus pauciflora). Glob. Chang. Biol. 2008, 14, 294–308. [Google Scholar] [CrossRef]
  50. Gallinat, A.S.; Primack, R.B.; Wagner, D.L. Autumn, the neglected season in climate change research. Trends Ecol. Evol. 2015, 30, 169–176. [Google Scholar] [CrossRef]
  51. Augspurger, C.K. Reconstructing patterns of temperature, phenology, and frost damage over 124 years: Spring damage risk is increasing. Ecology 2013, 94, 41–50. [Google Scholar] [CrossRef]
  52. Bajocco, S.; Rosati, L.; Ricotta, C. Knowing fire incidence through fuel phenology: A remotely sensed approach. Ecol. Model. 2010, 221, 59–66. [Google Scholar] [CrossRef]
  53. Poggio, L.; Gimona, A. Modelling high resolution RS data with the aid of coarse resolution data and ancillary data. Int. J. Appl. Earth Obs. Geoinf. 2013, 23, 360–371. [Google Scholar] [CrossRef]
  54. Atkinson, P.M.; Jeganathan, C.; Dash, J.; Atzberger, C. Inter-comparison of four models for smoothing satellite sensor time-series data to estimate vegetation phenology. Remote Sens. Environ. 2012, 123, 400–417. [Google Scholar] [CrossRef]
  55. Walker, J.J.; de Beurs, K.M.; Wynne, R.H.; Gao, F. Evaluation of Landsat and MODIS data fusion products for analysis of dryland forest phenology. Remote Sens. Environ. 2012, 117, 381–393. [Google Scholar] [CrossRef]
  56. Yang, X.; Mustard, J.F.; Tang, J.; Xu, H. Regional-scale phenology modeling based on meteorological records and remote sensing observations: Regional phenology modeling. J. Geophys. Res. 2012, 117, G03029. [Google Scholar] [CrossRef]
  57. Shew, A.M.; Ghosh, A. Identifying Dry-Season Rice-Planting Patterns in Bangladesh Using the Landsat Archive. Remote Sens. 2019, 11, 1235. [Google Scholar] [CrossRef] [Green Version]
  58. Tuanmu, M.-N.; Viña, A.; Bearer, S.; Xu, W.; Ouyang, Z.; Zhang, H.; Liu, J. Mapping understory vegetation using phenological characteristics derived from remotely sensed data. Remote Sens. Environ. 2010, 114, 1833–1844. [Google Scholar] [CrossRef]
  59. Whitcraft, A.; Becker-Reshef, I.; Justice, C. A Framework for Defining Spatially Explicit Earth Observation Requirements for a Global Agricultural Monitoring Initiative (GEOGLAM). Remote Sens. 2015, 7, 1461–1481. [Google Scholar] [CrossRef] [Green Version]
  60. Jin, X.; Kumar, L.; Li, Z.; Feng, H.; Xu, X.; Yang, G.; Wang, J. A review of data assimilation of remote sensing and crop models. Eur. J. Agron. 2018, 92, 141–152. [Google Scholar] [CrossRef]
  61. Yuping, M.; Shili, W.; Li, Z.; Yingyu, H.; Liwei, Z.; Yanbo, H.; Futang, W. Monitoring winter wheat growth in North China by combining a crop model and remote sensing data. Int. J. Appl. Earth Obs. Geoinf. 2008, 10, 426–437. [Google Scholar] [CrossRef]
  62. Gilardelli, C.; Stella, T.; Confalonieri, R.; Ranghetti, L.; Campos-Taberner, M.; García-Haro, F.J.; Boschetti, M. Downscaling rice yield simulation at sub-field scale using remotely sensed LAI data. Eur. J. Agron. 2019, 103, 108–116. [Google Scholar] [CrossRef]
  63. Landmann, T.; Eidmann, D.; Cornish, N.; Franke, J.; Siebert, S. Optimizing harmonics from Landsat time series data: The case of mapping rainfed and irrigated agriculture in Zimbabwe. Remote Sens. Lett. 2019, 10, 1038–1046. [Google Scholar] [CrossRef]
  64. Knight, J.F.; Lunetta, R.S.; Ediriwickrema, J.; Khorram, S. Regional Scale Land Cover Characterization Using MODIS-NDVI 250 m Multi-Temporal Imagery: A Phenology-Based Approach. Gisci. Remote Sens. 2006, 43, 1–23. [Google Scholar] [CrossRef]
  65. Liu, B.; Chen, J.; Chen, J.; Zhang, W. Land Cover Change Detection Using Multiple Shape Parameters of Spectral and NDVI Curves. Remote Sens. 2018, 10, 1251. [Google Scholar] [CrossRef] [Green Version]
  66. Liu, J.; Huffman, T.; Shang, J.; Qian, B.; Dong, T.; Zhang, Y. Identifying Major Crop Types in Eastern Canada Using a Fuzzy Decision Tree Classifier and Phenological Indicators Derived from Time Series MODIS Data. Can. J. Remote Sens. 2016, 42, 259–273. [Google Scholar] [CrossRef]
  67. Liu, J.; Li, L.; Huang, X.; Liu, Y.; Li, T. Mapping paddy rice in Jiangsu Province, China, based on phenological parameters and a decision tree model. Front. Earth Sci. 2019, 13, 111–123. [Google Scholar] [CrossRef]
  68. Roodposhti, M.S.; Safarrad, T.; Shahabi, H. Drought sensitivity mapping using two one-class support vector machine algorithms. Atmos. Res. 2017, 193, 73–82. [Google Scholar] [CrossRef]
  69. Bascietto, M.; Bajocco, S.; Mazzenga, F.; Matteucci, G. Assessing spring frost effects on beech forests in Central Apennines from remotely-sensed data. Agric. For. Meteorol. 2018, 248, 240–250. [Google Scholar] [CrossRef]
  70. Kasampalis, D.A.; Alexandridis, T.K.; Deva, C.; Challinor, A.; Moshou, D.; Zalidis, G. Contribution of Remote Sensing on Crop Models: A Review. J. Imaging 2018, 4, 52. [Google Scholar] [CrossRef] [Green Version]
  71. Fernandez-Martinez, M.; Belmonte, J.; Espelta, J.M. Masting in oaks: Disentangling the effect of flowering phenology, airborne pollen load and drought. Acta Oecol. 2012, 43, 51–59. [Google Scholar] [CrossRef]
  72. Czernecki, B.; Nowosad, J. Machine learning modeling of plant phenology based on coupling satellite and gridded meteorological dataset. Int. J. Biometeorol. 2018, 62, 1297–1309. [Google Scholar] [CrossRef] [Green Version]
  73. Bascietto, M.; Bajocco, S.; Ferrara, C.; Alivernini, A.; Santangelo, E. Estimating late spring frost-induced growth anomalies in European beech forests in Italy. Int. J. Biometeorol. 2019, 63, 1039–1049. [Google Scholar] [CrossRef]
  74. Vitasse, Y.; Signarbieux, C.; Fu, Y.H. Global warming leads to more uniform spring phenology across elevations. Proc. Natl. Acad. Sci. USA 2018, 115, 1004–1008. [Google Scholar] [CrossRef] [PubMed] [Green Version]
  75. Richardson, A.D.; Keenan, T.F.; Migliavacca, M.; Ryu, Y.; Sonnentag, O.; Toomey, M. Climate change, phenology, and phenological control of vegetation feedbacks to the climate system. Agric. For. Meteorol. 2013, 169, 156–173. [Google Scholar] [CrossRef]
  76. Donnelly, A.; Liu, L.; Zhang, X.; Wingler, A. Autumn leaf phenology: Discrepancies between in situ observations and satellite data at urban and rural sites. Int. J. Remote Sens. 2018, 39, 8129–8150. [Google Scholar] [CrossRef]
  77. Sparks, T.H.; Menzel, A. Observed changes in seasons: An overview. Int. J. Clim. 2002, 22, 1715–1725. [Google Scholar] [CrossRef]
  78. Wang, J.; Wu, C.; Zhang, C.; Ju, W.; Wang, X.; Chen, Z.; Fang, B. Improved modeling of gross primary productivity (GPP) by better representation of plant phenological indicators from remote sensing using a process model. Ecol. Indic. 2018, 88, 332–340. [Google Scholar] [CrossRef]
  79. Migliavacca, M.; Reichstein, M.; Richardson, A.D.; Mahecha, M.D.; Cremonese, E.; Delpierre, N.; Galvagno, M.; Law, B.E.; Wohlfahrt, G.; Andrew Black, T.; et al. Influence of physiological phenology on the seasonal pattern of ecosystem respiration in deciduous forests. Glob. Chang. Biol. 2015, 21, 363–376. [Google Scholar] [CrossRef]
  80. Gwenzi, D.; Helmer, E.; Zhu, X.; Lefsky, M.; Marcano-Vega, H. Predictions of Tropical Forest Biomass and Biomass Growth Based on Stand Height or Canopy Area Are Improved by Landsat-Scale Phenology across Puerto Rico and the U.S. Virgin Islands. Remote Sens. 2017, 9, 123. [Google Scholar] [CrossRef] [Green Version]
  81. Brewin, R.J.W.; Dall’Olmo, G.; Pardo, S.; van Dongen-Vogels, V.; Boss, E.S. Underway spectrophotometry along the Atlantic Meridional Transect reveals high performance in satellite chlorophyll retrievals. Remote Sens. Environ. 2016, 183, 82–97. [Google Scholar] [CrossRef] [Green Version]
  82. Tan, W.; LeDrew, E. Monitoring Arctic sea ice phenology change using hypertemporal remotely sensed data: 1989–2010. Appl. Clim. 2016, 125, 353–363. [Google Scholar] [CrossRef]
  83. Salgado-Hernanz, P.M.; Racault, M.-F.; Font-Muñoz, J.S.; Basterretxea, G. Trends in phytoplankton phenology in the Mediterranean Sea based on ocean-colour remote sensing. Remote Sens. Environ. 2019, 221, 50–64. [Google Scholar] [CrossRef]
  84. Küçük, Ç.; Taşkın, G.; Erten, E. Paddy-Rice Phenology Classification Based on Machine-Learning Methods Using Multitemporal Co-Polar X-Band SAR Images. IEEE J. Sel. Top. Appl. Earth Obs. Remote Sens. 2016, 9, 2509–2519. [Google Scholar] [CrossRef]
  85. Helman, D. Land surface phenology: What do we really see from space? Sci. Total Environ. 2018, 618, 665–673. [Google Scholar] [CrossRef] [PubMed]
  86. Dong, T.; Liu, J.; Shang, J.; Qian, B.; Ma, B.; Kovacs, J.M.; Walters, D.; Jiao, X.; Geng, X.; Shi, Y. Assessment of red-edge vegetation indices for crop leaf area index estimation. Remote Sens. Environ. 2019, 222, 133–143. [Google Scholar] [CrossRef]
  87. Ballester, C.; Brinkhoff, J.; Quayle, W.C.; Hornbuckle, J. Monitoring the Effects of Water Stress in Cotton using the Green Red Vegetation Index and Red Edge Ratio. Remote Sens. 2019, 11, 873. [Google Scholar] [CrossRef] [Green Version]
  88. Reiche, J.; Verbesselt, J.; Hoekman, D.; Herold, M. Fusing Landsat and SAR time series to detect deforestation in the tropics. Remote Sens. Environ. 2015, 156, 276–293. [Google Scholar] [CrossRef]
  89. Duncan, J.M.A.; Dash, J.; Atkinson, P.M. Elucidating the impact of temperature variability and extremes on cereal croplands through remote sensing. Glob. Chang. Biol. 2015, 21, 1541–1551. [Google Scholar] [CrossRef] [Green Version]
  90. Qader, S.H.; Dash, J.; Atkinson, P.M. Forecasting wheat and barley crop production in arid and semi-arid regions using remotely sensed primary productivity and crop phenology: A case study in Iraq. Sci. Total Environ. 2018, 613, 250–262. [Google Scholar] [CrossRef] [Green Version]
  91. Marshall, M.; Tu, K.; Brown, J. Optimizing a remote sensing production efficiency model for macro-scale GPP and yield estimation in agroecosystems. Remote Sens. Environ. 2018, 217, 258–271. [Google Scholar] [CrossRef]
  92. Singh, K.K.; Chen, Y.-H.; Smart, L.; Gray, J.; Meentemeyer, R.K. Intra-annual phenology for detecting understory plant invasion in urban forests. ISPRS J. Photogramm. Remote Sens. 2018, 142, 151–161. [Google Scholar] [CrossRef]
  93. Krehbiel, C.; Zhang, X.; Henebry, G. Impacts of Thermal Time on Land Surface Phenology in Urban Areas. Remote Sens. 2017, 9, 499. [Google Scholar] [CrossRef] [Green Version]
  94. Ren, Q.; He, C.; Huang, Q.; Zhou, Y. Urbanization Impacts on Vegetation Phenology in China. Remote Sens. 2018, 10, 1905. [Google Scholar] [CrossRef] [Green Version]
  95. Zhou, D.; Zhao, S.; Zhang, L.; Liu, S. Remotely sensed assessment of urbanization effects on vegetation phenology in China’s 32 major cities. Remote Sens. Environ. 2016, 176, 272–281. [Google Scholar] [CrossRef] [Green Version]
  96. Jeong, S.-J.; Park, H.; Ho, C.-H.; Kim, J. Impact of urbanization on spring and autumn phenology of deciduous trees in the Seoul Capital Area, South Korea. Int. J. Biometeorol. 2019, 63, 627–637. [Google Scholar] [CrossRef] [PubMed]
  97. Li, X.; Zhou, Y.; Asrar, G.R.; Mao, J.; Li, X.; Li, W. Response of vegetation phenology to urbanization in the conterminous United States. Glob. Chang. Biol. 2017, 23, 2818–2830. [Google Scholar] [CrossRef]
  98. Helmer, E.; Ruzycki, T.; Wilson, B.; Sherrill, K.; Lefsky, M.; Marcano-Vega, H.; Brandeis, T.; Erickson, H.; Ruefenacht, B. Tropical Deforestation and Recolonization by Exotic and Native Trees: Spatial Patterns of Tropical Forest Biomass, Functional Groups, and Species Counts and Links to Stand Age, Geoclimate, and Sustainability Goals. Remote Sens. 2018, 10, 1724. [Google Scholar] [CrossRef] [Green Version]
  99. Jin, Y.; Sung, S.; Lee, D.; Biging, G.; Jeong, S. Mapping Deforestation in North Korea Using Phenology-Based Multi-Index and Random Forest. Remote Sens. 2016, 8, 997. [Google Scholar] [CrossRef] [Green Version]
  100. Valderrama-Landeros, L.H.; España-Boquera, M.L.; Baret, F. Deforestation in Michoacan, Mexico, From CYCLOPES-LAI Time Series (2000–2006). IEEE J. Sel. Top. Appl. Earth Obs. Remote Sens. 2016, 9, 5398–5405. [Google Scholar] [CrossRef]
  101. McKenna, P.; Phinn, S.; Erskine, P. Fire Severity and Vegetation Recovery on Mine Site Rehabilitation Using WorldView-3 Imagery. Fire 2018, 1, 22. [Google Scholar] [CrossRef] [Green Version]
  102. João, T.; João, G.; Bruno, M.; João, H. Indicator-based assessment of post-fire recovery dynamics using satellite NDVI time-series. Ecol. Indic. 2018, 89, 199–212. [Google Scholar] [CrossRef]
  103. Dragozi, E.; Gitas, I.; Bajocco, S.; Stavrakoudis, D. Exploring the Relationship between Burn Severity Field Data and Very High Resolution GeoEye Images: The Case of the 2011 Evros Wildfire in Greece. Remote Sens. 2016, 8, 566. [Google Scholar] [CrossRef] [Green Version]
  104. Bajocco, S.; Koutsias, N.; Ricotta, C. Linking fire ignitions hotspots and fuel phenology: The importance of being seasonal. Ecol. Indic. 2017, 82, 433–440. [Google Scholar] [CrossRef]
  105. Wang, J.; Zhang, X. Impacts of wildfires on interannual trends in land surface phenology: An investigation of the Hayman Fire. Environ. Res. Lett. 2017, 12, 054008. [Google Scholar] [CrossRef]
  106. Fensholt, R.; Langanke, T.; Rasmussen, K.; Reenberg, A.; Prince, S.D.; Tucker, C.; Scholes, R.J.; Le, Q.B.; Bondeau, A.; Eastman, R.; et al. Greenness in semi-arid areas across the globe 1981–2007—An Earth Observing Satellite based analysis of trends and drivers. Remote Sens. Environ. 2012, 121, 144–158. [Google Scholar] [CrossRef]
  107. Ivits, E.; Cherlet, M.; Tóth, G.; Sommer, S.; Mehl, W.; Vogt, J.; Micale, F. Combining satellite derived phenology with climate data for climate change impact assessment. Glob. Planet. Change 2012, 88, 85–97. [Google Scholar] [CrossRef]
  108. Fares, S.; Bajocco, S.; Salvati, L.; Camarretta, N.; Dupuy, J.-L.; Xanthopoulos, G.; Guijarro, M.; Madrigal, J.; Hernando, C.; Corona, P. Characterizing potential wildland fire fuel in live vegetation in the Mediterranean region. Ann. For. Sci. 2017, 74, 1. [Google Scholar] [CrossRef] [Green Version]
  109. Bendini, H.D.N.; Fonseca, L.M.G.; Schwieder, M.; Körting, T.S.; Rufin, P.; Sanches, I.D.A.; Leitão, P.J.; Hostert, P. Detailed agricultural land classification in the Brazilian cerrado based on phenological information from dense satellite image time series. Int. J. Appl. Earth Obs. Geoinf. 2019, 82, 101872. [Google Scholar] [CrossRef]
  110. Liu, Y.; Hill, M.J.; Zhang, X.; Wang, Z.; Richardson, A.D.; Hufkens, K.; Filippa, G.; Baldocchi, D.D.; Ma, S.; Verfaillie, J.; et al. Using data from Landsat, MODIS, VIIRS and PhenoCams to monitor the phenology of California oak/grass savanna and open grassland across spatial scales. Agric. For. Meteorol. 2017, 237, 311–325. [Google Scholar] [CrossRef]
  111. Liu, Q.; Fu, Y.H.; Zhu, Z.; Liu, Y.; Liu, Z. Delayed autumn phenology in the Northern Hemisphere is related to change in both climate and spring phenology. Glob. Change Biol. 2016, 22, 3702–3711. [Google Scholar] [CrossRef]
  112. Yang, B.; He, M.; Shishov, V.; Tychkov, I.; Vaganov, E.; Rossi, S.; Ljungqvist, F.C.; Bräuning, A.; Grießinger, J. New perspective on spring vegetation phenology and global climate change based on Tibetan Plateau tree-ring data. Proc. Natl. Acad. Sci. USA 2017, 114, 6966–6971. [Google Scholar] [CrossRef] [Green Version]
  113. Karkauskaite, P.; Tagesson, T.; Fensholt, R. Evaluation of the Plant Phenology Index (PPI), NDVI and EVI for Start-of-Season Trend Analysis of the Northern Hemisphere Boreal Zone. Remote Sens. 2017, 9, 485. [Google Scholar] [CrossRef] [Green Version]
  114. Nontasiri, J.; Dash, J.; Roberts, G. Estimating of Rice Crop Yield in Thailand Using Satellite Data. In Proceedings of the SPIE 10783, Remote Sensing for Agriculture, Ecosystems, and Hydrology XX, Berlin, Germany, 10 October 2018; p. 107832K. [Google Scholar]
  115. Tang, K.; Zhu, W.; Zhan, P.; Ding, S. An Identification Method for Spring Maize in Northeast China Based on Spectral and Phenological Features. Remote Sens. 2018, 10, 193. [Google Scholar] [CrossRef] [Green Version]
  116. Xu, X.; Conrad, C.; Doktor, D. Optimising Phenological Metrics Extraction for Different Crop Types in Germany Using the Moderate Resolution Imaging Spectrometer (MODIS). Remote Sens. 2017, 9, 254. [Google Scholar] [CrossRef] [Green Version]
  117. Siachalou, S.; Mallinis, G.; Tsakiri-Strati, M. A Hidden Markov Models Approach for Crop Classification: Linking Crop Phenology to Time Series of Multi-Sensor Remote Sensing Data. Remote Sens. 2015, 7, 3633–3650. [Google Scholar] [CrossRef] [Green Version]
  118. Sakamoto, T.; Sprague, D.S.; Okamoto, K.; Ishitsuka, N. Semi-automatic classification method for mapping the rice-planted areas of Japan using multi-temporal Landsat images. Remote Sens. Appl. Soc. Environ. 2018, 10, 7–17. [Google Scholar] [CrossRef]
Figure 1. Temporal trend of rs+pheno (remotely sensed phenology) papers over the period 1979–2018. In blue, the total number of rs+pheno papers; in orange, the ratio between the total number of rs+pheno papers and the total number of all the scientific papers multiplied by 1,000,000.
Remotesensing 11 02751 g001
Figure 2. Temporal trend of publications in rs+pheno studies over the period 1979–2018 for the five most publishing remote sensing-based journals (upper panel) and the three most publishing ecology-based journals (lower panel).
Remotesensing 11 02751 g002
Figure 3. Network mapping of the keywords most used (occurrence threshold = 20) in the rs+pheno research in 1999–2008. Color bar indicates the year in which each keyword was mainly used. Lines represent the link strength between two terms (minimum link strength = 10).
Remotesensing 11 02751 g003
Figure 4. Network mapping of the keywords most used (occurrence threshold = 20) in the rs+pheno research in 2009–2018. Color bar indicates the year in which each keyword was mainly used. Lines represent the link strength between two terms (minimum link strength = 10).
Remotesensing 11 02751 g004
Figure 5. Network mapping and clustering of terms in 1999–2008. Since it is a 3-d map, not all the terms are represented. Lines represent the link strength between two terms (minimum link strength = 10). Red cluster = phenology/climate topic; Blue cluster = classification/agriculture topic.
Remotesensing 11 02751 g005
Figure 6. Network mapping and clustering of terms in 2009–2018. Since it is a 3-d map, not all the terms are represented. Lines represent the link strength between two terms (minimum link strength = 10). Red cluster = phenology/climate topic; Blue cluster = agriculture topic; Orange cluster = classification topic.
Remotesensing 11 02751 g006
Figure 7. Temporal trend and proportion of the rs+pheno papers dealing with the ten most relevant terms identified in 2009–2018 (see Table 3) to the total rs+pheno papers over the period 1979–2018. A 5-year moving average was applied.
Remotesensing 11 02751 g007
Table 1. List of the most used scientific journals in rs+pheno (remotely sensed phenology) studies (>20 documents in 1979–2018), with corresponding impact factor (source: Thomson Reuters) and H index (source: SCImago Journal Rank - SJR).
JournalRs+Pheno DocsImpact FactorH Index
Remote Sensing of Environment2328.218238
International Geoscience and Remote Sensing Symposium–IGARSS166na58
Remote Sensing1504.11881
International Journal of Remote Sensing1482.493151
Proceedings of SPIE - The International Society for Optical Engineering117na151
Agricultural and Forest Meteorology574.189144
ISPRS - Journal of Photogrammetry and Remote Sensing526.942110
IEEE - Journal of Selected Topics in Applied Earth Observations and Remote Sensing353.39264
IEEE - Transactions on Geoscience and Remote Sensing325.63216
International Journal of Applied Earth Observation and Geoinformation324.84686
Global Change Biology308.88217
Ecological Indicators234.49097
Photogrammetric Engineering and Remote Sensing213.15114
Journal of Applied Remote Sensing201.34439
Table 2. List of the ten most occurrent terms in 1999–2008 and in 2009–2018.
TermRel. ScoreOccurrenceCluster Color
1999–2008Classification0.5693blue
Accuracy0.4481blue
Mapping0.5177blue
Temperature0.8068red
Day0.6867red
Reflectance0.6260blue
Start of season1.1655red
Crops0.6453blue
Phenology stage0.4153red
LAI0.7150blue
2009–2018Image0.53422blue
Accuracy0.68403blue
Classification0.57264blue
Mapping0.57261red
Temperature0.89253red
Start of season0.77242blue
Response0.67229red
Trend0.59221blue
Climate change0.86217red
Climate0.75211blue
Table 3. List of the ten most relevant terms in 1999–2008 and in 2009–2018.
TermRel. ScoreOccurrenceCluster Color
1999–2008July2.6021blue
North America2.3211red
May2.3014blue
Crop type2.1410blue
August2.1118blue
Chlorophyll2.1012blue
Unsupervised classification2.0913blue
June1.9625blue
November1.8712blue
Yield1.8327blue
2009–2018Ecosystem respiration4.2412red
NEE3.2017red
Carbon uptake2.9119red
Crop classification2.8522blue
Red edge2.5311blue
SAR image2.4711blue
Major crops2.4314blue
Eddy covariance2.3833red
SVM2.3436orange
Yield prediction2.2818blue

