Article

Spatiotemporal Fusion of Satellite Images via Very Deep Convolutional Networks

1
School of Computer and Software, Engineering Research Center of Digital Forensics, Ministry of Education PAPD, Nanjing University of Information Science and Technology, Nanjing 210044, China
2
Jiangsu Key Laboratory of Big Data Analysis Technology (B-DAT) and Jiangsu Collaborative Innovation Center on Atmospheric Environment and Equipment Technology (CICAEET), Nanjing University of Information Science and Technology, Nanjing 210044, China
3
The School of Computer Science and Engineering, Nanjing University of Science and Technology, Nanjing 210094, China
4
College of Information and Communication Engineering, Sungkyunkwan University, Suwon 440-746, Korea
*
Author to whom correspondence should be addressed.
Remote Sens. 2019, 11(22), 2701; https://doi.org/10.3390/rs11222701
Submission received: 11 October 2019 / Revised: 9 November 2019 / Accepted: 13 November 2019 / Published: 18 November 2019
(This article belongs to the Section Remote Sensing Image Processing)

Abstract

:
Spatiotemporal fusion provides an effective way to fuse two types of remote sensing data featured by complementary spatial and temporal properties (typical representatives are Landsat and MODIS images) to generate fused data with both high spatial and temporal resolutions. This paper presents a very deep convolutional neural network (VDCN) based spatiotemporal fusion approach to effectively handle massive remote sensing data in practical applications. Compared with existing shallow learning methods, especially for the sparse representation based ones, the proposed VDCN-based model has the following merits: (1) explicitly correlating the MODIS and Landsat images by learning a non-linear mapping relationship; (2) automatically extracting effective image features; and (3) unifying the feature extraction, non-linear mapping, and image reconstruction into one optimization framework. In the training stage, we train a non-linear mapping between downsampled Landsat and MODIS data using VDCN, and then we train a multi-scale super-resolution (MSSR) VDCN between the original Landsat and downsampled Landsat data. The prediction procedure contains three layers, where each layer consists of a VDCN-based prediction and a fusion model. These layers achieve non-linear mapping from MODIS to downsampled Landsat data, the two-times SR of downsampled Landsat data, and the five-times SR of downsampled Landsat data, successively. Extensive evaluations are executed on two groups of commonly used Landsat–MODIS benchmark datasets. For the fusion results, the quantitative evaluations on all prediction dates and the visual effect on one key date demonstrate that the proposed approach achieves more accurate fusion results than sparse representation based methods.

Graphical Abstract

1. Introduction

One of the fundamental features of remote sensing data is the resolution in spatial, spectral, temporal, and radiometric domains. However, all single remote sensing sensors are constrained by their tradeoffs in spatial, spectral, temporal, and radiometric resolutions due to the technical and economic reasons. Specifically, we focus on the tradeoff between spatial and temporal resolution of remote sensing data in this study. For example, the images from sensors of Landsat TM/ETM+ and SPOT/HRV are featured by high-spatial resolutions of 10–30 m but low-temporal resolutions from a half to one month, while the images from sensors of MODIS, AVHRR, and MERIS are characterized by low-spatial resolutions of 250–1000 m but daily temporal coverage. These remote sensing data are complementary in both spatial and temporal resolutions.
However, capturing both spatial and temporal dynamical characteristics simultaneously is one important property for existing current remote sensing based monitoring systems. Examples include a monitoring system for change detection of land use/cover, crop growth monitoring system, disaster monitoring system, etc. [1,2]. To solve this conflict between data deficiency and the needs of practical applications, various spatiotemporal fusion methods [3,4,5,6,7,8,9,10] were proposed in the past decade. These methods combine high spatial resolution remote sensing data and high temporal resolution remote sensing data to generate fused data with both high-spatial and high-temporal resolutions. Specifically, the high-spatial resolution data suffer from low-temporal resolution (shortened as HSLT) and the high-temporal resolution data has low-spatial resolution (shortened as HTLS), but they are characterized by some similar spectral properties, such as band width and the number of bands. Considering the long revisit cycles of HSLT images and the effects of bad weather, the usual assumption for inputs of spatiotemporal fusion methods is that one or two pairs of HSLT–HTLS images on prior dates and one or more HTLS images on prediction dates are given. According to the differences in fusion basis, these fusion methods are usually divided into three classes: reconstruction-based, transformation-based, and learning-based [11]. We introduce several representative works for each category in the following section.
In the reconstruction-based methods, given the input images, they first search the neighboring pixels with spectrally similarity, and then each pixel in the fused image is predicted by a weighted sum of these pixels. Gao et al. [3] first introduced the reconstruction-based method into spatiotemporal fusion, termed as the spatial and temporal adaptive reflectance fusion model (STARFM), which fuses the Landsat and MODIS surface reflectance to obtain daily Landsat-like surface reflectance. However, STARFM has the following issues: first, it cannot deal well with the abnormal cases of land-cover type changes or disturbance events not contained in one Landsat image; second, it cannot handle well the predictions in heterogeneous landscapes. To address these issues, afterwards, several STARFM-improved models have been proposed. Hilker et al. [4] presented a spatial and temporal adaptive algorithm or mapping reflectance change (STAARCH) by discovering the temporal variations from a dense set of MODIS data. Zhu et al. [5] proposed an enhanced STARFM (ESTARFM) by handling homogeneous and heterogeneous regions separately with different conversion coefficients. Wang et al. [6] extended STARFM by first downscaling MODIS 500 m bands to 250 m by using bands 1 and 2 to enhance the predictions at areas with abrupt changes or heterogeneity.
In the transformation-based methods, input images are first transformed into another space and then the fusion procedure is implemented in a local subspace. For example, Acerbi-Junior et al. [7] improved the spatial resolutions of MODIS data by combining Landsat images into a three-level wavelet decomposition framework. Hilker et al. [4] fused the reflectance data of MODIS and Landsat TM/ETM+ that is able to capture changes using two fine spatial resolution images based on Tasseled cap transformation, which transforms the original bands into a new space with brightness, greenness, and wetness as axes, respectively.
With the popularity of sparse representation and deep learning in the past decade, the learning-based spatiotemporal fusion methods have been presented in recent years. With two-paired Landsat–MODIS images as priors, Huang and Song [8] worked to establish a corresponding relationship between the difference images of MODIS and Landsat by training a dictionary-pair, and then generate the Landsat image on the prediction date by a weighted sum of the predictions from two prior dates. To cope with the case of one-paired prior images, the authors further presented a fusion framework by first improving the spatial resolutions of the MODIS images based on sparse representation and then generating the fused image via a two-layer high-pass modulation framework [9]. To deal with the problems of manual feature designing and optimization disunity in sparse representation based fusion methods, Song et al. proposed a convolutional neural network (CNN) based fusion method to automatically extract effective image features by learning an end-to-end mapping between MODIS and downsampled Landsat images [10]. However, this CNN-based method only used three hidden layers, which was difficult to accurately simulate the complex non-linear correspondence between MODIS and Landsat images (caused by the differences in aspects of imaging environment, sensor design, etc.).
To improve this CNN-based shallow model, we present a novel spatiotemporal fusion approach with very deep convolutional neural networks (VDCNs). Specifically, we first trained a nonlinear mapping VDCN model to directly correlate MODIS and downsampled Landsat data, and then trained a multi-scale SR VDCN model between the downsampled Landsat and the original Landsat data in the training stage; in the prediction step, the input MODIS images were first mapped into the downsampled Landsat data using the trained non-linear mapping function of VDCN, and then super-resolved to the original Landsat image through a two-step image super-resolution. The learned two VDCN models can automatically extract image features and optimally unify feature extraction, non-linear mapping (playing the same role as sparse coding and dictionary learning in sparse representation), and image reconstruction.
The remaining sections are structured as follows. In Section 2, we introduce the work related with the proposed method. The proposed method is presented in detail in Section 3, and the experimental results and comparisons are demonstrated in Section 4. In Section 5, the paper is concluded with some discussions.

2. Related Work

2.1. Convolutional Neural Networks (CNNs)

CNNs are a type of deep and feed-forward artificial neural network that leverages a variation of multi-layer perceptrons tailored to recognize visual patterns directly from images without manual tweaking or preprocessing [12]. CNNs are shift-invariant because of their shared-weights architecture and translation invariance characteristics. Compared with shallow models (e.g., sparse representation based models), CNNs have much stronger learning capacity, ensuring more accurate predictions. Instead of using hand-designed features, CNNs can automatically learn rich feature hierarchies in a data-driven manner.
In recent years, much advance has been achieved for CNNs in the following aspects [13]: (1) the availability of largescale training sets with millions of annotated labels; (2) powerful GPU (Graphics Processing Unit) computation, which makes it practical to train a very large model; (3) a series of better model regularization strategies have been proposed, including the rectified linear unit (ReLU) [14], batch normalization [15], and residual learning [16]. Such advances promoted applying CNNs into a variety of computer vision tasks, such as object detection, object recognition, image classification, image de-noising, and image super-resolution, to name a few [17,18,19,20]. Since the breakthrough in image classification [20], the architecture of CNNs in [20] has been improved in several aspects. One of the important improvements is to increase the depth of CNNs using an architecture with a set of 3 × 3 convolution filters [21] (i.e., the very deep convolutional network). This work shows that a significant improvement can be achieved by setting the depth to 16–19 layers. In spite of the larger number of parameters and the greater depth compared to the original net in [20], the nets require less epochs to converge due to (1) the implicit regularization imposed by the greater depth and smaller convolution filter sizes; and (2) pre-initialization of certain layers.

2.2. CNNs for Single-Image Super-Resolution

Single-image super-resolution (SISR) aims to generate a high-resolution image from a low-resolution input image [22]. Recently, deep learning has been successfully introduced to SISR and delivered compelling performance [18,23]. In [18], Dong et al. first introduced CNN into SISR, whose model was comprised of three convolutional layers corresponding to patch extraction, non-linear mapping, and reconstruction, respectively. The input and output of this method corresponded to the low-resolution and high-resolution images, respectively, which directly learn a mapping between the low-and high resolution images in an end to end manner. Kim et al. [23] proposed a very deep CNN (20 layers) based SISR approach, which leverages residual-learning and gradient clipping techniques to speed up training. Compared with the previous methods, this method achieves more accurate results in large scale datasets. CNNs-based single image super-resolution techniques were also applied to spatial resolution enhancement of remote sensing images, such as the works in [24,25].

3. Methodology

To handle both phenology and land-cover changes, we did not impose any restrictions on the proportion of each land-cover type or the land-cover type changes in temporal axis. The input HSLT and HTLS data of the proposed method were Landsat/TM or ETM+ and MODIS images, respectively. Notably, our method could handle both cases of one-paired and two paired prior HSLT–HTLS images. However, we assumed there were two-paired prior Landsat–MODIS images in consideration of applying deep learning into massive remote sensing data.
Figure 1 shows the overall flowchart of the proposed approach. In general, the proposed framework consisted of a training stage and a prediction stage. In the training stage, we first learned a non-linear mapping VDCN to directly correlate downsampled Landsat (250 m) and MODIS images (500 m), and then we trained a multi-scale SR (MSSR) VDCN between 250 m Landsat images and the original Landsat images (25 m). To model the complex correspondence between MODIS and Landsat images and to reduce the spatial resolution gap in the next super-resolution step, we set a small resolution gap in designing the non-linear mapping VDCN. Considering so large a spatial resolution gap (10 times) between the original Landsat and the downsampled Landsat images, we designed an MSSR VDCN including 2 times and 5 times. Assuming that the noise intensities caused by imaging environment and imaging system were the same in all bands, we trained a non-linear mapping model and an MSSR model for all bands. In the prediction stage, the input MODIS images were first mapped into the 250 m Landsat images via the learned non-linear mapping VDCN and a fusion model; then, the 250 m Landsat images were super-resolved to the original Landsat images via a two-step super-resolution and a fusion model. The adoption of the fusion model was to fully utilize the information in prior Landsat images.

3.1. Configurations of Non-Linear Mapping VDCN

Inspired by the successful application of VDCN in image recognition [21], we designed a non-linear mapping VDCN to model the complex correspondence between downsampled Landsat and MODIS data. Since the downsampled Landsat and MODIS data were highly correlated, we decomposed one downsampled Landsat image into a low frequency part (corresponding to MODIS image) and a high frequency part (corresponding to image details). We thus built the non-linear mapping model between MODIS images and the image details (or residual images). The work in [23,26] demonstrated that residual-learning methods achieved superior performance over corresponding non-residual methods in both efficiency and accuracy for image super-resolution. In the prediction stage, the predicted downsampled Landsat image was obtained by the sum of network input and output.
Figure 2 illustrates the network architecture. It takes interpolated MODIS images as input and exports the image details. D convolutional layers and D-1 nonlinear layers are contained in the network, where each convolutional layer except for the last one is followed by an ReLU layer. The first layer operates on the input image with 64 3 × 3 filters. The layers from 2 to D-1 contain 64 3 × 3 filters, where each layer operates on 3 × 3 spatial region across 64 channels. The last layer contains a single 3 × 3 × 64 filter to yield the output residual images.
The stride of convolution was fixed to 1 pixel and zero padding with 1 pixel adopted for the input of convolutional layers such that all feature maps and the output reconstructed image kept the same size. The size of the receptive field was proportional to the depth of the network. For our depth D network, the receptive field had a size (2D + 1) × (2D + 1).

3.2. Configurations of Super-Resolution VDCN

For the 10 times spatial resolution gap between downsampled Landsat and original Landsat images, building one single super-resolution model was difficult between them. The work in [23,27] demonstrated that a single VDCN model can achieve superior performance in both accuracy and efficiency for super-resolution with multiple up-scales. This is probably attributed to the fact that a single VDCN can simultaneously fit the correspondence between low and high resolution images with multiple upscales by taking into account more contextual information in the neighborhood and modelling complex functions with many nonlinear layers. Inspired by this, we thus proposed to design a multi-scale super-resolution (MSSR) VDCN between original and downsampled Landsat images. Specifically, a general VDCN model was trained for 2 up-scale factors (×2; ×5), where factor 2 was to super-resolve 250 m Landsat to 125 m Landsat and factor 5 was to super-resolve 125 m Landsat to 25 m Landsat.
Considering that low and high spatial resolution Landsat images are largely similar (low and high herein are in a relative sense), we built the MSSR model between low spatial resolution image and the image details (i.e., the residual images between low and high spatial resolution Landsat images). Suppose that the depth of the MSSR VDCN is D’, the other parameters of the network architecture are the same to those of nonlinear mapping VDCN. The network takes interpolated low spatial resolution Landsat images as input and exports the image details. In the prediction stage, the predicted Landsat image is obtained by summing network input and output.

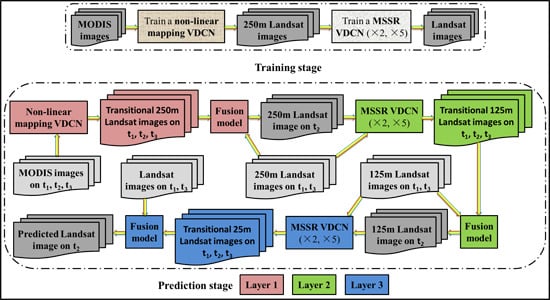
3.3. Training Networks

To train the non-linear mapping VDCN, we prepared N pairs of interpolated MODIS and down-sampled Landsat images, denoted as { X i , Y i } i = 1 N . Then the training samples were denoted as { X i , R i } i = 1 N , where R i = Y i X i is the defined residual image. The goal of non-linear mapping VDCN is to learn the nonlinear mapping F ( X i ) from input MODIS images X i to predict the residual images R i . We solved the network parameters θ = { W k , b k } k = 1 D , where W k and b k denote the weights and bias of the kth convolutional layer, respectively, through minimizing the loss function as
L ( θ ) = 1 N i = 1 N F ( X i ; θ ) R i 2 2
This regression objective was optimized by adopting the mini-batch gradient descent based on back-propagation [28]. To accelerate the network optimization convergence while suppressing exploding gradients, we adopted a varying learning rate strategy during the iterations as in [23]. Specifically, we initially set a large learning rate and then decreased the learning rate gradually.
The training procedure of the MSSR VDCN is similar to the above. One thing noteworthy is that the training samples for scales 2 and 5 were combined into one dataset. During training, images with different scales fell into the same mini-batch.

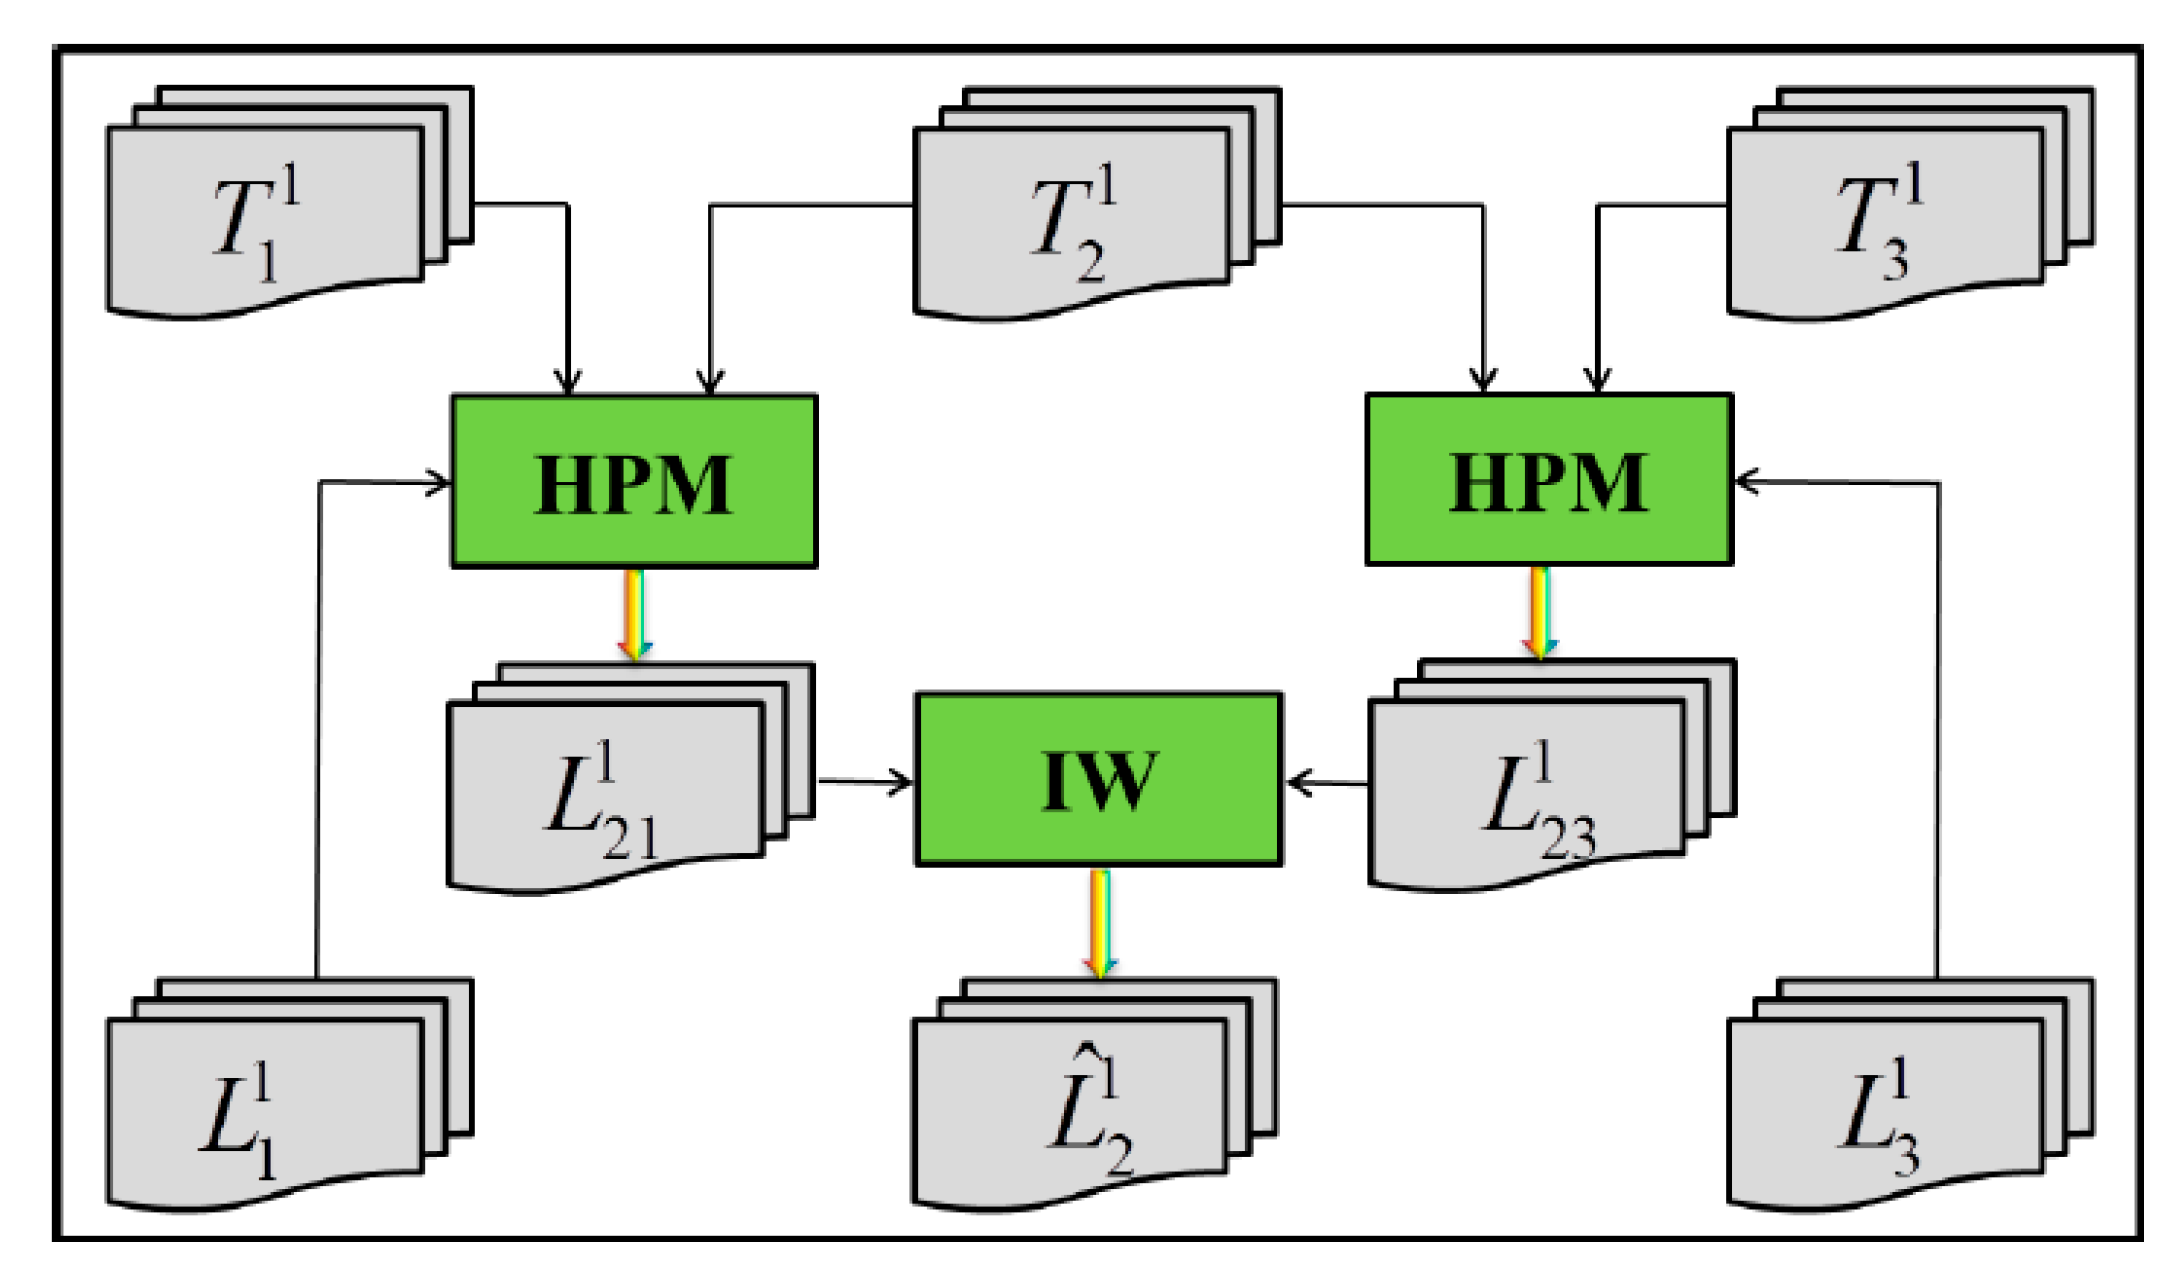
3.4. Three-Layer Prediction Step

Given two-paired prior Landsat–MODIS images on t1 and t3 and one MODIS image on t2 as input, we aimed to predict the Landsat image on t2. Usually, it is assumed that the prediction date t2 is between t1 and t3, so that we can integrate the spatial and temporal information before and after to do the prediction. Considering that the spatial information among time series satellite images is closely correlated (e.g., the phenology changes are dominant, or the proportion of land-cover type changes is small), we designed a fusion model to fully utilize the information in prior Landsat and MODIS images. On the other hand, based on the learned non-linear mapping VDCN and the MSSR VDCN, the non-linear mapping prediction and the two-step super-resolution predictions (×2; ×5) could be executed sequentially. We experimentally found that first executing the ×5 super-resolution step and then the ×2 super-resolution step output almost the same accuracy but cost more in computation. Combining the VDCN-based predictions and the fusion model, the prediction stage was achieved through three layers: the non-linear mapping layer, the ×2 super-resolution layer, and the ×5 super-resolution layer, where each layer consisted of a VDCN-based prediction and a fusion model, as demonstrated in the lower part of Figure 1.
In each prediction layer, three images with lower spatial resolutions were fed into one VDCN, which exported three images with higher spatial resolutions. Due to the existence of estimation errors in the predictions of VDCNs, we defined the outputs of VDCNs as the transitional images. Then, the fusion model integrated three transitional images and two prior Landsat images (those with low spatial resolutions were down-sampled from the original Landsat images) together to predict the Landsat image on t2 under different spatial resolution frames.
We take the first layer as an example to demonstrate the fusion procedure. We denoted the inputs of three transitional images as T i 1 ( i = 1 , 2 , 3 ) and two prior Landsat images as L i 1 ( i = 1 , 3 ) . We constructed the fusion model using a high pass modulation (HPM) module and an indicative weighting (IW) module. The overall flowchart is shown in Figure 3. As in [9], the HPM was a linear temporal change model between images of one prior date and the prediction date. Taking the time point t1 as an example, the HPM predicts the Landsat image on t2 by modulating the prior Landsat image on t1 with the ratio coefficients between transitional images on t2 and t1. The mathematical formula is as follows:
L 21 1 = T 2 1 T 1 1 L 1 1 .
Similarly, the prediction from the time point t3 is as follows:
L 23 1 = T 2 1 T 3 1 L 3 1 .
We leveraged a weighting strategy to integrate the two-end predictions, where the weighting matrix is computed from two transitional images as follows:
W i = 1 | T 2 1 T i 1 | 1 | T 2 1 T 1 1 | + 1 | T 2 1 T 3 1 | , i = 1 , 3 .
Considering that when relatively large temporal changes exist between one prior date and the prediction date, the prediction from that end may reduce the prediction accuracy at the prediction date; we thus proposed an indicative weighting strategy by using an indicative matrix to choose the predictions from two end dates. Therefore, the predicted Landsat image on t2 is computed as follows:
L ^ 2 1 = I 1 W 1 L 21 1 + I 3 W 3 L 23 1 .
When the temporal change is too large at one end, we then only choose the prediction result from the other end, and vice versa. To determine the values of the indicative matrix I, we define a threshold value ρ (e.g., ρ = 0.7 ). Then, the values of I are determined at each pixel location (r, c) as follows:
{ I 1 ( r , c ) = 1 W 1 ( r , c ) , I 3 ( r , c ) = 0 i f     W 1 ( r , c ) ρ I 1 ( r , c ) = 0 , I 3 ( r , c ) = 1 W 3 ( r , c ) i f     W 1 ( r , c ) 1 ρ I 1 ( r , c ) = 1 , I 3 ( r , c ) e l s e .
The fusion procedures for the other two layers are the same as above.

4. Experimental Results

In this section, we compare the proposed method with two shallow learning models, i.e., the sparse representation based spatiotemporal fusion method in [9] (abbreviated as SRSTF) and the convolutional neural network based spatiotemporal fusion method in [10] (abbreviated as CNNSTF). To extensively evaluate the performance of our method, we selected two Landsat–MODIS benchmark datasets in [29]. On one hand, these datasets are composed of 14 and 17 paired remote sensing images, respectively, which is suitable for deep learning that needs a large training set. On the other hand, the landscapes of the datasets have obvious contrasting spatial and temporal dynamical characteristics associated with both land-cover type and phenology changes. For description convenience in this section, the proposed very deep convolutional network based spatiotemporal fusion method is abbreviated as VDCNSTF.

4.1. Sites and Datasets

The first study site was the Coleambally Irrigation Area (CIA), which is a rice based irrigation system located in southern New South Wales, Australia, and covering 2193 km2. Over CIA, there were 17 cloud-free Landsat–MODIS image-pairs available from 2001 to 2002 for the austral summer growing season. The study in [29] demonstrated that the temporal dynamics of CIA dataset are crop phenology over a single growing season within the irrigation area. The relatively small field sizes determine that CIA is more spatially heterogeneous. The Lower Gwydir Catchment (LGC) was the second study site, locating in northern New South Wales and covering 5440 km2. Fourteen cloud-free Landsat–MODIS image-pairs over LGC were available from April 2004 to April 2005. A large flood and the subsequent inundation occurred in mid-December 2004, covering an area of about 44%, which indicated that LGC is a more temporally dynamic site.
For the CIA dataset, the Landsat images were derived from Landsat-7 ETM+ and were atmospherically corrected via MODTRAN4 [30]. For the LGC dataset, the Landsat images were derived from Landsat-5 TM and were corrected atmospherically with the method in [31]. During pre-processing, geocorrection was defined using the Australian Geodetic Datum (AGD66) for Landsat data. For the CIA dataset, the spatial resolution is 25 m and the image size is 2040 × 1720; for the LGC dataset, the spatial resolution is 25 m and the image size is 2720 × 3200. For both study sites, the MODIS images are from Terra MOD09GA Collection 5 and the spatial resolution is 500 m. To match the Landsat data resolution, the MODIS images were up-sampled to 25 m by using the nearest neighbor algorithm. To co-register Landsat and MODIS images with sub-pixel accuracy, an optimal offset was applied to each MODIS image by maximizing the correlation function between the image pairs. For experimental purpose, we selected the bands 1, 2, 3, 4, 5, and 7 of the Landsat images and the bands 1, 2, 3, 4, 6, and 7 of the MODIS images. Due to the different band order arrangements between Landsat and MODIS images, we adjusted the band orders of MODIS images to match those of Landsat images.

4.2. Quantitative Evaluation Indices

Since the ground truth Landsat images were known, we selected four indices that quantitatively evaluated the results from different aspects. The first one was root mean square error (RMSE), which measures the radiometric differences between the fusion result and the ground truth as
R M S E = i = 1 h j = 1 w ( L ( i , j ) L ^ ( i , j ) ) 2 h × w ,
where L and L ^ denote the ground truth and the fusion result, respectively, and h and w denote the image height and width, respectively. The smaller the RMSE is, the better the prediction is. We leveraged the spectral angle mapper (SAM) [32] as the second index to measure the spectral distortion of the result defined as
S A M = 1 N i = 1 N arccos j = 1 M L i j L ^ i j j = 1 M ( L i j ) 2 j = 1 M ( L ^ i j ) 2 ,
where N denotes the number of pixels in images and M is the number of bands. The smaller the SAM is, the better the result is. We took the structural similarity (SSIM) [33] as the third metric, measuring the similarity of the overall spatial structures between the fusion result and the ground truth as
S S I M = ( 2 μ L μ L ^ + C 1 ) ( 2 σ L L ^ + C 2 ) ( μ L 2 + μ L ^ 2 + C 1 ) ( σ L 2 + σ L ^ 2 + C 2 ) ,
where μ L and μ L ^ denote the means of the ground truth and fusion result, respectively; σ L L ^ represents the covariance between the ground truth and fusion result; σ L and σ L ^ are the variances of the ground truth and fusion result, respectively; and C 1 and C 2 are two small constants to avoid instability when μ L 2 + μ L ^ 2 or σ L 2 + σ L ^ 2 approach to zero. SSIM is valid when falling in [−1; 1], and a larger SSIM means a better fusion result. Finally, the erreur relative global adimensionnelle de synthese (ERGAS) [34] was chosen as the last index to evaluate the overall fusion result as
E R G A S = 100 h l 1 M i = 1 M [ R M S E ( L i ) 2 / ( μ i ) 2 ] ,
where the spatial resolutions of Landsat and MODIS images are denoted by h and l, respectively; the ith band image is denoted by Li; and μ i denotes the average value of the ith band image. A better fusion result is achieved when ERGAS is less than or equal to zero.

4.3. Experimental Setting

For description convenience, we arranged both CIA and LGC datasets in chronological order and number them from 1 to 17 and 1 to 14, respectively. During the training stage, we chose all bands of the 1st, the 6th, and the 14th image-pairs to generate the training samples for both datasets. In the prediction stage, the other image-pairs excluding those for training were utilized for testing. Specifically, we selected all three neighboring image-pairs (e.g., the 5th, the 7th, and the 8th image-pairs) from both time series; by assuming that the Landsat images on each middle date were unknown, we predicted the Landsat-like images from the corresponding MODIS images and two neighboring image-pairs (one before and one after). By referring to [23], the parameter settings of the proposed method are shown in Table 1, where the sizes of training sub-images were set to be the sizes of receptive fields and the learning rate decreased by a factor of 10 every 20 epochs. The codes were implemented by using matconvnet on a machine with Geforce GTX TITAN X GPU, 3.4 GHz CPU and 16 G RAM. Although the training stage took a long time (e.g., roughly 8 h for LGC dataset), the prediction of each Landsat image took about 10 min. For the comparison method SRSTF, the optimal parameters were set according to the reference in [9].

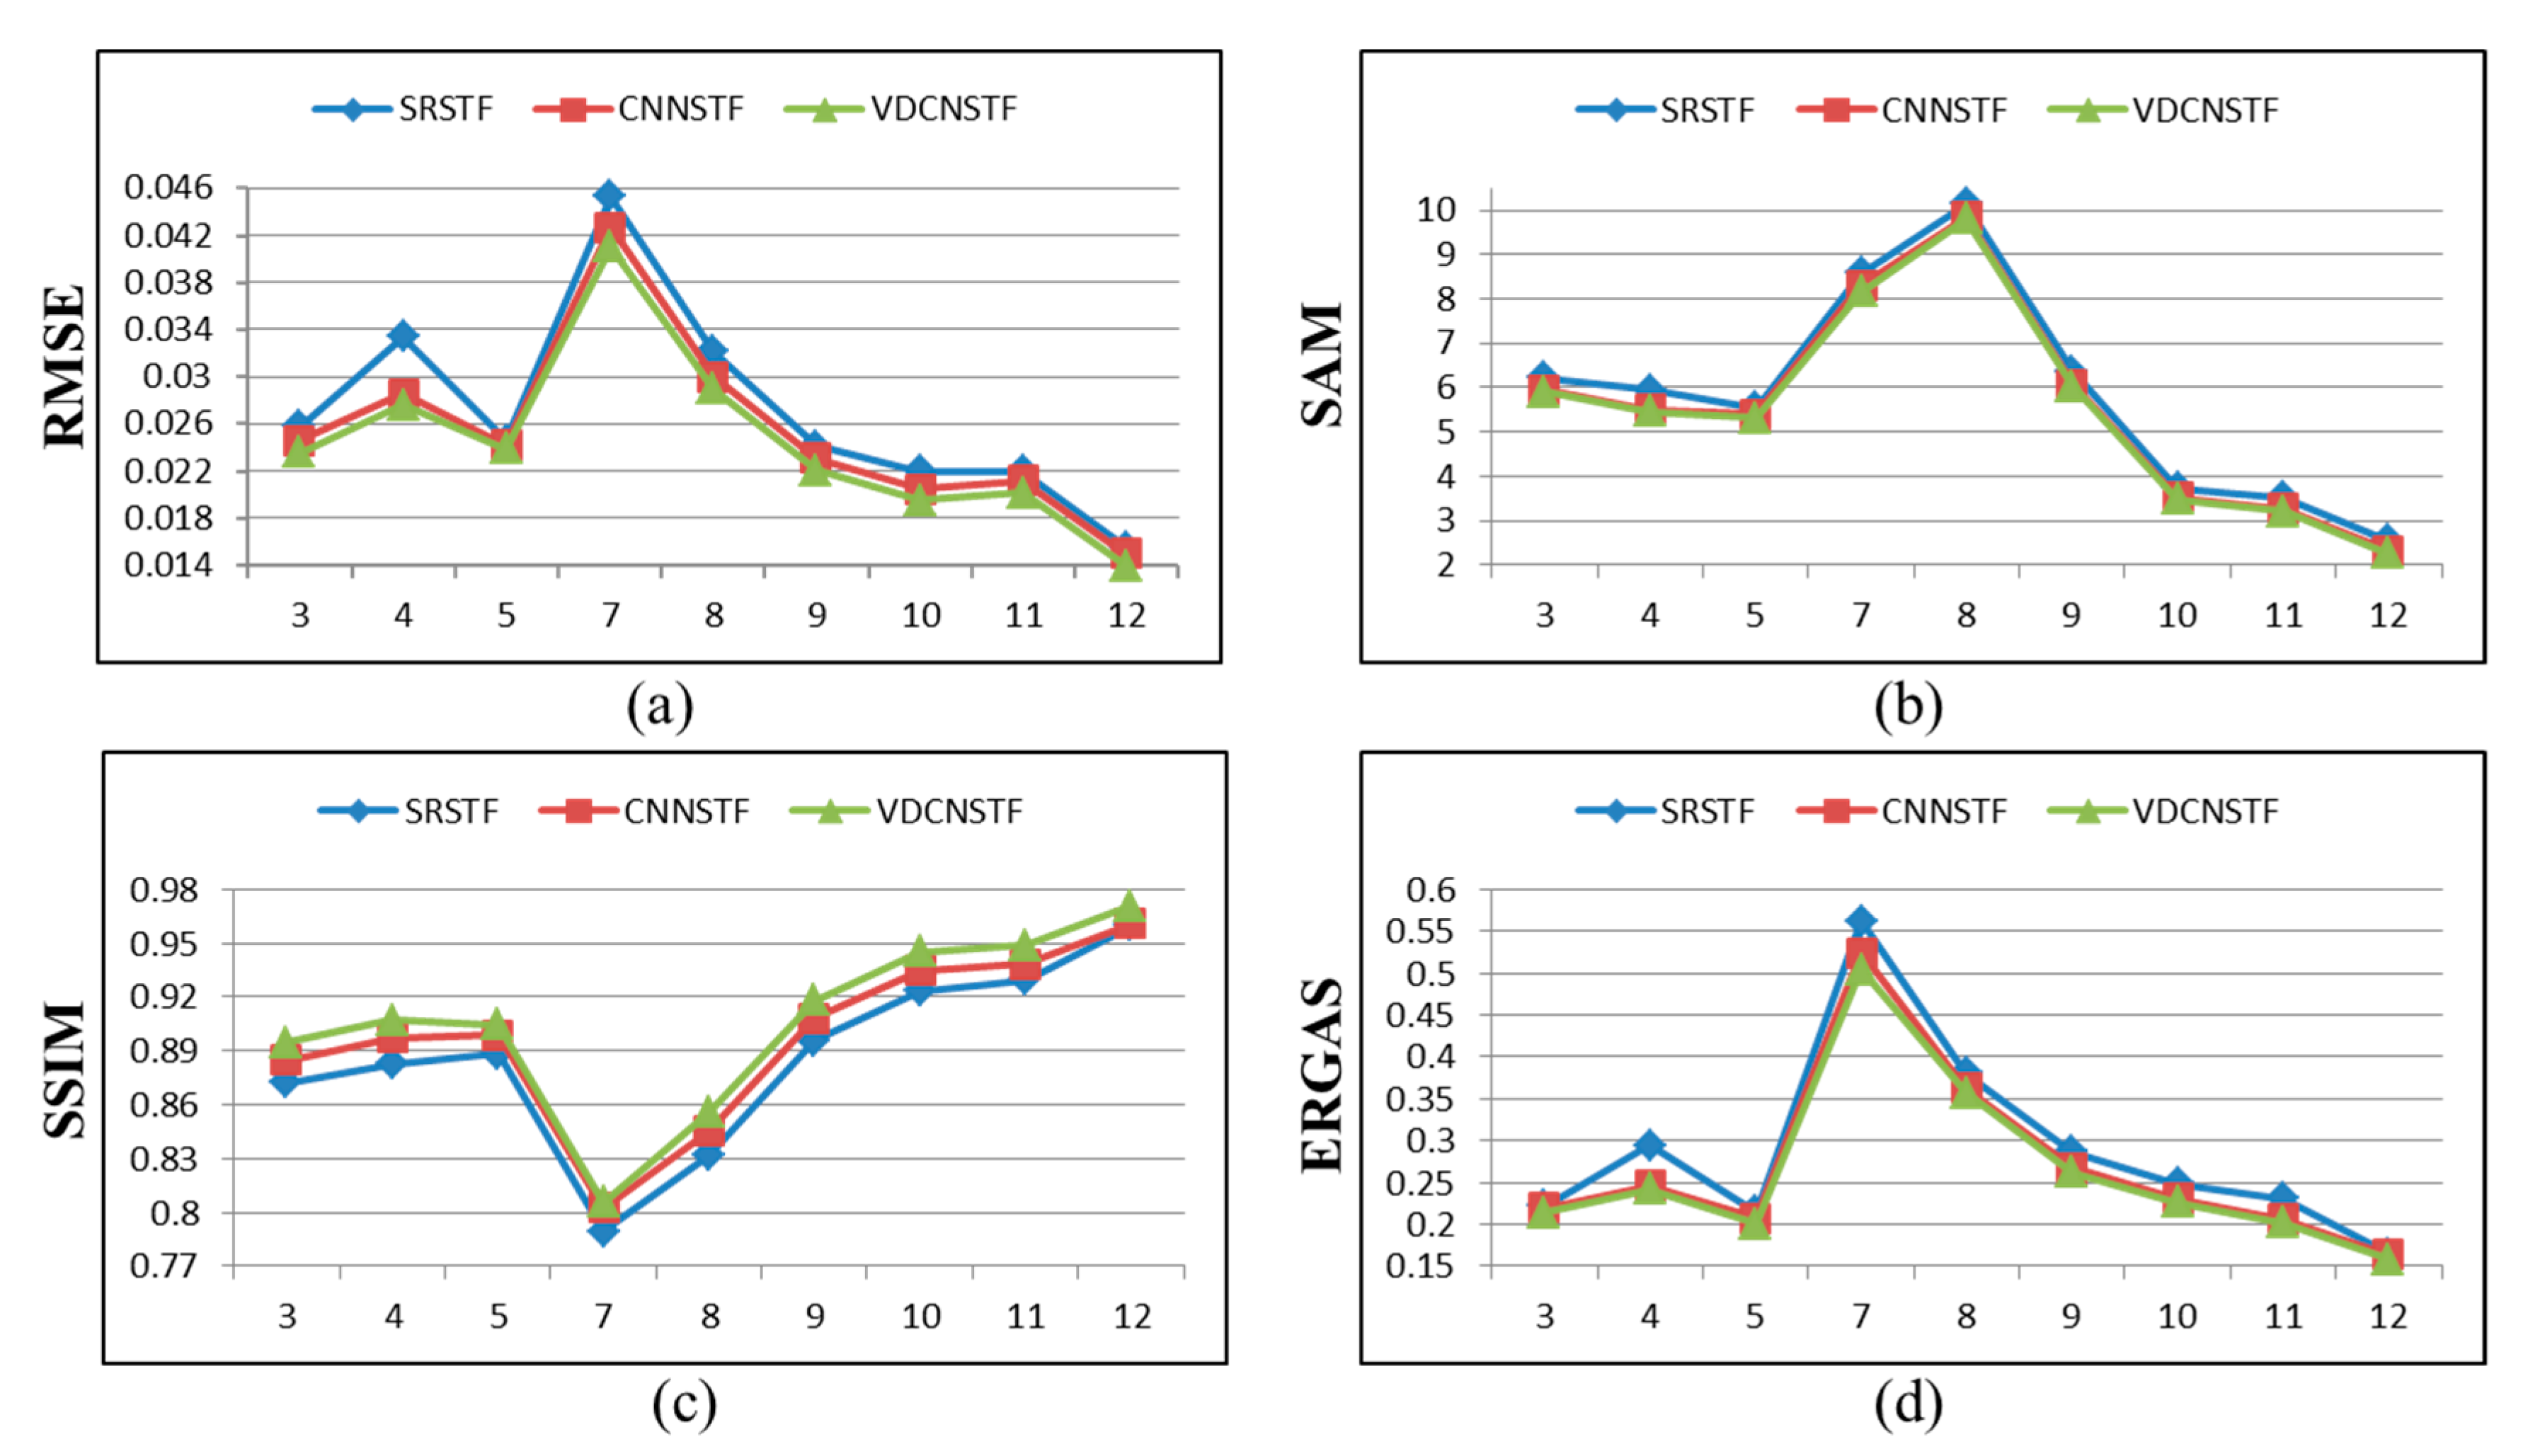
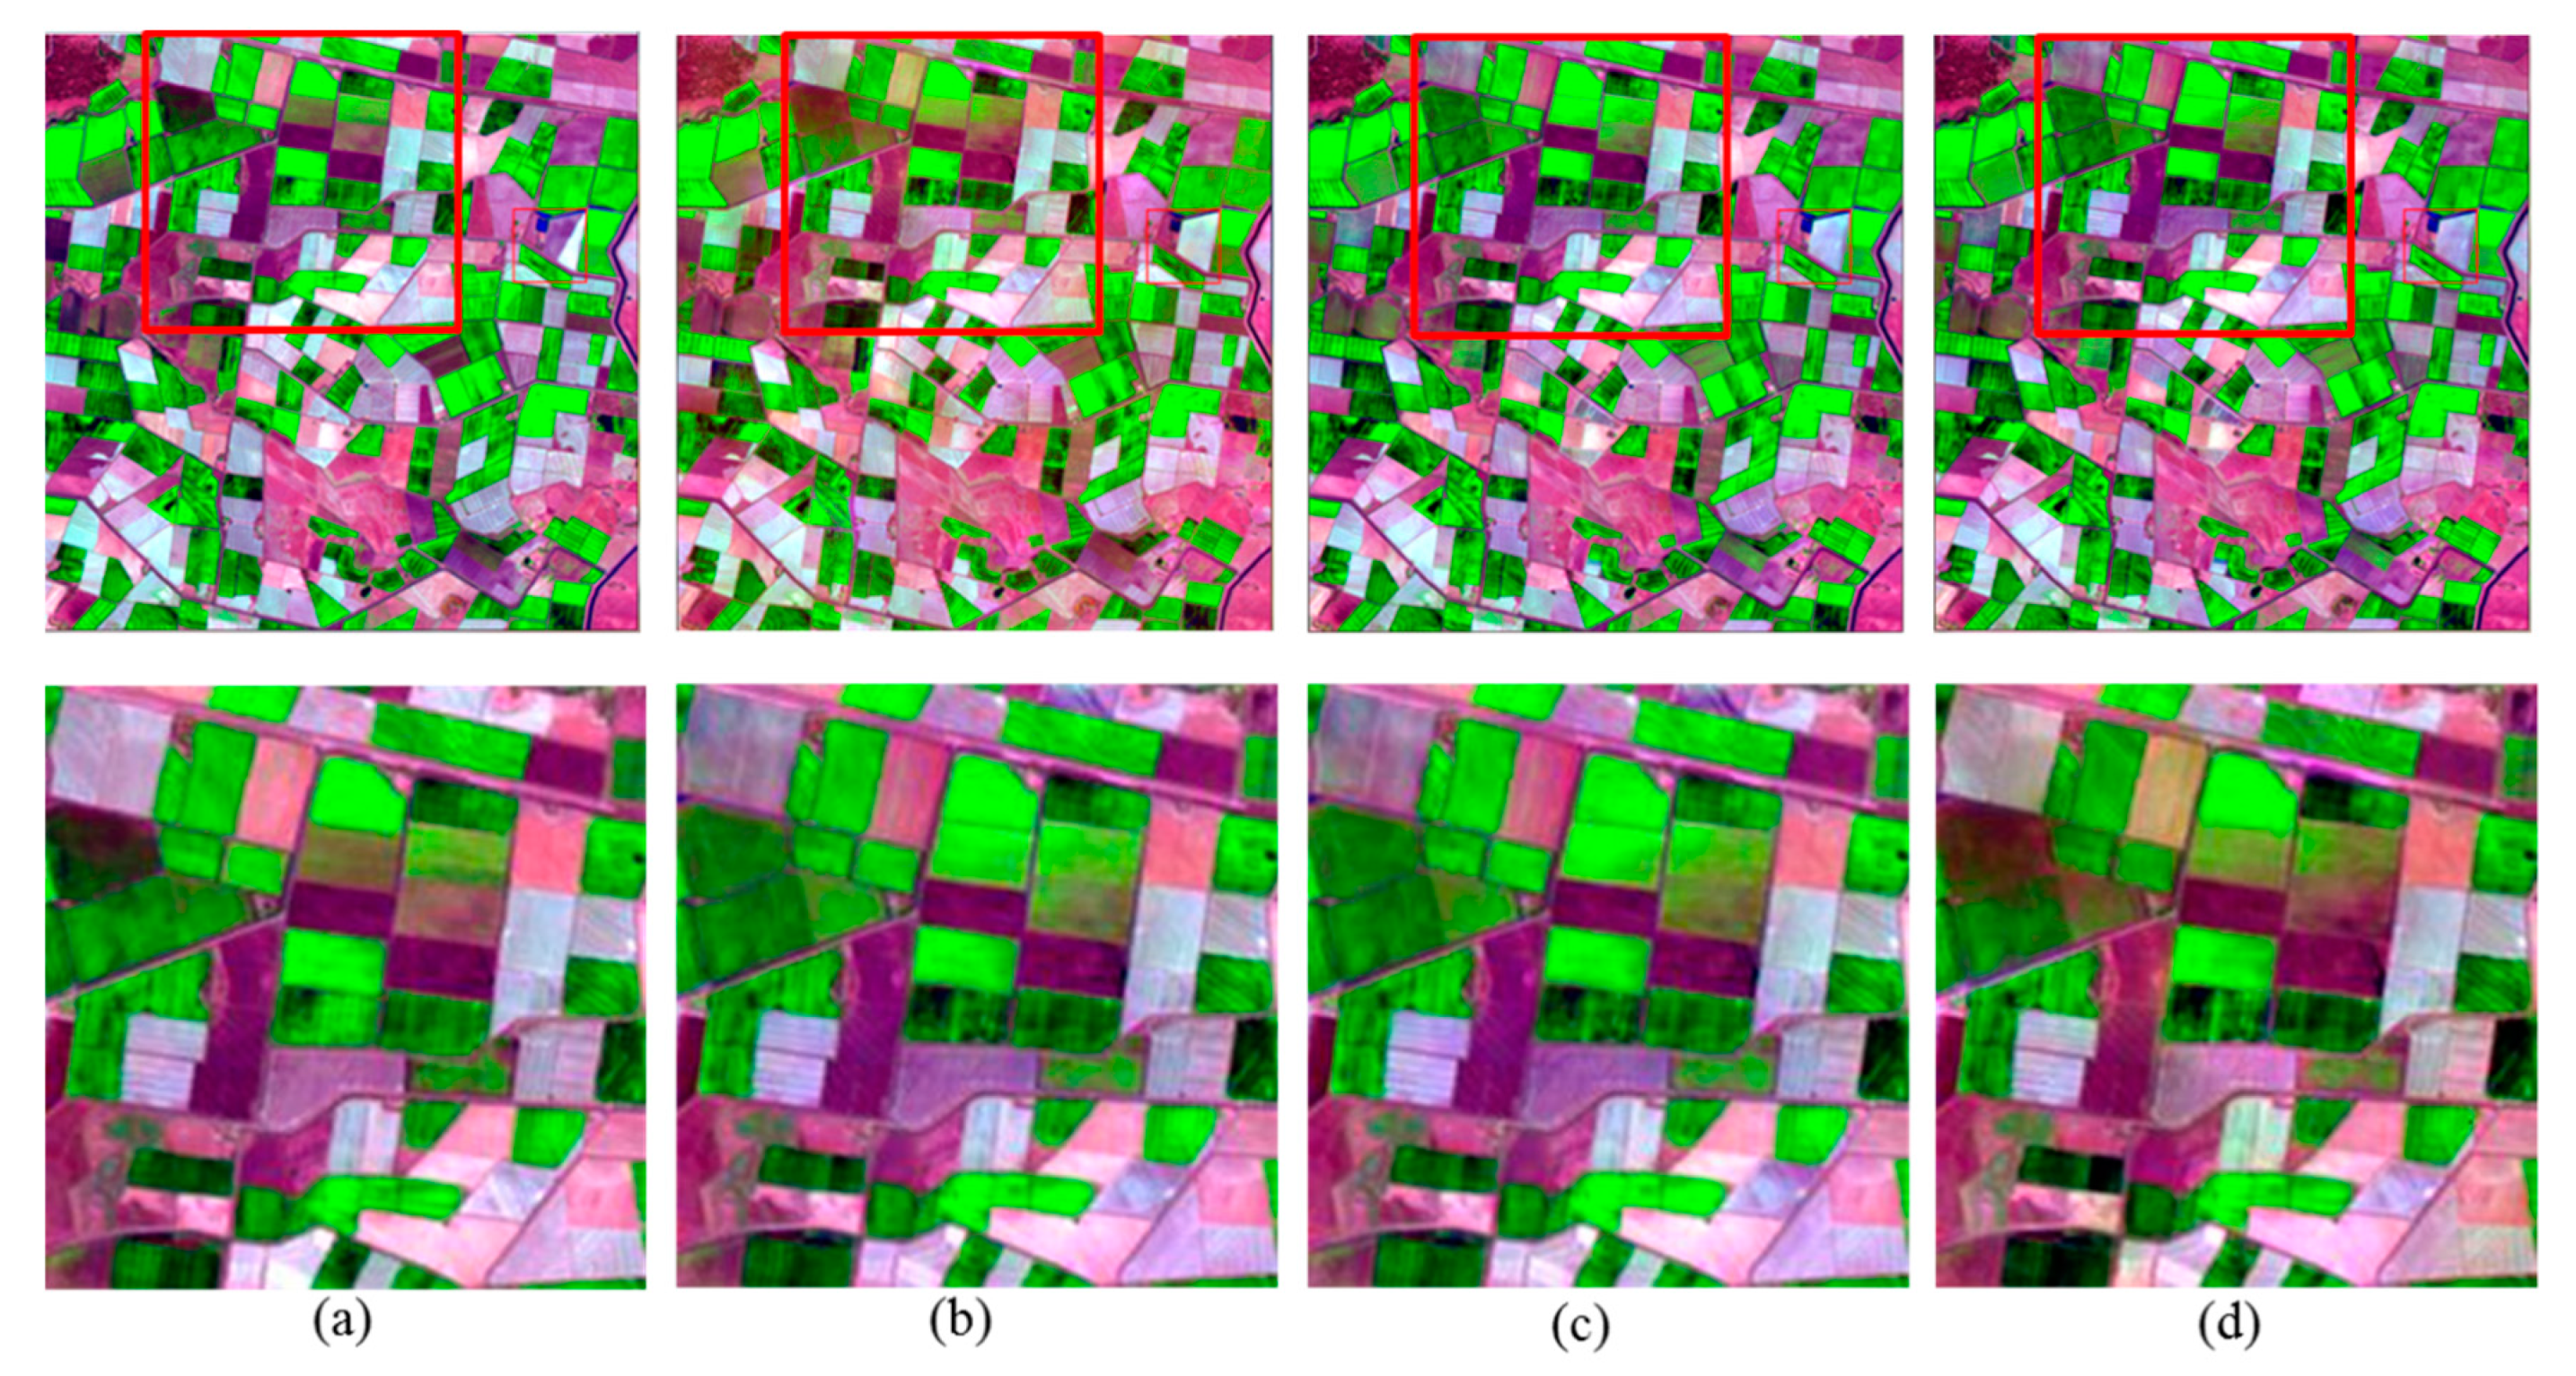
4.4. Experimental Results

For the CIA dataset, we predicted the Landsat-like images on the 3rd, the 4th, the 5th, the 7th, the 8th, the 9th, the 10th, the 11th, the 12th, the 13th, the 15th, and the 16th prediction dates; for the LGC dataset, we predicted the Landsat-like images on the 3rd, the 4th, the 5th, the 7th, the 8th, the 9th, the 10th, the 11th, and the 12th prediction dates. The quantitative evaluation results on the CIA and LGC datasets in terms of RMSE, SAM, SSIM, and ERGAS are demonstrated in Figure 4 and Figure 5, respectively, where the RMSE and SSIM are the average values of all bands. As seen in these two figures, we observed that the fusion results of VDCNSTF had lower RMSE than those of SRSTF and CNNSTF for all prediction dates on both datasets, which demonstrated that VDCNSTF could achieve more accurate radiometric values. The lower SAM values and the higher SSIM values of VDCNSTF results for all prediction dates on both datasets indicated that the proposed method performed better than SRSTF and CNNSTF in predicting both spatial and spectral information. The lower ERGAS values of VDCNSTF results also supported this point.
To show more details of the fusion results, we showed the results on one key date of both study sites, respectively. For the CIA dataset, the 8th prediction date was selected because of the color turning in the sporadic irrigation fields from the 8th date to the 9th date (see Figure 6). For the LGC dataset, we also chose the 8th prediction date due to the occurrence of a large flood on this day causing relatively large temporal dynamics and abnormal changes of land surface (see Figure 7). Figure 6 and Figure 7 show the three neighboring image-pairs on the 7th, the 8th, and the 9th dates for CIA and LGC datasets, respectively, where the Landsat images show bands 5, 4, and 3 as R–G–B and the MODIS images show bands 6, 2, and 1 as R–G–B. We predicted the Landsat images on the 8th date from other input images for both CIA and LGC datasets.
For clear comparisons, we selected one zoomed in area (shown in the red rectangles of Figure 6e) for the CIA dataset and one zoomed in area (shown in the red rectangles of Figure 7e) for the LGC dataset. Specifically, the zoomed in CIA area was selected due to the heterogeneity of fields and obvious phenology changes; the zoomed in LGC area was selected due to the dramatically varying land-cover types (from field area to flooded area between the 8th date and the 9th date). Figure 8 and Figure 9 demonstrate the fusion results from SRSTF, CNNSTF, and VDCNSTF for CIA and LGC sites, respectively. The ground truth, the fusion results from SRSTF, the fusion results from CNNSTF, and the fusion results from VDCNSTF are displayed in the first rows. For comparisons with clearer details, we selected one representative region of interest (ROI) for both CIA and LGC datasets, as shown in the red rectangles of the first rows of Figure 8 and Figure 9. The enlarged ROIs of the ground truth, the fusion results of SRSTF, the fusion results of CNNSTF, and the fusion results of VDCNSTF for CIA and LGC datasets are displayed in the second rows of Figure 8 and Figure 9, respectively.
Table 2 and Table 3 list the quantitative results in terms of RMSE, SAM, SSIM, and ERGAS of the fusion results shown by Figure 8 and Figure 9. We can observe that the fusion result of VDCNSTF was better than the fusion result of SRSTF and CNNSTF on all bands, which indicated that VDCNSTF achieved better spatial and spectral prediction results than comparison methods.

5. Discussion

Comparing the quantitative evaluation results for CIA and LGC datasets in Figure 4 and Figure 5, the general prediction errors on LGC dataset were higher than those on the CIA dataset, which indicated that land-cover type changes were more difficult to predict than phenology changes. This was due to the spatial resolution gap being too large between MODIS and Landsat images and the lost land cover change information in MODIS images were more difficult to recover than the lost phenology change information in MODIS images. To compare the improvements of our method over SRSTF on two datasets, we computed the average improvements of all prediction dates for CIA and LGC datasets and the results were as follows: decreased 0.0011 vs. 0.0010 for RMSE, decreased 0.04 vs. 0.05 for SAM, increased 0.0049 vs. 0.0085 for SSIM, and decreased 0.004 vs. 0.005 for ERGAS. This demonstrated that our method could better leverage the difficult land-cover type changes than CNNSTF, which may be attributed to the fact that our deep learning model could better correlate MODIS and Landsat images than the shallow learning model, and the VDCN based MSSR model had higher prediction accuracy than the one-step super-resolution model in CNNSTF.
Comparing the fusion results on the CIA dataset and the ground truth in Figure 8, we can see that all were able to predict the phenology changes within the prediction and the prior dates. However, as shown by the enlarged ROIs in the second row of Figure 8, which have some special heterogeneous regions, VDCNSTF performed better than SRSTF and CNNSTF in terms of the predicted spectral information. Comparing the fusion results on the LGC dataset and the ground truth in Figure 9, we conclude that all were unable to predict well the dramatically flooded areas because the change information in the low SR MODIS images was lost; but despite the dramatic changes of land-cover types shown in Figure 7, they could predict most areas well in aspects of both spatial structures and spectral information. The enlarged ROIs in the bottom row of Figure 9 demonstrated that the fusion results of all methods had some degree of spectral distortion and lost some spatial details, but VDCNSTF performed better than SRSTF and CNNSTF in predicting areas with land-cover type changes.

6. Conclusions

In this paper, we proposed a spatiotemporal fusion method based on VDCNNs by blending the spatial information of Landsat data and the temporal information of MODIS data. To handle the highly non-linear correspondence relations between MODIS and Landsat data, we trained a non-linear mapping VDCN between MODIS and Landsat data with low-spatial resolutions. To bridge the large spatial resolution gap between the original Landsat and the downsampled Landsat data (10 times), we trained a multi-scale super-resolution VDCN between low spatial resolution Landsat and original Landsat images. In the prediction step, the Landsat data on the prediction date was predicted from the corresponding MODIS data and two prior MODIS–Landsat data pairs. Based on the learned VDCN models and a fusion model, the prediction stage consisted of three layers, where each layer contained a VDCN-based prediction step and a fusion model. To thoroughly explore the prior information, we leveraged the predicted images generated by the VDCN model as transitional images and then used an HPM module and an indicative weighting strategy to integrate the information in prior image-pairs. Experimental evaluations on two benchmark datasets validated the superiority of the proposed method over other learning based methods.
Although the proposed method achieved favorable performance compared to other learning based methods, there is still a lot of room for improvement in both prediction accuracy of spectral information and in the finer details of recovering spatial information. Prediction accuracy of spectral information is very important for application to heterogeneous regions, and spatial detail recovery is very important for application to land-cover type changes. To increase the prediction accuracy of spectral information, our future work will focus on implementing precise geo-registration between two types of satellite sensors in the pre-processing step and building a more accurate fusion model between the outputs of VDCN and the prior images. To recover the lost spatial details in MODIS images, our future work will continue with learning the temporal dynamics of Landsat images.

Author Contributions

Y.Z. and H.S. contributed equally to this work. They proposed the algorithm and performed the experiments. L.S. and Z.W. supervised the study, analyzed the results, and gave insightful suggestions for the manuscript. Y.Z. and H.S. drafted the manuscript. B.J. contributed to the revision of the manuscript. All authors read and approved the submitted manuscript.

Funding

This research was funded in part by the Natural Science Foundation of China under Grant Numbers: 61972206, U1831127, 61872189, in part by the Foundation of Jiangsu Province of China under Grant Number BK20191397, and in part by the Six Talent Peaks Project in Jiangsu Province under Grant Numbers: RJFW-015, XYDXX-015, and XYDXX-045.

Acknowledgments

The authors wish to express their gratitude to Emelyanova, I.V., McVicar, T.R., Van Niel, T.G., et al., for releasing their CIA and LGC datasets. We are grateful to the anonymous reviewers whose constructive suggestions have improved the quality of our paper.

Conflicts of Interest

The authors declare no conflict of interest.

References

  1. Zhou, J.; Khot, L.R.; Boydston, R.A.; Miklas, P.N.; Porter, L. Low altitude remote sensing technologies for crop stress monitoring: a case study on spatial and temporal monitoring of irrigated pinto bean. Precision Agric. 2018, 19, 555–569. [Google Scholar] [CrossRef]
  2. Dang, L.M.; Hassan, S.I.; Suhyeon, I.; Sangaiah, A.K.; Mehmood, I.; Rho, S.; Seo, S.; Moon, H.; Syed, I.H. UAV based wilt detection system via convolutional neural networks. Sustain. Comput. Inform. Syst. 2018. [Google Scholar] [CrossRef]
  3. Schwaller, M.; Hall, F.; Gao, F.; Masek, J. On the blending of the Landsat and MODIS surface reflectance: predicting daily Landsat surface reflectance. IEEE Trans. Geosci. Remote. Sens. 2006, 44, 2207–2218. [Google Scholar]
  4. Hilker, T.; Wulder, M.A.; Coops, N.C.; Linke, J.; McDermid, G.; Masek, J.G.; Gao, F.; White, J.C. A new data fusion model for high spatial- and temporal-resolution mapping of forest disturbance based on Landsat and MODIS. Remote. Sens. Environ. 2009, 113, 1613–1627. [Google Scholar] [CrossRef]
  5. Zhu, X.; Chen, J.; Gao, F.; Chen, X.; Masek, J.G. An enhanced spatial and temporal adaptive reflectance fusion model for complex heterogeneous regions. Remote. Sens. Environ. 2010, 114, 2610–2623. [Google Scholar] [CrossRef]
  6. Wang, Q.; Zhang, Y.; Onojeghuo, A.O.; Zhu, X.; Atkinson, P.M. Enhancing Spatio-Temporal Fusion of MODIS and Landsat Data by Incorporating 250 m MODIS Data. IEEE J. Sel. Top. Appl. Earth Obs. Remote. Sens. 2017, 10, 4116–4123. [Google Scholar] [CrossRef]
  7. Acerbi-Junior, F.; Clevers, J.; Schaepman, M. The assessment of multi-sensor image fusion using wavelet transforms for mapping the Brazilian Savanna. Int. J. Appl. Earth Obs. Geoinf. 2006, 8, 278–288. [Google Scholar] [CrossRef]
  8. Song, H.; Huang, B. Spatiotemporal Reflectance Fusion via Sparse Representation. IEEE Trans. Geosci. Remote. Sens. 2012, 50, 3707–3716. [Google Scholar]
  9. Song, H.; Huang, B. Spatiotemporal satellite image fusion through one-pair image learning. IEEE Trans. Geosci. Remote. Sens. 2013, 51, 1883–1896. [Google Scholar] [CrossRef]
  10. Song, H.; Liu, Q.; Wang, G.; Hang, R.; Huang, B. Spatiotemporal Satellite Image Fusion Using Deep Convolutional Neural Networks. IEEE J. Sel. Top. Appl. Earth Obs. Remote. Sens. 2018, 11, 821–829. [Google Scholar] [CrossRef]
  11. Zhu, X.; Cai, F.; Tian, J.; Williams, T.K.-A. Spatiotemporal Fusion of Multisource Remote Sensing Data: Literature Survey, Taxonomy, Principles, Applications, and Future Directions. Remote. Sens. 2018, 10, 527. [Google Scholar]
  12. LeCun, Y.; Boser, B.; Denker, J.S.; Henderson, D.; Howard, R.E.; Hubbard, W.; Jackel, L.D. Backpropagation Applied to Handwritten Zip Code Recognition. Neural Comput. 1989, 1, 541–551. [Google Scholar] [CrossRef]
  13. Zeiler, M.D.; Fergus, R. Visualizing and Understanding Convolutional Networks. In Proceedings of the Model and Data Engineering; Springer Science and Business Media LLC: Berlin/Heidelberg, Germany, 2014; Volume 8689, pp. 818–833. [Google Scholar]
  14. Nair, V.; Hinton, G.E. Rectified linear units improve restricted boltzmann machines. In Proceedings of the 27th International Conference on International Conference on Machine Learning, Haifa, Israel, 21–24 June 2010; pp. 807–814. [Google Scholar]
  15. Ioffe, S.; Szegedy, C. Batch normalization: Accelerating deep network training by reducing internal covariate shift. In Proceedings of the 32nd International Conference on International Conference on Machine Learning, Lille, France, 6–11 July 2015; pp. 448–456. [Google Scholar]
  16. He, K.; Zhang, X.; Ren, S.; Sun, J. Deep Residual Learning for Image Recognition. In Proceedings of the 2016 IEEE Conference on Computer Vision and Pattern Recognition (CVPR), Las Vegas, NV, USA, 26 June–1 July 2016; pp. 770–778. [Google Scholar]
  17. Jain, V.; Seung, H.S. Natural image denoising with convolutional networks. In Proceedings of the Advances in Neural Information Processing Systems, Vancouver, BC, Canada, 8–10 December 2008; pp. 769–776. [Google Scholar]
  18. Dong, C.; Loy, C.C.; He, K.; Tang, X. Image super-resolution using deep convolutional networks. IEEE Trans. Pattern Anal. Mach. Intell. 2016, 38, 295–307. [Google Scholar] [CrossRef] [PubMed]
  19. Girshick, R.; Donahue, J.; Darrell, T.; Malik, J. Rich feature hierarchies for accurate object detection and semantic segmentation. In Computer Vision and Pattern Recognition; CVPR: Piscataway, NJ, USA, 2013; pp. 580–587. [Google Scholar]
  20. Krizhevsky, A.; Sutskever, I.; Hinton, G.E. Imagenet classification with deep convolutional neural networks. In Proceedings of the International Conference on Neural Information Processing Systems, Lake Tahoe, NV, USA, 3–6 December 2012; pp. 1097–1105. [Google Scholar]
  21. Simonyan, K.; Zisserman, A. Very Deep Convolutional Networks for Large-Scale Image Recognition. arXiv 2014, arXiv:1409.1556. Available online: https://arxiv.org/pdf/1409.1556.pdf (accessed on 11 October 2019).
  22. Yang, J.; Wright, J.; Huang, T.S.; Ma, Y. Image Super-Resolution Via Sparse Representation. IEEE Trans. Image Process. 2010, 19, 2861–2873. [Google Scholar] [CrossRef] [PubMed]
  23. Kim, J.; Lee, J.K.; Lee, K.M. Accurate image super-resolution using very deep convolutional networks. In Proceedings of the IEEE Conference on Computer Vision and Pattern Recognition, Las Vegas, NV, USA, 26 June–1 July 2016; pp. 1646–1654. Available online: https://arxiv.org/pdf/1511.04587.pdf (accessed on 11 October 2019).
  24. Tuna, C.; Ünal, G.; Sertel, E. Single-frame super resolution of remote-sensing images by convolutional neural networks. Int. J. Remote. Sens. 2018, 39, 2463–2479. [Google Scholar] [CrossRef]
  25. Pouliot, D.; Latifovic, R.; Pasher, J.; Duffe, J. Landsat Super-Resolution Enhancement Using Convolution Neural Networks and Sentinel-2 for Training. Remote. Sens. 2018, 10, 394. [Google Scholar] [CrossRef]
  26. Timofte, R.; Smet, V.D.; Gool, L.V. A+: Adjusted anchored neighborhood regression for fast super-resolution. In Proceedings of the Asian Conference on Computer Vision, Singapore, 1–5 November 2014; pp. 111–126. [Google Scholar]
  27. Jia, X.; Xu, X.; Cai, B.; Guo, K. Single image super-resolution using multi-scale convolutional neural network. In Proceedings of the IEEE Conference on Computer Vision and Pattern Recognition, Honolulu, HI, USA, 21–26 July 2017; Available online: https://arxiv.org/pdf/1705.05084.pdf (accessed on 11 October 2019).
  28. LeCun, Y.; Bottou, L.; Bengio, Y.; Haffner, P. Gradient-based learning applied to document recognition. Proc. IEEE 1998, 86, 2278–2324. [Google Scholar] [CrossRef]
  29. Emelyanova, I.V.; Mcvicar, T.R.; Niel, T.G.V.; Li, L.T.; van Dijk, A.I.J.M. Assessing the accuracy of blending landsatcmodis surface reflectances in two landscapes with contrasting spatial and temporal dynamics: A framework for algorithm selection. Remote Sens. Environ. 2013, 133, 193–209. [Google Scholar] [CrossRef]
  30. Berk, A.; Anderson, G.P.; Bernstein, L.S.; Acharya, P.K.; Dothe, H.; Matthew, M.W.; Adler-Golden, S.M.; Chetwynd, J.J.H.; Richtsmeier, S.C.; Pukall, B.; et al. MODTRAN4 radiative transfer modeling for atmospheric correction. SPIE’s Int. Symp. Opt. Sci. Engin. Instrum. 1999, 3756, 348. [Google Scholar]
  31. Jupp, D.L.B.; Reddy, S.; Lymburner, L.; Mueller, N.; Islam, A.; Li, F.; Tan, P. An Evaluation of the Use of Atmospheric and BRDF Correction to Standardize Landsat Data. IEEE J. Sel. Top. Appl. Earth Obs. Remote. Sens. 2010, 3, 257–270. [Google Scholar]
  32. Yuhas, R.; Goetz, A.F.H.; Boardman, J.W. Descrimination among Semi-Arid Landscape Endmembers Using the Spectral Angle Mapper (SAM) Algorithm. JPL. 1992. Available online: https://aviris.jpl.nasa.gov/proceedings/workshops/92_docs/52.PDF (accessed on 11 October 2019).
  33. Wang, Z.; Bovik, A.; Sheikh, H.; Simoncelli, E. Image Quality Assessment: From Error Visibility to Structural Similarity. IEEE Trans. Image Process. 2004, 13, 600–612. [Google Scholar] [CrossRef] [PubMed]
  34. Khan, M.; Alparone, L.; Chanussot, J. Pansharpening Quality Assessment Using the Modulation Transfer Functions of Instruments. IEEE Trans. Geosci. Remote. Sens. 2009, 47, 3880–3891. [Google Scholar] [CrossRef]
Figure 1. Flowchart of our method.
Remotesensing 11 02701 g001
Figure 2. The architecture of the non-linear mapping VDCN, where LSR means low spatial resolution (i.e., the downsampled Landsat image).
Remotesensing 11 02701 g002
Figure 3. Flowchart of our fusion model. HPM is high pass modulation module; IW is an indicative weighting module.
Remotesensing 11 02701 g003
Figure 4. Quantitative results of 12 prediction dates at the CIA site: (a) RMSE; (b) SAM; (c) SSIM; (d) ERGAS.
Remotesensing 11 02701 g004
Figure 5. Quantitative results of 9 prediction dates at the LGC site: (a) RMSE; (b) SAM; (c) SSIM; (d) ERGAS.
Remotesensing 11 02701 g005
Figure 6. Illustrating image-pairs of CIA. (ac) are MODIS data on the 7th, 8th, and 9th dates, respectively; (df) are the Landsat data on the same dates as MODIS.
Remotesensing 11 02701 g006
Figure 7. Illustrating image-pairs of LGC. (ac) are MODIS data on the 7th, 8th, and 9th dates, respectively, and (df) are the Landsat data on the same dates as MODIS.
Remotesensing 11 02701 g007
Figure 8. Fusion results on the 8th date of the CIA site. Top row shows the zoomed ground truth in the red rectangle of Figure 6e and the corresponding fusion results. Bottom row shows the zoomed ROIs in the red rectangle of images in the top row. (a) the ground truth Landsat image; (b) the fusion result of SRSTF; (c) the fusion result of CNNSTF; (d) the fusion result of VDCNSTF.
Remotesensing 11 02701 g008
Figure 9. Fusion results on the 8th date of the LGC site. Top row shows the zoomed ground truth in the red rectangle of Figure 7e and the corresponding fusion results. Bottom row shows the zoomed ROIs in the black rectangle of images in the top row. (a) The ground truth Landsat image; (b) the fusion result of SRSTF; (c) the fusion result of CNNSTF; (d) the fusion result of VDCNSTF.
Remotesensing 11 02701 g009
Table 1. Parameter settings of VDCNSTF for CIA1 and LGC2 datasets.
CIALGC
Network depth for NLM-VDCN 315
Network depth for MSSR-VDCN420
Size of training sub-images for NLM-VDCN31
Size of training sub-images for MSSR-VDCN41
Size of training batches64
Interpolation method 5Bicubic
Loss functionMean squared error
Number of training samples for NLM-VDCN25,34449,920
Number of training samples for MSSR-VDCN137,472315,648
Initial learning rate0.01
Momentum0.9
weight decay0.0001
Epochs80
1 Abbreviation for Coleambally Irrigation Area. 2 Abbreviation for Lower Gwydir Catchment. 3 NLM-VDCN refers to non-linear mapping VDCN. 4 MSSR-VDCN refers to multi-scale super-resolution VDCN. 5 The interpolation method is applied to up-sampling of MODIS images and the down-sampling of Landsat images.
Table 2. Quantitative evaluations of the fusion results in Figure 8. Bold fonts indicate better results.
IndexBandsSRSTFCNNSTFVDCNSTF
RMSEB10.00930.00730.0059
B20.01150.01120.0105
B30.01840.01430.0133
B40.02510.02220.0219
B50.02670.02310.0220
B60.02390.02130.0193
SAM 2.68792.33932.2993
SSIMB10.96790.97750.9835
B20.96470.97000.9748
B30.94230.95560.9610
B40.92050.93090.9337
B50.90590.91750.9228
B60.89860.90960.9150
ERGAS0.23250.20260.1986
Table 3. Quantitative evaluations of the fusion results in Figure 9. Bold fonts indicate better results.
IndexBandsSRSTFCNNSTFVDCNSTF
RMSEB10.01520.01410.0133
B20.02030.01950.0185
B30.02560.02460.0236
B40.03440.03170.0305
B50.05420.05140.0502
B60.04260.03890.0381
SAM10.15319.85869.8086
SSIMB10.93720.94820.9583
B20.91780.92840.9383
B30.89480.90420.9143
B40.85170.85890.8690
B50.67410.69160.7016
B60.71350.74010.7501
ERGAS0.38010.36220.3572

