Article

Self-Adjusting Thresholding for Burnt Area Detection Based on Optical Images

by
Edyta Woźniak
* and
Sebastian Aleksandrowicz
Space Research Centre, Polish Academy of Sciences, Bartycka 18A, 00-716 Warsaw, Poland
*
Author to whom correspondence should be addressed.
Remote Sens. 2019, 11(22), 2669; https://doi.org/10.3390/rs11222669
Submission received: 10 October 2019 / Revised: 6 November 2019 / Accepted: 13 November 2019 / Published: 15 November 2019

Abstract

:
Mapping of regional fires would make it possible to analyse their environmental, social and economic impact, as well as to develop better fire management systems. However, automatic mapping of burnt areas has proved to be a challenging task, due to the wide diversity of vegetation cover worldwide and the heterogeneous nature of fires themselves. Here, we present an algorithm for the automatic mapping of burnt areas using medium-resolution optical images. Although developed for Landsat images, it can be also applied to Sentinel-2 images without modification. The algorithm draws upon the classical concept of differences in pre- and post-fire reflectance, but also takes advantage of the object-oriented approach and a new threshold calculation method. It consists of four steps. The first concerns the calculation of spectral indices and their differences, together with differences in spectral layers based on pre- and post-fire images. In the second step, multiresolution segmentation and masking are performed (clouds, water bodies and non-vegetated areas are removed from further analysis). Thirdly, ‘core’ burnt areas are detected using automatically-adjusted thresholds. Thresholds are calculated on the basis of specific functions established for difference layers. The last step combines neighbourhood analysis and patch growing to define the final shape of burnt areas. The algorithm was tested in 27 areas located worldwide, and covered by various types of vegetation. Comparisons with manual interpretation show that the fully-automated classification is accurate. Over 82% of classifications were considered satisfactory (overall accuracy > 90%; user and producer accuracy > 70%).

Graphical Abstract

1. Introduction

Forest fires, both human-made and natural, are one of the main causes of adverse ecological, economic and social impacts worldwide. Not only do they lead to the loss of human life [1], they influence climate and carbon cycle changes [2], biodiversity [3], and change soil properties [4]. The reconstruction of the fire history makes it possible to define at least some, very important, aspects of the fire regime: its spatial pattern, distribution, frequency and seasonality [5]. This knowledge is crucial for the development of accurate fire management strategies and policies, not to mention damage assessment.
Satellite images are an exceptional source of data about forest fires, because it is an opportunity to derive long time series information. In regions where fire statistics are non-existent, remote sensing is the only possible source of data. Several successful attempts to map global and regional burnt areas have been carried out with the use of low resolution (5 km) National Oceanic and Atmospheric Administration (NOAA) and Advanced Very High Resolution Radiometer (AVHRR), or coarse resolution (1 km) Moderate Resolution Imaging Spectroradiometer (MODIS) data [6,7,8,9,10,11,12,13,14]. Furthermore, regional studies have been carried out in various environmental conditions: tropical forests [15,16], savannahs and grasslands [17,18], Mediterranean vegetation [19,20,21] and boreal forests [22]. Moderate-resolution data, such as Landsat images (30 m spatial resolution), have been used in local-scale studies [23,24,25,26,27]. The first time a large archive of Landsat TM and ETM+ data (>60,000 images) has been processed for burned area mapping of Queensland, Australia [28] and later on for mapping of selected areas of the Unites States of America [29]. Recently, a fire database for sub-Saharan Africa was developed based on Sentinel-2 data [30].
The main challenges relate to: (1) changes in vegetation cover that are very often unrelated to fire, and are caused by natural phenological changes or harvesting; (2) the spectral signature of burnt areas is inhomogeneous due to differences in fire intensity, fuel type, meteorological conditions of combustion, etc.; and (3) methods are non-transferable from one location to another, or different timeframes, without recalibration [31,32].
Burnt area detection studies have taken two main directions: (1) creating and applying spectral indices; and (2) the development of classification methods. Several spectral indices have been developed including, among others: the Normalized Difference Vegetation Index (NDVI) [33,34]; the Global Environmental Monitoring Index [35]; the Normalized Burn Ratio (NBR; the normalized difference of Landsat TM Bands 4 and 7) [36] and its multi-temporal variations the differenced Normalized Burn Ratio (dNBR) [37,38]; and the Burnt Area Index [39].
Equally, various methods are employed for burnt area mapping: supervised classification [26]; spectral signature and indices [22,32,40,41]; time series analysis [17,28]; image thresholding [16,21,41]; object-based approaches [42]; and approaches based on fuzzy set theory [43].
Automatic algorithms based on medium-resolution images have been developed and calibrated for different regions: Portugal and California [31]; the Mediterranean [32]; Australia [28]; and the United State of America [29]. These approaches consist of two-phase algorithms: core burnt pixel identification, followed by burnt region growth. The detection of core burnt pixels reduces commission errors, while burnt region growth reduces omission errors. This approach can be used to accurately classify burnt areas—with average user and producer accuracy > 70%. However, as Li et al. [44] note, the question of the transfer of the threshold to other areas without recalibration remains unanswered.
Published approaches for core burnt area mapping consist of: (1) an iterative decision criterion based on a large database of burnt and unburnt samples [30,31]; (2) the use of fuzzy set theory [43]; (3) the detection of negative outliers relative to the time series [28]; and (4) a gradient-boosted regression model [29]. However, in all of these cases, regional calibration datasets are needed. In this paper, we address the problem by proposing a thresholding approach based on scene statistics.
Several patch growing techniques have been developed. Seeded region growing [45] is fast and robust, but requires control points. Watershed region growing [46] is based on topographic concepts, where the relief is indicated by the magnitude of elevation differences. A similar approach was proposed by Goodwin and Collett [28], who used a flood-filling watershed filter. However, unlike earlier work, the authors did not use a fixed interval, but instead introduced a variable interval derived from preselected burnt and unburnt seed datasets. A logistic regression approach calibrated on the set of reference images has also been used [31].
In this paper, we present a threshold-based, two-phase algorithm for the automatic mapping of burnt areas. We aim to solve the problem of the transferability of thresholds among different geographical areas and vegetation types. We draw upon the classical approach, which is based on the difference between pre- and post-fire images [30,47], but combine it with an object-based approach and self-adjusting thresholding. The proposed recalibration procedure is based on specific functions, which are developed for various parameters that establish thresholds between unburnt and burnt areas based on the difference between pre- and post-fire images, or post-fire image statistics. The algorithm has been developed for Landsat images, but can also be applied to Sentinel-2 data without modification.

2. Materials and Methods

2.1. Data

Atmospherically-corrected pairs of multispectral optical images, with their corresponding cloud and water masks were used. Most were Level-2 Surface Reflectance products from Landsat 4, 5, 7 [48] and 8 [49], supplemented by a few pairs of Sentinel-2 images. In the case of Landsat images no further processing was needed as they are provided as reflectance values along with the cloud mask layers. In the case of Sentinel-2 the atmospheric correction was applied. Sen2Cor processor was employed to transform Level-1C top-of-atmosphere data into bottom-of-atmosphere surface reflectance (Level-2A) and to obtain a cloud mask [50]. The first image in a pair was acquired before the fire season and was considered as the reference image. Alternatively, the reference image was the one acquired one year before the fire season. The second was taken during, or shortly after, the fire season. Finally, the algorithm requires a slope layer, calculated from Shuttle Radar Topography Mission elevation data.
Two datasets were prepared. The first was used to develop the algorithm and was composed of pairs of Landsat images for the scenes that cover Western Greece and Ionian Islands (path 185, row 33) and Northern Portugal (path 204, row 33). These areas were chosen as they are at the limits between the Mediterranean and semi desert vegetation, in the case of Greece, and between the Mediterranean and Atlantic vegetation in the case of Portugal. Twenty images were selected to cover different combinations of pre- and post-fire images, as well as years with different annual precipitation [51] (Table 1).
The second dataset was used to test the accuracy of the algorithm. This was composed of 69 pairs of Landsat images, which covered 19 locations worldwide, and four pairs of Sentinel-2 images. The aim was to cover different vegetation types: tropical forests, coniferous forests, broadleaf forests, savannahs, Mediterranean vegetation, grassland and semi-desert (Figure 1).

2.2. Method

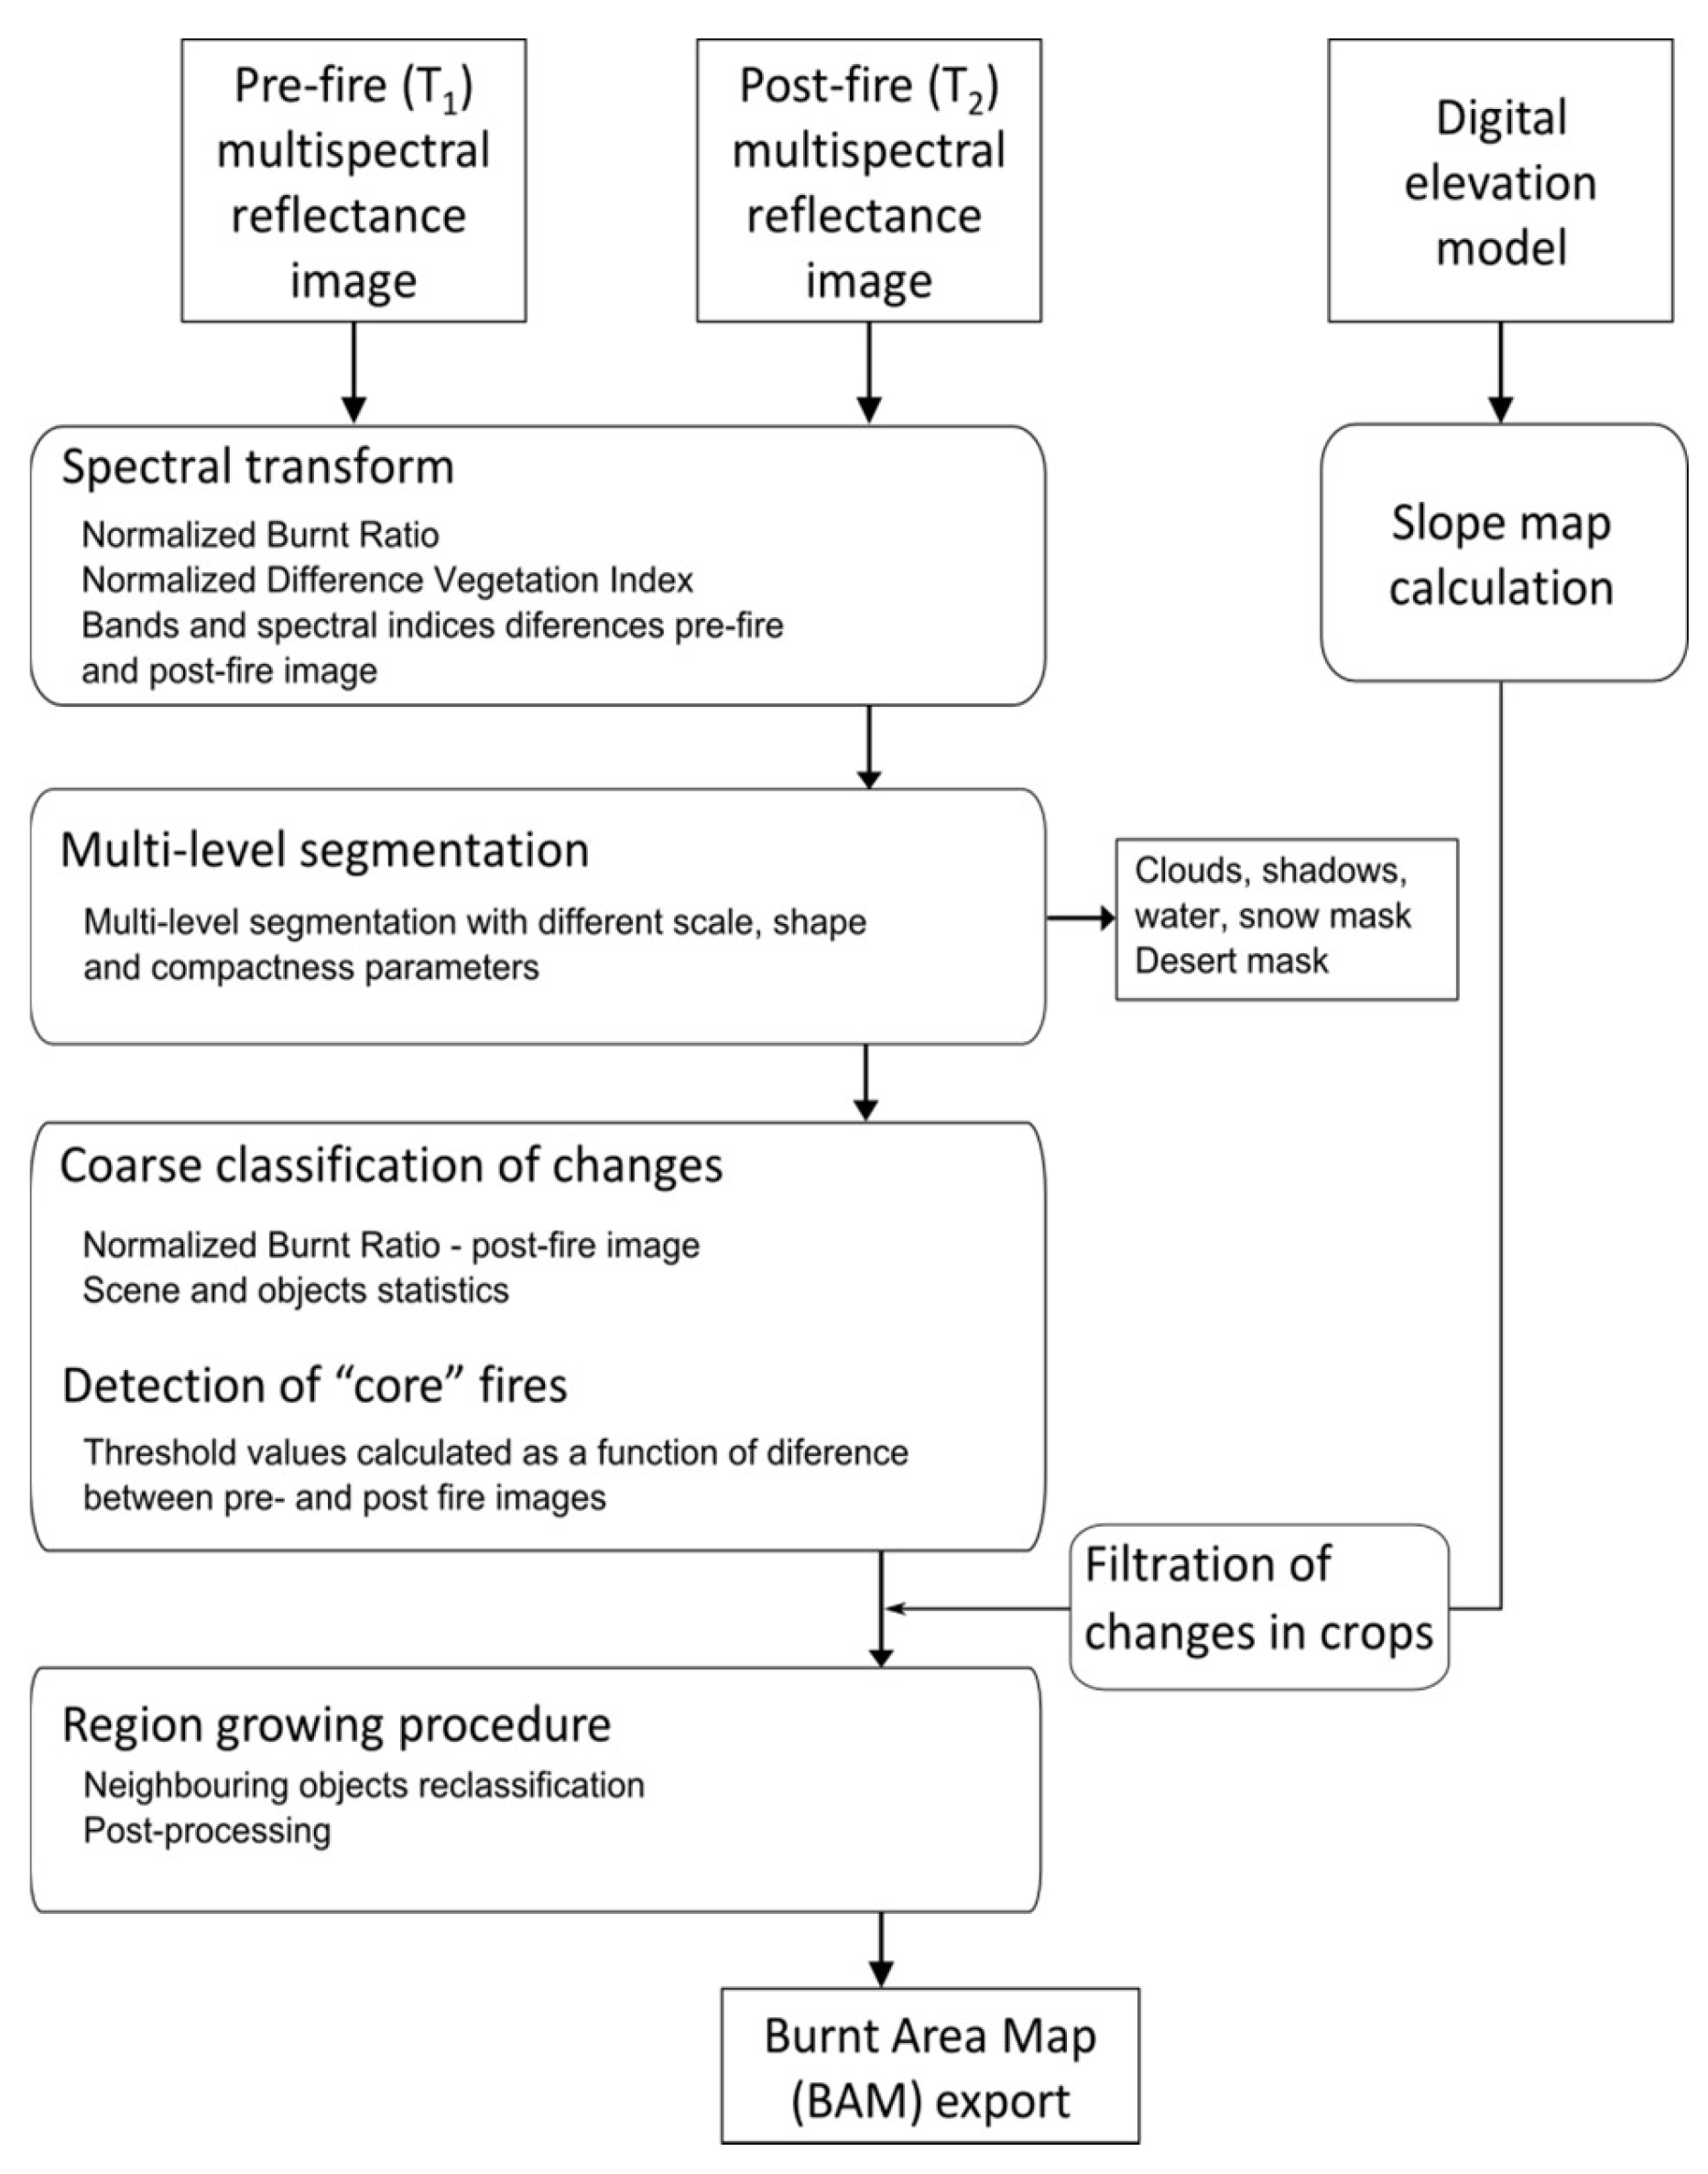
The method consists of the following main steps (Figure 2): (1) band arithmetic; (2) segmentation and masking; (3) the detection of changes and core burnt areas; and (4) region growing. All steps are implemented in Trimble eCognition® software (Trimble, Munich, Germany).

2.2.1. Band Arithmetic

In the first step, additional layers are calculated from pre- and post-fire images. Two well-known and widely used spectral indices are computed: the Normalized Burnt Ratio (NBR) [36] and the Normalized Difference Vegetation Index (NDVI) [33]:
NBR = NIR SWIR NIR + SWIR
where NIR is the near infrared band, and SWIR is the short wave infrared band
NDVI = NIR R NIR + R
where NIR is the near infrared band and R is the red band.
NDVI is known for its usefulness for the monitoring of changes in vegetation. NBR has been successfully applied for burnt detection. Both indices are easy to calculate and especially in the case of NDVI could be computed on images from various imaging systems.

2.2.2. Segmentation and Masking

Once the additional layers are calculated, segmentation can start. Multi-level segmentation is performed. First, images that correspond to both (T1, T2) Landsat or Sentinel-2 cloud cover masks are divided into objects. This is done using the quadtree procedure [52] which produces homogenous square objects. The objects which contain information about clouds, snow and water are classified and excluded from further analysis. Next, objects that remain unclassified are merged. In the following step, large non-vegetated areas are masked. Unclassified areas are again segmented using the quadtree algorithm, but this time with both (T1, T2) NDVI layers as input, and the scale parameter equal to 10. The largest objects that could be obtained were of the size of 1024 pixels, and only these objects were taken into consideration. The object was classified as non-vegetated when the NDVI for T1, T2 was low (<0.17), and its temporal change was in the range [−0.04, 0.04]. This approach has two advantages. Firstly, it accurately classifies large non-vegetated areas without requiring a detailed analysis, and secondly the computation time is very short. All objects classified as non-vegetated are excluded from further analysis. Any remaining unclassified objects are then merged again, and a segmented to obtain objects which will be directly used for burnt areas mapping is performed. This step uses the multiresolution segmentation method [53]. Trial and error showed that the best layers for segmentation are the NBRT2 and the difference of NIR spectral channels. The scale parameter was set at 100, and did not need to be changed between scenes. In the following paragraphs if we refer to statistics calculated for the scene it means that they were calculated only for the part of scene that has not been excluded from analysis at this point.
Segmentation procedures were selected taking into account the requirement to minimize the processing time needed to exclude areas that would affect the calculation of thresholds, but also to correctly delineate burnt areas with high transferability from one scene to another.

2.2.3. Core Burnt Areas Classification

As noted above, all classical approaches to burnt area mapping require manual, regional calibration. The approach that we propose overcomes this important problem. Here, core burnt areas are classified in two steps. The first concerns the coarse classification of potential burnt areas based on the NBRT2 layer of post-fire images. Objects with NBRT2 values much lower than the mean of the whole scene represent vegetation cover which suffered negative changes caused by, e.g., fires or harvesting. Objects that fulfil the following condition are considered for further analysis:
μ o < ( μ s σ s )
where μ o is the mean for an object of NBRT2, μ s is the mean for the scene of NBRT2 and σ s is the standard deviation for the scene of NBRT2.
In the next step, differences in each spectral parameter is calculated for pre- and post-fire images of the scene. We consider following differences of spectral parameters: indices—dNBR, dNDVI; spectral bands—near infrared (dNIR) and short wave infrared (dSWIR1, dSWIR2). These values are used to calculate the threshold for a specified pair of images; they are expressed as relative values and calculated as follows:
d μ s = 100 μ s T 1 * 100 μ s T 2
where d μ is the difference of a spectral parameter at scene level, μ s T 1 is the mean of a spectral parameter of pre-fire image, and is the mean of a spectral parameter of post-fire image.
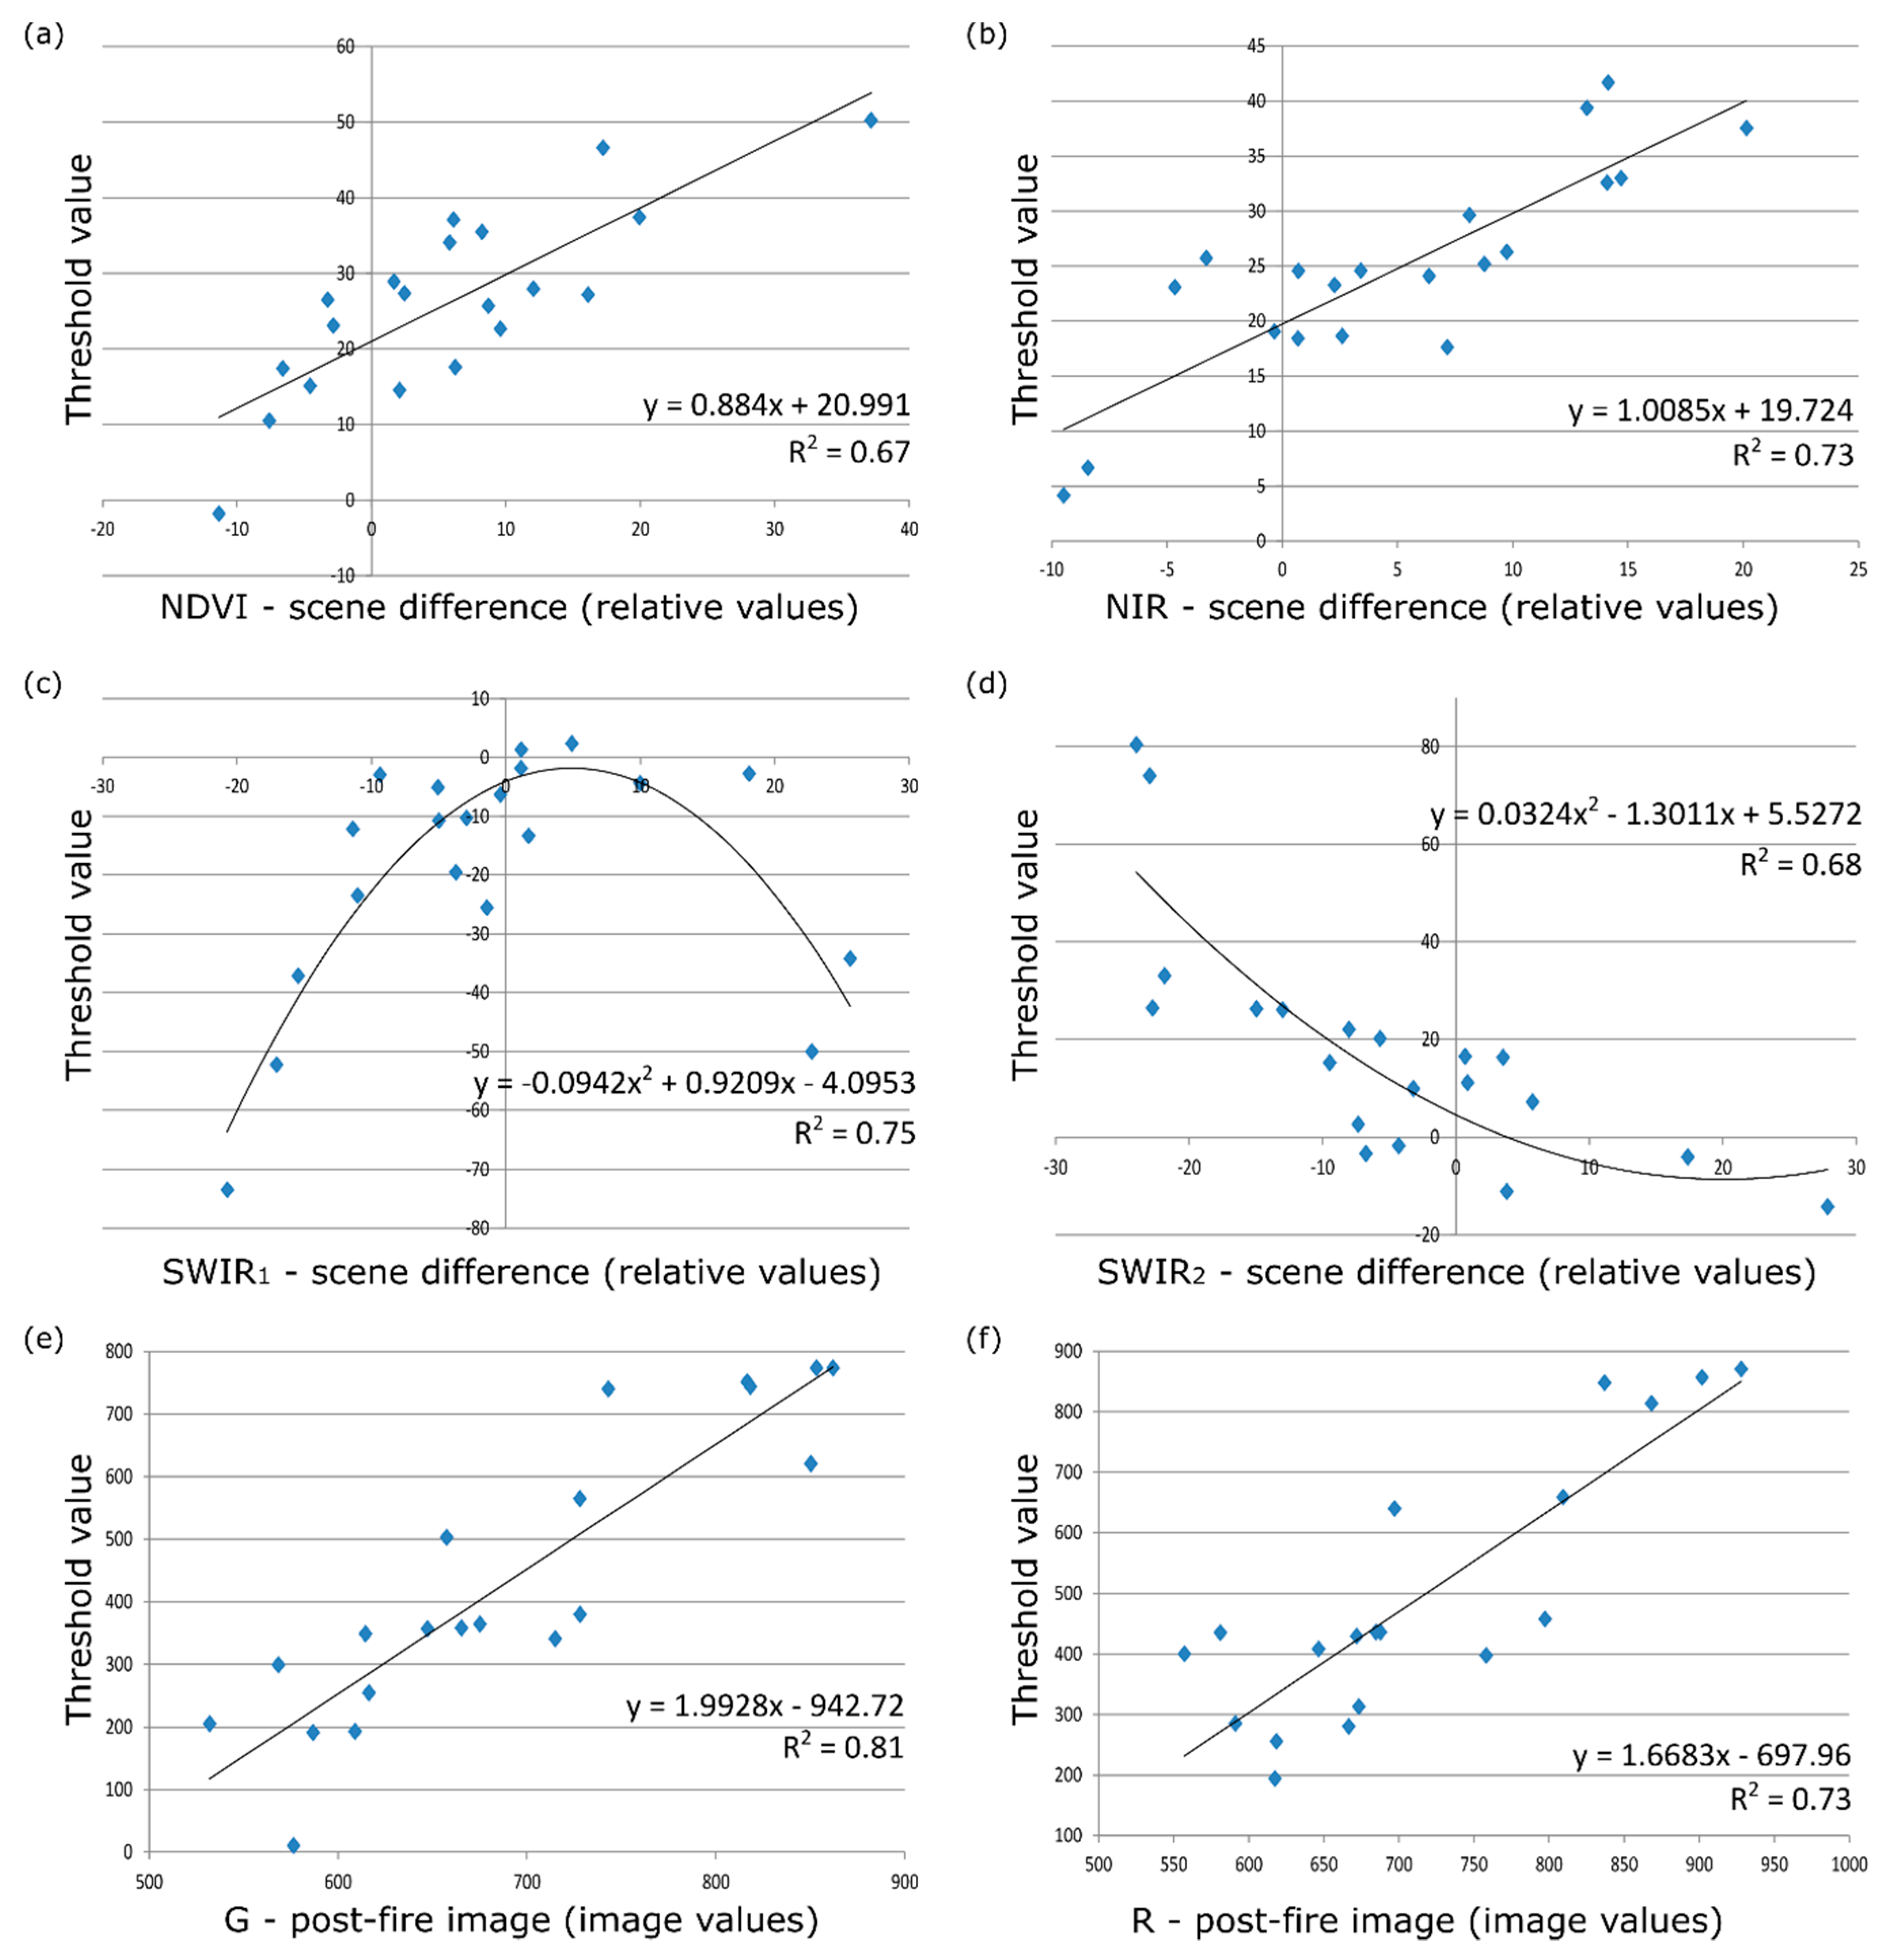
Potential burnt areas are refined using a set of thresholds designed to distinguish between unburnt and burnt areas, calculated for the following layers: dNIR, dSWIR1 and dSWIR2. The algorithm uses two kinds of thresholds: variable, which are calculated on the basis of threshold functions for each pair of analyzed images; and constant. Variable thresholds (T) are calculated as a linear or polynomial function of the difference between pre- and post-fire images (dNIR, dSWIR1, dSWIR2 and dNDVI):
T = f ( image difference )
or as a function of a post-fire (T2) image of green and red spectral bands (G and R, respectively):
T = f ( image T 2 )
To find threshold functions, burnt areas were manually mapped on reference pairs of Landsat images for the Ionian Islands and Western Greece and Northern Portugal (Table 1). Statistics for unburnt (clouds, water, snow and shadows were excluded) and burnt segments were extracted from the difference image for all parameters. Using these statistics, thresholds were calculated on the basis of the normal distribution [54]. Three cases were considered. In the case where σ1σ2 and Δ > 0, two intersection points x1, x2 exist. The intersection point for burnt area mapping, which is located between the maximum of the histograms maxima of the distribution probabilities of classes, was used. Intersection points were established using the following formulas:
x 1 = μ 2 σ 1 2 μ 1 σ 2 2 + σ 1 σ 2 Δ σ 1 2 σ 2 2
x 2 = μ 2 σ 1 2 μ 1 σ 2 2 σ 1 σ 2 Δ σ 1 2 σ 2 2
where μ1, μ2 are the means of classes; σ1, σ2 are the standard deviation of classes, and:
Δ = ( μ 1 μ 2 ) 2 + 2 ( σ 2 2 σ 1 2 ) log 10 σ 2 σ 1
Only one intersection point exists in cases when Δ = 0 or σ1= σ2. When Δ = 0 and σ1σ2 the intersection point is calculated as follows:
x = μ 2 σ 1 2 μ 1 σ 2 2 σ 1 2 σ 2 2
When Δ > 0 and σ 1 =   σ 2 , the intersection is at following point:
x = μ 1 + μ 2 2
Finally, it should be noted that Δ cannot be smaller than 0 for any values of µ1, µ2, σ1 or σ2.
Once the thresholds for all parameters have been calculated for each pair of reference images, linear or polynomial regressions between thresholds and the image difference were found.
Core burnt areas are distinguished from potential burnt areas using the conditions presented in Table 2. The conditions were set after the analysis of the thresholds obtained for different calibration sites and values of indices and spectral bands differences in objects considered as burnt areas.
In order to avoid the misclassification of crops harvested between data acquisitions, which have a similar spectral profile to burnt areas [13], we removed changes detected in the agricultural areas which fulfilled the following conditions: they were located on plains (slope ≤ 6, a slope map was calculated from SRTM data); they were relatively small (< 30 ha, this condition was fitted after the statistical analysis of dimensions of false detections of core burnt areas) and homogeneous (small internal variation). For the purposes of this reclassification, and to ensure that all three assumptions could be correctly evaluated, an additional segmentation level was prepared based on spectral values and slope layer.

2.2.4. Region Growing

Region growing avoids significant omission errors. An object-oriented approach was adopted, as it makes it possible to analyse relations between neighbouring objects. Here, we analysed the neighbourhood of core burnt areas in order to evaluate if the adjacent object could be considered as another burnt area. Once core burnt areas have been mapped, region growing starts. In the first step, objects classified as core burnt areas are merged, and spectral statistics (mean and standard deviation of dNBR) are calculated for all detected burnt areas. Next, neighbouring objects are classified as burnt areas if their spectral distance from the core is lower than the standard deviation of all areas classified as burnt in a scene:
( μ B A σ B A ) < μ o < ( μ B A + σ B A )
where μ B A is the mean of dNBR values of the total burnt area detected on the scene, σ B A is the standard deviation for dNBR values in the total burnt area detected on the scene, and μ o is the mean of dNBR value of each object adjacent to the core burnt area object.
If a neighbouring object is classified as a burnt area, it is merged into the core and the process is repeated until there are no more changes. To prevent uncontrolled growing (found in some specific cases), an additional condition, based on dNDVI thresholding, is used. This is calculated in the same way as the thresholds used for the calculation of core burnt areas.
Post-processing is the final step of the classification. Here, objects are merged, and the minimum mapping unit (MMU) is applied. The size of the MMU was set to 1 ha. It allows to filter out objects that were too small to provide plausible statistical values due to low number of pixels used for calculation. An enclosure analysis is applied to reclassify small unclassified areas (or areas classified as clouds) that are enclosed by burnt areas.

2.3. Validation

The method was tested in various geographical areas, on both Landsat and Sentinel-2 images. A total of 73 classifications were validated. For four regions, all available Landsat images were classified. For another 19 regions distributed worldwide, one pair of images was tested. Reference datasets were prepared for each pair of images by visual interpretation. Other authors have reported that commission errors are the main problem in this type of analysis [28,43]; hence, a stratified random sampling approach was applied to address the problem. Stratification was based on the classification of the detected burnt areas. A point density was defined for burnt and unburnt areas. One point indicated 100 pixels of burnt area. Depending on the extent of the burnt area in the scene, a test point was drawn per 1000 pixels classified as unburnt (if the burnt area occupied > 1.5% of the analysed area), or per 10,000 pixels (if the burnt area occupied < 1.5% of the area). The allocation of sampling points results in a dense representation of burnt points (compared to unburnt), and decreases the standard error in the estimated user accuracy of this class [55].
For all classifications, accuracy was assessed using the confusion (error) matrix [56], which compares mapped classes with those observed in the reference dataset. Overall accuracy is usually used as the measure, but if classes are not more-or-less equally represented, it may not be reliable as the standard error increases [56,57]. Consequently, we focused on omission (producer accuracy, precision) and commission (user accuracy, recall) errors. Specifically, we calculated how many tested pairs of images had a user and producer accuracy above 95, 90, 85, 80, 75 and 70 or less. We considered a classification to be ‘very good’ when all accuracies were > 90; ‘good’ [80, 90); acceptable [70, 80]; and ‘unacceptable’ < 70. Overall accuracy was an additional condition, and was set at > 90% for a classification to be considered correct.

3. Results

A function was established that estimates thresholds for almost all analysed parameters. For the NDVI index and the NIR, SWIR1 and SWIR2 spectral bands, they are based on the relative difference in mean values for pre- and post-fire images. In the case of green and red bands, the function is established for mean values of the post-fire image. The regression for the NBR index was impossible to establish. Correlation coefficients for rest of the functions varied from r2 = 0.67 (NDVI), r2 = 0.68 (SWIR1) to r2 = 0.73 (NIR and R), r2 = 0.75 (SWIR1) and r2 = 0.81 (G) (Figure 3). Correlation coefficients for parameters were satisfactory, as we did not attempt to map all burnt areas using them, but only the ‘seed’ areas.
Average producer accuracy was 94.4% (14%–100% for individual images) and average user accuracy was 93.6% (46%–99% for individual images). A total of 17.4% of classifications were unacceptable; 82.6% were considered satisfactory. 46.4% were evaluated as very good (user and producer accuracies of burnt and unburnt classes were higher than 90%), 24.6% were good (user and producer accuracy for burnt and unburnt classes was 80%–90%), while 11.6% were acceptable.
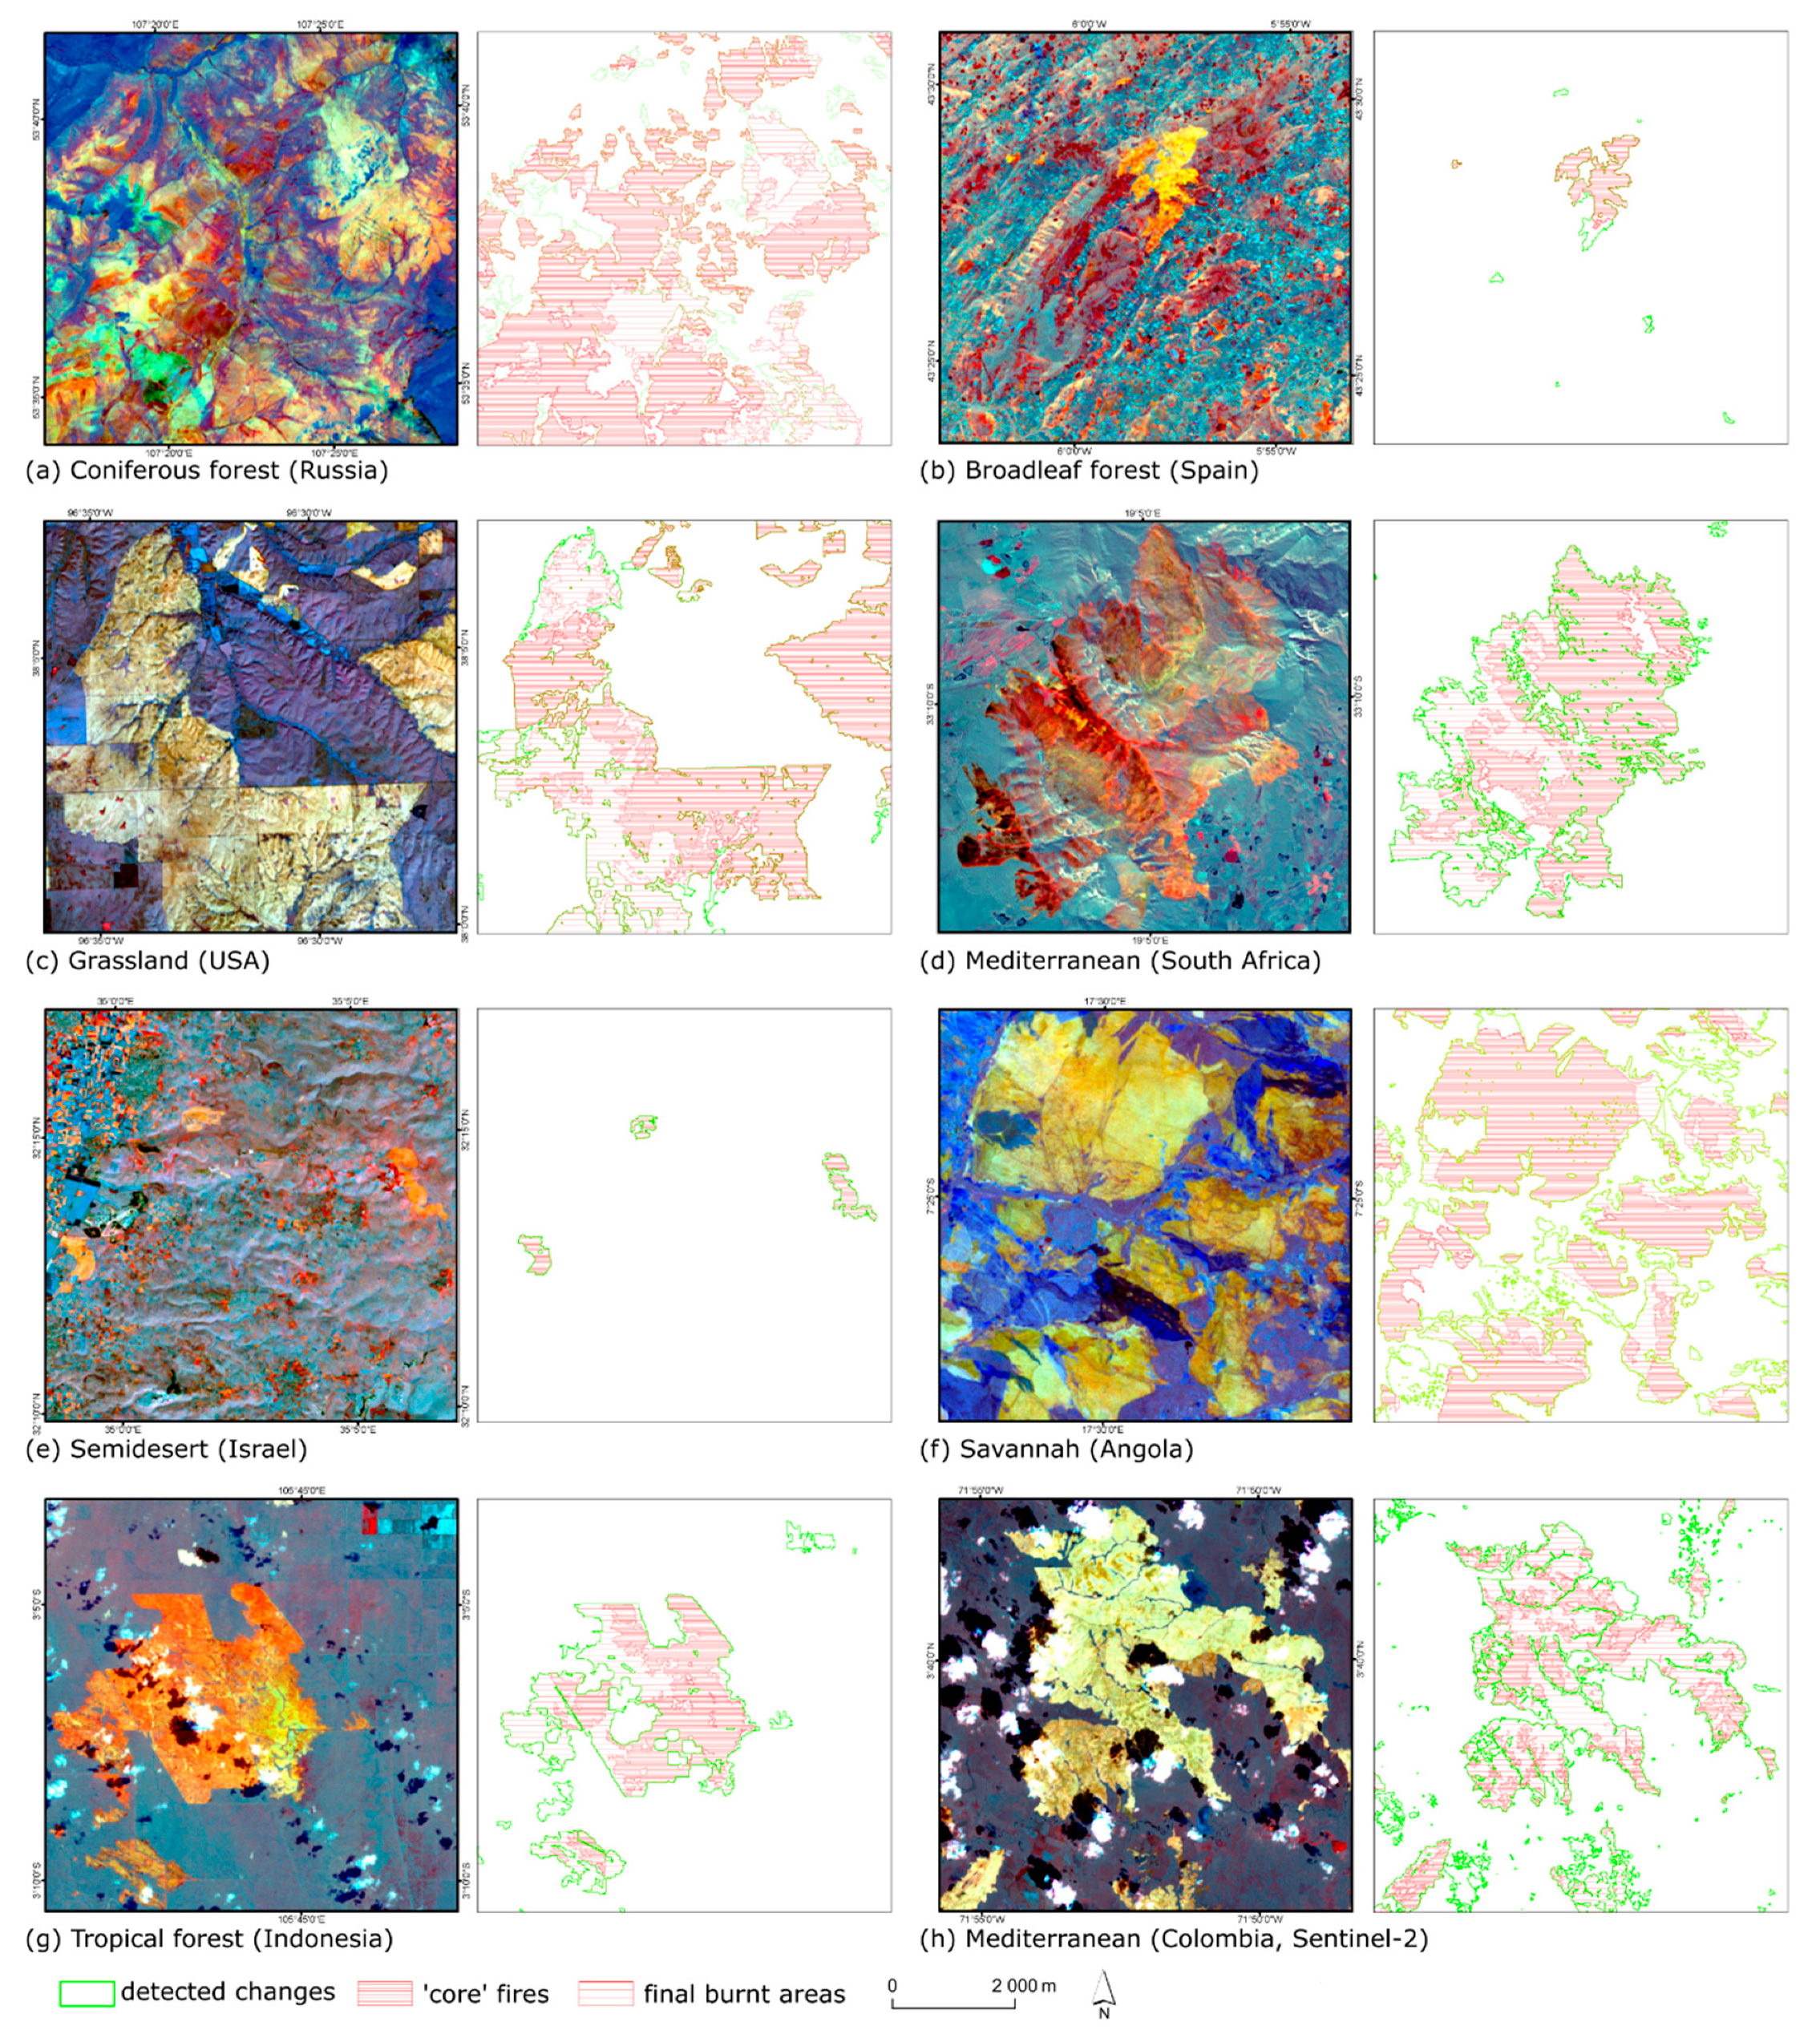
With respect to the performance of the algorithm, we found that it behaved similarly in different geographic settings (Figure 4, Table 2). Independently of the geographic zone, the surface of changes detected by the coarse classification was around three times larger than the final burnt area surface. The exception concerned cases where agricultural areas covered large part of the scene; in this case, the proportion was up to 15–20 times higher. Detected core fires constituted, on average, around 60% of the final burnt surface, but this varied from 32% (for the Sentinel-2 scene of Colombia) to 92% (for the Landsat scene of Kansas).
Although the algorithm was designed based on Landsat images, it was successfully employed on Sentinel-2 images without modification. Four pairs of Sentinel-2 images were tested for fires that occurred in 2016 and 2017 in Colombia (Table 3), California and for two areas in Portugal (Table 4). In all cases, the accuracy was > 90%.

4. Discussion

Although a general results are positive it is necessary to comment the failure classifications in order to find sources of errors and point out a possible ways of improvements. With respect to unacceptable classifications, half were due to commission errors, and half due to omission errors. Most were caused by deficiencies in the cloud mask. When not detected by the cloud mask, low stratus clouds, fog and haze altered the scene statistics and degraded the threshold calculation. As we did not implement topographic correction, other sources of error were the presence of shadows in mountainous areas. Another reason, especially for omission errors, is a time distance between fire and post-fire image acquisition. It was especially seen for fires occurred in grasslands. For example, the post-fire image of grassland in Kansas was acquired four days after main fires and the classification result was very good (Table 3), however, the next cloud free image of the area was acquired two months later and on this image it was impossible to detect fires, even by visual interpretation.
Regarding land cover we did not find any relation between the vegetation type and a specific kind of errors. However, further, more extensive testing should be performed in additional natural and semi-natural environments. In the current version of the method agricultural burns are considered only in the case of fields larger than 30 ha. The statistical analysis of false ‘core’ areas detections showed that the vast majority of them was located at arable lands smaller than 30 ha, which were harvested instead of being burnt. Moreover, it seems that the scenes which image coastal areas are classified incorrectly more often (Supplementary Materials). It can be due to inefficiency of atmospheric correction [49].
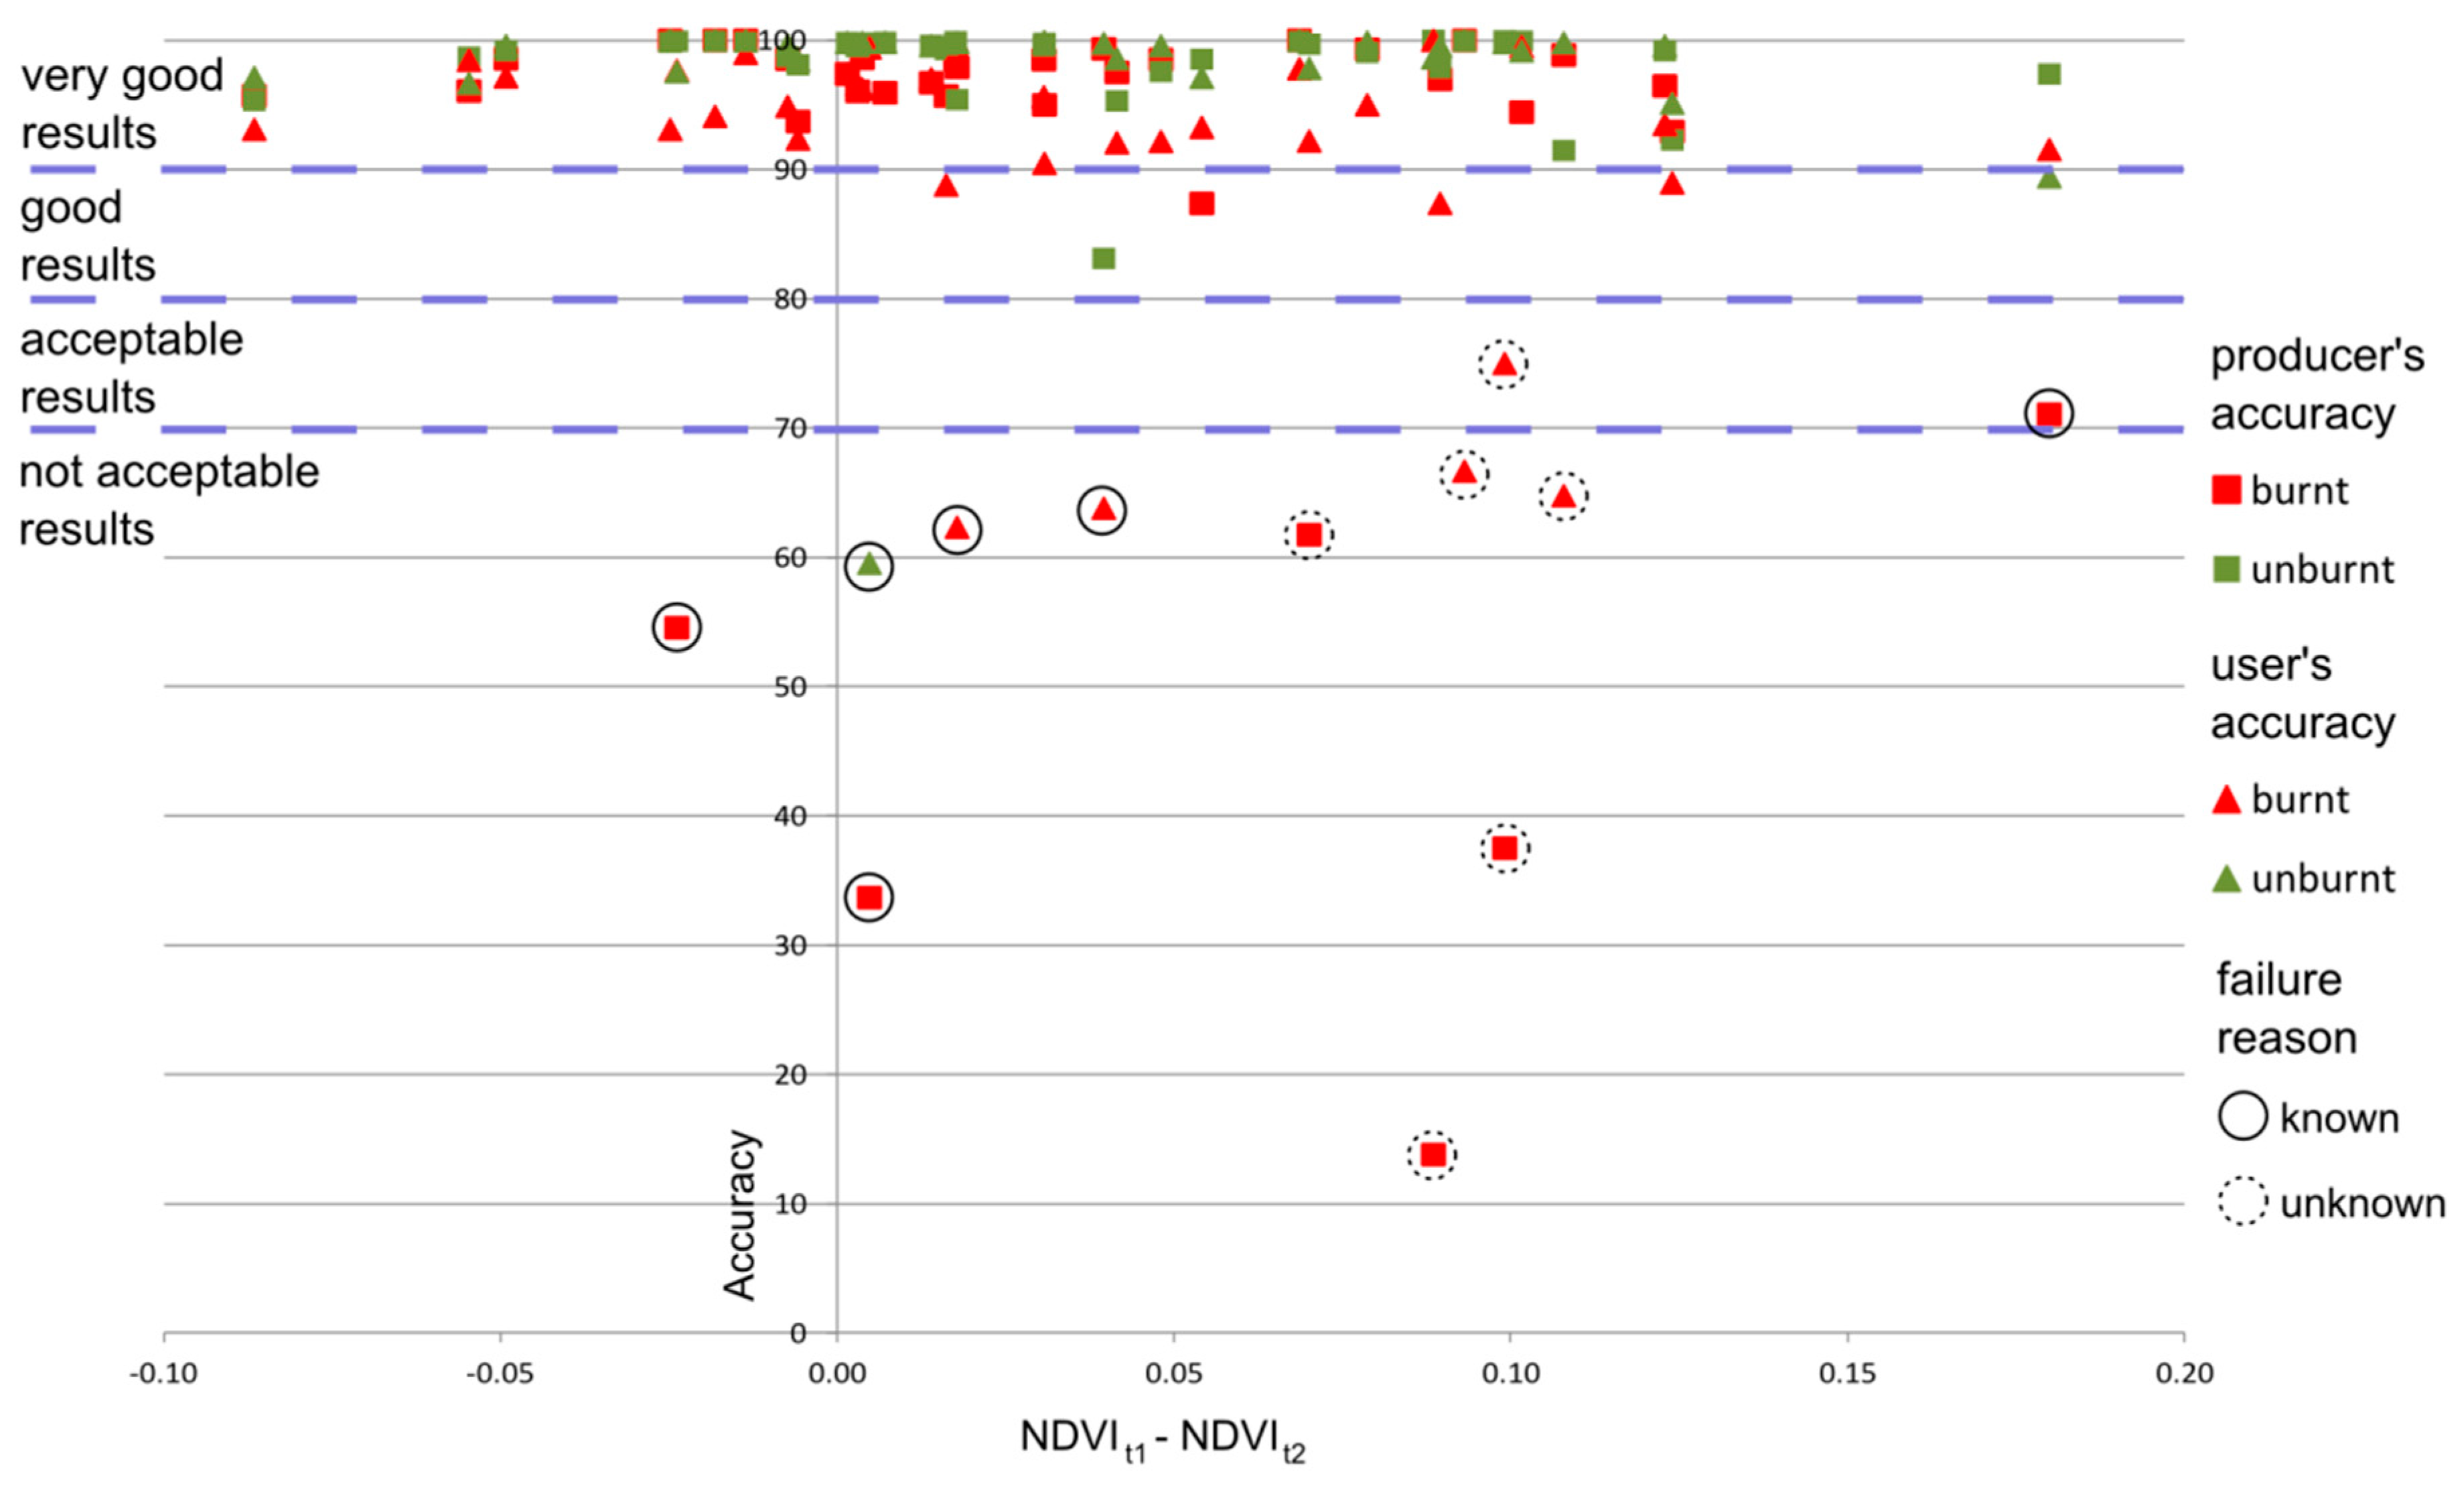
In some cases, no objective reason could be found for the failure. We investigated if there is a specific NDVI difference between pre- and post-fire images expressed in absolute values which is especially good for burnt area mapping or makes it impossible. We found that the NDVI difference cannot be used to preselect images in order to obtain satisfactory results of burnt area mapping as for all ranges of differences there were correct classifications done. However, in the case of NDVI of whole post-fire images higher that 0.05–0.1 compared to pre-fire images, it seems that the probability of successful classification decreases (Figure 5). Further tests should be run to confirm this hypothesis.
The analysis of individual burnt patches suggests that the region-growing algorithm should be improved. In cases when the fire intensity changes significantly between the core fire and other areas, omission errors are seen. The most representative case of such a situation is the classification carried out for the coniferous forest in Russia (Figure 4a). If fire is of low intensity than the NBR value of the post-fire image is only slightly lower than those of pre-fire image. Hence, it does not fulfil the condition expressed in Equation (12).

5. Conclusions

The burnt area mapping method presented here was tested in various areas, on scenes that represent diverse types of vegetation: tropical forests, coniferous forests, broadleaf forests, savannah, Mediterranean vegetation, grassland, and semi-desert. Thresholds to delimit core burnt areas were established from functions developed from statistics of pairs of pre- and post-fire images. The method proved to be easily transferable from one region to another, and accuracy remained satisfactory with no loss in automation. A total of 82.6% of pairs of images from different parts of the world were classified correctly. However, further tests are necessary to check the performance of the method in different environmental conditions. As thresholding is dependent on image statistics, it is possible to transfer the method from the Landsat sensor to Sentinel-2 without modification. Four Sentinel-2 datasets were classified with producer and user accuracies > 90%. Nevertheless, additional tests using Sentinel-2 images are needed. Although, overall, the method is accurate, the region-growing procedure needs to be improved, especially for low-severity fires. The main restriction in the use of the method is its dependency on the quality of the cloud mask. Furthermore, in mountainous areas topographic correction should be applied in an image pre-processing step. Future testing of the method should focus on classification of large datasets under various environmental conditions (e.g., snow and ice presence, leaf on/leaf off conditions, shadows). We hope that the further application of the method will benefit not only our understanding of past and present fire regimes, but also help natural resource management.

Supplementary Materials

The following are available online at https://www.mdpi.com/2072-4292/11/22/2669/s1, Table S1: List of all processed image pairs and obtained accuracies.

Author Contributions

E.W. and S.A. conceived and designed the experiments; S.A. performed the experiments; E.W. and S.A. analysed the data; S.A. contributed analysis tools; and E.W. and S.A. wrote the paper.

Funding

This work was financially supported by European Commission under FP7 AF3- Advanced Forest Fire Fighting (FP7-SEC-2013-1, grant agreement no. 607276).

Conflicts of Interest

The authors declare no conflict of interest.

References

  1. Brushlinsky, N.N.; Ahrens, M.; Sokolov, S.V.; Wagner, P. World Fire Statistics 22; Center of Fire Statistics of International Association of Fire and Rescue Services: Ljubljana, Slovenia, 2017. [Google Scholar]
  2. Bowman, D.M.J.S.; Balch, J.K.; Artaxo, P.; Bond, W.J.; Carlson, J.M.; Cochrane, M.A.; D’Antonio, C.M.; DeFries, R.S.; Doyle, J.C.; Harrison, S.P.; et al. Fire in the Earth System. Science 2009, 324, 481–484. [Google Scholar] [CrossRef]
  3. Andersen, A.N.; Cook, G.D.; Corbett, L.K.; Douglas, M.M.; Eager, R.W.; Russell-Smith, J.; Setterfield, S.A.; Williams RJ And Woinarski JC, Z. Fire frequency and biodiversity conservation in Australian tropical savannas: Implications from the Kapalga fire experiment. Austral Ecol. 2005, 30, 155–167. [Google Scholar] [CrossRef]
  4. Certini, G. Effects of fire on properties of forest soils: A review. Oecologia 2005, 143, 1–10. [Google Scholar] [CrossRef] [PubMed]
  5. Morgan, P.; Hardy, C.; Swetnam, T.; Rollins, M.; Long, D. Mapping fire regimes across time and space: Understanding coarse and fine scale fire patterns. Int. J. Wildland Fire 2001, 10, 329–343. [Google Scholar] [CrossRef]
  6. Barbosa, P.M.; Gregoire, J.M.; Cardoso Pereira, J.M. An Algorithm for Extracting Burned Areas from Time Series of AVHRR GAC Data Applied at a Continental Scale. Remote Sens. Environ. 1999, 69, 253–263. [Google Scholar] [CrossRef]
  7. Justice, C.O.; Giglio, L.; Korontzi, S.; Owens, J.; Morisette, J.T.; Roy, D.; Descloitres, J.; Alleaume, S.; Petitcolin, F.; Kaufman, Y. The MODIS fire products. Remote Sens. Environ. 2002, 83, 244–262. [Google Scholar] [CrossRef]
  8. Roy, D.; Jin, Y.; Lewis, P.; Justice, C. Prototyping a global algorithm for systematic fire-affected area mapping using MODIS time series data. Remote Sens. Environ. 2005, 97, 137–162. [Google Scholar] [CrossRef]
  9. Giglio, L.; van der Werf, G.; Randerson, J.; Collatz, G.; Kasibhatla, P. Global estimation of burned area using MODIS active fire observations. Atmos. Chem. Phys. 2006, 6, 957–974. [Google Scholar] [CrossRef]
  10. Alonso-Canas, I.; Chuvieco, E. Global Burned Area Mapping from ENVISAT-MERIS data. Remote Sens. Environ. 2015, 163, 140–152. [Google Scholar] [CrossRef]
  11. Chuvieco, E.; Yue, C.; Heil, A.; Mouillot, F.; Alonso-Canas, I.; Padilla, M.; Pereira, J.M.; Oom, D.; Tansey, K. A new global burned area product for climate assessment of fire impacts. Glob. Ecol. Biogeogr. 2016, 25, 619–629. [Google Scholar] [CrossRef]
  12. Chuvieco, E.; Lizundia-Loiola, J.; Pettinari, M.L.; Ramo, R.; Padilla, M.; Tansey, K.; Mouillot, F.; Laurent, P.; Storm, T.; Heil, A. Generation and analysis of a new global burned area product based on MODIS 250 m reflectance bands and thermal anomalies. Earth Syst. Sci. Data 2018, 10, 2015–2031. [Google Scholar] [CrossRef]
  13. Giglio, L.; Boschetti, L.; Roy, D.P.; Humber, M.L.; Justice, C.O. The Collection 6 MODIS burned area mapping algorithm and product. Remote Sens. Environ. 2018, 217, 72–85. [Google Scholar] [CrossRef] [PubMed]
  14. Otón, G.; Ramo, R.; Lizundia-Loiola, J.; Chuvieco, E. Global Detection of Long-Term (1982–2017) Burned Area with AVHRR-LTDR Data. Remote Sens. 2019, 11, 2079. [Google Scholar] [CrossRef]
  15. Malingreau, J.P.; Stephens, G.; Fellows, L. Remote sensing of forest fires: Kalimantan and North Borneo in 1982–83. Ambio 1985, 14, 314–321. [Google Scholar]
  16. Libonati, R.; DaCamara, C.; Pereira, J.; Peres, L. Retrieving middle-infrared reflectance for burned area mapping in tropical environments using MODIS. Remote Sens. Environ. 2010, 114, 831–843. [Google Scholar] [CrossRef]
  17. Hardtke, L.A.; Blancoa, P.D.; del Vallea, H.F.; Metternichtb, G.I.; Sionec, W.F. Semi-automated mapping of burned areas in semi-arid ecosystems using MODIS time-series imagery. Int. J. Appl. Earth Obs. Geoinf. 2015, 38, 25–35. [Google Scholar] [CrossRef]
  18. De Carvalho, O.A., Jr.; Fontes Guimaraes, R.; Rosa Silva, C.; Trancoso Gomes, R.A. Standardized Time-Series and Interannual Phenological Deviation: New Techniques for Burned-Area Detection UsingLong-Term MODIS-NBR Dataset. Remote Sens. 2015, 7, 6950–6985. [Google Scholar] [CrossRef]
  19. Fernandez, A.; Illera, P.; Casanova, J.L. Automatic mapping of surfaces affected by forest fires in Spain using AVHRR NDVI composite image data. Remote Sens. Environ. 1997, 60, 153–162. [Google Scholar] [CrossRef]
  20. Garcia, M.; Chuvieco, E. Assessment of the potential of SAC-C/MMRS imagery for mapping burned areas in Spain. Remote Sens. Environ. 2004, 92, 414–423. [Google Scholar] [CrossRef]
  21. Quintano, C.; Fernández-Manso, A.; Stein, A.; Bijker, W. Estimation of area burned by forest fires in Mediterranean countries: A remote sensing data mining perspective. For. Ecol. Manag. 2011, 262, 1597–1607. [Google Scholar] [CrossRef]
  22. Loboda, T.; O’Neal, K.; Csiszar, I. Regionally adaptable dNBR-based algorithm for burned area mapping from MODIS data. Remote Sens. Environ. 2007, 109, 429–442. [Google Scholar] [CrossRef]
  23. Russell-Smith, J.; Ryan, P.G.; Durieu, R. A Landsat MSS-derived fire history of Kakadu National Park. J. Appl. Ecol. 1997, 34, 748–766. [Google Scholar] [CrossRef]
  24. Edwards, A.; Hauser, P.; Anderson, M.; McCartney, J.; Armstrong, M.; Thackway, R.; Allan, G.; Hempel, C.; Russell-Smith, J. A tale of two parks: Contemporary fire regimes of Litchfield and Nitmiluk National Parks, monsoonal northern Australia. Int. J. Wildland Fire 2001, 10, 79–89. [Google Scholar] [CrossRef]
  25. Recondo, C.; Woźniak, E.; Perez-Morandaira, C. Cartografia de zonas quemadas en Asturias durante el periodo 1991-2001 a partir de imaenes Landsat TM. Rev. De Teledetec. 2002, 18, 47–55. [Google Scholar]
  26. Silva, J.; Sá, A.; Pereira, J. Comparison of burned area estimates derived from SPOT-VEGETATION and Landsat ETM+ data in Africa: Influence of spatial pattern and vegetation type. Remote Sens. Environ. 2005, 96, 188–201. [Google Scholar] [CrossRef]
  27. Felderhof, L.; Gillieson, D. Comparison of fire patterns and fire frequency in two tropical savanna bioregions. Austral Ecol. 2006, 31, 736–746. [Google Scholar] [CrossRef]
  28. Goodwin, N.R.; Collett, L.J. Development of an automated method for mapping fire history captured in Landsat TM and ETM+ time series across Queensland, Australia. Remote Sens. Environ. 2014, 148, 206–221. [Google Scholar] [CrossRef]
  29. Hawbaker, T.J.; Vanderhoof, M.K.; Beal, Y.-J.; Takacs, J.D.; Schmidt, G.L.; Falgout, J.T.; Williams, B.; Fairaux, N.M.; Caldwell, M.K.; Picotte, J.J.; et al. Mapping burned areas using dense time-series of Landsat data. Remote Sens. Environ. 2017, 198, 504–522. [Google Scholar] [CrossRef]
  30. Roteta, E.; Bastarrika, A.; Padilla, M.; Storm, T.; Chuvieco, E. Development of a Sentinel-2 burned area algorithm: Generation of a small fire database for sub-Saharan Africa. Remote Sens. Environ. 2019, 222, 1–17. [Google Scholar] [CrossRef]
  31. Bastarrika, A.; Chuvieco, E.; Martín, M.P. Mapping burned areas from Landsat TM/ETM+ data with a two-phase algorithm: Balancing omission and commission errors. Remote Sens. Environ. 2011, 115, 1003–1012. [Google Scholar] [CrossRef]
  32. Stroppiana, D.; Bordogna, G.; Carrara, P.; Boschetti, M.; Boschetti, L.; Brivio, P.A. A method for extracting burned areas from Landsat TM/ETM+ images by soft aggregation of multiple spectral indices and a region growing algorithm. ISPRS J. Photogramm. Remote Sens. 2012, 69, 88–102. [Google Scholar] [CrossRef]
  33. Rouse, J.W.; Haas, R.H.; Schell, J.A.; Deering, D.W. Monitoring vegetation systems in the Great Plains with ERTS. In Proceedings of the 3rd Earth Resources Technology Satellite-1 Symposium (NASA), Washington, DC, USA, 10–14 December 1974; pp. 309–317. [Google Scholar]
  34. Chuvieco, E.; Martín, M.P.; Palacios, A. Assessment of different spectral indices in the red-near-infrared spectral domain for burned land discrimination. Int. J. Remote Sens. 2002, 23, 5103–5110. [Google Scholar] [CrossRef]
  35. Pinty, B.; Verstraete, M.M. GEMI: A non-linear index to monitor global vegetation from satellites. Vegetatio 1992, 101, 15–20. [Google Scholar] [CrossRef]
  36. Key, C.H.; Benson, N.C. Measuring and remote sensing of burn severity. In Proceedings of the Joint Fire Science Conference and Workshop: Crossing the Millennium: Integrating Spatial Technologies and Ecological Principles for a New Age in Fire Management, Boise, Idaho, 15–17 June 1999; Volume 2, p. 284. [Google Scholar]
  37. Miller, J.D.; Thode, A.E. Quantifying burn severity in a heterogeneous landscape with a relative version of the delta Normalized Burn Ratio (dNBR). Remote Sens. Environ. 2007, 109, 66–80. [Google Scholar] [CrossRef]
  38. Veraverbeke, S.; Lhermitte, S.; Verstraeten, W.W.; Goossens, R. A time-integrated MODIS burn severity assessment using the multi-temporal differenced normalized burn ratio (dNBRMT). Int. J. Appl. Earth Obs. Geoinf. 2001, 13, 52–58. [Google Scholar] [CrossRef] [Green Version]
  39. Martín, M.P. Cartografía e Inventario de Incendios Forestales en la Península Ibérica a Partir de Imágenes NOAA–AVHRR. Ph.D. Thesis, Departamento de Geografía, Universidad de Alcalá, Alcalá de Henares, Madrid, Spain, 1998. [Google Scholar]
  40. Martín, M.; Gómez, I.; Chuvieco, E. Burnt area index (BAIM) for burned area discrimination at regional scale using MODIS data. For. Ecol. Manag. 2006, 234, s221. [Google Scholar] [CrossRef]
  41. Maier, S. Changes in surface reflectance from wildfires on the Australian continent measured by MODIS. Int. J. Remote Sens. 2010, 31, 3161–3176. [Google Scholar] [CrossRef]
  42. Katagis, T.; Gitas, I.Z.; Mitri, G.H. An Object-Based Approach for Fire History Reconstruction by Using Three Generations of Landsat Sensors. Remote Sens. 2014, 6, 5480–5496. [Google Scholar] [CrossRef] [Green Version]
  43. Stroppiana, D.; Azar, R.; Calò, F.; Pepe, A.; Imperatore, P.; Boschetti, M.; Silva, J.M.N.; Brivio, P.A.; Lanari, R. Integration of Optical and SAR Data for Burned Area Mapping in Mediterranean Regions. Remote Sens. 2015, 7, 1320–1345. [Google Scholar] [CrossRef] [Green Version]
  44. Li, Z.; Kaufman, Y.J.; Ichoku, C.; Fraser, R.; Trishchenke, A.; Giglio, L.; Jin, J.; Yu, X. A review of AVHRR-based active fire detection algorithms: Principles, limitations, and recommendations. In Global and Regional Vegetation Fire Monitoring from Space. Planning a Coordinated and International Effort; Ahern, F.J., Goldammer, J.G., Justice, C.O., Eds.; SPB Academic: The Hague, The Netherlands, 2001; pp. 199–255. [Google Scholar]
  45. Adams, R.; Bischof, L. Seeded region growing. IEEE Trans. Pattern Anal. Mach. Intell. 1994, 16, 641–647. [Google Scholar] [CrossRef]
  46. Vincent, L.; Soille, P. Watersheds in digital spaces: An efficient algorithm based on immersion simulations. IEEE Trans. Pattern Anal. Mach. Intell. 1991, 13, 583–598. [Google Scholar] [CrossRef] [Green Version]
  47. Bastarrika, A.; Alvarado, M.; Artano, K.; Martinez, M.P.; Mesanza, A.; Torre, L.; Ramo, R.; Chuvieco, E. BAMS: A Tool for supervised burned area mapping using Landsat data. Remote Sens. 2014, 6, 12360–12380. [Google Scholar] [CrossRef] [Green Version]
  48. USGS. Product Guide. LANDSAT 4-7 Surface Reflectance (LEDAPS) Product. 2018. Available online: https://landsat.usgs.gov/sites/default/files/documents/ledaps_product_guide.pdf (accessed on 23 February 2018).
  49. USGS. Product Guide. LANDSAT 8 Surface Reflectance (LASRC) Product. 2017. Available online: https://landsat.usgs.gov/sites/default/files/documents/lasrc_product_guide.pdf (accessed on 23 February 2018).
  50. ESA. S2 MPC L2A Product Definition Document. S2-PDGS-MPC-L2A-PDD-V14.2. 2017. Available online: http://step.esa.int/thirdparties/sen2cor/2.4.0/Sen2Cor_240_Documenation_PDF/S2-PDGS-MPC-L2A-PDD-V14.2_V4.6.pdf (accessed on 23 February 2018).
  51. Kalimeris, A.; Founda, D.; Giannakopoulos, C.; Pierros, F. Long-term precipitation variability in the Ionian Islands, Greece (Central Mediterranean): Climatic signal analysis and future projections. Theor. Appl. Climatol. 2012, 109, 51–72. [Google Scholar] [CrossRef]
  52. Samet, H. The Quadtree and Related Hierarchical Data Structures. ACM Comput. Surv. 1984, 16, 187–260. [Google Scholar] [CrossRef] [Green Version]
  53. Baatz, M.; Schäpe, A. Object-Oriented and Multi-Scale Image Analysis in Semantic Networks. In Proceedings of the 2nd International Symposium on Operationalization of Remote Sensing ITC, Enschede, The Netherlands, 16–20 August 1999. [Google Scholar]
  54. Woźniak, E.; Kofman, W.; Wajer, P.; Lewiński, S.; Nowakowski, A. The influence of filtration and decomposition window size on the threshold value and accuracy of land-cover classification of polarimetric SAR images. Int. J. Remote Sens. 2016, 37, 212–228. [Google Scholar] [CrossRef]
  55. Stehman, S.V. Impact of sample size allocation when using stratified random sampling to estimate accuracy and area of land-cover change. Remote Sens. Lett. 2012, 3, 111–120. [Google Scholar] [CrossRef]
  56. Congalton, R.G. A review of assessing the accuracy of classifications of remotely sensed data. Remote Sens. Environ. 1991, 37, 35–46. [Google Scholar] [CrossRef]
  57. Olofsson, P.; Foody, G.M.; Herold, M.; Stehman, S.V.; Woodcock, C.E.; Wulder, M.A. Good practices for estimating area and assessing accuracy of land change. Remote Sens. Environ. 2014, 148, 42–57. [Google Scholar] [CrossRef]
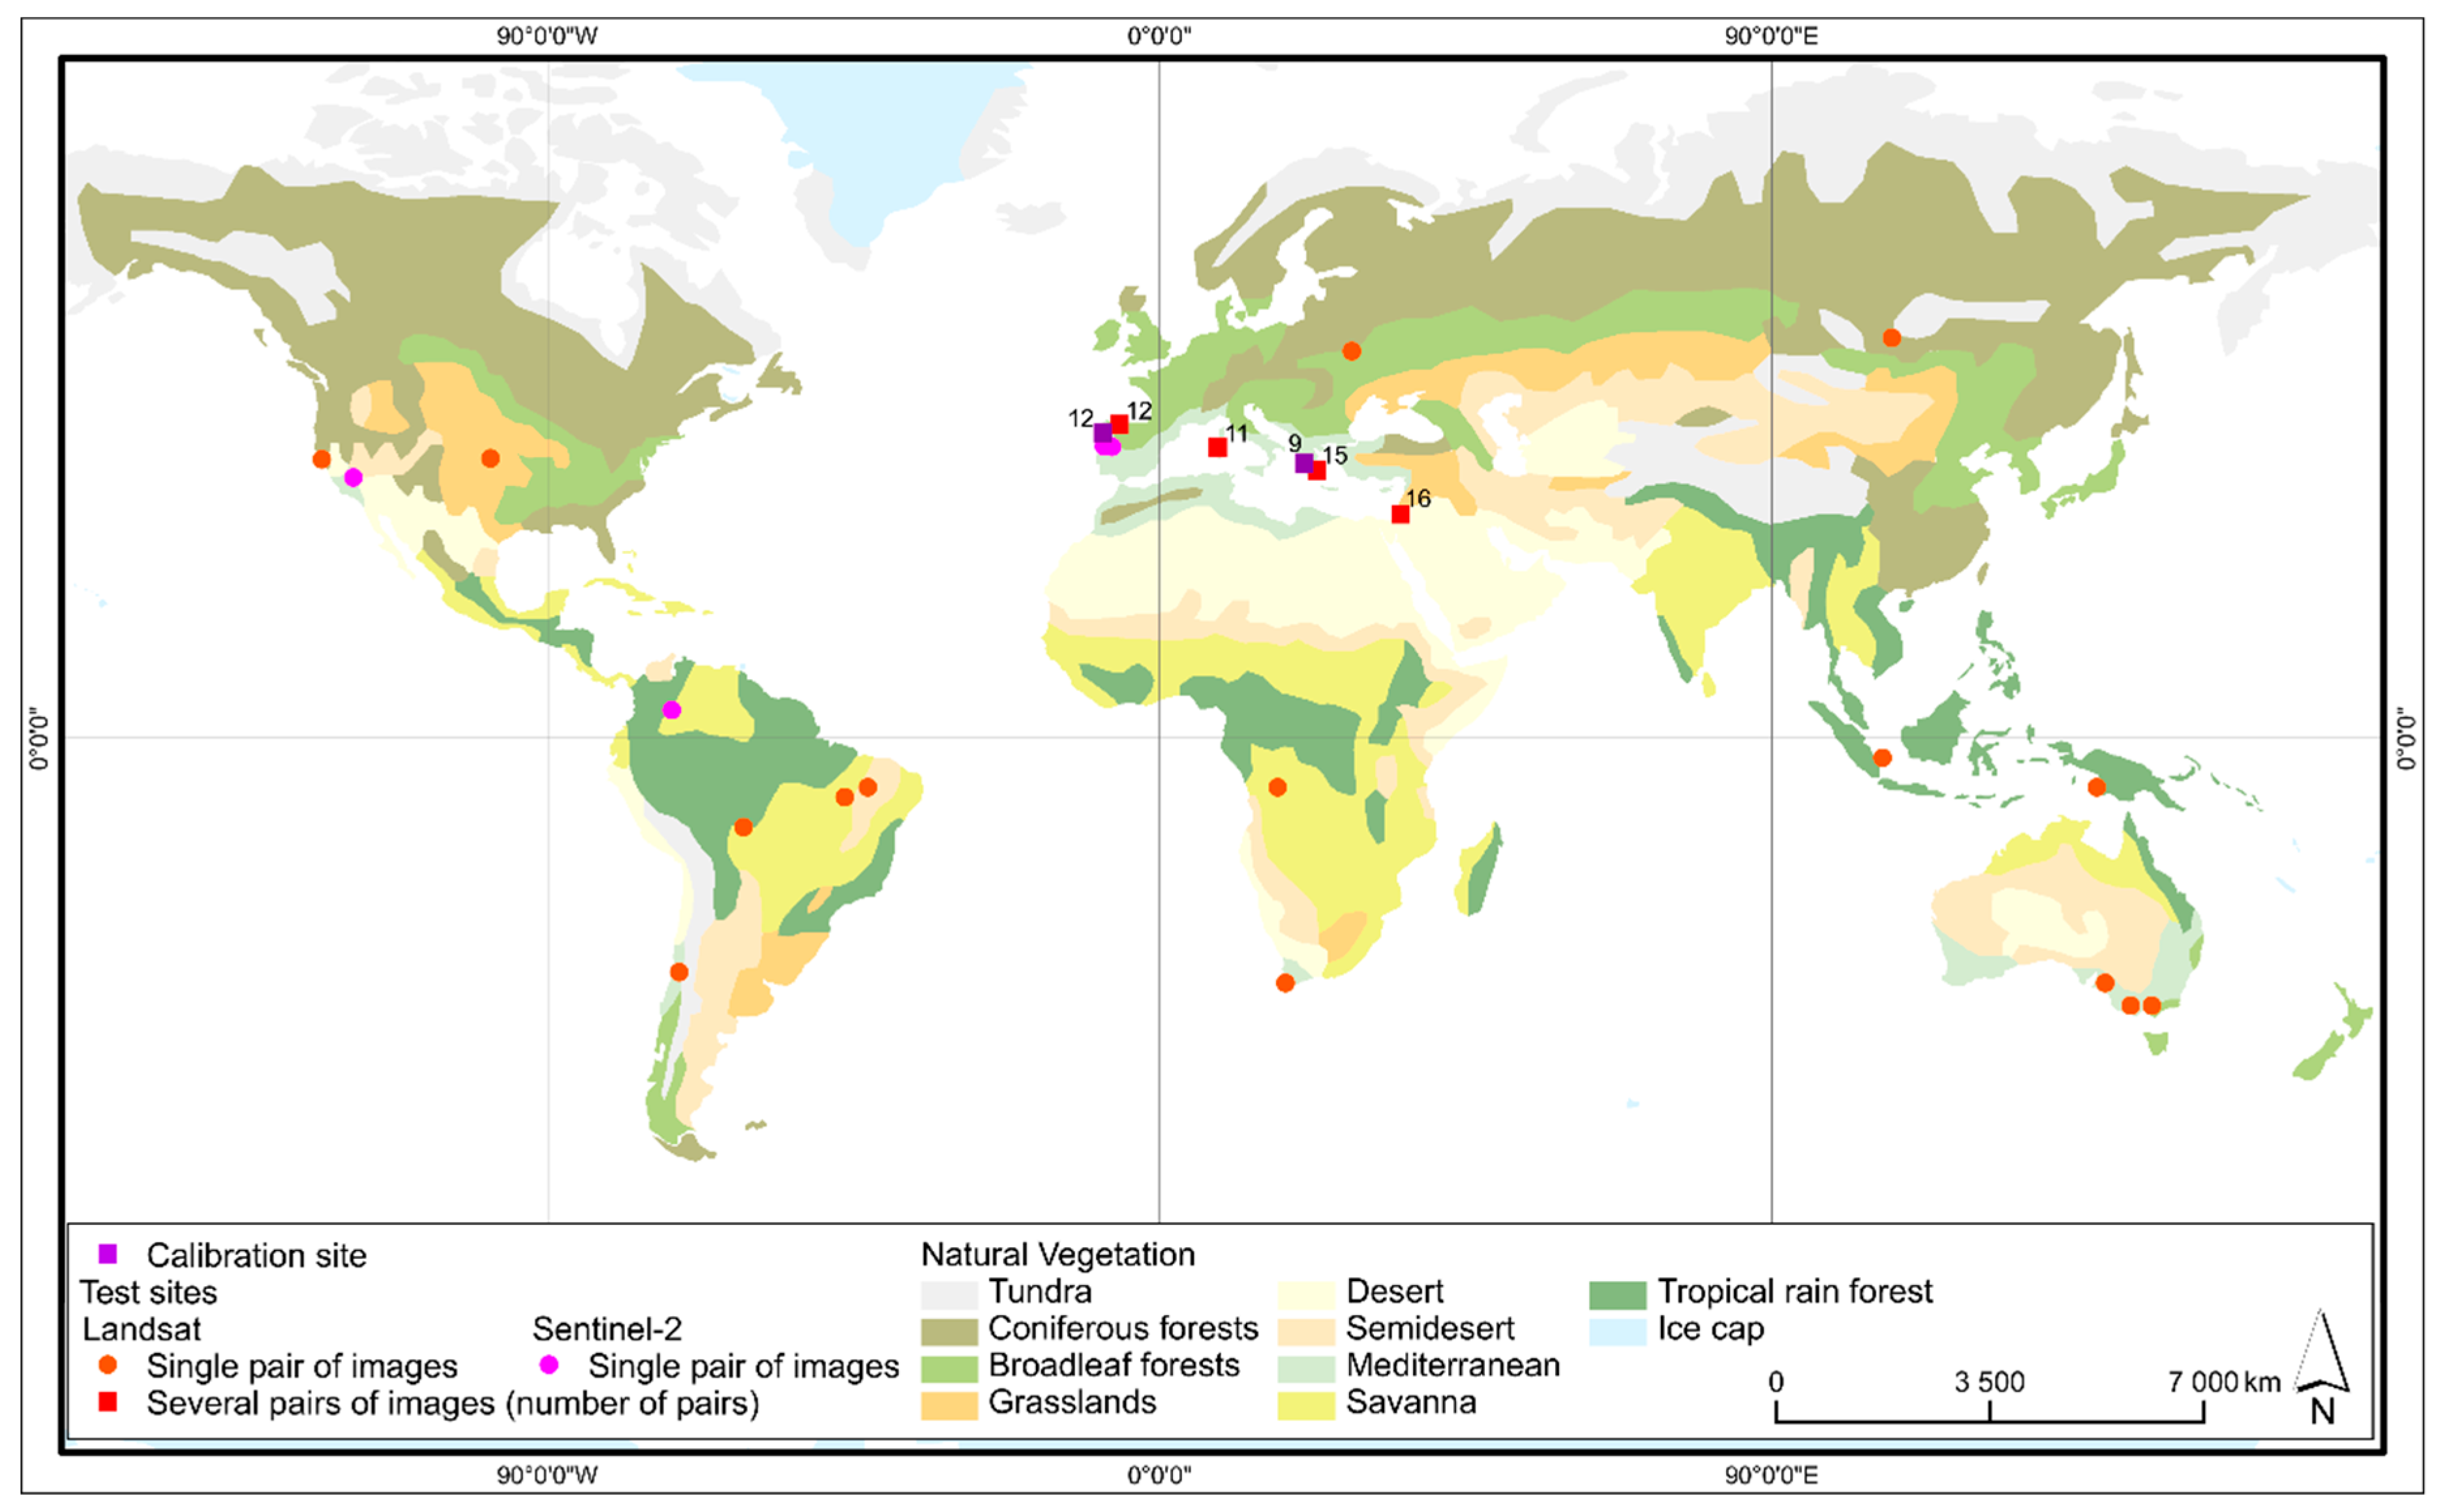
Figure 1. Distribution of calibration and test sites.
Remotesensing 11 02669 g001
Figure 2. Burnt area mapping workflow.
Remotesensing 11 02669 g002
Figure 3. The function to calculate threshold values.
Remotesensing 11 02669 g003
Figure 4. Examples of burnt area mapping in different geographic zones and vegetation types.
Remotesensing 11 02669 g004
Figure 5. Relationship between scene difference and threshold for burnt and unburnt areas delimitation.
Remotesensing 11 02669 g005
Table 1. Acquisition dates of pairs of Landsat images used for the algorithm development.
Path 185 Row 33Path 204 Row 31
Pre-Fire ImagePost-Fire ImagePre-Fire ImagePost-Fire Image
YearDay of YearYearDay of YearYearDay of YearYearDay of Year
198692198623620002482001250
1986204198623620031922003256
1999216199928020061202006216
2002176200230420071072007251
2003187200320320091122009288
2010190201023820101152010291
2011113201119320131072013251
2011193201124120131872013251
201318220132942014712014206
20161762016275
20171022017262
Table 2. Conditions used for core burnt area mapping,   μ o is a mean value of object (in the case of dNBR, dNIR, dSWIR1, dSWIR2 µo is the value of relative mean difference) and in the case of image bands R, G and NDVI index µo is the absolute mean value). T is the threshold calculated using the function.
Conditions Using Constant ThresholdsConditions Using Variable Thresholds (T) Derived from the Function
NDVIT2 μ o < 0.5 dNIR μ o T
dNBR μ o 100 %     μ o 110 % depending on mode of dNBR valuesdSWIR1 μ o T
dSWIR2 μ o T
RT2 μ o < T
GT2 μ o < T
Table 3. Confusion matrices for scenes from different geographic zones and vegetation types. Acquisition dates of pre- (T1) and post- (T2) fire images are given as: year/day of year.
Coniferous forest
(Russia T1: 2015/169, T2: 2015/233)
Semidesert
(Israel T1: 1986/095, T2: 1987/162)
BurntUnburnt BurntUnburnt
Burnt14,0831069Burnt39123
Unburnt174620,892Unburnt22776
User accuracy89.095.1User accuracy99.599.2
Producer accuracy92.992.3Producer accuracy94.499.9
Overall accuracy92.6Overall accuracy99.2
Broadleaf forest
(Spain T1: 1984/165, T2: 1985/119)
Savannah
(Angola T1: 2003/144, T2: 2004/155)
BurntUnburnt BurntUnburnt
Burnt154069Burnt10,8291939
Unburnt1142336Unburnt14230,162
User accuracy93.197.1User accuracy98.794.0
Producer accuracy95.795.3Producer accuracy84.899.5
Overall accuracy95.5Overall accuracy95.2
Grassland
(USA T1: 2016/003, T2:2016/099)
Tropical forest
(Indonesia T1: 2009/217, T2: 2009265)
BurntUnburnt BurntUnburnt
Burnt28,4471162Burnt3920
Unburnt44633,774Unburnt411079
User accuracy98.596.7User accuracy90.5100.0
Producer accuracy96.198.7Producer accuracy 100.0 96.3
Overall Accuracy97.5Overall accuracy 97.3
Mediterranean
(South Africa T1: 2014/115, T2: 2015/070)
Mediterranean / Sentinel-2
(Colombia T1: 2015/12/09, T2: 2016/01/19)
BurntUnburnt BurntUnburnt
Burnt84137Burnt6091155
Unburnt374682Unburnt52410,652
User accuracy95.899.2User accuracy92.198.6
Producer accuracy95.899.2Producer accuracy97.595.3
Overall accuracy98.7Overall accuracy96.1
Table 4. Confusion matrices for Sentinel-2 scenes. Acquisition dates of pre- (T1) and post- (T2) fire images are given.
Portugal (West)
(T1: 2017/07/14, T2: 2017/09/02)
Portugal (East)
(T1: 2017/07/14, T2: 2017/09/02)
California
(T1: 2017/07/11, T2: 2017/10/19)
BurntUnburnt BurntUnburnt BurntUnburnt
Burnt622333Burnt32,33063Burnt11,71058
Unburnt4210,409Unburnt17611,545Unburnt748568
User accuracy99.399.7User accuracy99.599.6User accuracy99.499.3
Producer accuracy99.599.6Producer accuracy99.898.5Producer accuracy99.599.1
Overall accuracy99.6Overall accuracy99.5Overall accuracy99.4