Article

Multi-Temporal Cliff Erosion Analysis Using Airborne Laser Scanning Surveys

by
Dagmara Zelaya Wziątek
1,
Paweł Terefenko
2,* and
Apoloniusz Kurylczyk
3
1
Faculty of Geodesy and Cartography, Warsaw University of Technology, 00661 Warsaw, Poland
2
Institute of Marine and Environmental Sciences, University of Szczecin, 70383 Szczecin, Poland
3
Institute of Spatial Management and Socio-Economic Geography, University of Szczecin, 70383 Szczecin, Poland
*
Author to whom correspondence should be addressed.
Remote Sens. 2019, 11(22), 2666; https://doi.org/10.3390/rs11222666
Submission received: 18 October 2019 / Revised: 12 November 2019 / Accepted: 13 November 2019 / Published: 14 November 2019
(This article belongs to the Special Issue Remote Sensing Applications in Coastal Environment)

Abstract

:
Rock cliffs are a significant component of world coastal zones. However, rocky coasts and factors contributing to their erosion have not received as much attention as soft cliffs. In this study, two rocky-cliff systems in the southern Baltic Sea were analyzed with Airborne Laser Scanners (ALS) to track changes in cliff morphology. The present contribution aimed to study the volumetric changes in cliff profiles, spatial distribution of erosion, and rate of cliff retreat corresponding to the cliff exposure and rock resistance of the Jasmund National Park chalk cliffs in Rugen, Germany. The study combined multi-temporal Light Detection and Ranging (LiDAR) data analyses, rock sampling, laboratory analyses of chemical and mechanical resistance, and along-shore wave power flux estimation. The spatial distribution of the active erosion areas appear to follow the cliff exposure variations; however, that trend is weaker for the sections of the coastline in which structural changes occurred. The rate of retreat for each cliff–beach profile, including the cliff crest, vertical cliff base, and cliff base with talus material, indicates that wave action is the dominant erosive force in areas in which the cliff was eroded quickly at equal rates along the cliff profile. However, the erosion proceeded with different rates in favor of cliff toe erosion. The effects of chemical and mechanical rock resistance are shown to be less prominent than the wave action owing to very small differences in the measured values, which proves the homogeneous structure of the cliff. The rock resistance did not follow the trends of cliff erosion revealed by volume changes during the period of analysis.

Graphical Abstract

1. Introduction

According to current estimates, 80% of the world’s coastlines is composed of cliffs [1]. Despite the significant area represented by rocky cliff coastlines, this topic is often neglected in scientific dissertations. In their work summarizing previous research of the coastal geomorphology and related topics, Naylor, Stephenson, and Trenhaile [1] revealed that only 8.8% of such research involves the study of rocky coasts. The majority of contemporary research focuses on sedimentary coasts including mostly beaches, considering the high importance from sociological and economical perspectives [2,3,4,5,6,7,8,9]. It is popularly believed that rocky cliffs are characterized by slow rates of erosion and are only moderately vulnerable to global sea level changes [1,10,11]. This aspect explains the superficial treatment of the problem of cliff erosion.
Faster rates of beach coastline erosion are undeniable; however, the consequences of this phenomenon are more predictable and are less catastrophic than those in the case of cliff erosion caused by mass movement. Thus, researchers agree that the process of cliff erosion is important. Numerous models of chalk and limestone cliff retreat have been presented by authors from all over the world. Their works indicate that the factors influencing erosion vary among study areas. For example, studies conducted on chalk cliffs in East Sussex in the United Kingdom have identified geology as the main factor controlling the location and scale of cliff erosion, whereas studies on chalk cliffs in Pas de Calais, France, suggest that cliff stability is more relevant than other factors in cliff erosion [12]. Another element considered is marine action, which in some cases is the main reason for cliff erosion [13,14]; in other cases, its influence is restricted to debris removal [15]. In addition, the effect of rainwater is noted for its significant influence. Furthermore, sub-aerial processes have also been found to be relevant in the cliff retreat process [12].
Despite efforts made to the describe cliff erosion mechanisms, the relationships among factors such as precipitation, geology, cliff stability, and sub-aerial processes are highly complex and have been inadequately explained thus far. An essential question remains: Which of these factors is critical in initiating erosion processes? If a cliff is composed of hard, dolomitized, and compressed chalk, heavy rain will not be as erosive as high-power waves. Conversely, soft chalk can be easily saturated by rainwater and thus erodes at a high rate without the influence of other factors.
Identification of the factors influencing cliff erosion is a challenge owing to the high complexity of this mechanism. Even when applying the available techniques, this task remains very difficult and demands prolonged observation and correlation of many factors.
The use of high-accuracy three-dimensional (3D) spatial data is necessary for such sophisticated analysis. Tools and methods such as light detection and ranging (LiDAR), structure-from-motion (SfM) photogrammetry, or video imaging provide the quickest and most accurate and detailed data available for topographic analysis [16,17,18,19,20]. In the present study, a cliff system in Jasmund National Park in Rugen, Germany, located in the southern Baltic Sea, was monitored by using multi-temporal LiDAR data comparison. This method enabled us to track the annual cliff surface changes in these well-known, spectacular white chalk cliffs. On the basis of the gathered data, precise calculation of the rates of erosion and volumetric changes was performed, and ongoing processes were analyzed. The results, when incorporated with wave, hydrological, and geological data, provided an overview of interdependencies and influences of coastal erosion processes. However, LiDAR data are not free of errors. Thus, creation of a digital terrain model (DTM) with suitable accuracy is another challenge that demands data pre-processing. The vertical absolute accuracy of LiDAR surveys used for coastal analysis is generally about ± 0.15 m [21].
The analyzed part of this coast has experienced erosion since the Pleistocene era. However, a coastal monitoring program using an airborne LiDAR scanner has recently revealed intensification of these processes.
Therefore, the main objective of the present study was to identify the possible correspondence among cliff erosion rates, cliff exposure to wave action, and cliff rock resistance based on multi-temporal LiDAR data. These data, in addition to those of the volumetric changes along the cliff–beach profile, were used to produce final reproducible solutions for analyzing the relationship among the erosion rate on coastal cliffs and selected variables such as wave action, rock resistance, the hydrological regime, and geological structures.

2. Materials and Methods

2.1. Study Sites

Cliff erosion analysis was performed for a non-tidal basin of the Baltic Sea, a subdivision of the shallow Arkona Basin, bordered by Borholm, Falster, and Zealand islands. The analyzed cliff formations have long been the subject of widespread interest since they became part of Jasmund National Park in 1990. These formations are known worldwide for their distinctive, high, white chalk cliffs, with the highest occurring along the southern Baltic coastline [22]. In June 2011, the beach forest in Jasmund Park, which at only 30 km2 is the smallest German National Park, became part of the United Nations Educational, Scientific and Cultural Organization (UNESCO) World Heritage list.
In this region, Cretaceous chalk rock has formed steep cliffs that often exceed 100 m in height [23]. The highest position in this area reaches 118 m above sea level and it is located in Königsstuhl near Sassnitz. The elevated chalk cliffs are separated by lower, gently dipping parts consisting mostly of Pleistocene deposits [23].
The morphology of the cliffs varies along the coastline and depends on the predominant building material. The upper part of the cliffs forms a slightly concave, smooth slope with an almost vertical profile. The majority of the chalk cliffs contain “apron fans of chalk rubble” at the base [22]; this talus was produced by erosion processes. In the other parts of the cliffs, where the sea surface and the waves interact with the cliff, wave-cut notches are a visible indicator of sea erosion. Beaches of Jasmund National Park are covered by flint pebbles of different sizes the have formed shingle beaches (Figure 1).
For this research, two study areas were chosen for analysis. The first located in the central part of the national park coastline on the east-facing cliff, and the second is situated at the southern end of the park close to the city of Sassnitz, with cliffs facing southeast.
Selection of test sites with different coastline orientations was crucial for this study. The power of the waves reaching the cliffs changes depending on mean angle of the study area. Therefore, to analyze the influence of waves on cliff erosion, the power of waves reaching the cliffs in both study areas should be adjusted to reflect local conditions. Because wave power depends on the angle between the refracted wave and the shoreline, the two study areas with different orientations were assumed to receive different levels of wave power. The two selected study areas are located approximately 4 km apart.
The cliffs of both study sites dip steeply seaward. The cliffs are lower and the slope is moderate only on the sides of the cliffs, where bluffs occur. The top parts of these cliffs are covered by Pleistocene glacial sediments. The beach clasts in both study areas consist of flint pebbles originating from flint veins in the chalk rocks.
Study Area 1 is located on the Kieler shore (Kieler Ufer). This part of the cliff, as well as the neighboring area to the north (Kollicer Ufer), have been classified as highly prone to complex and large-scale cliff failure according to the kinematic rock slope evaluation of Grunther and others [23]. In particular, the northern part of the cliff qualifies as having very high/high susceptibility to chalk rock failure. The northern and southern parts of the chalk cliff in this area border layers of glacial sediments; the presence of this material corresponds with landslides occurring in the northern part of the study area after 2000 and in the part bordering the study area to the south before that year. In the middle part of the analyzed area, the chalk cliff experienced mass failure in 1994.
Study Area 2 is located on the Gakower coastline (Gakower Ufer). Although the analyzed cliff did not experience rock failure, landslides of the glacial sediments have occurred in neighboring areas to the north and south before 2000. Small-scale landslides occurring after that year have been recorded only in one part of the southern cliff side. The central part of study area has been characterized as having moderate and low susceptibility to rock failure [23].

2.2. Data

Recent technical developments have enabled the broad use of new remote sensing techniques such as Light Detection and Ranging (LiDAR) in topographic survey and coastal process monitoring [24,25,26].
In the case of cliff areas, airborne LiDAR surveys have one important advantage such that laser scanning can be performed from the seaside. This enables collection of data from positions that were previously inaccessible when using terrestrial LiDAR and traditional methods. This enables much more flexibility and allows for the collection of data with greatly expanded coverage. However, the data accuracy is usually lower owing to the very high laser beam incident angle; therefore, this method does not always enable sufficient data collection, particularly from slanted surfaces. This problem is also associated with the high-plain altitude: to access data with high vertical accuracy with all notch concavity penetrated, the airplane equipped with the LiDAR instrument must fly at very low altitudes and almost perpendicular to the cliff.
The data used in this study cover two airborne LiDAR campaigns. The first was performed in April 2007 as part of a Federal Institute for Geosciences and Natural Resources (BGR) project in which a 3D Optech ALTM3100 laser scanner was used to scan the area of Jasmund National Park. Data with a horizontal point distribution of 0.5 m were obtained during 10 fly routes with flight strip swath widths of about 9 km × 4.5 km. The resulting point cloud of the scanned area comprised 12.1 million points. The data were divided into sub-areas of 1 km × 1 km in extent and were saved as separate files. The average point density for the coastline area was equal 2.2 points per m2, and the average point resolution was 0.67 m.
The second scanning campaign was performed in April 2012 by the National Board of Agriculture and Environment of Central Mecklenburg (STALUMM) Coastal Group Department. The main purpose of this LiDAR data collection was to create coastal and river flood simulation and coastal hazard maps. Many flight routes were performed that sometimes covered the same area two or three times. As a result, the data density varied between 1 and 25 points per m2.
For the purpose of this work, only the data from the coastline were used. Average point density equals 24.5 points per m2. Average point resolution equals 0.2 m. The property of signal reflection enabled categorizing, separating, and filtering out points representing terrain surface and overlying points representing buildings or vegetation. The primary returns, including the intermediate and first of many returns, represent vegetation, whereas the secondary returns, including the last returns, correspond to the ground surface. Single point returns were also categorized as primary returns; however, they were considered as a bare earth because their high return signal intensity resulted in small error. It should be noted that the signal intensity and time of return is only one of many available methods used for data classification and further filtration. Depending on concepts and research objectives, data filters can be based on the morphology, progressive densification, surface, or segmentation [27].
The wave data used in the present study were obtained from the Federal Maritime and Hydrographic Agency of Germany (Bundesamt für Seeschifffahrt und Hydrographie, BSH) as a part of the Western Baltic Sea Monitoring Program (MARNET). The records of the wave parameters were obtained from the station Arkona Becken, located at a depth of 45 m at 54°53′ N and 13°52′ E. The station is equipped with water quality sensors to measure salinity, temperature, and radioactivity; water movement sensors to detect wave height, wave periods, wave direction, and current; and meteorological sensors to measure temperature, wind speed, and wind direction.
Data of significant wave height, wave period, and wave mean propagation direction were provided for the period corresponding to the period in which the LiDAR data were obtained: 1 January 2007–31 December 2012. The wave data were recorded hourly. The continuity of the data was disturbed only on a few occasions.
The study area inventory revealed the presence of objects that change cliff morphology and could influence cliff erosion. Two types of obstacles were identified: log pilings located close to the coastline on the sea side and fallen trees placed on the beach toe close to the coastline. These can be classified as major breakwater structures.
Two locations with fallen trees were identified in the first study test area. Trees most likely grew on the cliff tableland and then fell to the beach after cliff mass movement. Greater accumulation of the trees was observed in the southern part of the study area, where they were situated across the beach (Figure 2a). In the second area, a fallen tree was located on the beach toe parallel to the cliff (Figure 2b). This single tree acted as cliff protection by shielding talus and beach material from erosion. It is not clear whether the position of the tree is a result of natural processes or human intervention. The location of Study Area 1 in the national park should exclude any type of human intervention in the natural environment. However, wooden log pilings were found in front of the coastline (Figure 3). This small, definitely anthropogenic breakwater structure is commonly used for cliff protection. Any type of obstacle located in front of a cliff decreases the wave power, which in turn decreases the erosive influence of the wave. Thus, the presence of these structures is expected to significantly affect the results. Presumably, the location of the city of Sassnitz and the considerable tourist traffic on the beach area justify the presence of this structure. It is likely that, without protection, narrow beach sections 3–10 m in width would disappear completely, which would make the area less attractive for tourism.

2.3. Methodology

Due to representation of the surface and features by LiDAR raw data as a point cloud, “hydrographically coherent surfaces” such as river banks or shorelines are not accurately represented [28]. To provide accurate understanding of the data, a good digital elevation model (DEM) and analysis are essential for recognizing morphologically important features [29]. Depending on the study objective, four major line indicators are extracted from LiDAR-derived DEMs: shorelines, cliff bases with talus, vertical cliffs without talus, and cliff crests.
In both datasets, the shoreline was created on the basis of an isoline 0.3 m above sea level. Owing to the low slope and almost constant values below 0.3 m, this value is considered to be a practical border for the division of beach and sea level data. However, the 0.3 m isoline indicates the presence of debris and large stones on some parts of the coast, resulting in almost closed curves. For these areas, the isoline was manually smoothed. Supervised changes were made to hill shade maps in which two rasters were created: the first had an azimuth of 315° and an attitude of 45°, and the second had an azimuth and attitude both equal to 45°.
For sea level recognition, the aspect raster was used as the water surface because the presence of waves and ripples reveal significant aspect changes in small areas. Each wave or ripple consists of one crest and two depressions (wave troughs) that divide the wave surface aspect in at least two different directions. Therefore, it was easy to distinguish the water surface from the smother surface of the beach, which has smaller aspect changes, or even from single waves.
The process of identifying the cliff base line was more challenging than that used to distinguish the shoreline. Numerous studies on cliffs assume manual delineation of the cliff baseline by relying mainly on aerial photographs, topographic maps, and in situ surveys [30,31,32,33]. Some examples of automatic delineation were reported by Palaseanu-Lovejoy and others [34], who used generalized coastal shoreline vectors, and by Terefenko and others [33], who considered a simplified methodology of rapid changes in altitude. In our work, cliff base line evaluation was done based on slope and hill shade analysis. The slopes of cliffs are greater than those of beaches; therefore, areas adjacent to the coastline showing sudden and significant changes in the slope were classified as the base of the cliff. However, in some parts of a cliff, talus material concentrated in front on the cliff toe changes the morphology by smoothing the slope close to the beach. These areas are recognized in LiDAR data as characteristic cone embankments, sometimes with the flat top surfaces showing a step-like shape. On parts of a cliff containing obvious talus material, a second break line referred to as a cliff base with talus, with an azimuth of 315° and a horizon of 44°, was created on the basis of the slope and hill shade map. To ensure the presence of cone or step-like talus, additional profiles of the cliff were created for problematic areas. If the profiles indicated the presence of this form, a second break line was created. Moreover, evaluation of the talus material for the dataset from 2012 is supported by notes from field work and onsite photo documentation. The presence of this talus material at the base of a cliff is not guaranteed or continuous. Areas in which the beach is separated from the cliff’s surface by a sudden and high slope were identified by creating a third break line known as a vertical cliff base.
Owing to the relatively high resistance of the rock-building chalk cliffs in Jasmund National Park, vertical cliffs forming steep surfaces are easily recognized. In the case of a cliff crest, the same technique as that used in creating the second and third break lines was employed, in which the cliff rest border was determined in areas of high steepness. The tableland close to the cliff is flat, which facilitates recognition even without comparison with a hillshade raster. Mapping the cliff crest and its migration over time is one of the most common methodologies used for investigating cliff recession with both manual hand-digitized procedures [35] and automatic extraction [34].
Finally, to explore the changes in the entire cliff system that occurred between LiDAR surveys, line indicator migration and volumetric changes were analyzed. The total volume of eroded material was calculated on the basis of the indicated differences between surveys.
The average values of cliff recession were calculated on the basis of differences in the x direction (in meters) between two mean center points, where one line represents one feature in both datasets. The mean center point identifies the geographic center of the line based on average x and y values and thus is assumed to effectively represent the average line indicator location.
The differences in distance between two central points on each line indicator reveal the shift distance. The results indicate the total shift per analyzed time period of six years and as the average value of line shift in meters per year.
The wave capacity for eroding a cliff depends on the power of the wave action on the cliff surface. The energy and power of waves depend on the wave incident angle, in which a smaller angle is related to higher power in the wave reaching the cliff. This relation among wave erosion capacity, its power, and its incident angle is assumed to be an indicator of cliff exposure. The calculation of cliff exposure to wave action consists of four major phases: (a) calculation of the deep water wave parameters based on data from buoys; (b) calculation of the wave parameters for the near-shore location, at 5 m in depth; (c) calculation of the cliff exposure based on the wave refraction angle; and (d) calculation of the total wave power for a wave acting on 1 m of cliff, measured in watts.
The height and direction of refracted wave propagation are functions of the propagation angle, depth, height, and period of wave initiation for offshore wave. Following this relation, the wave refraction and height for near-shore conditions were calculated using offshore wave data calculated for waves affecting the shoreline. The calculation was performed using MATLAB software including equations for wave refraction and height modification derived from the Coastal Engineering Manual of the U.S. Army Corps of Engineers [36].
For evaluating the offshore wave parameters affecting the Jasmund National Park coastline, a wind rose for the wave period (Tp) and wave significant height (Hs) was created. The final wave parameters were calculated only for waves with significant Tp and Hs that affect the coastline.
After determining the offshore wave parameters, including Tp, Hs, and wave angle oriented to the coastline calculated for each coastline segment, it is possible to calculate the refraction of the wave at the 5 m depth by using Snell’s law [36]. The height of the near shore wave was calculated for each part of the coast line based on Equation (1), where Ho is offshore wave height, Ks is shoaling coefficient, and Kr refraction coefficient.
H n e a r s h o r e = H o   K s   K r  
Wave refraction depends on offshore wave parameters as well as the coastline orientation. Therefore, the wave refraction angle will change along the coastline depending on its angle. The phenomenon of wave refraction angle change according to variation in the mean shoreline angle for both study areas is illustrated in Figure 4. Even with the same parameters or offshore wave, the wave angle after refraction at Study Area 1 was different from that at Study Area 2.
The wave power was then calculated based on the results of wave refraction and near-shore wave height. This parameter is related to the wave energy and wave celerity for the wave group and wave incident angle.
The cliff exposure affected by wave action was evaluated according to the wattage of the wave acting on 1 m of the cliff, where greater power is related to more cliff exposure. As a result, five classes of wave exposure were identified using equal intervals between maximum and minimum observed values, as presented in Table 1.
Finally, to rate the chemical and mechanical resistance against the wave action creating mechanical and chemical erosion, rock samples were collected and analyzed. The content of the calcium carbonate (CaCO3) in the sample was used to evaluate of the rock’s chemical resistance: The rock’s resistance decreases with an increase in CaCO3. For this analysis, the commonly used Scheibler calcimeter was employed owing to its ease of use and rapid results [37].
The analysis revealed that the studied cliff sections include dolomitized chalk. The presence of dolomite is known to significantly increase the strength of chalk [38]. Dolomite is formed from the carbonate rocks during the dolomitization process under high temperature and high pressure. As a result of this metamorphosis, rocks lose volume but gain mechanical resistance [39]. Even though calcite and dolomite have similar chemical and structural properties, calcite undergoes plastic deformation, while dolomite is “brittle and very strong” [38]. Cleven [38] proved that, although dolomite effectively increases the “structural capacity of the rock to compress and store”, the calcite-bearing network is still dominant.
Considering these factors, the dolomite content in the rock sample, calculated during the calcimeter test as part of the CaCO3, was assumed to be an indicator of the rock’s mechanical resistance.

3. Results and Discussion

3.1. Volumetric Changes

The calculations of total volume change between 2007 and 2012 revealed progressive erosion in both analyzed study areas. During this period, the total volume of the cliff measured in 2007 was decreased by 6% (form 322.566 to 303.470 m3) and 2.6% (from 638.649 to 621.801 m3) in Study Areas 1 and 2, respectively. Therefore, the rate of coastline erosion in Study Area 1, at 0.01 m3/year, was faster than in Study Area 2, at only 0.004 m3/year.
The areas of the highest cliff activity were evaluated based on the volume changes occurring between 2007 and 2012. In Study Area 1, the amount of material erosion in the upper part of the cliff averaged 2.2–9 m3/0.25 m2, and the maximum value was 36 m3/m2. In the middle and bottom parts, the average was 0.01–2.1 m3/0.25 m2, and the maximum value was 9.6 m3/m2. It is worth noting that, in addition to the differences in activity across the cliff profile, an increasing tendency for erosion was evident on the northern part of the cliff, whereas the southern part of the study area is characterized by smaller volume changes and thus lower cliff activity.
The cliff section in Study Area 2 revealed significant changes in the material volume at the bottom of the cliff, with average volume changes of 3.6–6.9 m3/0.25 m2 and a maximum erosion value of 27 m3/m2. In the upper part of the cliff, only small changes in volume were found, with averages of 0.01–2.8 m3/0.25 m2 and a maximum value of 11.2 m3/m2. In addition to the areas of high volume change in the lower part of the cliff, two other areas were shown to be significantly eroded. The first is the southern part of the cliff near the crest, and the second area is in the middle of the cliff in the northern part. This indicates susceptibility to linear erosion, which occurs at the bottom to the upper part of the cliff.
The erosion–accumulation ratio of the vertical cliff surface in both study areas indicates significant erosion. Slightly more than 98% and 92.5% of the cliff surface measured in 2007 had been eroded by 2012 in Study Areas 1 and 2, respectively. However, the progressive cliff erosion calculated in both study areas does not always correspond with the beach–talus development (Table 2).
According to the erosion–accumulation rate, accumulation was observed in Study Area 1, particularly in the beach and talus areas. Material accumulation on the cliff toe is a direct effect of mass movement of the upper part of the cliff. After a cliff collapse, the beach area is enriched by fresh debris material that provides additional cliff protection against wave erosion. In the case of Study Area 2, erosion was predominant across the entire cliff–beach profile.
Analysis of the recession rate, calculated separately for each part of the cliff, revealed that the cliff retreated at varying speeds across the profile (Table 3). In Study Area 1, the difference between the recession rates of the cliff crest and base was insignificant, at 0.004 m/year, and an increasing tendency was revealed in the top part. In Study Area 2, the opposite occurred such that the cliff toe retreated more quickly than the crest. In addition, the difference in erosion between the cliff top and toe was significant, at 0.46 m/year. These results are within the average values presented in various scientific works [40,41,42,43].

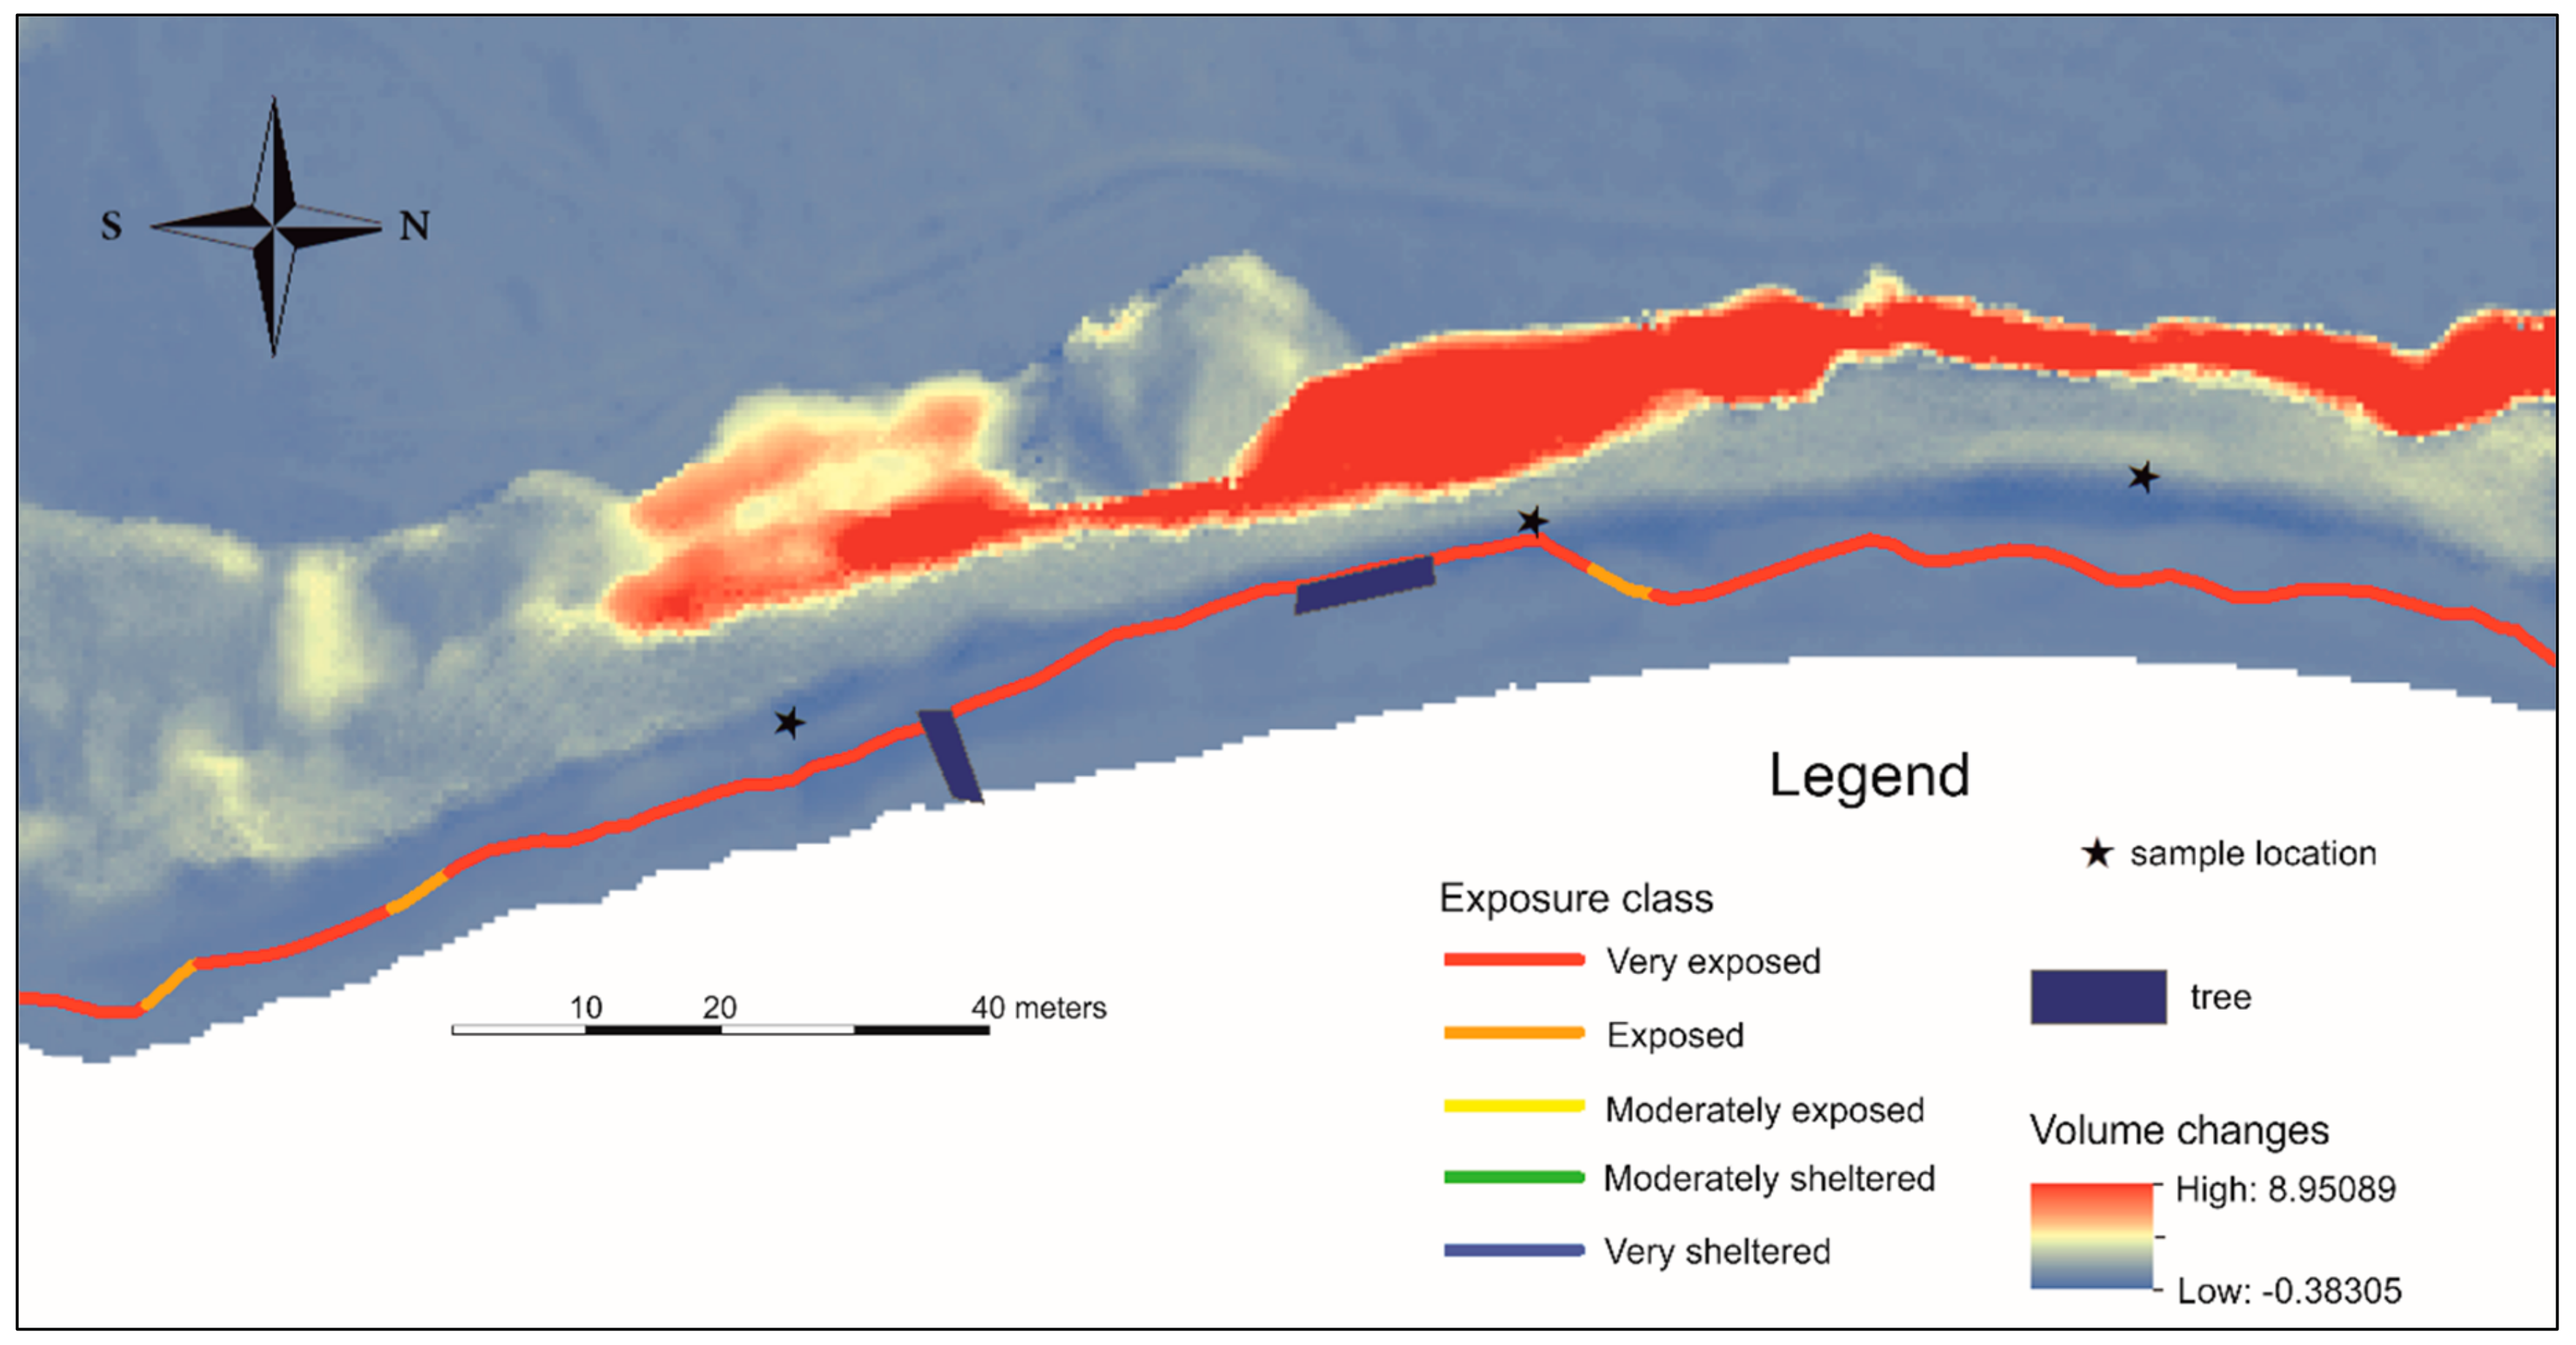
3.2. Exposure to Erosion

The analysis of the amount of cliff exposed to wave action revealed relatively high exposure in both study areas. The average values of wave power received by the cliffs in Study Areas 1 and 2 were 2665.6 and 2535 W/m, respectively. With such a high value of wave power acting per cliff unit, the influence of waves in the cliff recession processes is expected to be significant.
Study Area 1 has greater exposure to wave action than that in Study Area 2. In addition, the wave power amplitude in Study Area 2 is roughly three times smaller than in Study Area 1, with values of 1601.5 and 521.1 W/m, respectively. This means that the coastline of Study Area 2 is more diverse, and the refracted waves approach it from different directions with varied power. Finally, the cliff parts of Study Area 1 were classified as exposed and highly exposed to wave action (Figure 5), whereas those in Study Area 2 included all classes, from sheltered to very exposed.

3.3. Rock Resistance

The chemical resistance of the cliff in Study Area 1 decreases from south to north, although the largest variance between measured values was relatively small, at 8%. This result confirms a homogeneous chalk structure with variations in CaCO3 content occurring along the cliff.
In Study Area 2, the resistance increases along the cliff from southwest to northeast. However, an extremely high CaCO3 value in one of the samples, at 99%, significantly influenced the trend. Even though the fluctuations in CaCO3 content in the cliff indicate geological differences, the difference between the maximum and minimum content was only 5%. Therefore, the cliff is assumed to be homogeneous.
The measurements of mechanical rock resistance revealed large differences between both study sides. The cliff in Study Area 1 is composed mostly of pure chalk with a high CaCO3 content and no dolomitization and thus has low resistance to mechanical wave action. Only one cliff part, located in the northern area, revealed the presence of dolomite and is considered to be moderately resistant. The cliff in Study Area 2 is classified as being highly resistant to mechanical action, designated as Class 3, with an average value of 0.62% dolomite content and a northward trend for decreased resistance.

3.4. Correspondence to Morphological Changes

As described above, material accumulation in the beach area is explained by mass movement. However, in the analyzed study areas, slight accumulation was also noticed along the vertical cliff surface. The amount of accumulated material is insignificant and can be explained by the presence of vegetation, particularly near the cliff crest, and material movement along the structural breaks.
This phenomenon is clearly visible in Study Area 2. Large amounts of erosion on the upper part of the cliff were observed in correspondence with changes in the geomorphological structure identified in the same area by Niemeyer and others [44]. These changes structure clearly proceeded downslope during the analysis period, causing significant erosion as well as accumulation in specific parts. In addition, the linear orientation of the high cliff activity and its location over the middle part of the cliff profile in this study area most likely corresponds to a structural break. However, only erosion was observed in this case.
Owing to the small changes in wave power amplitude occurring along the coastline of Study Area 1, most of the cliff sides were classified as very exposed and exposed. The variability of the exposure is very small; thus, it can be assumed that the waves acting on the cliff were similar for all parts of Study Area 1 and had very high intensity. Analysis of the retreat rate also indicated that no significant changes occurred along the cliff profile.
Study Area 1 is an example of a cliff retreat process caused mainly by wave action: high coastal exposure to wave action accelerates cliff erosion. When the cliff toe and beach are eroded, the cliff stability decreases until reaching a critical value, at which point sudden mass movement occurs. Debris material from the collapsed cliff enriches the talus and beach area and provides additional protection against wave erosion. However, owing to the high power of the waves, this material is again eroded and washed offshore by currents, which leaves the cliff vulnerable to erosion.
The higher degree of erosion on cliff crest than that on the base can be easily explained. First, the presence of accumulated material at the cliff base indicates the occurrence of a cliff collapse between 1997 and 2012. According to Gunther and others [23], toppling is the most common type of mass movement in Rugen. During this type of erosion, the top of the cliff experiences the greatest amount of material loss. The volume of the collapsed material can be so high that the material loss after a single mass movement event is greater than that caused by constant erosion occurring at the cliff base. As a result, the average recession rate of the cliff crest will have a higher value than the rate of ongoing cliff base erosion, particularly because it is also enriched by material from the cliff collapse.
In Study Area 2, the area of cliff exposure to wave action corresponds with the areas of greatest volume change between the analyzed years. Cliff sections composed predominantly of exposed and moderately exposed sections, as well as the section classified as sheltered, have not been significantly eroded. On the contrary, small accumulation was observed. Relatively small wave power reaching the cliff has been further reduced by breakwater structures. Presumably, the presence of pilings facilitates material accumulation.
Sections containing predominantly very exposed cliffs appeared to be eroded and showed the highest rate of erosion of all analyzed cliff profiles, at 0.57 m/year. Particularly strong cliff toe erosion is visible owing to the very high degree of cliff exposure to wave action. Erosion of the material on the vertical cliff surface was caused by the presence of structural features.
In Study Area 1, only parts of the area revealed trends of strong cliff erosion that do not correspond with exposure. Owing to the predominance of mostly exposed cliffs, erosion of the cliff toe is very low. The impact of the waves was additionally decreased by presence of pilings as wave-break structures. In this case, the observed erosion occurred on the upper part of the cliff and was caused by geomorphological changes descending in the structure.
The cliff in Study Area 1 has been categorized as moderately resistant to chemical erosion but not resistant to mechanical erosion. In this case, the downwearing process caused mostly by freshwater action is expected to be slower than the backwearing process resulting in erosion of the cliff toe by wave action. However, the volume changes indicate the exact opposite trend: the erosion is stronger at the cliff top than at the cliff base. Only the northern part of the cliff has high mechanical resistance and low chemical resistance, and the upper part of the cliff has become eroded. This result indicates no connection of the mechanical and chemical resistance to location of the active erosion areas across the cliff profile.
The chemical resistance in the cliff decreases in the northern direction. This trend agrees with the trend of increasing cliff erosion northward. Therefore, it can be assumed that waves are acting on the cliff and causing erosion by both mechanical action depending on the wave power and chemical reaction through dissolution.
Low chemical resistance and high mechanical resistance characterize the cliff in Study Area 2. According to the factors mentioned above, the cliff is expected to be eroded more quickly by the downwearing process at the cliff top than by the mechanical wave action at the cliff base. However, volume changes indicate the exact opposite trend: The erosion is stronger at the cliff bottom. As discussed above, mechanical and chemical rock resistance are not good indicators of downwearing/backwearing processes. In addition, variations in the chemical resistance along the coastline location do not indicate changes in the volume of eroded material. Unfortunately, all samples collected from Study Area 2 correspond only to the second sector of cliff exposure. This fact prevents correlation of cliff resistance and wave influence.

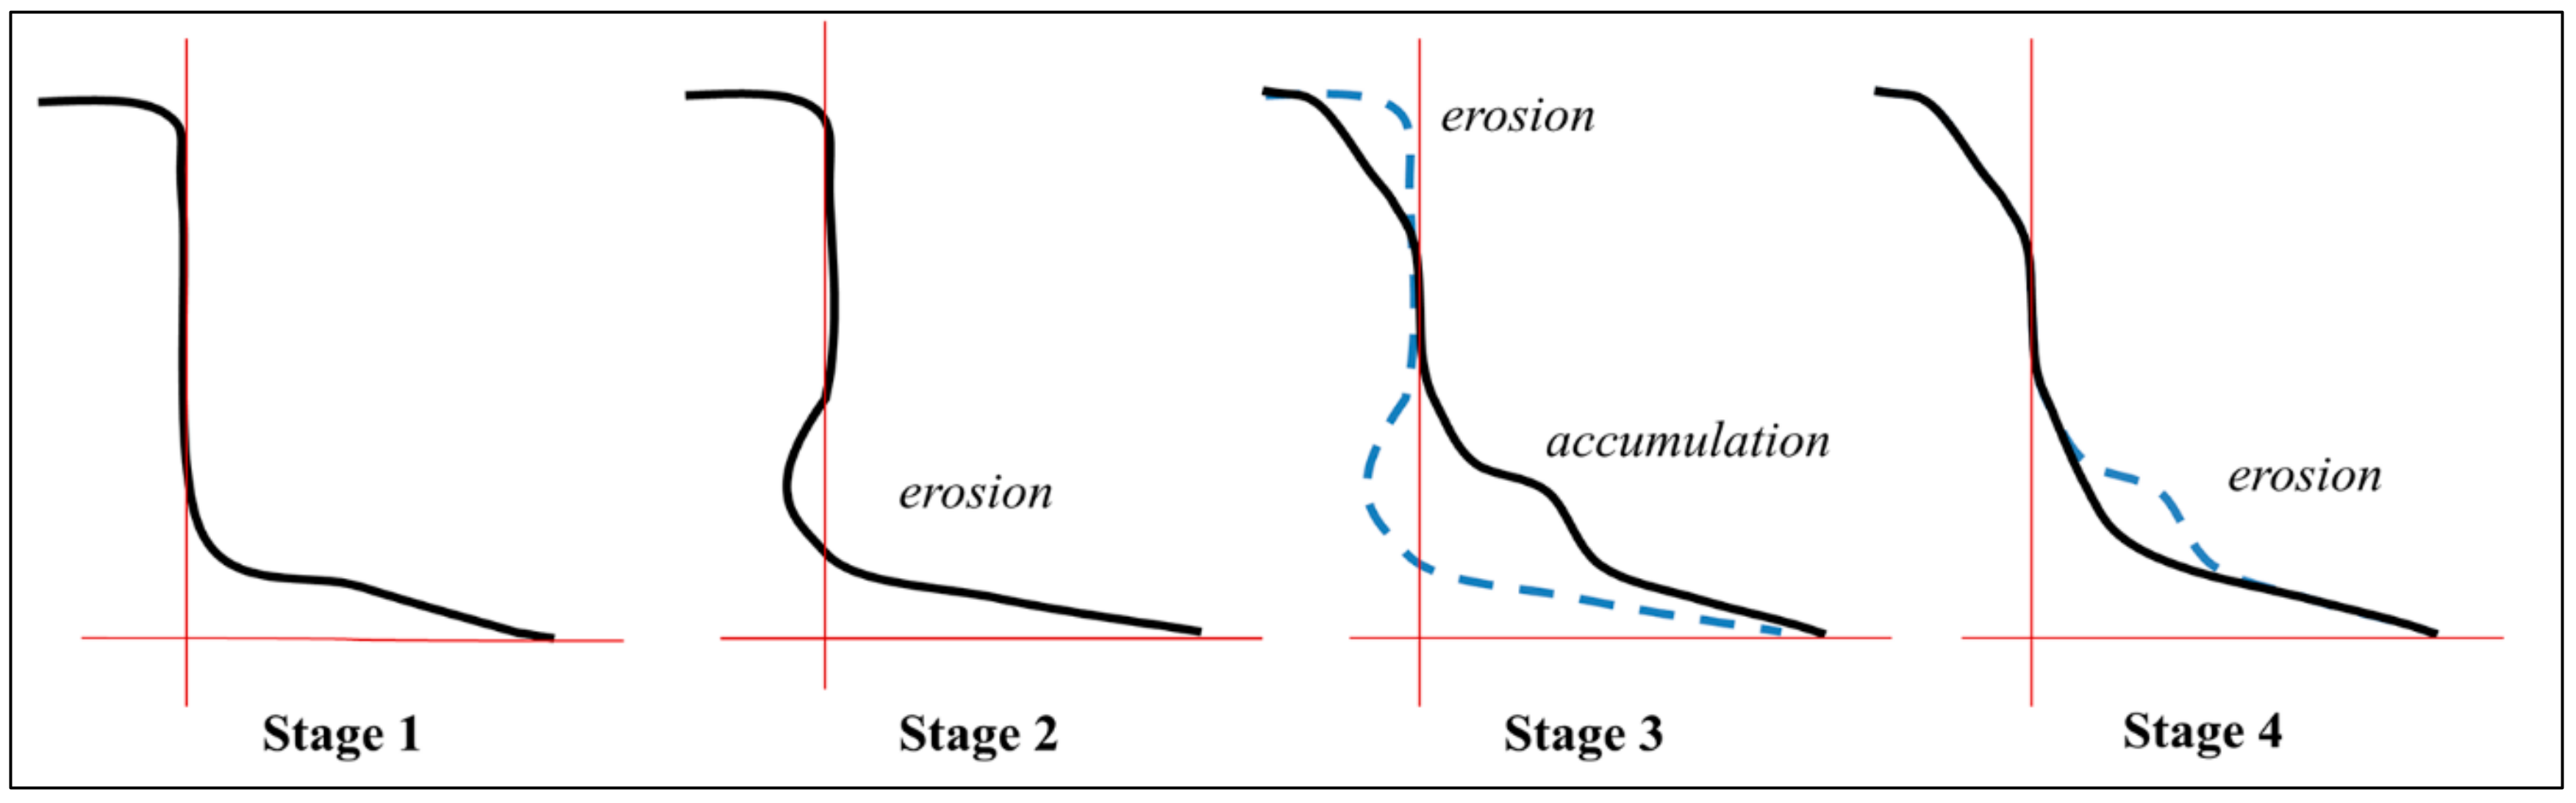
3.5. Model of the Cliff Retreat

Considering the high wave activity and its correspondence with active, eroded areas identified across the cliff–beach profile, a wave-induced cliff recession model with four stages is proposed to explain the mechanisms of cliff erosion of the Jasmund National Park coastline (Figure 6). Stage 1 occurs when the vertical cliff is in equilibrium. No accumulation occurs on the beach and no talus material appears. In this stage, waves act on the cliff surface directly, although only during storm and high-water level events. With the progression of cliff erosion, the cliff base experiences material loss (Stage 2). As a result, the cliff is undercut by wave-induced mechanical and chemical erosion, and the slope stability decreases. In this stage, the cliff base retreats more quickly than the still-balanced cliff crest. After reaching a critical value, the cliff collapses (Stage 3). From a geomorphometry perspective, the upper part of the cliff incurs the greatest loss of material. As a result, the top part of the cliff shows a high retreat rate. Material lost from the upper part of the cliff accumulates at the cliff base as talus material. Because the waves now act directly on the accumulated talus material, it provides the vertical cliff with additional protection from further erosion. In time, talus material is eroded (Stage 4) until it is completely removed or transported offshore, and the cliff returns to a vertical profile with slope equilibrium (Stage 1).
According to the described wave-induced cliff retreat model, Study Area 1 is at Stage 4. The significant material accumulation on the cliff base and the large material loss at the cliff crest indicate the occurrence of a recent cliff collapse, most likely by toppling. According to the model, the cliff should be in Stage 3; however, the erosion–accumulation ratio calculated for the talus–beach area indicates accumulation as the dominant process, with small amounts of erosion present. Finally, the amount of material accumulated on the talus–beach area is not equal to the amount of eroded material from the upper part of the cliff. This indicates that progressive erosion of the accumulated beach and talus material has already begun, and the cliff in Study Area 1 is at Stage 4.
According to the observed progressive erosion of the cliff base and thus the much faster retreat rate of the cliff bottom, the cliff in Study Area 2 is at Stage 2, characterized by progressive erosion. The lack of material accumulation at the bottom of the cliff can be explained by the low rate of retreat, at 0.004 m/year. The erosion process is not as fast as that in the case of Study Area 1; thus, mass movement likely occurs less often in this area. Therefore, the beach is not supplied by the material from the cliff.
Assuming the factors described above and considering such large wave power acting on the cliff, the changes along the cliff are expected to be similar for the wave influenced model of cliff erosion. However, in Study Area 1, although the cliff is affected the waves with similar power, a trend of high material erosion on the north part of the cliff is evident. Therefore, in addition to the predominant influence of the wave action indicated by similar retreat rates along the cliff profile, fast erosion rates, and high wave power, other influencing factors that facilitate erosion cannot be neglected. After incorporating the resistance of the cliff rocks, it appeared that the faster erosion in the northern sector was induced by lower chemical resistance. As a result, it is assumed that the wave action is causing mechanical and chemical erosion through hydraulic and dissolution processes, respectively. However, dissolution at the cliff bottom can also be an effect of freshwater action through which precipitation is concentrated between the flint pebbles accumulated on the beach or on concave parts of the talus material. Nevertheless, this contribution to cliff erosion in Study Area 1 must be further evaluated and was thus excluded in the final cliff retreat model developed in this study.
The spatial distribution of the cliff erosion in Study Area 1 appears to agree with the map of cliff vulnerability to collapse evaluated by Gunther and others [23], based on the kinematic cliff slope stability. According to their evaluation, the northern part of the cliff in Study Area 1 is particularly prone to cliff collapse. The present study shows that the northern section indeed experiences mass movement. The cliffs in Study Area 2 were also evaluated by Gunther and others [23] and were determined to have moderate to low susceptibility to cliff collapse. In the present study, the same cliff revealed a low rate of retreat, indicating a low degree of cliff exposure to wave action. Thus, the low wave erosion identified in the present study is reflected in the low susceptibility for cliff collapse [23].
The model results of cliff retreat caused by waves presented in this study combined with those of erosion susceptibility based on cliff stability reported by Gunther and others [23] have proved the causes and effects of the cliff erosion mechanism. Although the results of both models indicate areas prone to erosion, the topic is evaluated from different perspectives. The results demonstrate that cliff slope stability is an effect of cliff erosion caused primarily by wave action.

4. Conclusions

The number of studies on remote coastal morphology have increased in recent years and include high temporal resolution in terrestrial laser scanning, structure-from-motion photogrammetry, and/or video imaging survey. Our study demonstrates a clear advantage of using airborne LiDAR scanning for studies of rocky cliffs characterized by slow rates of erosion. By using this technique, several factors such as wave action and chemical and mechanical rock resistance can be correlated with the geomorphological responses of coastlines for long-term analysis. In addition, this method enables a conceptual model of cliff behavior to be developed.
The proposed model explains the general behavior of a cliff coast with respect to the most relevant variables of each segment along the profile. Wave action is classified as the primary force in cliff erosion. According to the differences in the rate of retreat based on features along a cliff–beach profile, the wave erosion-dominated cliff retreat model with the following four stages effectively represents the analyzed study areas in Jasmund National Park.
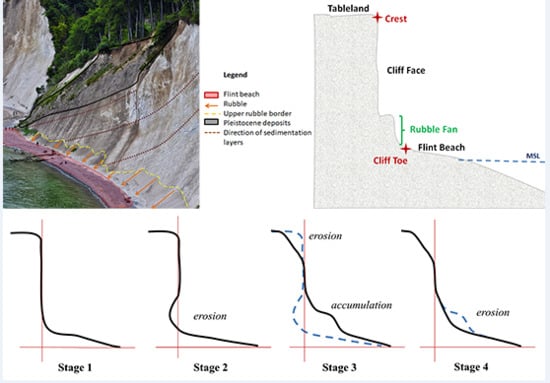
  • Stage 1: Cliff in equilibrium. The vertical cliff has balanced stability, and no talus or material is accumulated on the beach. Waves acts directly on the cliff surface.
  • Stage 2: Progressive erosion. Erosion of the cliff toe is caused by wave action. The cliff stability is decreased, and a high degree of erosion occurs along the cliff base.
  • Stage 3: Cliff collapse, most likely by toppling. The beach is enriched by material removed from the upper part of the cliff. High erosion of the cliff crest and accumulation on the cliff base occur.
  • Stage 4: Talus reduction: Waves act on talus and beach areas to remove accumulated material. Progressive erosion of the talus and beach material occurs until complete removal.
For both analyzed study areas, volume changes occurring in the cliff–beach profile between 2007 and 2012 show strong correlation to cliff exposure by wave action. The cliff of Study Area 1, which is highly exposed, retreats more quickly in comparison to the moderately exposed parts of the cliff located in Study Area 2. As a result, the rate of retreat of the cliff in Study Area 1 is 0.43 m/year, whereas that in Study Area 2 is only 0.29 m/year. Since 2007, 6% of the cliff in Study Area 1 and 2.6% of that in Study Area 2 have been eroded. All mentioned values of cliff retreat are within the retreat range typical for chalk cliffs, between 1 cm and 10 m per year.
The predominance of accumulation processes occurring on the beach–talus sector in Study Area 1 and the significant material loss from the cliff crest indicate the recent occurrence of a cliff collapse.
Although the cliff located in Study Area 2 is classified as moderately exposed, one analyzed part indicates a high degree of cliff erosion. This anomaly, which does not correspond to a high degree of cliff exposure, is attributed to changes in geomorphological structures that descend on the cliff, revealing the high importance of cliff structural breaks in cliff retreat–erosion processes.
The single trees present on the beach side were not found to be important obstacles for cliff erosion. These features are likely not large enough to cause a significantly reduction in the power of waves affecting the cliff. Only breakwater structures in the form of log pilings are likely to decrease the wave power and thus the degree of cliff erosion. However, owing to the ubiquitous presence of such obstacles along the shore in Study Area 2, its influence was difficult to evaluate.
Owing to the homogeneous geological structure of the analyzed cliffs and thus the very small differences in chemical and mechanical cliff resistance, this parameter did not closely follow the trends of cliff erosion revealed by volume changes during the period of study. Only one correlation was found in Study Area 1 between the chemical resistance of the cliff and the erosion trend; thus, the influence of chemical erosion caused by waves was proved.
The model results indicate that the cliffs in both study areas are in different stages of cliff erosion. Study Area 1 shows material accumulation on the cliff bottom and significant material loss in upper part of the cliff as well as the onset of talus material erosion; therefore, it in Stage 4: talus material reduction. However, the cliffs in Study Area 2 show progressive erosion on the cliff base; therefore, it is in Stage 2: progressive erosion.
It has been shown that wave erosion is the most active ongoing process triggering the retreat of the rocky coastline in Jasmund National Park. However, two additional factors cannot be neglected: both structural breaks and chemical erosion were found to play significant roles in the cliff retreat model.

Author Contributions

Conceptualization, D.Z.W.; Methodology, D.Z.W., P.T. and A.K.; Software, D.Z.W. and P.T.; Validation, D.Z.W. and P.T.; Formal analysis, D.Z.W.; Investigation, D.Z.W. and P.T.; Resources, D.Z.W.; Data curation, D.Z.W., P.T. and A.K.; Writing original draft Preparation, D.Z.W. and P.T.; Writing-Review & Editing, P.T.; Visualization, D.Z.W. and P.T.; Supervision, P.T.

Funding

This research received no external funding.

Conflicts of Interest

The authors declare no conflicts of interest.

References

  1. Naylor, L.A.; Stephenson, W.J.; Trenhaile, A.S. Rock coast geomorphology: Recent advances and future reasearch directions. Geomorphology 2009, 114, 3–11. [Google Scholar] [CrossRef]
  2. Furmańczyk, K.; Andrzejewski, P.; Benedyczak, R.; Bugajny, N.; Cieszyński, Ł.; Dudzińska-Nowak, J.; Giza, A.; Paprotny, D.; Terefenko, P.; Zawiślak, T. Recording of selected effects and hazards caused by current and expected storm events in the Baltic Sea coastal zone. J. Coast. Res. 2014, 70, 338–342. [Google Scholar] [CrossRef]
  3. Paprotny, D.; Andrzejewski, P.; Terefenko, P.; Furmańczyk, K. Application of Empirical Wave Run-Up Formulas to the Polish Baltic Sea Coast. PLoS ONE 2014, 9, e105437. [Google Scholar] [CrossRef] [PubMed]
  4. Paprotny, D.; Terefenko, P. New estimates of potential impacts of sea level rise and coastal floods in Poland. Nat. Hazards 2017, 85, 1249–1277. [Google Scholar] [CrossRef]
  5. Aniśkiewicz, P.; Łonyszyn, P.; Furmańczyk, K.; Terefenko, P. Application of Statistical Methods to Predict Beach Inundation at the Polish Baltic Sea Coast. In Interdisciplinary Approaches for Sustainable Development Goals: GeoPlanet: Earth and Plan; Zielinski, T., Sagan, I., Surosz, W., Eds.; Springer: Berlin, Germany, 2017; pp. 73–92. [Google Scholar]
  6. Deng, J.; Harff, J.; Zhang, W.; Schneider, R.; Dudzińska-Nowak, J.; Giza, A.; Terefenko, P.; Furmańczyk, K. The Dynamic Equilibrium Shore Model for the Reconstruction and Future Projection of Coastal Morphodynamics. In Coastline Changes of the Baltic Sea from South to East: Past and Future Projection; Harff, J., Furmańczyk, K., VonStorch, H., Eds.; Springer: Berlin, Germany, 2017; pp. 87–106. [Google Scholar]
  7. Novikova, A.; Belova, N.; Baranskaya, A.; Aleksyutina, D.; Maslakov, A.; Zelenin, E.; Shabanova, N.; Ogorodov, S. Dynamics of Permafrost Coasts of Baydaratskaya Bay (Kara Sea) Based on Multi-Temporal Remote Sensing Data. Remote Sens. 2018, 10, 1481. [Google Scholar] [CrossRef]
  8. Uścinowicz, G.; Szarafin, T. Short-term prognosis of development of barrier-type coasts (Southern Baltic Sea). Ocean Coast. Manag. 2018, 165, 258–267. [Google Scholar] [CrossRef]
  9. De Sanjosé Blasco, J.J.; Gómez-Lende, M.; Sánchez-Fernández, M.; Serrano-Cañadas, E. Monitoring Retreat of Coastal Sandy Systems Using Geomatics Techniques: Somo Beach (Cantabrian Coast, Spain, 1875–2017). Remote Sens. 2018, 10, 1500. [Google Scholar] [CrossRef]
  10. Andriani, G.F.; Walsh, N. Rocky coast geomorphology and erosional processes: A case study along the Murgia coastline South of Barri, Apulia—SE Italy. Geomorphology 2006, 87, 224–238. [Google Scholar] [CrossRef]
  11. Terefenko, P.; Zelaya Wziątek, D.; Dalyot, S.; Boski, T.; Pinheiro Lima-Filho, F. A High-Precision LiDAR-Based Method for Surveying and Classifying Coastal Notches. ISPRS Int. J. Geo-Inf. 2018, 7, 295. [Google Scholar] [CrossRef]
  12. Cherith, M.; Robinson, D. Chalk coast dynamics: Implications for understanding rock coast evolution. Earth Sci. Rev. 2011, 109, 63–73. [Google Scholar]
  13. Wziątek, D.; Vousdoukas, M.V.; Terefenko, P. Wave-cut notches along the Algarve coast, S. Portugal: Characteristics and formation mechanisms. J. Coast. Res. 2011, 64, 855–859. [Google Scholar]
  14. Terefenko, P.; Terefenko, O. Determining the role of exposure, wave force, and rock chemical resistance in marine notch development. J. Coast. Res. 2014, 70, 706–711. [Google Scholar] [CrossRef]
  15. Lageat, Y.; Henaff, A.; Costa, S. The retreat of the chalk cliffs of the Pays-de-Caux (France): Erosion processes and patterns. Z. Fur Geomorphol. 2006, 44, 183–197. [Google Scholar]
  16. Terefenko, P.; Giza, A.; Paprotny, D.; Kubicki, A.; Winowski, M. Cliff retreat induced by series of storms at Międzyzdroje (Poland). J. Coast. Res. 2018, 85, 181–185. [Google Scholar] [CrossRef]
  17. Fonstad, M.A.; Dietrich, J.T.; Courville, B.C.; Jensen, J.L.; Carbonneau, P.E. Topographic structure from motion: A new development in photogrammetric measurement. Earth Surf. Process Landf. 2013, 38, 421–430. [Google Scholar] [CrossRef]
  18. James, M.R.; Quinton, J.N. Ultra-rapid topographic surveying for complex environments: The hand-held mobile laser scanner (HMLS). Earth Surf. Process Landf. 2014, 39, 138–142. [Google Scholar] [CrossRef]
  19. Ružić, I.; Marović, I.; Benac, Č.; Ilić, S. Coastal cliff geometry derived from structure-from-motion photogrammetry at Stara Baška, Krk Island, Croatia. Geo Mar. Lett. 2014, 34, 555–565. [Google Scholar] [CrossRef]
  20. Uścinowicz, G.; Szarafin, T.; Jurys, L. Tracking cliff activity based on multi temporal digital terrain models–an example from the southern Baltic Sea coast. Baltica 2019, 32, 10–21. [Google Scholar]
  21. Sallenger, A.H., Jr.; Krabill, W.B.; Swift, R.N.; Brock, J.; List, J.; Hansen, M.; Holman, R.A.; Manizade, S.; Sontag, J.; Meredith, A.; et al. Evaluation of Airborne Topographic Lidar for Quantifying Beach Changes. J. Coast. Res. 2003, 19, 125–133. [Google Scholar]
  22. Schwarzen, K.; Horst, S. Book section: Germany. In Encyclopedia of the World’s Coastal Landforms; Bird, E.C.F., Ed.; Springer: Berlin, Germany, 2010; Volume 1. [Google Scholar]
  23. Gunther, A.; Thiel, C. Combined rock slope stability and shallow landslide susceptibility assessment of the Jasmund cliff area (Rugen Island, Germany). Nat. Hazard Earth Syst. 2009, 9, 687–698. [Google Scholar] [CrossRef]
  24. Buckley, S.J.; Howell, J.A.; Enge, H.D.; Kurz, T.H. Terrestrial laser scanning in geology: Data acquisition, processing and accuracy. J. Geol. Soc. 2008, 165, 625–638. [Google Scholar] [CrossRef]
  25. Vousdoukas, M.; Kirupakaramoorthy, T.; Oumeraci, H.; de la Torre, M.; Wübbold, F.; Wagner, B.; Schimmels, S. The role of combined laser scanning and video techniques in monitoring wave-by-wave swash zone processes. Coast. Eng. 2014, 83, 150–165. [Google Scholar] [CrossRef]
  26. Almeida, L.P.; Masselink, G.; Russell, P.E.; Davidson, M.A. Observations of gravel beach dynamics during high energy wave conditions using a laser scanner. Geomorphology 2015, 228, 15–27. [Google Scholar] [CrossRef]
  27. Korzeniowska, K.; Łącka, M. Generating DEM from LIDAR data-comparison of availabe software tools. Archives of Photogrammetry. Cartogr. Remote Sens. 2011, 22, 271–284. [Google Scholar]
  28. Campbell, J.B.; Wynne, R.H. Introduction to Remote Sensing; The Guilford Press: New York, NY, USA, 2011. [Google Scholar]
  29. Hengl, T.; Reuter, H.I. Geomorphometry: Concepts, Software, Application; Elsevier: Amsterdam, The Netherlands, 2009. [Google Scholar]
  30. Rosser, N.J.; Brain, M.J.; Petley, D.N.; Lim, M.; Norman, E.C. Coastline retreat via progressive failure of rocky coastal cliffs. Geology 2013, 41, 939–942. [Google Scholar] [CrossRef]
  31. Johnstone, E.; Raymond, J.; Olsen, J.M.; Driscoll, N. Morphological Expressions of Coastal Cliff Erosion Processes in San Diego County. J. Coast. Res. 2016, 76, 174–184. [Google Scholar] [CrossRef]
  32. Warrick, J.A.; Ritchie, A.C.; Adelman, G.; Adelman, K.; Limber, P.W. New techniques to measure cliff change form historical oblique aerial photographs and structure-for-motion photogrammetry. J. Coast. Res. 2017, 33, 39–55. [Google Scholar] [CrossRef]
  33. Terefenko, P.; Paprotny, D.; Giza, A.; Morales-Nápoles, O.; Kubicki, A.; Walczakiewicz, S. Monitoring Cliff Erosion with LiDAR Surveys and Bayesian Network-based Data Analysis. Remote Sens. 2019, 11, 843. [Google Scholar] [CrossRef]
  34. Palaseanu-Lovejoy, M.; Danielson, J.; Thatcher, C.; Foxgrover, A.; Barnard, P.; Brock, J.; Young, A. Automatic Delineation of Seacliff Limits using Lidar-derived High-resolution DEMs in Southern California. J. Coast. Res. 2016, 76, 162–173. [Google Scholar] [CrossRef]
  35. Kostrzewski, A.; Zwoliński, Z.; Winowski, M.; Tylkowski, J.; Samołyk, M. Cliff top recession rate and cliff hazards for the sea coast of Wolin Island (Southern Baltic). Baltica 2015, 28, 109–120. [Google Scholar] [CrossRef]
  36. U.S. Army Corps of Engineers. Coastal. Engineering Manual—Chapter 3: Estimation of Nearshore Waves; Corps of Engineers U.S. Army: Washington, DC, USA, 2002. [Google Scholar]
  37. Fonnesbeck, B.B.; Boettinger, J.L.; Lawley, J.R. Improving a Simple Pressure-Calcimeter Method for Inorganic Carbon Analysis. Soil Sci. Soc. Am. J. 2012, 77, 1553. [Google Scholar] [CrossRef]
  38. Cleven, R.N. The Role of Dolomite Content on the Mechanical Strength and Failure Mechanisms in Dolomite-Limestone Composites; University of British Colombia: Vancouver, BC, Canada, 2008. [Google Scholar]
  39. Czubla, P.; Mizerski, W.; Świerczewska-Gładysz, E. Przewodnik Do Ćwiczeń Z Geologii; Wydawnictwo Naukowe PWN: Warszawa, The Netherlands, 2005. [Google Scholar]
  40. Masselink, G.; Hughes, M.G. Introduction to Coast. Processes & Geomorphology; Hodder Education: London, UK, 2003. [Google Scholar]
  41. Dornbusch, U.; Robinson, D.A.; Moses, C.; Williams, R.; Costa, S. Retreat of Chalk cliffs in the eastern English Channel during the last century. J. Maps 2006, 2, 71–78. [Google Scholar] [CrossRef]
  42. Letortu, P.; Costa, S.; Maquaire, O.; Delacourt, C.; Augereau, E.; Davidson, R.; Suanez, S.; Nabucet, J. Retreat rates, modalities and agents responsible for erosion along the coastal chalk cliffs of Upper Normandy: The contribution of terrestrial laser scanning. Geomorphology 2015, 245, 3–14. [Google Scholar] [CrossRef]
  43. El Khattabi, J.; Carlier, E.; Louche, B. The Effect of Rock Collapse on Coastal Cliff Retreat along the Chalk Cliffs of Northern France. J. Coast. Res. 2018, 341, 136–150. [Google Scholar] [CrossRef]
  44. Niemeyer, J.; Rottensteiner, F.; Kuhn, F.; Sorgel, U. Extraktion geologisch relevanter Strukturen auf Rügen in Laserscanner-Daten. DGPF Tag. Wien 2010, 19, 298–307. [Google Scholar]
Figure 1. Major morphological components of the coast cliff system in Jasmund National Park.
Remotesensing 11 02666 g001
Figure 2. Inventory base of Study Area 1: (a) trees lying across the beach; and (b) tree located parallel to the cliff.
Remotesensing 11 02666 g002
Figure 3. Inventory base of Study Area 2, showing log pilings.
Remotesensing 11 02666 g003
Figure 4. Wave refraction changes according to mean shoreline angle.
Remotesensing 11 02666 g004
Figure 5. Cliff exposure to wave action corresponding to volumetric changes in Study Area 1.
Remotesensing 11 02666 g005
Figure 6. Model of cliff retreat induced by wave action.
Remotesensing 11 02666 g006
Table 1. Cliff Exposure Classification Based on Wave Power.
ClassExposureWave Power Range (W/m)
1Very exposed2460.1–2780
2Exposed2140.1–2460
3Moderately exposed1820.1–2140
4Moderately sheltered1500.1–1820
5Sheltered1178–1500
Table 2. Volumetric Changes and Dominant Morphological Processes of Vertical Cliff, Talus Material, and Beach. The 95% Confidence Interval was Used as a Critical Threshold for Volumetric Calculations.
Volume (m3)Area m2Volume Change
(m2)
Percentage of Total AreaRatio (erosion/accumulation)
AREA 1CliffErosion19260.353503.505.5098.1051.52
Accumulation15.6068.000.231.90
TalusErosion238.73289.500.8238.960.64
Accumulation251.3653.500.5561.04
BeachErosion33.64443.500.0827.070.37
Accumulation238.731194.750.2072.93
AREA 2CliffErosion15167.4112314.751.2392.5212.38
Accumulation315.34995.000.327.48
TalusErosion818.93942.250.8791.2610.44
Accumulation6.0890.250.078.74
BeachErosion2768.973247.250.8592.9813.25
Accumulation42.89245.000.187.02
Table 3. Recession Rate Based on Calculations of Cliff Profiles.
Study Area 1Study Area 2
Recession (m)TotalPer yearTotalPer year
Cliff crest2.700.450.630.11
Cliff base (vertical)2.60.431.150.19
Cliff base (with talus)2.450.413.430.57
Average2.580.431.740.29

