1. Introduction
The Copernicus Emergency Management Service (EMS) is a publicly-funded European Union program coordinated by the European Commission that
“provides all actors involved in the management of natural disasters, man-made emergency situations, and humanitarian crises with timely and accurate geospatial information derived from satellite remote sensing and completed by available in situ or open data sources” [
1]. It consists of two components: an early warning and monitoring, and a mapping component. The early warning and monitoring component consists of three different systems, the European Flood Awareness System (EFAS) [
2], the European Forest Fire Information System (EFFIS) [
3] and the European Drought Observatory (EDO) [
4]. EFAS provides information about monitoring and forecasting floods across Europe, while EFFIS and EDO deal with forest fires and droughts respectively, and their ecological impacts in Europe, the Middle East and North Africa. These three systems are also extended to the global scale, as the Global Flood Awareness System (GloFAS), Global Wildfire Information System (GWIS) and Global Drought Observatory (GDO). The Copernicus EMS Mapping Service component
“provides geospatial information (maps) derived from satellite images to assess the impact and respond to natural and man-made disasters. The mapping service operates in two modes: Rapid Mapping for emergencies that require an immediate response, and Risk & Recovery Mapping for situations that do not require immediate action such as prevention and disaster risk analysis and recovery activities”. Events normally analyzed in the scope of these services include the assessment of damage caused by fires, floods, earthquakes, and hurricanes among others, although the Risk and Recovery Service also creates information related to exposure to risks and vulnerability. The Copernicus EMS Mapping service includes a Validation module that, when activated by the European Commission, takes as input the Rapid Mapping and Risk and Recovery Mapping products and validates them on a sample basis taking the Validation protocol created by the Joint Research Center (JRC) as reference [
5,
6].
In the context of the Validation module, the feasibility of creating crisis information related to different events based on Sentinel-1 and 2 (S-1 and S-2) and preferably processed using the free software created by ESA, SNAP, has been studied and validated against reference data created from various sources. The final goal of these studies is the investigation of the applicability of Sentinel data in a crisis management environment by analyzing their potential to create information, while investigating alternative methods to those that have been widely used in the past. For this purpose, not only the methods or the source information are studied, but also the feasibility of creating crisis information within the time constraints that a crisis requires, i.e., a method shall be easily implemented and give results with an accuracy that ensures no major mistakes are given.
Burnt area delineation has traditionally been based on optical imagery, mainly due to the higher number of optical sensors available and to the fact that burnt areas can be easily derived by either automatic algorithms or by visual image interpretation. The above mentioned EFFIS service is indeed based on MODIS and VIIRS data [
3], that lack high spatial resolution but have a very high temporal resolution that allows having up to two or three updates in one day. However, optical imagery has limitations that might decrease their applicability, such as limitations due to cloud or smoke cover, or their acquisition being restricted to daylight hours, even if hotspots can be detected at night via thermal channels of MODIS and VIIRS. To overcome these limitations, several studies [
1,
2] have analyzed SAR data to delineate burnt areas, mainly focused on the analysis of the differences between the pre- and post-fire situations, using both the backscatter and the coherence data. However, the MTC analysis used in the frame of the present study has not been widely tested yet.
The climate in Mediterranean territories is characterized by summers with high temperatures and low rainfall and has is regarded as one of the most vulnerable to climate change [
7]. These environmental factors, together with anthropogenic factors, facilitate the occurrence and spread of fires in forested areas, which are expected to increase in number and intensity in the coming years [
7]. Moreover, they increase the need to have rapid, high-quality information regarding the spread and the effects of fires, not only in order to facilitate planning of the immediate response after a fire, but also to help in planning recovery operations.
In the scope of the present study, the feasibility of creating burnt area delineation from the analysis of the Interferometric Synthetic Aperture Radar (InSAR) data and classifying the MultiTemporal Coherence (MTC) data was assessed as an alternative to widely used indices for mapping forest fires based on optical imagery. The final goal of the study was to test the possibility of rapidly deriving accurate burnt areas from Sentinel-1 images using the software developed by ESA to process the imagery.
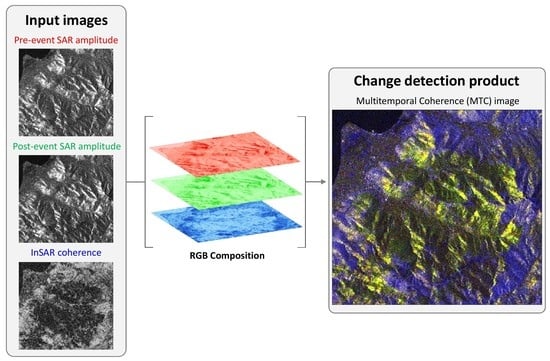
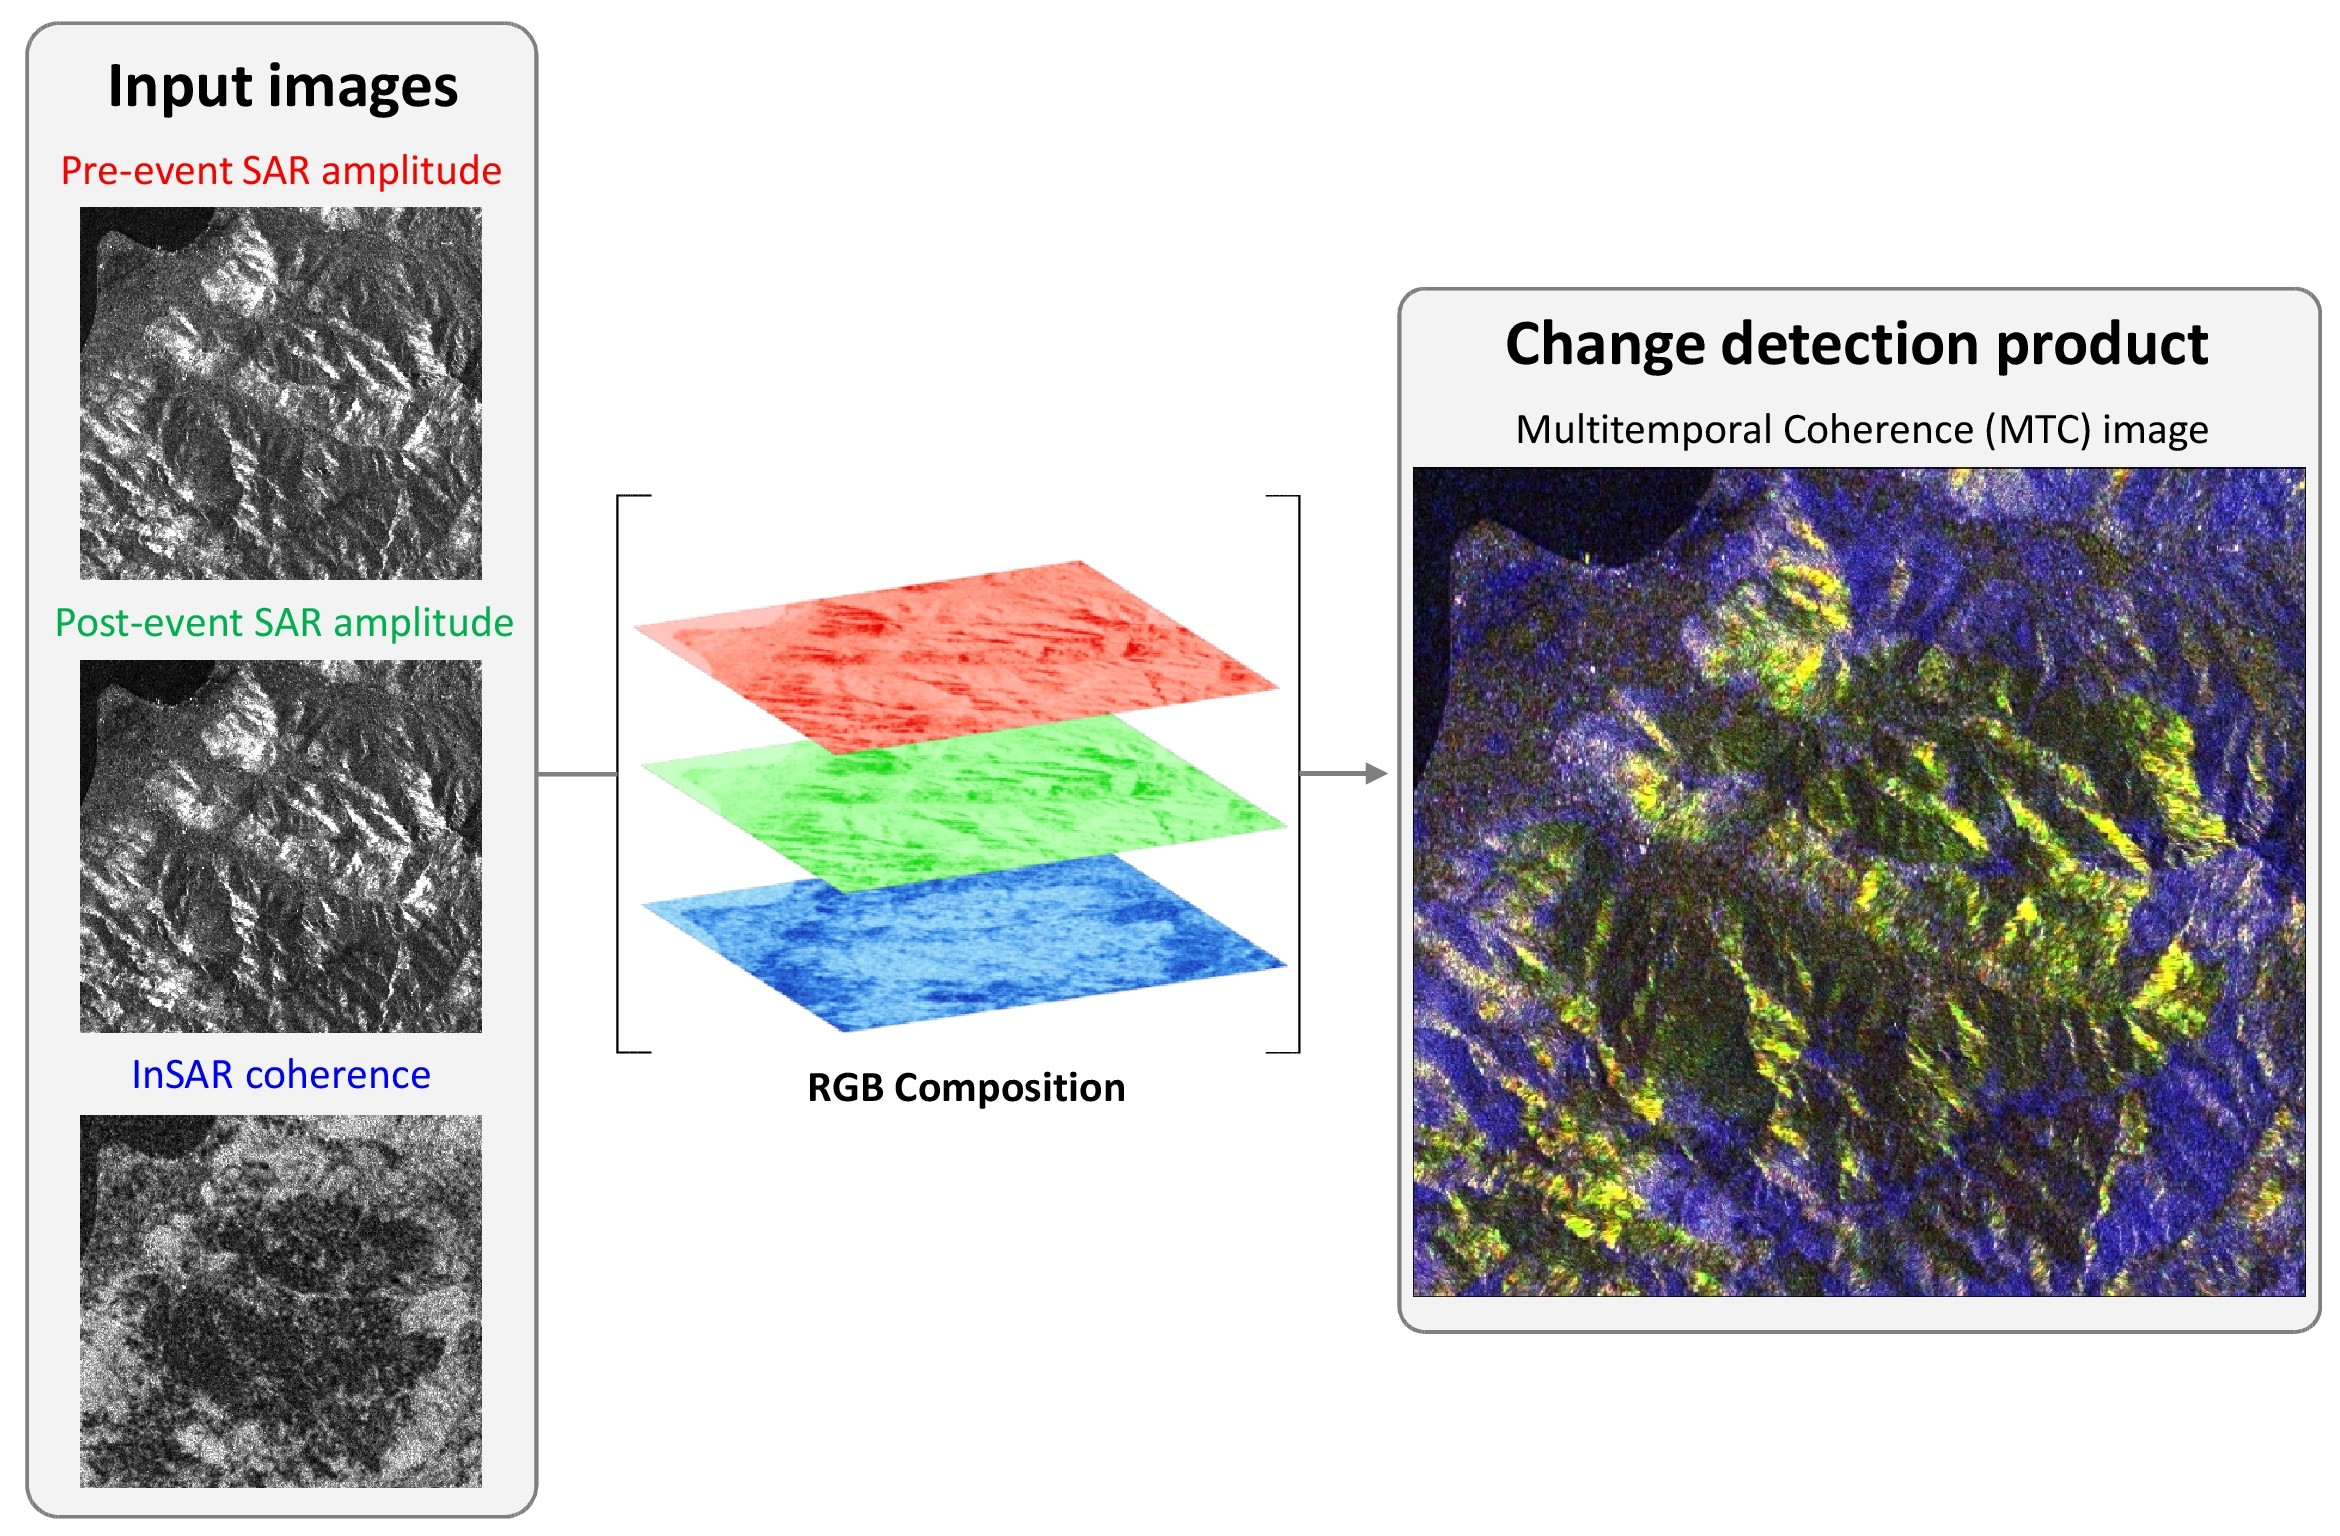
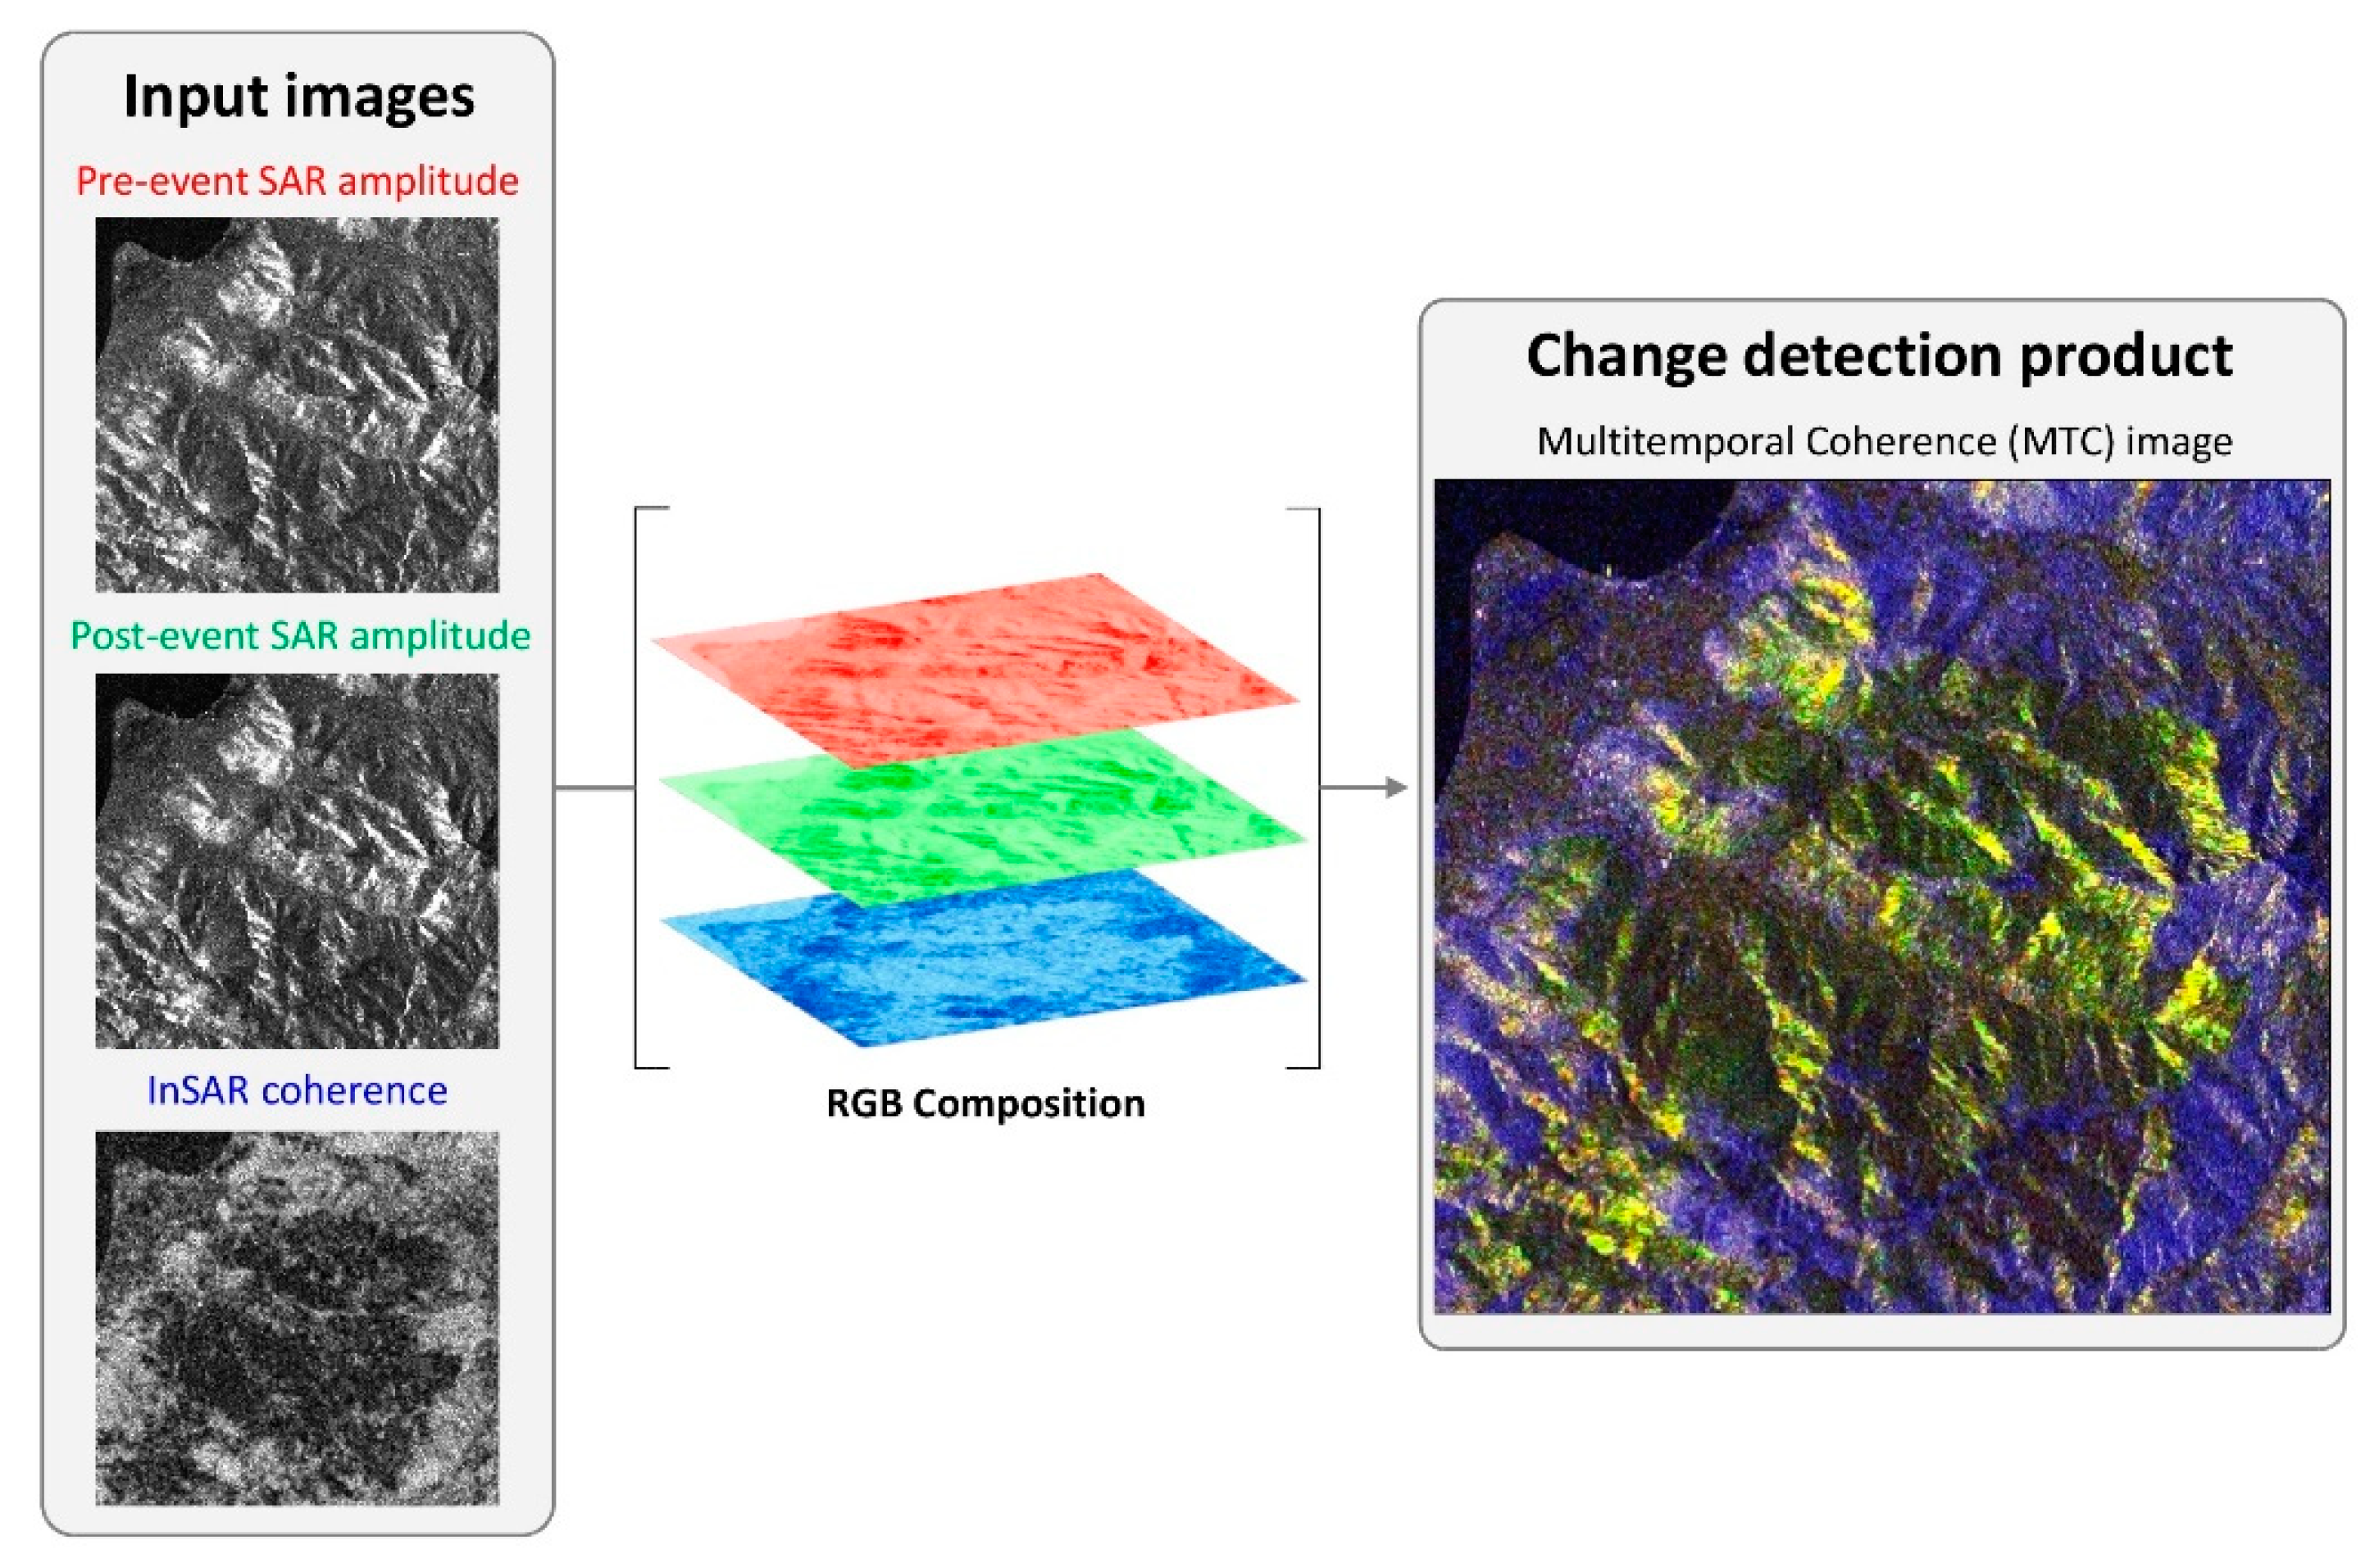
The MTC image is a color composite created using SAR images acquired in two different moments that combines the information regarding the amplitude of both images in the red and green colors with the coherence calculated between those two images in the blue. If a given event affects the terrain in terms of its height, roughness or moisture, low coherence values will be observed. Therefore, if images are acquired before and after an event that is expected to affect the characteristics of the terrain, the changes in coherence might be allocated to the event itself, and the effects of the event might be identified and delineated. This approach has already been used in the past to delineate burnt areas [
8] over a densely vegetated area in Spain that suffered from a massive fire. However, in that case study the ground mostly covered by pine trees, the limits of the burnt area were well-defined and the terrain was flat, which are conditions different to those of the area under study in this case. The sparse vegetation in the present area of study was expected to be limiting for the MTC analysis to detect burnt areas, as areas with bare soil were not classified as burnt even if located within the limits of fire extent.
2. Materials and Methods
The following sections present our approach for the study of the applicability of Sentinel-1 based burnt area delineation in the context of the Copernicus EMS Services.
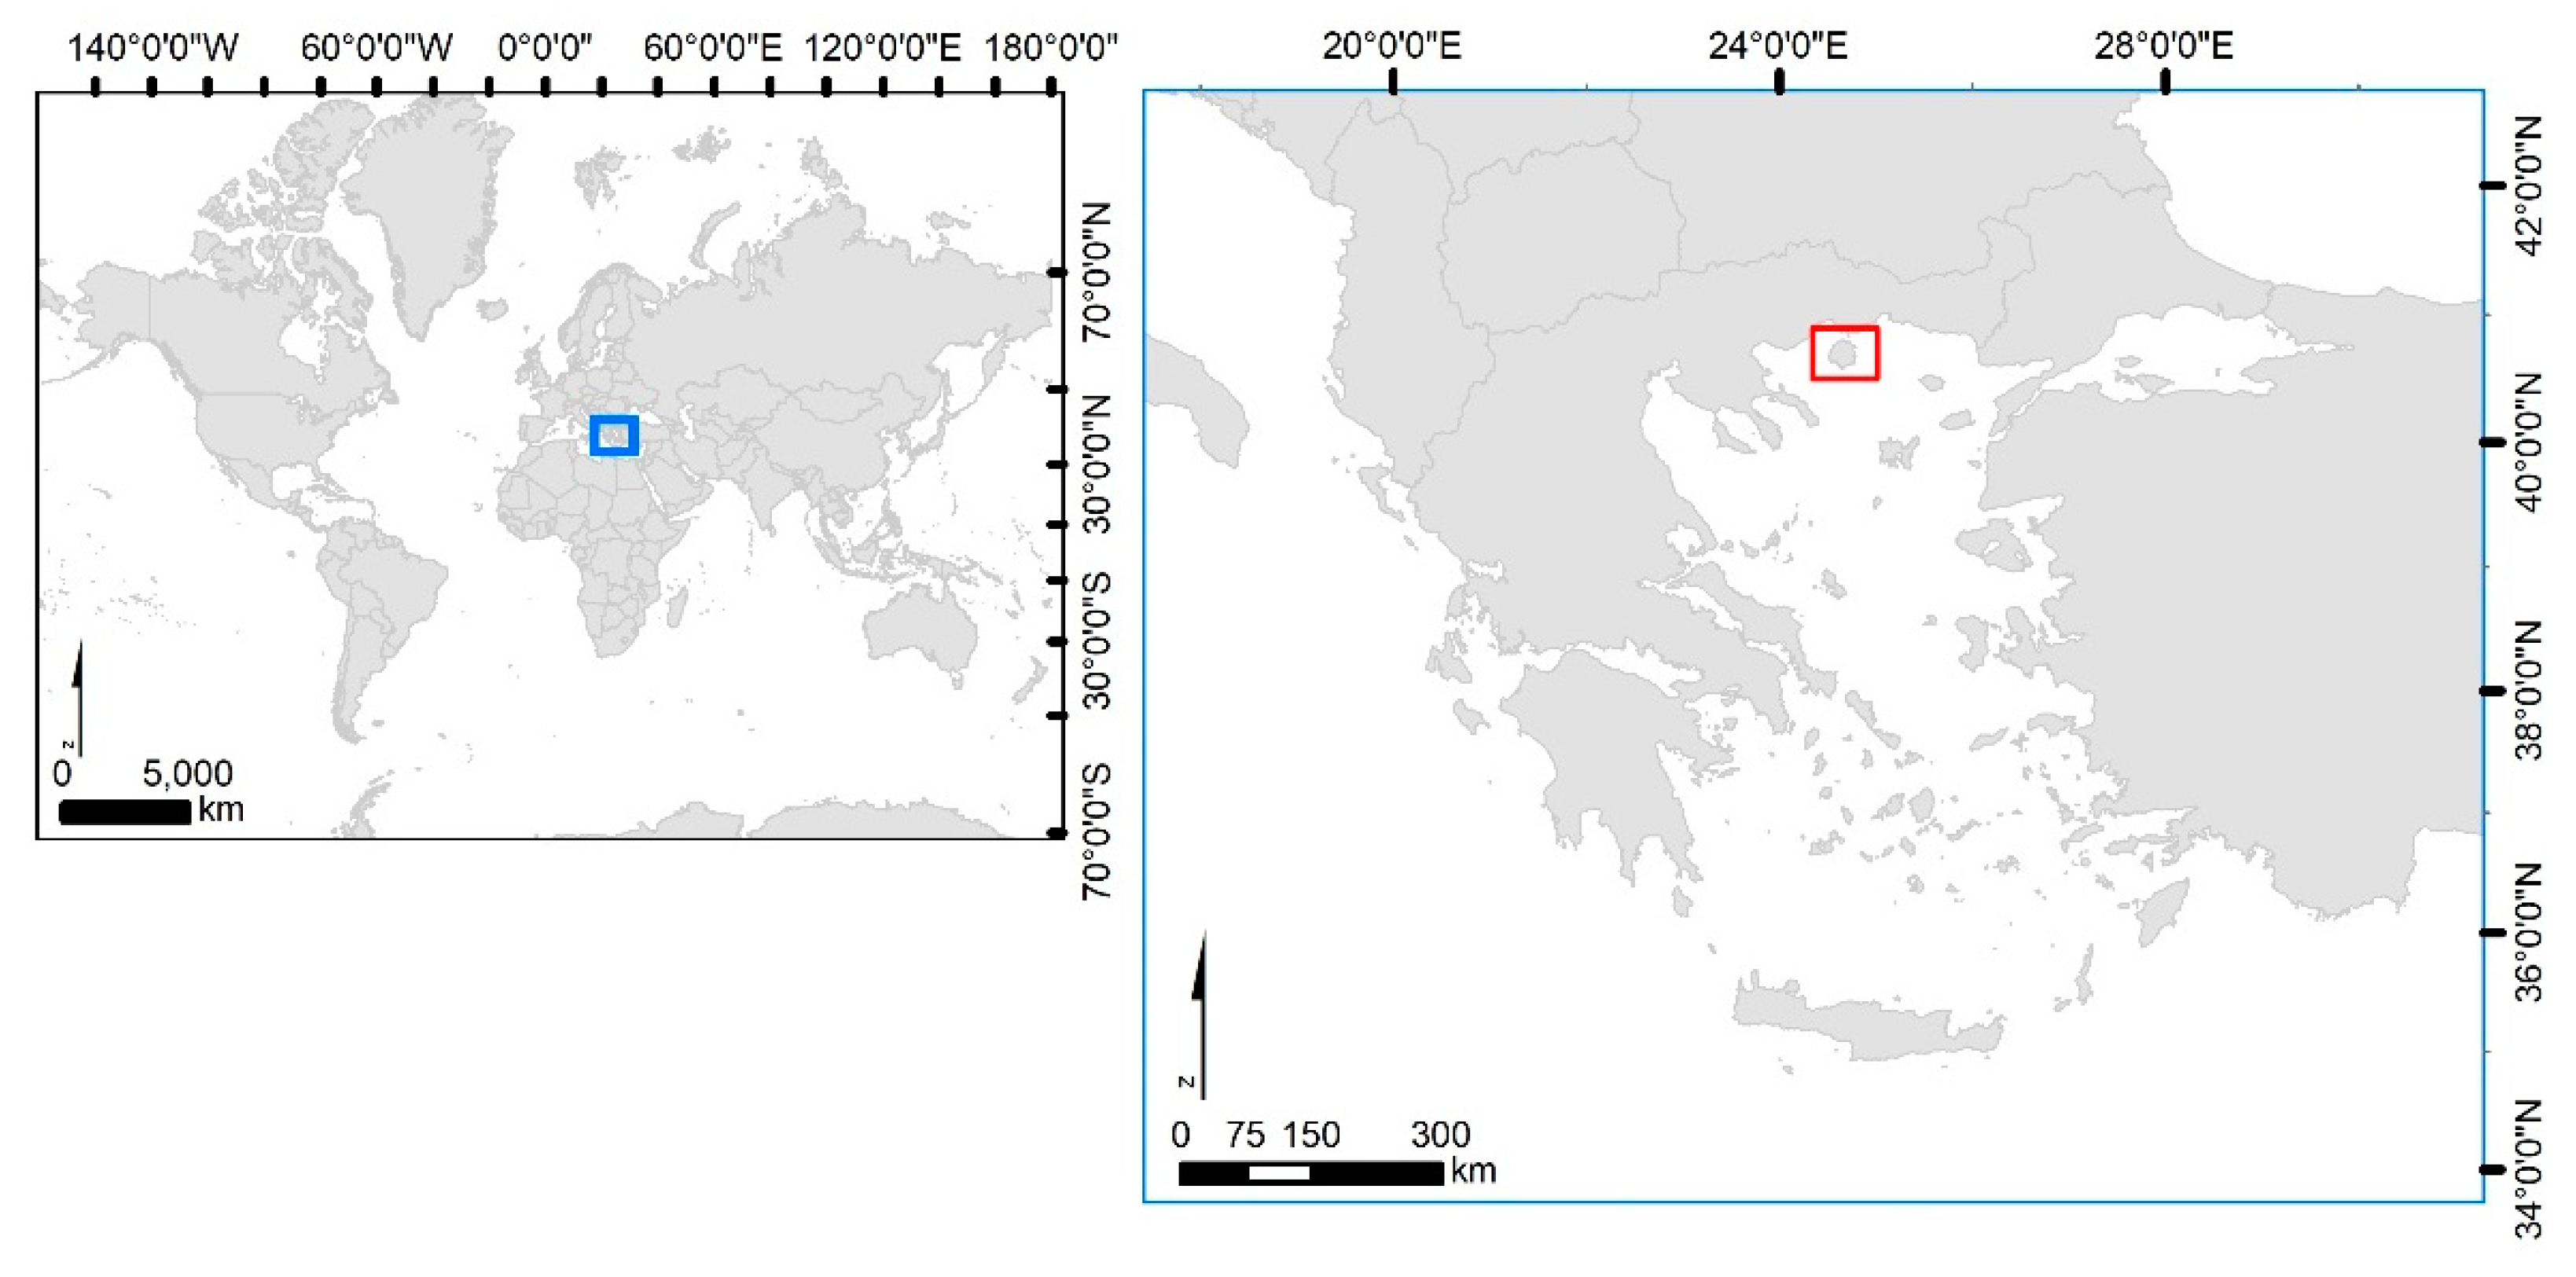
The study area is located on a Mediterranean mountainous island mainly covered by natural vegetation, such as pine trees or bushes and abundant olive trees [
9]. Most of the areas affected by fires were covered by natural vegetation, although some agricultural areas were also affected. This island, shown in
Figure 1, suffered from massive forest fires that started on the 10th of September 2016 and were under control on the 14th of the same month.
For this excercise, 4 Sentinel-1, 2 Sentinel-2 and 1 SPOT 6 images of different dates were processed. The Sentinel-1 images were used to obtain the burnt area delineation over the study area, while the Sentinel-2 and SPOT 6 images were used as reference data to validate the result obtained. All of the Sentinel-1 images were acquired with double polarization as single look complex (SLC) products, a processing level that retains the information related to the phase, which is necessary to calculate coherence, and acquired in the interferometric wide swath (IW) mode. The pixel spacing for these products is 2.3 × 14.1 m in Range × Azimuth [
10]. No multi-looking was applied in order not to decrease the spatial resolution of the input images. Sentinel-1 and Sentinel-2 images were downloaded and processed by the Copernicus EMS validation service, while SPOT 6 was received pre-processed by the ESA. The processing carried out by ESA included the orthorectification using the elevation information provided by the Shuttle Radar Topography Mission (SRTM) of 3 arcsec (approximately 90 m) and pan sharpening of the multispectral and panchromatic image. No information regarding the processing parameters, or the grounds for using elevation information with a spatial resolution of 90 m for orthorectification was provided. Elevation information provided by the SRTM of 1 arcsec (approximately 30 m), downloaded from the United States Geological Survey (USGS), was used in the processing of Sentinel-1 imagery. Sentinel-2 images were acquired as Level 1C as Level 2A products were not available at the time. Therefore, Sentinel-2 images were acquired orthorectified and in top of atmosphere (TOA) values. Orthorectification of these products was made using SRTM 3 arcsec elevation information [
11].
Table 1 summarizes the imagery used in this study. In this table and in following figures t1 and t2 correspond to the pre- and the post-event time steps.
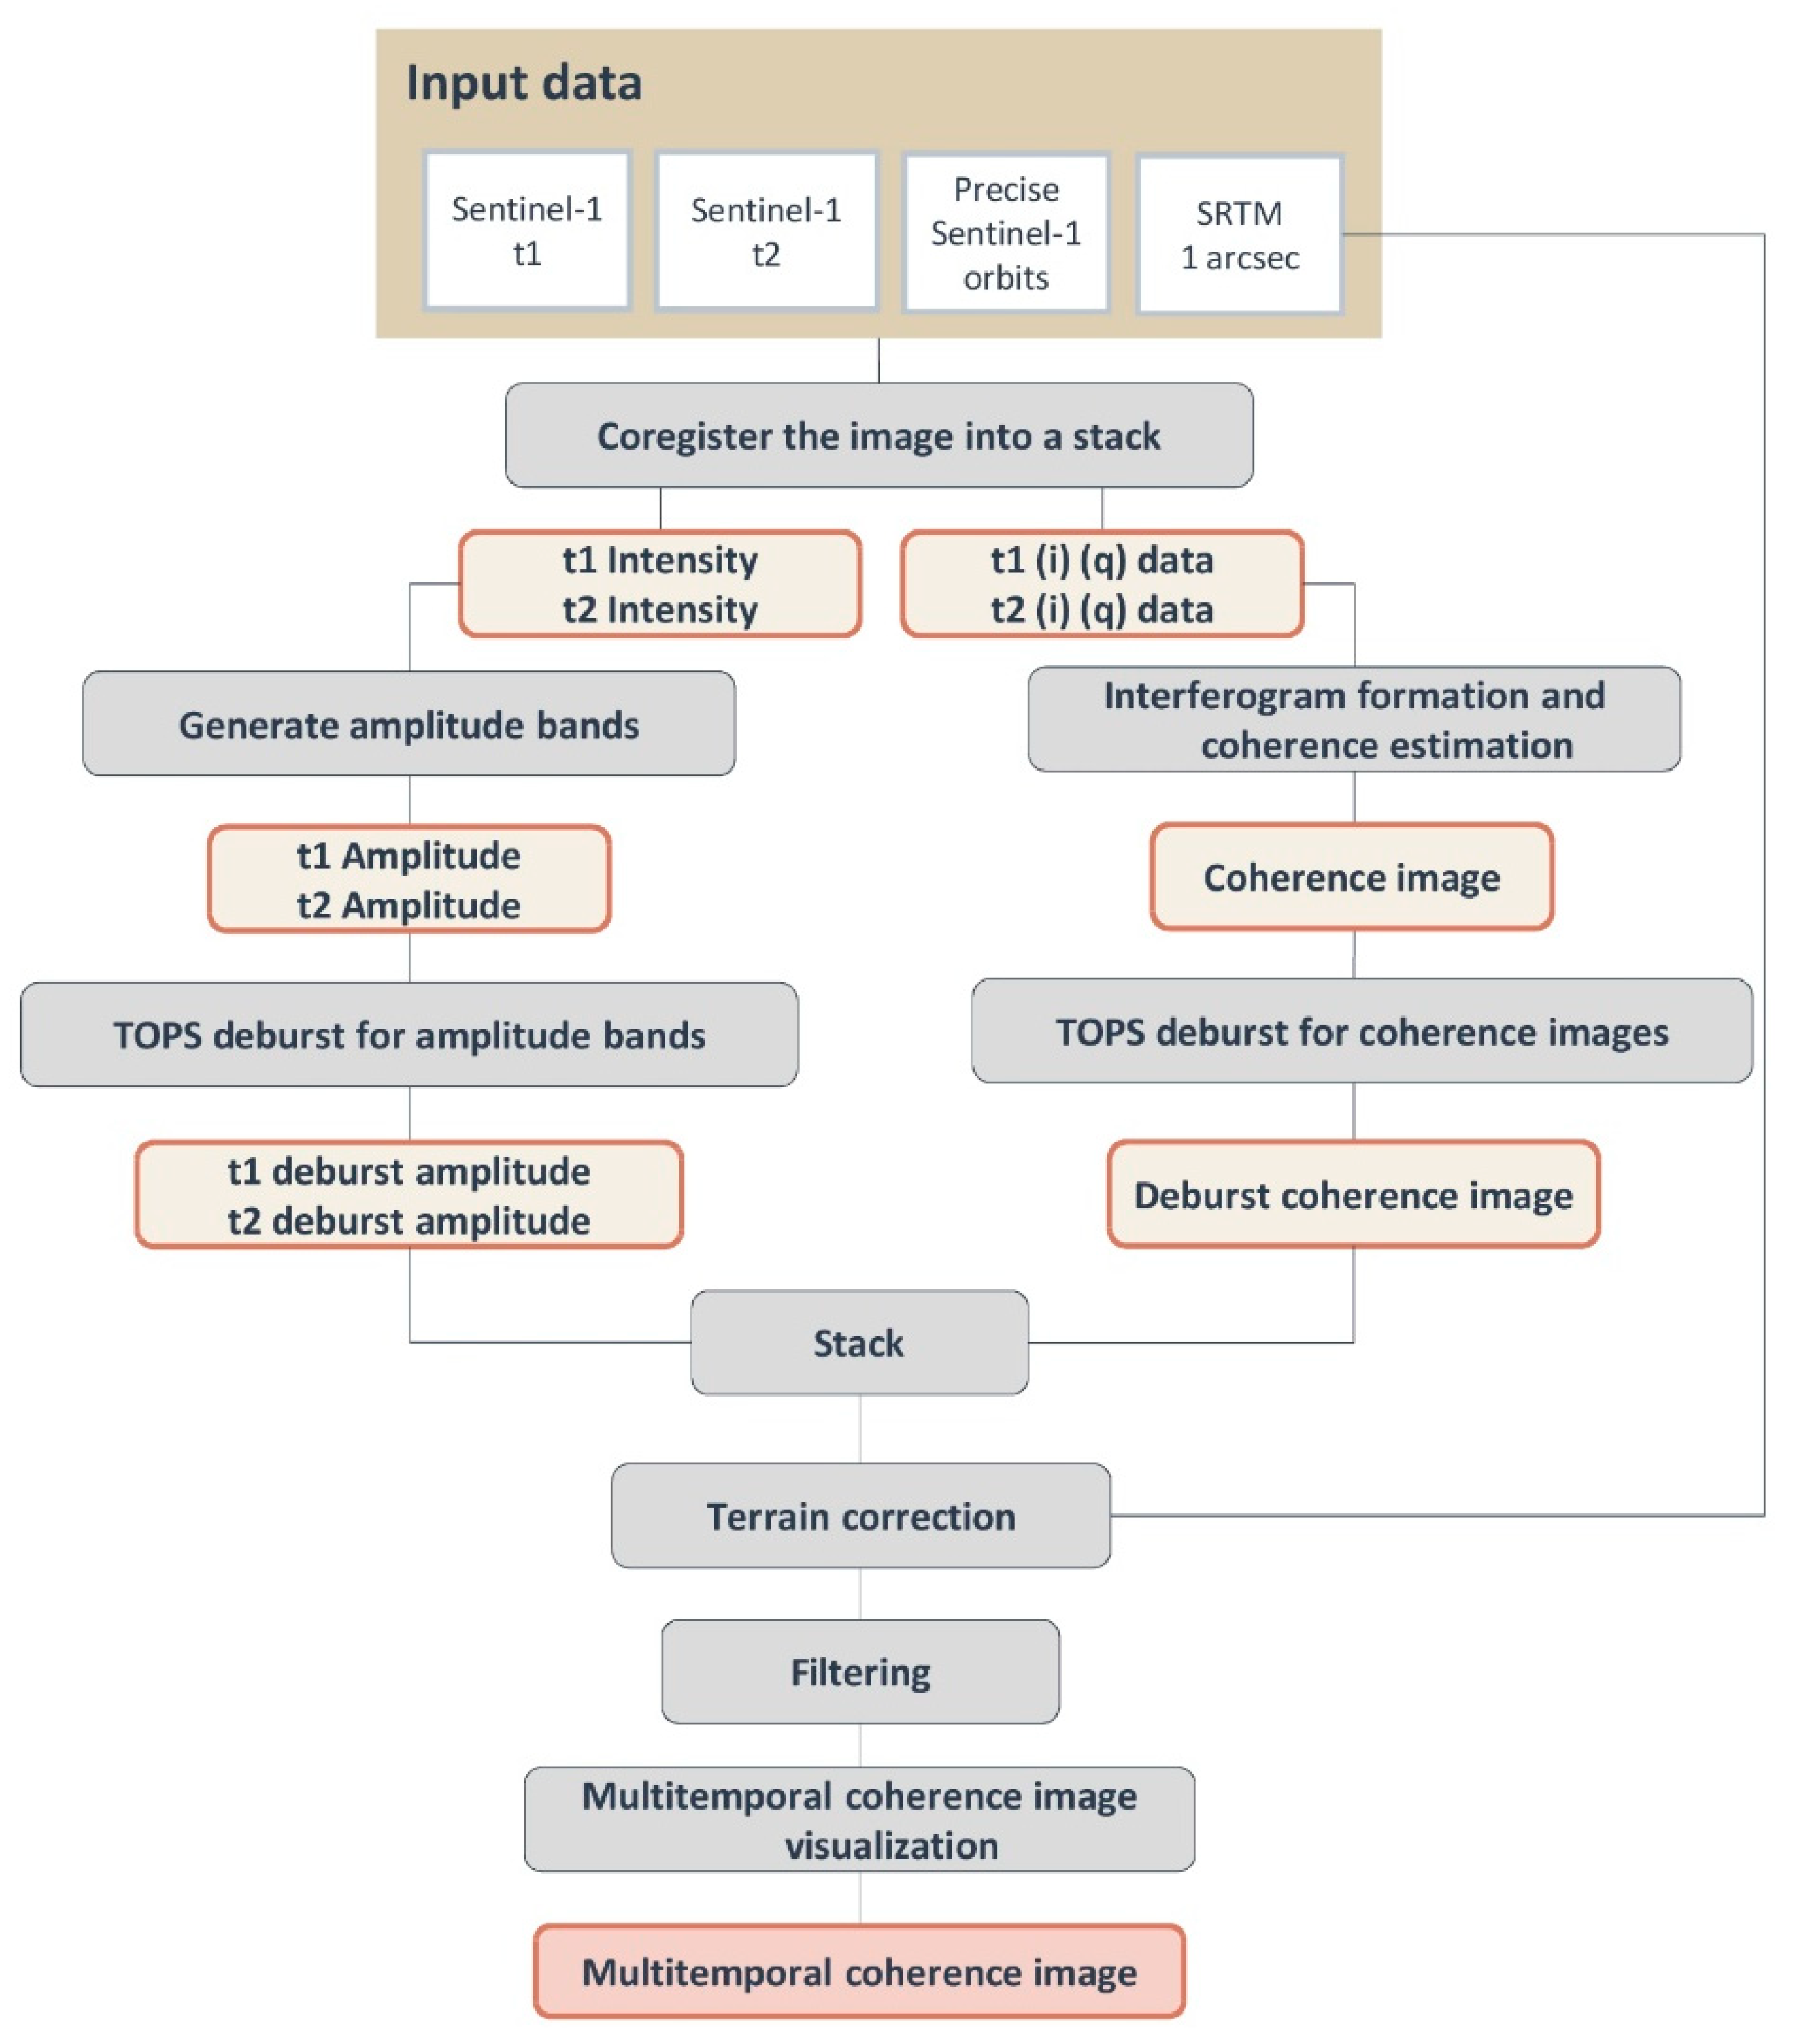
Sentinel-1 data acquired in IW mode were processed in the Sentinel Application Platform (SNAP) environment. This processing included the generation of the amplitude bands, the creation of the interferograms and calculation of the coherence, the TOPS deburst for the amplitude and the coherence images, the stacking into a three-band image, the terrain correction using the SRTM of 1 arcsec and the filtering of the resulting image.
The local coherence, i.e., the coherence value at a given point, is the cross-correlation coefficient of a SAR image pair estimated over a small window (a few pixels in range and azimuth) [
12]. The coherence image is obtained by computing the absolute value of the local coherence on a moving window that covers the whole SAR image. It is essential that the Sentinel-1 images be acquired in the same orbit to allow the calculation of coherence.
The calculation was carried out in SNAP using the default values of the moving window, as past experiences [
8] using Sentinel-1 to calculate coherence have demonstrated that values suggested by default by SNAP when working with Sentinel-1 are appropriate and results are optimal. These values are a 10 × 2 coherence range and azimuth range window sizes. Resulting pixel values range from 0 to 1, where 1 is total coherence between images and 0 is no coherence. Excluding random noise, the coherence is determined by the changes with time of the scattering properties of a target [
13].
The adaptive speckle filter used was a Lee filter with a window of 7 × 7. The choice was made by comparing results with past experiences and to the visual analysis of the results of different filters, bearing in mind that a trade-off shall be found between having a better definition of the spots of interest and the loss of spatial resolution that applying a filter entails. The difficulty of having universal filtering values that can be applied to all cases has shown us the importance of establishing filtering parameters in a case-oriented approach.
Figure 2 shows the workflow of the processing carried out in SNAP to the Sentinel-1 images. Precise orbits for each of the Sentinel-1 images are automatically downloaded by SNAP.
The analysis was made taking the images in pairs, one in ascending and another one in descending mode, of Sentinel-1 pre- (t1) and post-event (t2) images. Burnt area delineation for each of the available polarizations, Vertical–Vertical (VV) and Vertical–Horizontal (VH), was carried out by segmentation of the MTC images calculated with the pre- and post-event ascending and descending images using the Feature Analyst™ [
14] software running in an ESRI environment. Even though some studies recommend the use of VH polarization for burnt area delineation [
15], others affirm that no consolidated methodology is available as the results are often site-specific and not directly comparable [
16]. Therefore—and given that double polarization was available—it was decided to assess the differences in the fire delineation caused by the differences in polarization by using both polarizations in the study.
The resulting MTC image is a color composite that combines the t1 and t2 amplitude in the red and green colors respectively with the t1-t2 coherence in the blue. An example of an MTC image calculated in the scope of the present study is given in
Figure 3. In this figure, areas affected by fire are those that present low coherence values and will, therefore, appear as green and yellowish areas in the MTC image.
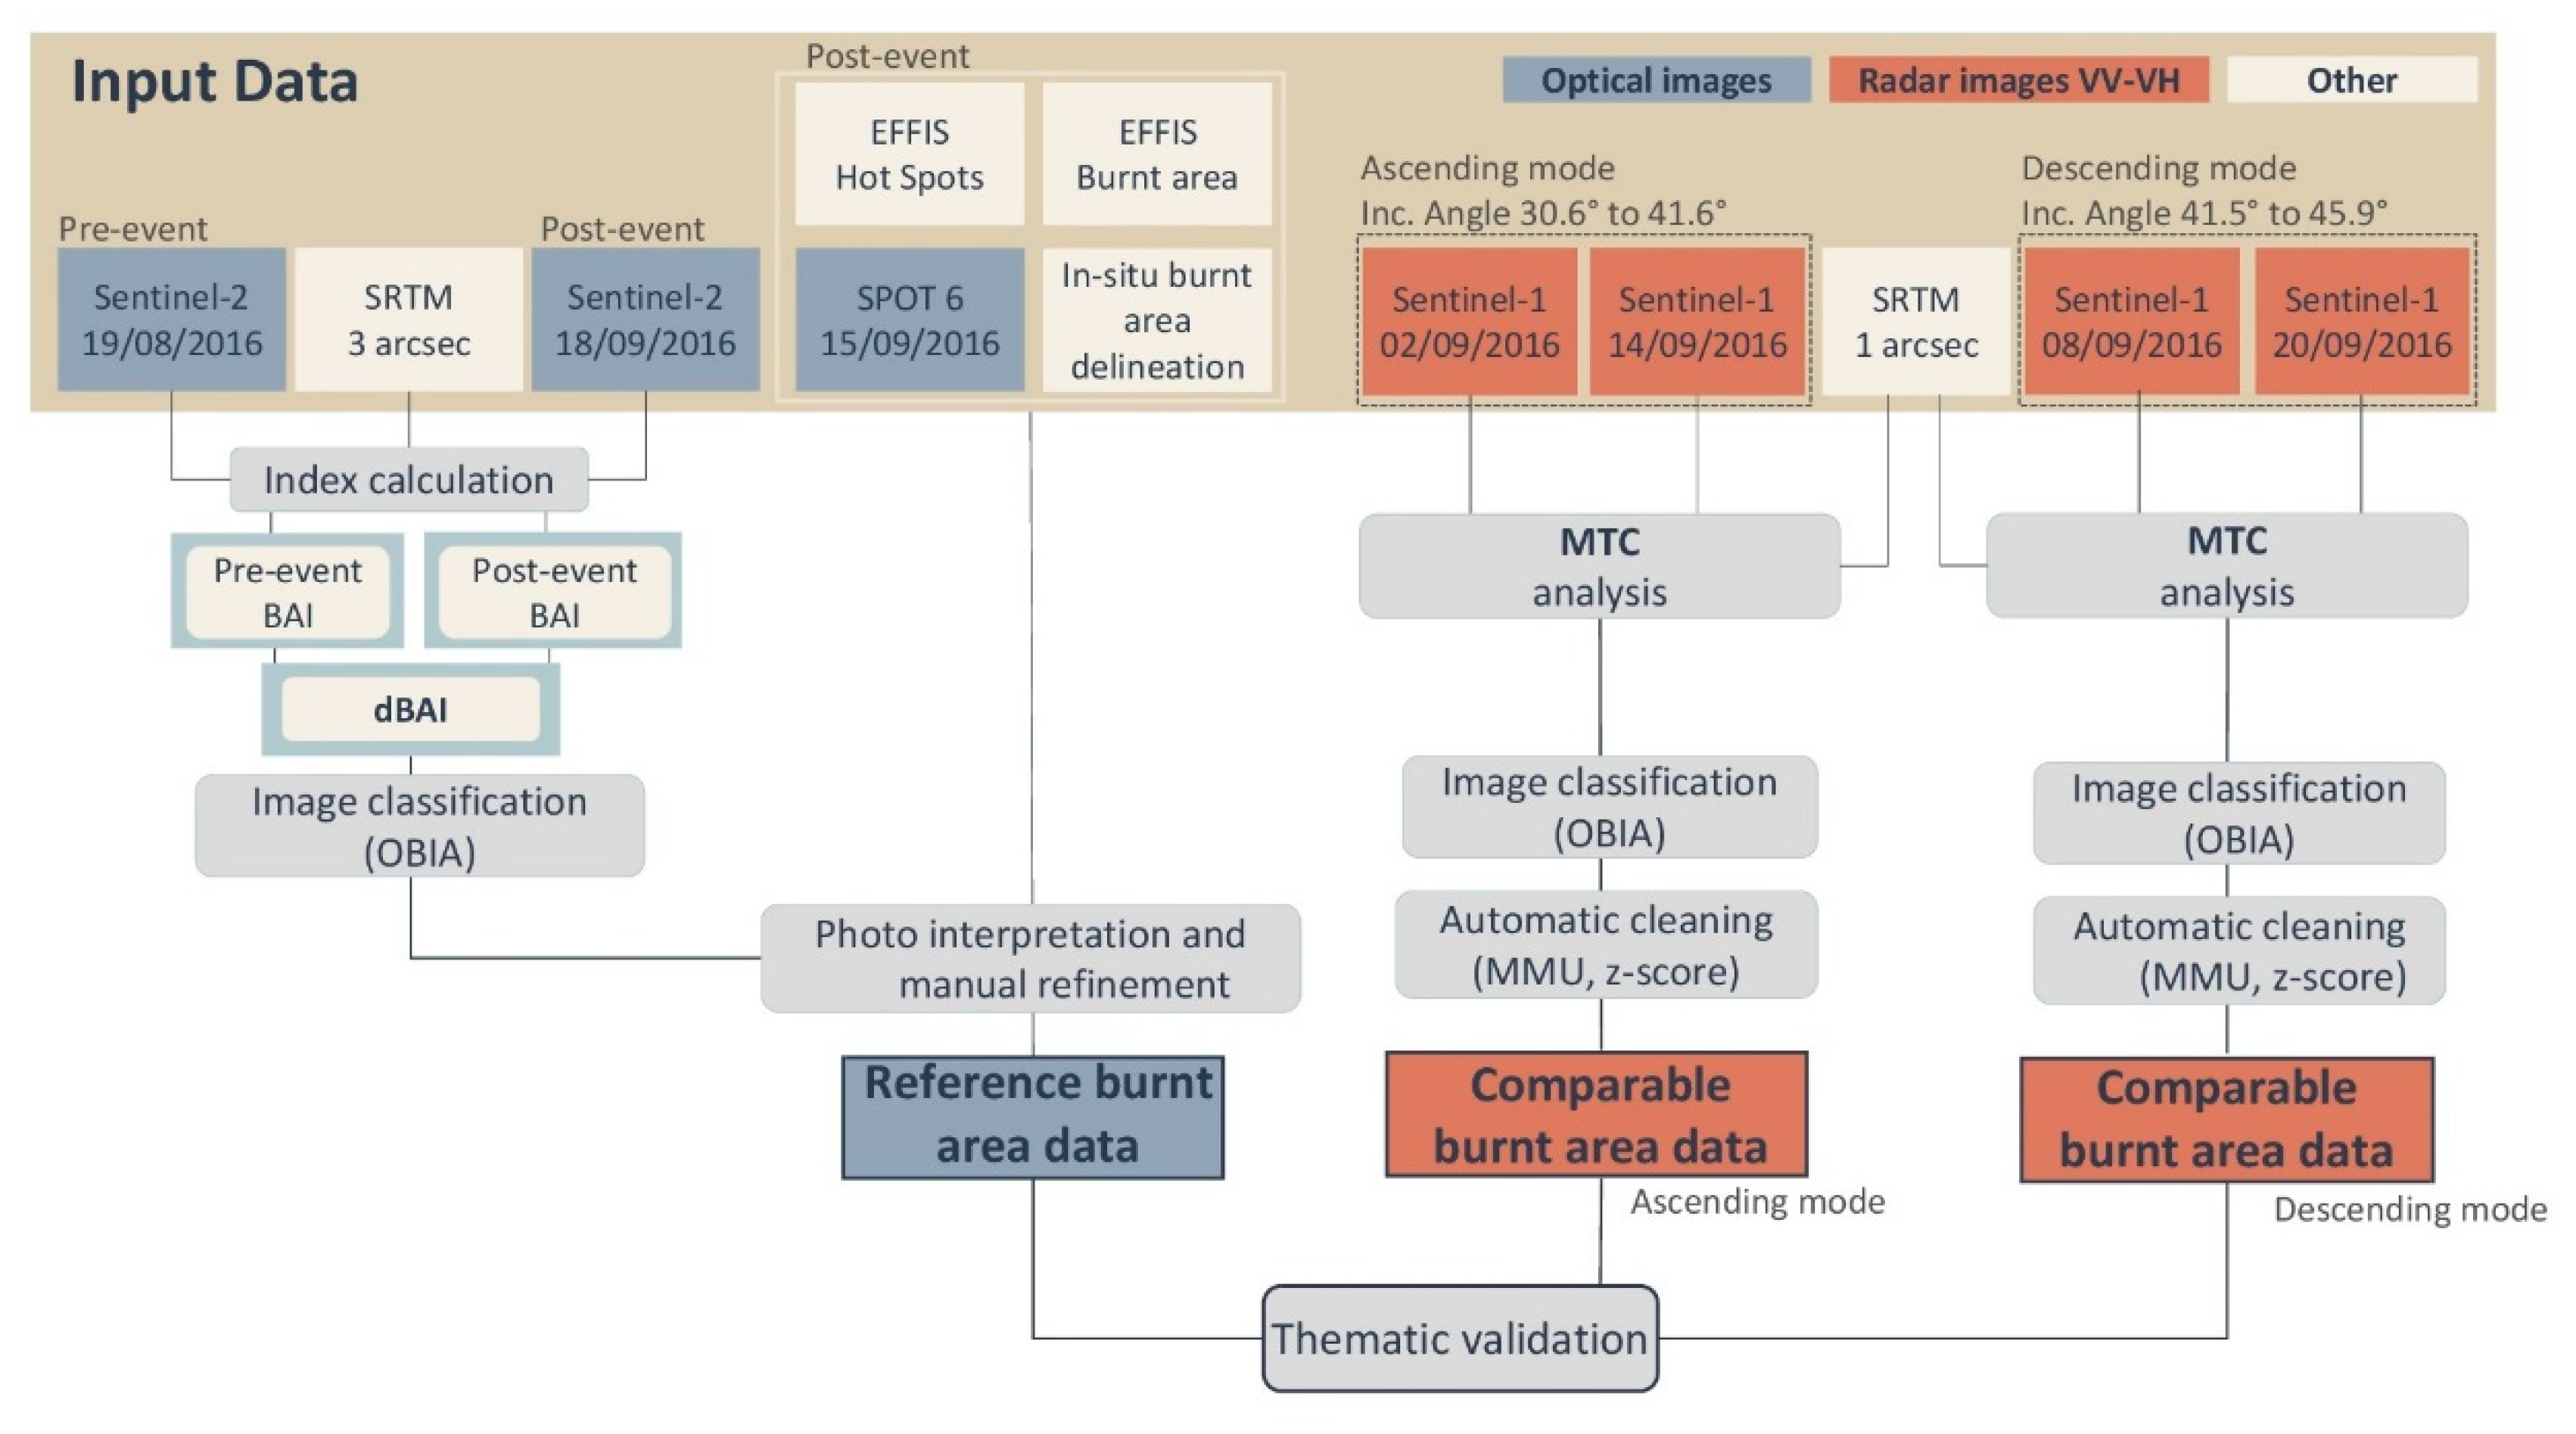
Figure 4 shows the workflow of the study carried out, from the creation of the data to the validation. In this workflow, the comparable data and the images from which they are derived are shown in a cinnamon color and the reference data and the images from which they are derived are shown in blue.
The generation of the Comparable Burnt Area based on Sentinel-1 imagery followed the steps shown in
Figure 4. The processing of images until the creation of the MTC image was carried out in SNAP, while image segmentation and classification were done using the Feature Analyst™ [
14] software running in an ESRI environment. The classification thus obtained was visually inspected and edited to eliminate areas smaller than an established minimum mapping unit (MMU) of 1500 m
2, or with a low membership likelihood. The MMU value was fixed based on the scale of the product created in the scope of Copernicus EMS, 1:50,000, and on the visual analysis of the data. One of the possible outputs of this software is a vector file that shows the membership likelihood, named z-score, of each of the classified polygons to the assigned class given the samples that are introduced in the classifier [
14]. This z-score was used in the context of the study to discard those areas classified as being burnt with a low membership likelihood. No fixed value was established, and the choice of a given z-score to discard wrongly classified areas was based on the interpretation and analysis of the results in each case. Generally, a membership likelihood higher than 90% was considered. Once those polygons classified as burnt with a membership likelihood over 90% were selected, additional editing was carried out in ArcGIS.
In order to be able to study the influence of the acquisition mode, the incidence angle and the polarization in the results, and given the available images, see
Table 1, it was decided to carry out the classifications considering the seven possible combinations included in
Table 2. The purpose of considering and classifying the different combinations regarding the polarization or the acquisition mode was to be able to detect which of the following characteristics of the SAR data—acquisition mode, polarization—had a bigger impact on the delineation of the burnt area. Moreover, the fact that the images acquired in ascending or descending modes presented very different incidence angles, from 31° to 41° and from 41° to 45° respectively, allowed the study of the effect of the angle. In this way, the purpose was to follow the study carried out in [
8]. In this study, only the suitability of the MTC methodology was assessed without a further investigation of the effect of the different characteristics of Sentinel-1 imagery.
The whole classification process was repeated with the MTC images created with each of the above-mentioned combinations. For those combinations that included both polarizations or a combination of ascending and descending images, classification was carried out using two MTC images, this is, classifying over the available 6 bands.
Reference data to validate Comparable Burnt Area data was created using optical Sentinel-2 t1 and t2 images, see
Table 1. Atmospheric, radiometric and topographic corrections were applied to the images using ERDAS Imagine
TM. Even if SNAP is the most appropriate software to carry out these processes, at the time in which the study was held, 2017, it presented some problems for Sentinel-2 Level 1C processing and therefore ERDAS Imagine
TM was used. Those problems have been solved and Sentinel-2 processing is currently carried out in the SNAP environment. Once this processing was done, the burnt area index (BAI) of each date was calculated as in Equation (1).
where:
ρ
RED = Reflectance of the red band (665 nm). This corresponds to Band 4 of Sentinel-2 [
17].
ρ
NIR = Reflectance of near-infrared (NIR) band (842 nm). Corresponds to Band 8 of Sentinel-2 [
17].
Prior to the calculation, other vegetation indices were considered. Although the normalized burnt ratio (NBR) is commonly used for the detection and delineation of burnt areas and has proven its applicability [
18], the bands needed to calculate it are not always available in the frame of the Copernicus EMS Rapid Mapping, see Equation (2).
where:
ρ
NIR = Reflectance of NIR band (842 nm). Corresponds to Band 8 of Sentinel-2 [
17].
ρ
SWIR = Reflectance of short wave Infrared (SWIR) band (1610 nm). Corresponds to Band 11 of Sentinel-2 [
17].
Given that the high spatial resolution of the images is prioritized to create damage assessment data in the scope of Copernicus EMS, and that very high resolution (VHR) optical images usually include 4 bands (red, green, blue and NIR) it is more common to use the BAI rather than the NBR. It was therefore decided to use the former, aiming to reproduce as much as possible the information that would have been created in the scope of a Copernicus EMS activation.
Despite having a better spatial resolution, the use of the post-event SPOT 6 image alone to create the reference data was discarded and the Sentinel-2 image pair was used instead. The decision was based on the fact that no pre-event SPOT 6 image was available, which is considered essential to have a clear view of the pre-event situation that allows better discrimination of the burnt area. The use of SPOT 6 was therefore limited to visual inspection of the results of the classification of the difference of BAI (dBAI) index to select the training areas for the classification of reference data and in those areas where the presence of fire was doubtful.
Burnt area delineation using Sentinel-2 images, used as reference data in the present study, was calculated by segmentation of the difference of BAI (dBAI) between pre- and post-event images using the Feature Analyst™ software [
14]. The classification was inspected and occasionally manually edited using as ancillary information a SPOT 6 image, hot spots and burnt area data available in EFFIS [
3] and in-situ data collected by the national civil protection service and provided to the Copernicus EMS Validation service. No information regarding the equipment used by the national civil protection to collect the in-situ data was available. Although considered a very reliable source of thematic information in terms of the presence or not of burnt area, the lack of information regarding its spatial accuracy and the fact that it did not completely cover the area under study decreased its usability. Manual refinement of Reference delineation did not comprise the inclusion of new areas or the generalization of the classification. The purpose was to discard major errors if any. As no gross errors were encountered, edition was limited to its visual inspection and to establishing an MMU of 1500 m
2, already used in the creation of the comparable data derived from SAR data.
Validation of the different comparable data against reference burnt was carried out following an area-based approach and the template shown in
Table 3. In this table, OA (%) corresponds to overall accuracy taking the whole area of interest (AOI) into consideration, OAu (%), Cu (%) and Ou (%) correspond to the overall accuracy, commission and omission errors respectively, obtained taking into consideration the union of the Sentinel-1 derived burnt area, comparable data, with the reference burnt area. The purpose of calculating accuracy measures referred to the union of the burnt areas is to avoid the effect of the disproportion between the size of the AOI and the size of the burnt areas in the results. The AOI corresponds to the AOI of the Copernicus EMS product and covers the whole island, approximately 840 km
2, while the burnt area was expected to be smaller, see Figure 8.
3. Results
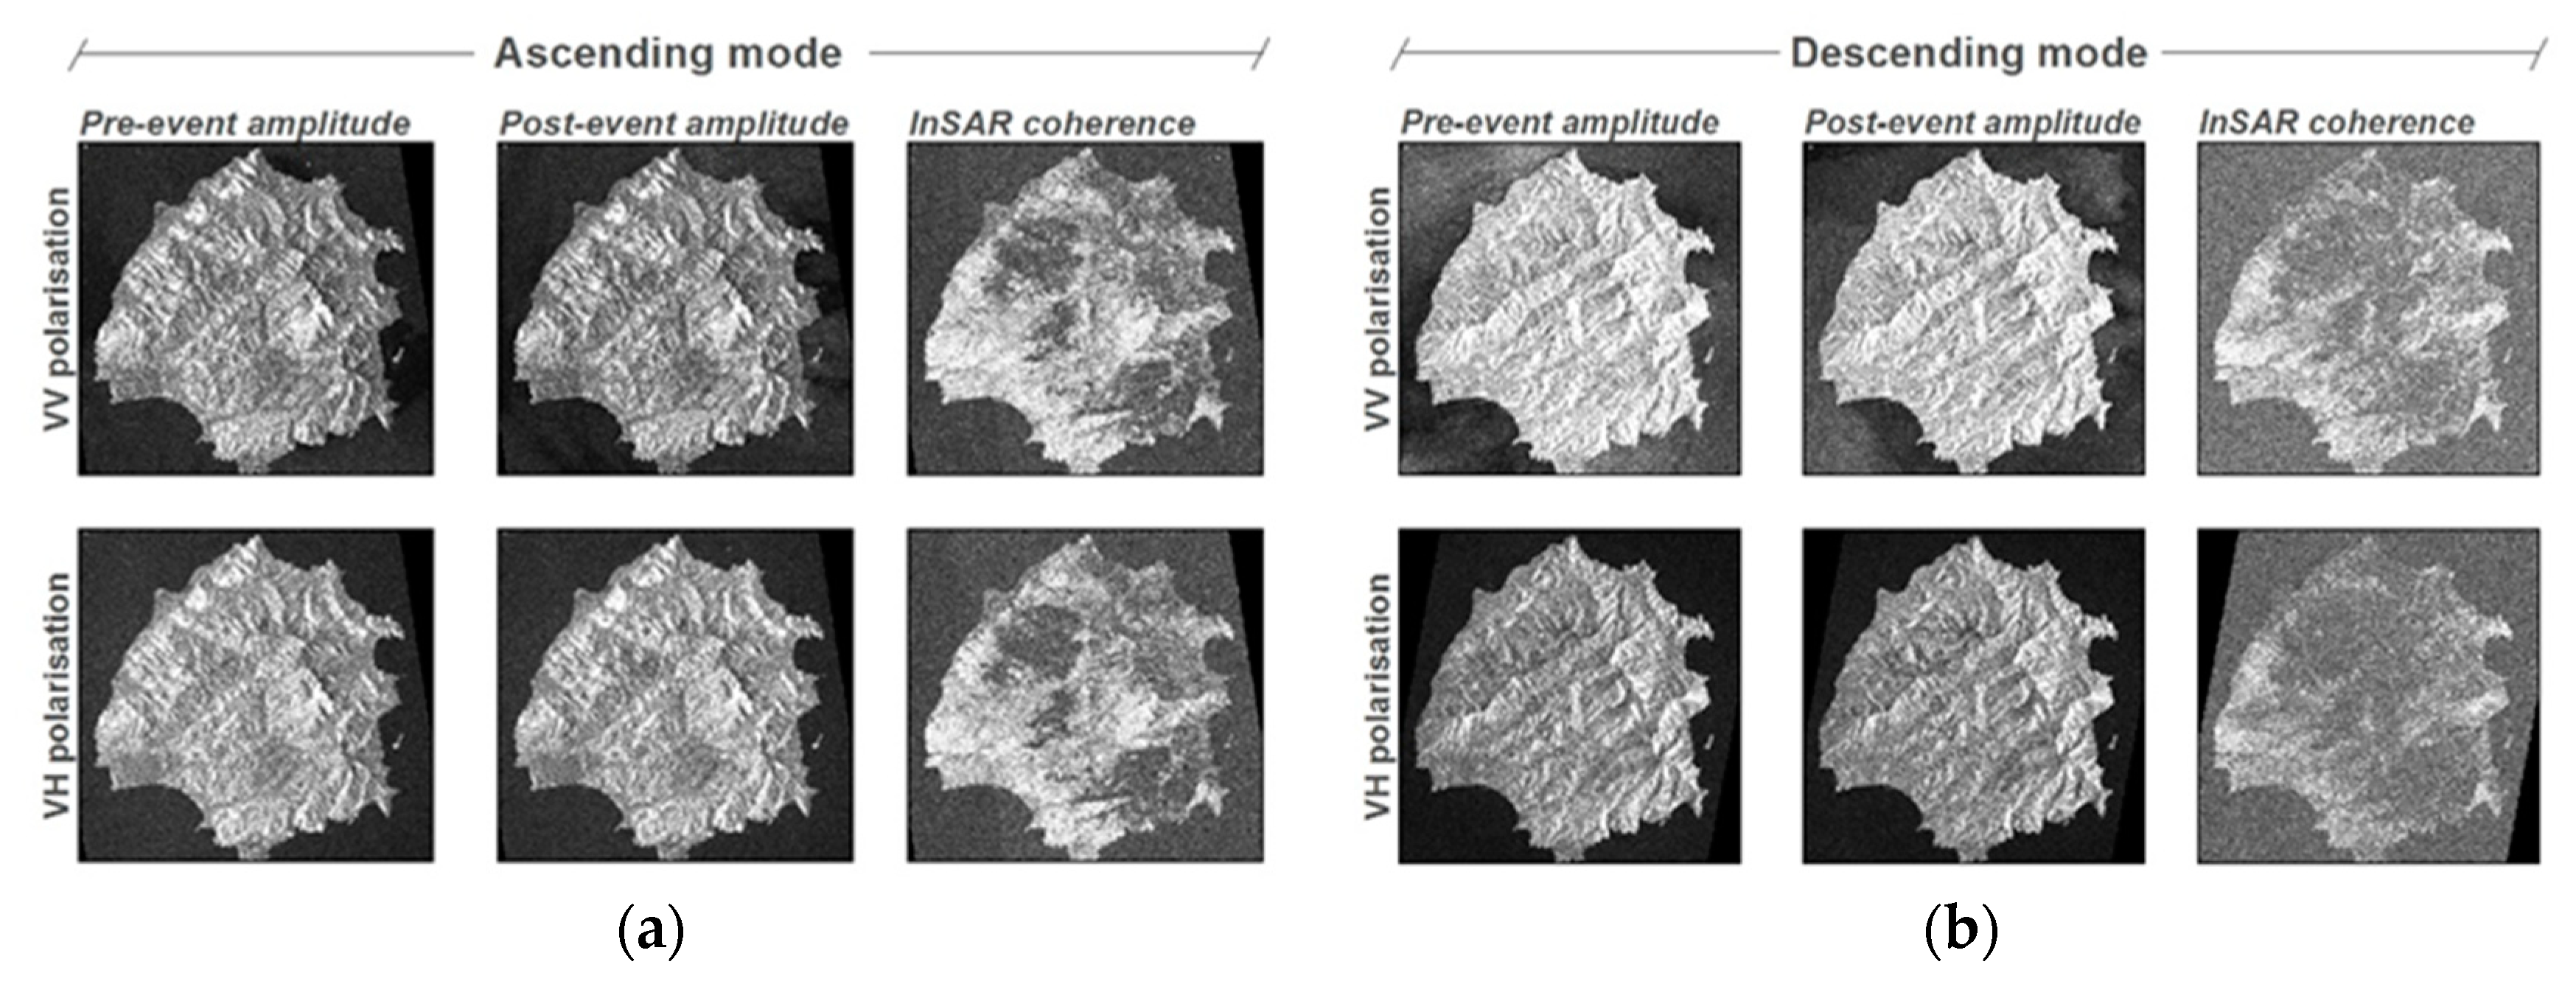
Figure 5 shows the results of the Sentinel-1 images processing using the ascending and the descending modes with the two different polarizations that were subsequently used to create the different comparable data classifications, see
Table 2. In
Figure 5, it is noticeable how the coherence images obtained using the SAR data acquired in ascending mode present well-defined areas of low coherence that might be indicative of burnt areas while the coherence data derived from those images acquired in descending mode are less well defined, showing a blurry appearance in both polarizations. The main reason for these differences lays in the incidence angle of the images, which is lower for the SAR data acquired in ascending mode, see
Table 1.
It was expected that the classification of the MTC images with the Feature Analyst
TM [
14] using the images acquired in descending mode would be very poor after the visual inspection of the coherence images shown in
Figure 5.
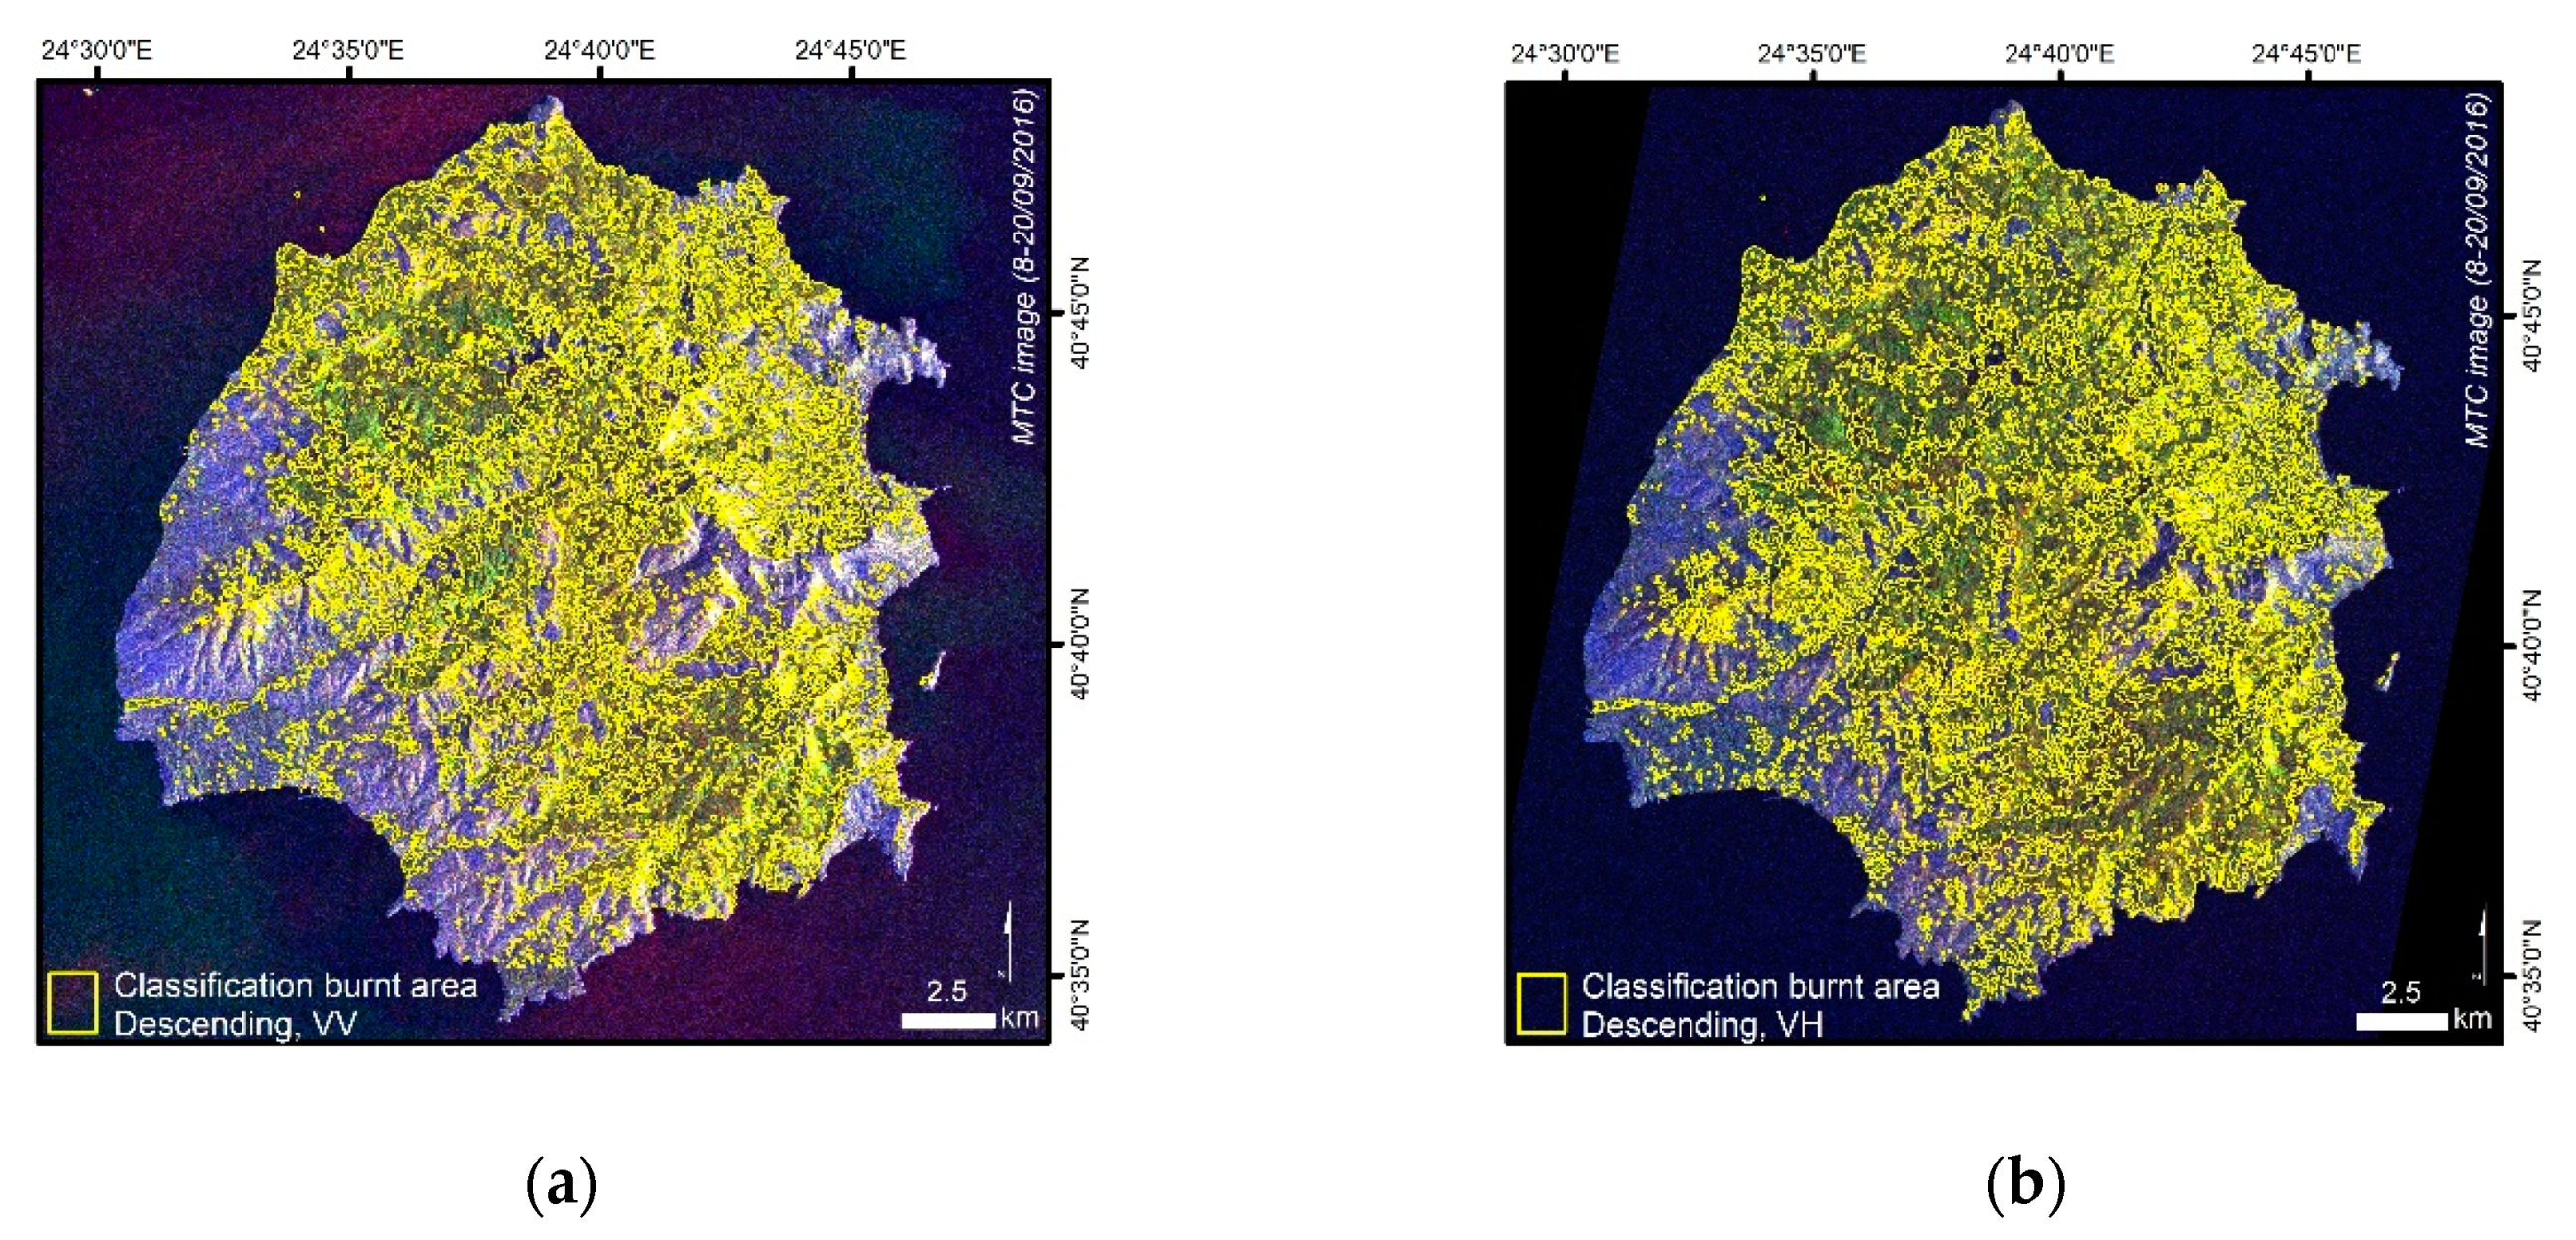
Figure 6 shows the preliminary results of the classification of the MTC images created with those Sentinel-1 acquired in descending mode. Most of the area was classified as burnt and the z-score or membership likelihood of these classifications was very low. Therefore, it was decided to not create the comparable descending VV and comparable descending VH burnt area data, see
Table 2.
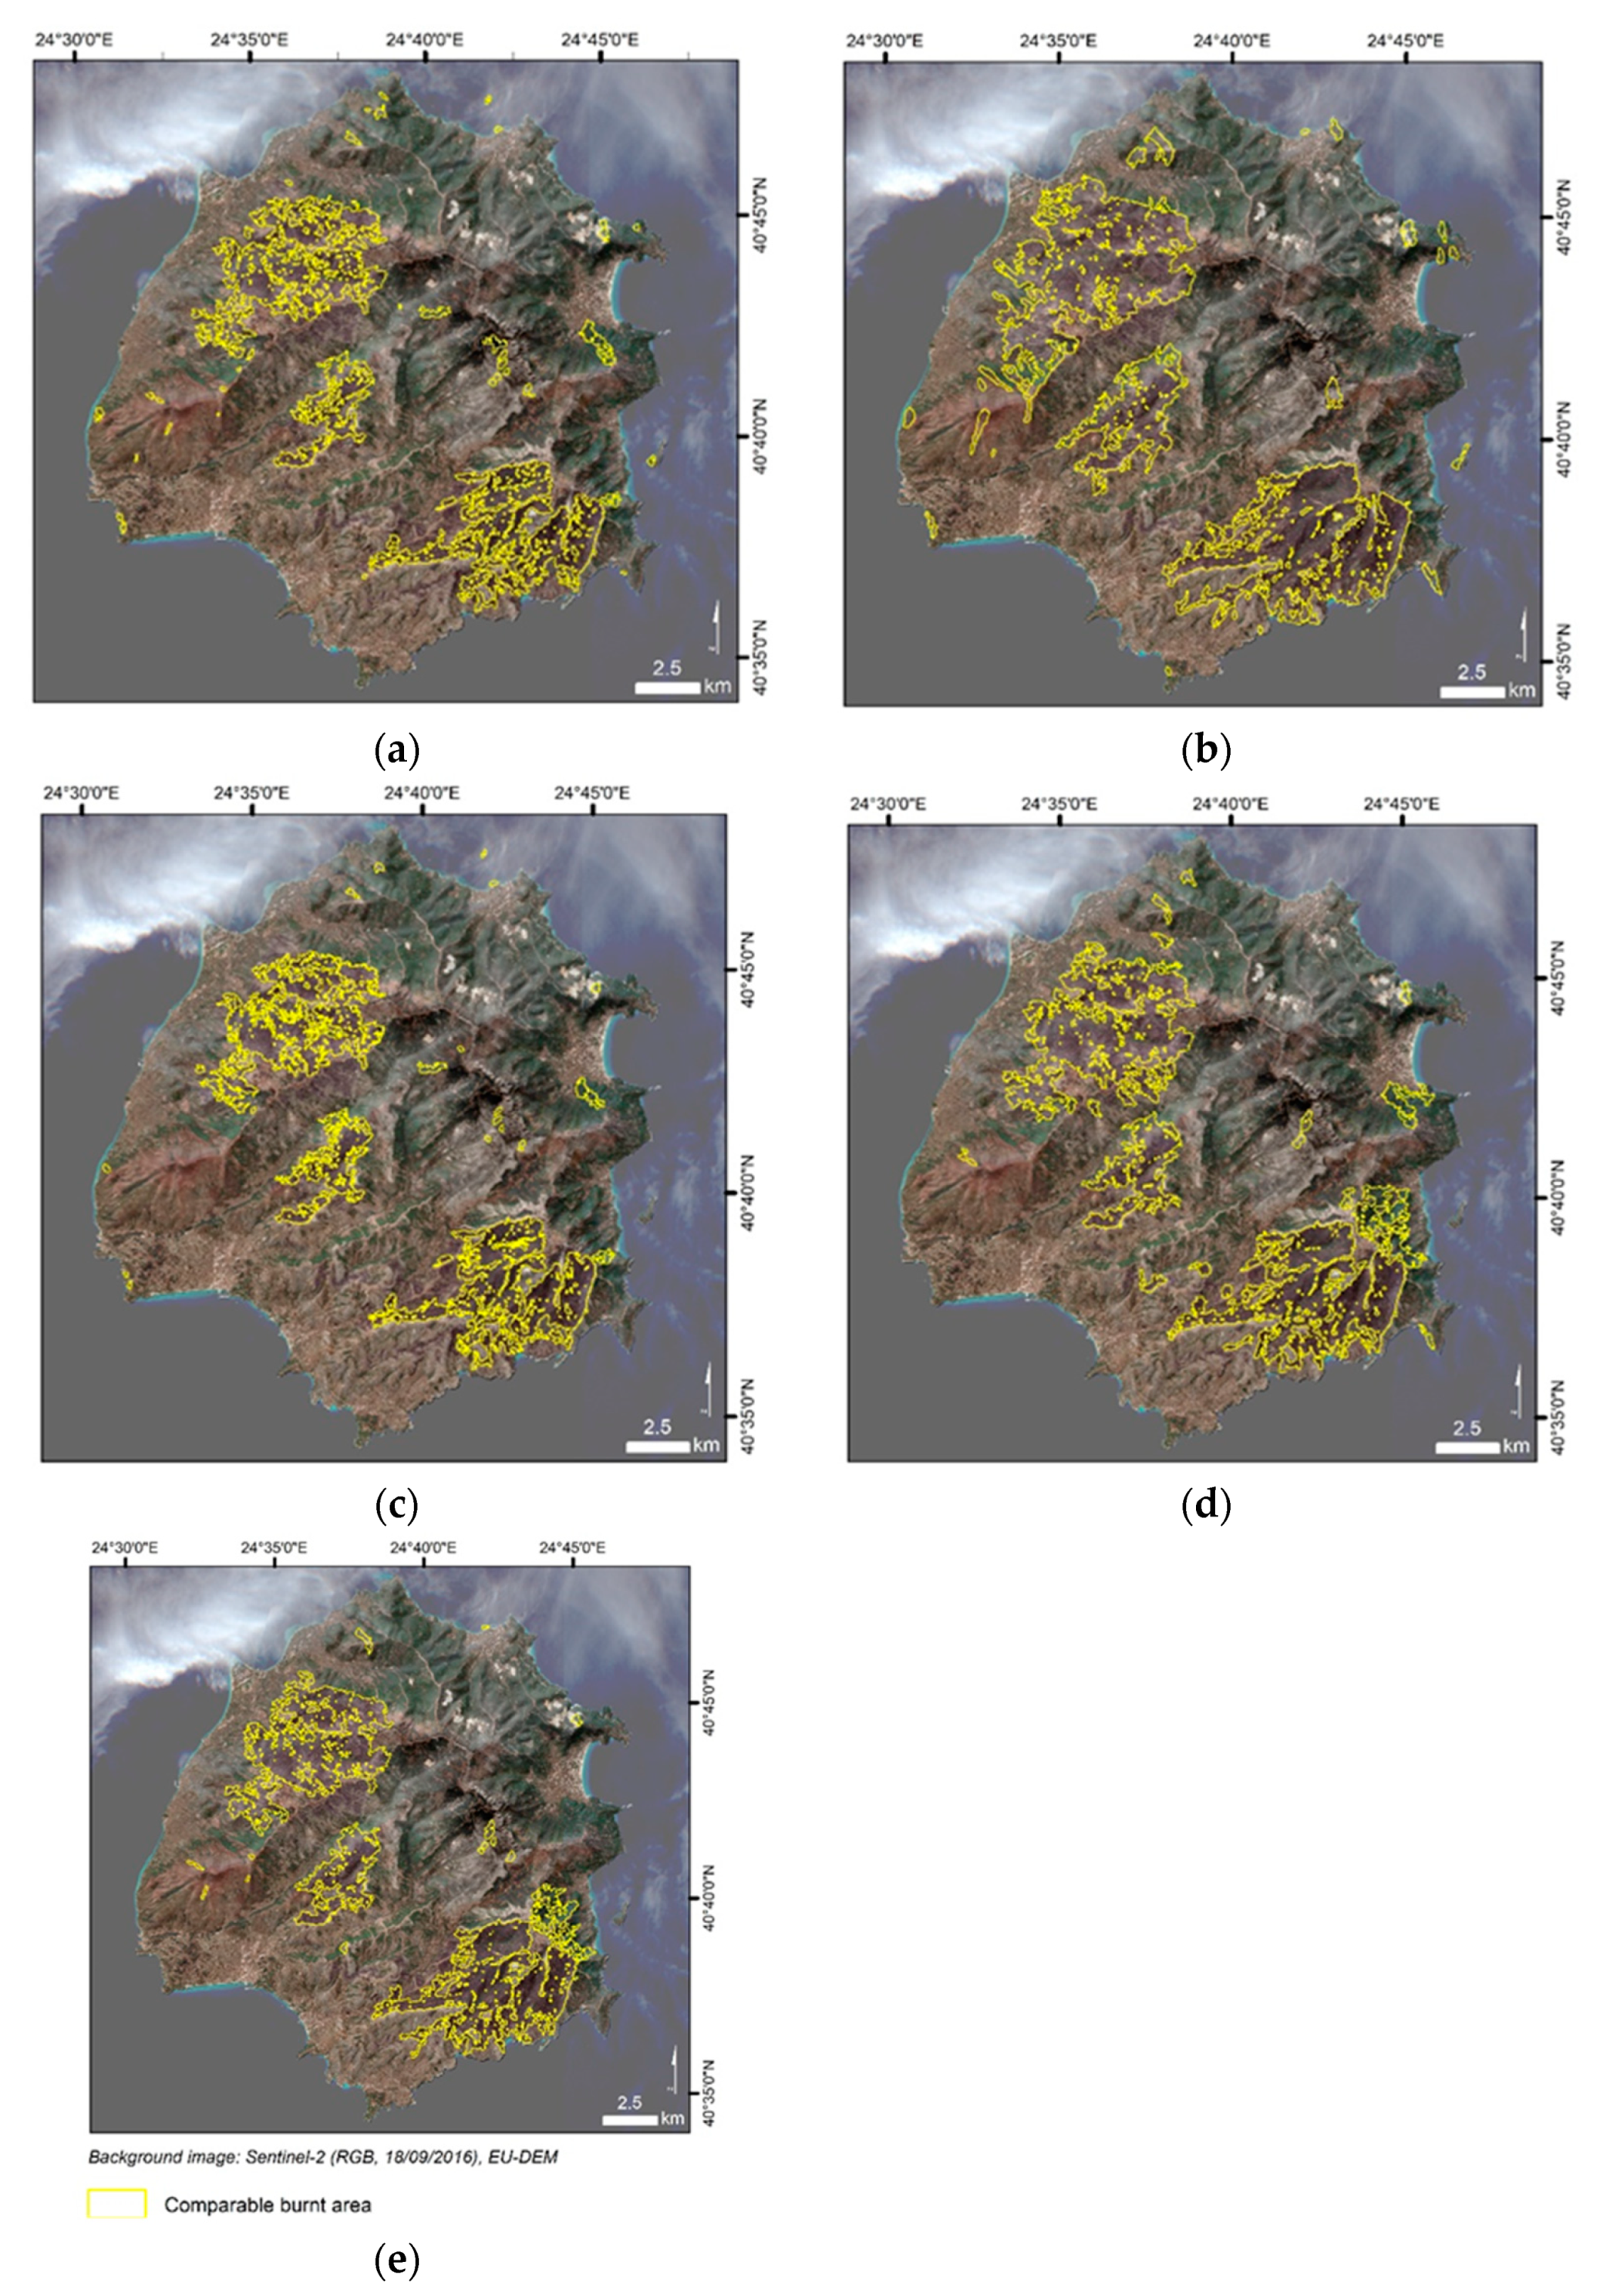
Figure 7 shows in yellow the five different comparable burnt area data created. In all frames background information includes a natural color composition of the post-event Sentinel-2 image of the 18th of September 2016 (bands B2, B3 and B4 of Sentinel-2) over elevation information to give an idea of the topography of the area. Frames a, b and c show the comparable burnt area data created using the SAR data acquired in ascending mode with single-polarization in the first two—VV and VH respectively—and double polarization in the last, while frames d and e represent comparable data created using SAR data acquired in both modes and using single-polarization—VV and VH respectively. In all cases, three main burnt areas are located, and the main differences correspond to scattered areas smaller in size compared to those three. However, noticeable differences in the delineation should be highlighted, such as the classifications in b and d, which are the ones that cover a bigger extent, followed by that in frame e. Leaving the differences in the delineation aside, other differences between the classifications correspond to gullies or mountainsides incorrectly classified as burnt due to shadowing in the SAR data, most of the time being missclassified areas located in the mountainsides opposing the acquisition of the images—ascending images show those areas in northern mountainsides and vice versa. The visual comparison of these results shows the importance of the acquisition mode with respect to the topography of the terrain, which might lead to shadowed areas being incorrectly classified as burnt in, together with the effect of the incidence angle of the image shown in
Figure 6.
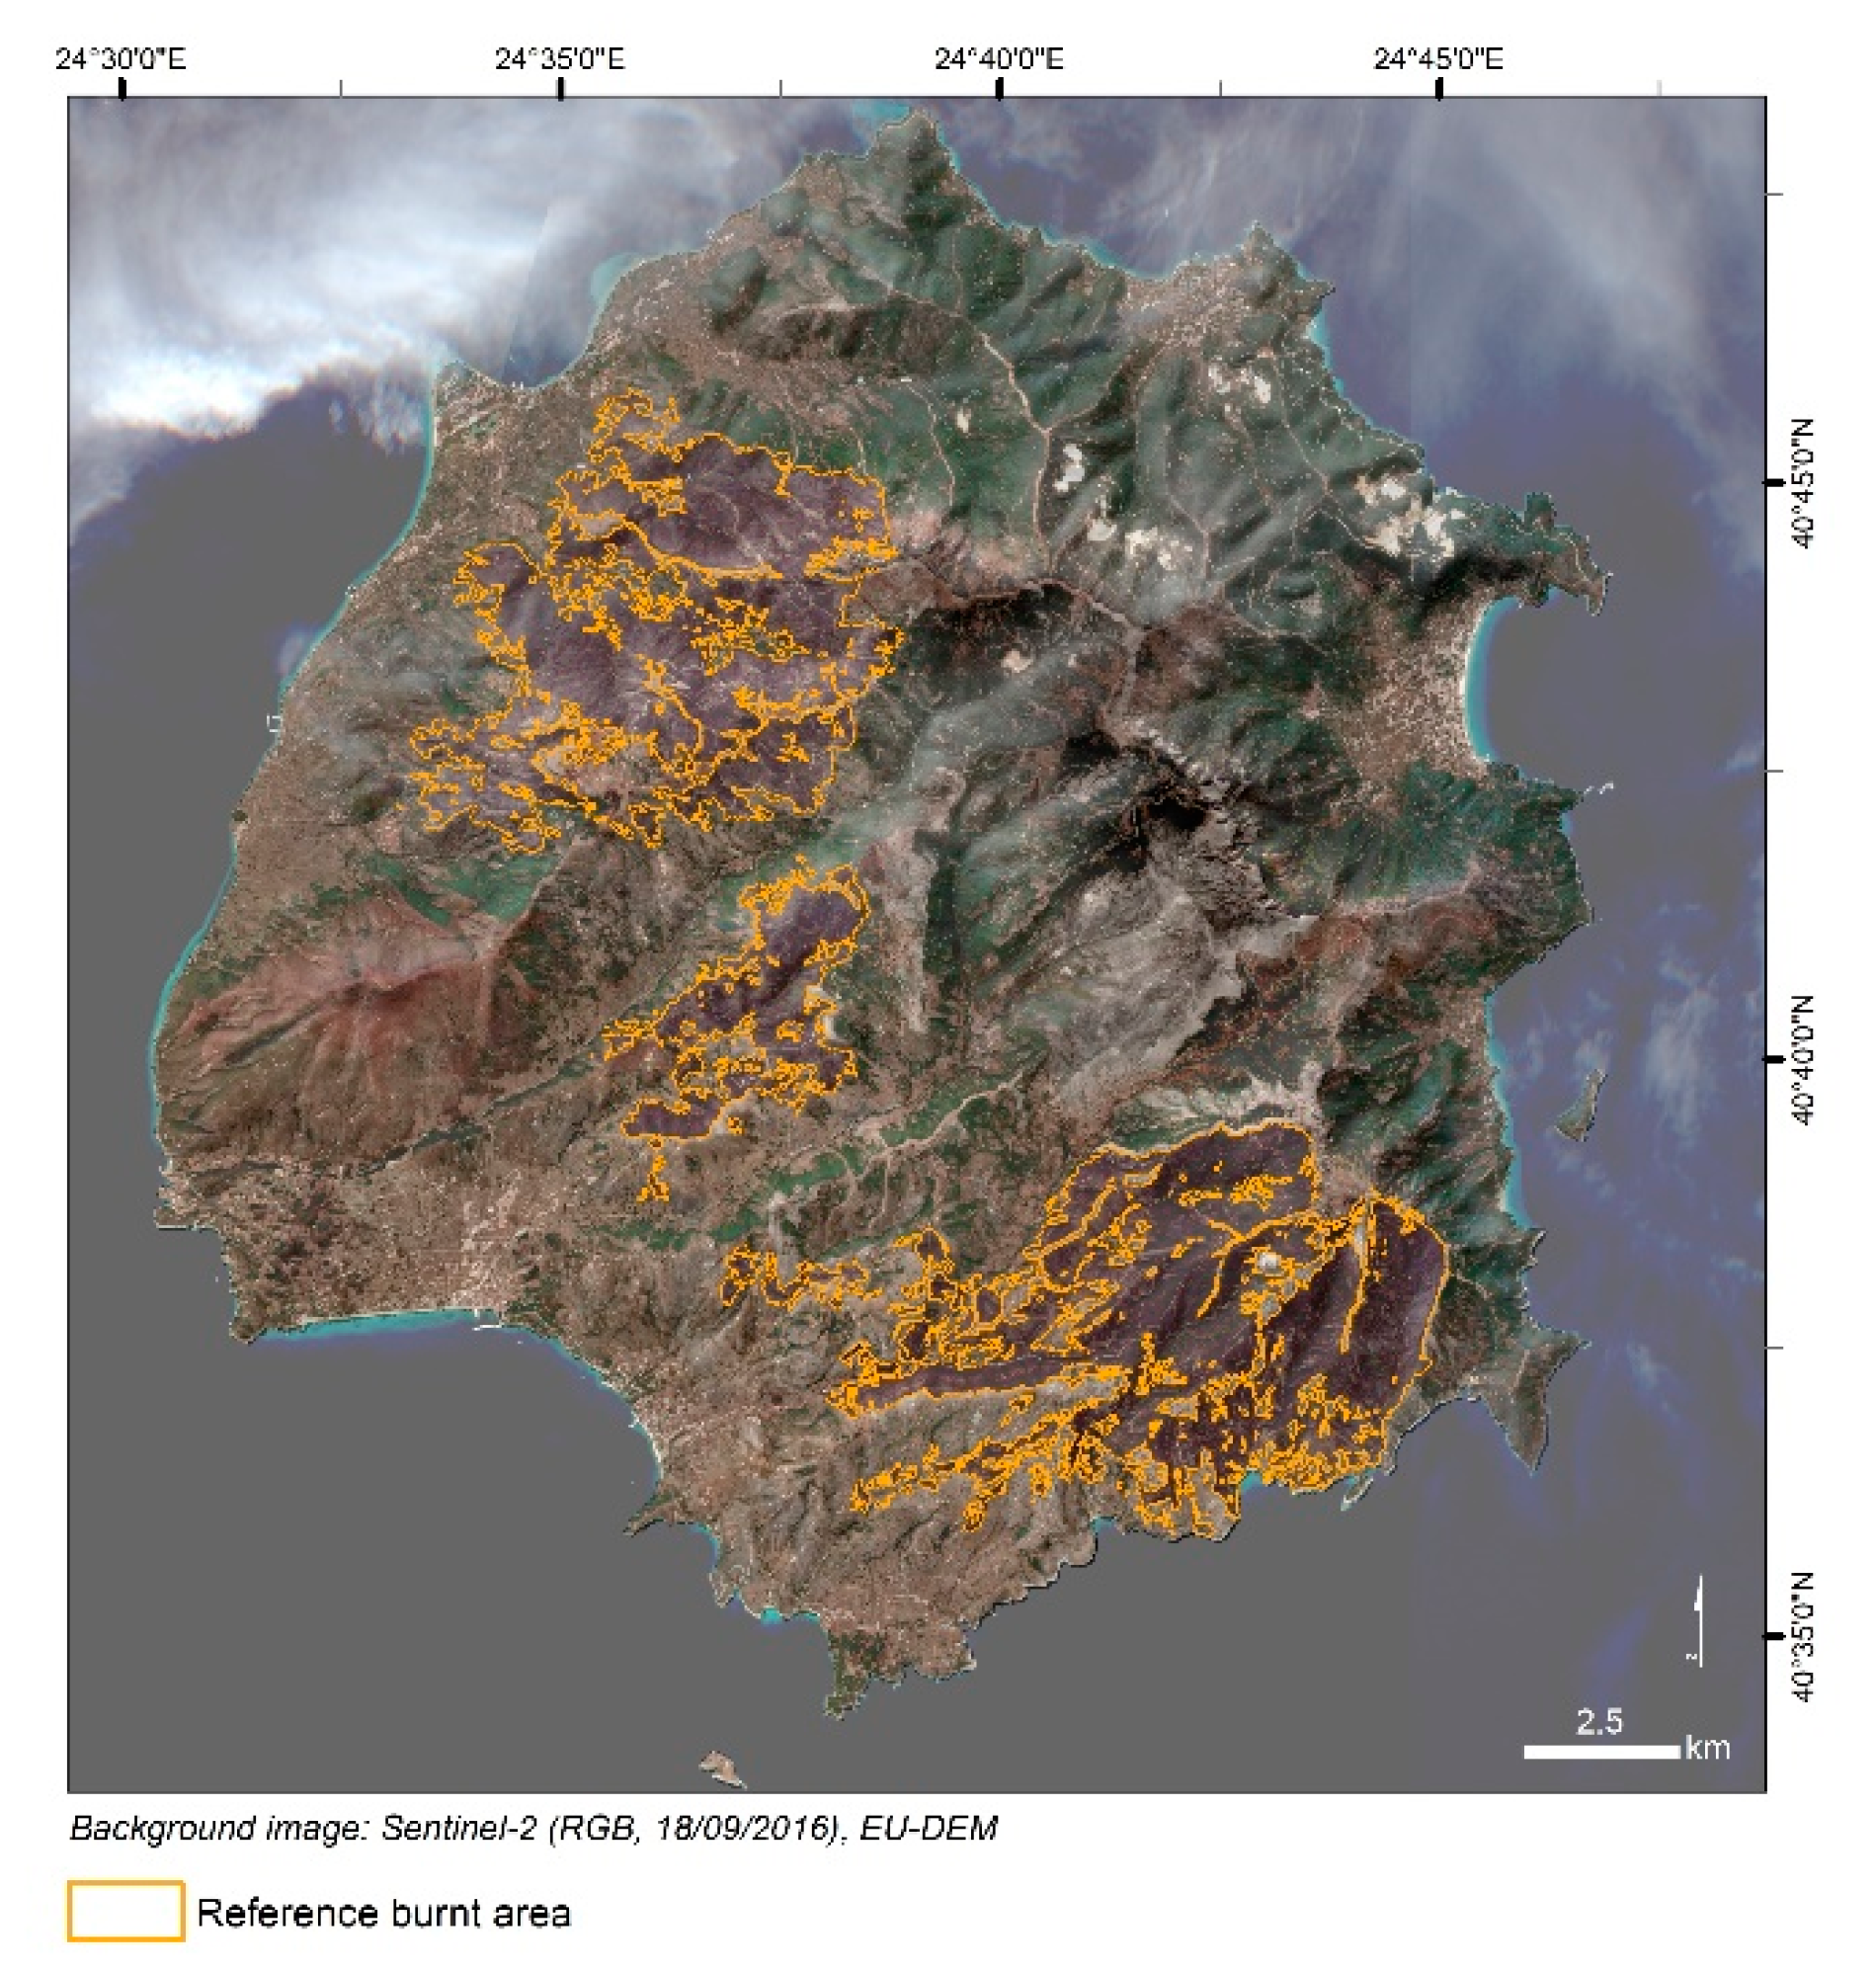
Figure 8 shows the reference data created using Sentinel-2 images and ancillary data. This reference data shows two big separated burnt areas and a smaller burnt area located between both. In this figure background information includes a natural color composition of the post-event Sentinel-2 image of the 18th of September 2016 (bands B2, B3 and B4 of Sentinel-2) and elevation information to give an idea of the topography of the area. Burnt areas are located in the skirts of the mountains, with mountain tops acting as natural barriers to stop the fire from spreading to the other hillside.
Table 4 shows the results of the validation of the comparable burnt area data classified using the MTC images with the reference burnt area detected with optical images and the template shown in
Table 3. In this table, OA (%) corresponds to overall accuracy taking the whole area of interest (AOI) into consideration, OAu (%), Ou (%) and Cu (%) correspond to the overall accuracy, omission error and commission values respectively, obtained taking into consideration the union of the Sentinel-1 derived burnt area with the reference burnt area. OA and OAu values are similar in all cases.
The results of
Table 4 show the usefulness of considering the union of the crisis information in both layers to calculate accuracy measures. While the overall accuracy taking the whole AOI is 96% or more in all cases, the overall accuracy taking the union of the crisis information in both layers’ ranges between 57% and 66%.
4. Discussion
Coherence, defined as the cross-correlation product derived from two co-registered complex-valued SAR images, is calculated between two images acquired in identical modes [
19]. It depicts the similarity of the radar reflection between them. Any changes in the complex reflectivity function of the scene are manifested as a decorrelation in the phase of the pixels between two images, [
20] resulting in a loss of coherence. Coherence was calculated for each ascending and descending pair of the images shown in
Table 1, using both available polarizations, assuming that the loss of coherence between two images was completely due to the event. However, this assumption can only be made if the images used to calculate the coherence have been acquired with a short time gap and if external sources state that the event of interest is the only possible explanation for the loss of coherence. Whenever other sources are suspected, the method might lead to erroneous results regarding the effects caused by a particular event. The return period of Sentinel-1 images is of 6 days at the equator, even if revisit time is higher in higher latitudes [
12], meaning that the coherence image will reflect changes in the coherence occurred in the time gap.
The best results were obtained using the combination of the MTC derived from ascending and descending modes together, independent of the polarization used. This result seems to indicate that combining ascending and descending images minimizes the effect of the topography.
It should be highlighted that no major differences were encountered when using only one polarization in the creation of comparable data. However, VH polarization tended to increase the commission errors for the union of the layers. This could be caused by the fact that this polarization is more sensitive to volume scattering [
21] and therefore the coherence image might show a low response in those areas where the canopy of the trees has changed for different reasons than the effect of the fire. In this study, differences between polarizations were not noticed when using them separately, and what is more, the worst results were observed when combination of both polarizations was taken into account. In the previous study carried out by the same group [
8], only VH polarization was tested as VV was not available, and therefore the effect of the polarization could not be analyzed.
It is noticeable that images acquired in the descending mode gave worse results, with far more burnt area detected than on those acquired in ascending mode, independent of the polarization. Differences between the results using ascending and descending data could be attributed to the differences in the incidence angle of the images. Those images acquired in ascending mode showed small incidence angles that allow the radar beam to penetrate further into the canopy [
21]. Results show the importance of the incidence angle of the SAR data for the burnt area delineation. Lower incidence angles in the ascending mode resulted in a more accurate delineation, independent of the polarization. Higher incidence angles, like the ones of the descending mode, resulted in very poor burnt area delineation, regardless of the polarization. Finally, it is noticeable that the best results were obtained when the image that included both acquisition modes, ascending and descending, was classified. This might be due to the effect of the topography of the terrain, as burnt areas shadowed in each image could be illuminated on the other. The effect of the steep terrain in the results could have been avoided by carrying out a topographic correction, which was not included in the workflow. The repetition of the approach used in this study in a flat area or in areas with different topography would confirm these results. The influence of the terrain, which could not be studied in the fire in Spain [
8] was expected and here analyzed.
Despite the applicability of Sentinel-1 images to delineate burnt areas, doubtful cases and limitations of the methodology should be pointed out. Some discrepancies appear in areas where the burnt area perimeters are poorly defined in MTC images due to the terrain effects (relief, land cover, orientation of the terrain and any other aspects of the land). Moreover, bare soils affected by fire are difficult to classify as burnt using the MTC images as this methodology is based on changes in the characteristics of the observed covers. Similar results had been observed in the previous study [
8], when only the burnt area delimited by photo-interpretation over a VHR optical image included those areas. It should be therefore highlighted that similar limitations are present when using optical imagery to delineate burnt areas in sparse vegetation unless the spatial resolution allows a detailed delimitation of the affected areas.
When a single polarization and a single acquisition mode were considered, the best classification results were obtained using the VH polarization of Sentinel-1, see
Table 2. It was noticed that the use of both polarizations did not improve the results, as commissions increased.
Data used as reference was derived from optical imagery, calculating the difference burnt area index (dBAI) with the pre- and post-event images. However, it should be pointed that values of the dBAI, based on the reflectance of the top of canopy, are conditioned by the nature of the event. If a fire spreads rapidly, leaving areas non-burnt or almost non-burnt, or when the fire affects the ground but not the canopy of vegetation, the response of the dBAI might lead to inaccuracies of the data. These inaccuracies could have a direct impact on the validation results.
Further analysis on the subject might be needed in areas with different characteristics, such as flat terrain, or an area covered by dense vegetation, e.g., Atlantic forests, in order to assess the effects of the polarization and the acquisition modes.
5. Conclusions
The return period of Sentinel-1, that allows to calculate coherence with images acquired in a time gap of 6 days [
12], gives a good possibility to detect changes in coherence caused by a given event or disaster, allowing to take the assumption that those changes are only due to the considered event or disaster.
The information provided by the MTC images was adequate to automatically delineate the extent of the burnt area. These results are in line with the study carried out by the same group [
8]. The possibility to test the methodology developed in [
8] in steep terrain in an area with more sparse vegetation showed the importance of having images acquired in ascending and descending modes to decrease the influence of the terrain in the results. These results are in line with similar findings [
13].
The highest overall accuracy for the union of the crisis information in both layers under comparison was observed when the classification was carried out using the combination of the MTC color composition calculated using the Sentinel-1 images acquired in ascending and descending modes.
Regarding the results depending on the polarization, and in line with the conclusions in [
15], VH performed slightly better than VV polarization. Nevertheless, it should be stated that those differences are not significant, and more studies should be carried out to be able to establish a relation between the polarization and the type of vegetation burnt or the characteristics of the area under study.
The integration of automatic classification of MTC images to detect burnt areas with the use of optical imagery or other ancillary data (e.g., EFFIS) to refine the fire delineation by photo-interpretation would be suitable to obtain accurate thematic layers. The main advantage of the use of Sentinel-1 would be its short revisit time and the possibility to overcome the limitations that the presence of clouds or smoke present, being, therefore, a valuable source of data in the frame of Copernicus EMS Rapid Mapping.
It should be outlined that the pixel size of the Sentinel-1 images, which is 10 m at its best and approximately 14 m after the calculation of the coherence, directly affects the accuracy and the precision of the resulting thematic layer, and therefore, the working scale. In the scope of the present study, differences in the delineation that could be caused by differences in the spatial resolution were avoided by creating the reference data based on Sentinel-2. However, and with regards to the creation of fire delineation products in the scope of Copernicus EMS Rapid Mapping service, limitations caused by the spatial resolution compared to the spatial resolution of VHR sensors available to the service through the Copernicus Space Component Data Access (CSCDA) [
22] should be considered. This portal offers a wide variety of sensors, both optical and radar, to the service providers of the Copernicus EMS Mapping components, including most of the commercial VHR, which are usually preferred by potential users to create the crisis information in the products.
Although the optical imagery allows a more straightforward burnt area delineation, the potential use of SAR data obtaining equivalent results is significant in an emergency context given that radar sensors acquire images continuosly (day and night) and in all weather conditions (not affected by the presence of clouds).
Differences between the overall accuracy calculated taking the whole AOI into consideration and the overall accuracy taking the union of the crisis information—burnt area—in both layers show the importance of the choice of the approach to calculate the accuracy measures if results of different studies have to be compared. If only the first is considered, it could bring confusion regarding the possibility to delineate burnt area based on Sentinel-1 with respect to that obtained from Sentinel-2 imagery.


