Article

Examination of Surface Wind Asymmetry in Tropical Cyclones over the Northwest Pacific Ocean Using SMAP Observations

1
School of Marine Sciences, Nanjing University of Information Science & Technology, Nanjing 210044, China
2
Southern Marine Science and Engineering Guangdong Laboratory (Zhuhai), Zhuhai 519082, China
3
Hurricane Research Division at NOAA/AMOL and CIMAS at University of Miami, Miami, FL 33149, USA
4
Bedford Institute of Oceanography, Fisheries and Oceans Canada, Dartmouth, NS B2Y 4A2, Canada
*
Author to whom correspondence should be addressed.
Remote Sens. 2019, 11(22), 2604; https://doi.org/10.3390/rs11222604
Submission received: 9 October 2019 / Revised: 31 October 2019 / Accepted: 4 November 2019 / Published: 6 November 2019
(This article belongs to the Special Issue Tropical Cyclones Remote Sensing and Data Assimilation)

Abstract

:
Tropical cyclone (TC) surface wind asymmetry is investigated by using wind data acquired from an L-band passive microwave radiometer onboard the NASA Soil Moisture Active Passive (SMAP) satellite between 2015 and 2017 over the Northwest Pacific (NWP) Ocean. The azimuthal asymmetry degree is defined as the factor by which the maximum surface wind speed is greater than the mean wind speed at the radius of the maximum wind (RMW). We examined storm motion and environmental wind shear effects on the degree of TC surface wind asymmetry under different intensity conditions. Results show that the surface wind asymmetry degree significantly decreases with increasing TC intensity, but increases with increasing TC translation speed, for tropical storm and super typhoon strength TCs; whereas no such relationship is found for typhoon and severe typhoon strength TCs. However, the degree of surface wind asymmetry increases with increasing wind shear magnitude for all TC intensity categories. The relative strength between the storm translation speed and the wind shear magnitude has the potential to affect the location of the maximum wind speed. Moreover, the maximum degree of wind asymmetry is found when the direction of the TC motion is nearly equal to the direction of the wind shear.

Graphical Abstract

1. Introduction

Tropical cyclones (TCs) can induce storm surges and intense rainfall during landfall, thereby causing serious damage to society and affecting the safety of residents in coastal areas. Therefore, in operational forecast centers, risk evaluation of potential TC damage is becoming increasingly significant. Obtaining key parameters is vital for TC forecasts, including the maximum wind speed (MWS), radius of maximum wind (RMW), and wind field distribution. Meteorologists usually determine TC intensity by identifying the MWS; thus, understanding the two-dimensional surface wind structure has great importance.
Over the past decades, efforts have been made to understand the possible reasons for TC surface wind asymmetry by considering large-scale environmental impacts, such as the beta effect, vertical shear of environmental flow, and uniform environmental flows, on storm intensity. Thus, it is suggested that these environmental effects induce quasi-stationary asymmetries near the TC eyewall and exert inhibitory actions on storm intensity [1]. Moreover, previous studies have shown that other factors may affect TC structural asymmetries, including variations in surface friction [2], Rossby waves [3], and blocking actions [4].
Storm motion is one of the major impact factors on an asymmetric structure in the TC surface wind field. The effect of storm movement induces the wind field to be asymmetric on two sides of the storm motion direction, with higher winds in the right forward quadrant than in the left, and the effect of surface friction leads to front-rear asymmetry due to the storm motion [5]. However, TC surface wind fields are axisymmetric when simulated with the traditional parametric hurricane wind profile model [6]. An asymmetric parametric wind profile model was later developed when the impact of storm movement was considered, which maximizes the wind asymmetry to the right side of the forward storm movement [7]. Moreover, early studies found that the effect of storm motion contributes to convective asymmetries, with updrafts being stronger in the right forward quadrant, based on a linear analytical boundary layer flow model in a moving TC [8].
Vertical wind shear also has an important effect on hurricane structural asymmetry [9]. Although the storm motion is traditionally considered to be the primary factor that contributes to the TC structural asymmetry, its effect is significantly weaker than the influence of vertical wind shear on TC convection, based on lightning data in TCs [10]. Recent studies have shown that large environmental vertical wind shear can induce strong asymmetric structures observed in hurricanes and typhoons [11,12]. Moreover, two kinds of rain-rate data have been used to investigate TC rainfall asymmetry; these data show that precipitation asymmetry is much more associated with wind shear than storm motion [13]. Mesoscale analysis data from four typhoon seasons between 2004 and 2007 acquired from the Japan Meteorological Agency (JMA) were used to investigate the azimuthal wavenumber −1 asymmetry [14] of surface winds in the typhoon core region, suggesting that the phenomenon of asymmetric surface wind is related to both the vertical wind shear and also to the storm motion. Moreover, a previous study has reported that the maximum surface wind speed occurs on the left side of the storm motion when the direction of shear is approximately identical to the storm heading [15].
Airborne stepped-frequency microwave radiometer (S-FMR) hurricane wind observations at the surface and flight level have been used to study the effect of storm movement and vertical wind shear on surface wind asymmetry in hurricanes [16]. At the flight level, the wavenumber −1 wind speed asymmetry amplitude increases with storm translation speed, while no obvious increasing tendency can be found at the surface. SFMR can only observe along-track wind speeds in TCs, not the complete two-dimensional surface wind field of an individual storm [17]. Satellite scatterometers, such as Ku-band QuikSCAT, have the potential to measure TC surface wind fields [18]. Scientists have used QuikSCAT winds to qualitatively investigate the link between typhoon surface wind asymmetry, as well as both the vertical wind shear and storm motion [19]. The highest wind speeds tend to arise favorably on the left side of the shear and on the right side of the storm movement. However, QuikSCAT cannot accurately provide the maximum winds in the eyewall region of most TCs because of radar signal saturation and attenuation by rain [20]. By conducting a composite analysis of TC wind fields in each TC-inclined region and different TC intensity conditions, based on rain-corrected scatterometer surface winds, a recent investigation has shown that the entire TC surface wind asymmetry is located to the left side of the storm movement, in a motion-relative frame, for all areas and for weaker TCs, when the movement velocity is removed [21]. For the purpose of further study of the effect of wind shear and storm motion on TC surface wind asymmetry, a low-wavenumber analysis method [16] was adopted to quantify the asymmetry index; thus, it was shown that tropical storms exhibit the most obvious surface wind asymmetry characteristics among all TC intensity groups [22]. However, whether the vertical wind shear or the storm motion dominantly affects TC surface wind asymmetry remains an open question.
The L-band spaceborne radiometer is an excellent passive microwave sensor for remotely measuring the wind speed in TCs, because it is much less susceptible to rain attenuation than Ku-band scatterometers. Recent investigation has shown that there is a good relation between the wind-induced brightness temperatures from the SMAP L-band radiometer and TC wind speeds, and that brightness temperatures are not saturated under extreme weather conditions [23], thereby providing an opportunity for remote sensing of ocean surface winds during severe storms [24,25]. Compared to Ku-band scatterometers, the L-band radiometer can provide more accurate measurements of high winds in extreme weather conditions. Although aircraft-based platforms, such as SFMR, are useful instruments to measure TC-force wind speeds in the along-track direction, they cannot provide comprehensive wind speed measurements over the entire two-dimensional spatial domain. However, the SMAP L-band radiometer has a wide swath and therefore has the capability of providing complete and accurate wind speed measurements in severe storms. Thus, it is possible to study TC wind asymmetry using SMAP winds.
In this paper, our focus was the study of surface wind asymmetry in relation to both factors, namely storm motion and vertical wind shear, for the first time, using SMAP wind measurements of TCs between 2015 and 2017 over the Northwest Pacific Ocean. Our motivation was to probe the roles of storm motion and vertical wind shear in affecting the surface wind speed asymmetry degree under differing TC intensity conditions. The sensitivity of the surface wind asymmetry to the difference between the storm motion direction and wind shear direction was also investigated. The remaining part of this paper is organized as follows. The data and the methodology are described in Section 2 and Section 3. The results and discussion are presented in Section 4 and Section 5. Conclusions are summarized in Section 6.

2. Data

2.1. SMAP Radiometer Winds

In this study, SMAP radiometer winds in storms were used to explore the degree of surface wind asymmetry in TCs. The NASA SMAP mission was successfully launched in January 2015 and started to provide data to the science community in April 2015. SMAP was originally designed for the purpose of measuring soil moisture and the freeze-thaw state [26], by using synergistic observations from an onboard passive radiometer and active scatterometer. The spatial resolution and swath of the SMAP L-band radiometer are about 40 and 1000 km, respectively. Moreover, it has been demonstrated that the SMAP radiometer is an excellent microwave instrument to observe ocean surface winds in storms [23,24,25]. SMAP wind data with a spatial resolution of 0.25° × 0.25° were publicly obtained through the remote sensing systems website (www.remss.com/missions/smap/). The SMAP radiometer has the ability to provide accurate estimates of storm intensity (~70 m/s) and hurricane-force wind radii, even in heavy rainfall conditions [23]. In order to investigate surface wind asymmetry in TCs, a total of 125 samples of SMAP-measured surface wind fields for 43 TCs were acquired over the Northwest Pacific Ocean between April 2015 and December 2017. Table 1 summarizes the TC names and corresponding numbers of SMAP observations for each TC.

2.2. TC Track Data and Environmental Wind Data

The direction and magnitude of the TC translational motion were determined from the Best Track data from the Joint Typhoon Warning Center (JTWC) (https://www.metoc.navy.mil/jtwc/jtwc.html). It is difficult to accurately determine the TC center from SMAP wind data due to its sparse resolution. Thus, Best Track data were used to derive the TC center positions from SMAP winds via linear interpolation. The temporal resolution is 6 h for the JTWC Best Track data. The environmental vertical wind shear was estimated by calculating the change in winds at 850 and 200 hPa levels averaged within a circle with a radius of 300 km about the storm center, from the NCEP Climate Forecast System Reanalysis (CFSR) Version 2 (apdrc.soest.hawaii.edu/dods/public_data/CFSv2). The spatial and temporal resolutions of the CFSR data are 0.5° × 0.5° and 1 h, respectively.

3. Methodology

3.1. Asymmetry Parameter

The SMAP wind speeds were used to estimate the degree of TC wind speed asymmetry by using an asymmetry parameter (ε). Following [4], the dimensionless asymmetry parameter was defined as
ε = V m a x V ¯ R M W V ¯ R M W
where V m a x is the maximum wind speed, and   V ¯ R M W is the average azimuthal wind speed at the location of the radius of the maximum wind (RMW). In this study, V m a x and V ¯ R M W were derived from the SMAP surface wind data. Larger values of the asymmetry parameter correspond to a larger degree of asymmetry for the TC wind field.
The asymmetry parameter for each TC case was estimated following Equation (1). All TCs were divided into two groups according to the asymmetry degree parameter. Strong or weak asymmetry was denoted by the asymmetry parameter, corresponding to larger or smaller values than 0.2, respectively. Figure 1 shows the geographical locations of these two groups of TCs, indicating no apparent difference in spatial distributions between the two groups. The linear effect of storm motion was removed by subtracting half of the TC translation speed [27] from the SMAP surface wind speed data, and the asymmetry parameter was recalculated.

3.2. Composite Wind Field Analysis

A composite wind field analysis method was used to investigate TC surface wind asymmetry. Compared to an individual case analysis, composite wind field analysis of a group of TCs can directly reveal the overall characteristics of the surface wind field, including the average intensity and asymmetric structure. Since the composite field is derived from the average of the individual fields, the noise in the SMAP wind data is eliminated, to a certain extent. Accordingly, TC asymmetric structure can be elucidated, based on composite analysis, which thus enabled us to explore the effect of various factors on TC surface wind asymmetry.
The basic steps for the composite analysis were as follows: (1) Select the SMAP wind field within a radius of 250 km from the TC center to ensure that the composite wind fields can exhibit the essential asymmetric structural features; (2) rotate the TC wind fields so that the forward direction of the composite field coincides with the direction of the wind shear or storm motion; and (3) bin average the TC wind fields as a function of the distance from the TC center and normalize, by using the radius of maximum wind speed (RMW) and the maximum wind speed (MWS).

3.3. Grouping Approach and Coordinate Systems

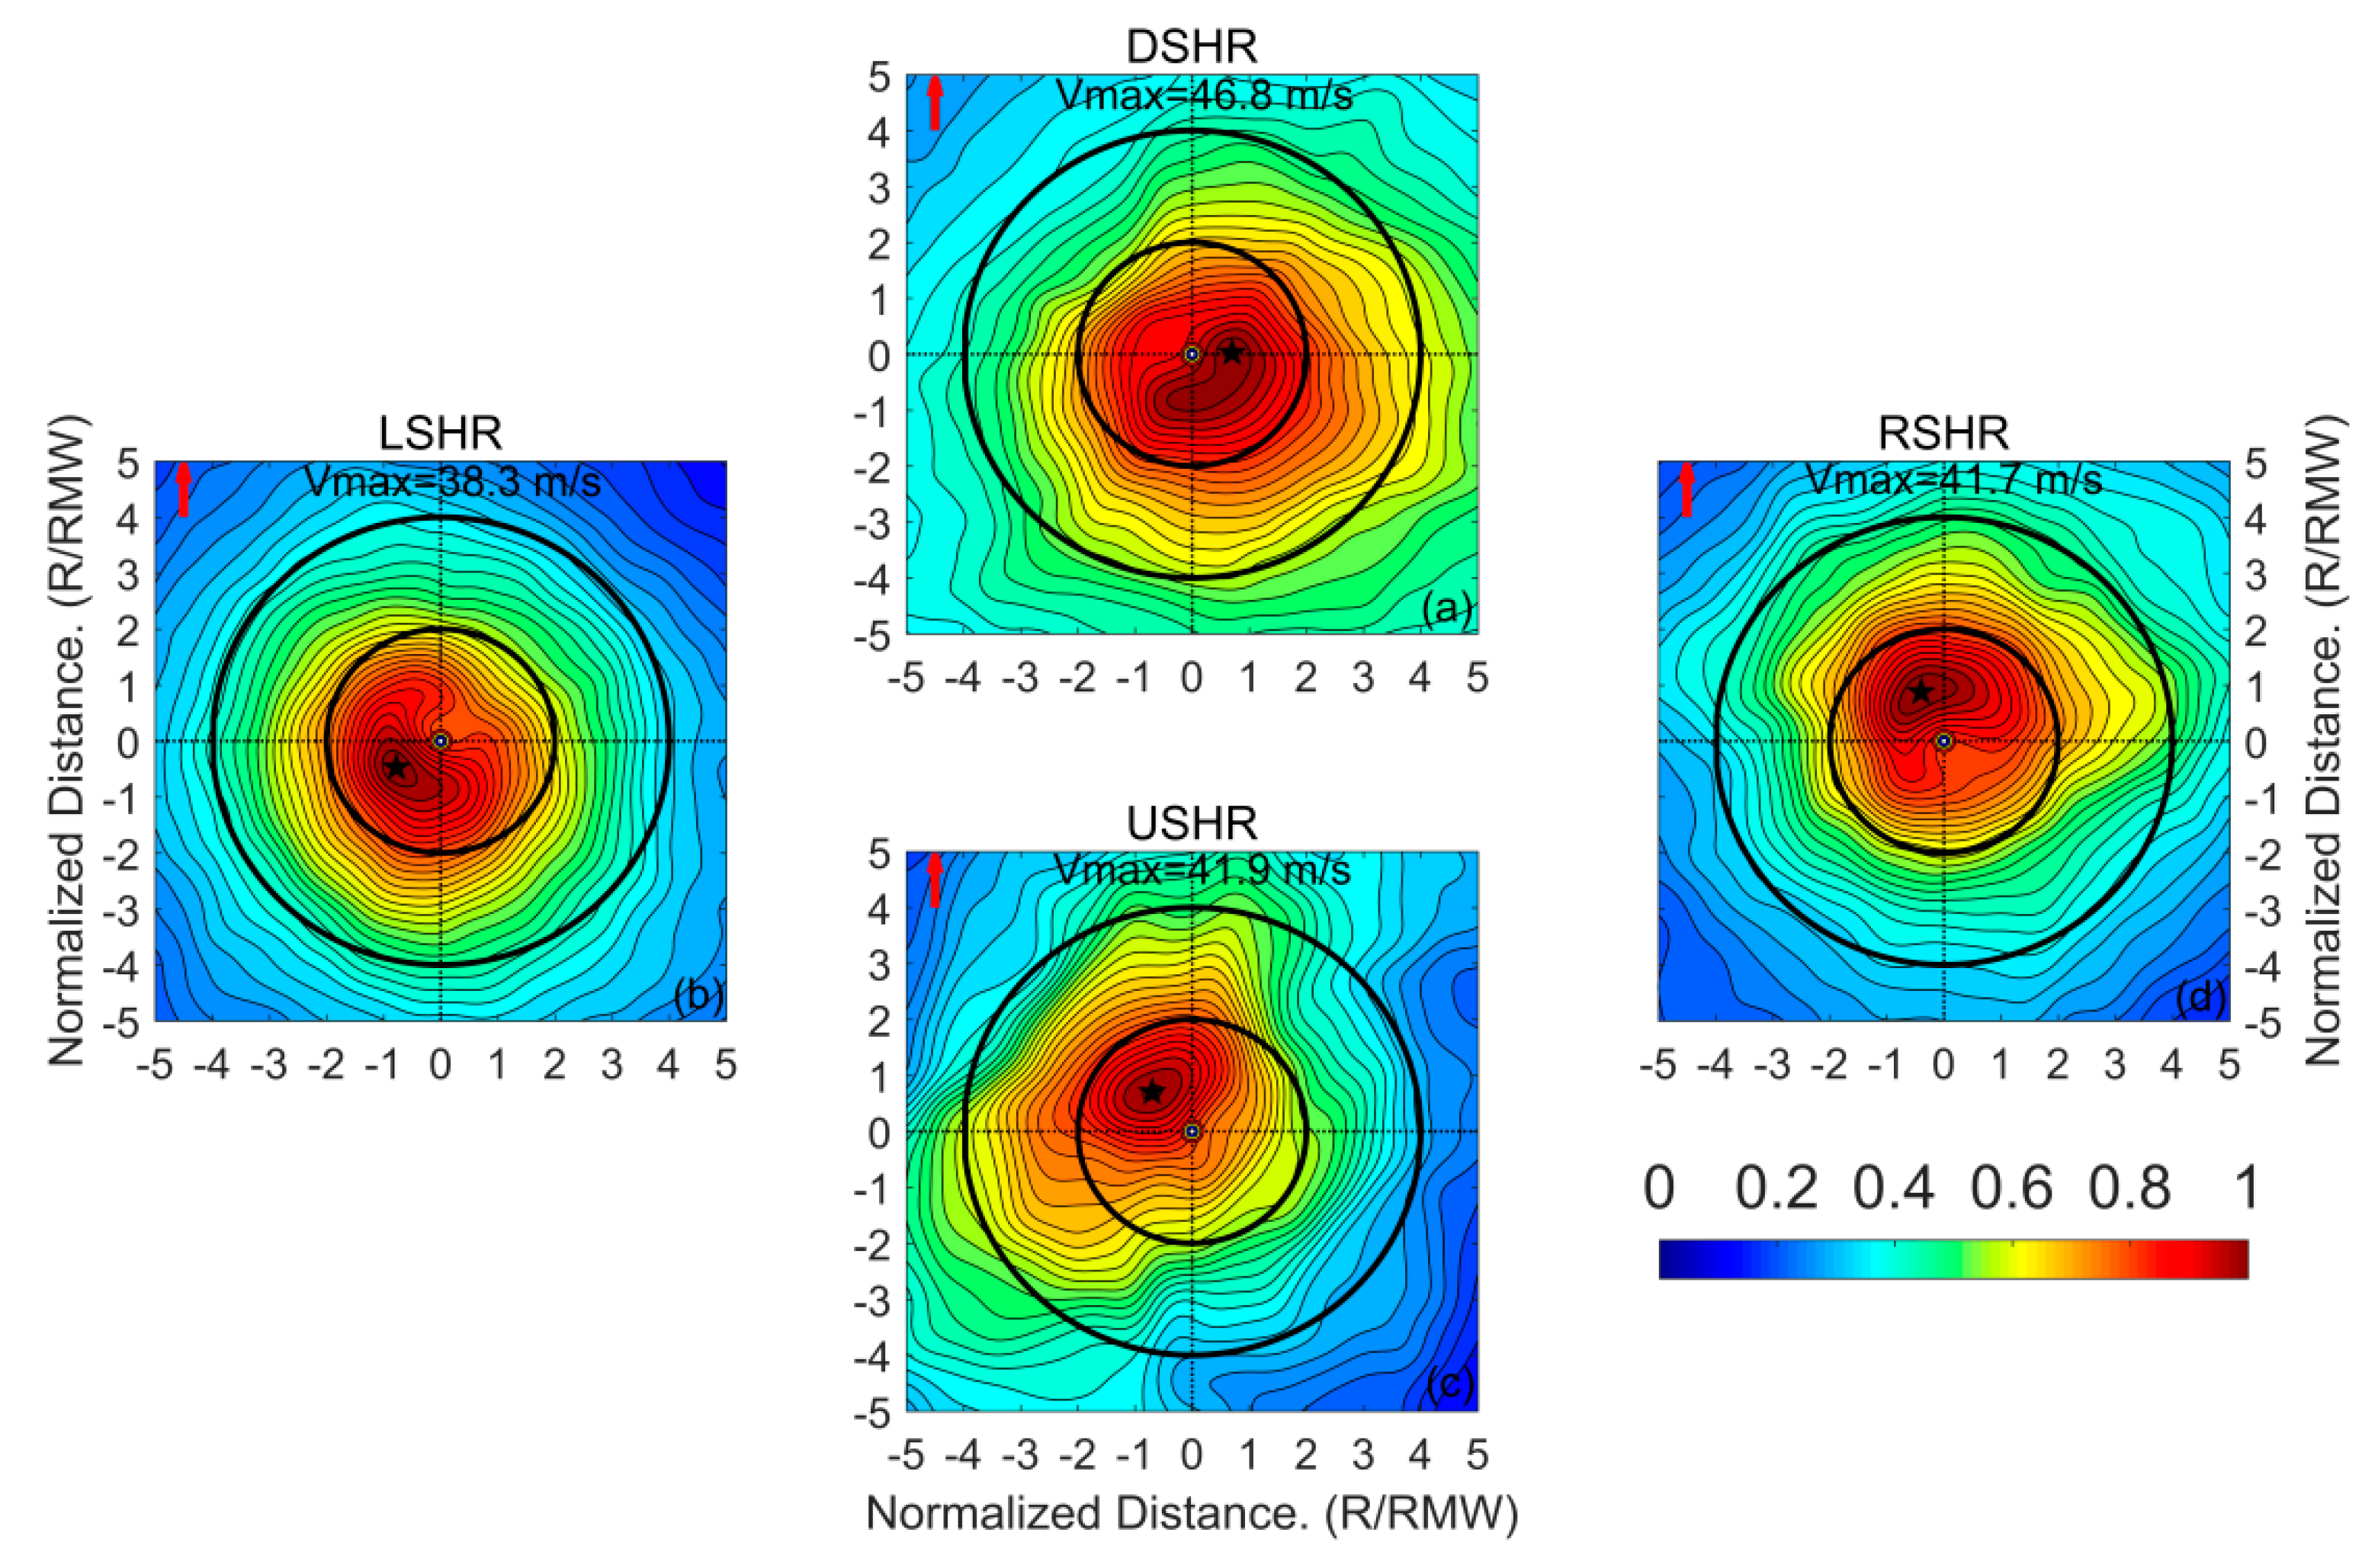
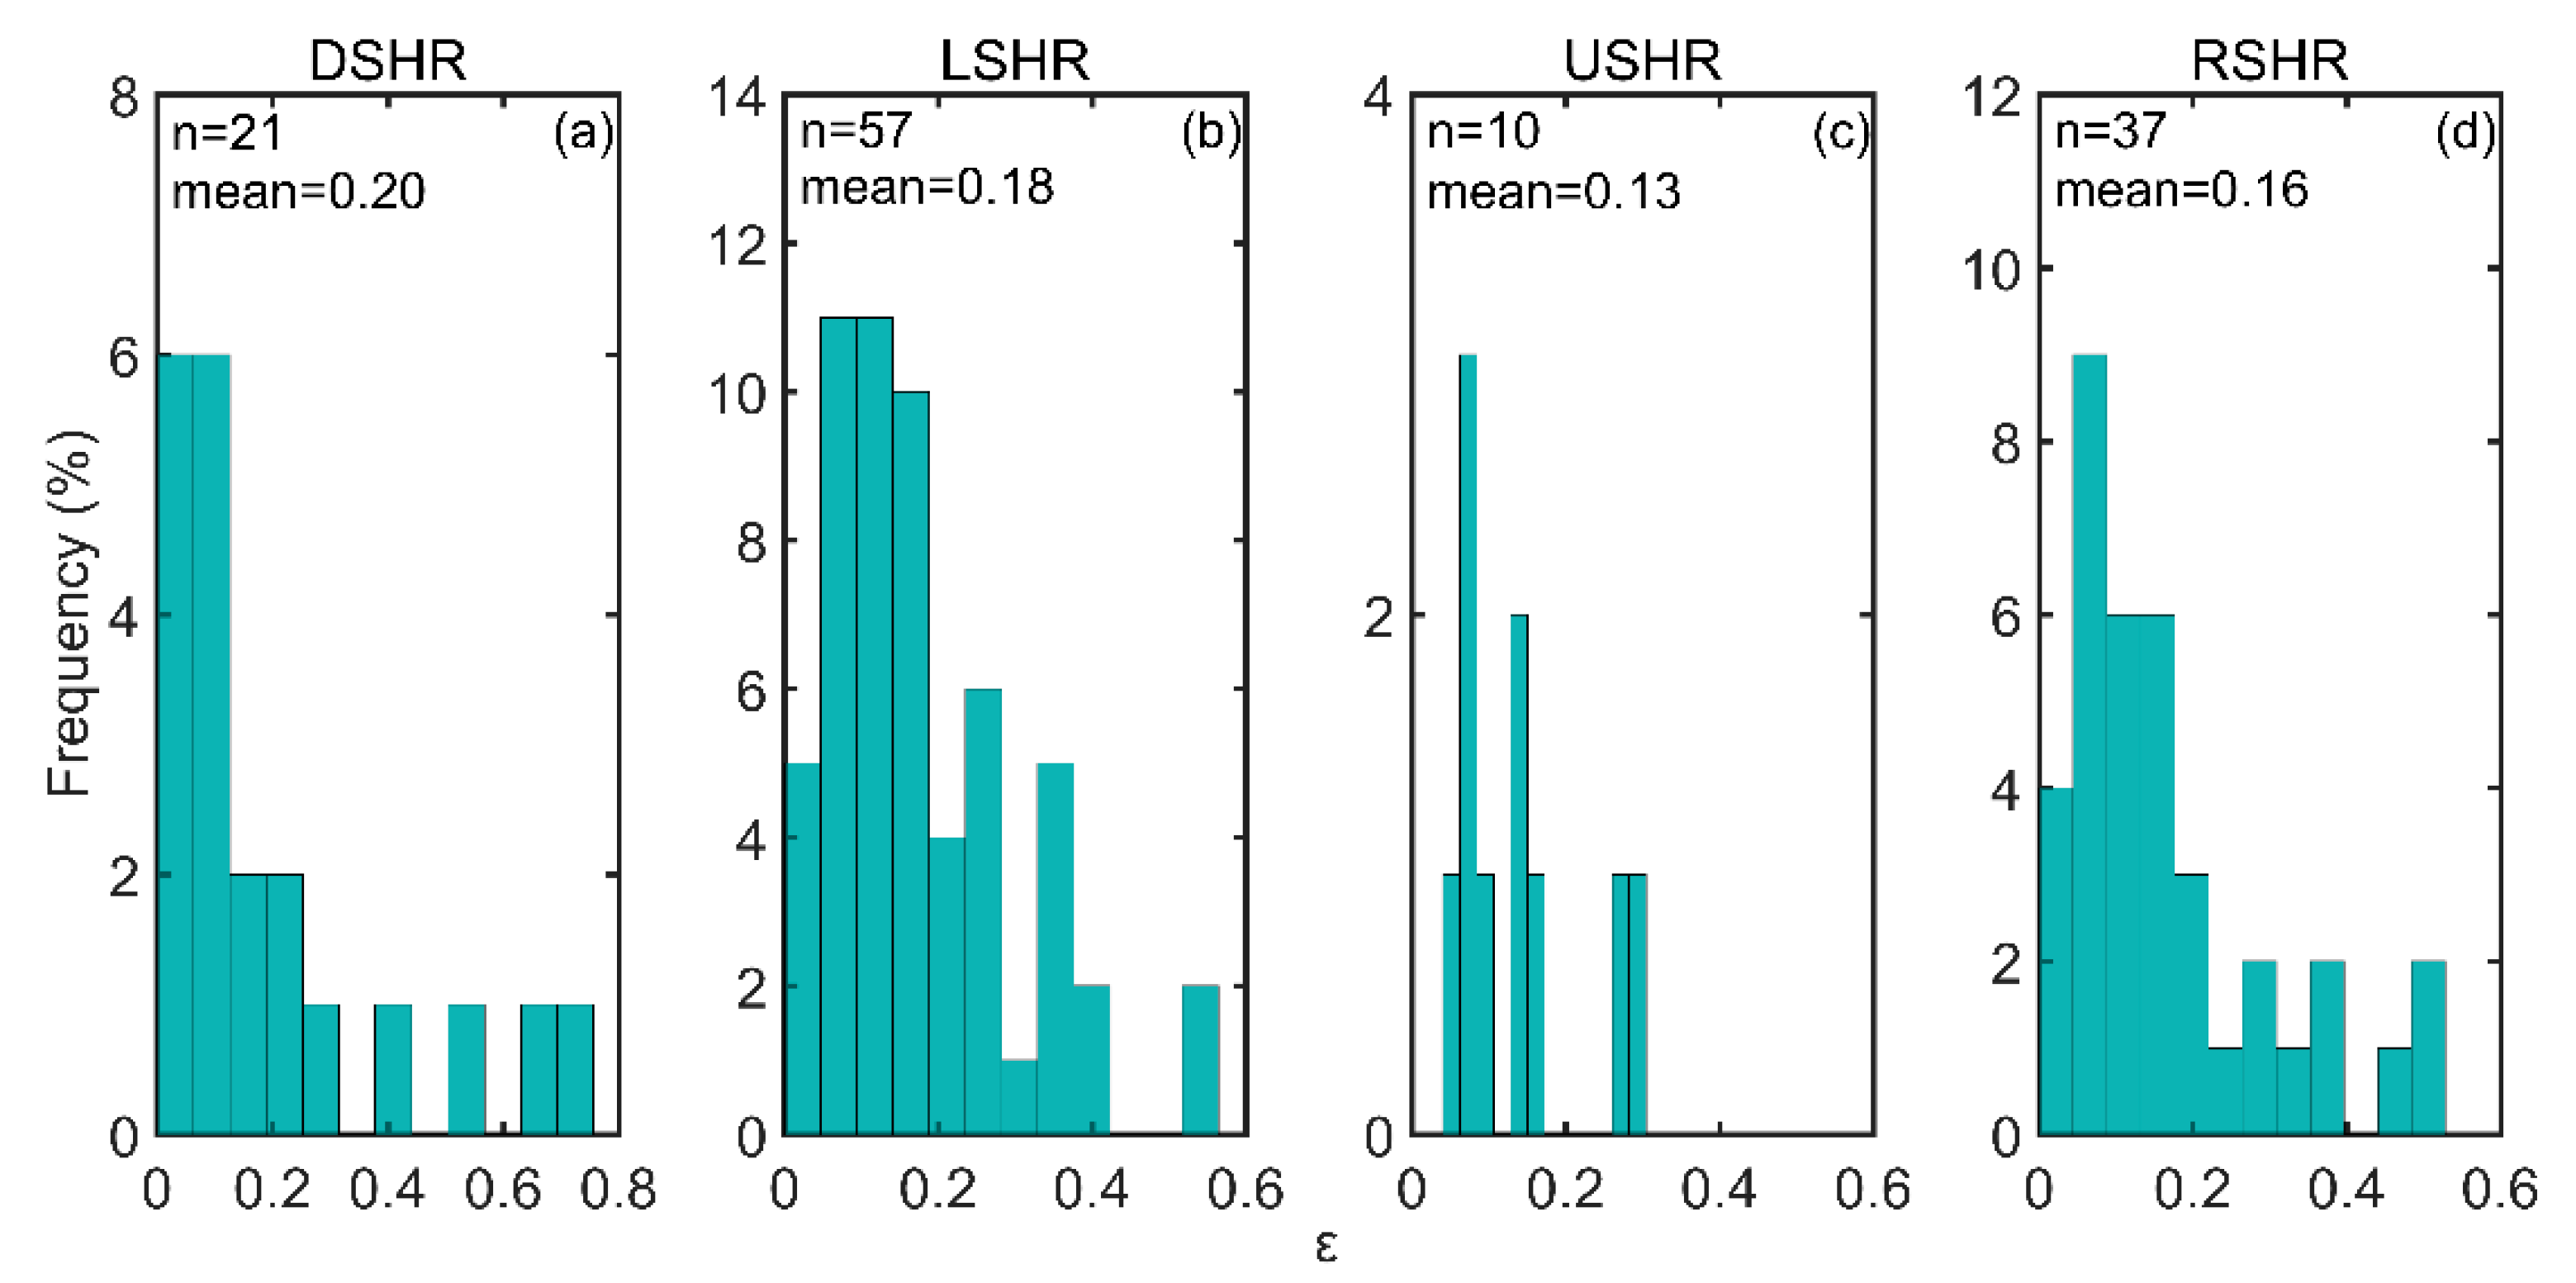
The relationship between the asymmetry parameter (ε) and the dominant factors that influence it were examined, such as the environmental vertical wind shear, storm movement, and intensity. First, TC samples were divided into four groups according to the TC intensity, namely, the tropical storm group (17.2 m/s <   V m a x   < 32.6 m/s), typhoon group (32.7 m/s <   V m a x   < 41.4 m/s), severe typhoon group (41.5 m/s < V m a x   < 50.9 m/s), and super typhoon group ( V m a x   > 51.0 m/s). TC samples were also divided into four groups according to the angle difference ( Δ θ = θ s h e a r     θ s t o r m ), between the storm motion direction,   θ s t o r m , and wind shear direction, θ s h e a r . For the downshear (DSHR) group, wind shear and storm motion directions were equal; the angle difference was | Δ θ | ≤ 22.5 ° . For the upshear (USHR) group, the wind shear and storm motion were in the opposite directions; to be specific, the angle difference was | Δ θ | ≥ 157.5 ° . When the wind shear was on the right side of the storm motion direction (RSHR) or to the left side of the storm motion direction (LSHR), they were categorized as 22.5 ° < Δ θ < 157.5 ° and − 157.5 ° < Δ θ < 22.5 ° , respectively.
Several different coordinate systems were used to evaluate the wind asymmetry. These coordinate systems include (1) earth-relative coordinates, in which cardinal directions are designated as North, East, South, and West; (2) motion-relative coordinates, in which cardinal directions are defined as to the front of the storm motion, to the right side of the storm motion, to the rear of the storm motion, and to the left side of the storm motion; and (3) wind shear-relative coordinates, in which the cardinal directions are defined as ‘upshear’, ‘downshear’, left side of shear, and right side of shear.
The frequency distributions of some key parameters for the TC samples are shown in Figure 2. TC intensity ( V m a x ) was directly derived from the SMAP wind observations. Figure 2a shows that the TC samples used in this study cover a wide range of TC intensities, from ~20 to 75 m/s. The average TC translation speed ( V s t o r m ) and direction ( θ s t o r m ) over all samples are 5.8 m/s and 231°, respectively. The average environmental vertical wind shear magnitude ( V s h e a r ) and direction ( θ s h e a r ) of the TC samples are 6.15 m/s and 196°, respectively. The range of the angle differences between the wind shear directions and storm motion directions ( θ s h e a r θ s t o r m ) is shown in Figure 2f.

4. Results

4.1. Intensity Effect on the Degree of Wind Asymmetry

To study the TC intensity effect on surface wind asymmetry, the TC samples were divided into four groups as mentioned in Section 3.3 and the distribution of the asymmetry parameters was examined in each group. As shown in Figure 3, on average, tropical storms have stronger surface wind asymmetry than typhoons, severe typhoons, and super typhoons as indicated by the asymmetry parameter. We also computed the linear regressions to estimate the dependence of the asymmetry parameter on the TC intensity. Figure 4 clearly shows that the asymmetry parameter significantly decreases with increasing TC intensity. This finding suggests that strong surface wind asymmetry (ε > 0.2) often exists in weak storms, which is in line with the results shown in Figure 3. The values of the linear regression coefficients in Figure 4 are given in Table 2.

4.2. Composite Analysis for Different Intensity Groups

Composite analysis of the TC surface wind fields was conducted for different intensity groups to examine the asymmetry of the wind distribution relative to factors of both the environmental vertical wind shear and storm movement. Figure 5 shows the shear-relative surface wind composites for four intensity groups. Figure 5a,b show that the maximum wind speed (denoted by black stars) approximately occurs on the left side of the wind shear (LS) in the composites of the tropical storm and typhoon intensity categories. However, with regard to the severe typhoon category, the position of the maximum wind speed is close to ‘downshear’, as shown in Figure 5c. On the other hand, in the composite analysis, Figure 5d shows that for the super typhoon category, the location of the maximum wind speed is within the left quadrant of ‘upshear’.
Figure 6 shows the surface wind composites in a motion-relative coordinate framework for all four intensity groups. As expected, the location of the maximum wind speed mainly occurs to the right side of the TC movement for all groups. For the typhoon and super typhoon groups, the maximum wind speed occurs in the right-rear quadrant. Yet, for the tropical storm and severe typhoon groups, the maximum wind speed arises just to the right side of the storm motion. The composite fields in Figure 5 and Figure 6 all pass the student’s t-test with 95% confidence.

4.3. Dependence of Wind Asymmetry on Storm Motion and Shear

Figure 7 shows the asymmetry parameter versus storm translation speed for various intensity groups. Figure 7a,d show that the asymmetry parameter (ε) significantly increases with increasing TC translation speed ( V s t o r m ) for tropical storms and super typhoons. However, for typhoons and severe typhoons, the asymmetry is weakly dependent on the storm motion speed, as shown in Figure 7b,c.
Figure 8 illustrates the relation between the asymmetry parameter and the environmental vertical wind shear magnitude. For all intensity groups, the asymmetry parameter (ε) increases with the increasing vertical wind shear ( V s h e a r ) magnitude. Table 3 shows the values of the linear regression coefficients in Figure 7 and Figure 8.

4.4. Impact of Motion and Shear on the Maximum Wind Speed Position

The location of the maximum wind speed azimuthal is another important property for an investigation of the TC asymmetric wind structure, aside from the degree of asymmetry as estimated by the asymmetric parameter. Figure 9 illustrates the azimuthal dependence of the maximum wind on the storm translation speed for different intensity groups. The maximum wind speed is mostly located to the right side of the storm motion direction for all intensity groups. The azimuth location of the maximum wind speed has a tendency to move from the right-front quadrant to the right side and then to the right-rear quadrant, as the TC translation speed increases for all intensity groups.
Similarly, the relationship between the environmental vertical wind shear and maximum wind speed position is illustrated in Figure 10. The maximum wind speed mainly occurs in the downshear and downshear-left quadrants for all intensity groups. The azimuthal location of the maximum wind speed has a tendency to shift from the downshear to the left side of the wind shear when the shear magnitude increases for different intensity groups. These results are consistent with [16] for typhoons, and severe and super typhoons. It should be noted that the relationship for the location of the maximum surface wind and the wind shear magnitude also holds for tropical storm-strength TCs. The linear regression coefficients of Figure 9 and Figure 10 are presented in Table 4.
To simultaneously investigate the impacts of storm motion and wind shear on TC surface wind asymmetry, the TC samples were divided into two categories based on the magnitudes of the storm translation speed and vertical wind shear, for each intensity group. As shown in Figure 11, the maximum wind speed occurs favorably to the left side of the wind shear and to the right side of the storm motion for all typhoon intensity groups, which is consistent with [19]. The relative strength between the storm translation speed and wind shear magnitude has the potential to affect the wind maximum location. As shown in Figure 11, the maximum wind speed mostly occurs to the right side of the storm motion when the storm translation speed is larger than the magnitude of the wind shear (blue diamonds in Figure 11). By contrast, when the storm translation speed is smaller than the wind shear magnitude (red crosses in Figure 11), the maximum wind speed mostly occurs to the left side of the wind shear direction.

4.5. Influence of the Angle Difference between the Storm Motion and Wind Shear on Wind Asymmetry

The 125 TC samples were divided into four groups to explore the influence of the angle difference between the vertical wind shear and storm motion on the surface wind asymmetry. The composite wind speed of each group is shown in Figure 12. Similar to Figure 5, Figure 12 shows the normalized wind speed versus the normalized radius in the wind shear-relative framework. The maximum wind speed (black star) rotates clockwise from LSHR, USHR, and RSHR, to DSHR, as defined in Section 3.3. The maximum wind speed mainly occurs in the left-front and left-rear quadrants for the RSHR, USHR, and LSHR groups, which agrees with the results shown in [16]. However, the maximum wind speed in the DSHR group occurs to the right side of the wind shear.
The distribution of the asymmetry parameter for each group was also evaluated for the storm motion and wind shear directions. As shown in Figure 13, the DSHR and LSHR groups have a larger degree of surface wind asymmetry than the USHR and RSHR groups. On average, when the direction of the wind shear is nearly the same as the direction of the storm motion, the wind asymmetry degree is the largest; and as the wind shear direction is opposite to the storm motion direction, the wind asymmetry degree is the smallest. These results are consistent with those shown by [22].

5. Discussion

Previous studies have shown that both storm motion and environmental vertical wind shear are the primary factors that account for TC surface wind asymmetries [15,16,19,21,
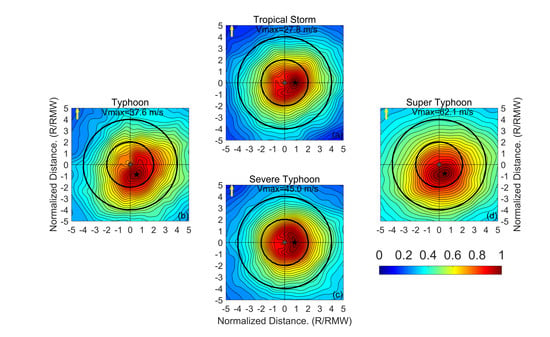
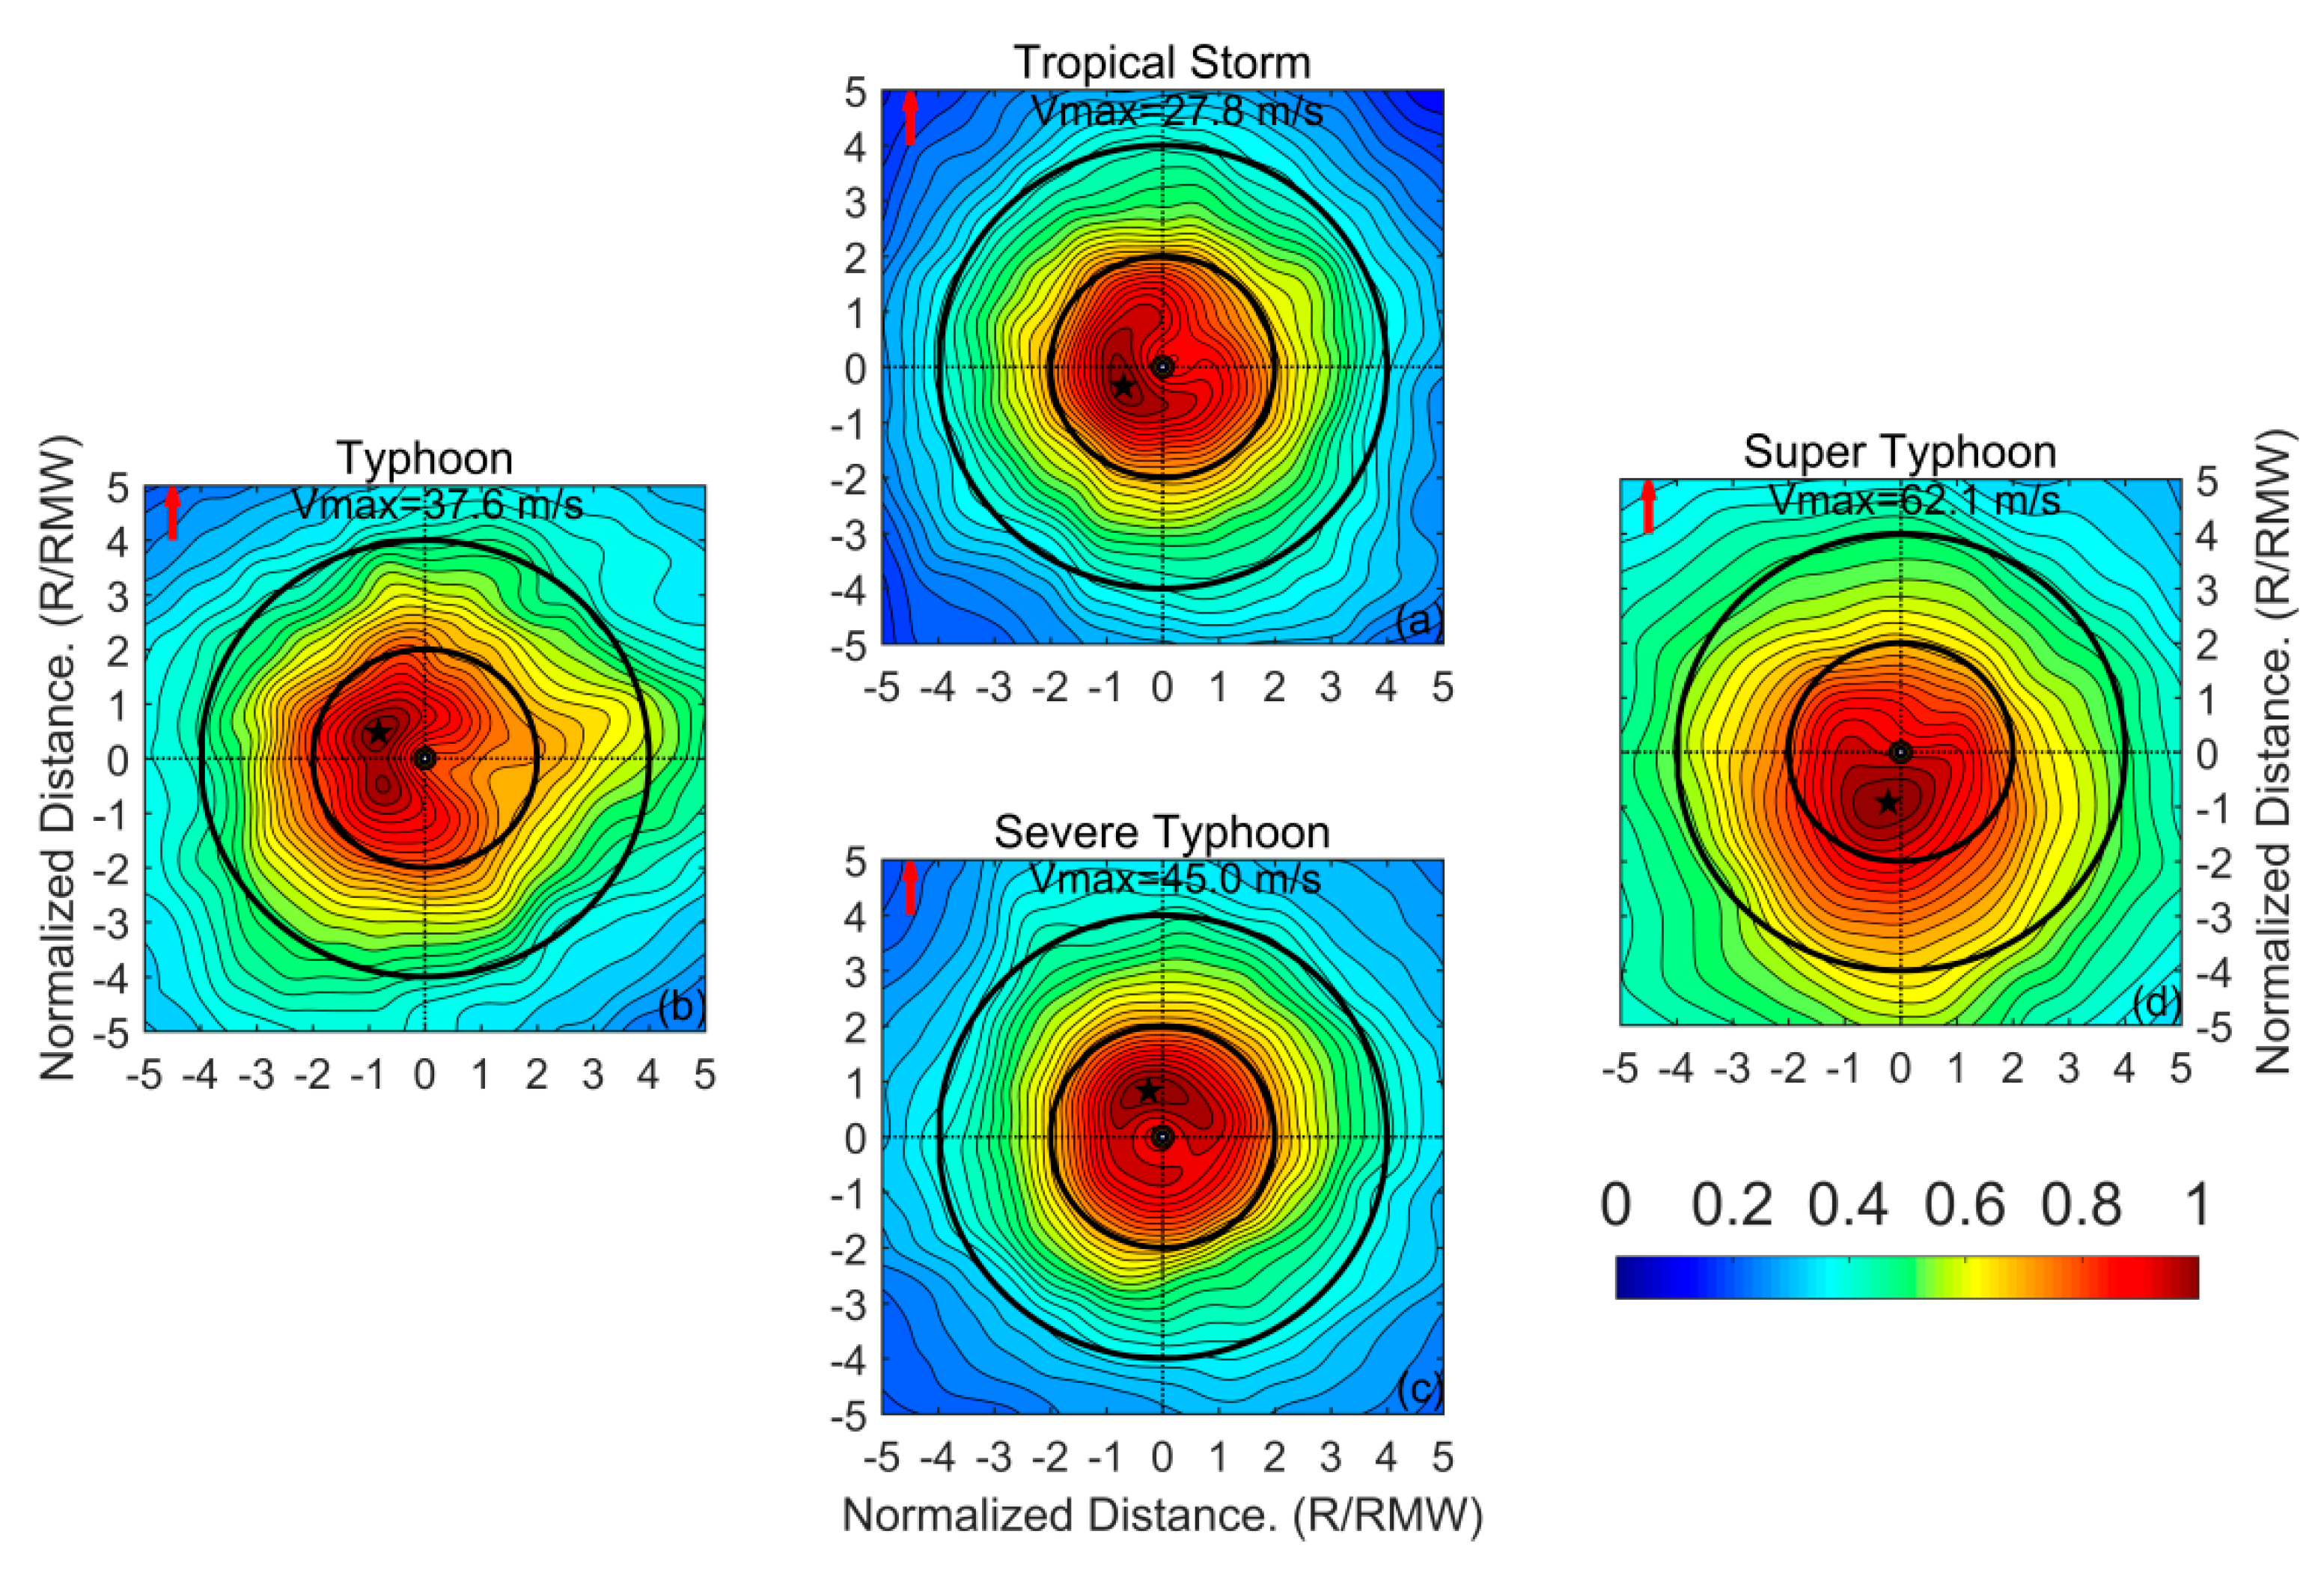
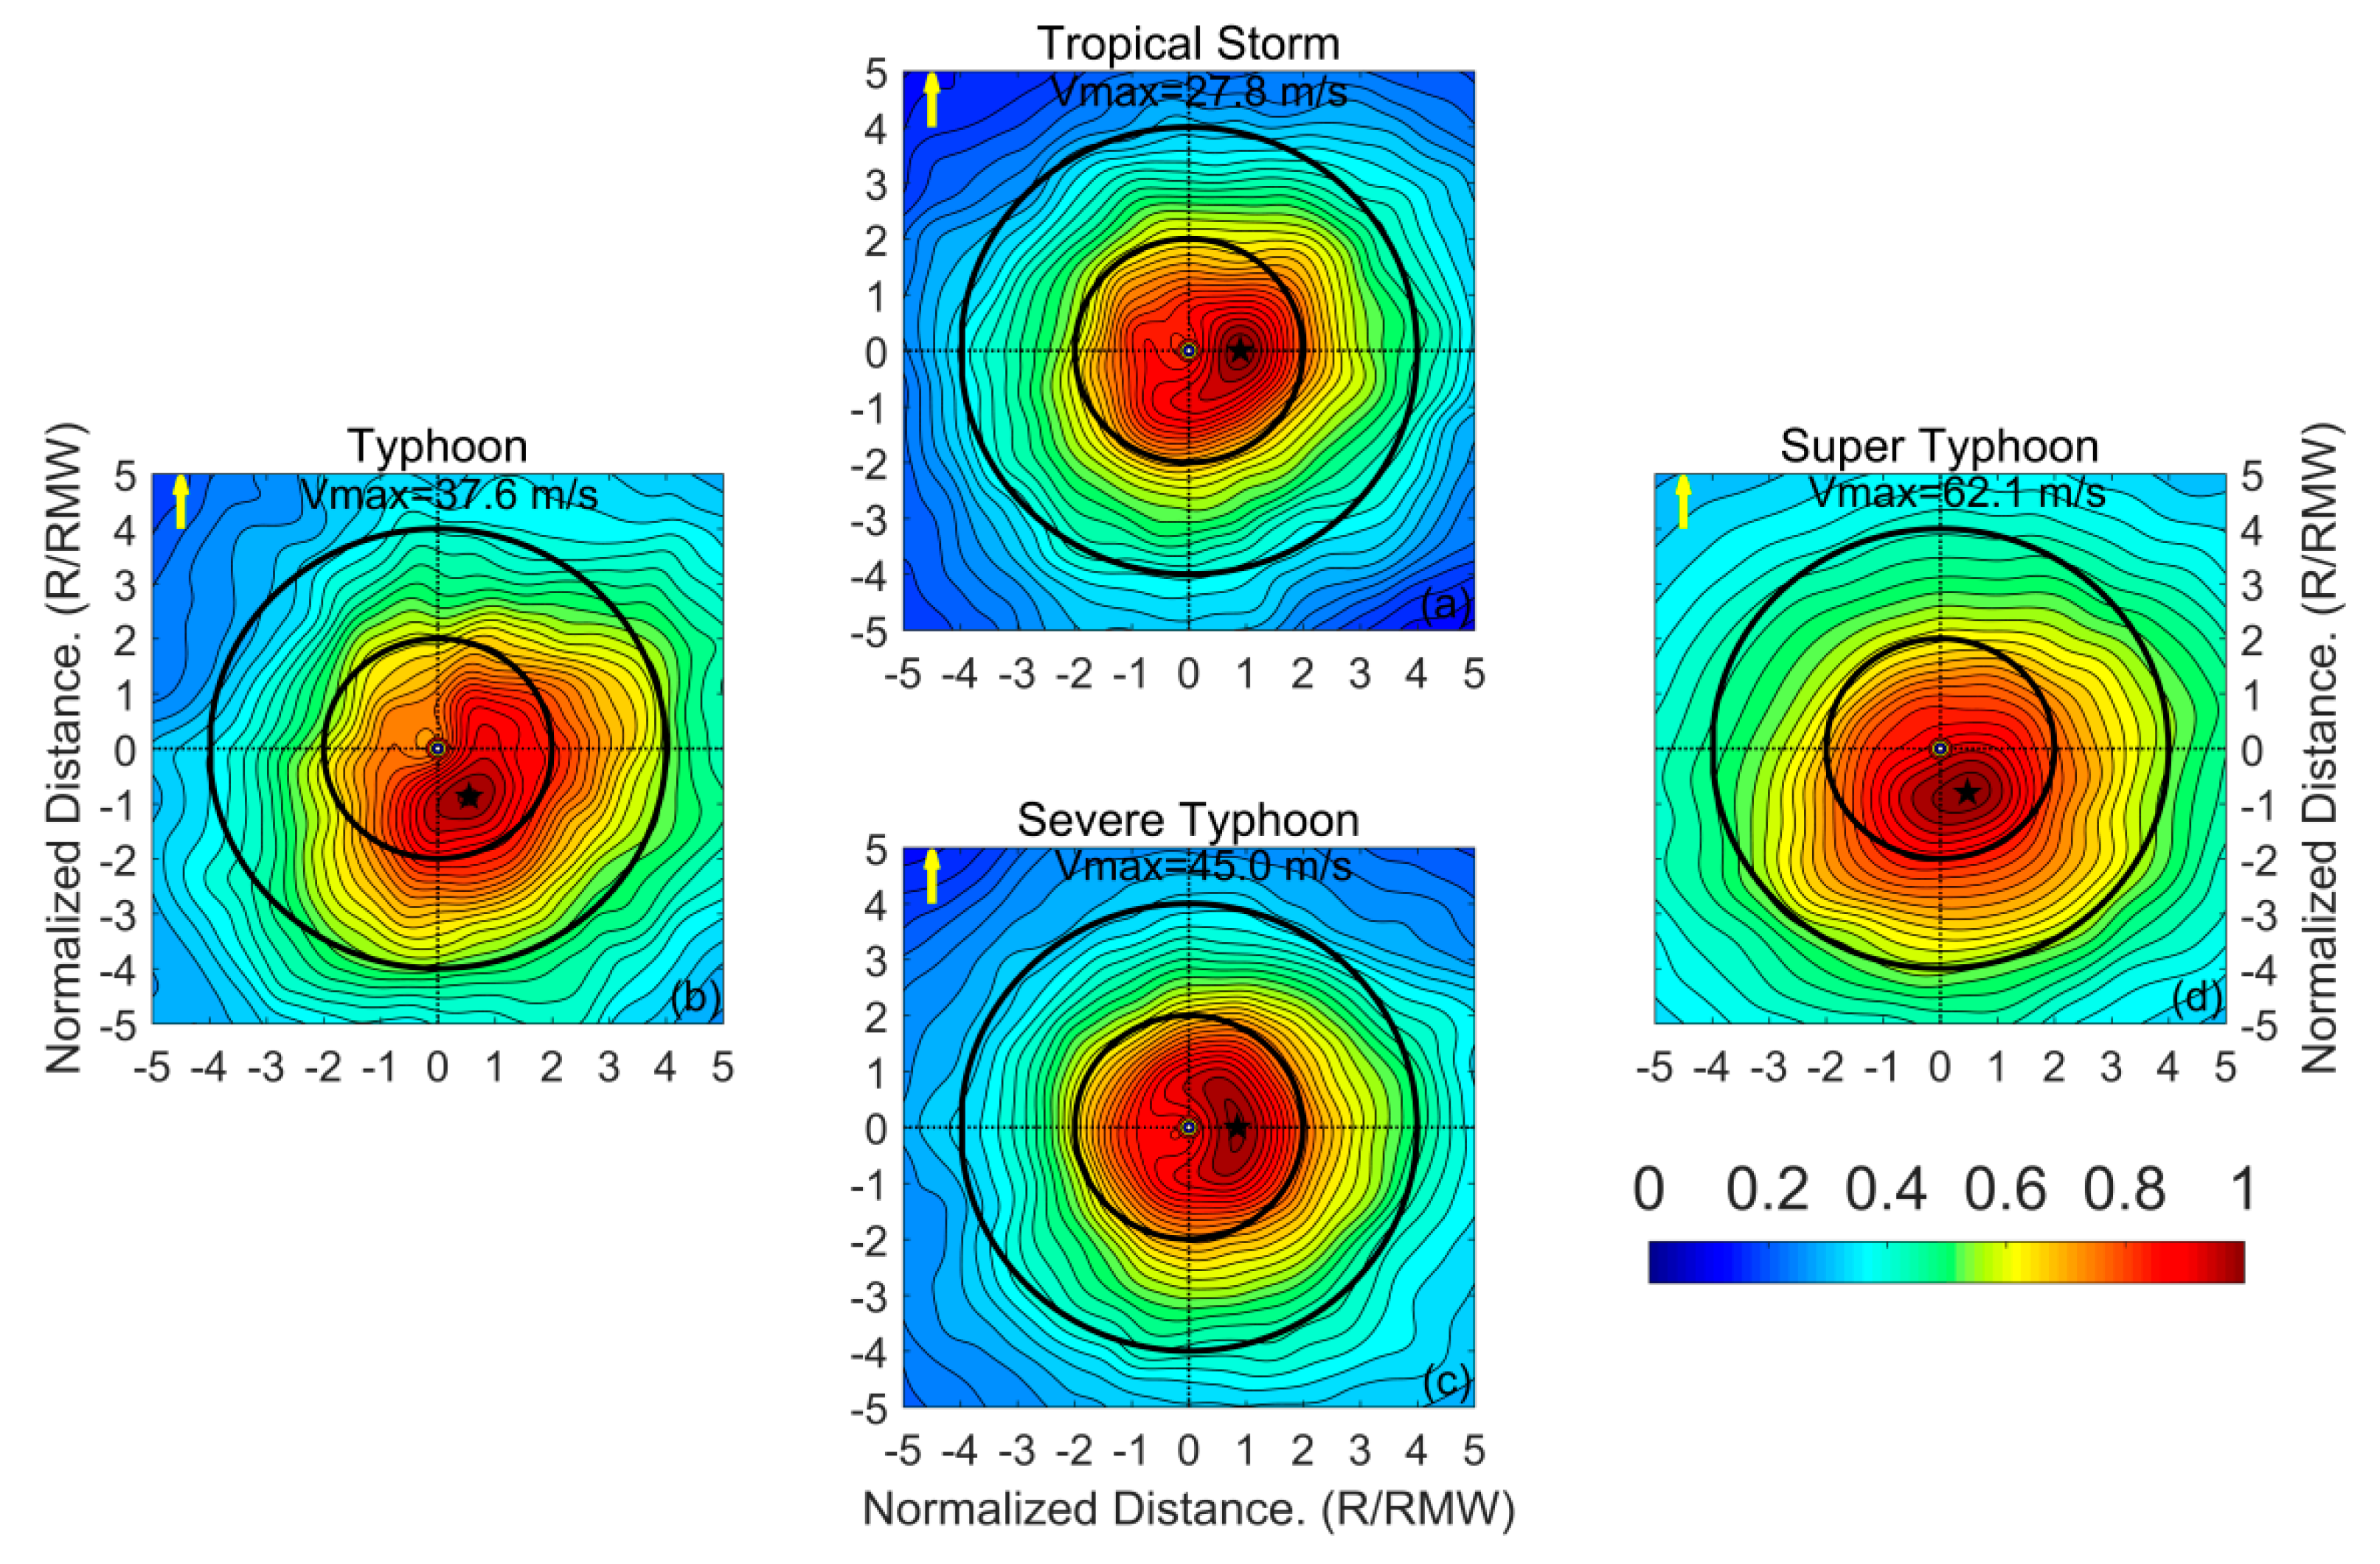
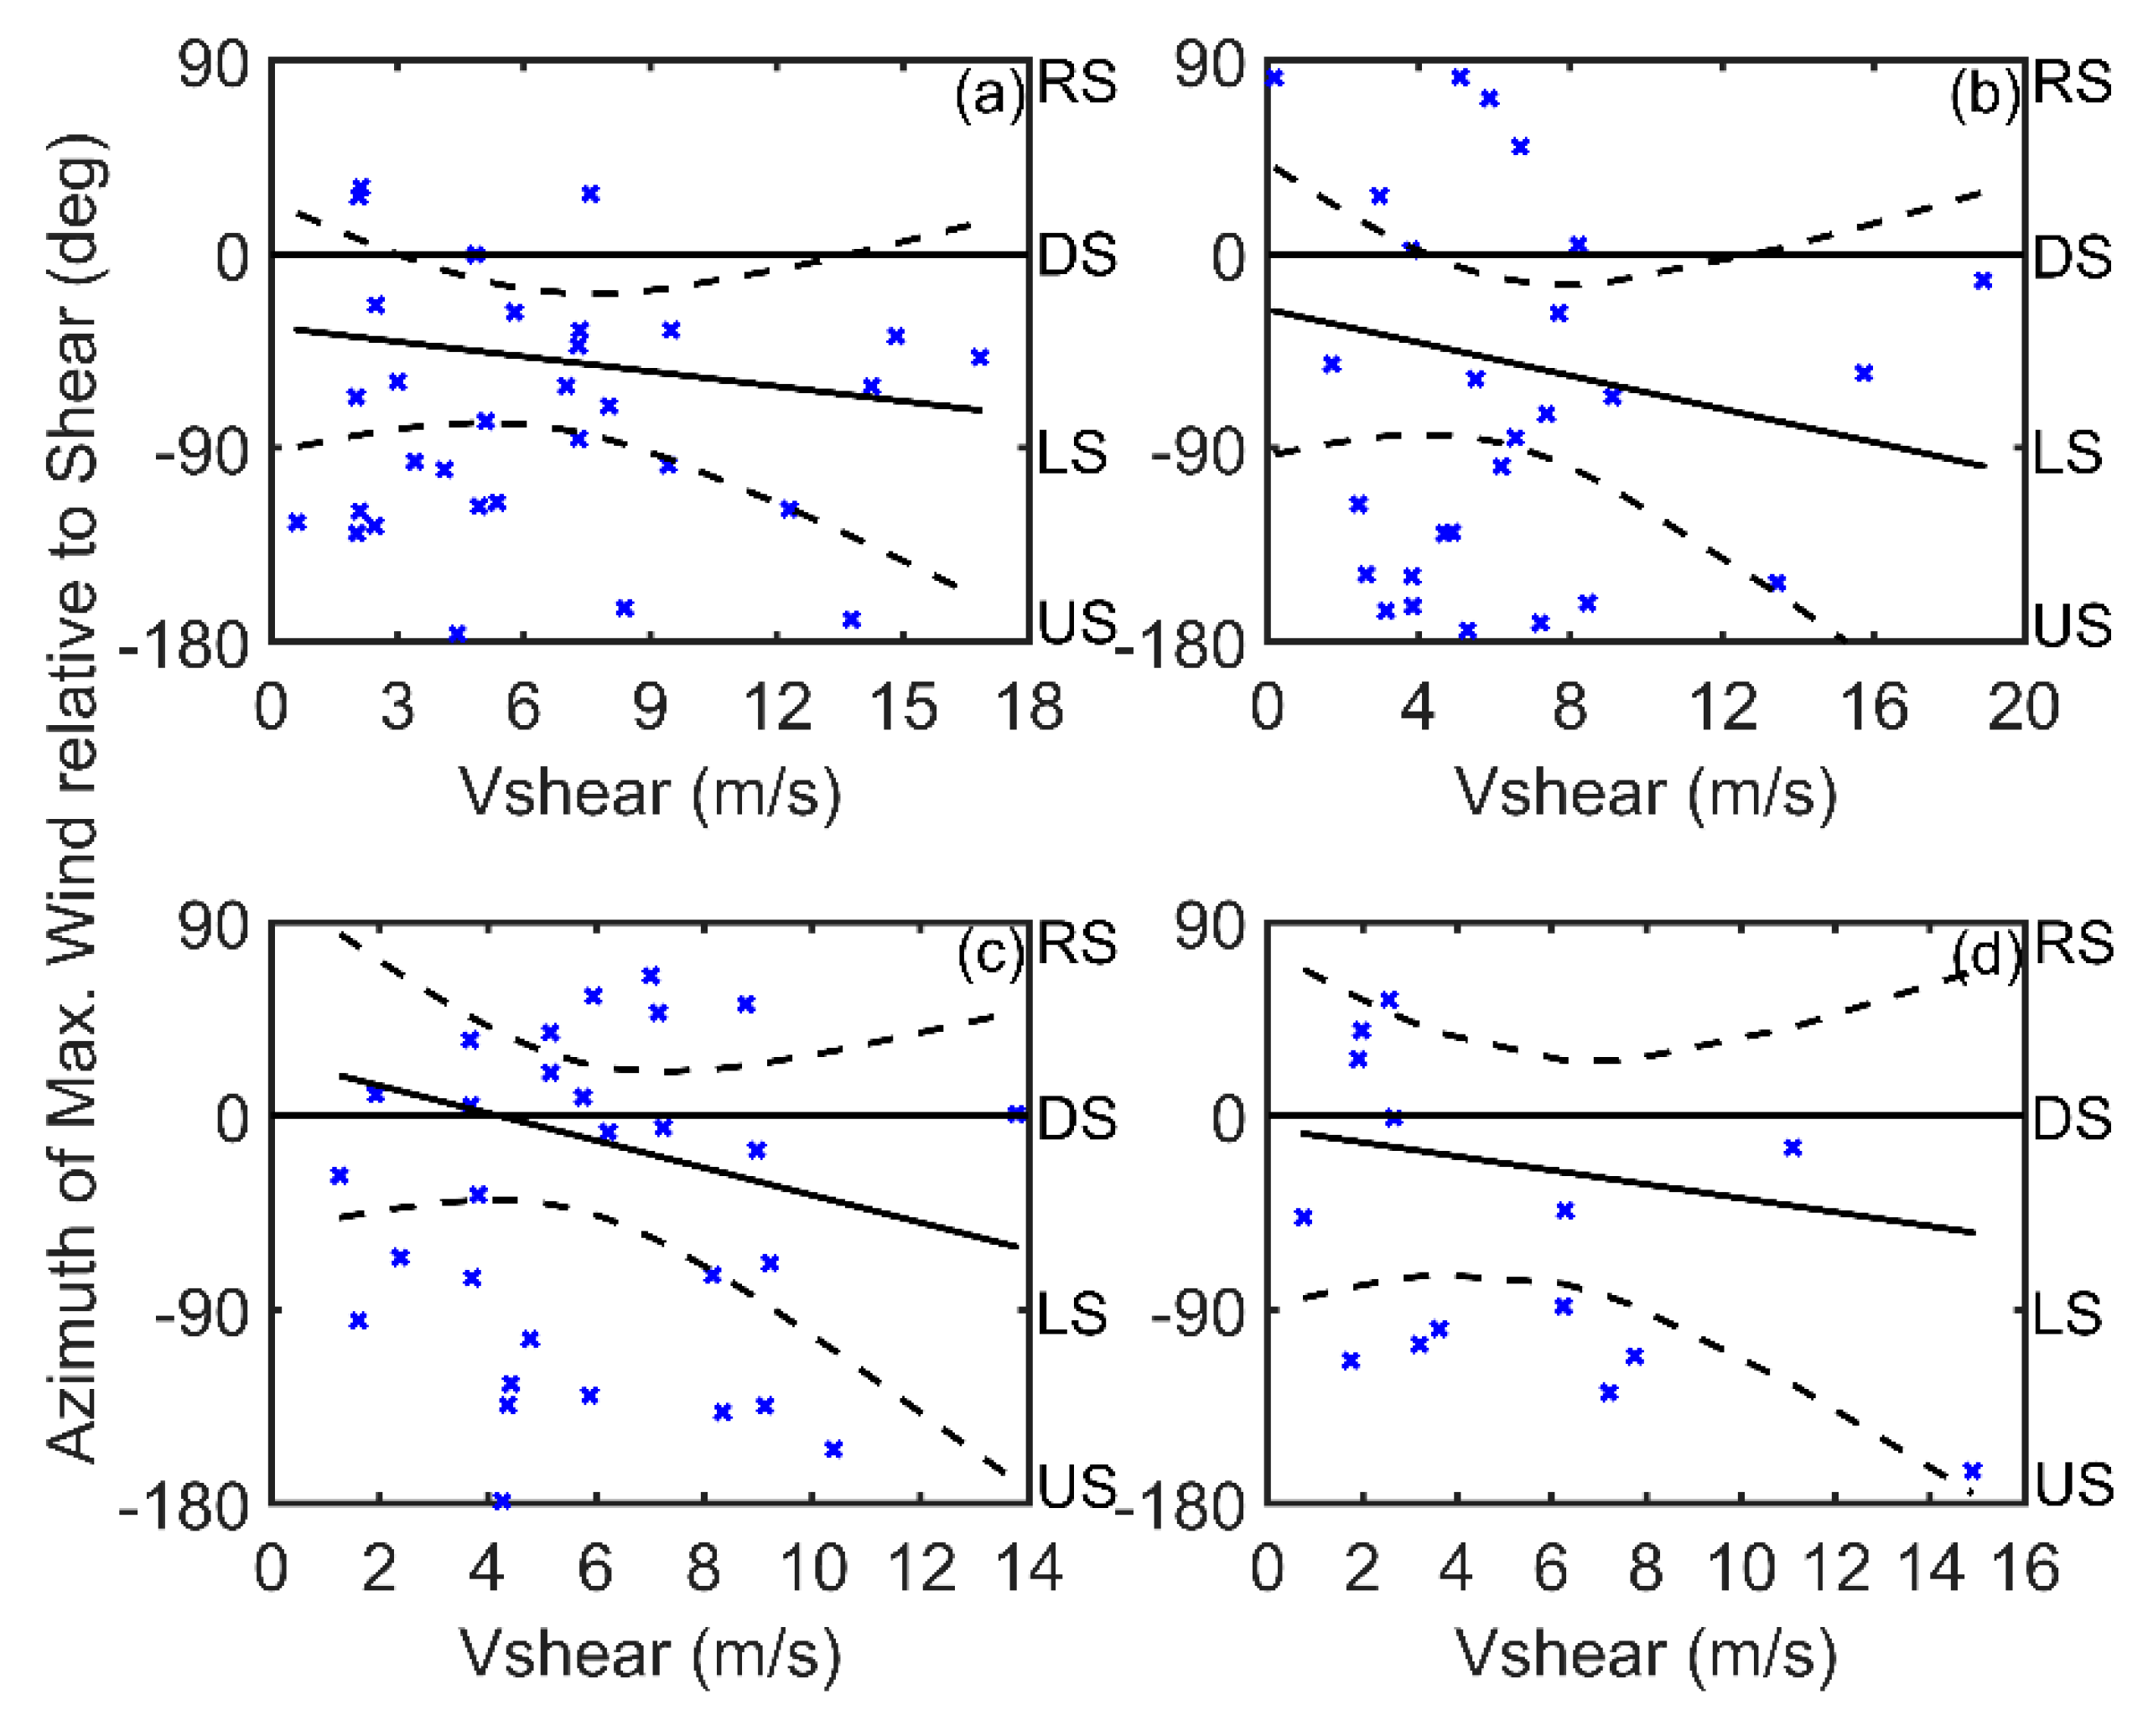
22]. However, it is still not clear which factor has greater influence on the TC asymmetries. In this study, the relationships among TC surface wind asymmetry, storm motion, and vertical wind shear were further explored using SMAP-measured winds. An analysis of composite wind fields of the intensities for tropical storm and typhoon groups show that the location of the maximum wind speed approximately occurs on the left side of the wind shear (Figure 5a,b), which further corroborates the previous results reported in [21,22]. Note that the average maximum wind speeds of the composite wind fields from the SMAP wind data were significantly larger than those derived from scatterometer winds [21,22], as shown in Figure 5c,d, especially for severe typhoons and super typhoons. Moreover, for these two categories, the positions of the maximum wind speed were found to be closer to left of ‘downshear’ and ‘upshear’, which are different from those shown in Figure 5a,b in this study, Figure 4 in [21], and Figure 5 in [22]. TC structures tend to be more symmetrical for the range from the center to about 4 × RMW, with increasing storm intensity, especially for super typhoons, whether in shear-relative or in motion-relative coordinate frameworks.
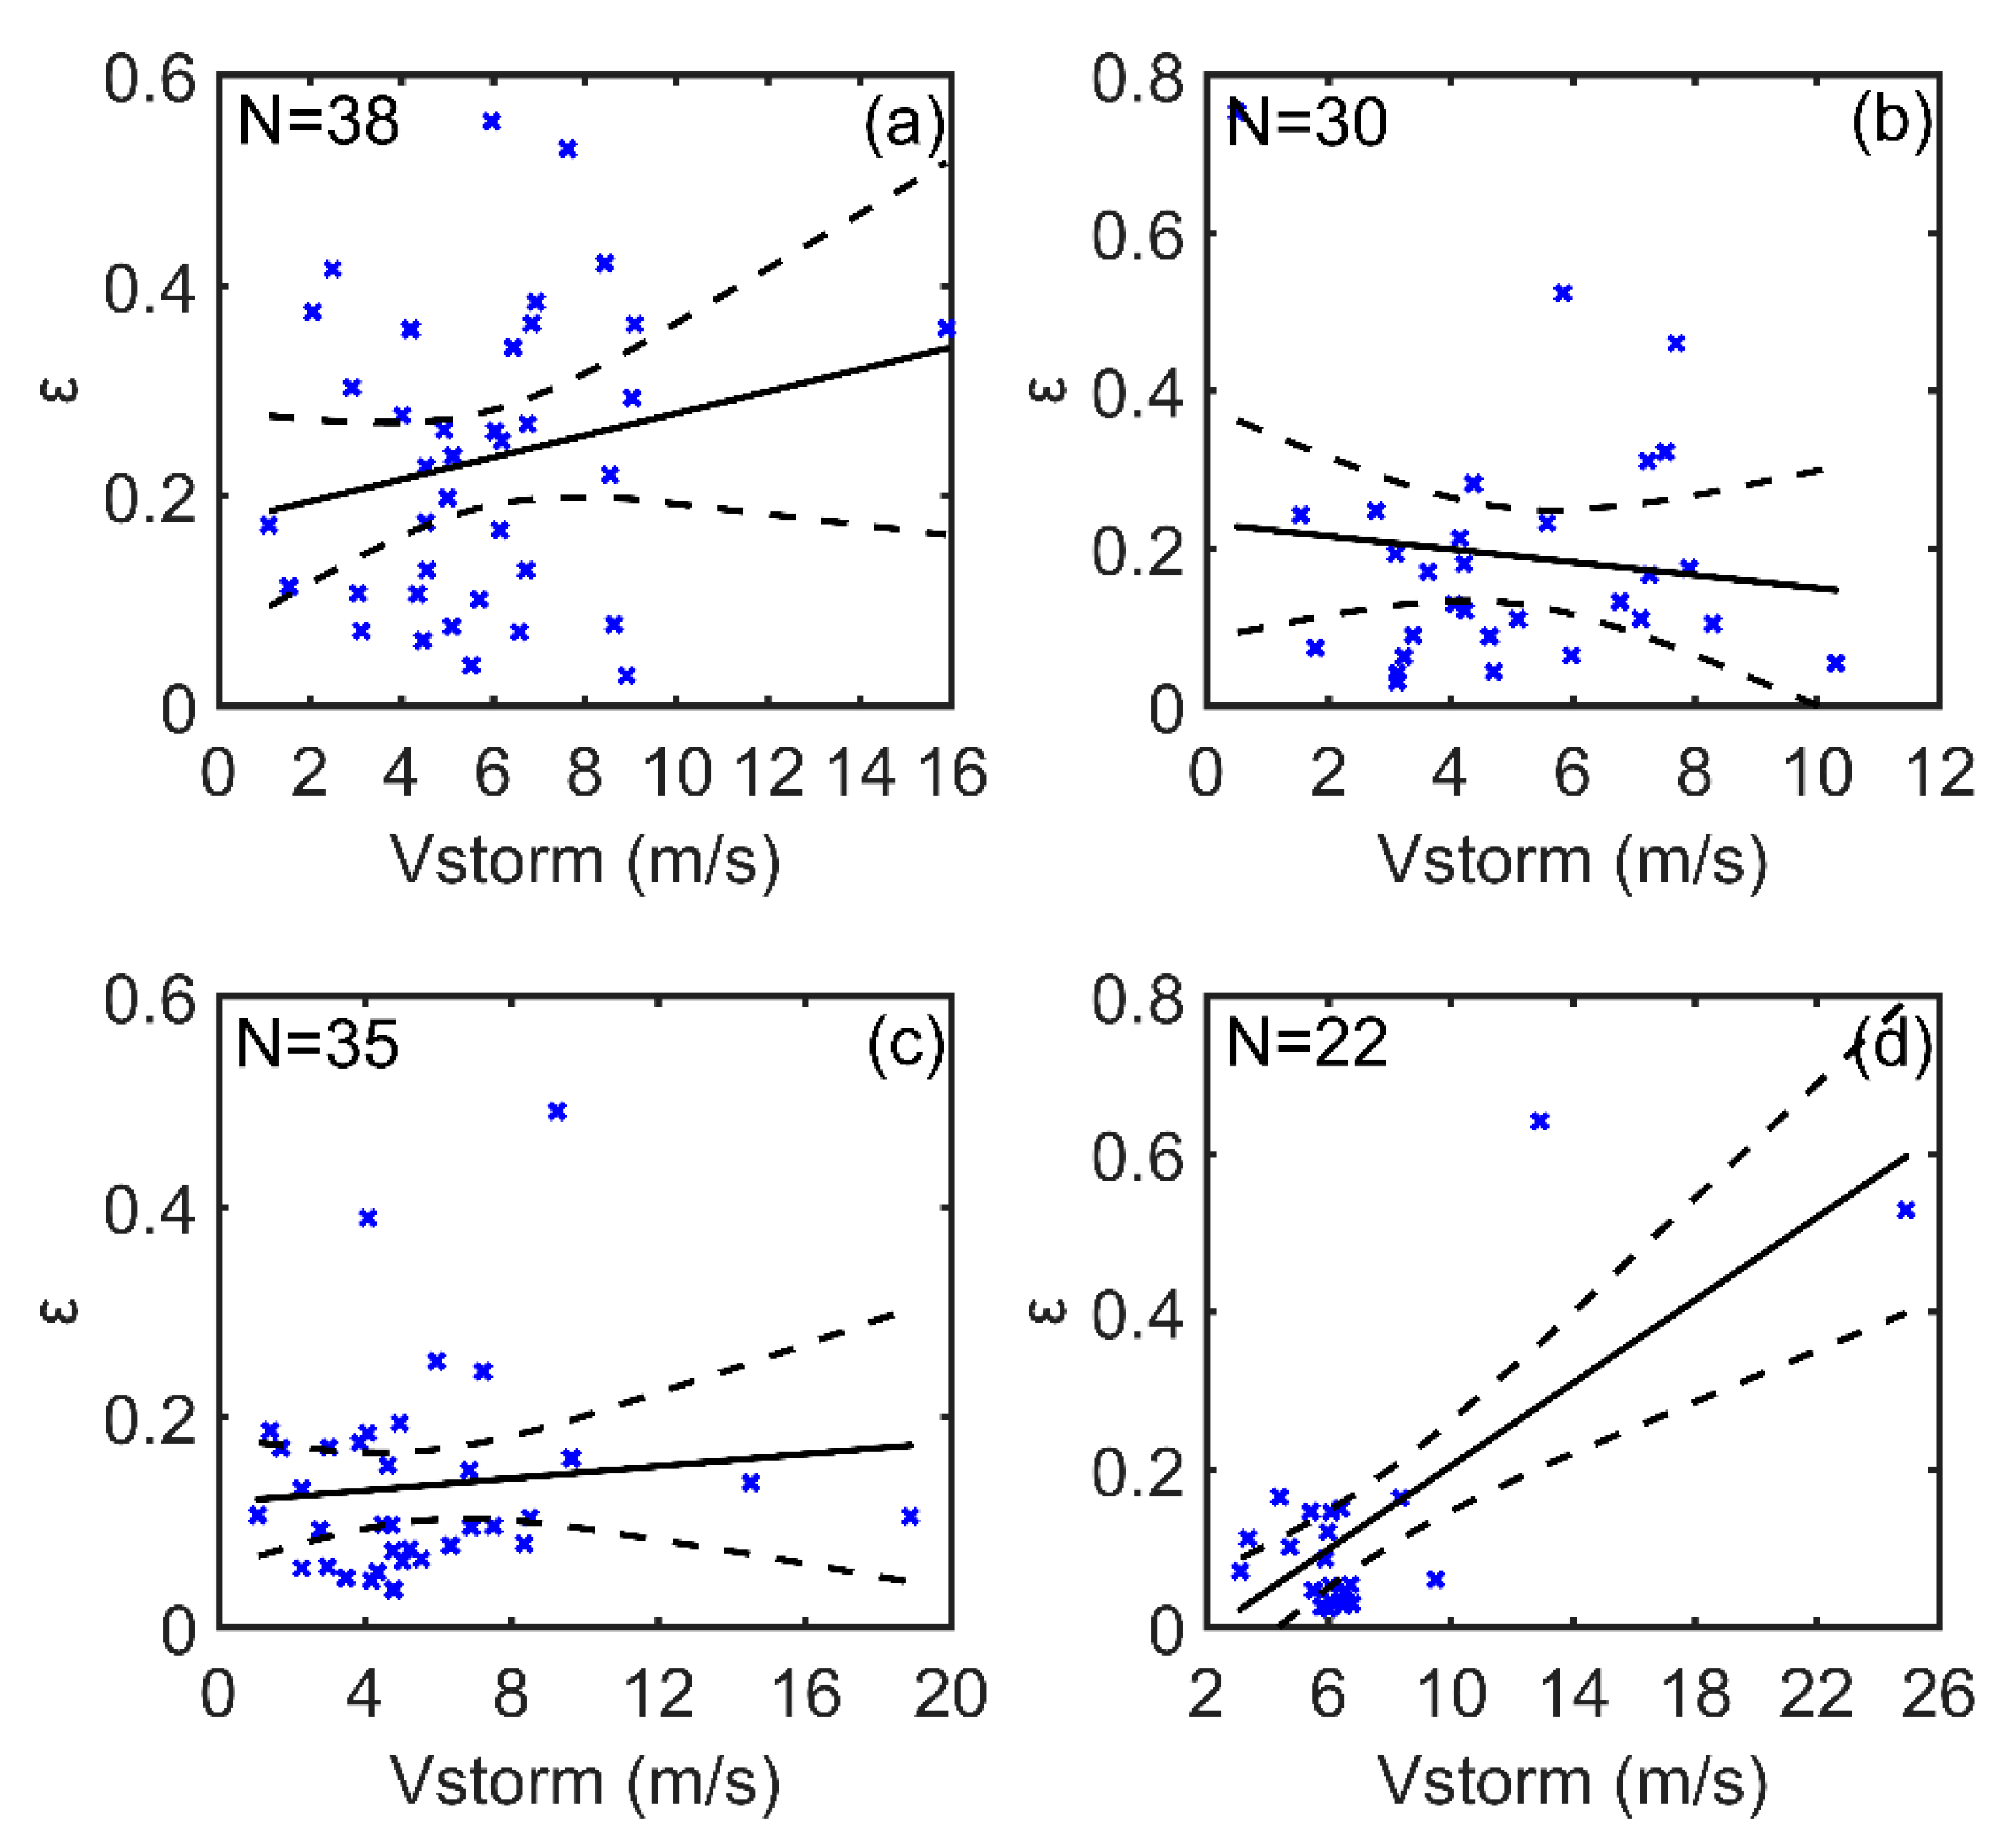
The dependence of TC asymmetries on storm motion and environmental vertical wind shear is probably based on the estimated asymmetric parameter. It was shown that the asymmetry parameter increases with increasing TC translation speed and vertical wind shear magnitude for the tropical storm and super typhoon categories (Figure 7a,d and Figure 8a,d); however, this tendency was not given by [16]. The influence of the angle difference between the storm motion and vertical wind shear on TC asymmetries was also examined by using the composite wind field analysis. The maximum wind speed position rotates on the basis of the angle difference between the storm motion and the wind shear; however, the order of rotation is different from previous studies [16,22]. This difference may be due to the different TC intensity ranges between our study and other studies [16,22], because [16] only included hurricane-strength TCs, and in [22], the maximum wind speeds of TC samples were not as large as those in our study.
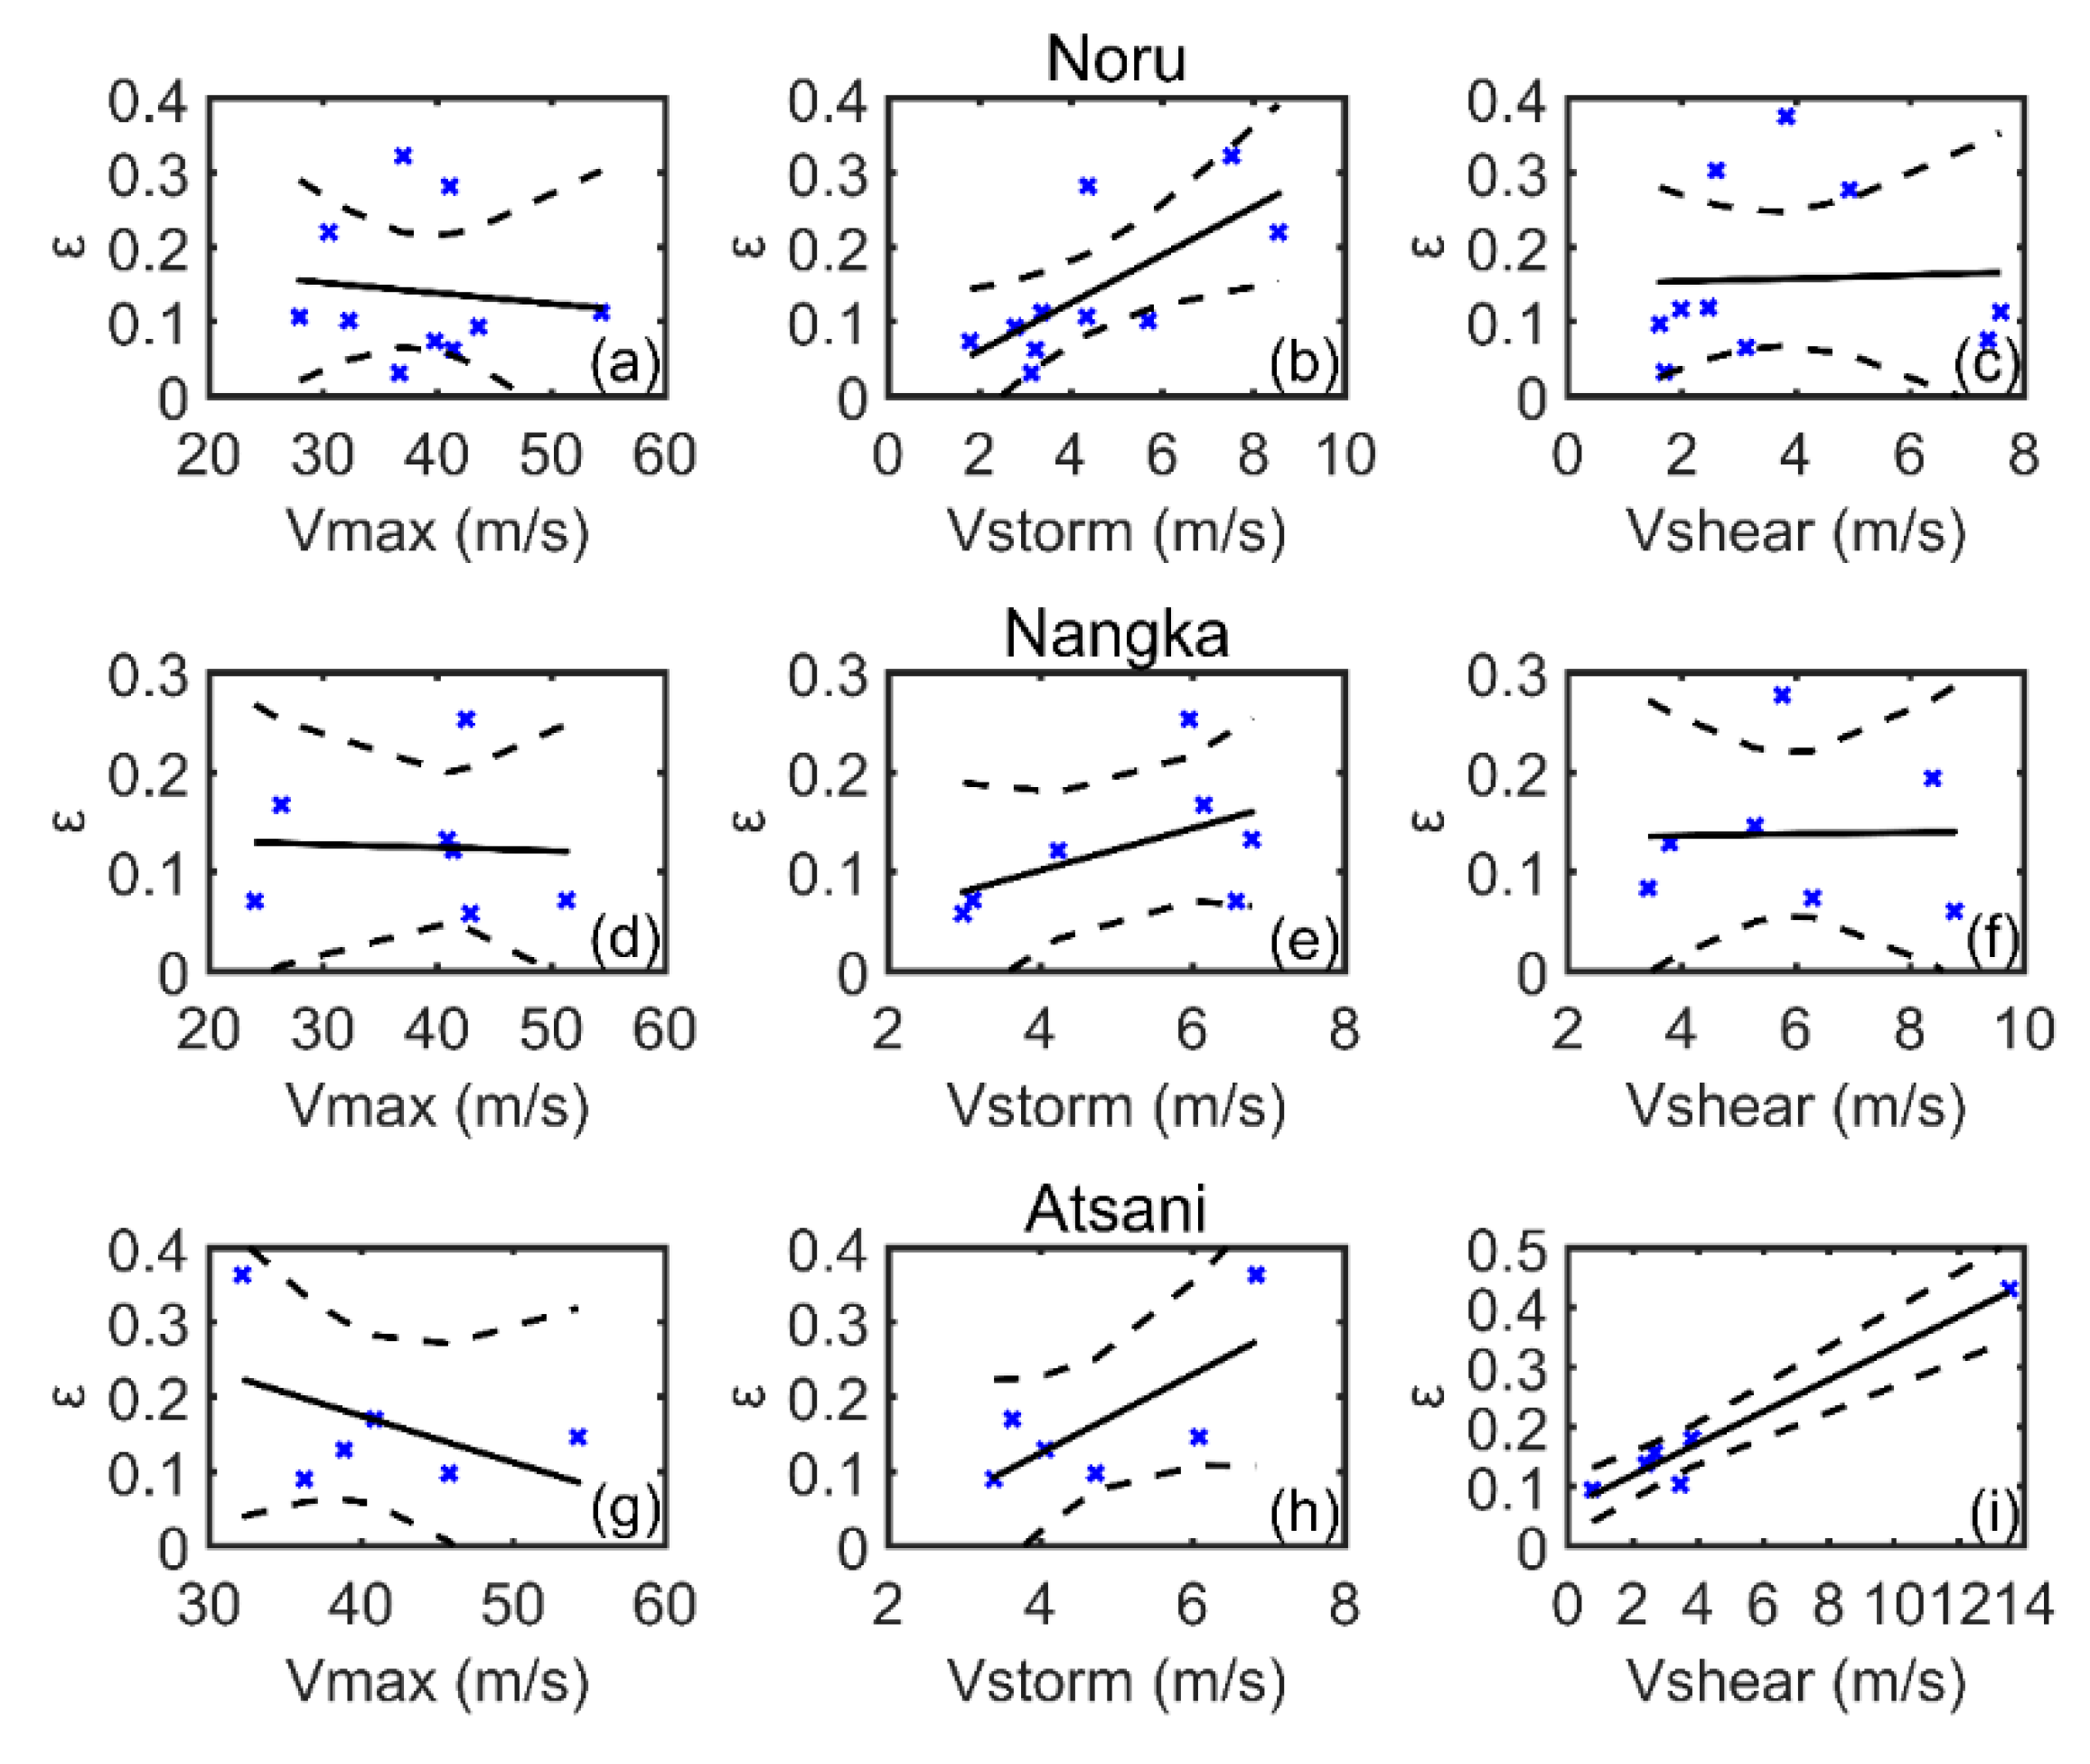
In order to further study the relationship between TC asymmetries and intensity, storm motion, and environmental vertical wind shear, SMAP multi-temporal wind observations of three typical typhoons (Atsani, Nangka, and Noru) were selected from 125 samples to conduct individual case study analyses. Figure 14 shows the asymmetry parameter versus intensity, translation speed, and environmental vertical wind shear magnitude for each typhoon. As shown in Figure 14b,e,h, as the translation speed increases, the asymmetry parameter has an obvious increasing tendency for all three typhoons. However, an exception is typhoon Atsani, where the intensity increases, but the asymmetry parameter shows a significant decreasing trend. Additionally, for this case, the asymmetry parameter also increases with the wind shear magnitude, whereas no similar features are found for typhoons Noru and Nangka. The explanation may be that the range of magnitudes for wind shear for these two typhoons (~1.7–7.6 m/s for Noru and ~3.4–8.8 m/s for Nangka) is significantly smaller than that of Atsani (~0.8–13.5 m/s).
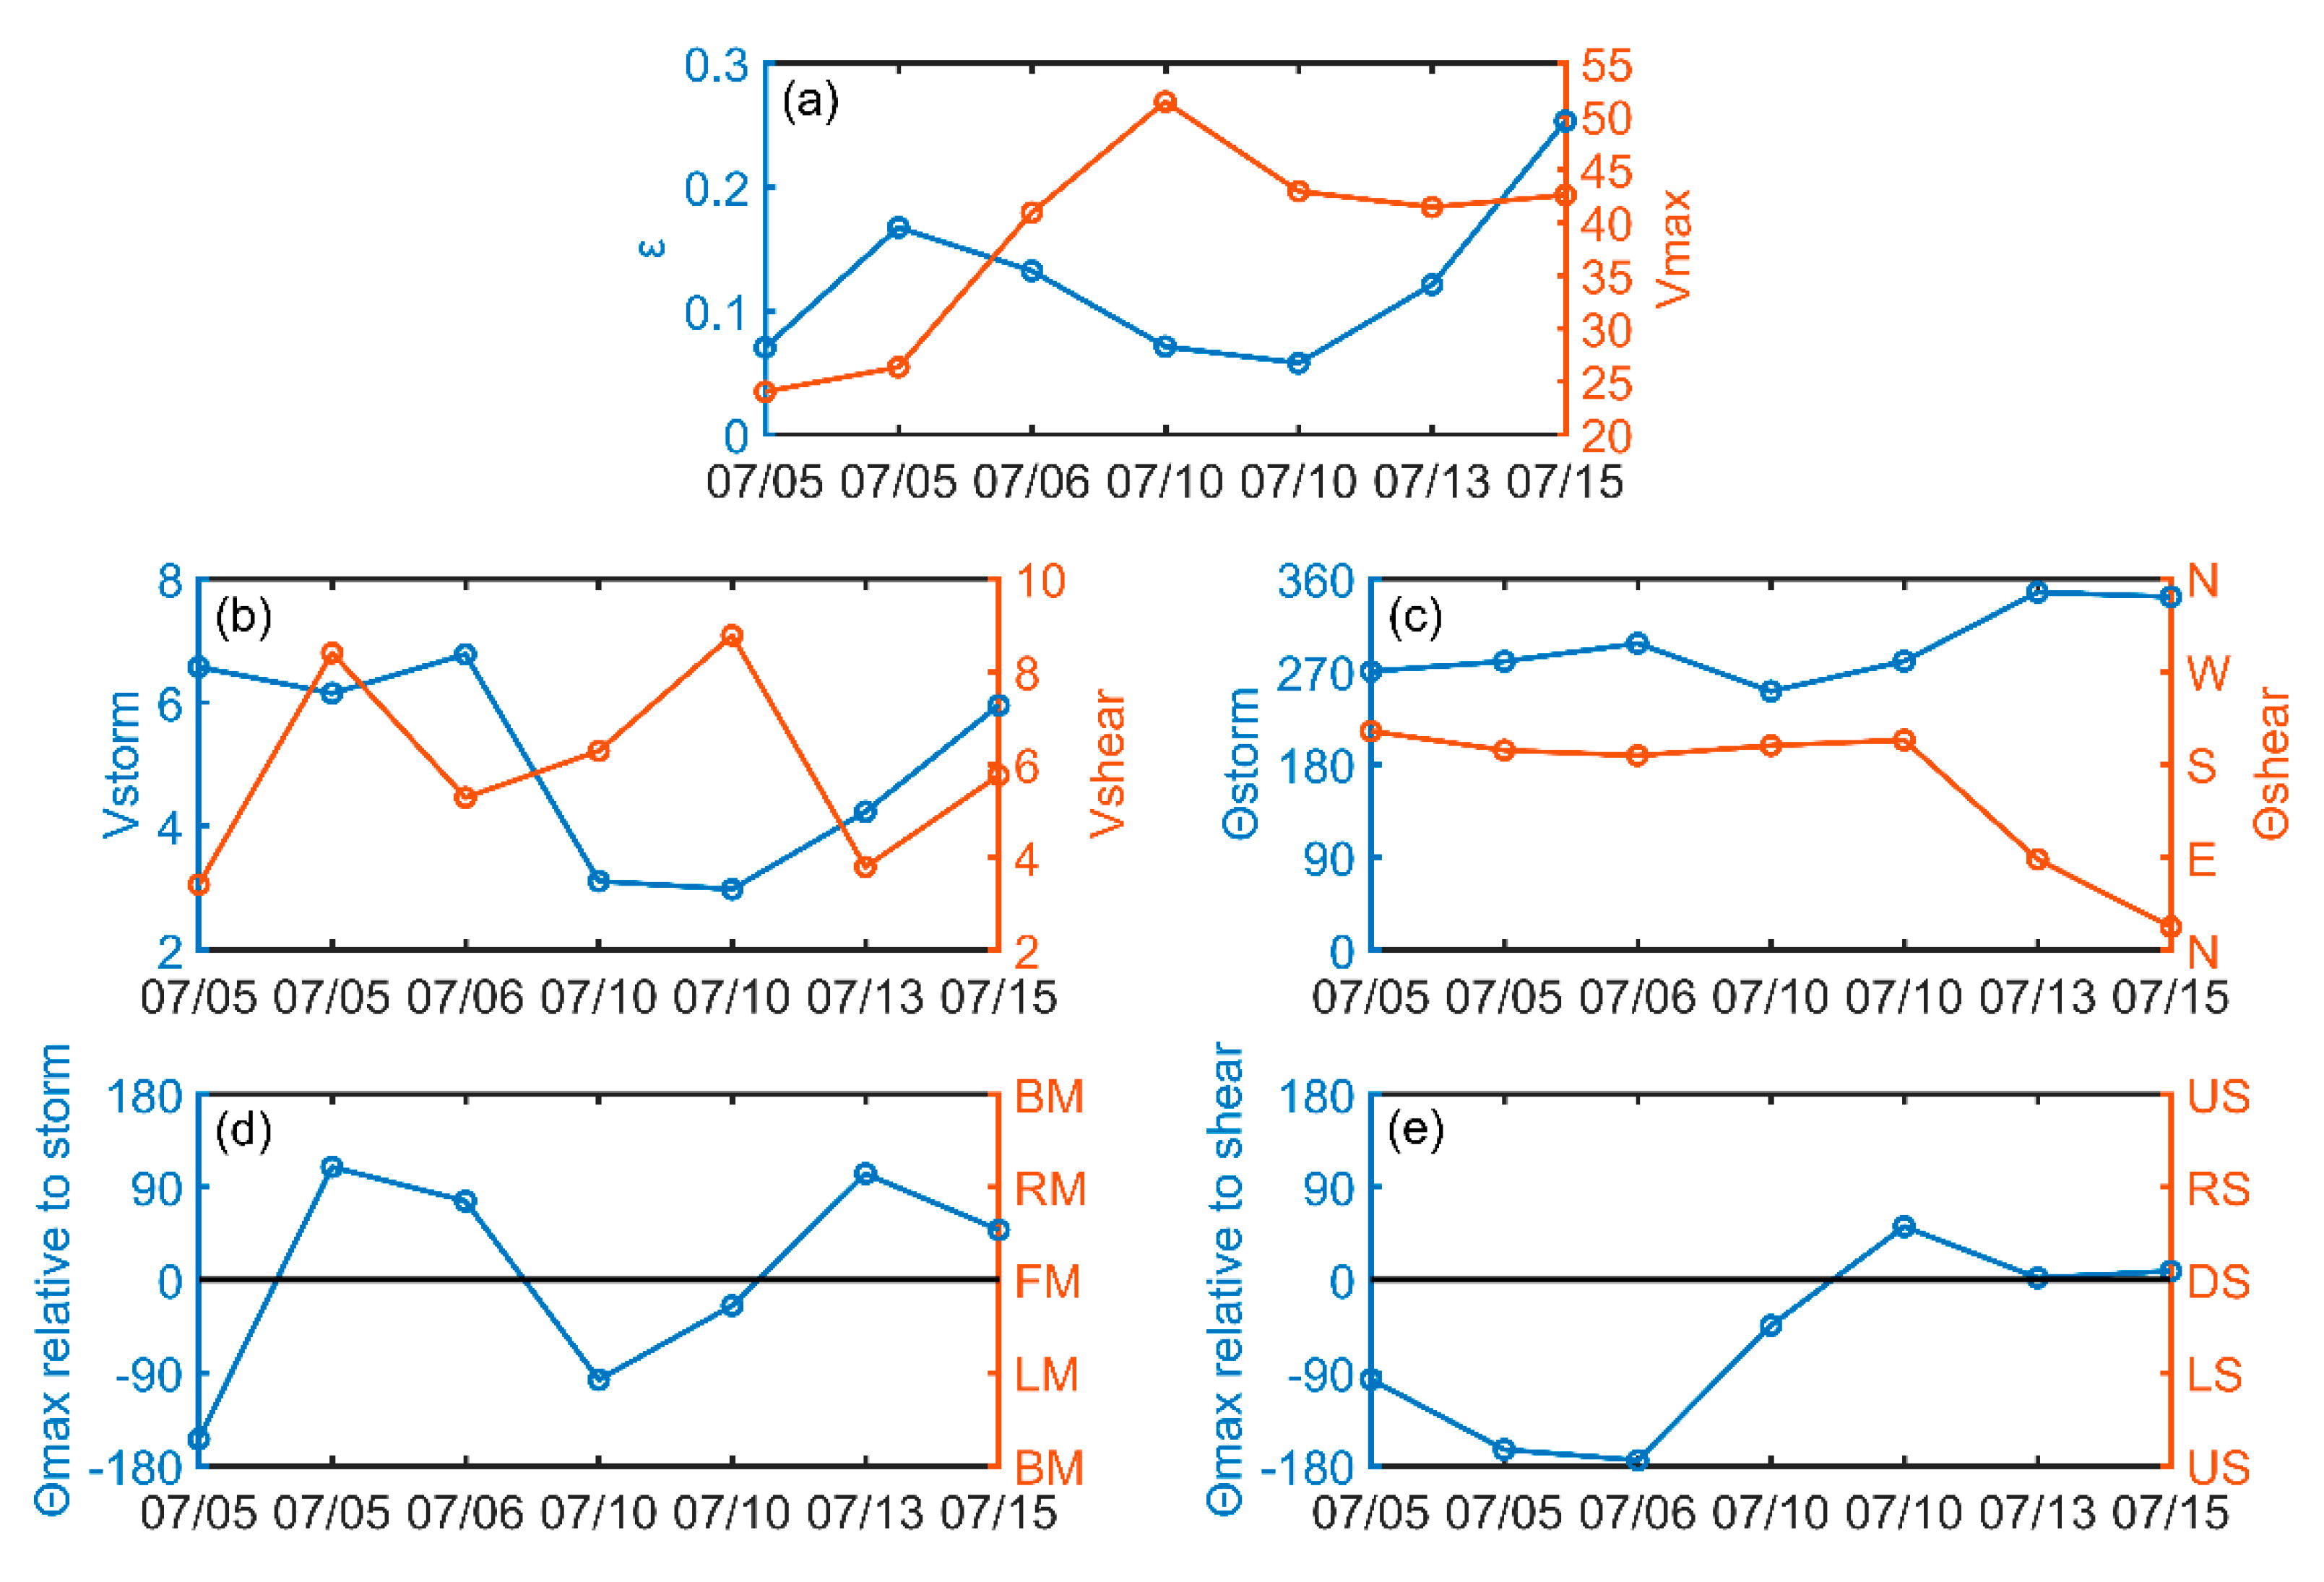
A time series analysis of key parameters of typhoon Nangka was carried out to further investigate the variations of TC surface wind structure. The results are shown in Figure 15. In the early stage of development (5 July), Nangka was classified as a tropical storm (~24 m/s). It moved westward with a relatively fast translation speed (~6–7 m/s) and a small vertical wind shear (~3.4 m/s); its structure appears to be asymmetric. On 6 July, Nangka was upgraded to a typhoon with a maximum wind speed of about 40.8 m/s. The structure of the surface wind field gradually became symmetrical. On 10 July, Nangka reached the super typhoon level (~51.3 m/s). Subsequently, Nangka began to slowly weaken due to its large vertical wind shear (~8.8 m/s) and the eye became cloud filled. In the evening of 12 July, Nangka commenced to have eyewall replacement and its intensity continued to weaken. As a result, the asymmetric structure again emerged for typhoon Nangka. On 13 July, Nangka started to move northward with a slow translation speed (~4 m/s). Thereafter, the eyewall replacement was completed and Nangka underwent re-intensification between 13 and 15 July.
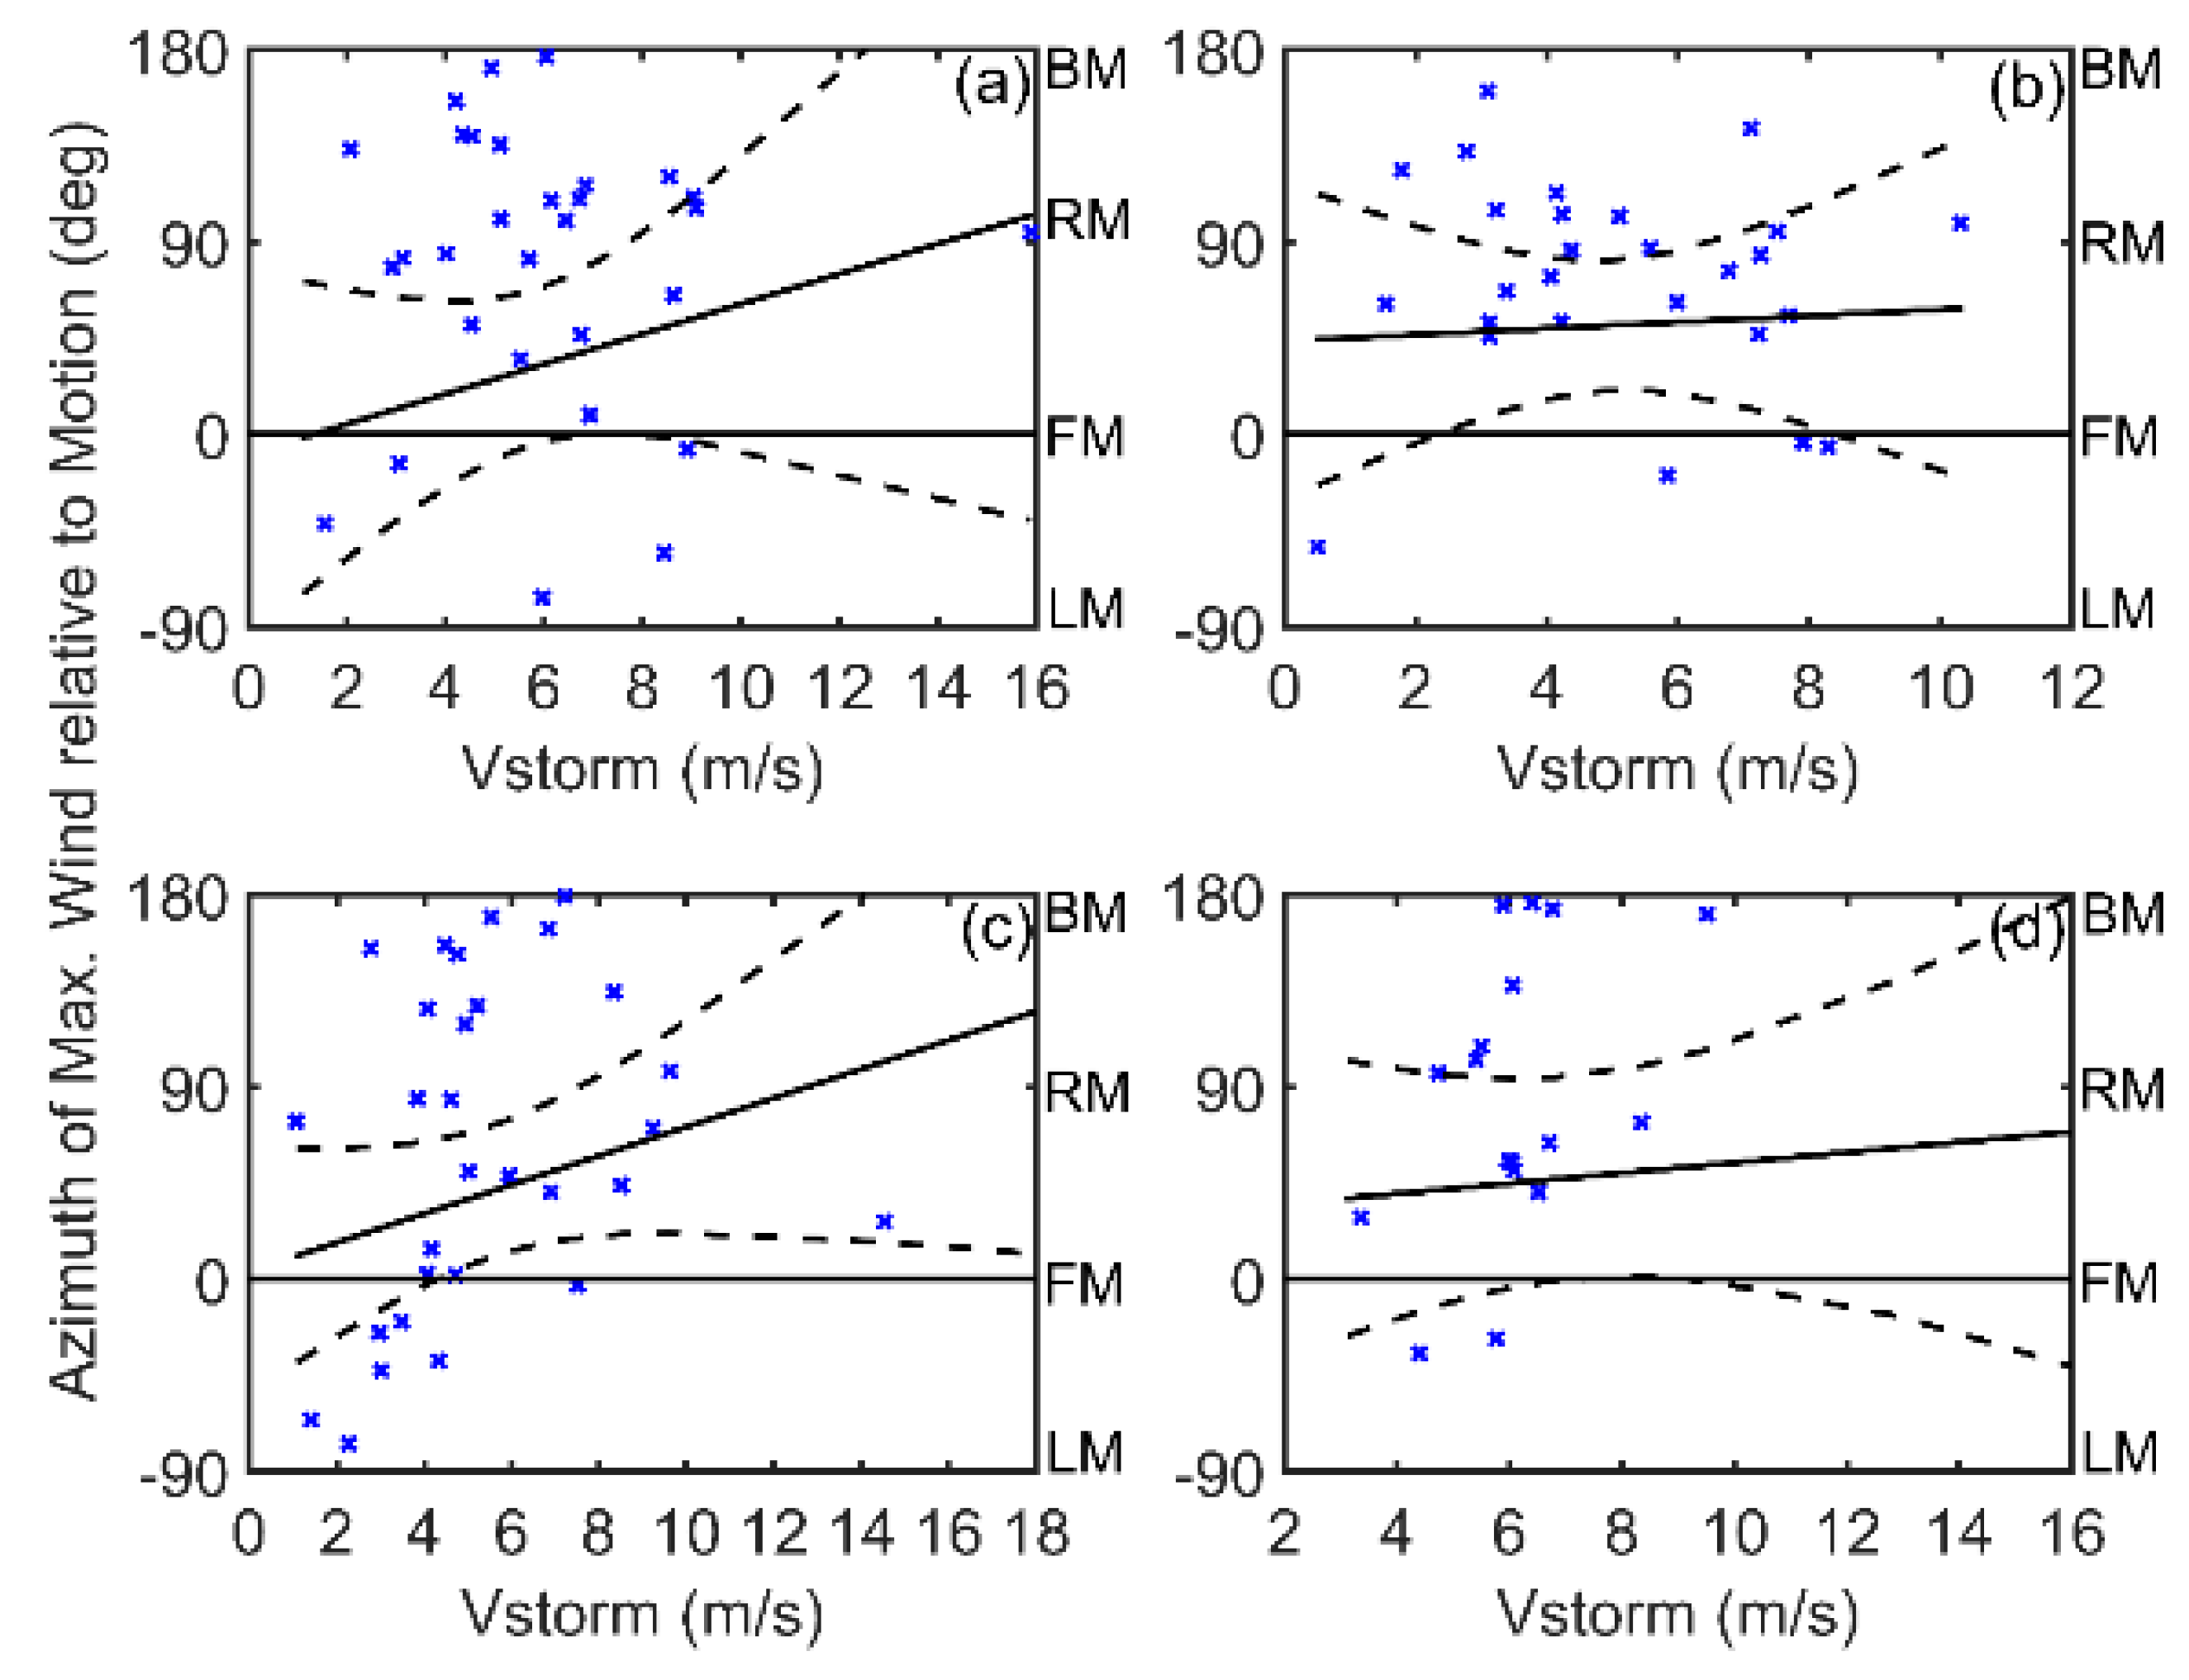
In general, the largest wind speeds are found in the eyewall on the right side of the typhoons in the northern hemisphere. The typhoon’s motion (forward speed) contributes to the counterclockwise wind speed. In our study, and also in previous investigations [16,19,21,22], the maximum wind speeds are found to occur mainly on the left side of the wind shear. However, it is difficult to interpret this phenomenon based only on statistical analysis. Based on SMAP wind observations on five different days of typhoon Nangka’s lifecycle, the positions of the maximum wind speed were found to occur four times on the right side of the storm motion (Figure 15d). Three of these four occurrences corroborate our conclusion that the relative strength between the storm translation speed and the wind shear magnitude affects the position of the maximum wind speed. Namely, the position of the maximum wind speed mostly appears on the right side of the storm motion when the storm translation speed is larger than the magnitude of the wind shear. In the first observation on 10 July, the maximum wind speed position is located on the left side of the storm motion and the wind shear (Figure 15d,e) because the translation speed (~3 m/s) is relatively smaller than the magnitude of the vertical wind shear (~6.3 m/s). In addition, the TC motion direction and the direction of the wind shear are similar (Figure 15c), which is in accordance with the conclusion in [15] that the position of the maximum wind speed occurs on the left side of the storm motion when the angle difference between the storm motion and wind shear is small.
The angle difference between the direction of the storm motion and the direction of the wind shear, and relative strength between the storm translation speed and the wind shear magnitude both have an important influence on the position of the maximum wind speed. The existing TC parametric models [4,27,28] only take into account the impact of the storm motion on the structure of wind field while ignoring the effect of the environmental vertical wind shear. Studies have shown that significant wave heights simulated by numerical ocean wave models using asymmetric wind fields are closer to buoy measurements than those resulting from symmetric wind fields [29]. Therefore, it is necessary to refine parametric wind field models by incorporating the effect of wind shear on TC asymmetries, thereby providing the potential to improve the accuracy of TC simulations, storm warnings, and risk assessments.
In this study, we used spaceborne radiometer wind data to investigate the effect of storm motion and wind shear on TC wind asymmetry, and moreover, we suggest that the relative strength between the storm translation speed and the wind shear magnitude can affect the location of the maximum wind speed. Compared to spaceborne Ku-band scatterometer winds, L-band SMAP radiometer winds have the advantage that for investigation of TC wind field asymmetry, the radiometer-measured brightness temperatures are largely unaffected by rain and have excellent sensitivity to wind speed when winds are very high. However, due to its coarse resolution, SMAP winds are limited in their ability and cannot accurately resolve the detailed structure of TC storms, such as accurate RMW, or provide reliable radial profiles.

6. Conclusions

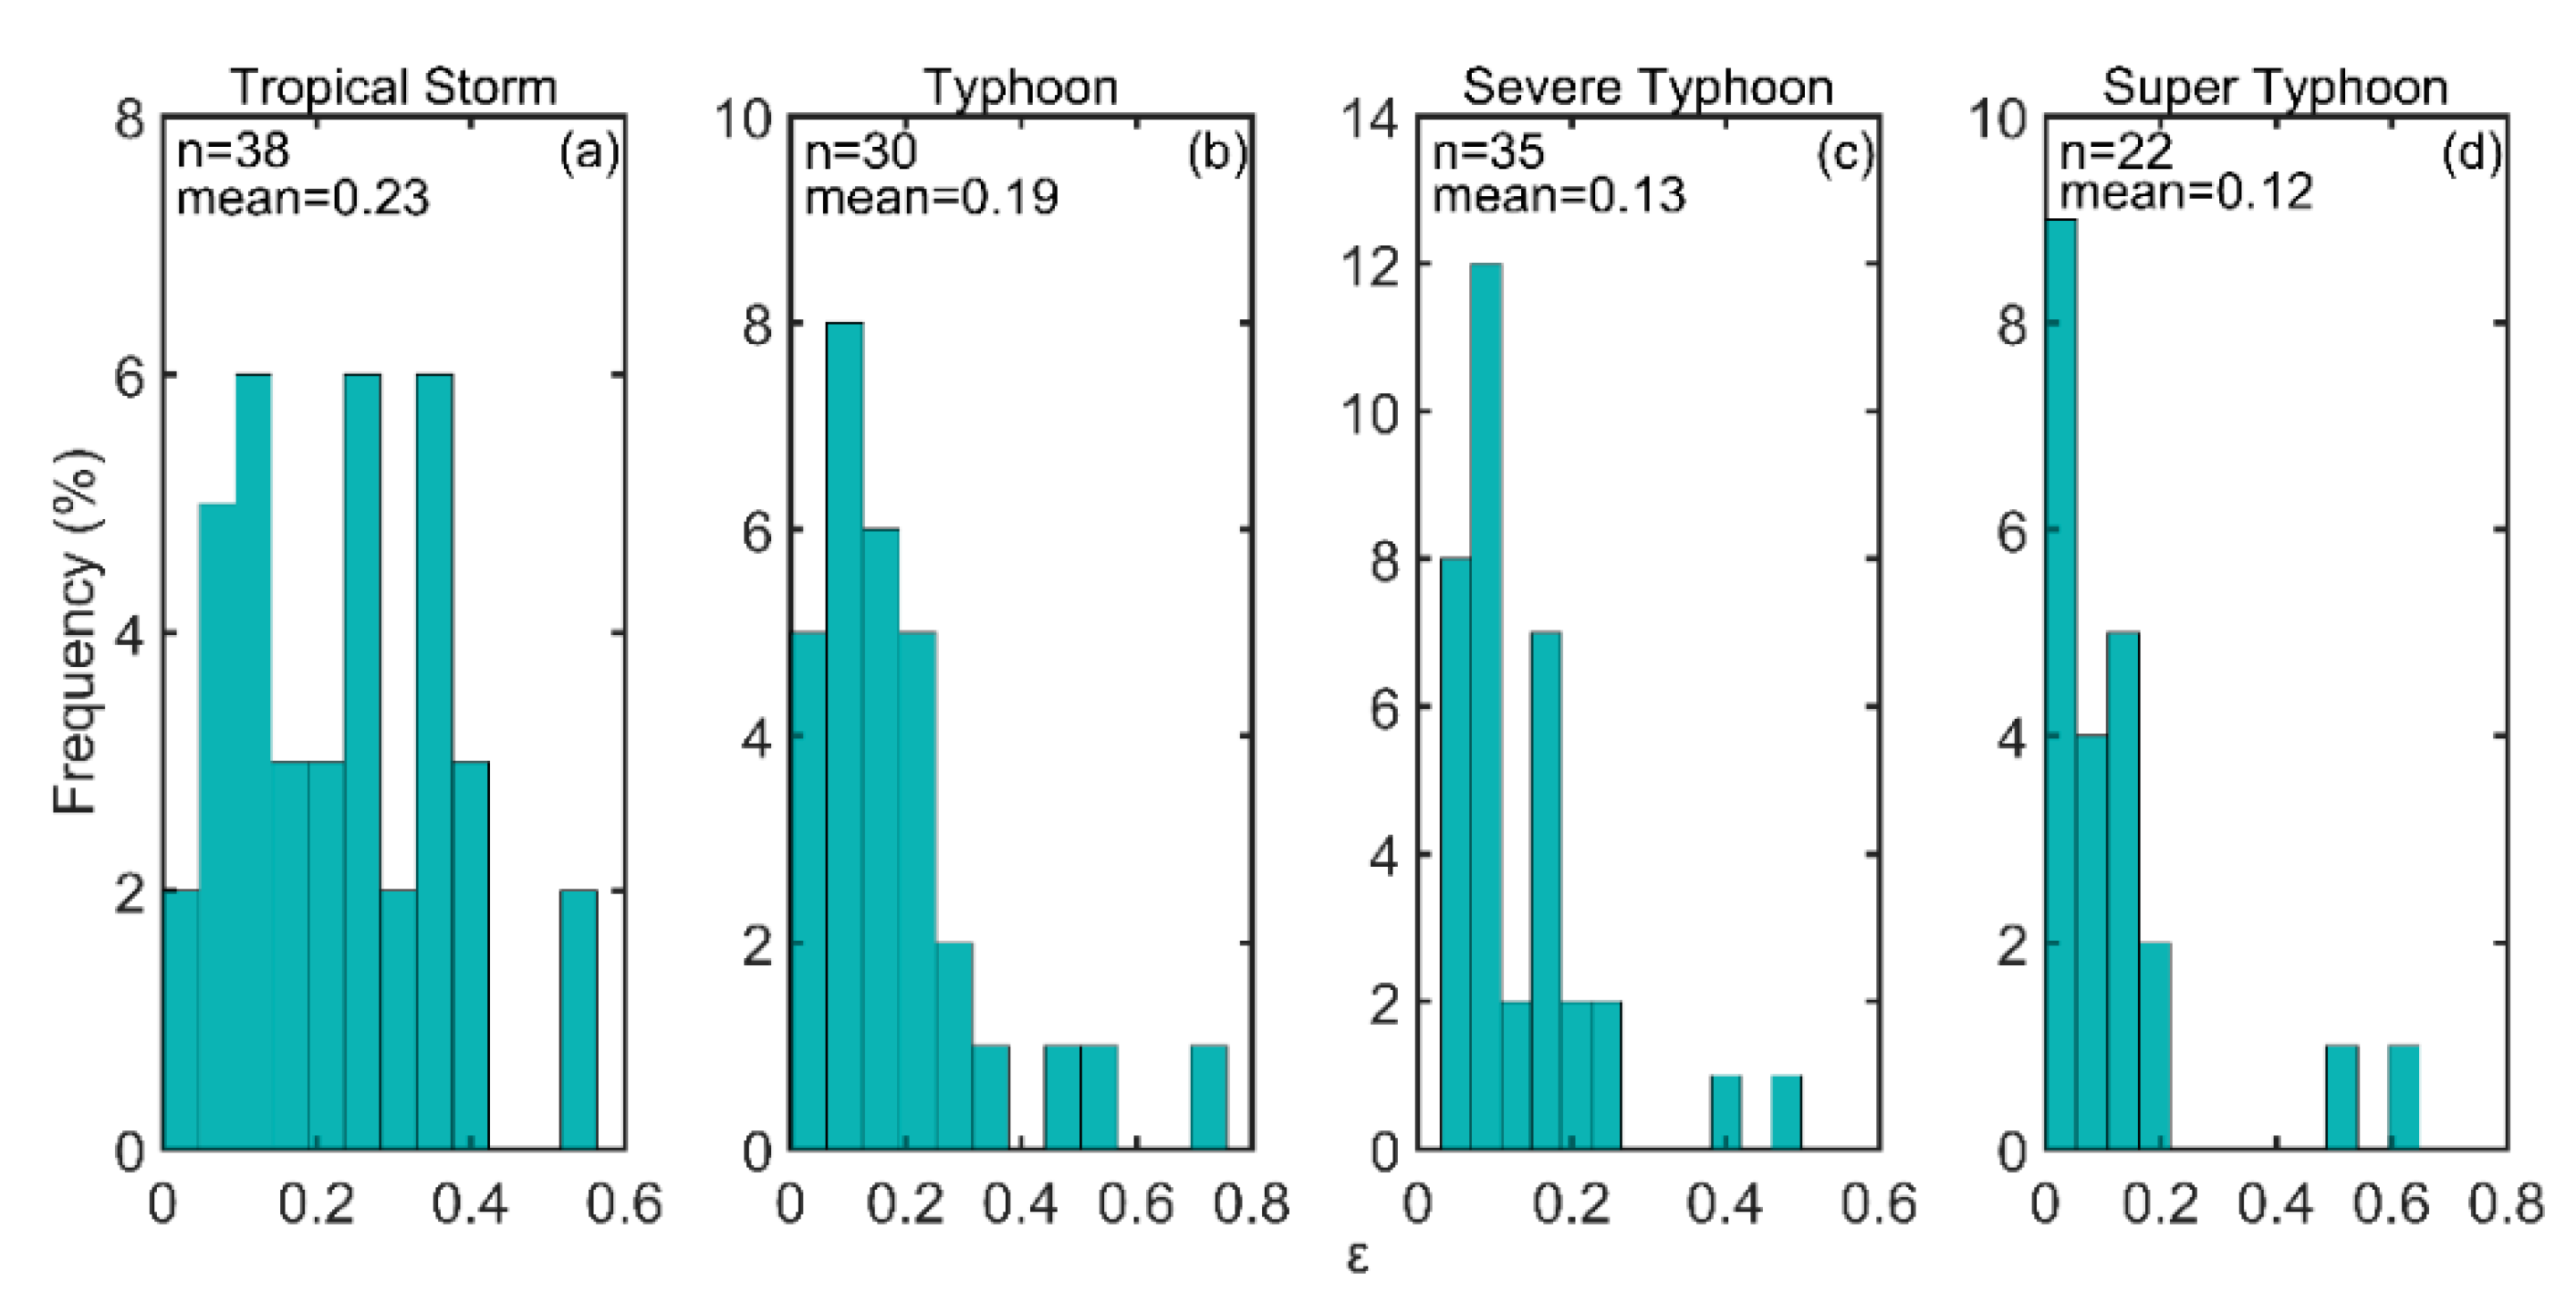
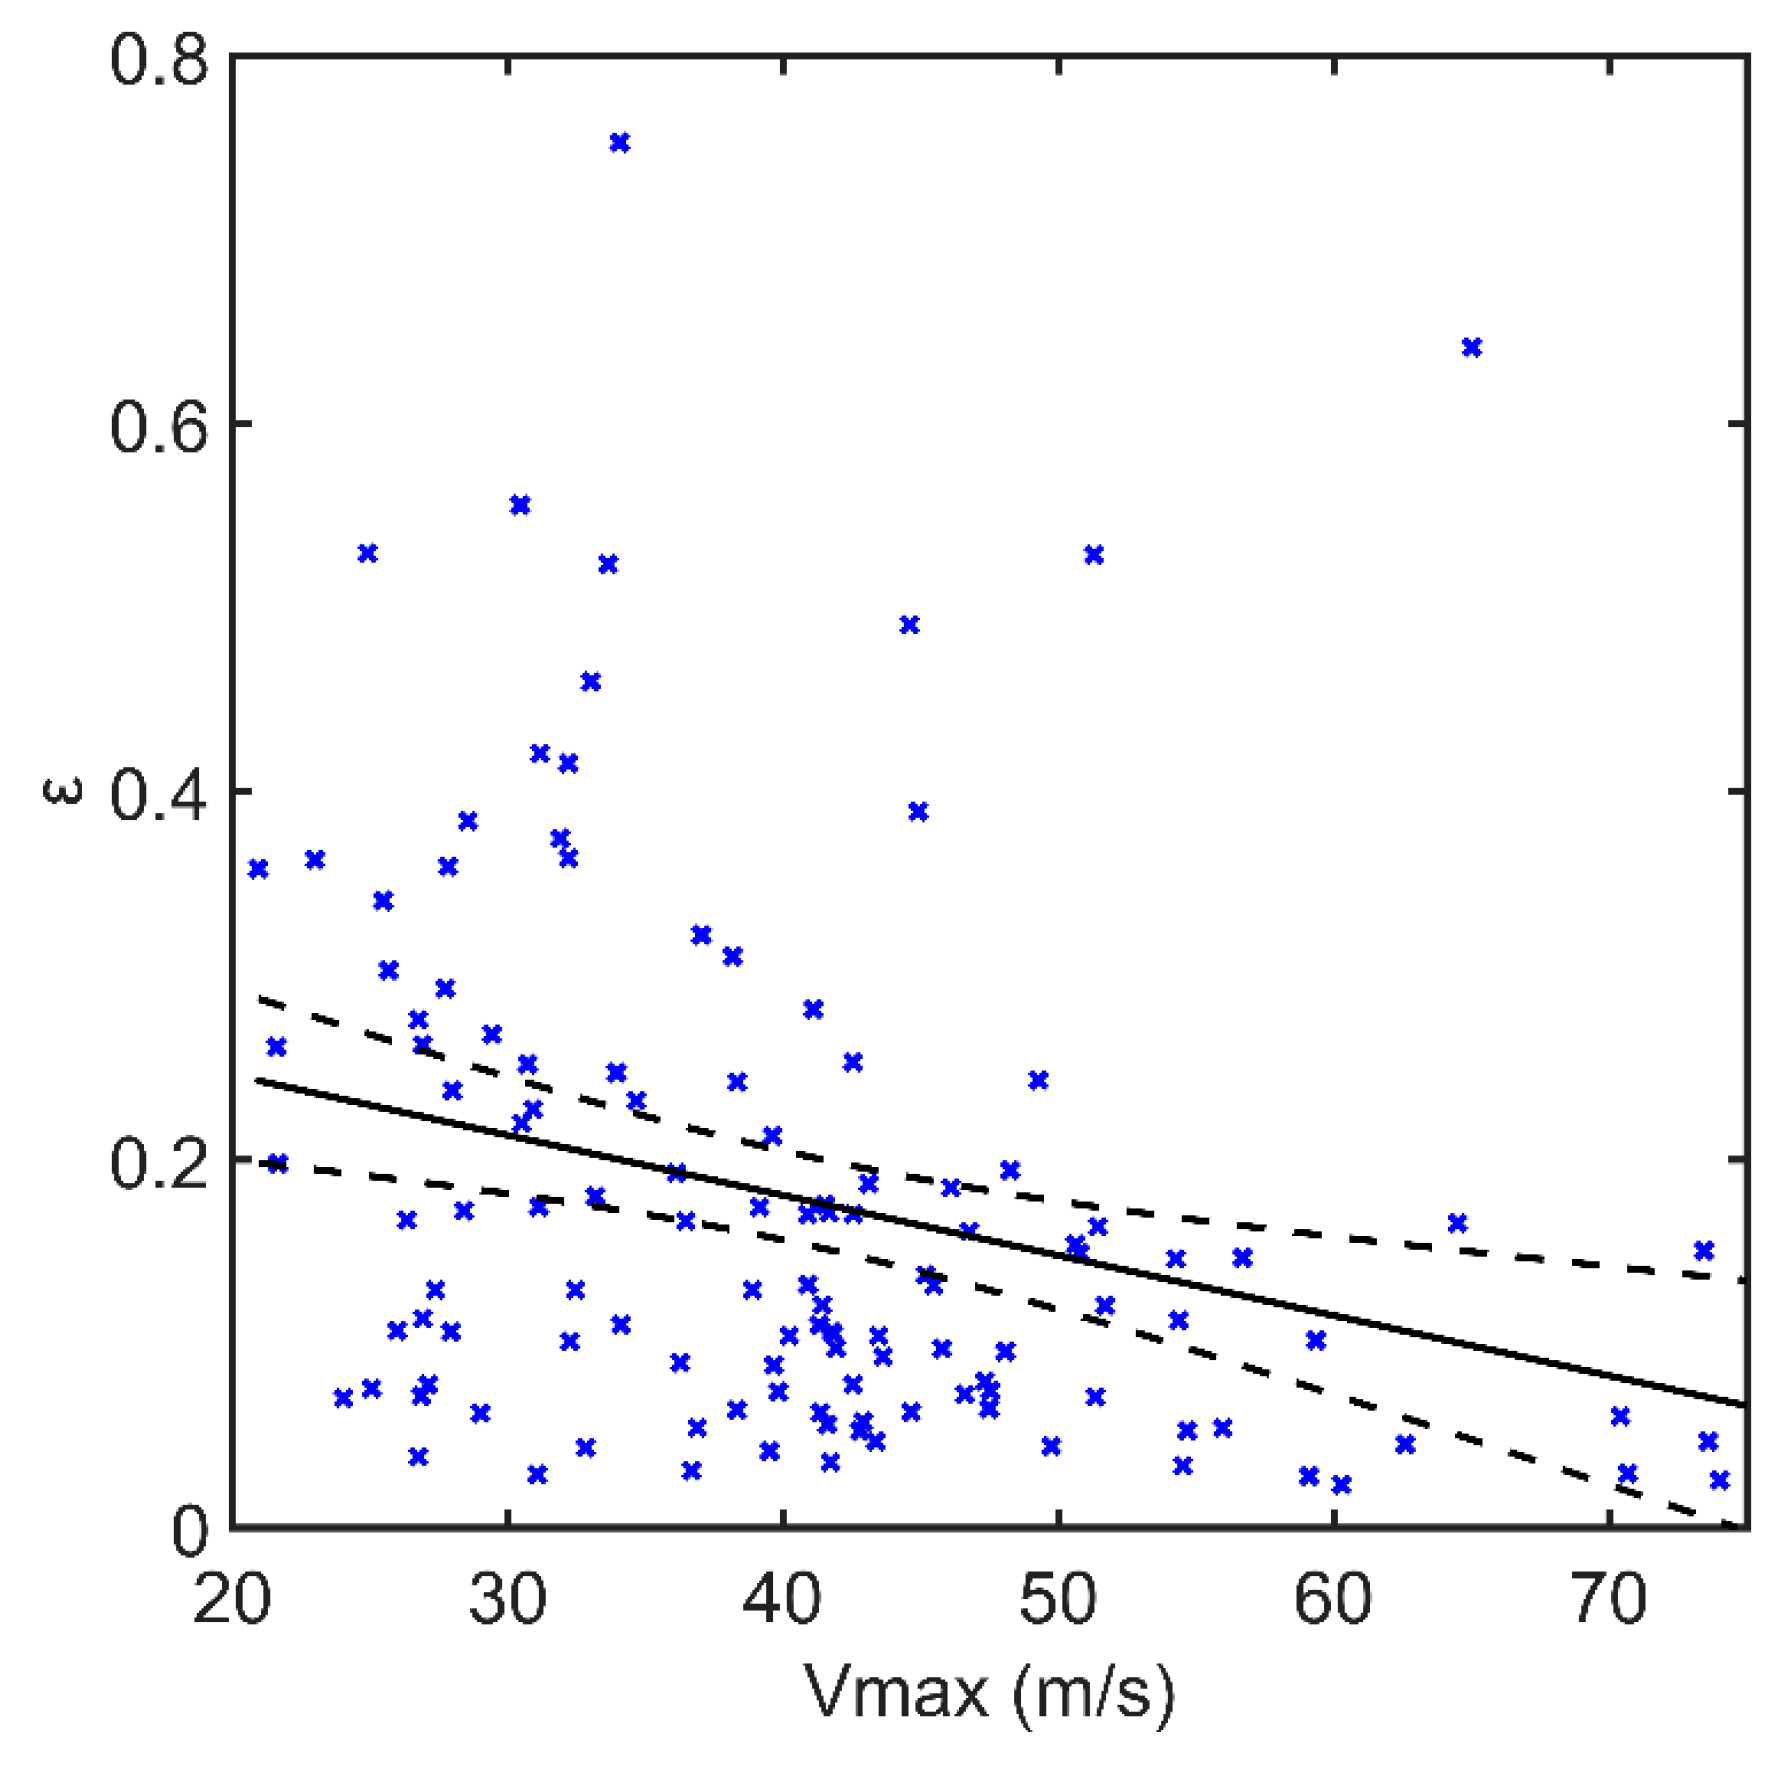
The effects of the storm motion and the environmental vertical wind shear on surface wind asymmetry in TCs were investigated by using SMAP observations in the Northwest Pacific Ocean from 2015 to 2017. The great advantage of the SMAP data is that it can provide accurate TC wind speed measurements up to 70 m/s, thereby allowing studies of the wind asymmetry in TCs with a large range in intensity. The asymmetry parameter was estimated by the ratio of the difference between the maximum wind speed and the azimuthal average of the wind speed, relative to the azimuthal average wind speed at the location of the RMW. The results showed that this asymmetry parameter significantly decreases as the TC intensity increases. The results also showed that the degree of surface wind asymmetry increases significantly with increasing TC translation speed for tropical storms and super typhoons; whereas it has little dependence on the storm motion for typhoons and severe typhoons. However, the asymmetry parameter increases with increasing magnitude of the wind shear for all TC intensity groups.
Moreover, the wind maximum tended to occur to the left side of the wind shear direction and to the right side of the storm motion direction in all TC intensity groups. The relative strength between the storm translation speed and the wind shear magnitude also has the potential to affect the location of the maximum wind speed. The position of the maximum wind speed mostly appears to the right side of the storm motion when the storm translation speed is larger than the magnitude of the wind shear. On the contrary, when the storm translation speed is smaller than the wind shear magnitude, the maximum wind speed mostly occurs to the left side of the wind shear direction. The composite analyses show that the wind maximum rotates, in storms where the wind shear is on the left side of the storm motion direction (LSHR), to those in the upshear (USHR) group, to those where wind shear is on the right side of the storm motion direction (RSHR), and to those in the downshear (DSHR) group. A maximum asymmetry exists when the direction of the TC motion is nearly equal to the direction of the wind shear, whereas a minimum asymmetry is found when the directions of motion and wind shear are opposite to each other.

Author Contributions

B.Z. and J.A.Z. conceived the original idea of the study, suggested for the topic, and contributed to the interpretation of the results; Z.S. carried out the satellite and best track data analysis and prepared all of the figures; W.P. assisted in manuscript preparation and revision. Z.S. and B.Z. wrote the manuscript.

Funding

This research received no external funding other than what is acknowledging below.

Acknowledgments

Z.S. and B.Z. acknowledge support of the National Science Foundation of China for Outstanding Young Scientist under Grant 41622604, the National Key Research and Development Program of China under Grant 2016YFC1401004, the National Program on Global Change and Air-Sea Interaction under Grant GASI-IPOVAI-04. SMAP sea surface wind data are produced by Remote Sensing Systems and sponsored by NASA Earth Science funding. Data are available at www.remss.com/missions/SMAP/winds. The views, opinions, and findings contained in the paper are those of the authors and should not be construed as an official NOAA or U.S. Government position, policy, or decision.

Conflicts of Interest

The authors declare no conflict of interest.

References

  1. Wu, L.; Braun, S.A. Effects of Environmentally Induced Asymmetries on Hurricane Intensity: A Numerical Study. J. Atmos. Sci. 2004, 61, 3065–3081. [Google Scholar] [CrossRef]
  2. Shapiro, L.J. The asymmetric boundary layer flow under a translating hurricane. J. Atmos. Sci. 1983, 40, 1984–1998. [Google Scholar] [CrossRef]
  3. Wang, Y. Vortex Rossby Waves in a Numerically Simulated Tropical Cyclone. Part I: Overall Structure, Potential Vorticity, and Kinetic Energy Budgets. J. Atmos. Sci. 2002, 59, 1213–1238. [Google Scholar] [CrossRef]
  4. Olfateh, M.; Callaghan, D.P.; Nielsen, P.; Baldock, T.E. Tropical Cyclone wind field asymmetry—Development and evaluation of a new parametric model. J. Geophys. Res. Oceans 2017, 122, 458–469. [Google Scholar] [CrossRef]
  5. Yoshizumi, S. On the Asymmetry of Wind Distribution in the Lower Layer in Typhoon. J. Meteorol. Soc. Jpn. Ser. II 1968, 46, 153–159. [Google Scholar] [CrossRef] [Green Version]
  6. Holland, G.J. An analytic model of the wind and pressure profiles in hurricanes. Mon. Weather Rev. 1980, 108, 1212–1218. [Google Scholar] [CrossRef]
  7. Georgiou, P.N.; Davenport, A.G.; Vickery, B.J. Design wind speeds in regions dominated by tropical cyclones. J. Wind Eng. Ind. Aerod. 1983, 13, 139–152. [Google Scholar] [CrossRef]
  8. Kepert, J. The Dynamics of Boundary Layer Jets within the Tropical Cyclone Core. Part I: Linear Theory. J. Atmos. Sci. 2001, 58, 2469–2484. [Google Scholar] [CrossRef] [Green Version]
  9. Rogers, R.F.; Uhlhorn, E. Observations of the structure and evolution of surface and flight-level wind asymmetries in Hurricane Rita (2005). Geophys. Res. Lett. 2008, 35, 113–130. [Google Scholar] [CrossRef]
  10. Corbosiero, K.L.; Molinari, J. The Relationship between Storm Motion, Vertical Wind Shear, and Convective Asymmetries in Tropical Cyclones. J. Atmos. Sci. 2003, 60, 366–376. [Google Scholar] [CrossRef]
  11. Dougherty, E.M.; Monlinari, J.; Rogers, R.F.; Zhang, J.A.; Kossin, J.P. Hurricane Bonnie (1998): Maintaining intensity during high vertical wind shear and an eyewall replacement cycle. Mon. Weather Rev. 2018, 146, 3383–3399. [Google Scholar] [CrossRef]
  12. Chou, K.-H.; Yeh, C.-M.; Lin, S.-J. The roles of vertical wind shear and topography in formation of convective asymmetries in Typhoon Nanmadol (2011). Terr. Atmos. Ocean. Sci. 2019, 30, 185–214. [Google Scholar] [CrossRef]
  13. Ueno, M. Observational Analysis and Numerical Evaluation of the Effects of Vertical Wind Shear on the Rainfall Asymmetry in the Typhoon Inner-Core Region. J. Meteorol. Soc. Jpn. 2007, 85, 115–136. [Google Scholar] [CrossRef] [Green Version]
  14. Tomislava, V.; Uhlhorn, E.; Reasor, P.; Klotz, B. A novel multi-scale intensity metric for evaluation of tropical cyclone intensity forecasts. J. Atmos. Sci. 2014, 71, 1292–1304. [Google Scholar]
  15. Ueno, M.; Kunii, M. Some Aspects of Azimuthal Wavenumber-One Structure of Typhoons Represented in the JMA Operational Mesoscale Analyses. J. Meteorol. Soc. Jpn. Ser. II 2009, 87, 615–633. [Google Scholar] [CrossRef] [Green Version]
  16. Uhlhorn, E.W.; Klotz, B.W.; Vukicevic, T.; Reasor, P.D.; Rogers, R.F. Observed Hurricane Wind Speed Asymmetries and Relationships to Motion and Environmental Shear. Mon. Weather Rev. 2014, 142, 1290–1311. [Google Scholar] [CrossRef]
  17. Uhlhorn, E.W.; Black, P.G.; Franklin, J.L.; Goodberlet, M.; Carswell, J.; Goldstein, A.S. Hurricane Surface Wind Measurements from an Operational Stepped Frequency Microwave Radiometer. Mon. Weather Rev. 2007, 135, 3070–3085. [Google Scholar] [CrossRef] [Green Version]
  18. Stiles, B.W.; Danielson, R.E.; Poulsen, W.L.; Brennan, M.J.; Fore, A.G. Optimized Tropical Cyclone Winds From QuikSCAT: A Neural Network Approach. IEEE Trans. Geosci. Remote. 2014, 52, 7418–7434. [Google Scholar] [CrossRef]
  19. Ueno, M.; Bessho, K. A Statistical Analysis of Near-Core Surface Wind Asymmetries in Typhoons Obtained from QuikSCAT Data. J. Meteorol. Soc. Jpn. 2011, 89, 225–241. [Google Scholar] [CrossRef] [Green Version]
  20. Brennan, M.J.; Hennon, C.C.; Knabb, R.D. The Operational Use of QuikSCAT Ocean Surface Vector Winds at the National Hurricane Center. Weather Forecast. 2009, 24, 621–645. [Google Scholar] [CrossRef] [Green Version]
  21. Klotz, B.W.; Jiang, H. Global composites of surface wind speeds in tropical cyclones based on a 12 year scatterometer database. Geophys. Res. Lett. 2016. [Google Scholar] [CrossRef]
  22. Klotz, B.W.; Jiang, H. Examination of Surface Wind Asymmetries in Tropical Cyclones: Part, I. General Structure and Wind Shear Impacts. Mon. Weather Rev. 2017, 145, 3989–4009. [Google Scholar] [CrossRef]
  23. Meissner, T.; Ricciardulli, L.; Wentz, F.J. Capability of the SMAP Mission to Measure Ocean Surface Winds in Storms. Bull. Am. Meteor. Soc. 2017, 98, 1660–1677. [Google Scholar] [CrossRef]
  24. Yueh, S.H.; Fore, A.G.; Tang, W.; Hayashi, A.; Stiles, B.; Reul, N. SMAP L-Band Passive Microwave Observations of Ocean Surface Wind During Severe Storms. IEEE Trans. Geosci. Remote 2016, 54, 7339–7350. [Google Scholar] [CrossRef]
  25. Fore, A.G.; Yueh, S.H.; Stiles, B.W.; Tang, W.; Hayashi, A.K. SMAP Radiometer-Only Tropical Cyclone Intensity and Size Validation. IEEE Trans. Geosci. Res. Lett. 2018, 15, 1480–1484. [Google Scholar] [CrossRef]
  26. Entekhabi, D. The Soil Moisture Active Passive (SMAP) mission. Proc. IEEE 2010, 98, 704–716. [Google Scholar] [CrossRef]
  27. Georgiou, P.N. Design Wind Speeds in Tropical Cyclone-Prone Regions. Doctor Dissertation, Western Libraries, London, ON, Canada, 1986. [Google Scholar]
  28. Holland, G. A Revised Hurricane Pressure-Wind Model. Mon. Weather Rev. 2008, 136, 3432–3445. [Google Scholar] [CrossRef]
  29. Liu, H.; Xie, L.; Pietrafesa, L.J.; Bao, S. Sensitivity of wind waves to hurricane wind characteristics. Ocean. Model. 2007, 18, 37–52. [Google Scholar] [CrossRef]
Figure 1. Geographical locations of 125 TC cases in the Northwest Pacific Ocean observed by SMAP. Blue stars and black circles denote that the corresponding asymmetry parameter (ε) is larger or smaller than 0.2, for a particular TC, respectively.
Remotesensing 11 02604 g001
Figure 2. Histograms of parameters used for: (a) TC intensity ( V m a x ); (b) TC translation speed ( V s t o r m ); (c) environmental vertical wind shear magnitude ( V s h e a r ); (d) TC motion direction ( θ s t o r m ); (e) environmental vertical wind shear direction ( θ s h e a r ); and (f) angle difference between the shear direction and the TC motion direction ( θ s h e a r θ s t o r m ). Note that 0° in (d) and (e) represents North; 0° in (f) indicates that the wind shear and storm motion directions are equal. RS indicates that the wind shear is located on the right side of the TC motion and LS indicates that the wind shear is located on the left side of the TC motion.
Remotesensing 11 02604 g002
Figure 3. Histogram of the asymmetry parameter ( ε ) for (a) a tropical storm; (b) typhoon; (c) severe typhoon; and (d) super typhoon. The number of cases in each group and the mean value of ε for each group is marked.
Remotesensing 11 02604 g003
Figure 4. Asymmetry parameter ( ε ) versus TC intensity ( V m a x ). Black solid and dashed lines represent linear regressions and 95% confidence intervals for the fits, respectively.
Remotesensing 11 02604 g004
Figure 5. Composites of normalized two-dimensional SMAP wind speed fields are illustrated for (a) a tropical storm, (b) typhoon, (c) severe typhoon, and (d) super typhoon, as shown in Figure 3. Isoline intervals are 0.025 normalized units, and the maximum wind speed is equal to a value of 1. The red arrow and the black star indicate the direction of the wind shear and the location of the maximum wind speed in each group, respectively. The average maximum wind speed in each of the different groups is marked at the top of each panel. Black circles with radii 2 × RMW and 4 × RMW are also shown, for easy comparison among the different groups.
Remotesensing 11 02604 g005
Figure 6. Similar to Figure 5 but in a motion-relative coordinate framework. The yellow arrow indicates the typhoon motion direction. Other details are the same.
Remotesensing 11 02604 g006
Figure 7. Asymmetry parameter ( ε ) versus typhoon translation speed ( V s t o r m ) for (a) a tropical storm, (b) typhoon, (c) severe typhoon, and (d) super typhoon, as shown in Figure 3. The number of storms for each group is marked. The black solid and dashed lines represent linear regressions and 95% confidence intervals for the fits, respectively.
Remotesensing 11 02604 g007
Figure 8. Asymmetry parameter (ε) versus the environmental vertical wind shear magnitude ( V s h e a r ) for (a) a tropical storm, (b) typhoon, (c) severe typhoon, and (d) super typhoon, as shown in Figure 3. The number of storms for each group is marked. The black solid and dashed lines represent the linear regressions and 95% confidence intervals for the fits, respectively.
Remotesensing 11 02604 g008
Figure 9. Maximum wind speed position ( θ m a x ) versus the typhoon translation speed ( V s t o r m ) for (a) a tropical storm, (b) typhoon, (c) severe typhoon, and (d) super typhoon, as shown in Figure 3. The black solid and dashed lines represent linear regressions and 95% confidence intervals for the fits, respectively. θ m a x (°) is in the clockwise azimuthal direction relative to the typhoon movement direction. RM indicates that θ m a x is located on the right side of the TC motion, LM indicates that θ m a x is located on the left side of the TC motion, FM indicates that θ m a x is located to the forward of the TC motion, and BM indicates that θ m a x is located behind the TC motion.
Remotesensing 11 02604 g009
Figure 10. Maximum wind speed position ( θ m a x ) versus the environmental vertical wind shear magnitude ( V s h e a r ) for (a) a tropical storm, (b) typhoon, (c) severe typhoon, and (d) super typhoon, as shown in Figure 3. The black solid and dashed lines represent linear regressions and 95% confidence intervals for the fits, respectively. θ m a x (°) is clockwise azimuth relative to the wind shear direction. RS indicates that θ m a x is located on the right side of the wind shear, LS indicates that θ m a x is located on the left side of the wind shear, DS indicates that θ m a x is ‘downshear’, and US indicates that θ m a x is ‘upshear’.
Remotesensing 11 02604 g010
Figure 11. Azimuth angle of the wind maximum to the storm movement versus the azimuth angle of the wind maximum to vertical wind shear for (a) a tropical storm, (b) typhoon, (c) severe typhoon, and (d) super typhoon as shown in Figure 3. The blue diamond indicates that V s t o r m is larger than V s h e a r , and the red cross indicates that V s t o r m is smaller than V s h e a r .
Remotesensing 11 02604 g011
Figure 12. Composites of normalized two-dimensional SMAP wind speed fields for: (a) Wind shear direction and storm motion direction are equal (DSHR); (b) wind shear is on the left side of the storm motion (LSHR); (c) wind shear and storm motion are in the opposite direction (USHR); and (d) wind shear is on the right side of the storm motion (RSHR). Other details are the same as in Figure 5.
Remotesensing 11 02604 g012
Figure 13. Histogram of the asymmetry parameter ( ε ) for: (a) Wind shear and storm motion directions are equal (DSHR); (b) wind shear is on the left side of the motion (LSHR); (c) wind shear and storm motion are in the opposite direction (USHR); and (d) wind shear is on the right side of the storm motion (RSHR). The number of storms in each group and the mean value of ε for each group are indicated.
Remotesensing 11 02604 g013
Figure 14. Asymmetry parameter ( ε ) versus TC intensity ( V m a x ), translation speed ( V s t o r m ), and environmental vertical wind shear magnitude ( V s h e a r ) for Noru (ac), Nangka (df), and Atsani (gi). Black solid and dashed lines represent linear regressions and 95% confidence intervals for the fits, respectively.
Remotesensing 11 02604 g014
Figure 15. Time series of key parameters of typhoon Nangka: (a) Asymmetry parameter ( ε ) and TC intensity ( V m a x ); (b) translation speed ( V s t o r m ) and environmental vertical wind shear magnitude ( V s h e a r ); (c) TC motion direction ( θ s t o r m ) and environmental vertical wind shear direction ( θ s h e a r ); (d) Azimuth angle of wind maximum ( θ m a x ) relative to storm movement; (e) Azimuth angle of the wind maximum ( θ m a x ) relative to vertical wind shear. RM indicates that θ m a x is located on the right side of the TC motion, LM indicates that θ m a x is located on the left side of the TC motion, FM indicates that θ m a x is located forward of the TC motion, and BM indicates that θ m a x is located behind the TC motion. RS indicates that θ m a x is located on the right side of the wind shear, LS indicates that θ m a x is located on the left side of the wind shear, DS indicates that θ m a x is ‘downshear’, and US indicates that θ m a x is ‘upshear’.
Remotesensing 11 02604 g015
Table 1. Names of TCs and corresponding numbers of SMAP wind field snapshots. The year in which each storm occurred is also shown in the table.
YearStorm (No. of Wind Fields)
2015Atsani (6), Chan-hom (2), Champi (4), Dolphin (3), Dujuan (5), Goni (3), Haishen (1), In-fa (5), Koppu (2), Krovanh (4), Linfa (1), Maysak (2), Melor (2), Nangka (7), Noul (3), Soudelor (3), Choi-wan (1)
2016Haima (2), Lionrock (7), Megi (1), Meranti (2), Nepartak (4), Sarika (1), Songda (4), Ghaba (3), Malakas (4), Meari (3), Mindulle (1), Namtheun (1), Omais (1), Conson (1)
2017Khanun (1), Kulap (1), Lan (4), Nalgae (1), Nanmadol (1), Nesat (2), Noru (10), Sanvu (4), Saola (3), Talim (3), Banyan (5), Kai-tak (1)
Total43 (125)
Table 2. Linear regression coefficients for the asymmetry parameter ( ε ) versus TC intensity ( V m a x ) [ ε = a + b V m a x ] (Figure 4).
Asymmetry Parameter ε = a + b V m a x
ab
ε = a + b V m a x 0.3112−0.0033
Table 3. Linear regression coefficients for the asymmetry parameter ( ε ) versus the typhoon translation speed ( V s t o r m ) [ ε = a + b V s t o r m ] (Figure 7), and the asymmetry parameter (ε) versus the environmental vertical wind shear magnitude ( V s h e a r ) [ ε = c + d V s h e a r ] (Figure 8) for different intensity groups.
Asymmetry Parameter ε = a + b V s t o r m ε = c + d V s h e a r
abcd
tropical storm0.17360.01050.19080.0129
typhoon0.2315−0.00820.09770.0186
severe typhoon0.11850.00290.07780.0122
super typhoon−0.05890.0263−0.04470.0354
Table 4. Linear regression coefficients for the maximum wind speed position ( θ m a x ) with respect to the typhoon translation speed ( V s t o r m ) [ θ m a x = a + b V s t o r m ] (Figure 9), and also with respect to the environmental vertical wind shear magnitude ( V s h e a r ) [ θ m a x = c + d V s h e a r ] (Figure 10) for different storm intensity groups.
Maximum Wind Speed Position θ m a x = a + b V s t o r m θ m a x = c + d V s h e a r
abcd
tropical storm−9.21087.0214–33.802–2.2985
typhoon43.6191.4731–25.739–3.8484
severe typhoon3.5746.765526.554–6.3546
super typhoon30.3552.4134–5.9658–3.2414

