The Seamless Solar Radiation (SESORA) Forecast for Solar Surface Irradiance—Method and Validation


Abstract
1. Introduction
2. Materials and Methods
2.1. Validation Data
2.1.1. SARAH-2
2.1.2. Ground Stations
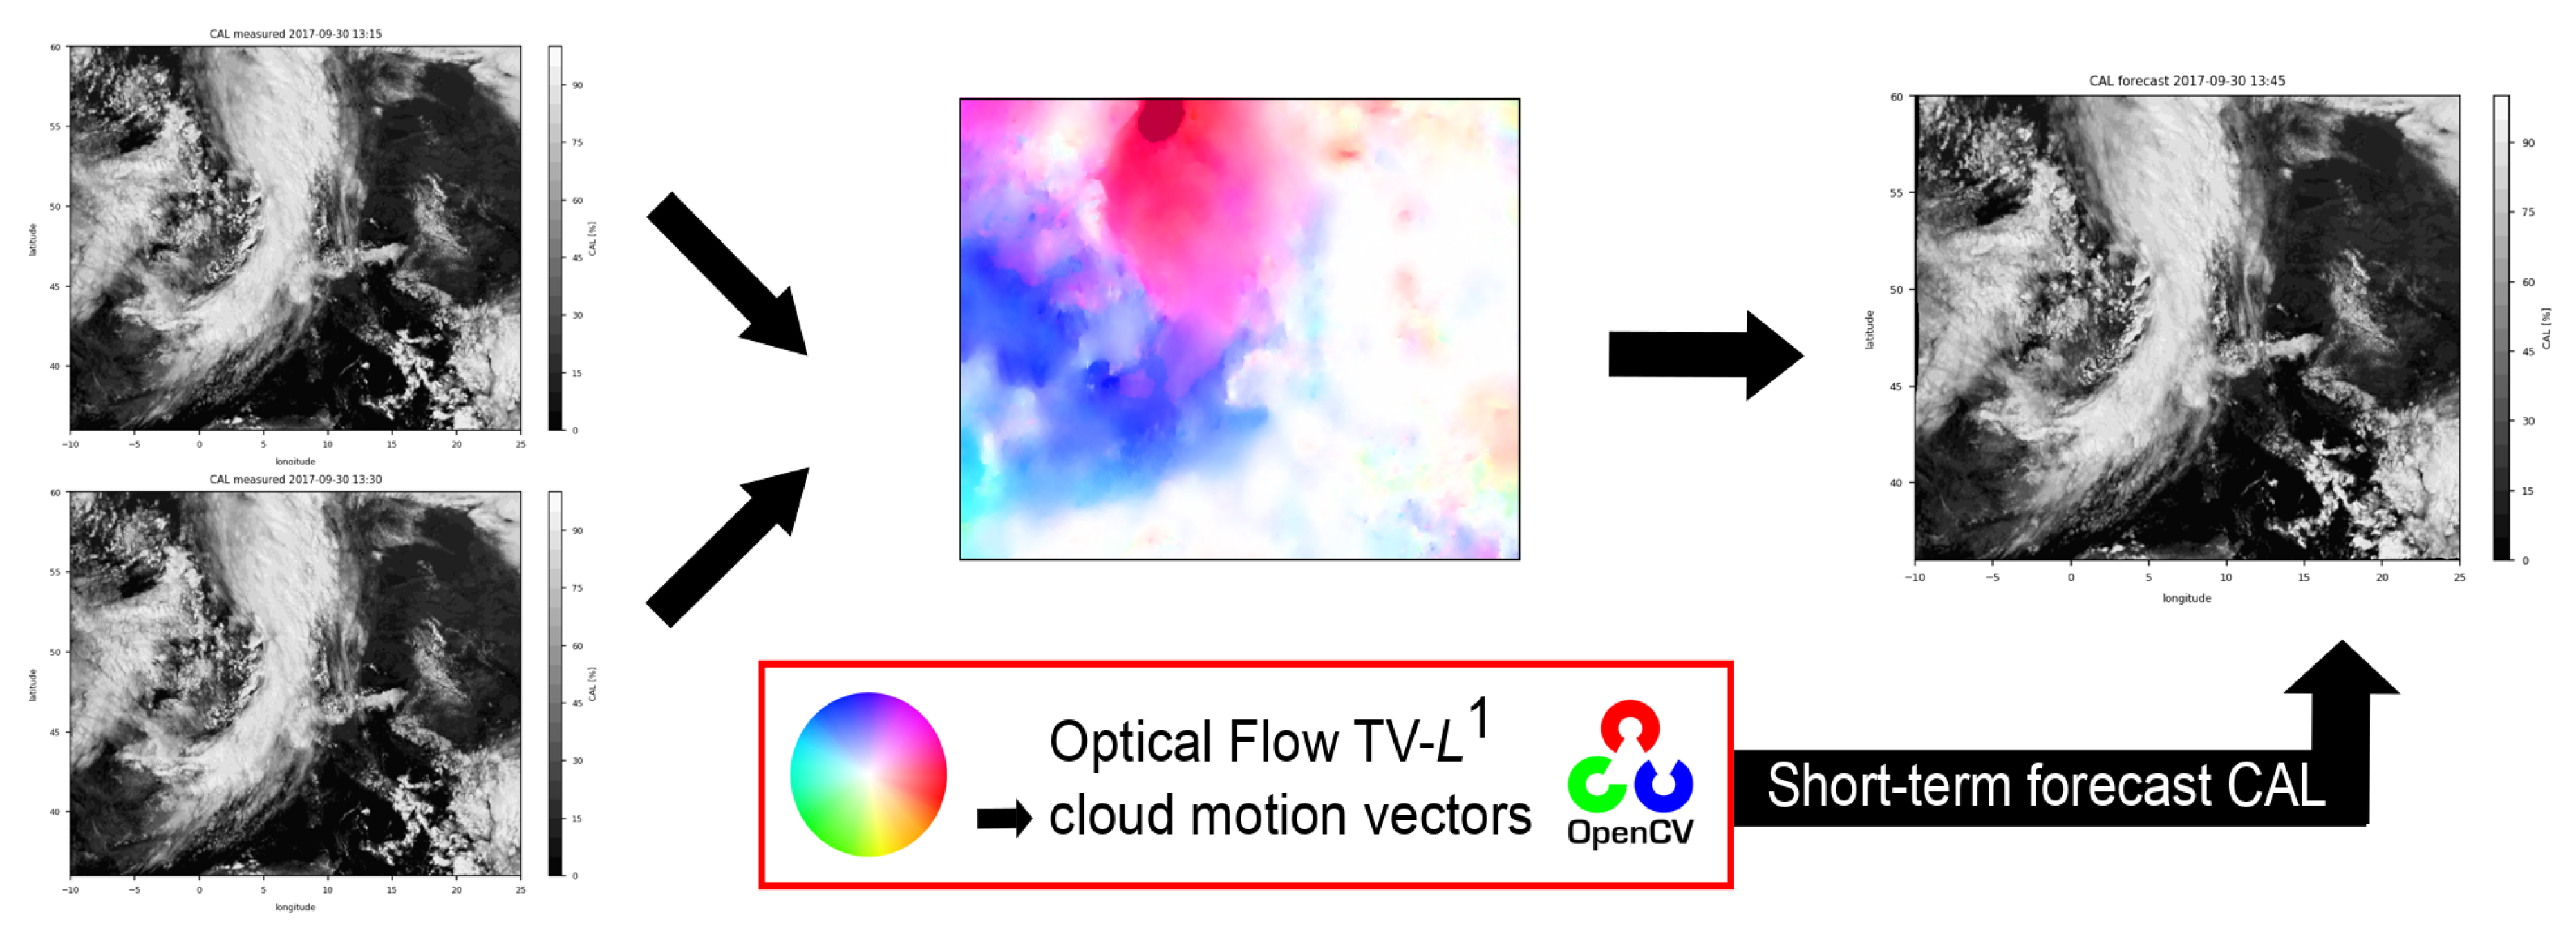
2.2. Optical Flow Method
2.3. SPECMAGIC NOW
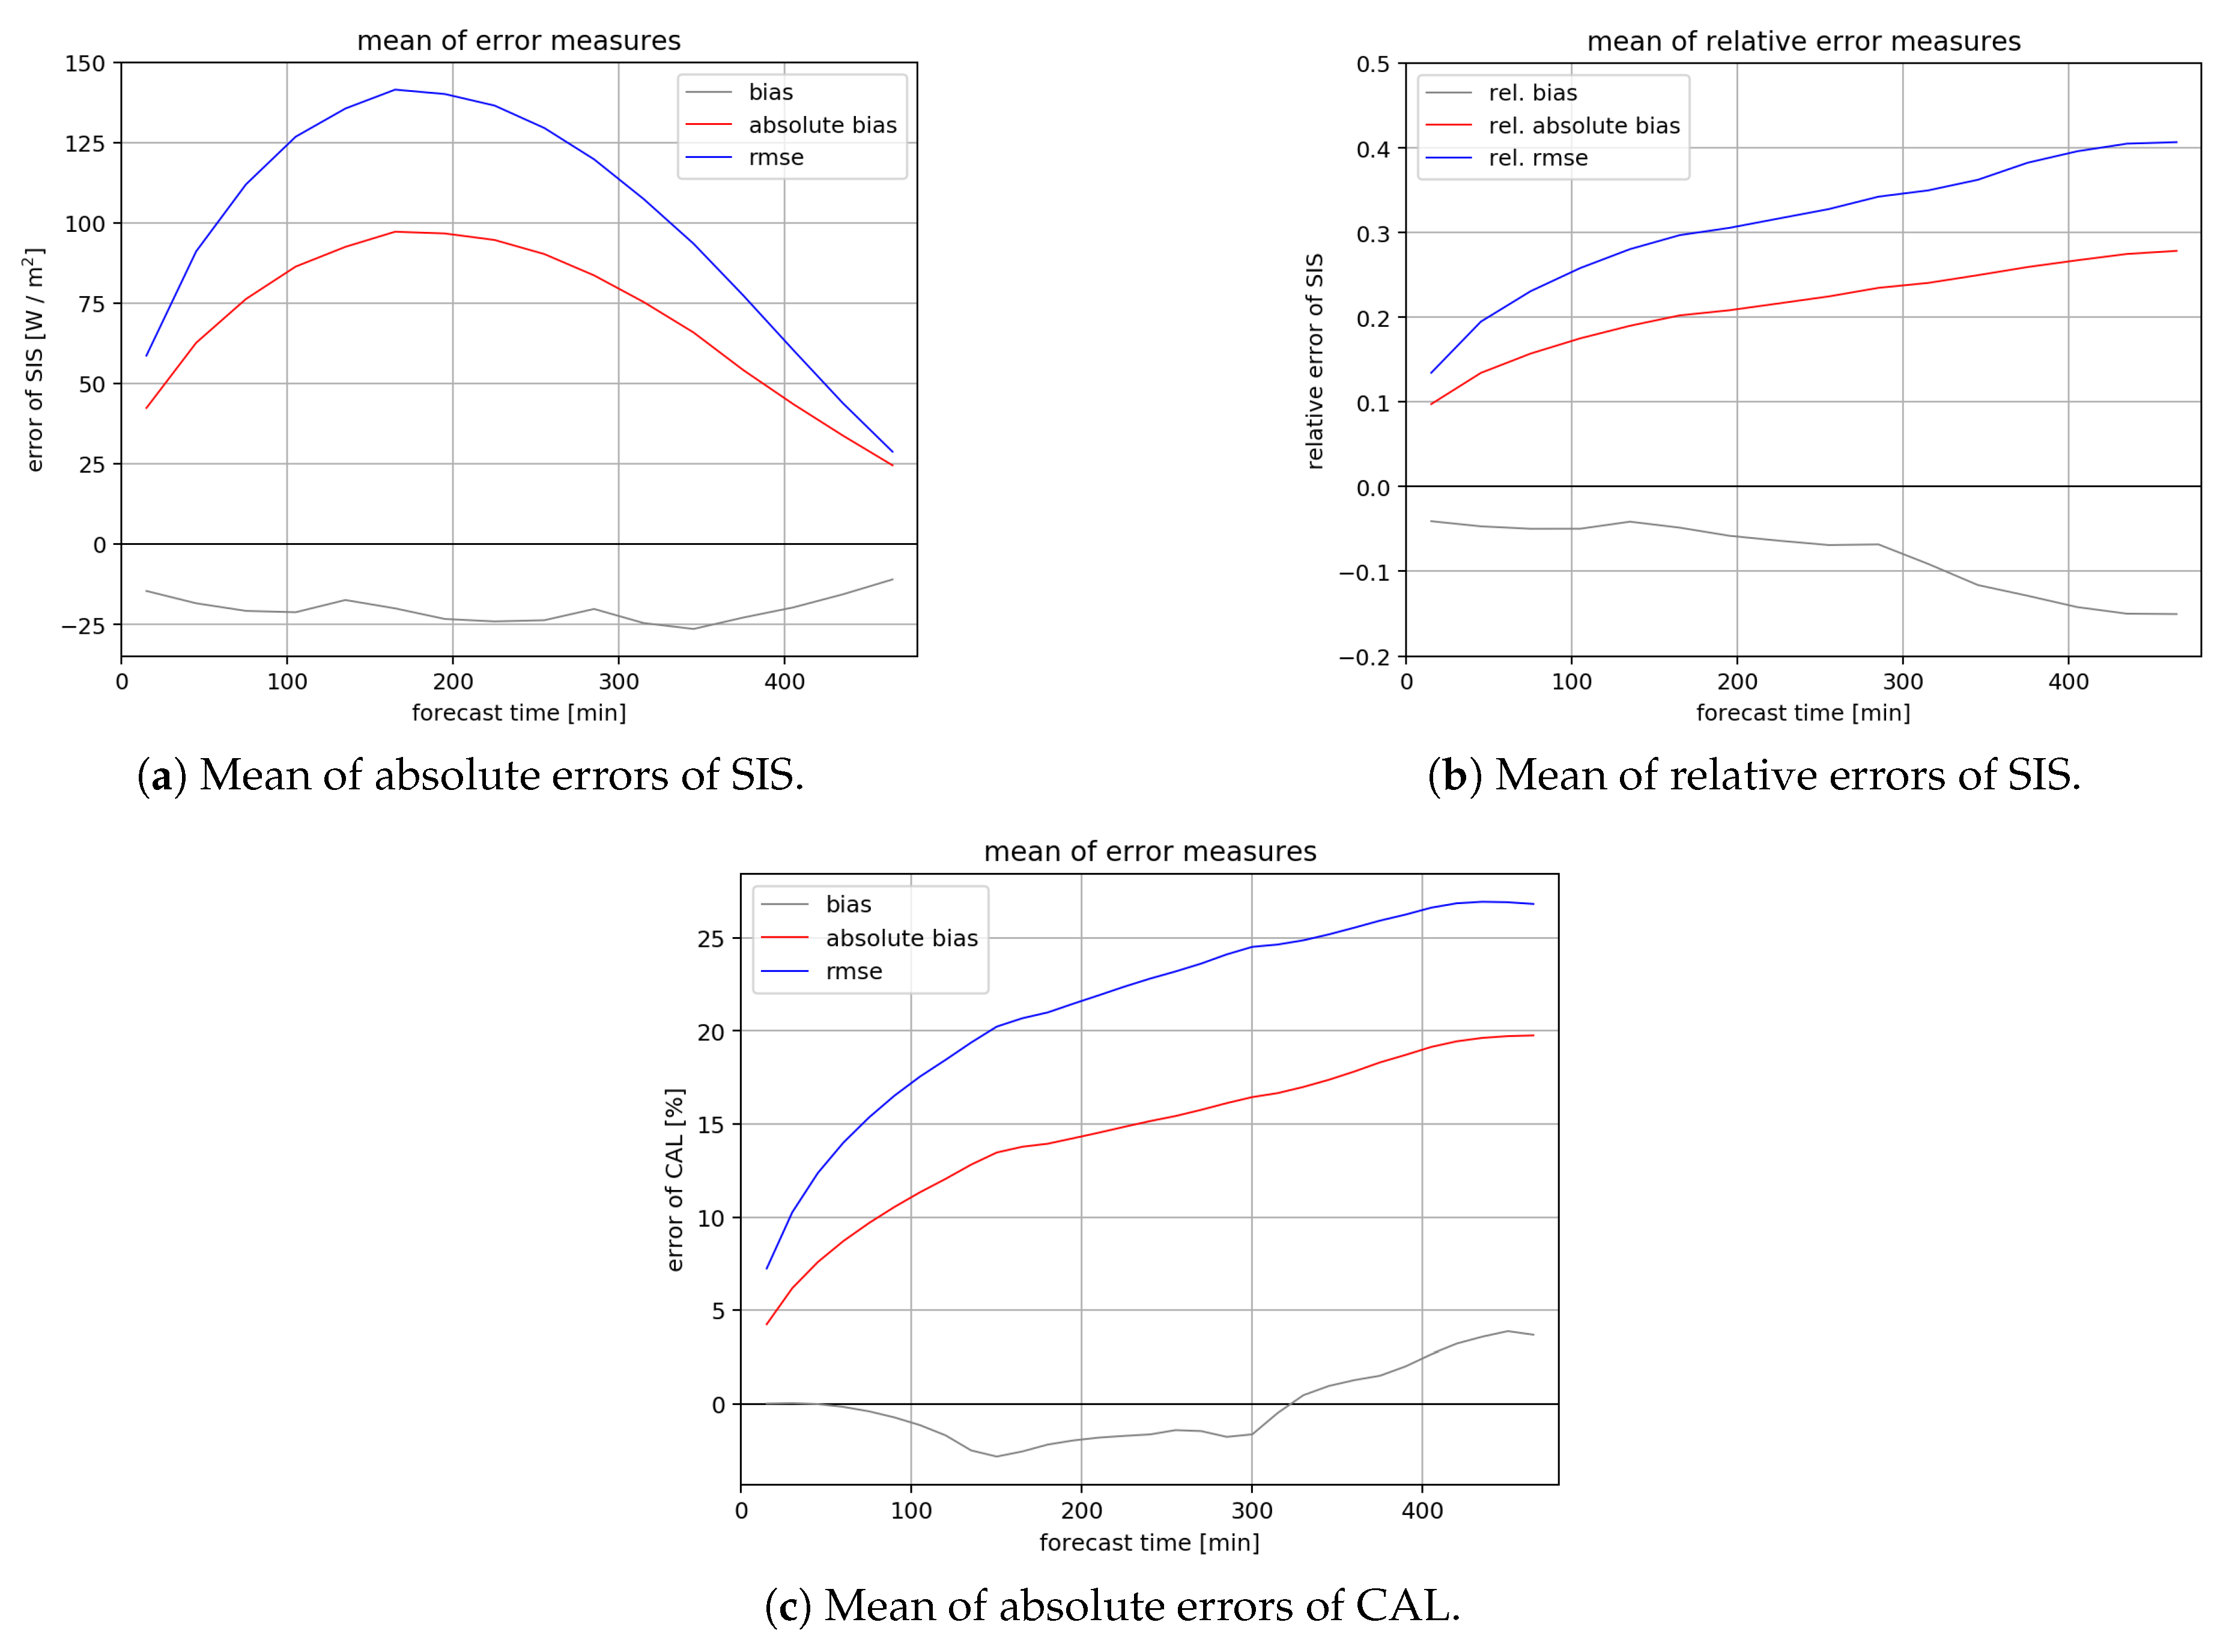
2.4. Error Measures
3. Results
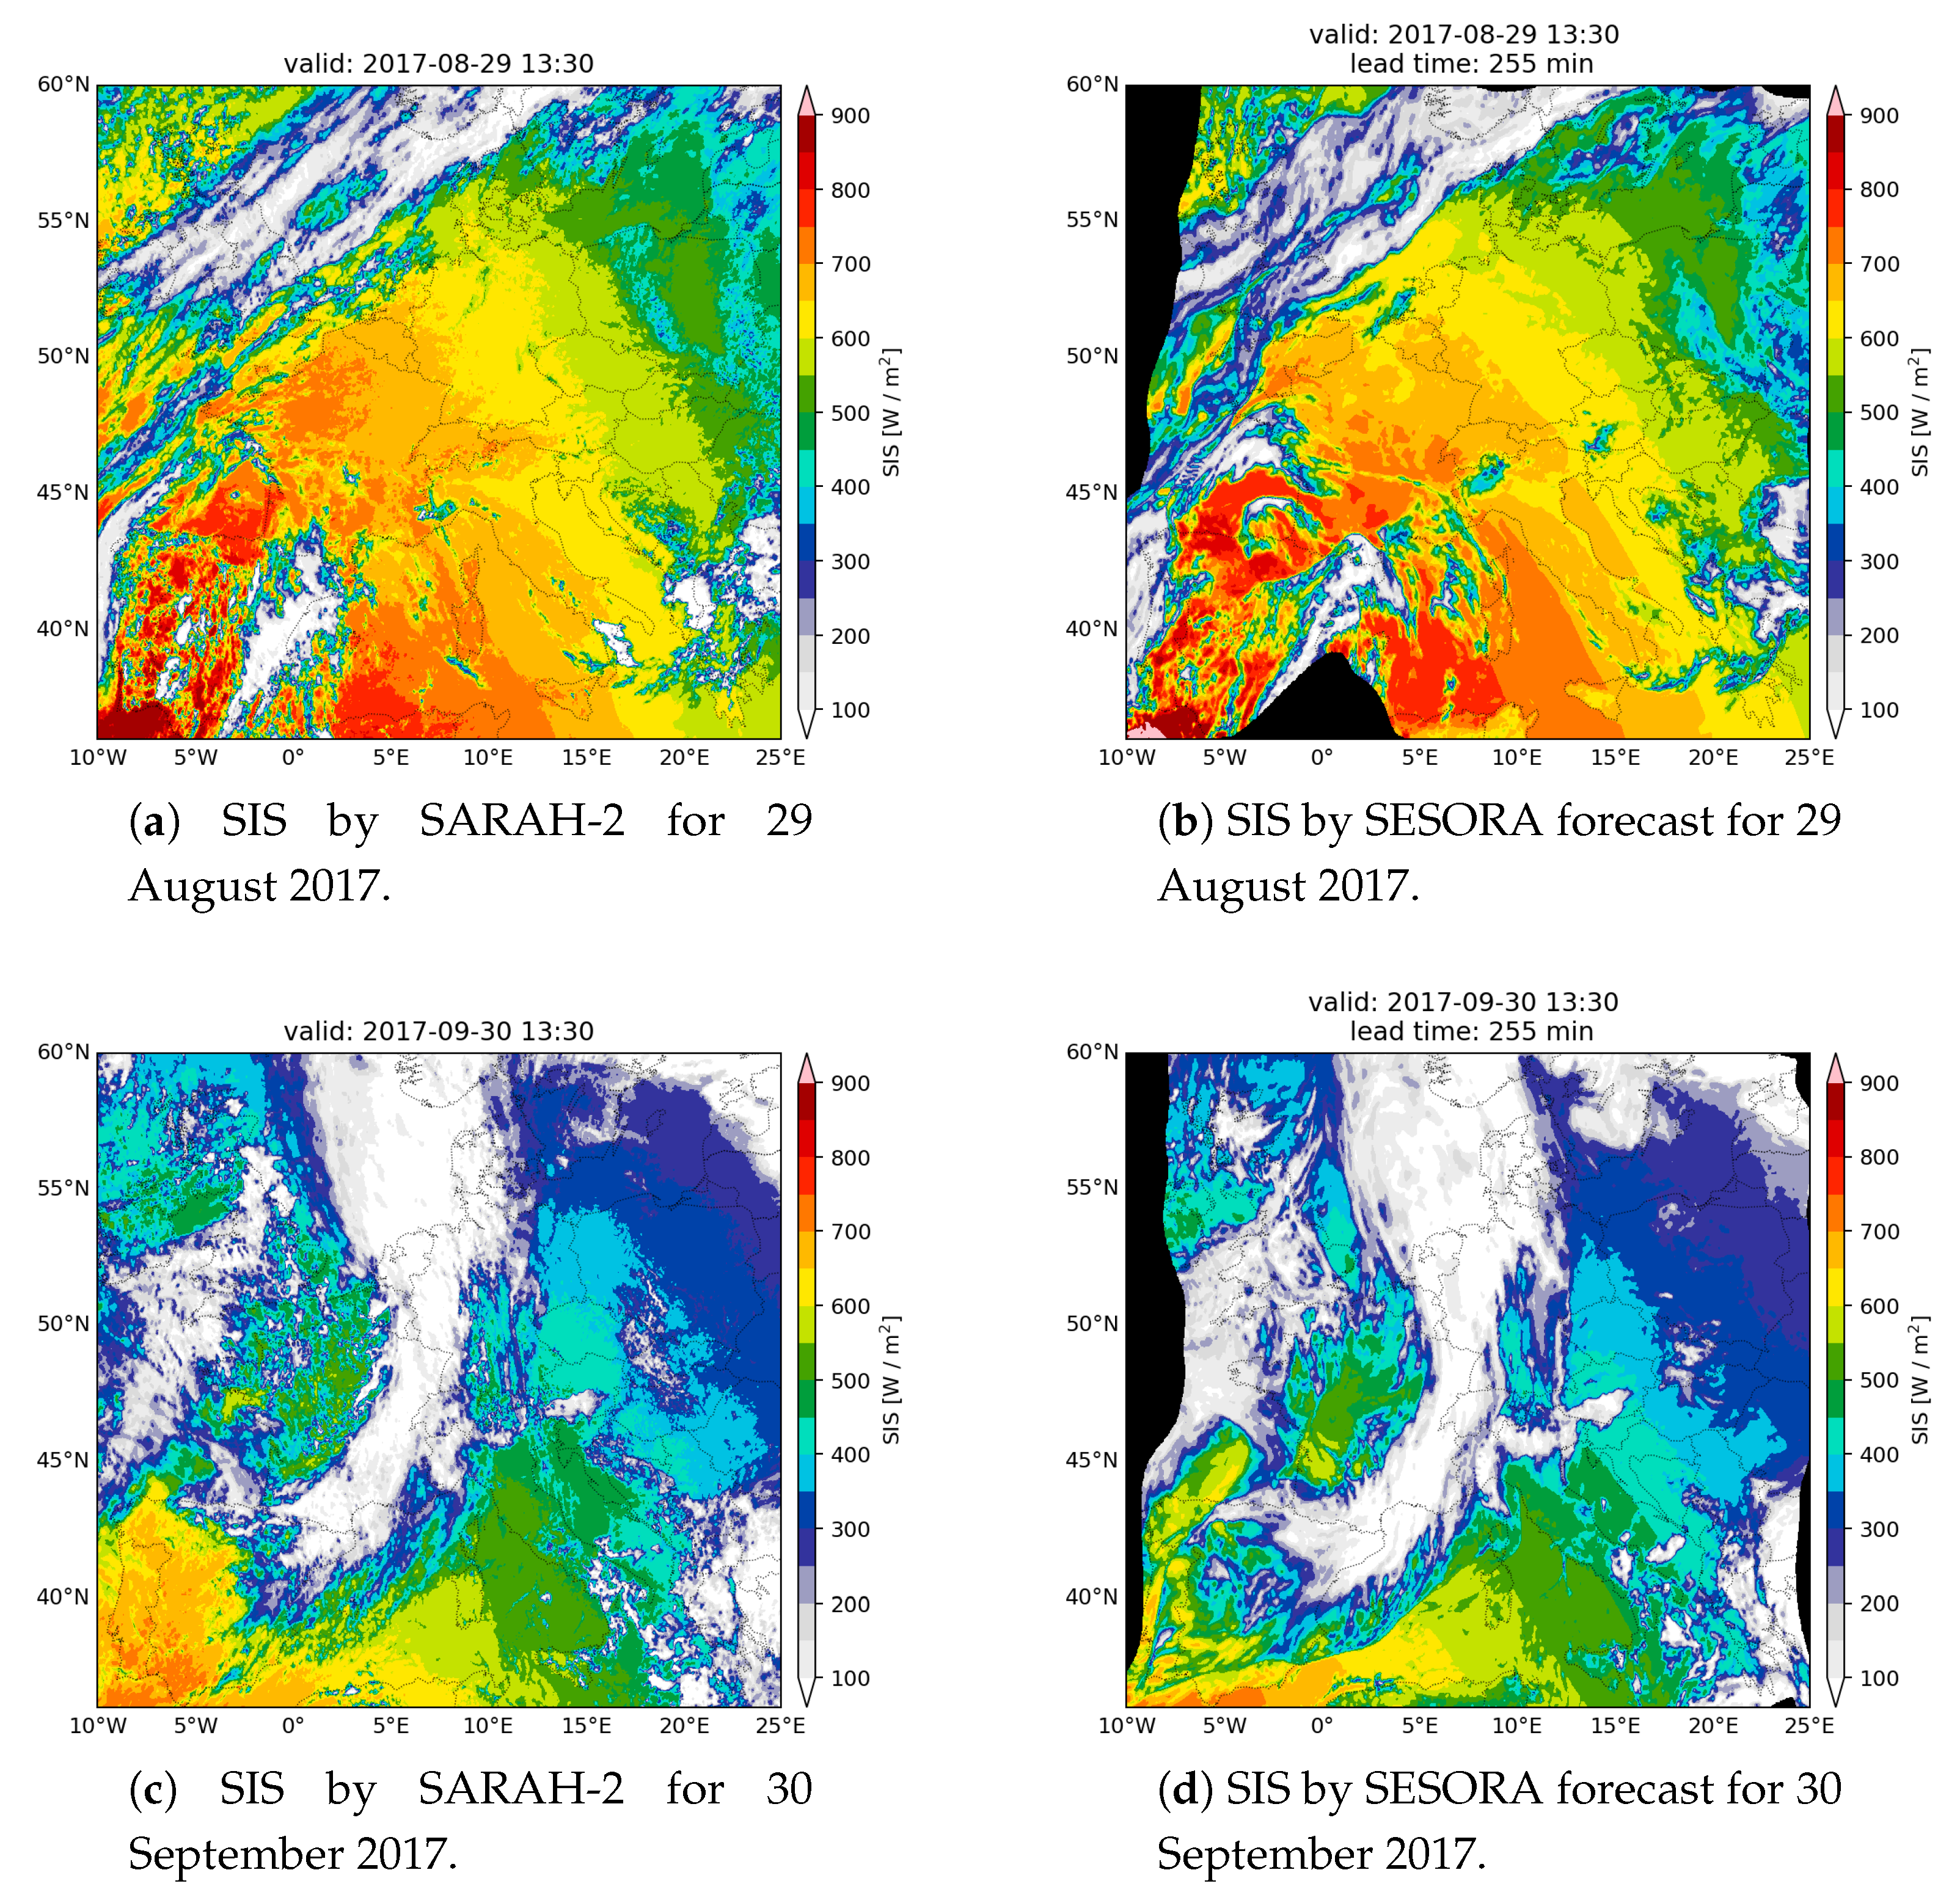
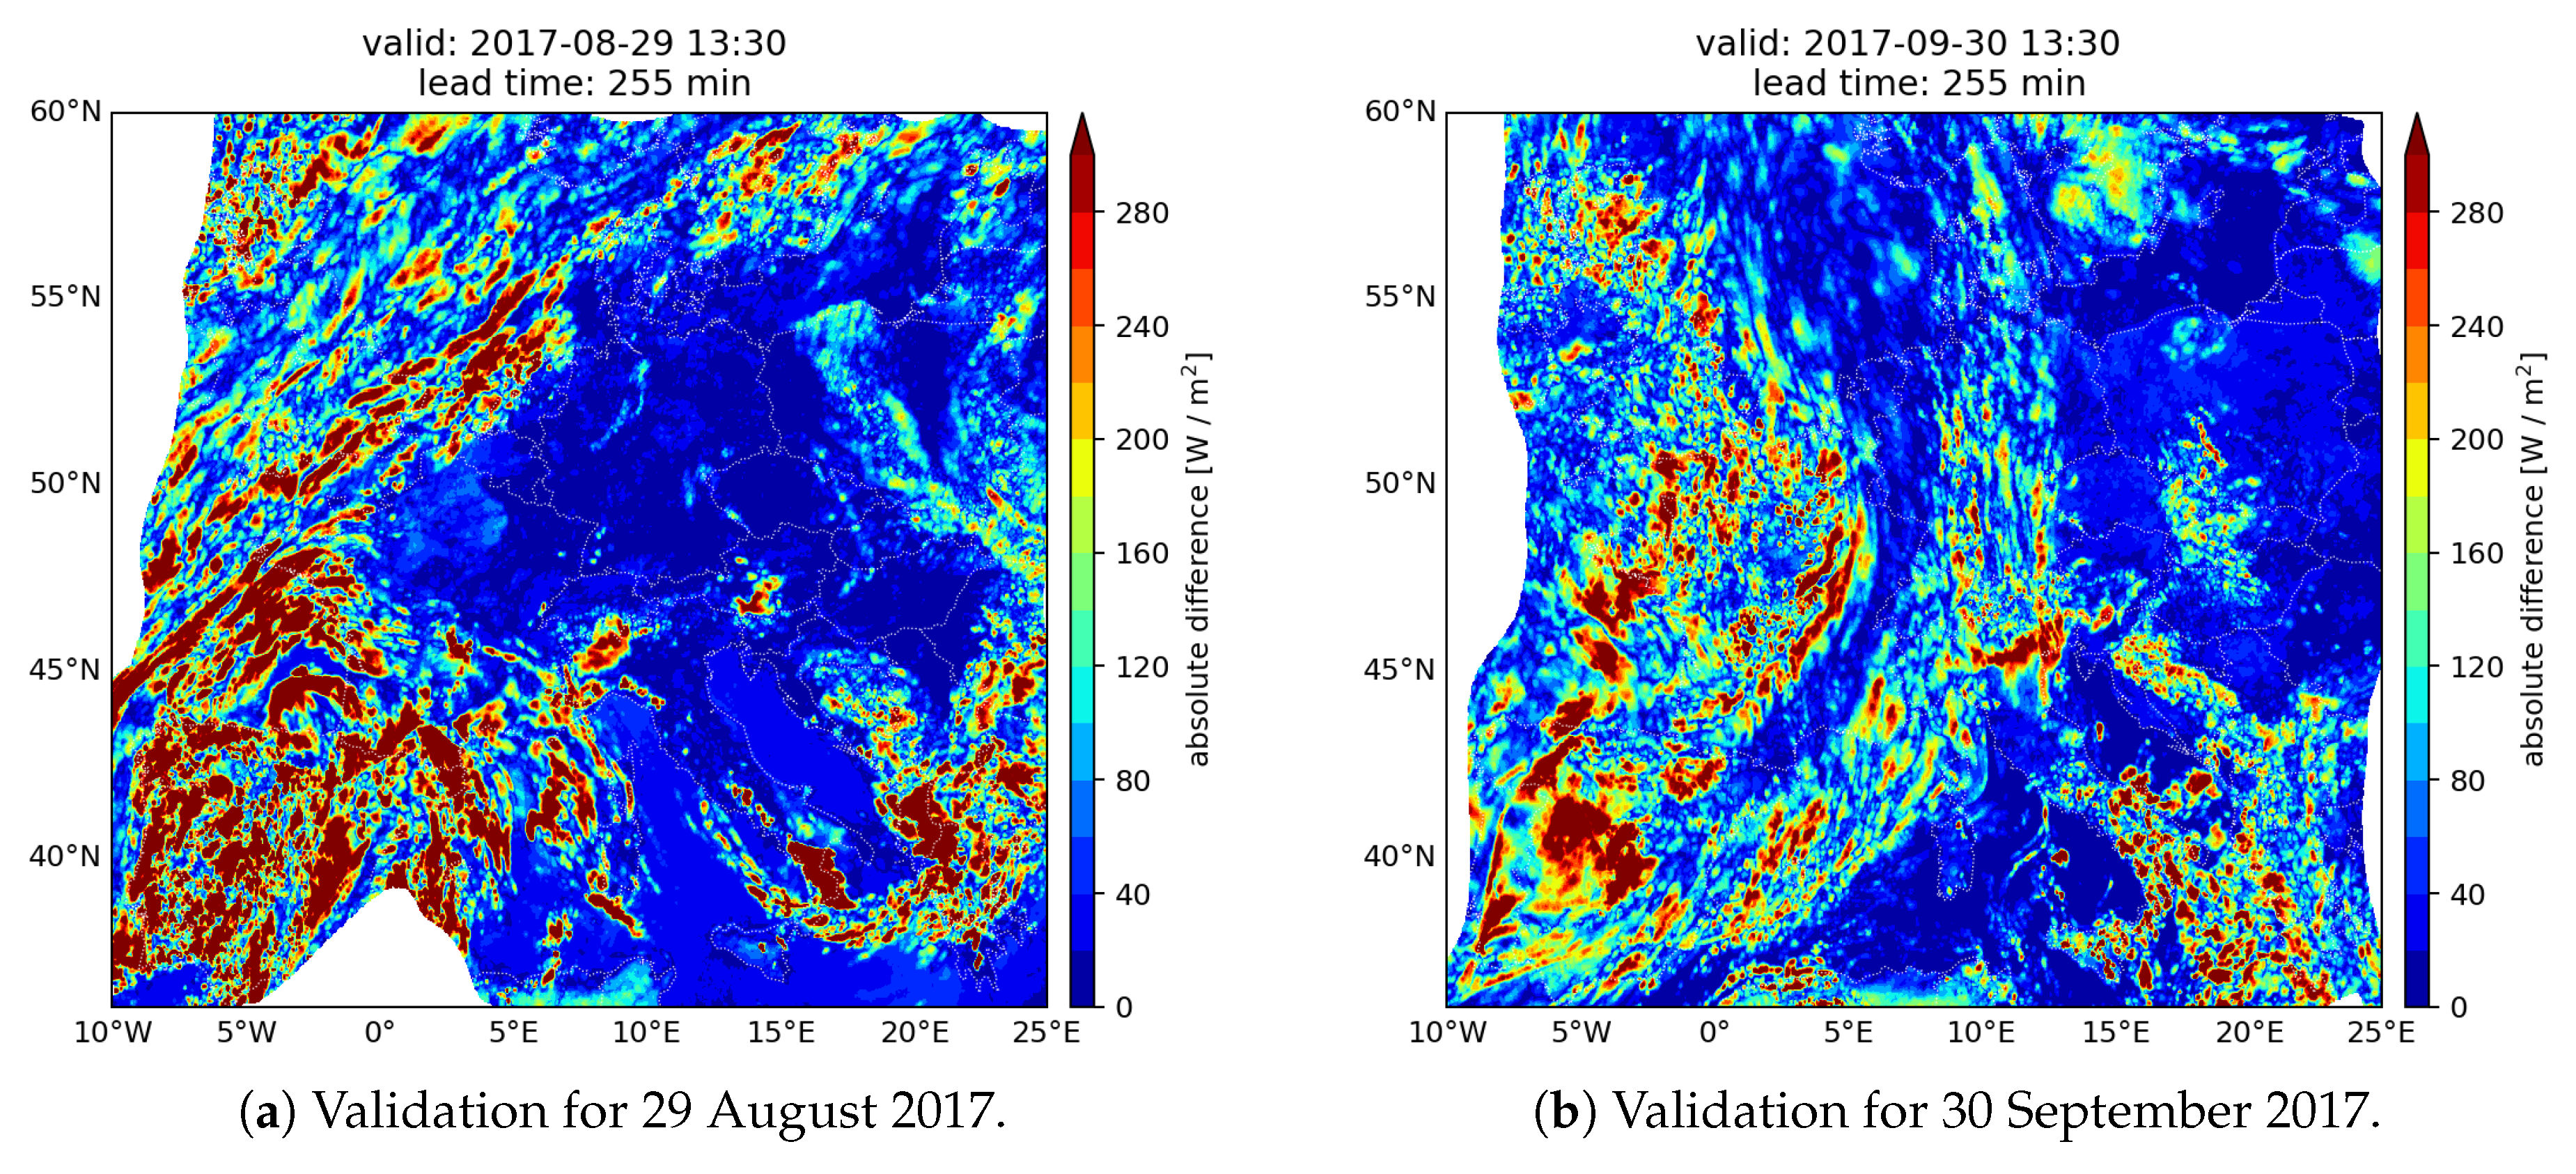
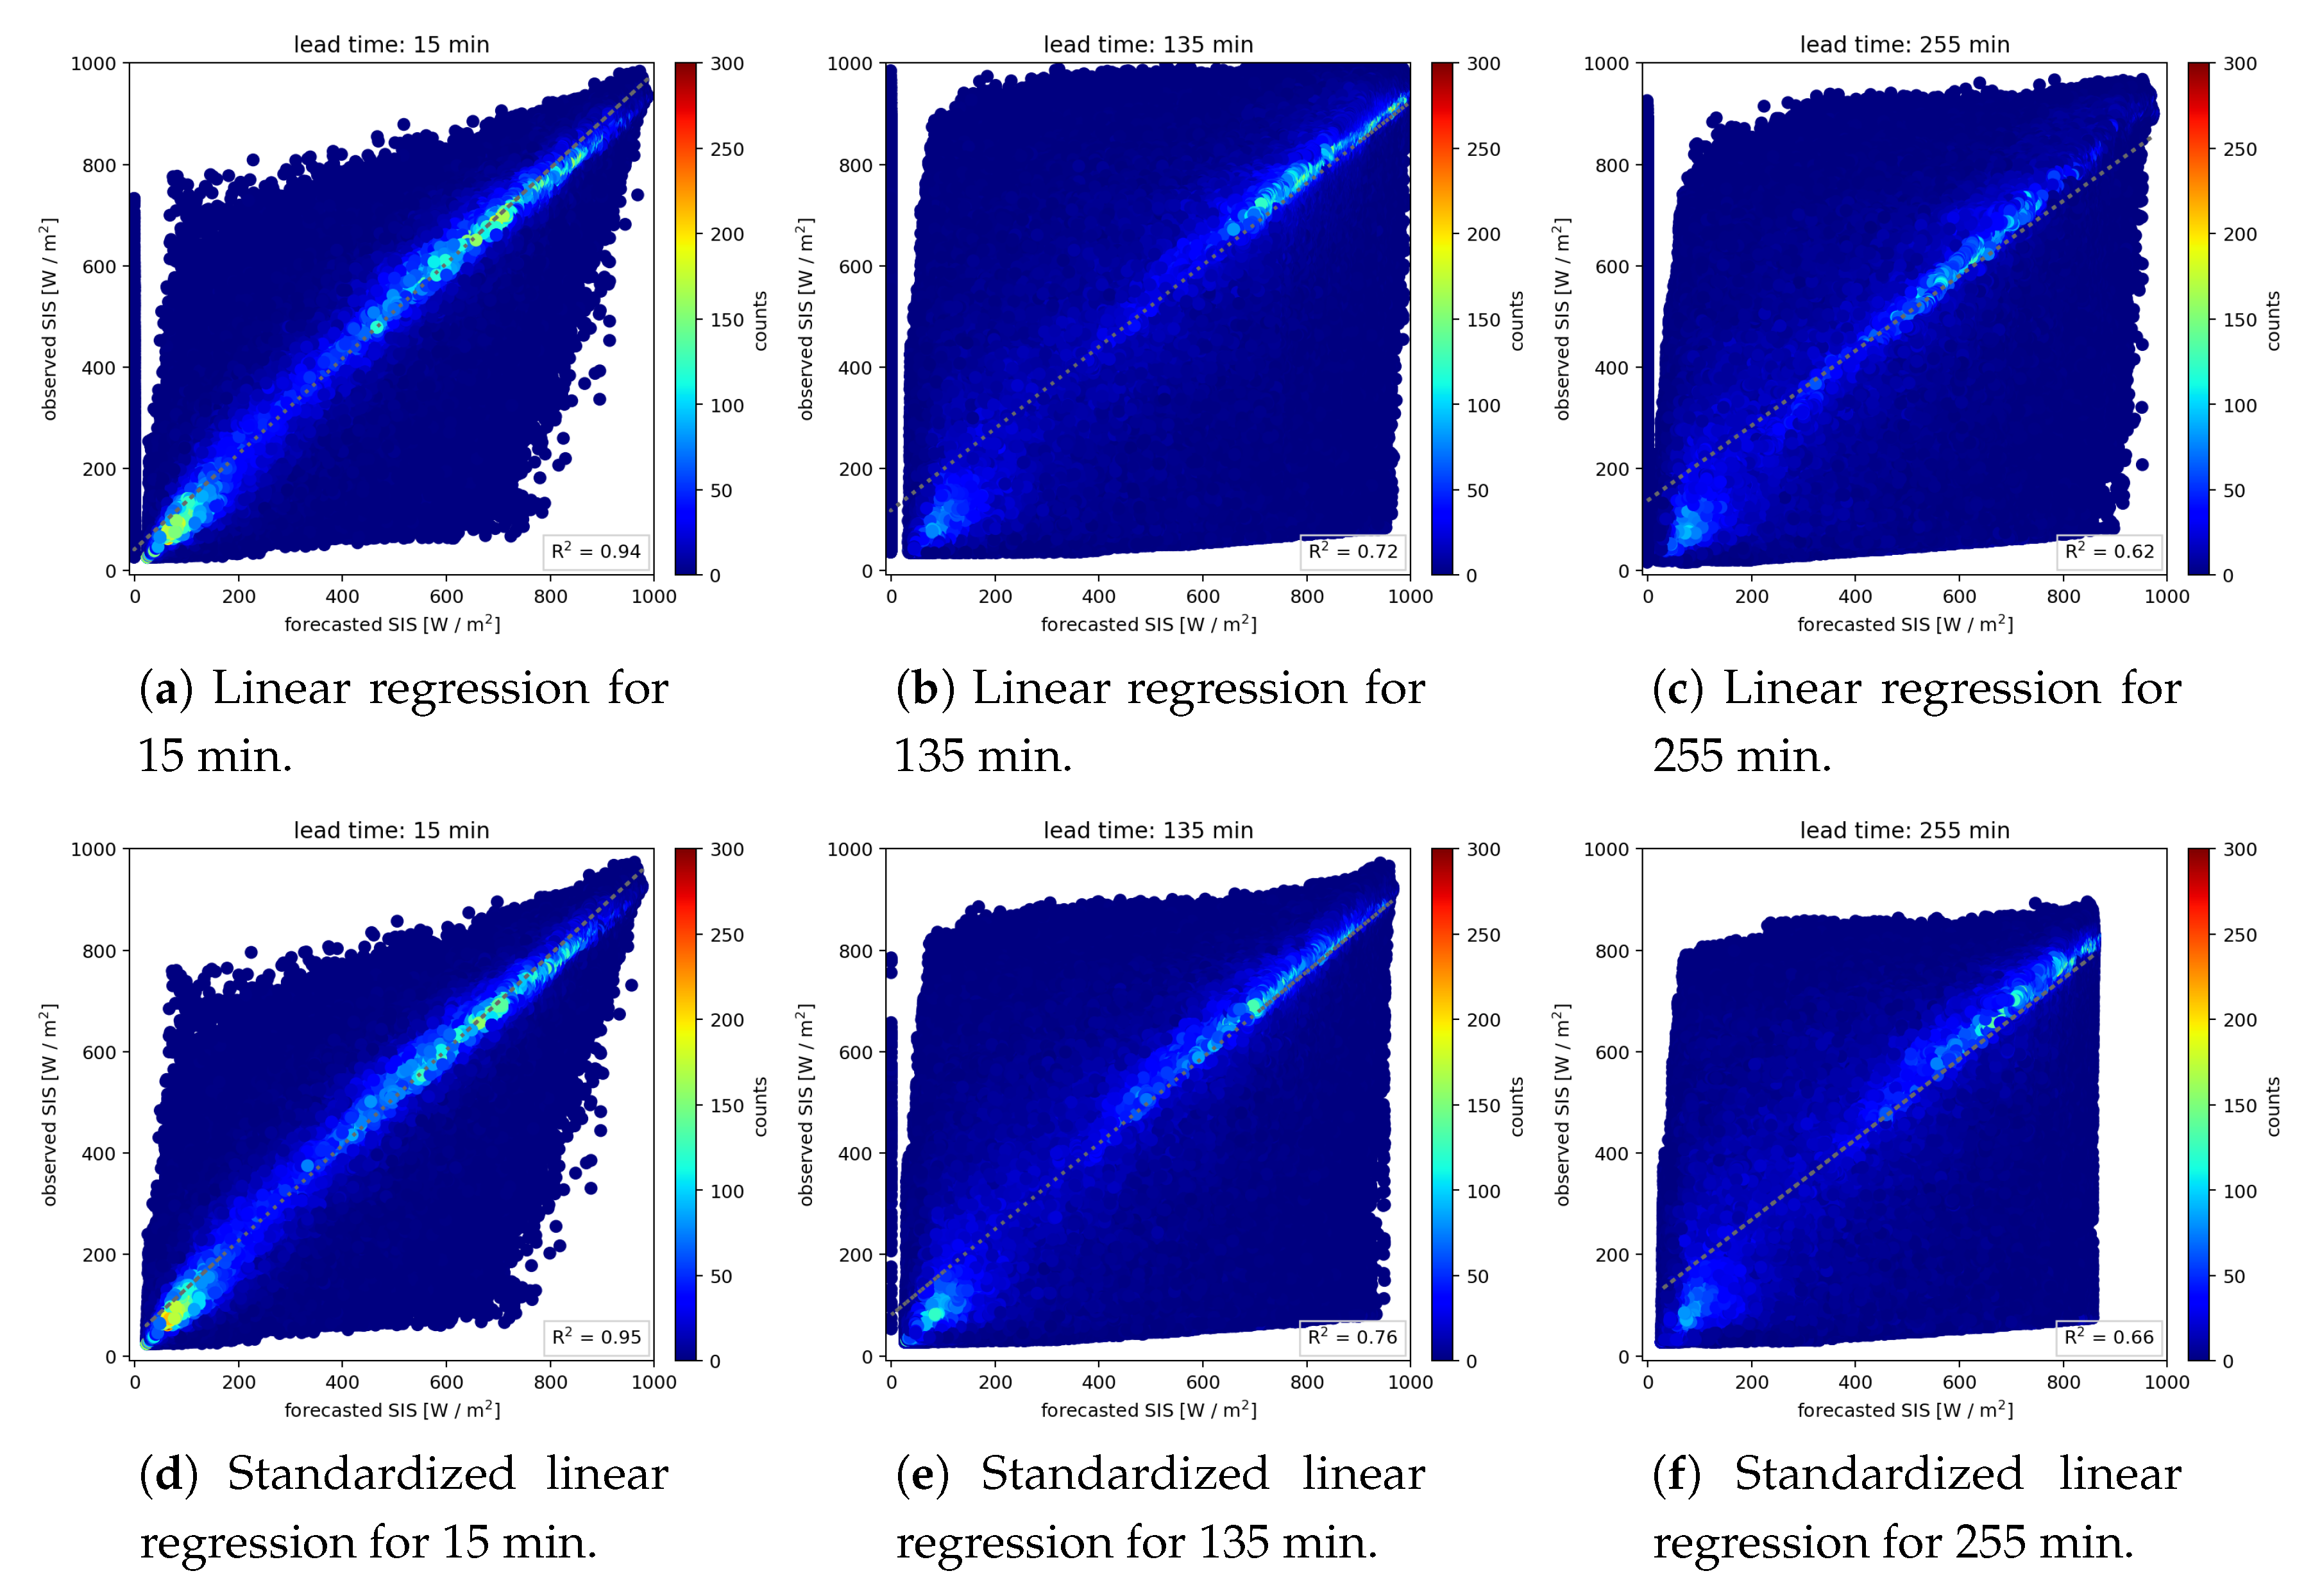
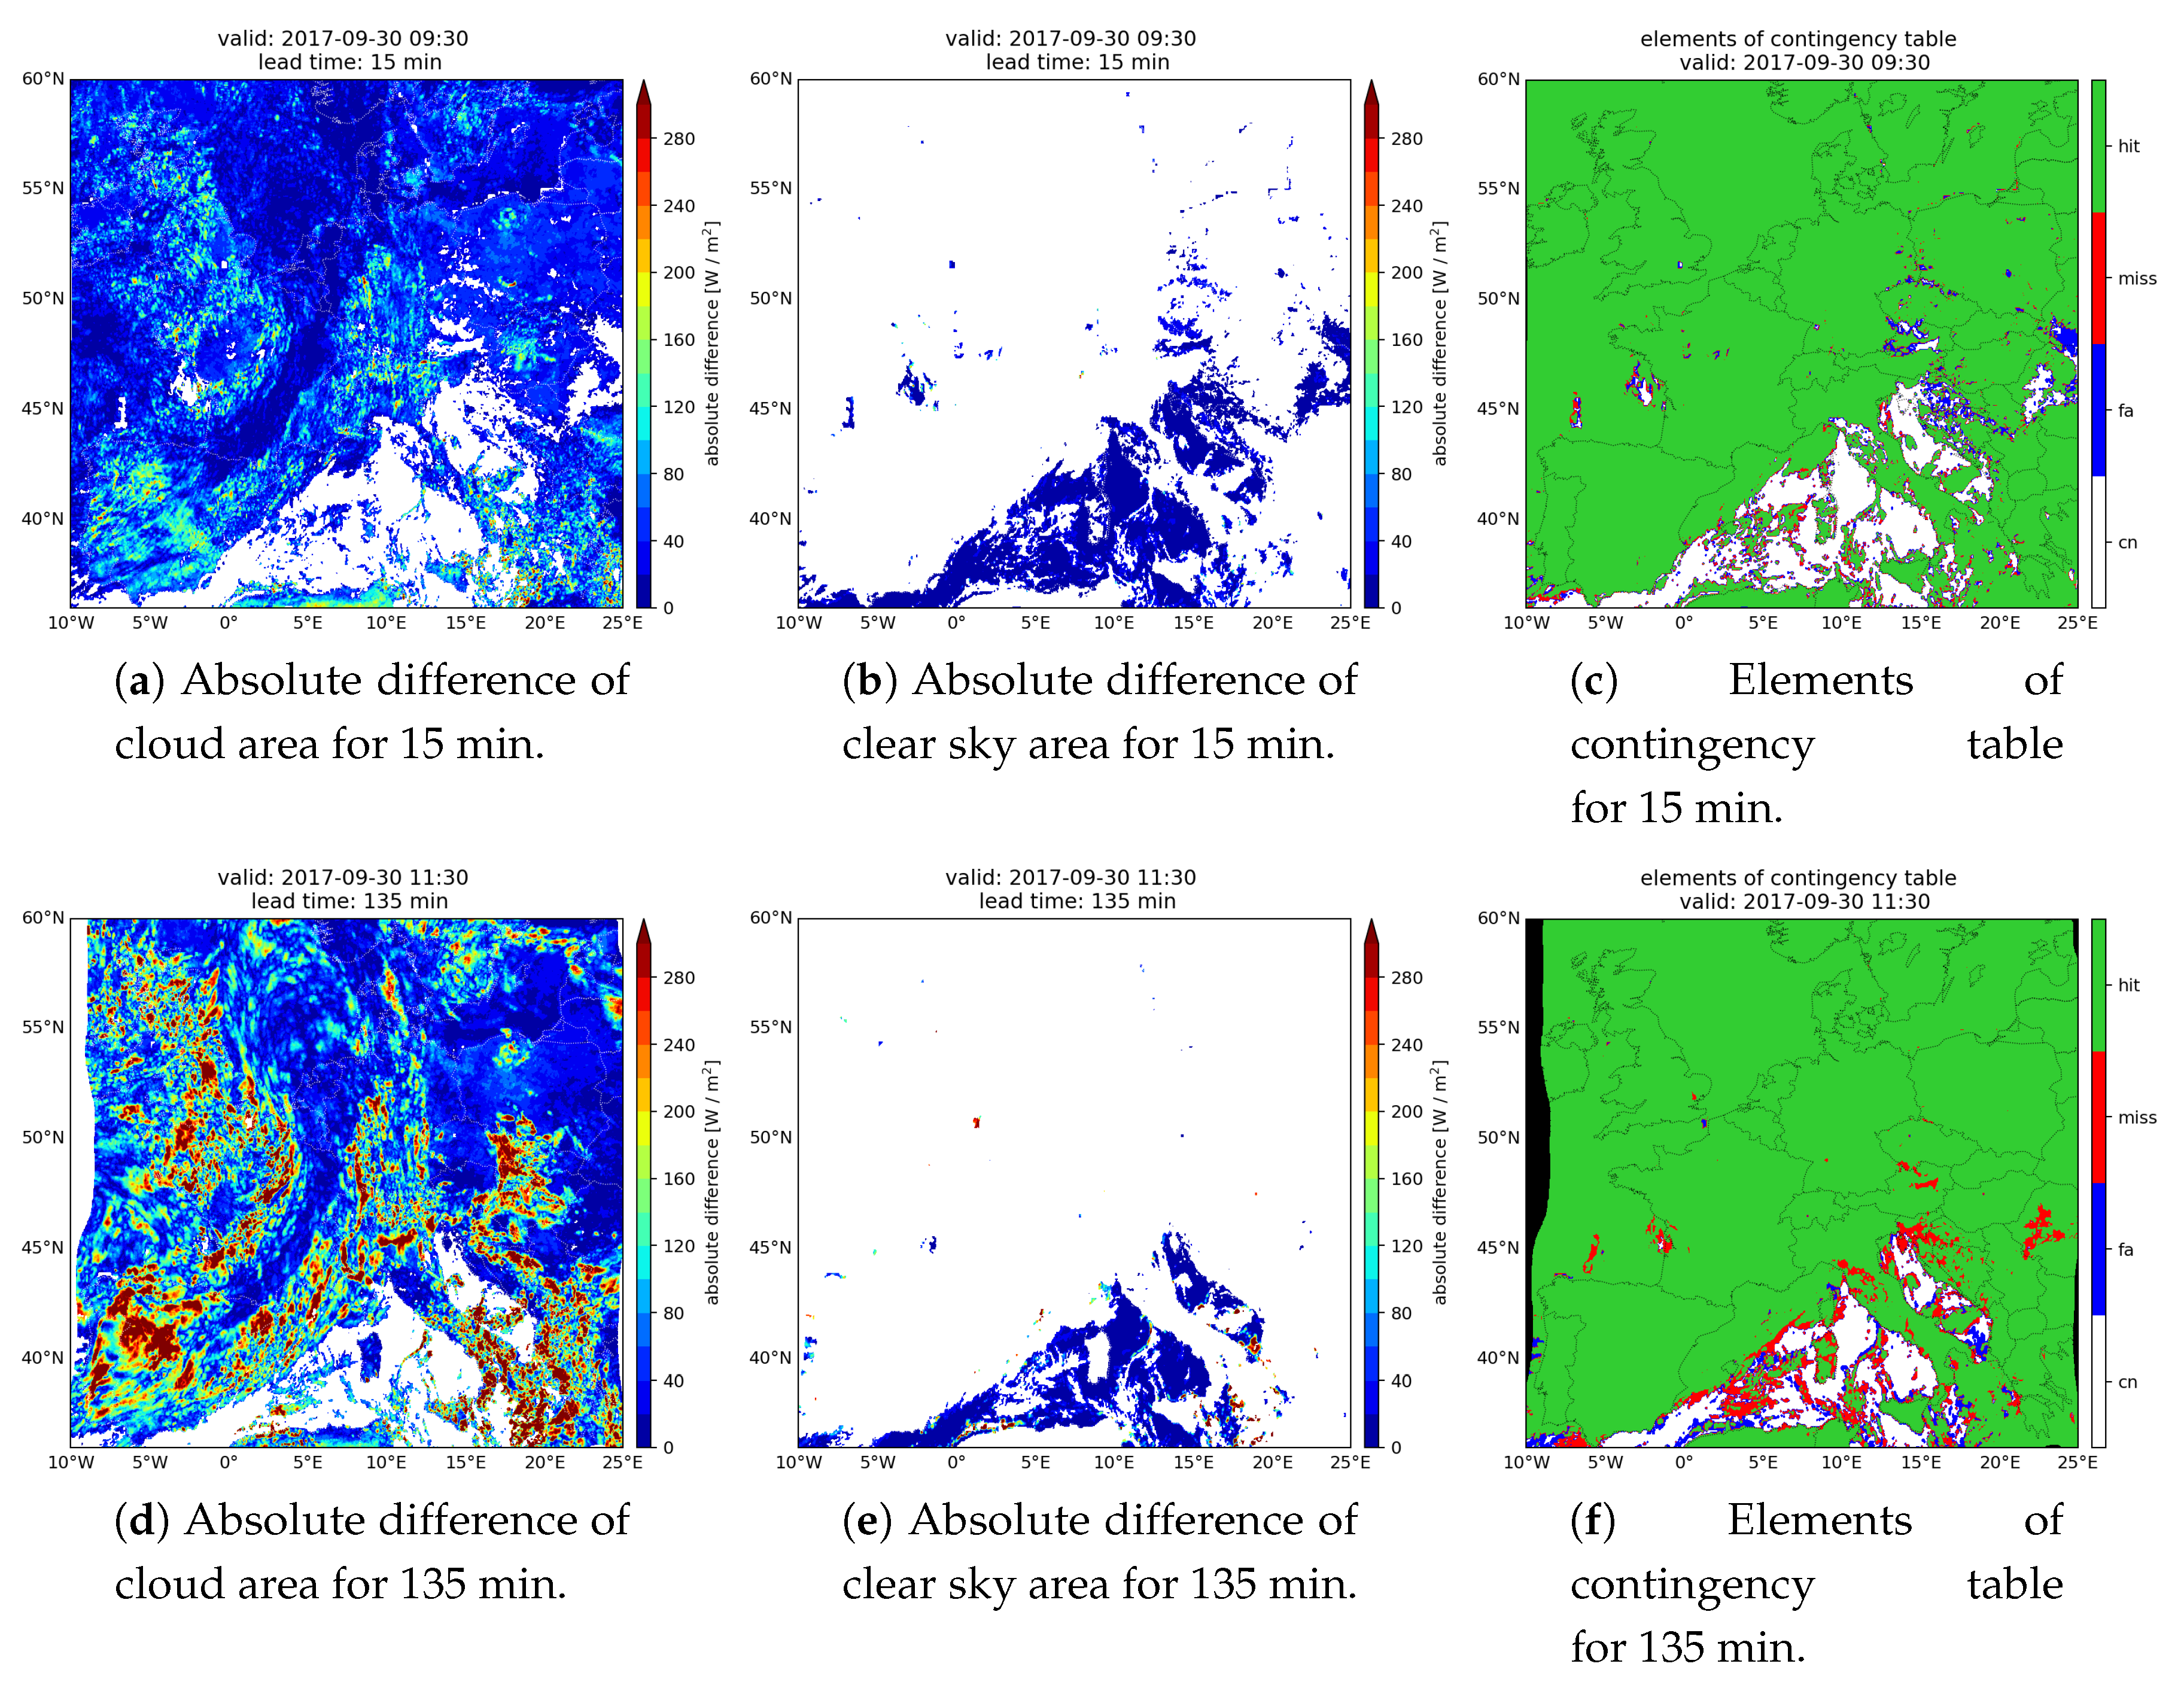
3.1. SARAH-2
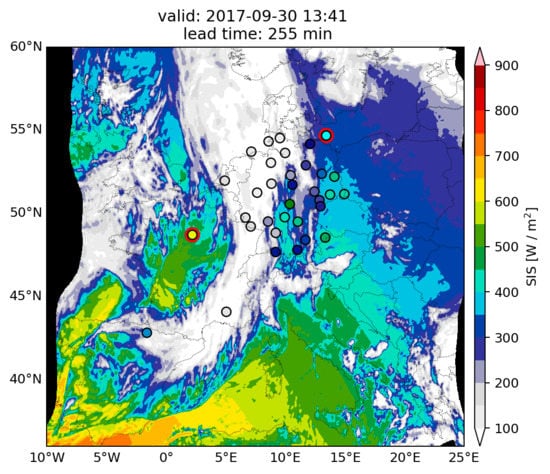
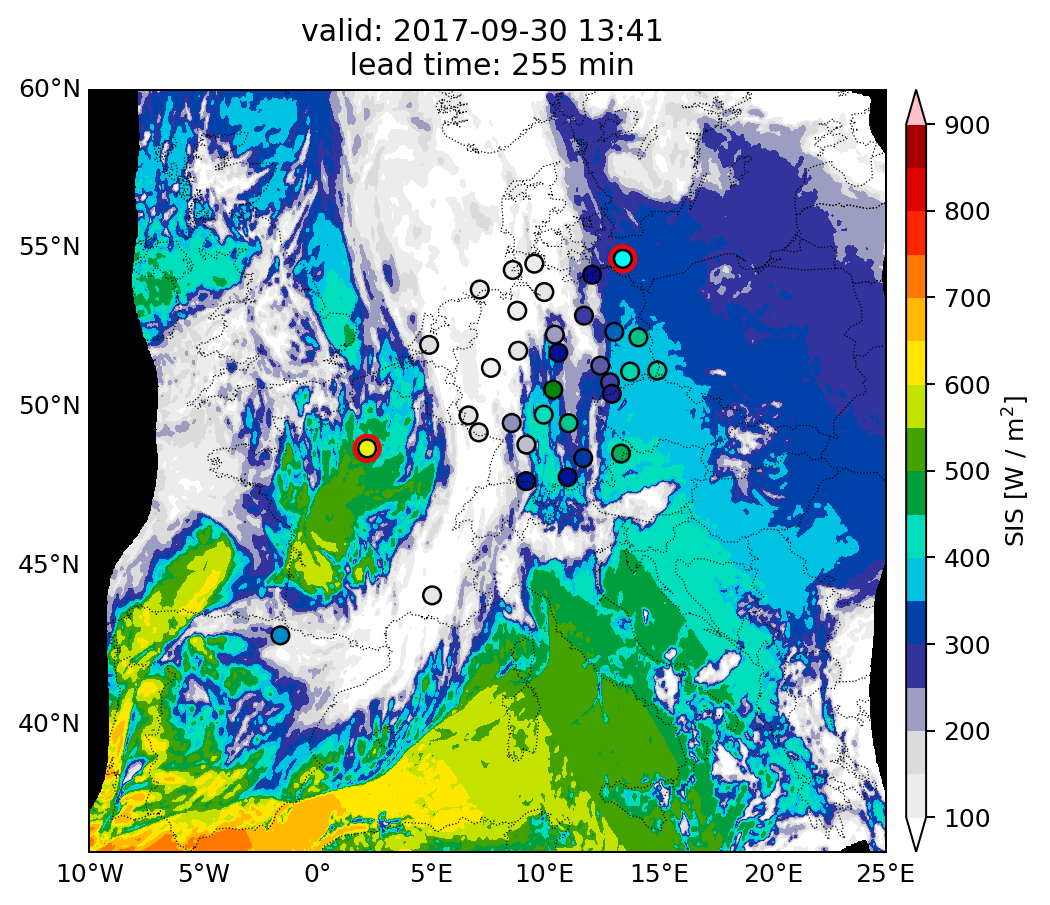
3.2. Ground Stations
4. Discussion
5. Conclusions and Outlook
Author Contributions
Funding
Acknowledgments
Conflicts of Interest
Appendix A

| Event | Label | Location | Latitude () | Longitude () | Elevation (m) |
|---|---|---|---|---|---|
| Cabauw | CAB | Netherlands | 51.9711 | 4.9267 | 0.0 |
| Carpentras | CAR | France | 44.0830 | 5.0590 | 100.0 |
| Cener | CNR | Spain | 42.8160 | −1.6010 | 471.0 |
| Palaiseau | PAL | France | 48.7130 | 2.2080 | 156.0 |
| Location | DWD-ID | Latitude () | Longitude () | Elevation (m) |
|---|---|---|---|---|
| Arkona | 183 | 54.6791 | 13.4342 | 42.0 |
| Braunlage | 656 | 51.7233 | 10.6021 | 607.3 |
| Braunschweig | 662 | 52.2914 | 10.4464 | 81.4 |
| Bremen | 691 | 53.0445 | 8.7985 | 4.3 |
| Chemnitz | 853 | 50.7912 | 12.8719 | 418.0 |
| Dresden | 1048 | 51.1279 | 13.7543 | 227.0 |
| Fichtelberg | 1358 | 50.4283 | 12.9535 | 1213.0 |
| Geisenheim | 1580 | 49.9859 | 7.9548 | 110.2 |
| Görlitz | 1684 | 51.1621 | 14.9505 | 238.0 |
| Hamburg | 1975 | 53.6331 | 9.9880 | 14.1 |
| Hohenpeissenberg | 2290 | 47.8009 | 11.0108 | 977.0 |
| Konstanz | 2712 | 47.6774 | 9.1900 | 442.5 |
| Leipzig | 2928 | 51.3150 | 12.4462 | 138.0 |
| Lindenberg | 3015 | 52.2084 | 14.1179 | 98.0 |
| Bad-Lippspringe | 3028 | 51.7854 | 8.8387 | 157.0 |
| Lüdenscheid | 3098 | 51.2451 | 7.6424 | 386.7 |
| Meiningen | 3231 | 50.5611 | 10.3771 | 450.0 |
| Norderney | 3631 | 53.7123 | 7.1519 | 11.5 |
| Nuremberg | 3668 | 49.5030 | 11.0549 | 314.0 |
| Potsdam | 3987 | 52.3812 | 13.0622 | 81.0 |
| Rostock | 4271 | 54.1801 | 12.0805 | 4.0 |
| Saarbrücken | 4336 | 49.2128 | 7.1077 | 320.0 |
| Sankt-Peter-Ording | 4393 | 54.3279 | 8.6029 | 4.9 |
| Schleswig | 4466 | 54.5275 | 9.5486 | 42.7 |
| Seehausen | 4642 | 52.8911 | 11.7296 | 21.0 |
| Stuttgart | 4928 | 48.8281 | 9.2000 | 314.3 |
| Trier | 5100 | 49.7478 | 6.6582 | 265.0 |
| Weihenstephan | 5404 | 48.4024 | 11.6945 | 477.1 |
| Weissenburg | 5440 | 49.0113 | 10.9319 | 439.3 |
| Würzburg | 5705 | 49.7702 | 9.9577 | 268.0 |
| Zugspitze | 5792 | 47.4208 | 10.9847 | 2964.0 |
| Fürstenzell | 5856 | 48.5451 | 13.3530 | 476.4 |
| Mannheim | 5906 | 49.5090 | 8.5540 | 98.0 |
| Schneefernerhaus | 7325 | 47.4167 | 10.9794 | 2650.0 |
| Date | Forecast Time (Min) | |||||||
|---|---|---|---|---|---|---|---|---|
| 45 | 105 | 165 | 225 | 285 | 345 | 405 | 465 | |
| 7 August 2017 | 9.10 | 11.52 | 13.62 | 15.28 | 17.08 | 17.77 | 19.67 | 23.43 |
| 58.64 | 79.25 | 93.11 | 97.01 | 93.38 | 79.13 | 61.58 | 40.78 | |
| 11 August 2017 | 11.52 | 14.32 | 16.26 | 17.70 | 19.36 | 20.76 | 23.32 | 27.17 |
| 66.73 | 89.09 | 101.11 | 102.40 | 95.17 | 82.92 | 64.72 | 59.63 | |
| 15 August 2017 | 8.98 | 11.93 | 13.59 | 15.73 | 17.60 | 18.04 | 19.86 | 23.04 |
| 58.41 | 82.36 | 92.62 | 98.72 | 94.24 | 77.21 | 58.65 | 54.92 | |
| 28 August 2017 | 11.70 | 16.25 | 19.48 | 21.93 | 24.44 | 26.46 | 28.83 | 32.95 |
| 66.24 | 96.75 | 113.62 | 117.03 | 108.83 | 91.3 | 92.82 | 51.57 | |
| 29 August 2017 | 10.59 | 13.58 | 16.20 | 17.64 | 19.67 | 21.69 | 24.21 | 30.17 |
| 60.23 | 81.35 | 95.03 | 94.51 | 87.79 | 73.67 | 51.14 | 47.41 | |
| 1 September 2017 | 10.47 | 14.91 | 17.00 | 18.51 | 20.21 | 20.84 | 22.39 | 23.86 |
| 59.55 | 90.18 | 101.61 | 101.11 | 92.97 | 75.20 | 52.62 | 31.11 | |
| 7 September 2017 | 14.60 | 20.20 | 23.52 | 24.48 | 26.33 | 27.21 | 28.16 | 25.55 |
| 65.20 | 94.47 | 107.60 | 102.78 | 91.44 | 73.71 | 46.93 | 22.76 | |
| 17 September 2017 | 12.59 | 18.04 | 21.43 | 22.63 | 23.31 | 23.77 | 25.32 | 26.72 |
| 59.18 | 88.51 | 102.30 | 98.81 | 83.44 | 63.65 | 38.11 | 22.92 | |
| 19 September 2017 | 14.26 | 19.87 | 23.15 | 24.63 | 26.12 | 26.36 | 26.77 | 23.74 |
| 64.52 | 94.35 | 106.79 | 103.11 | 88.90 | 66.95 | 38.74 | 20.08 | |
| 22 September 2017 | 11.67 | 15.23 | - | 19.47 | 21.14 | 23.48 | 24.47 | 26.24 |
| 52.09 | 71.82 | - | 80.67 | 70.85 | 57.53 | 33.92 | 20.08 | |
| 26 September 2017 | 15.13 | 19.79 | 22.65 | 24.32 | 26.26 | 27.90 | 27.83 | 25.71 |
| 64.69 | 89.15 | 98.55 | 96.67 | 83.70 | 63.01 | 35.77 | 17.62 | |
| 30 September 2017 | 12.79 | 17.30 | 20.62 | 22.14 | 25.03 | 26.79 | 31.07 | 31.91 |
| 53.20 | 74.10 | 82.72 | 78.56 | 67.87 | 47.80 | 29.88 | 15.29 | |
| 1 October 2017 | 16.76 | 21.20 | 23.70 | 25.71 | 28.12 | 32.62 | 38.52 | 37.42 |
| 65.97 | 87.08 | 91.81 | 87.65 | 73.45 | 57.72 | 37.50 | 18.60 | |
| 2 October 2017 | 18.10 | 23.08 | 26.33 | 28.05 | 30.56 | 32.27 | 35.01 | 35.59 |
| 73.02 | 97.73 | 105.55 | 99.08 | 81.54 | 59.67 | 38.27 | 19.53 | |
| 3 October 2017 | 16.49 | 20.51 | 22.96 | 24.58 | 26.91 | 28.97 | 30.11 | 31.52 |
| 67.94 | 89.16 | 95.75 | 92.08 | 78.98 | 57.96 | 35.44 | 17.39 | |
| 4 October 2017 | 16.46 | 19.63 | 21.55 | 22.70 | 23.71 | 25.37 | 25.80 | 25.83 |
| 66.59 | 84.74 | 87.86 | 82.82 | 67.34 | 48.45 | 29.22 | 13.76 | |
| 7 October 2017 | 17.26 | 20.26 | 21.60 | 22.52 | 23.32 | 24.32 | 23.22 | 22.59 |
| 63.81 | 79.09 | 80.57 | 77.10 | 62.80 | 44.35 | 26.26 | 11.87 | |
| Date | Forecast Time (Min) | |||||||
|---|---|---|---|---|---|---|---|---|
| 45 | 105 | 165 | 225 | 285 | 345 | 405 | 465 | |
| 7 August 2017 | 8.59 | 15.07 | 20.71 | 23.51 | 26.39 | 27.54 | 30.82 | 37.92 |
| 83.88 | 117.61 | 140.33 | 147.39 | 142.00 | 120.23 | 94.27 | 64.14 | |
| 11 August 2017 | 17.66 | 22.45 | 25.29 | 27.17 | 29.80 | 31.91 | 35.54 | 41.20 |
| 101.97 | 138.38 | 154.88 | 153.84 | 142.45 | 123.20 | 94.82 | 59.63 | |
| 15 August 2017 | 16.62 | 20.29 | 22.98 | 24.67 | 27.92 | 28.90 | 31.51 | 36.30 |
| 89.69 | 128.84 | 143.23 | 151.98 | 145.85 | 120.17 | 89.71 | 54.92 | |
| 28 August 2017 | 17.19 | 24.15 | 28.91 | 32.73 | 24.44 | 39.61 | 44.28 | 52.94 |
| 96.96 | 142.22 | 165.55 | 170.24 | 157.76 | 131.24 | 92.82 | 51.57 | |
| 29 August 2017 | 16.17 | 20.99 | 25.42 | 28.22 | 31.73 | 35.53 | 42.24 | 53.14 |
| 91.63 | 124.27 | 146.14 | 146.92 | 136.38 | 115.26 | 82.46 | 47.41 | |
| 1 September 2017 | 16.09 | 23.25 | 26.42 | 28.82 | 31.33 | 31.70 | 33.50 | 35.64 |
| 91.46 | 140.16 | 156.92 | 156.03 | 142.43 | 112.87 | 77.40 | 41.14 | |
| 7 September 2017 | 21.42 | 29.39 | 33.93 | 35.58 | 38.06 | 38.21 | 39.12 | 36.04 |
| 95.26 | 135.83 | 152.04 | 144.92 | 127.03 | 98.48 | 61.37 | 25.36 | |
| 17 September 2017 | 20.03 | 28.11 | 32.94 | 34.00 | 34.68 | 34.54 | 37.74 | 38.04 |
| 94.01 | 137.29 | 156.01 | 146.83 | 122.36 | 90.85 | 55.61 | 23.88 | |
| 19 September 2017 | 21.35 | 29.26 | 33.55 | 35.35 | 37.79 | 37.46 | 38.94 | 32.85 |
| 96.31 | 137.75 | 152.47 | 144.86 | 123.69 | 91.85 | 53.48 | 19.26 | |
| 22 September 2017 | 17.59 | 23.31 | - | 29.91 | 32.47 | 35.32 | 38.31 | 37.71 |
| 78.26 | 108.74 | - | 120.81 | 105.42 | 83.23 | 49.92 | 19.45 | |
| 26 September 2017 | 21.47 | 28.35 | 32.46 | 34.35 | 36.85 | 38.65 | 39.78 | 35.48 |
| 91.53 | 126.61 | 139.11 | 133.64 | 114.23 | 84.33 | 46.76 | 15.44 | |
| 30 September 2017 | 18.72 | 25.98 | 30.79 | 32.50 | 36.57 | 40.17 | 47.02 | 43.47 |
| 77.60 | 110.16 | 121.39 | 112.39 | 95.85 | 68.69 | 38.54 | 11.15 | |
| 1 October 2017 | 22.15 | 29.35 | 33.22 | 35.94 | 39.22 | 45.75 | 57.08 | 58.69 |
| 86.68 | 118.58 | 125.20 | 117.78 | 97.28 | 75.99 | 46.10 | 14.51 | |
| 2 October 2017 | 24.11 | 31.23 | 35.61 | 37.91 | 41.33 | 44.22 | 48.51 | 45.29 |
| 96.87 | 130.68 | 139.94 | 130.20 | 106.39 | 78.32 | 43.98 | 12.90 | |
| 3 October 2017 | 22.61 | 28.89 | 32.40 | 34.27 | 37.21 | 40.00 | 42.31 | 43.30 |
| 92.80 | 123.99 | 132.34 | 124.65 | 105.10 | 76.32 | 40.53 | 12.11 | |
| 4 October 2017 | 22.87 | 28.26 | 30.59 | 31.55 | 32.55 | 34.27 | 35.76 | 35.71 |
| 92.29 | 119.76 | 122.95 | 112.75 | 89.92 | 63.21 | 33.25 | 9.84 | |
| 7 October 2017 | 25.41 | 30.05 | 31.78 | 32.05 | 32.13 | 32.39 | 31.94 | 28.01 |
| 92.53 | 115.66 | 115.80 | 106.17 | 82.92 | 56.12 | 28.07 | 6.67 | |
References
- Aliberti, A.; Bottaccioli, L.; Cirrincione, G.; Macii, E.; Acquaviva, A.; Patti, E. Forecasting Short-term Solar Radiation for Photovoltaic Energy Predictions. In Proceedings of the 7th International Conference on Smart Cities and Green ICT Systems, Funchal, Portugal, 16–18 March 2018; pp. 44–53. [Google Scholar]
- Wolff, B. Support Vector Regression for Solar Power Prediction. Ph.D. Thesis, Carl von Ossietzky Universität Oldenburg, Oldenburg, Germany, 2017. [Google Scholar]
- Hammer, A.; Heinemann, D.; Hoyer, C.; Kuhlemann, R.; Lorenz, E.; Müller, R.; Beyer, H.G. Solar energy assessment using remote sensing technologies. Remote Sens. Environ. 2003, 86, 423–432. [Google Scholar] [CrossRef]
- Vrettos, E.; Gehbauer, C. A Hybrid Approach for Short-Term PV Power Forecasting in Predictive Control Applications. In Proceedings of the 2019 IEEE Milan PowerTech, Milan, Italy, 23–27 June 2019; pp. 1–6. [Google Scholar] [CrossRef]
- Raza, M.Q.; Nadarajah, M.; Ekanayake, C. On recent advances in PV output power forecast. Sol. Energy 2016, 136, 125–144. [Google Scholar] [CrossRef]
- Inman, R.H.; Pedro, H.T.; Coimbra, C.F. Solar forecasting methods for renewable energy integration. Prog. Energy Combust. Sci. 2013, 39, 535–576. [Google Scholar] [CrossRef]
- Barbieri, F.; Rajakaruna, S.; Ghosh, A. Very short-term photovoltaic power forecasting with cloud modeling: A review. Renew. Sustain. Energy Rev. 2017, 75, 242–263. [Google Scholar] [CrossRef]
- Lorenz, E.; Kühnert, J.; Heinemann, D. Short term forecasting of solar irradiance by combining satellite data and numerical weather predictions. In Proceedings of the 27th European PV Solar Energy Conference (EU PVSEC), Frankfurt, Germany, 24–28 September 2012; Volume 2428, p. 44014405. [Google Scholar]
- Wolff, B.; Kühnert, J.; Lorenz, E.; Kramer, O.; Heinemann, D. Comparing support vector regression for PV power forecasting to a physical modeling approach using measurement, numerical weather prediction, and cloud motion data. Sol. Energy 2016, 135, 197–208. [Google Scholar] [CrossRef]
- Kurz, C. From Nowcasting to Day Ahead Forecasting: Application of Combinational PV Power Forecasts. ICEM. Available online: http://www.wemcouncil.org/wp/wp-content/uploads/2016/12/icem_20180524_room1_0950_kurz.pdf (accessed on 10 July 2019).
- Nikitidou, E.; Zagouras, A.; Salamalikis, V.; Kazantzidis, A. Short-term cloudiness forecasting for solar energy purposes in Greece, based on satellite-derived information. Meteorol. Atmos. Phys. 2019, 131, 175–182. [Google Scholar] [CrossRef]
- Urbich, I.; Bendix, J.; Müller, R. A Novel Approach for the Short-Term Forecast of the Effective Cloud Albedo. Remote Sens. 2018, 10, 955. [Google Scholar] [CrossRef]
- Turner, B.; Zawadzki, I.; Germann, U. Predictability of precipitation from continental radar images. Part III: Operational nowcasting implementation (MAPLE). J. Appl. Meteorol. 2004, 43, 231–248. [Google Scholar] [CrossRef]
- Lin, C.; Vasić, S.; Kilambi, A.; Turner, B.; Zawadzki, I. Precipitation forecast skill of numerical weather prediction models and radar nowcasts. Geophys. Res. Lett. 2005, 32. [Google Scholar] [CrossRef]
- Berenguer, M.; Sempere-Torres, D.; Pegram, G.G. SBMcast–An ensemble nowcasting technique to assess the uncertainty in rainfall forecasts by Lagrangian extrapolation. J. Hydrol. 2011, 404, 226–240. [Google Scholar] [CrossRef]
- Germann, U.; Zawadzki, I. Scale-dependence of the predictability of precipitation from continental radar images. Part I: Description of the methodology. Mon. Weather. Rev. 2002, 130, 2859–2873. [Google Scholar] [CrossRef]
- OpenCV Homepage. Available online: http://opencv.org/ (accessed on 12 March 2019).
- Hamill, T.M.; Nehrkorn, T. A Short-Term Cloud Forecast Scheme Using Cross Correlations. Weather. Forecast. 1993, 8, 401–411. [Google Scholar] [CrossRef]
- Lorenz, E.; Hammer, A.; Heinemann, D. Short term forecasting of solar radiation based on satellite data. In Proceedings of the EUROSUN2004 (ISES Europe Solar Congress), Freiburg, Germany, 20–23 June 2004; pp. 841–848. [Google Scholar]
- Harty, T.M.; Holmgren, W.F.; Lorenzo, A.T.; Morzfeld, M. Intra-hour cloud index forecasting with data assimilation. Sol. Energy 2019, 185, 270–282. [Google Scholar] [CrossRef]
- Cheng, H.Y. Cloud tracking using clusters of feature points for accurate solar irradiance nowcasting. Renew. Energy 2017, 104, 281–289. [Google Scholar] [CrossRef]
- Bosch, J.L.; Zheng, Y.; Kleissl, J. Deriving cloud velocity from an array of solar radiation measurements. Sol. Energy 2013, 87, 196–203. [Google Scholar] [CrossRef]
- Guillot, E.M.; Vonder Haar, T.H.; Forsythe, J.M.; Fletcher, S.J. Evaluating Satellite-Based Cloud Persistence and Displacement Nowcasting Techniques over Complex Terrain. Weather. Forecast. 2012, 27, 502–514. [Google Scholar] [CrossRef]
- Velden, C.S.; Olander, T.L.; Wanzong, S. The Impact of Multispectral GOES-8 Wind Information on Atlantic Tropical Cyclone Track Forecasts in 1995. Part I: Dataset Methodology, Description, and Case Analysis. Mon. Weather. Rev. 1998, 126, 1202–1218. [Google Scholar] [CrossRef]
- Escrig, H.; Batlles, F.; Alonso, J.; Baena, F.; Bosch, J.; Salbidegoitia, I.; Burgaleta, J. Cloud detection, classification and motion estimation using geostationary satellite imagery for cloud cover forecast. Energy 2013, 55, 853–859. [Google Scholar] [CrossRef]
- Nonnenmacher, L.; Coimbra, C.F. Streamline-based method for intra-day solar forecasting through remote sensing. Sol. Energy 2014, 108, 447–459. [Google Scholar] [CrossRef]
- Schroedter-Homscheidt, M.; Gesell, G. Verification of sectoral cloud motion based direct normal irradiance nowcasting from satellite imagery. AIP Conf. Proc. 2016, 1734, 150007. [Google Scholar] [CrossRef]
- Gallucci, D.; Romano, F.; Cersosimo, A.; Cimini, D.; Di Paola, F.; Gentile, S.; Geraldi, E.; Larosa, S.; Nilo, S.T.; Ricciardelli, E.; et al. Nowcasting Surface Solar Irradiance with AMESIS via Motion Vector Fields of MSG-SEVIRI Data. Remote Sens. 2018, 10, 845. [Google Scholar] [CrossRef]
- Sirch, T.; Bugliaro, L.; Zinner, T.; Möhrlein, M.; Vazquez-Navarro, M. Cloud and DNI nowcasting with MSG/SEVIRI for the optimized operation of concentrating solar power plants. Atmos. Meas. Tech. 2017, 10, 409–429. [Google Scholar] [CrossRef]
- Müller, R.; Trentmann, J.; Träger-Chatterjee, C.; Posselt, R.; Stöckli, R. The Role of the Effective Cloud Albedo for Climate Monitoring and Analysis. Remote Sens. 2011, 3, 2305–2320. [Google Scholar] [CrossRef]
- Müller, R.; Pfeifroth, U.; Träger-Chatterjee, C.; Trentmann, J.; Cremer, R. Digging the METEOSAT treasure—3 decades of solar surface radiation. Remote Sens. 2015, 7, 8067–8101. [Google Scholar] [CrossRef]
- Mueller, R.; Pfeifroth, U.; Traeger-Chatterjee, C. Towards Optimal Aerosol Information for the Retrieval of Solar Surface Radiation Using Heliosat. Atmosphere 2015, 6, 863–878. [Google Scholar] [CrossRef]
- Richard Müller, J.T. Algorithm Theoretical Baseline Document Meteosat Solar Surface Radiation and Effective Cloud Albedo Climate Data Records—Heliosat SARAH the MAGICSOL Method Applied for the Generation of SARAH. 2014. Available online: https://www.cmsaf.eu/SharedDocs/Literatur/document/2014/saf_cm_dwd_atbd_meteosat_hel_1_3_pdf.html (accessed on 16 October 2019).
- Trentmann, J. Meteosat Solar Surface Irradiance and Effective Cloud Albedo Climate Data Records METEOSAT HEL the SARAH Climate Data Records. 2014. Available online: https://www.cmsaf.eu/SharedDocs/Literatur/document/2014/saf_cm_dwd_pum_meteosat_hel_1_1_pdf.html (accessed on 16 October 2019).
- Bellouin, N.; Quaas, J.; Morcrette, J.J.; Boucher, O. Estimates of aerosol radiative forcing from the MACC re-analysis. Atmos. Chem. Phys. 2013, 13, 2045–2062. [Google Scholar] [CrossRef]
- ECMWF Homepage. Available online: https://www.ecmwf.int/ (accessed on 18 October 2019).
- Loveland, T.R.; Belward, A.S. The IGBP-DIS global 1km land cover data set, DISCover: First results. Int. J. Remote Sens. 1997, 18, 3289–3295. [Google Scholar] [CrossRef]
- Brown, J.F.; Loveland, T.R.; Merchant, J.W.; Reed, B.C.; Ohlen, D.O. Using multisource data in global land-cover characterization: Concepts, requirements, and methods. Photogramm. Eng. Remote Sens. 1993, 59, 977–987. [Google Scholar]
- Müller, R.; Behrendt, T.; Hammer, A.; Kemper, A. A New Algorithm for the Satellite-Based Retrieval of Solar Surface Irradiance in Spectral Bands. Remote Sens. 2012, 4, 622–647. [Google Scholar] [CrossRef]
- Lalouni, S.; Rekioua, D.; Rekioua, T.; Matagne, E. Fuzzy logic control of stand-alone photovoltaic system with battery storage. J. Power Sources 2009, 193, 899–907. [Google Scholar] [CrossRef]
- Islam, M.A.; Merabet, A.; Beguenane, R.; Ibrahim, H. Modeling solar photovoltaic cell and simulated performance analysis of a 250W PV module. In Proceedings of the 2013 IEEE Electrical Power & Energy Conference, Halifax, NS, Canada, 21–23 August 2013; pp. 1–6. [Google Scholar]
- Kusiak, A.; Verma, A. Monitoring wind farms with performance curves. IEEE Trans. Sustain. Energy 2012, 4, 192–199. [Google Scholar] [CrossRef]
- Albadi, M.; El-Saadany, E. Wind turbines capacity factor modeling—A novel approach. IEEE Trans. Power Syst. 2009, 24, 1637–1638. [Google Scholar] [CrossRef]
- Pfeifroth, U.; Sanchez-Lorenzo, A.; Manara, V.; Trentmann, J.; Hollmann, R. Trends and Variability of Surface Solar Radiation in Europe Based On Surface-and Satellite-Based Data Records. J. Geophys. Res. Atmos. 2018, 123, 1735–1754. [Google Scholar] [CrossRef]
- Pfeifroth, U.; Kothe, S.; Müller, R.; Trentmann, J.; Hollmann, R.; Fuchs, P.; Werscheck, M. Surface Radiation Data Set—Heliosat (SARAH), 2nd ed.; Satellite Application Facility on Climate Monitoring: Offenbach am Main, Germany, 2017. [Google Scholar] [CrossRef]
- Ohmura, A.; Dutton, E.G.; Forgan, B.; Fröhlich, C.; Gilgen, H.; Hegner, H.; Heimo, A.; König-Langlo, G.; McArthur, B.; Müller, G.; et al. Baseline Surface Radiation Network (BSRN/WCRP): New precision radiometry for climate research. Bull. Am. Meteorol. Soc. 1998, 79, 2115–2136. [Google Scholar] [CrossRef]
- Beauchemin, S.S.; Barron, J.L. The computation of optical flow. ACM Comput. Surv. (CSUR) 1995, 27, 433–466. [Google Scholar] [CrossRef]
- Horn, B.K.; Schunck, B.G. Determining optical flow. Artif. Intell. 1981, 17, 185–203. [Google Scholar] [CrossRef]
- Zach, C.; Pock, T.; Bischof, H. A duality based approach for realtime TV-L1 optical flow. In Joint Pattern Recognition Symposium; Springer: Berlin/Heidelberg, Germany, 2007; pp. 214–223. [Google Scholar]
- Farnebäck, G. Two-frame motion estimation based on polynomial expansion. In Scandinavian Conference on Image Analysis; Springer: Berlin/Heidelberg, Germany, 2003; pp. 363–370. [Google Scholar]
- Amillo, A.; Huld, T.; Müller, R. A New Database of Global and Direct Solar Radiation Using the Eastern Meteosat Satellite, Models and Validation. Remote Sens. 2014, 6, 8165–8189. [Google Scholar] [CrossRef]
- Matsuoka, A.; Babin, M.; Devred, E.C. A new algorithm for discriminating water sources from space: A case study for the southern Beaufort Sea using MODIS ocean color and SMOS salinity data. Remote Sens. Environ. 2016, 184, 124–138. [Google Scholar] [CrossRef]
- Arndt, E. Vergleich von Kurzfrist-Strahlungsvorhersagen (Nowcasting) mit Vorhersagen aus numerischen Wettermodellen im Kontext der nahtlosen Strahlungsvorhersage. Master’s Thesis, Johann Wolfgang Goethe-University Frankfurt am Main, Frankfurt, Germany, 2019. [Google Scholar]


| Observation | |||
|---|---|---|---|
| Cloud | No Cloud | ||
| Forecast | Cloud | a = hit | b = fa |
| No Cloud | c = miss | d = cn | |
| Author | Variable | Area | Measure | Lead Time (min) | Value |
|---|---|---|---|---|---|
| Schroedter-Homscheidt and Gesell [27] | DNI | Spain | Bias | 300 | 130 W/m |
| Nonnenmacher and Coimbra [26] | GHI | San Diego | RMSE | 120 | 145 W/m |
| Gallucci et al. [28] | SIS | Italy | RMSE | 120 | 147 W/m |
| this study | SIS | Europe | RMSE | 135 | 136 W/m |
| Sirch et al. [29] | DNI | Spain | POD | 120 | 85–90% |
| this study | SIS | Europe | POD | 135 | 84% |
| Sirch et al. [29] | DNI | Spain | R | 120 | 0.71 |
| this study | SIS | Europe | R | 135 | 0.72 |
© 2019 by the authors. Licensee MDPI, Basel, Switzerland. This article is an open access article distributed under the terms and conditions of the Creative Commons Attribution (CC BY) license (http://creativecommons.org/licenses/by/4.0/).
Share and Cite
Urbich, I.; Bendix, J.; Müller, R. The Seamless Solar Radiation (SESORA) Forecast for Solar Surface Irradiance—Method and Validation. Remote Sens. 2019, 11, 2576. https://doi.org/10.3390/rs11212576
Urbich I, Bendix J, Müller R. The Seamless Solar Radiation (SESORA) Forecast for Solar Surface Irradiance—Method and Validation. Remote Sensing. 2019; 11(21):2576. https://doi.org/10.3390/rs11212576
Chicago/Turabian StyleUrbich, Isabel, Jörg Bendix, and Richard Müller. 2019. "The Seamless Solar Radiation (SESORA) Forecast for Solar Surface Irradiance—Method and Validation" Remote Sensing 11, no. 21: 2576. https://doi.org/10.3390/rs11212576
APA StyleUrbich, I., Bendix, J., & Müller, R. (2019). The Seamless Solar Radiation (SESORA) Forecast for Solar Surface Irradiance—Method and Validation. Remote Sensing, 11(21), 2576. https://doi.org/10.3390/rs11212576