Comparison of Different Classifiers and the Majority Voting Rule for the Detection of Plum Fruits in Garden Conditions

 ,
, 

 ,
, 
Abstract
:
1. Introduction
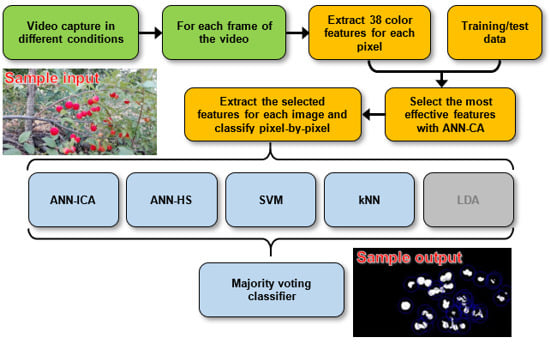
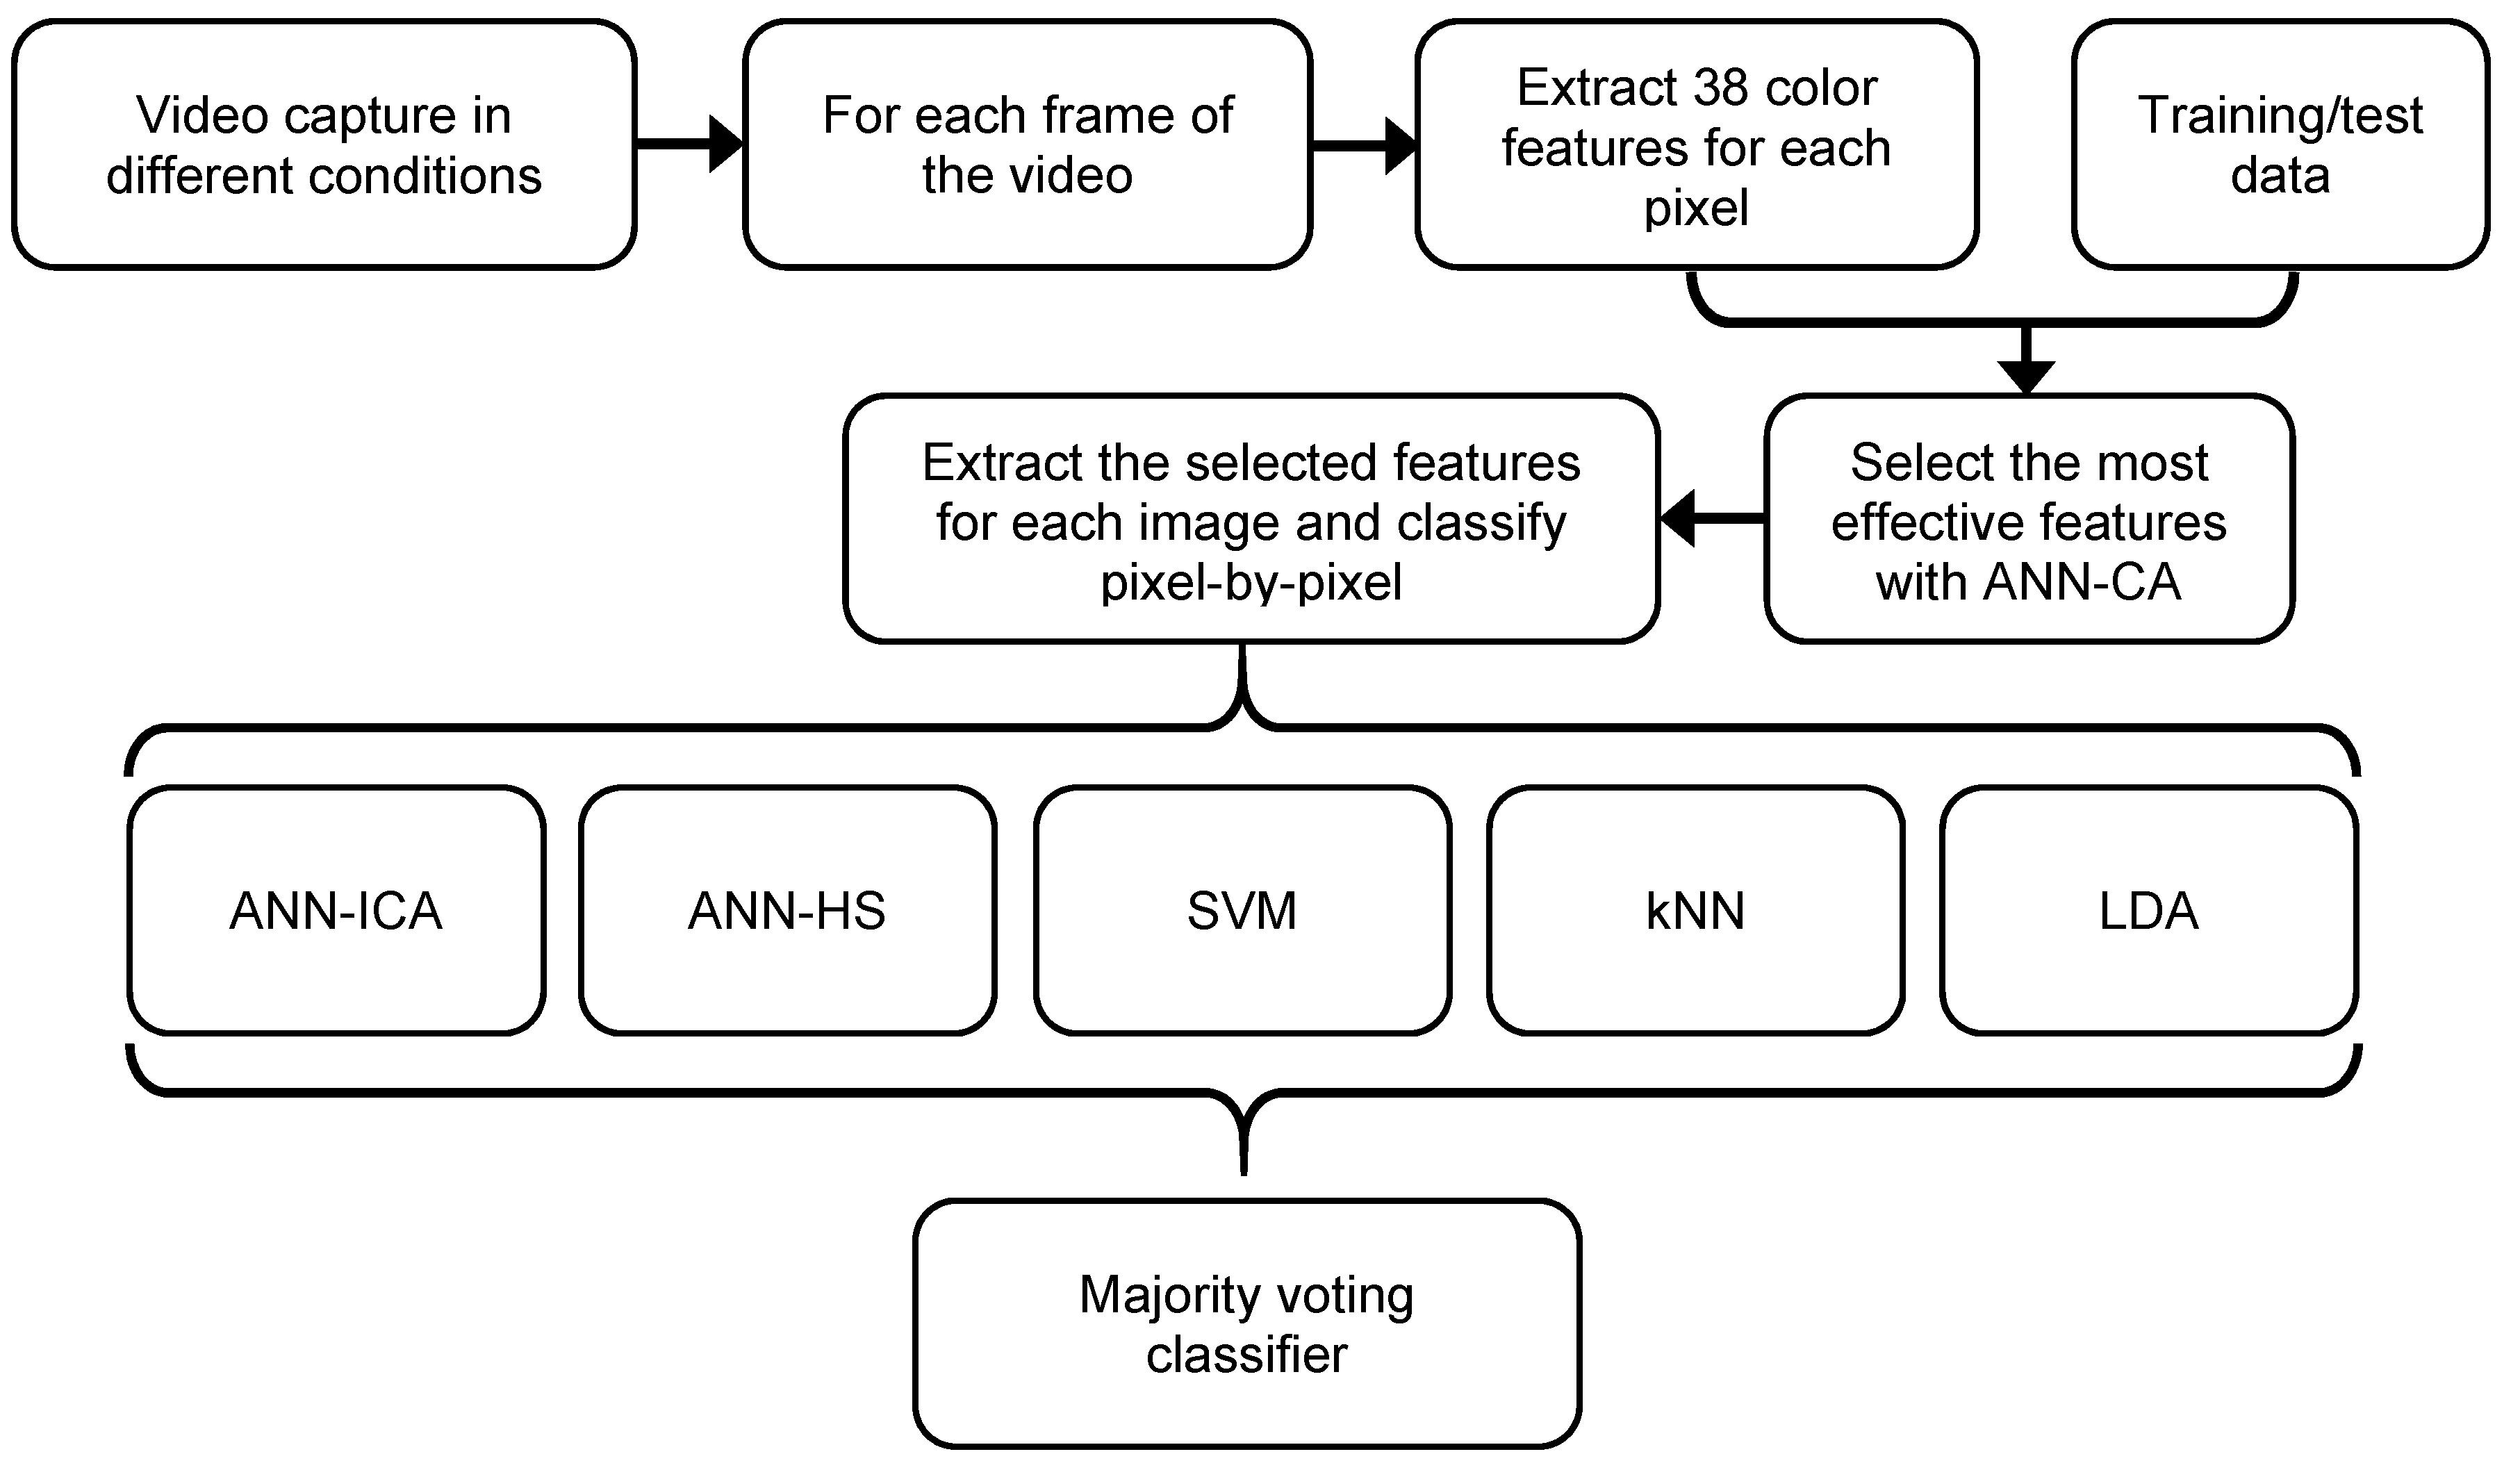
2. Materials and Methods
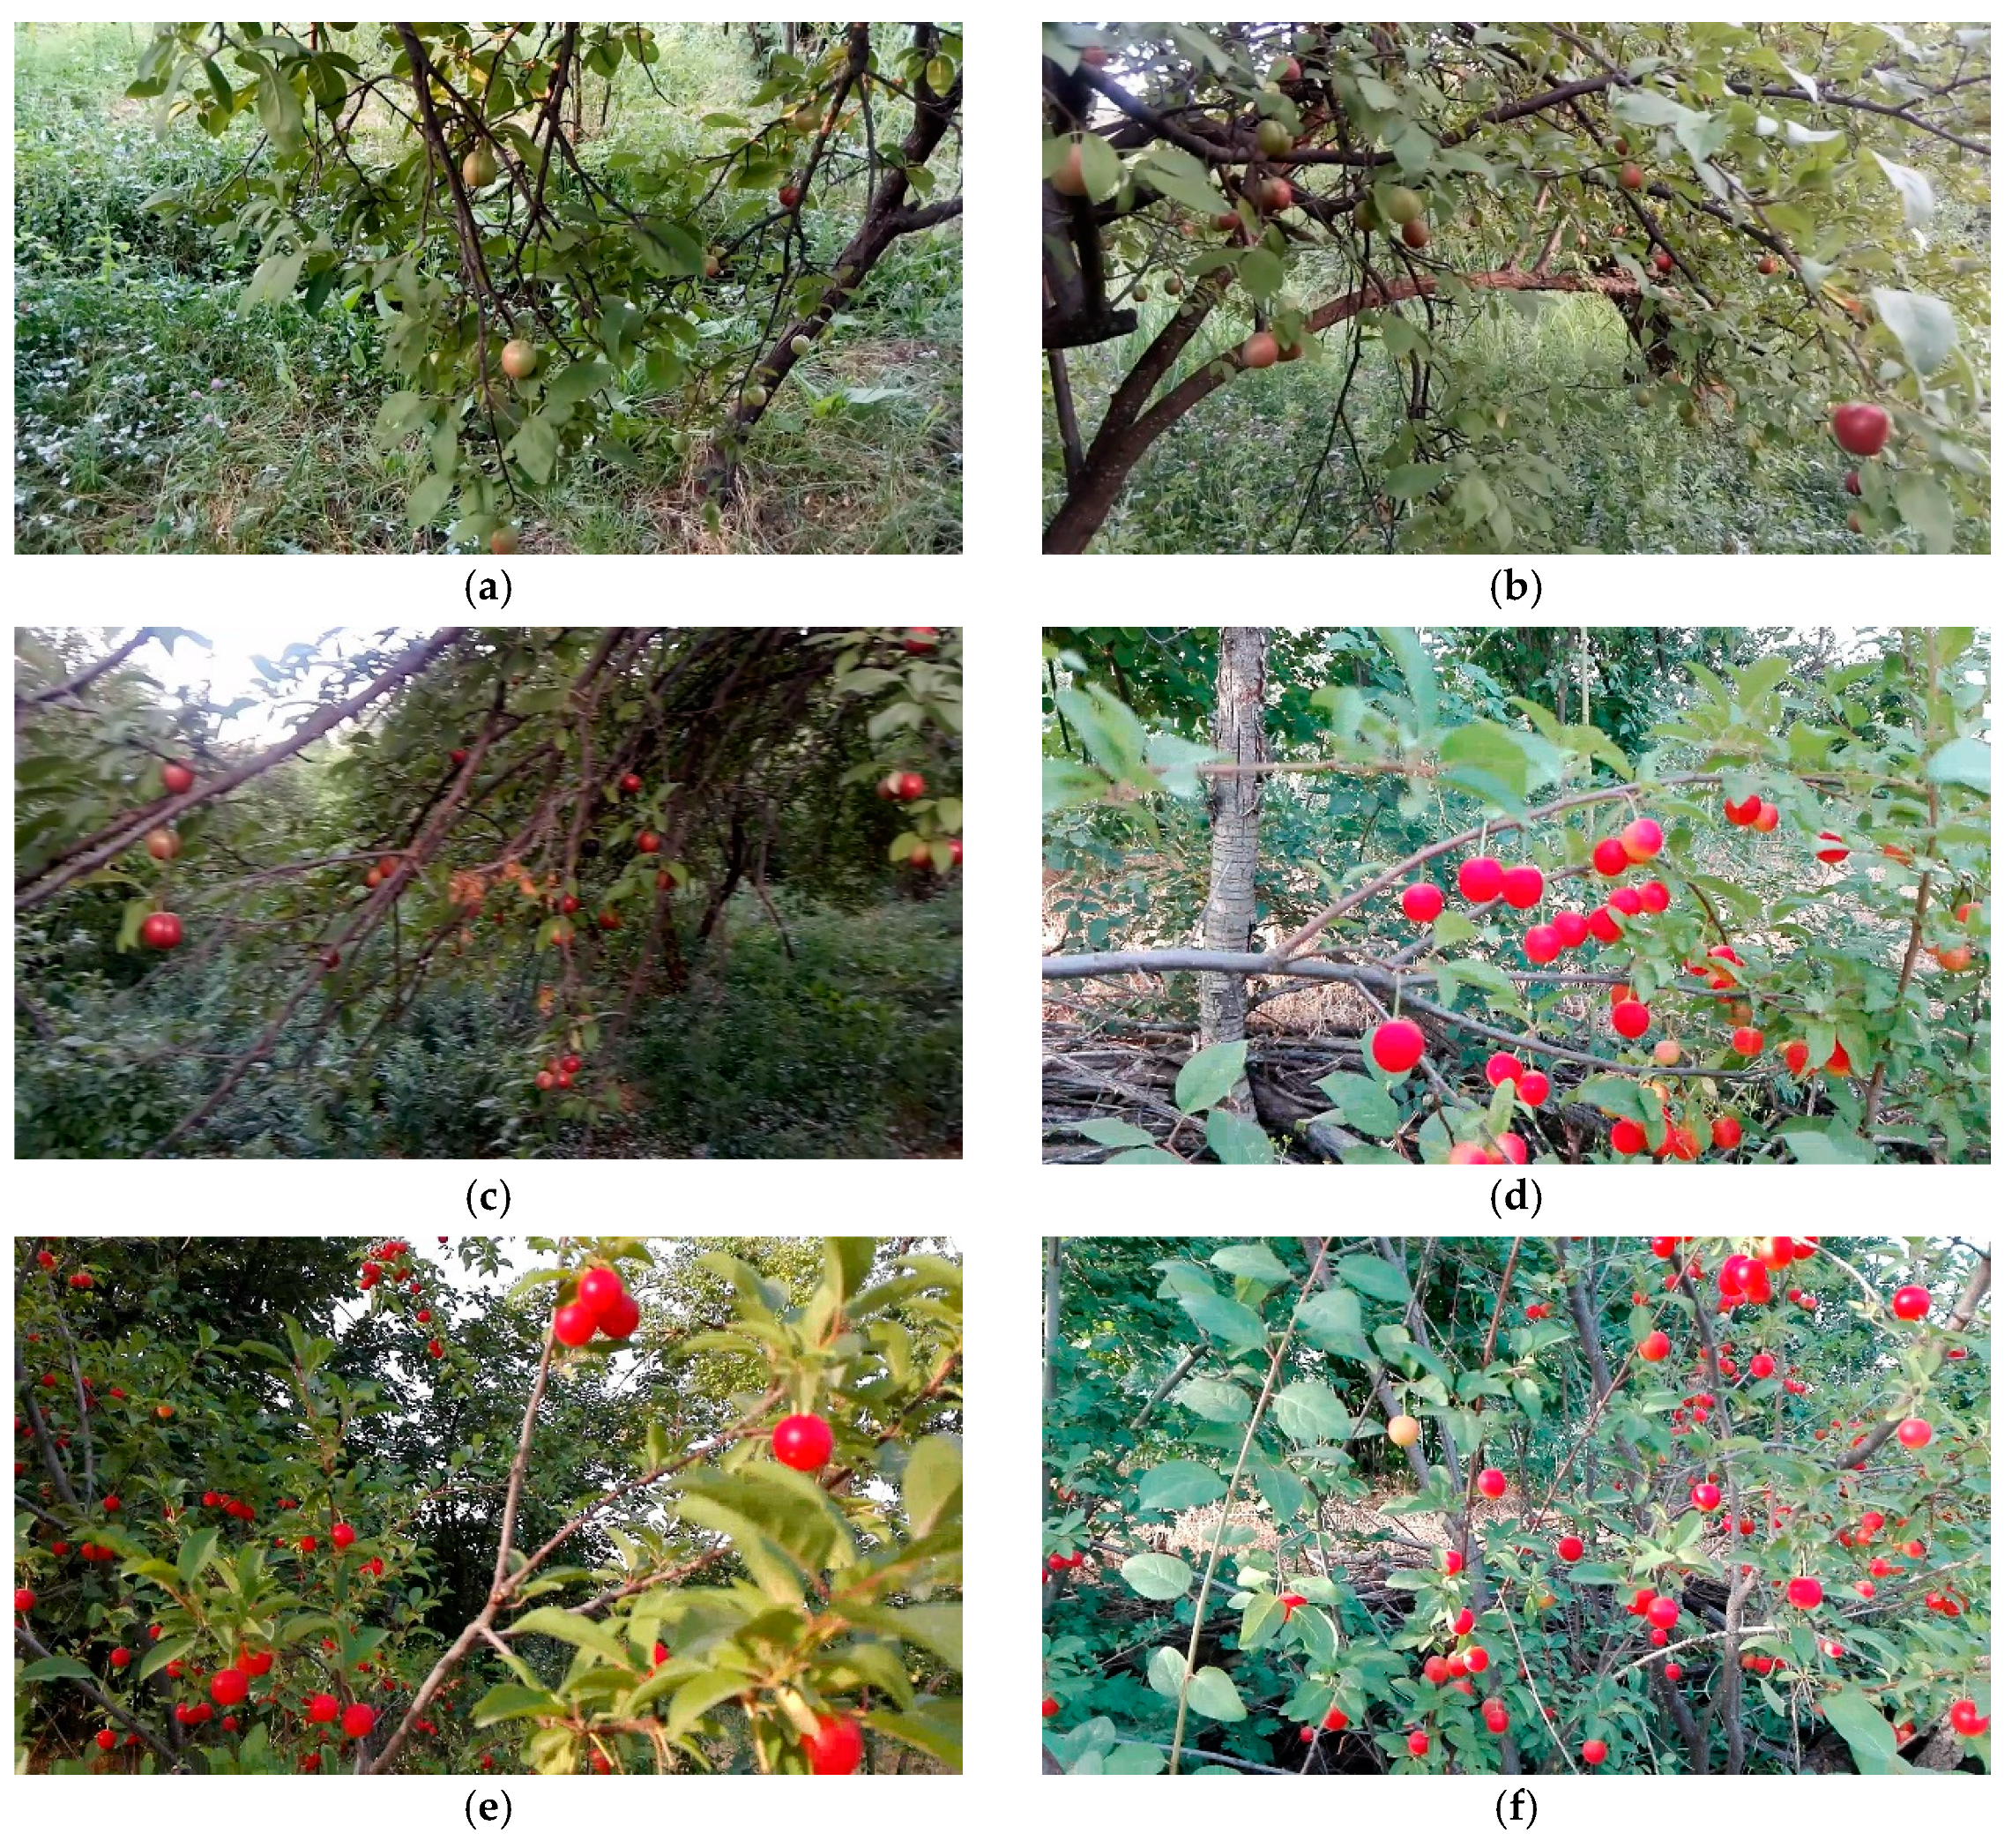
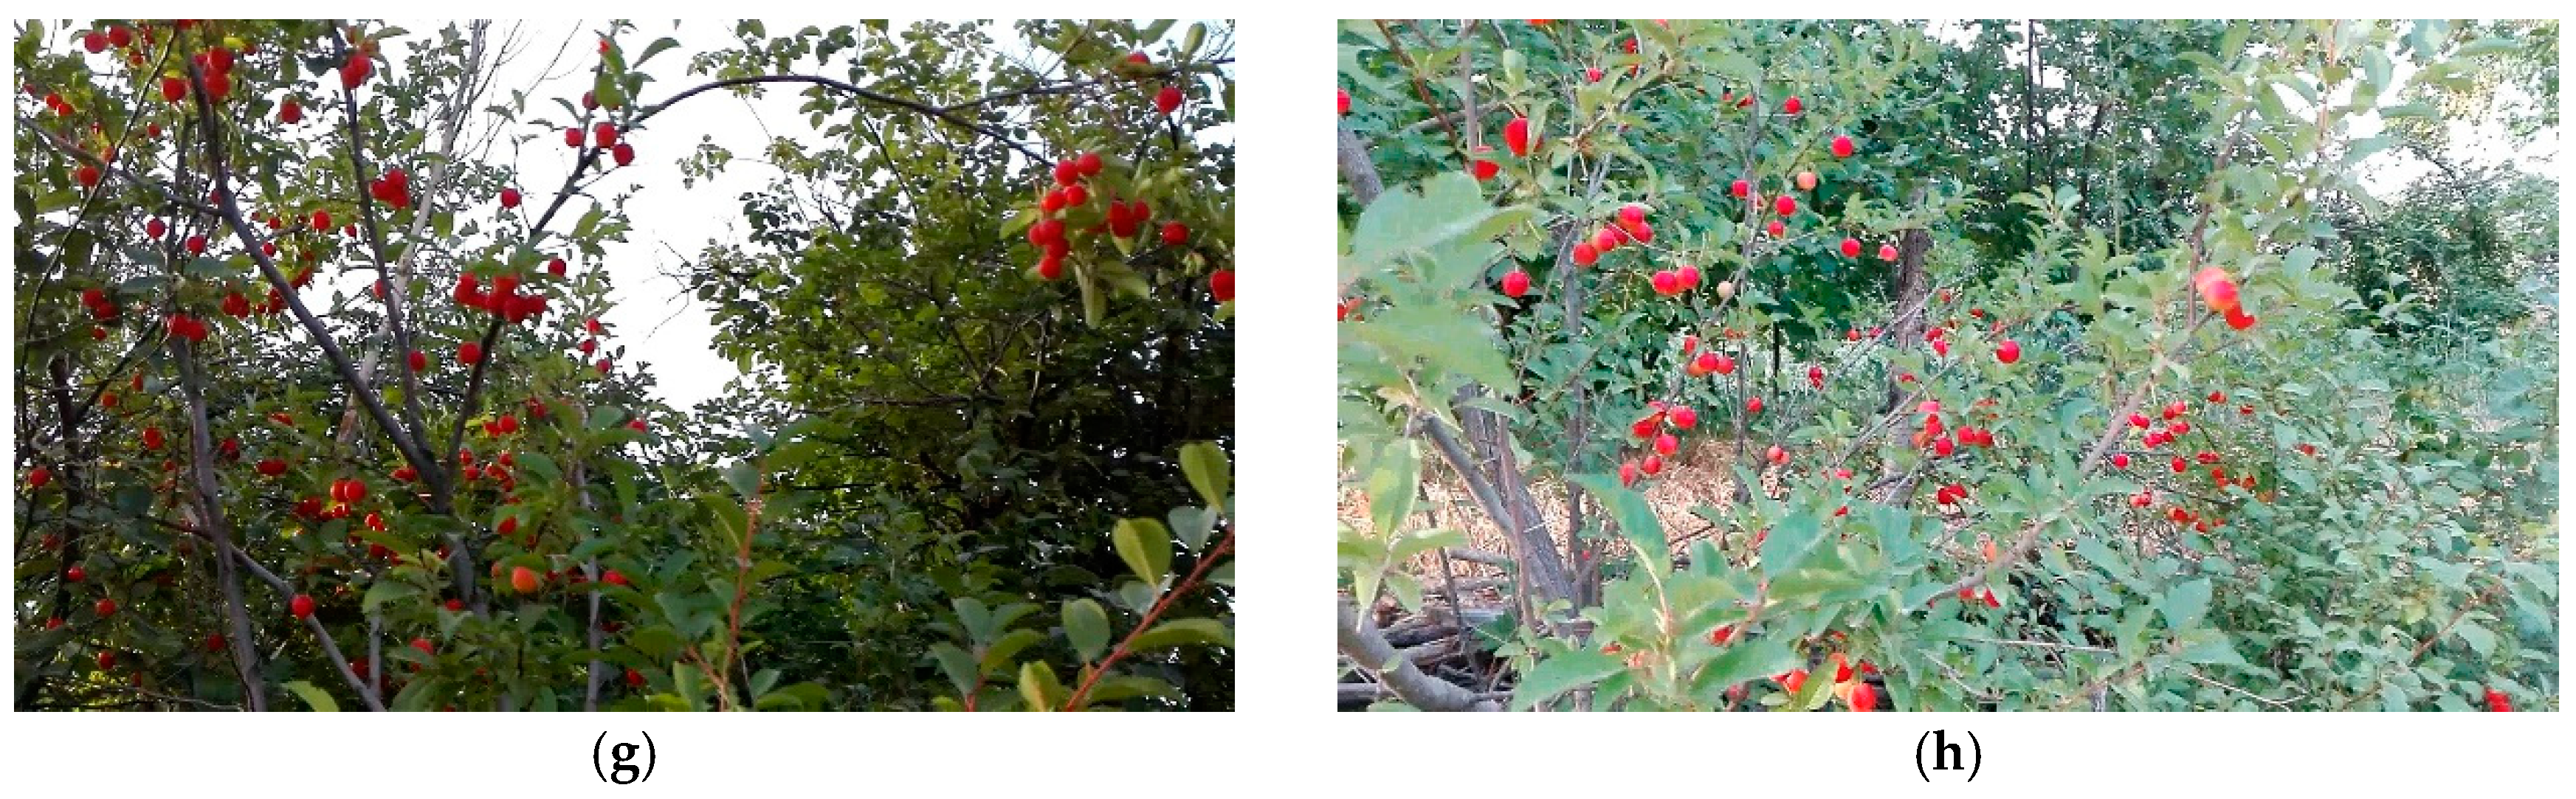
2.1. Video Recording and Data Collection
2.2. Selection of the Most Effective Color Features
2.3. Underlying Color Classifiers
2.3.1. Hybrid Artificial Neural Network-Imperialist Competitive Algorithm (ANN-ICA)
2.3.2. Hybrid Artificial Neural Network-Harmony Search (ANN-HS)
2.3.3. Support Vector Machines (SVM) Classifier
2.3.4. k-Nearest Neighbors (kNN) Classifier
2.3.5. Linear Discriminant Analysis (LDA) Classifier
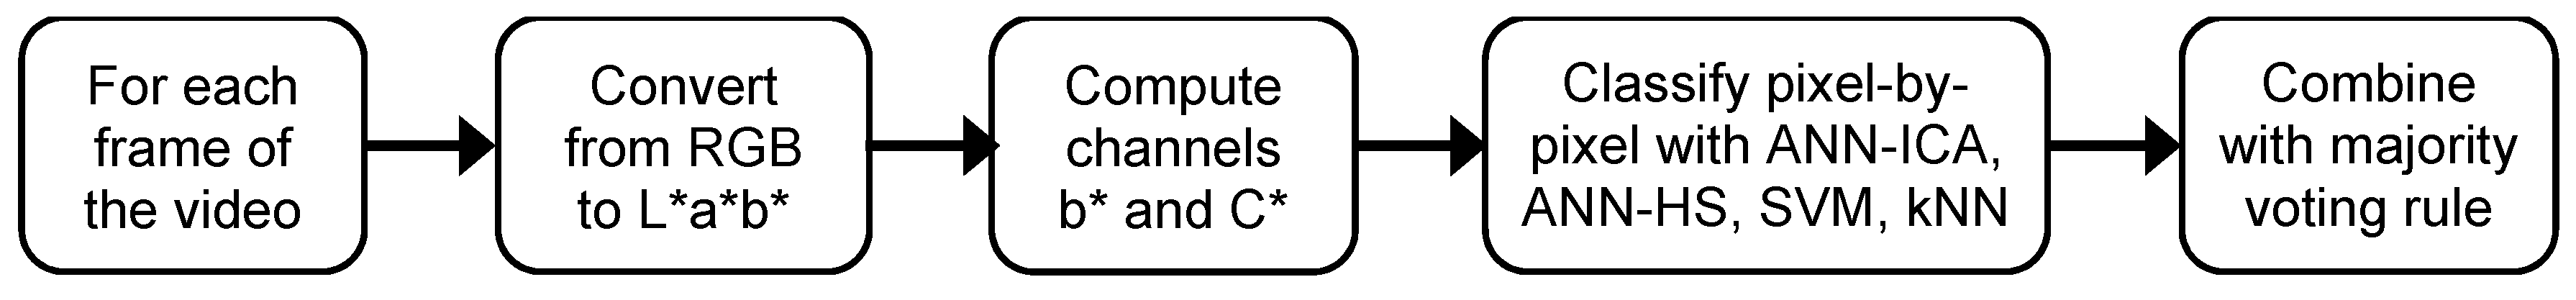
2.4. Combination of the Ensemble Classifier
2.5. Performance Evaluation Parameters of the Classifiers
2.5.1. Performance Parameters Based on the Confusion Matrix
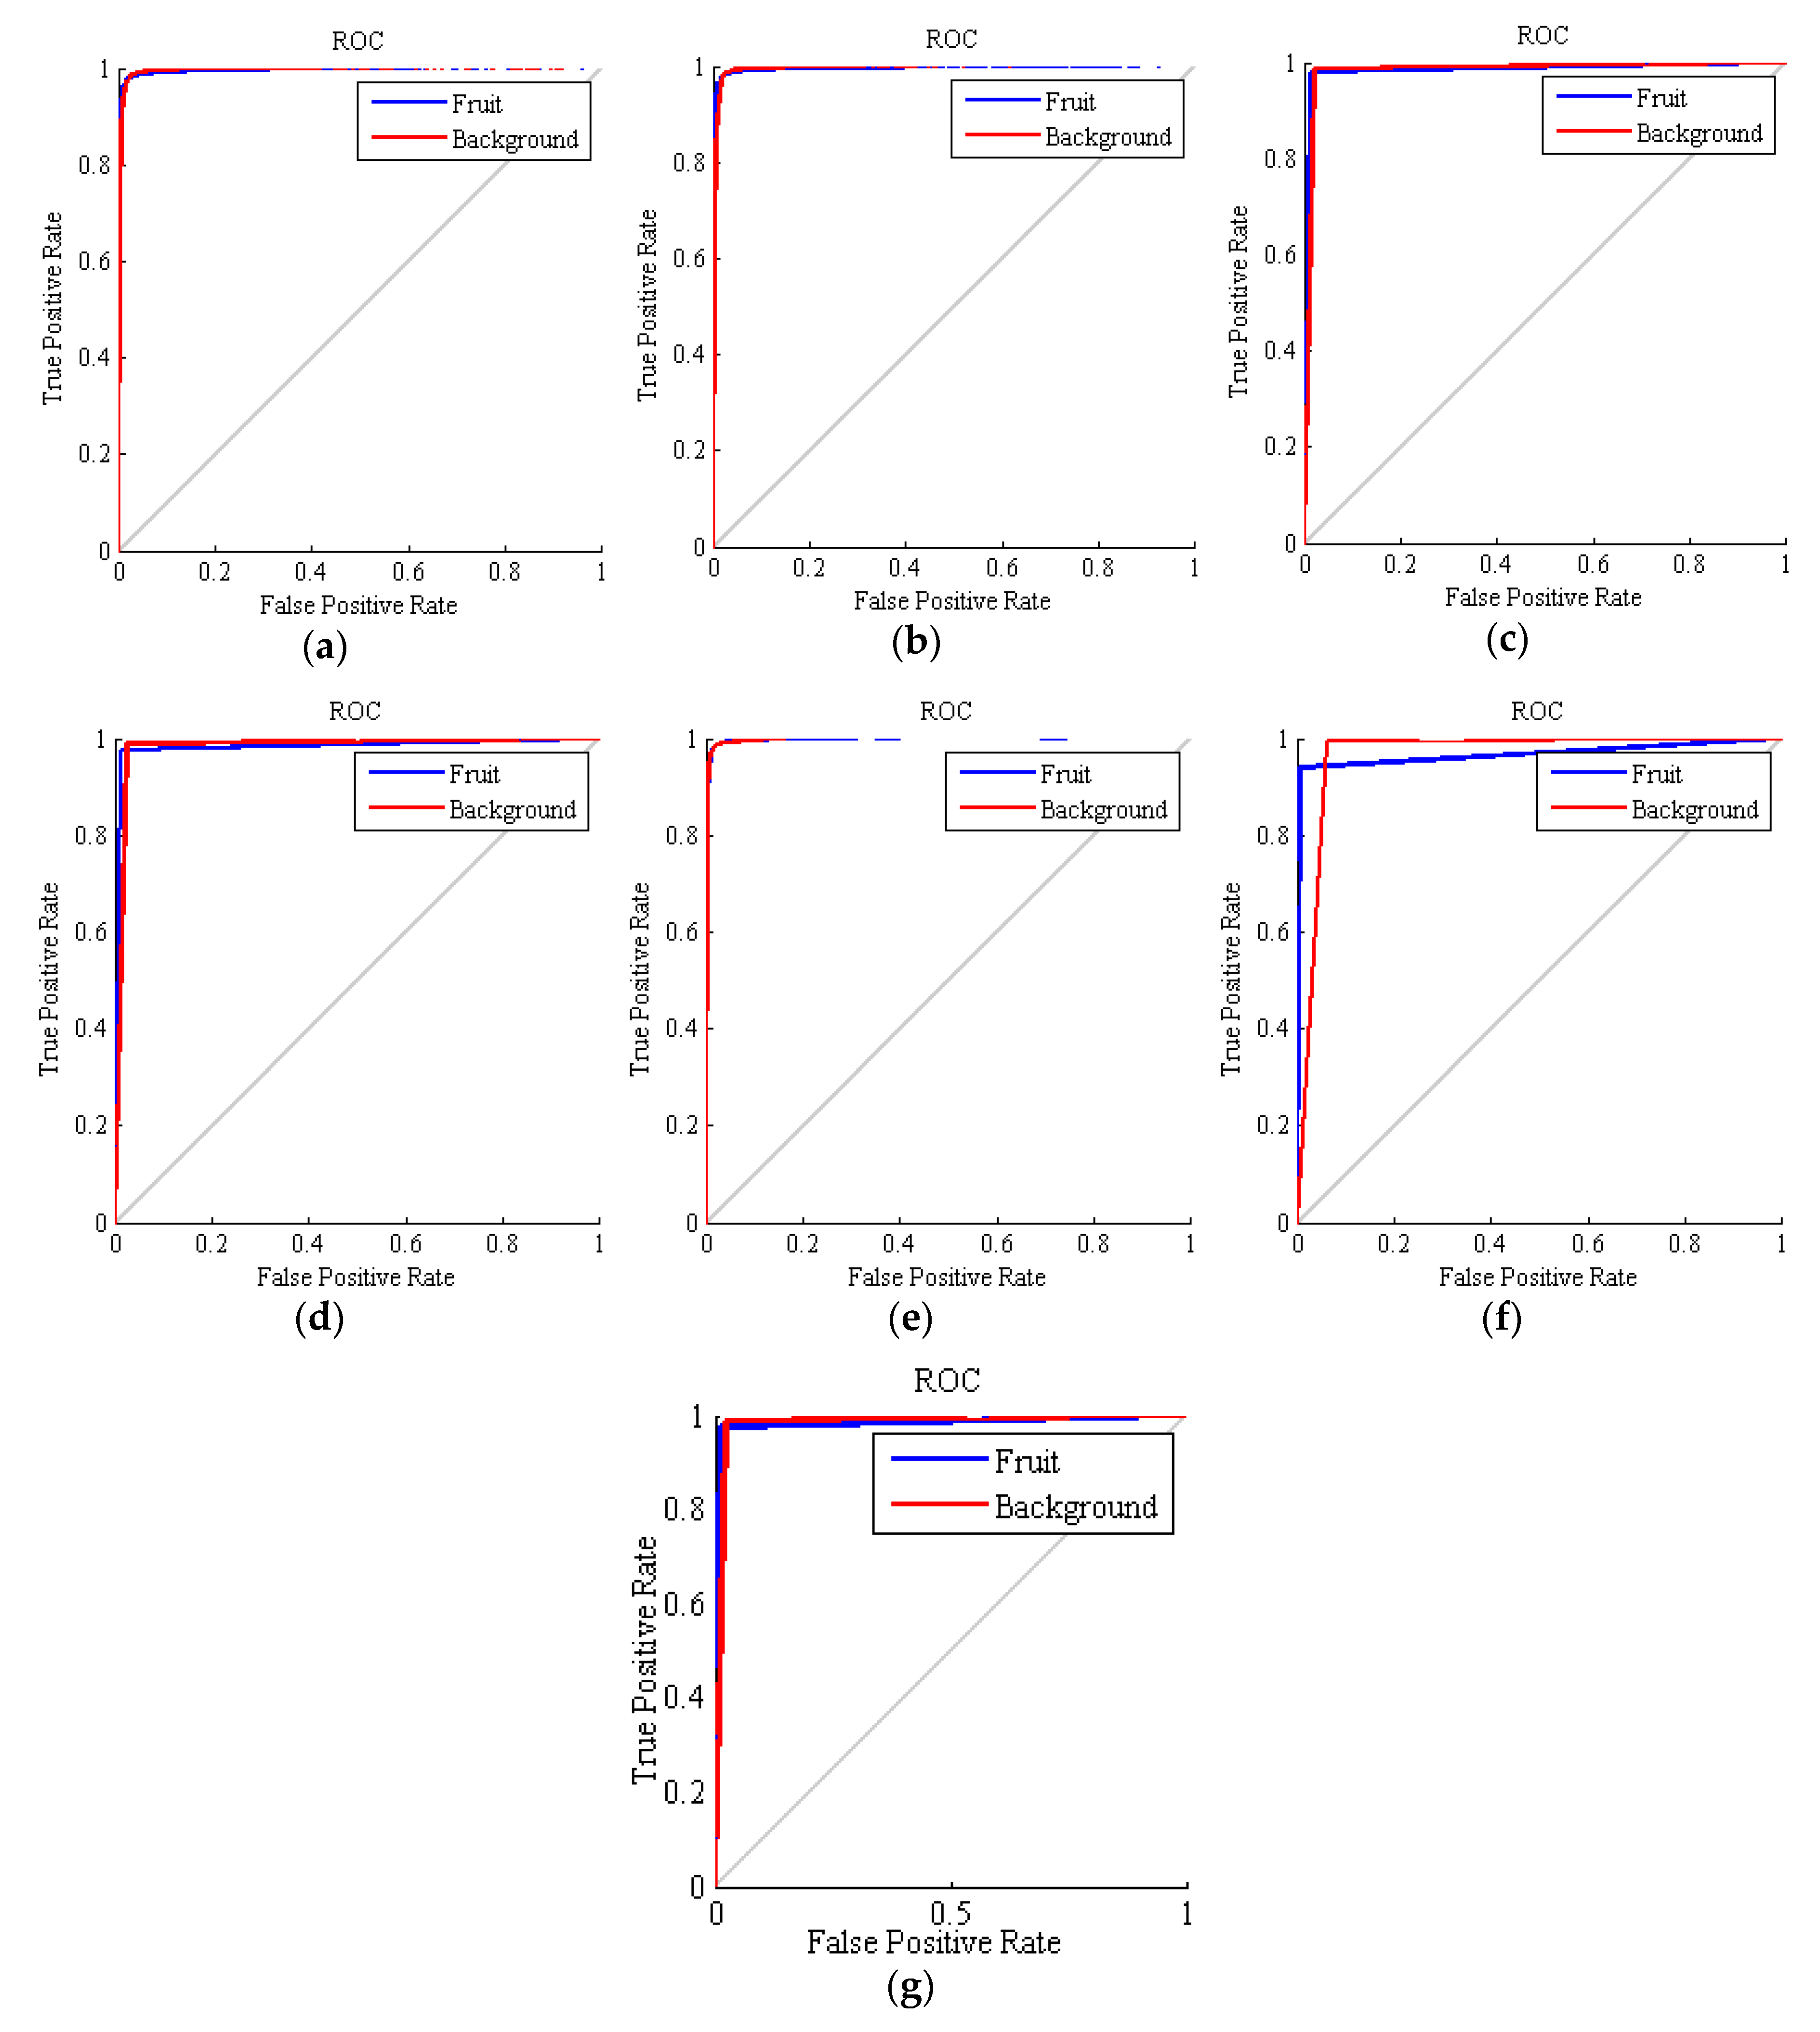
2.5.2. Receiver Operating Characteristic
3. Results and Discussion
3.1. Selection of the Color Features and Configuration of ANN-ICA and ANN-HS
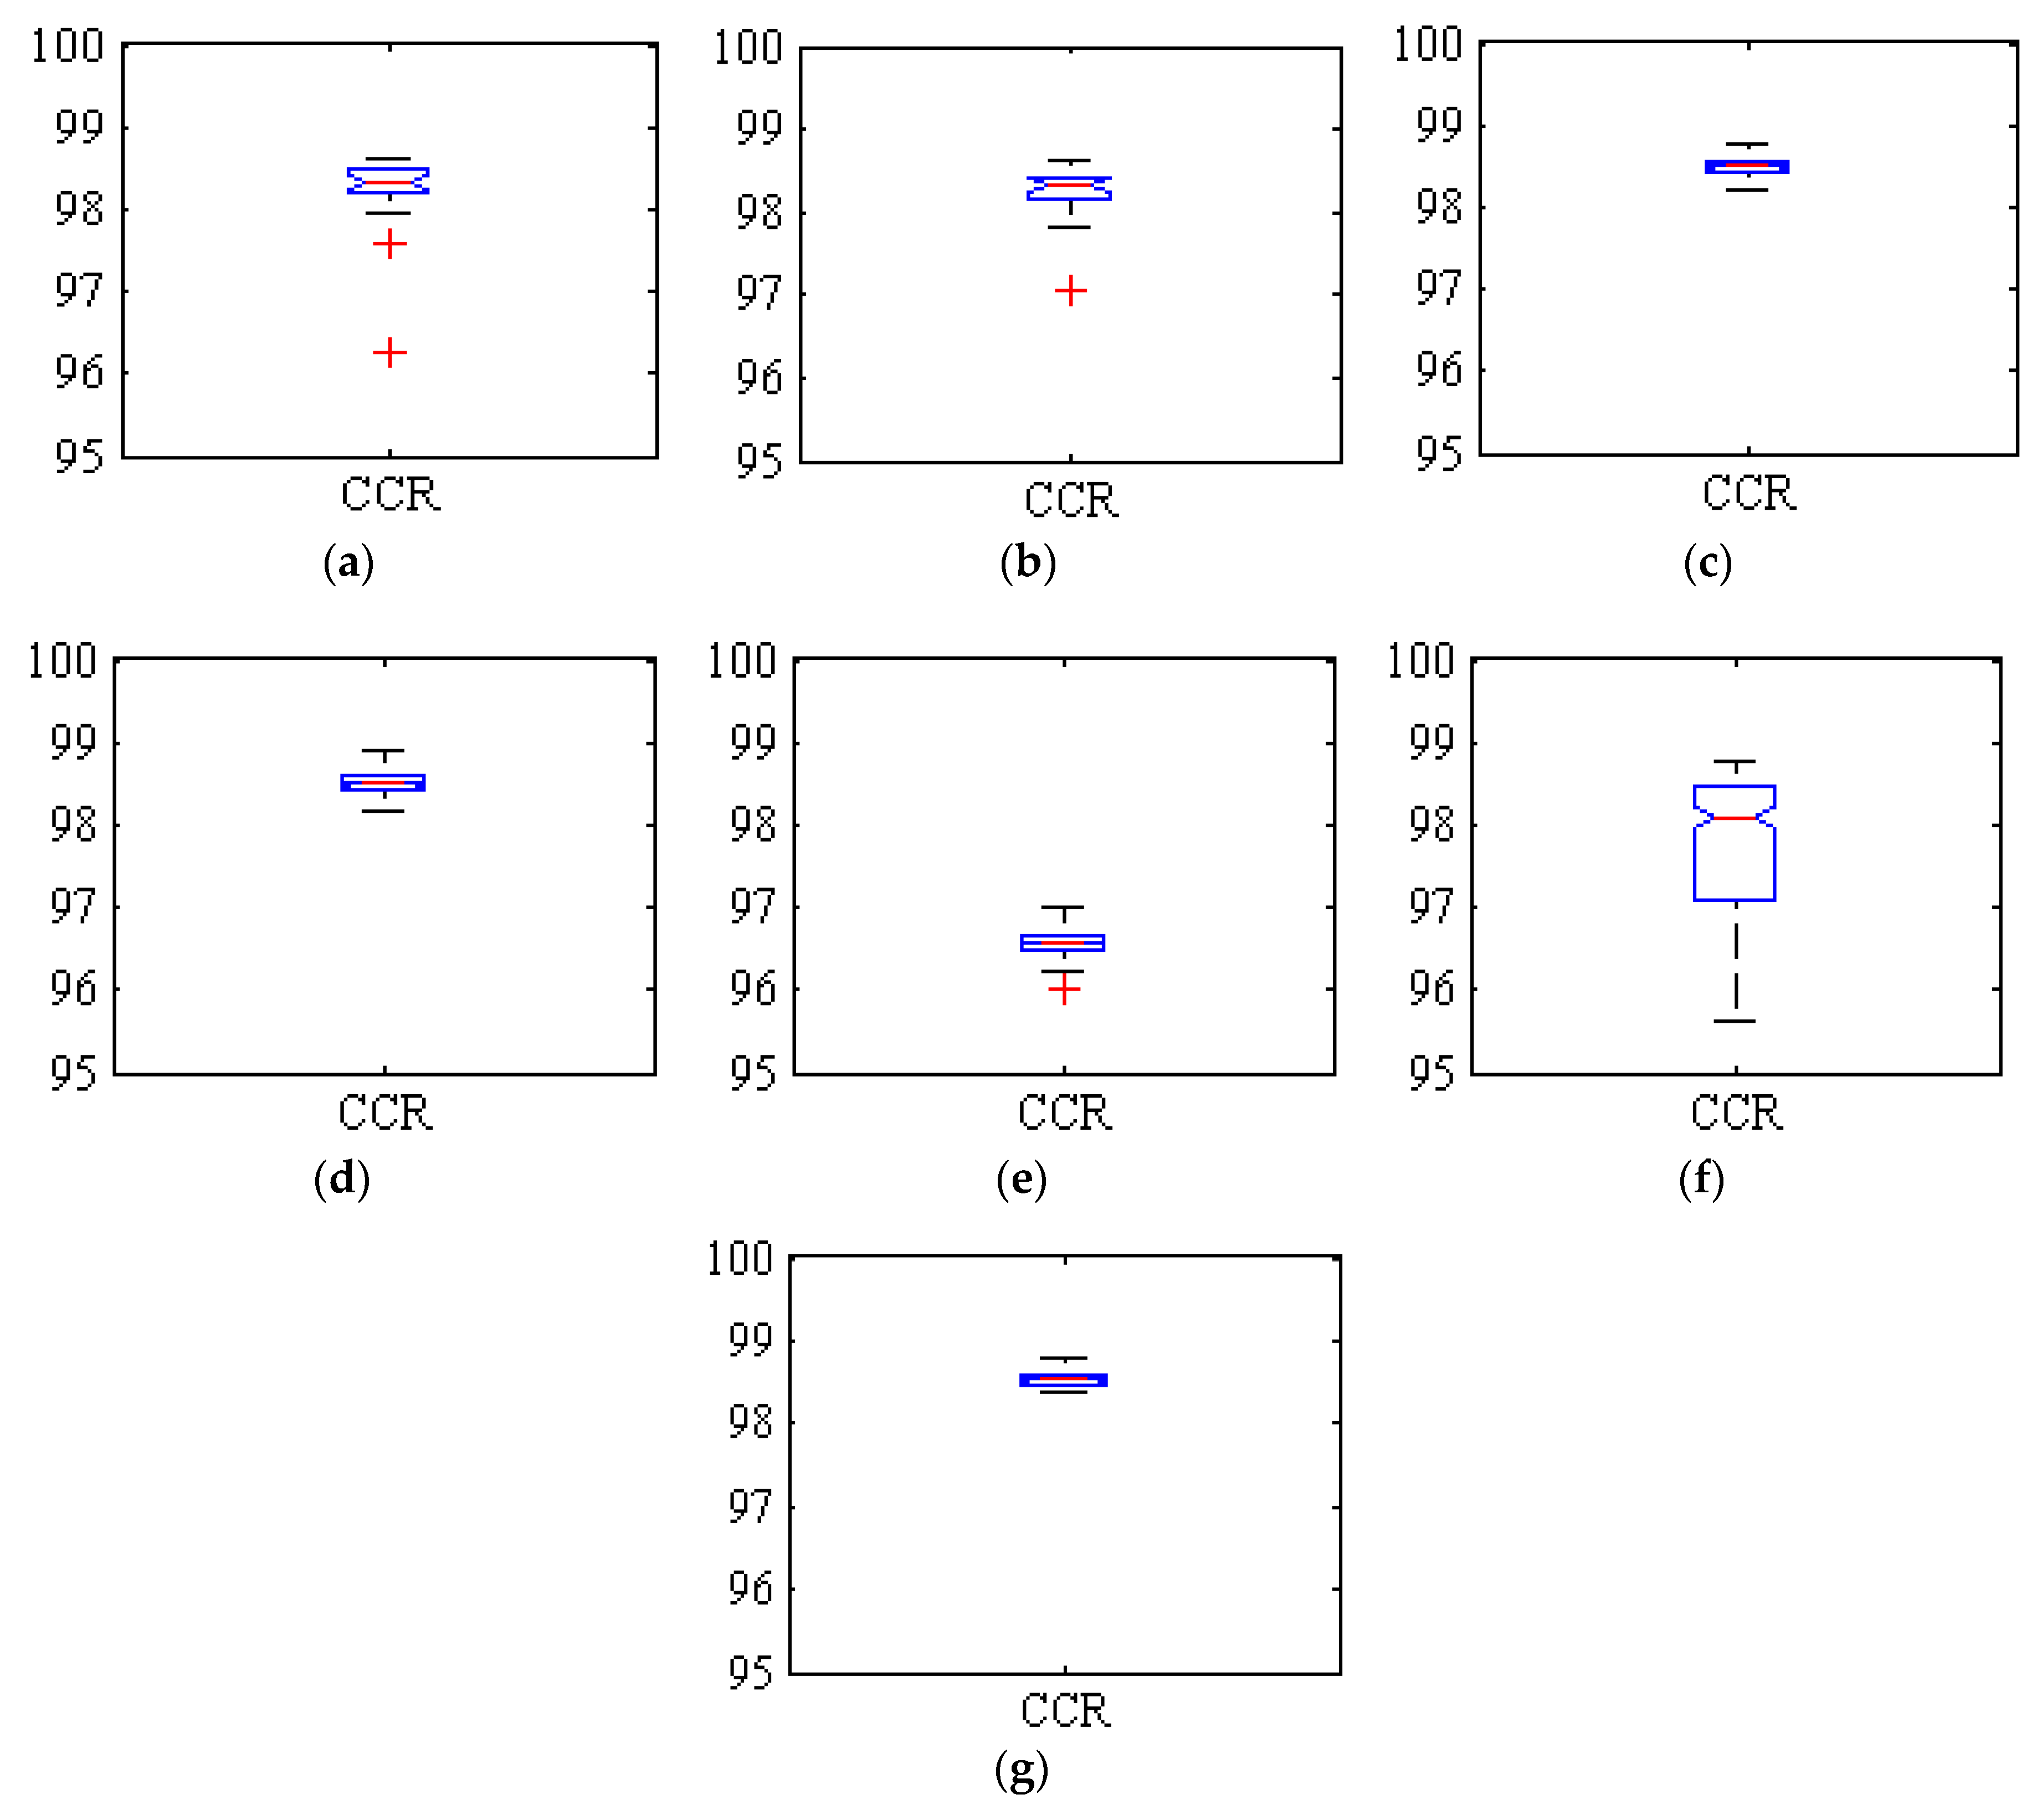
3.2. Classification Results of the Ensemble Method and the Basic Classifiers
3.3. Final Proposed Method and Comparison with the State-of-the-Art
4. Conclusions
Author Contributions
Funding
Conflicts of Interest
References
- Atzberger, C. Advances in remote sensing of agriculture: Context description, existing operational monitoring systems and major information needs. Remote Sens. 2013, 5, 949–981. [Google Scholar] [CrossRef]
- Jiménez, A.R.; Ceres, R.; Pons, J.L. A survey of computer vision methods for locating fruit on trees. Trans. Am. Soc. Agric. Eng. 2000, 43, 1911–1920. [Google Scholar] [CrossRef]
- Yu, Y.; Zhang, K.; Yang, L.; Zhang, D. Fruit detection for strawberry harvesting robot in non-structural environment based on Mask-RCNN. Comput. Electron. Agric. 2019, 163, 104846. [Google Scholar] [CrossRef]
- Fu, L.; Tola, E.; Al-Mallahi, A.; Li, R.; Cui, Y. A novel image processing algorithm to separate linearly clustered kiwifruits. Biosyst. Eng. 2019, 183, 184–195. [Google Scholar] [CrossRef]
- Li, Z.; Miao, F.; Yang, Z.; Chai, P.; Yang, S. Factors affecting human hand grasp type in tomato fruit-picking: A statistical investigation for ergonomic development of harvesting robot. Comput. Electron. Agric. 2019, 157, 90–97. [Google Scholar] [CrossRef]
- Wang, C.; Luo, T.; Zhao, L.; Tang, Y.; Zou, X. Window Zooming–Based Localization Algorithm of Fruit and Vegetable for Harvesting Robot. IEEE Access 2019, 7, 103639–103649. [Google Scholar] [CrossRef]
- Wang, Y.; Zhu, X.; Ji, C. Machine Vision Based Cotton Recognition for Cotton Harvesting Robot. In Computer And Computing Technologies in Agriculture, Volume II; Li, D., Ed.; CCTA 2007. The International Federation for Information Processing; Springer: Boston, MA, USA, 2008; Volumn 259. [Google Scholar]
- Sun, L.; Meng, X.; Xu, J.; Tian, Y. An image segmentation method using an active contour model based on improved SPF and LIF. Appl. Sci. 2018, 8, 2576. [Google Scholar] [CrossRef]
- Sabzi, S.; Abbaspour-Gilandeh, Y.; García-Mateos, G.; Ruiz-Canales, A.; Molina-Martínez, J.M. Segmentation of apples in aerial images under sixteen different lighting conditions using color and texture for optimal irrigation. Water 2018, 10, 1634. [Google Scholar] [CrossRef]
- Miao, R.H.; Tang, J.L.; Chen, X.Q. Classification of farmland images based on color features. J. Vis. Commun. Image Represent. 2015, 29, 138–146. [Google Scholar] [CrossRef]
- Zhao, C.; Lee, W.S.; He, D. Immature green citrus detection based on colour feature and sum of absolute transformed difference (SATD) using colour images in the citrus grove. Comput. Electron. Agric. 2016, 124, 243–253. [Google Scholar] [CrossRef]
- Wang, C.; Tang, Y.; Zou, X.; SiTu, W.; Feng, W. A robust fruit image segmentation algorithm against varying illumination for vision system of fruit harvesting robot. Optik 2017, 131, 626–631. [Google Scholar] [CrossRef]
- Meylan, L.; Süsstrunk, S. Color image enhancement using a Retinex-based adaptive filter. In Proceedings of the CGIV 2004-Second European Conference on Color in Graphics, Imaging, and Vision and Sixth International Symposium on Multispectral Color Science, Aachen, Germany, 5–6 April 2004. [Google Scholar]
- Sabzi, S.; Abbaspour-Gilandeh, Y.; Hernandez-Hernandez, J.L.; Azadshahraki, F.; Karimzadeh, R. The use of the combination of texture, color and intensity transformation features for segmentation in the outdoors with emphasis on video processing. Agriculture 2019, 9, 104. [Google Scholar] [CrossRef]
- Xu, W.; Chen, H.; Su, Q.; Ji, C.; Xu, W.; Memon, M.S.; Zhou, J. Shadow detection and removal in apple image segmentation under natural light conditions using an ultrametric contour map. Biosyst. Eng. 2019, 184, 142–154. [Google Scholar] [CrossRef]
- Sengupta, S.; Lee, W.S. Identification and determination of the number of immature green citrus fruit in a canopy under different ambient light conditions. Biosyst. Eng. 2014, 117, 51–61. [Google Scholar] [CrossRef]
- Luo, L.; Tang, Y.; Zou, X.; Wang, C.; Zhang, P.; Feng, W. Robust Grape Cluster Detection in a Vineyard by Combining the AdaBoost Framework and Multiple Color Components. Sensors 2016, 16, 2098. [Google Scholar] [CrossRef] [PubMed]
- Xiong, J.; Liu, Z.; Lin, R.; Bu, R.; He, Z.; Yang, Z.; Liang, C. Green grape detection and picking-point calculation in a night-time natural environment using a charge-coupled device (CCD) vision sensor with artificial illumination. Sensors 2018, 18, 969. [Google Scholar] [CrossRef] [PubMed]
- Wang, C.; Tang, Y.; Zou, X.; Luo, L.; Chen, X. Recognition and matching of clustered mature litchi fruits using binocular charge-coupled device (CCD) color cameras. Sensors 2017, 17, 2564. [Google Scholar] [CrossRef]
- Wang, C.; Zou, X.; Tang, Y.; Luo, L.; Feng, W. Localisation of litchi in an unstructured environment using binocular stereo vision. Biosyst. Eng. 2016, 145, 39–51. [Google Scholar] [CrossRef]
- Hernández-Hernández, J.L.; García-Mateos, G.; González-Esquiva, J.M.; Escarabajal-Henarejos, D.; Ruiz-Canales, A.; Molina-Martínez, J.M. Optimal color space selection method for plant/soil segmentation in agriculture. Comput. Electron. Agric. 2016, 122, 124–132. [Google Scholar] [CrossRef]
- Clerici, M.T.P.S.; Kallmann, C.; Gaspi, F.O.G.; Morgano, M.A.; Martinez-Bustos, F.; Chang, Y.K. Physical, chemical and technological characteristics of Solanum lycocarpum A. St.-HILL (Solanaceae) fruit flour and starch. Food Res. Int. 2011, 44, 2143–2150. [Google Scholar] [CrossRef]
- Goldberg, D.E.; Holland, J.H. Genetic Algorithms and Machine Learning. Mach. Learn. 1988, 3, 95–99. [Google Scholar] [CrossRef]
- Goldberg, D. Real-coded genetic algorithms, virtual alphabets, and blocking. Complex. Syst. 1991, 5, 139–167. [Google Scholar]
- Mitchell, M. An Introduction to Genetic Algorithms (Complex. Adaptive Systems); MIT Press: Cambridge, MA, USA, 1998. [Google Scholar]
- Montana, D.J.; Davis, L. Training Feedforward Neural Networks Using Genetic Algorithms. In Proceedings of the Eleventh International Joint Conference on Artificial Intelligence, Detroit, MI, USA, 20–25 August 1989. [Google Scholar]
- Ali, M.Z.; Awad, N.H.; Suganthan, P.N.; Duwairi, R.M.; Reynolds, R.G. A novel hybrid Cultural Algorithms framework with trajectory-based search for global numerical optimization. Inf. Sci. 2016, 334, 219–249. [Google Scholar] [CrossRef]
- Atashpaz-Gargari, E.; Lucas, C. Imperialist competitive algorithm: An algorithm for optimization inspired by imperialistic competition. In Proceedings of the 2007 IEEE Congress on Evolutionary Computation, CEC, Singapore, 25–28 September 2007. [Google Scholar]
- Sabzi, S.; Abbaspour-Gilandeh, Y.; García-Mateos, G. A fast and accurate expert system for weed identification in potato crops using metaheuristic algorithms. Comput. Ind. 2018, 98, 80–89. [Google Scholar] [CrossRef]
- Lee, K.S.; Geem, Z.W. A new meta-heuristic algorithm for continuous engineering optimization: Harmony search theory and practice. Comput. Methods Appl. Mech. Eng. 2005, 194, 3902–3933. [Google Scholar] [CrossRef]
- Cortes, C.; Vapnik, V. Support-Vector Networks. Mach. Learn. 1995, 20, 273–297. [Google Scholar] [CrossRef]
- Altman, N.S. An introduction to kernel and nearest-neighbor nonparametric regression. Am. Stat. 1992, 43, 175–185. [Google Scholar]
- Fix, E.; Hodges, J.L., Jr. Discriminatory Analysis-Nonparametric Discrimination: Consistency Properties; University of California: Berkeley, CA, USA, 1951. [Google Scholar]
- Hart, P. The condensed nearest neighbor rule. IEEE Trans. Inf. Theory 1968, 18, 515–516. [Google Scholar] [CrossRef]
- Kemsley, E.K. Discriminant analysis of high-dimensional data: A comparison of principal components analysis and partial least squares data reduction methods. Chemom. Intell. Lab. Syst. 1996, 33, 47–61. [Google Scholar] [CrossRef]
- Carrillo-De-Gea, J.M.; García-Mateos, G. Detection of normality/pathology on chest radiographs using LBP. In Proceedings of the BIOINFORMATICS 2010-Proceedings of the 1st International Conference on Bioinformatics, Valencia, Spain, 20–23 January 2010. [Google Scholar]
- Guijarro, M.; Riomoros, I.; Pajares, G.; Zitinski, P. Discrete wavelets transform for improving greenness image segmentation in agricultural images. Comput. Electron. Agric. 2015, 118, 396–407. [Google Scholar] [CrossRef]
- Hernández-Hernández, J.L.; Ruiz-Hernández, J.; García-Mateos, G.; González-Esquiva, J.M.; Ruiz-Canales, A.; Molina-Martínez, J.M. A new portable application for automatic segmentation of plants in agriculture. Agric. Water Manag. 2017, 183, 146–157. [Google Scholar] [CrossRef]
- Aquino, A.; Diago, M.P.; Millán, B.; Tardáguila, J. A new methodology for estimating the grapevine-berry number per cluster using image analysis. Biosyst. Eng. 2017, 156, 80–95. [Google Scholar] [CrossRef]
- Tang, J.L.; Chen, X.Q.; Miao, R.H.; Wang, D. Weed detection using image processing under different illumination for site-specific areas spraying. Comput. Electron. Agric. 2016, 122, 103–111. [Google Scholar] [CrossRef]

| Number | Date | Time | Weather Condition | Light Intensity (lux) | Length (Minutes) | Number of Pixels Extracted |
|---|---|---|---|---|---|---|
| 1 | 2018-7-9 | 10:25 | Sunny | 1769 | 01:02 | 3924 |
| 2 | 2018-7-16 | 18:45 | Cloudy | 593 | 00:50 | 3146 |
| 3 | 2018-7-20 | 20:15 | Evening | 826 | 01:10 | 4430 |
| 4 | 2018-7-27 | 15:45 | Sunny | 2078 | 00:50 | 3146 |
| 5 | 2018-8-1 | 6:45 | Morning | 287 | 00:58 | 3671 |
| 6 | 2018-8-6 | 17:35 | Sunny | 1563 | 01:58 | 7468 |
| 7 | 2019-7-6 | 17:30 | Cloudy | 342 | 00:45 | 2848 |
| 8 | 2019-7-11 | 11:45 | Sunny | 1689 | 00:54 | 3418 |
| 9 | 2019-7-14 | 13:45 | Sunny | 1963 | 01:15 | 4747 |
| 10 | 2019-7-18 | 7:15 | Morning | 467 | 00:58 | 3671 |
| 11 | 2019-7-25 | 20:30 | Evening | 639 | 01:15 | 4767 |
| 12 | 2019-7-29 | 15:15 | Cloudy | 738 | 01:05 | 4111 |
| Color Model | Channel | Transformation from RGB |
|---|---|---|
| V | V = M ; with M = max{R,G,B} ; m = min{R,G,B}; p = 60·m/M | |
| HSV | S | S = (M − m)/M |
| H | H = { p(G-B) if M = R ; 120 + p(B-R) if M=G ; 240 + p(R-G) if M=B } | |
| HLS | L | L = (M+m)/2 |
| S | S = (M-m)/min{M+m, 2-M-m} | |
| HSI | I | I = (R+G+B)/3 |
| S | S = 255 − m/I | |
| L* | L* = { 116·Y1/3 if Y > k ; 903.3·Y if Y ≤ k } with k = 0.008856 | |
| L*a*b* | a* | a* = 500(f(X) − f(Y)) with f(t) = {t1/3 if t > k ; 7.787t + 0.1379 if t ≤ k } |
| b* | b* = 200(f(Y) − f(Z)) | |
| L*u*v* | u* | u* = 13·L*·(4X/(X+15Y+3Z) − 0.197939) |
| v* | v* = 13·L*·(9Y/(X+15Y+3Z) − 0.468311) | |
| XYZ | X | X = 0.607·R + 0.174·G + 0.200·B |
| Y | Y = 0.299·R + 0.587·G + 0.114·B | |
| Z | Z = 0.066·G + 1.116·B | |
| YCrCb | Cr | Cr = 0.713·(R − Y) + 128 |
| Cb | Cb = 0.564·(B − Y) + 128 | |
| YUV | U | U = −0.14713·R − 0.28886·G + 0.436·B |
| V | V = 0.615·R − 0.51499·G − 0.10001·B | |
| YIQ | I | I = −0.595716·R − 0.274453·G − 0.321263·B |
| Q | Q = 0.211456·R − 0.522581·G − 0.311135·B | |
| CMY | C | C = 255 − R |
| M | M = 255 − G | |
| Y | Y = 255 − B | |
| L*C*h | C* | C* = [ (a*)2 + (b*)2 ]1/2 |
| h | h = tan−1 (b*/a*) |
| Number of Layers | Number of Neurons | Transfer Function | Backpropagation Network Training Function | Backpropagation Weight/Bias Learning Function |
|---|---|---|---|---|
| 1 | First Layer: 10 | First Layer: tangent sigmoid | Levenberg-Marquardt | LVQ1 weight learning function |
| Number of Layers | Number of Neurons | Transfer Function | Backpropagation Network Training Function | Backpropagation Weight/Bias Learning Function |
|---|---|---|---|---|
| 2 | First layer: 10 Second layer: 20 | First layer: tangent sigmoid Second layer: tangent sigmoid | Levenberg-Marquardt | Gradient descent with momentum |
| Number of Layers | Number of Neurons | Transfer Function | Backpropagation Network Training Function | Backpropagation Weight/Bias Learning Function |
|---|---|---|---|---|
| 2 | First layer: 13 Second layer: 24 | First layer: tangent sigmoid Second layer: triangular basis | Conscience bias | BFGS quasi-Newton backpropagation |
| Classification Method | Real/Obtained Class | Fruit | Background | Total Data | Classification Error per Class (%) | Correct Classification Rate (%) |
|---|---|---|---|---|---|---|
| ANN-ICA | Fruit | 1,283,547 | 44,638 | 1,328,185 | 3.36 | 98.28 |
| Backgr. | 25,189 | 2,717,726 | 2,742,915 | 0.918 | ||
| ANN-HS | Fruit | 1,281,556 | 46,629 | 1,328,185 | 3.51 | 98.24 |
| Backgr. | 22,287 | 2,720,628 | 2,742,915 | 0.813 | ||
| SVM | Fruit | 1,301,672 | 26,513 | 1,328,185 | 1.99 | 98.49 |
| Backgr. | 34,989 | 2,707,926 | 2,742,915 | 1.28 | ||
| kNN | Fruit | 1,297,335 | 30,850 | 1,328,185 | 2.32 | 98.50 |
| Backgr. | 30,342 | 2,712,573 | 2,742,915 | 1.11 | ||
| LDA | Fruit | 1,197,201 | 130,984 | 1,328,185 | 9.86 | 96.57 |
| Backgr. | 8,581 | 2,734,334 | 2,742,915 | 0.313 | ||
| Voting | Fruit | 1,247,066 | 81,119 | 1,328,185 | 6.12 | 97.68 |
| with LDA | Backgr. | 13,163 | 2,729,752 | 2,742,915 | 0.480 | |
| Voting | Fruit | 1,298,650 | 29,535 | 1,328,185 | 2.22 | 98.59 |
| without LDA | Backgr. | 27,819 | 2,715,096 | 2,742,915 | 1.01 |
| Classification Method | Recall (%) | Specificity (%) | Precision (%) | F_Measure (%) | AUC (Mean ± Std. dev.) | Accuracy (Mean % ± Std. dev.) |
|---|---|---|---|---|---|---|
| ANN-ICA | 98.94 | 98.38 | 96.63 | 97.28 | 0.9976 ± 0.0027 | 98.28 ± 0.4719 |
| ANN-HS | 98.09 | 98.31 | 96.50 | 97.27 | 0.9974 ± 0.0036 | 98.24 ± 0.3266 |
| SVM | 97.38 | 99.03 | 98.00 | 97.69 | 0.9826 ± 0.0013 | 98.49 ± 0.0962 |
| kNN | 97.71 | 98.87 | 97.68 | 97.70 | 0.9829 ± 0.0014 | 98.50 ± 0.1237 |
| LDA | 99.29 | 95.43 | 90.14 | 94.49 | 0.9983 ± 0.0002 | 96.57 ± 0.1386 |
| Voting w. LDA | 98.95 | 97.11 | 93.89 | 96.36 | 0.9670 ± 0.0313 | 97.68 ± 1.9820 |
| Voting wo. LDA | 98.92 | 97.90 | 98.98 | 98.95 | 0.9830 ± 0.0013 | 98.59 ± 0.0940 |
| Method | Number of Samples | Correct Classification Rate (%) |
|---|---|---|
| Proposed in this study | 14,804 | 98.59 |
| Sabzi et al. (2018) [9] | 210,752 | 96.80 |
| Aquino et al. (2017) [39] | 152 | 95.72 |
| Tang et al. (2016) [40] | 100 | 92.5 |
| Zhao et al. (2016) [11] | 68 | 83 |
© 2019 by the authors. Licensee MDPI, Basel, Switzerland. This article is an open access article distributed under the terms and conditions of the Creative Commons Attribution (CC BY) license (http://creativecommons.org/licenses/by/4.0/).
Share and Cite
Pourdarbani, R.; Sabzi, S.; Hernández-Hernández, M.; Hernández-Hernández, J.L.; García-Mateos, G.; Kalantari, D.; Molina-Martínez, J.M. Comparison of Different Classifiers and the Majority Voting Rule for the Detection of Plum Fruits in Garden Conditions. Remote Sens. 2019, 11, 2546. https://doi.org/10.3390/rs11212546
Pourdarbani R, Sabzi S, Hernández-Hernández M, Hernández-Hernández JL, García-Mateos G, Kalantari D, Molina-Martínez JM. Comparison of Different Classifiers and the Majority Voting Rule for the Detection of Plum Fruits in Garden Conditions. Remote Sensing. 2019; 11(21):2546. https://doi.org/10.3390/rs11212546
Chicago/Turabian StylePourdarbani, Razieh, Sajad Sabzi, Mario Hernández-Hernández, José Luis Hernández-Hernández, Ginés García-Mateos, Davood Kalantari, and José Miguel Molina-Martínez. 2019. "Comparison of Different Classifiers and the Majority Voting Rule for the Detection of Plum Fruits in Garden Conditions" Remote Sensing 11, no. 21: 2546. https://doi.org/10.3390/rs11212546
APA StylePourdarbani, R., Sabzi, S., Hernández-Hernández, M., Hernández-Hernández, J. L., García-Mateos, G., Kalantari, D., & Molina-Martínez, J. M. (2019). Comparison of Different Classifiers and the Majority Voting Rule for the Detection of Plum Fruits in Garden Conditions. Remote Sensing, 11(21), 2546. https://doi.org/10.3390/rs11212546