Abstract
Assessing forest degradation has been a challenging task due to the generally slow-changing nature of the process, which demands long periods of observation and high frequency of records. This research contributes to efforts aimed at detecting forest degradation by analyzing the trend component of the time series of Leaf Area Index (LAI) collected by the Moderate Resolution Imaging Spectroradiometer (MODIS) over Central Mexico from 2002 to 2017. The analysis of the trend component is proposed to overcome the challenge of identifying very subtle and gradual changes that can be undetected if only the raw time series is examined. Additionally, the use of LAI as an alternative to other widely used indexes (e.g., Normalize Difference Vegetation Index and Enhanced Vegetation Index) facilitates consideration of the structural changes evident from degradation though not necessarily observable with spectral indices. Overall, results indicate that 52% of the study area has experienced positive trends of vegetation change (i.e., increasing LAI), 37% has remained unchanged, and 11% exhibits some level of forest degradation. Particularly, the algorithm estimated that 0.6% (385 km2) is highly degraded, 5.3% (3406 km2) moderately degraded, and 5.1% (3245 km2) slightly degraded. Most of the moderate and highly degraded areas are distributed over the east side of the study area and evergreen broadleaf appears to be the most affected forest type. Model validation resulted an accuracy of 63%. Some actions to improve this accuracy are suggested, but also a different approach to validate this type of study is suggested as an area of opportunity for future research.
1. Introduction
Forest ecosystems play an essential role maintaining the carbon cycle balance because they are able to store carbon [1]. However, when these ecosystems are perturbed, stored carbon is released as carbon dioxide (CO2) into the atmosphere, where it contributes to global warming by absorbing heat and impeding transmission to space. The assessment of forest degradation depends on how “forest” and “forest degradation” are defined. Both concepts, which have been the subject of extensive debates [2,3], have been defined by many institutions based on particular perspectives and purposes. In this research, forests are “lands dominated by woody vegetation with a percent cover of more than 60 percent and height exceeding 2 meters” [4], which is in agreement with the definition used by the Moderate Resolution Imaging Spectroradiometer (MODIS) land cover product (MCD12Q1). Regarding forest degradation, this paper adopts a simple but comprehensive approach for which context needs to be provided.
Definitions from international organizations, such as the Intergovernmental Panel on Climate Change (IPCC) and the United Nations Food and Agriculture Organization (FAO), share a set of basic notions which describe forest degradation as a process that involves a long-term observation period in which negative changes affect the forest’s structure, function, and capacity to provide services and goods [3,5,6,7,8,9,10]. Within the literature on remote sensing of forest dynamics, forest degradation is frequently embedded in the context of forest disturbances, which are described as drivers of a forest’s state and function that range from high-impact events (e.g., caused by fires, windstorms, deforestation) to subtle and gradual processes (e.g., caused by insects, diseases, droughts, acid rain) [11]. As far as we are aware, the scientific literature lacks an explicit explanation of the relationship between forest degradation and forest disturbances. However, according to the forest disturbances definition, forest degradation is a type of disturbance and other disturbances can eventually lead to forest degradation. Therefore, this research considers forest degradation as any negative monotonic (i.e., single direction), not necessarily linear, trend in vegetation greenness. This includes any disturbances that are not associated with a recovery process during the period of observation. Special attention is given to changes that are very subtle and become apparent gradually, as they have traditionally been hard to monitor.
Although not used as frequently as Landsat (see [11] for examples of Landsat-based algorithms), MODIS has been employed to detect forest disturbances, including forest degradation. MODIS-based algorithms make use of surface reflectance [12,13,14,15], Percent Tree Cover (PTC) [16], fires and thermal anomalies [17], and a variety of spectral indexes, such as the Normalized Difference Vegetation Index (NDVI) [17,18], the Normalized Burned Ratio (NBR) [19], the Modified Soil Adjusted Vegetation Index (MSAVI) [20], and the Enhanced Vegetation Index (EVI) together with Land Surface Temperature (LST) [21,22,23]. Some authors combine a broad range of MODIS products into a single algorithm. For example, [24] used surface reflectance, NDVI, the Wide Dynamic Range Vegetation Index (WDVI), the Soil Adjusted Vegetation Index (SAVI), the Global Environment Monitoring Index (GEMI), the Reduced Simple Ratio (RSR), and the Normalized Difference Moisture index (NDMI) to train a decision tree classifier. Unlike other vegetation greenness indicators, such as NDVI and EVI, Leaf Area Index (LAI) has not been tested to assess forest disturbances. LAI is a measure of the amount of vegetation vertically distributed and is formally defined as the total one-sided area of all green leaves per unit ground area in broadleaf canopies, and as the total surface area of just one half of all needles per unit ground area in coniferous canopies [25]. In theory, the higher the LAI values, the denser the vegetation vertical structure and, as a consequence, the greater the surface potentially available for photosynthesis. Thus, this research proposes to use time series of LAI, which may provide a good description of forest conditions through time.
MODIS-based algorithms have identified forest disturbances through linear trend analysis [17], temporal segmentation [19], regression and decision trees [24,26,27], unsupervised classifications [12], linear combinations of the pixel components [20], Tasseled Cap transformations [14,15,28], and multitemporal analysis of surface temperature and vegetation greenness ratios [21,22,23]. A considerable number of algorithms have fused MODIS with Landsat data to improve the detection of forest disturbances [13,15,28,29]. To the best of our knowledge, no MODIS-based algorithms have decomposed LAI time series to extract and analyze the trend component. Time series decomposition procedures were developed within the field of econometrics; however, environmental sciences have adopted these techniques to study different processes, including ecosystem changes [30] and vegetation dynamics [31,32]. Often, time series are assumed to be comprised of three basic components; “trend”, “seasonal”, and “remainder”. The trend component improves the identification of very subtle and gradual changes because it extracts low frequency changes that occur throughout the time series [33].
Therefore, this study aims to assess forest degradation by analyzing, on a pixel-by-pixel basis, the trend component of MODIS LAI time series collected over Central Mexico from 2002 to 2017. To achieve this objective, a time series decomposition procedure based on regression is applied to extract the trend component, whose strength and magnitude are calculated through a modified Mann–Kendall non-parametric test and the Theil–Sen slope test, respectively. The product of the strength and magnitude is proposed as a measure of forest degradation. The validation is performed by comparing the overall trend analysis with an analogous trend analysis of a health index, which was developed for the specific purposes of this research and is calculated using reference data from the Mexico’s National Forest and Soils Inventory (NFSI).
2. Materials and Methods
2.1. Study Area
Due to the multitemporal nature of this work, the study area encompassed all 500 m pixels contained in the MODIS tile h08v06 that were covered by forest during at least one year between 2002 and 2017 (Figure 1). According to the MODIS Land Cover product (MCD12Q1, type 3), these pixels comprised 63,964 km2, 60% of which corresponded to deciduous broadleaf forest, 36% to evergreen broadleaf, and 4% to evergreen needleleaf. These forests are home to a wide variety of species (in the order of hundreds), some of the most commonly found include Quercus magnoliifolia, Quercus rugosa, Quercus laeta, Quercus sideroxyla, Pinus durangensis, Abies sp., Lysiloma divaricatum, Laguncularia racemosa, Byrsonima crassifolia, Beilschmiedia mexicana, and Guazuma ulmifolia [34].
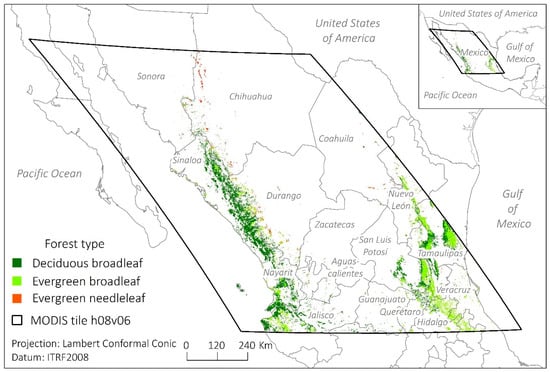
Figure 1.
Study area: pixels covered by forest during at least one year between 2002 and 2017. Moderate Resolution Imaging Spectroradiometer(MODIS).
This vegetation is primarily distributed across the Sierra Madre Occidental (west mountain range) and Sierra Madre Oriental (east mountain range). In the western region, elevation ranges from sea level to 3104 m with a mean of 972 m and a standard deviation of 742 m, while slopes range from 0 to 30° with a mean of 6.9° and a standard deviation of 4.5°. In the eastern region, the altitudinal range is wider, it goes from sea level to 3300 m with a mean of 1067 m and a standard deviation of 684 m, while slopes range from 0 to 35° with a mean of 6.9° and a standard deviation of 5°.
The climatic conditions range from tropical to semi-cold. Tropical and semi-tropical climates, whose mean annual temperature exceeds 18 °C, extend over most of the areas facing the coastal plains and cover 41% and 35% of the study area, respectively. Temperate climate, whose mean annual temperature oscillates between 12 and 18 °C, extends over higher elevations and covers 13% of the study area. Arid climates are generally found towards continental areas and represent 8% of the study area. The highest elevations are occupied by semi-cold climates, which cover the remaining 3% of the study area.
In Mexico, nearly 60% of the forest lands are owned by ejidos (i.e., a tenurial system in which land is managed collectively) or agrarian communities [35], where forests are often managed for timber production. The remaining forested areas are managed by private property owners and, in a smaller proportion, by the government in the form of natural protected areas [36,37]. In the study area, about 50% of the land is managed by ejidos. Although this proportion is lower than at national level, ejidos are the dominant land tenure units.
Central Mexico was chosen as the study area for three reasons. First, studies focused on detecting forest disturbances or degradation in Mexico have been conducted primarily at local scales [16,38,39,40,41] and rarely at a regional scale [22] like this study. Second, according to [37], the levels of human disturbance in Mexican forest are significantly high. Third, according to the Land Use and Vegetation Map produced by the Instituto Nacional de Geografía y Estadística (INEGI), 14,900 km2 (23%) of the study area was covered by perturbed secondary vegetation in 2014 [42].
2.2. Data and Preprocessing
LAI, the ratio of half of the total leaf surface area per unit ground area, is a dimensionless measure that ranges from 0 (e.g., bare ground) to over 10 (e.g., dense forest) [43]. In this research, LAI estimates were acquired from the MODIS sensor onboard the Terra satellite. The morning overpass time of Terra (at approximately 10:30 at the equator) provides more reliable LAI estimates than the afternoon overpass time of Aqua (at approximately 13:30) due to lower cloud presence [44]. A visual comparison of the Terra and Aqua cloud fractions was performed by [45], who found a generally cloudier pattern over land in the Aqua products.
MODIS LAI is released in conjunction with Fraction of Photosynthetically Active Radiation (FPAR) in a single product. Both variables are estimated from an algorithm based on a tridimensional (i.e., it accounts for vegetation structure) radiative transfer model that selects the best LAI and FPAR estimates by comparing measured spectral values (from the red and near-infrared regions) with a look-up table that contains observed spectral values of six biome types and their corresponding LAI/FPAR values. This main algorithm may fail to obtain a solution due to large uncertainties in the input spectral values, cloud effects, or too low sun/view zenith angles. In this case, the retrievals, with relatively poor quality, are produced from a back-up algorithm based on the biome-specific empirical relationship between NDVI and LAI/FPAR [25,44,46,47,48]. According to [44], Collection 6 (C6) of the MODIS LAI/FPAR product is considerably better than Collection 5 (C5). C6 properly captures the interannual variation of LAI, as well as the general seasonality of all biomes, except for evergreen broadleaf forests, where poor quality retrievals are produced. However, this shortcoming is also observed in other satellite products, such as the Carbon cYcle and Change in Land Observational Products from an Ensemble of Satellites (CYCLOPES) and those from the Global Land Surface Satellite (GLASS), and the SPOT-VEGETATION GEOV1 system.
MODIS data were acquired through the Land Processes Distributed Active Archive Center (LP DAAC) managed by the NASA Earth Science Data and Information System (ESDIS) project. Based on the characteristics mentioned, MODIS Terra 8-day LAI/FPAR composites (MOD15A2H, C6) of the tile h08v06 were downloaded from 2002 to 2017 at 500 meters spatial resolution. To extract forest land covers, MODIS Terra + Aqua yearly Land Cover composites (MCD12Q1, C6) were also obtained for the same area and time period, and at the same spatial resolution. The preprocessing steps that are described below were conducted by means of ArcPy, a site package that allows for the use of ArcGIS functionalities through the Python programming language.
All datasets were projected to Lambert Conformal Conic projection in ITRF2008 datum and clipped to forested areas, which were delimited by identifying all pixels covered by forest during at least one year between 2002 and 2017. In the few cases for which the type of forest changed between years, the most frequent forest type was assigned. Only good quality LAI retrievals (i.e., obtained from the main algorithm) were selected to perform the analysis. The Land Data Operational Product Evaluation (LDOPE) tool was used to unpack the LAI Quality Control layers, which specify the type of algorithm used to derive the retrievals. Once the good quality values were extracted, monthly LAI means were calculated on a pixel-by-pixel basis for each month from January 2002 to December 2017. Finally, in order to manipulate the data in an R environment, all LAI means were extracted from the raster files and rearranged into a comma-separated values (CVS) file, where each row contained the monthly LAI time series of a single pixel. Due to the exclusion of poor-quality retrievals, 0.5% of the pixels (1505) were discarded from the analysis.
2.3. Algorithm to Analyse LAI Trends
A seasonal-trend decomposition procedure based on regression (STR; see [33] for a complete description of the procedure) was used to break down the time series (, where is time) into trend (), seasonal (), and remainder () components. In a given time series (Figure 2a), the simplest STR model considers these components to be additive:
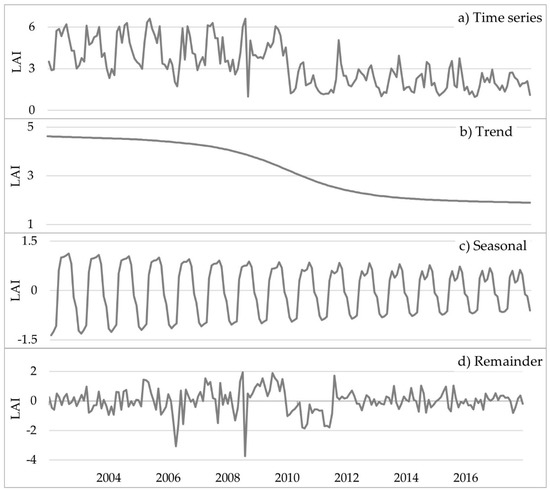
Figure 2.
Example of the decomposition of a time series (a) into trend (b), seasonal (c), and reminder (d) components.
The trend component (Figure 2b) describes low frequency non-stationary long-term changes. The seasonal component (Figure 2c) shows a stable repeating pattern of change; thus, represents only one element of the seasonal pattern, while represents a k x n matrix of seasonal shapes, where k is the number of seasons and n is the length of the time series. The remainder (Figure 2d) depicts variations considered as a normally distributed white noise process with mean zero and variance [33,49,50,51,52].
The trend (Figure 2b), which is the component of interest in this research, can be modeled as a local approximation to a linear trend:
where and are normally distributed independent white noise processes with mean zero and variance and , respectively. The level and slope change slowly over time based on a random walk mechanism [49]. The reason behind analyzing the trend lies on the nature of the component. Its low frequency, non-stationary behavior, and small rate of change in a long-term basis allows for the identification of very subtle and gradual changes that may otherwise be obscured.
Using the “stR” package [53] in an R environment [54], trend components were extracted in the form of a new time series with as many values as the original time series. These new sets of values may or may not exhibit a general increase or decrease. This means that, in some cases, the trend component may actually show that the time series does not exhibit a trend. Therefore, to evaluate the presence of a monotonic trend in the trend component, a modified Mann–Kendall test for serially-correlated data [55,56,57] was applied. This non-parametric test evaluates the null hypothesis of independent and randomly ordered observations (i.e., no trend).
The original Mann–Kendall [55,56] test determines if the Y variable (in this case LAI) tends to increase or decrease as the X variable (time) increases. To achieve this, data were ordered chronologically and a Kendall’s correlation coefficient was computed as follows:
where is the number of observations and is the test statistic, which is calculated by subtracting , the number of “discordant pairs of observations”, from , the number of “concordant pairs of observations”. In , the later-in-time observation has a smaller value than the previous observation (i.e., Y decreases as X increases); while in , the later-in-time observation has a larger value that the previous observation (i.e., Y increases as X increases). A total of pairs of observations are possible. If half of the pairs are concordant and half discordant, so that , will equal 0 (i.e., no trend). If all pairs are concordant, so that , will equal 1 (i.e., strong increasing trend). In contrast, if all pairs are discordant, so that , will equal −1 (i.e., strong decreasing trend). Therefore, produces values, from −1 to 1, that show the strength of the monotonic association between the variable of interest (Y) and time (X) [58].
The significance of the trends is evaluated by comparing the standardized statistic, , with the standard normal variate at the desired level or significance. Under the null hypothesis of trend absence, the statistic tends to show zero mean and variance . However, the variance of and, as a consequence, the p values are affected when serial correlation is detected. A positive serial correlation increases the probability of detecting a significant trend when it actually does not exist, while a negative serial correlation decreases the probability of detecting a significant trend when it actually exists [57]. A rank von Neumann ratio test [59], which assesses the null hypothesis of randomness, corroborated the presence of serial correlation in the extracted trend components of this study. Therefore, a variance correction approach, proposed by [57], was implemented to address the issue of serial correlation and, consequently, generate the correct p values.
As explained, the modified Mann–Kendall test detects significant monotonic trends and provides a measure of their strength (i.e., how consistently decreasing or consistently increasing they are) through the Kendall’s correlation coefficient. However, it does not specify their magnitude (i.e., how much they change). To account for the magnitude, a Theil–Sen’s slope [60,61], which estimates a monthly rate of change that can be used to calculate the absolute change over the study period, was obtained by computing a set of = slope values [62]:
and then finding the median of those slopes:
The “modifiedmk” R package [63] was used to calculate the Mann–Kendall p value, the Kendall’s correlation coefficient, and the Theil–Sen slope for each of the trend components. After exploring the overall results and computing the occurrence of positive versus negative significant trends, a subset of negative trends was created for a deeper analysis. Negative trends are potential indicators of forest degradation. However, consistently decreasing trends alone (i.e., negative Kendall’s correlation coefficients) cannot be considered processes of forest degradation because their magnitude of change may be insignificant. Similarly, negative magnitudes alone (i.e., Theil–Sen slopes) cannot be considered processes of forest degradation because their rate of change may be weakly monotonic and, therefore, not representative of a typical process of forest degradation. Therefore, the product of negative Kendall’s correlation coefficients and negative Theil–Sen slopes is here proposed as a measure of forest degradation. This measure facilitates the identification of consistently decreasing trends with high magnitudes of change, which can be interpreted as severe processes of forest degradation. As a rule, the higher the product, the greater the degradation severity. The outcomes of the multiplication were reclassified into three categories of severity (i.e., high, moderate, and low) based on a geometrical interval classification method, which performs well with non-normally distributed data.
2.4. Validation of the Algorithm
To validate the results, the health conditions of 52,807 trees collected in 177 conglomerates were used as reference data [34]. This information was gathered between 2004 and 2017 by the Comisión Nacional Forestal (CONAFOR) as part of Mexico’s National Forest and Soils Inventory (NFSI). A simple trend analysis of the tree conditions was performed and compared with the proposed measure of forest degradation. The Mexico’s NFSI is completely updated every five years by revisiting 20% of the sampling conglomerates every year. Within the study area, there are approximately 1540 conglomerates separated from each other by roughly 5 km. These conglomerates have been measured two or, in a few cases, three times during the study period. Based on these spatio-temporal characteristics, only conglomerates that have been visited three times and whose centroids fall within a buffer of 150 m around the center of the MODIS pixels were considered for the analysis. The first criterion responds to the necessity of at least three observations to perform a trend analysis. The second criterion ensures that the conglomerates are representative of what the Instantaneous Field of View (IFOV) of the MODIS pixels captures. In other words, it warrants spatial coincidence.
The 177 conglomerates that meet the two aforementioned criteria mimic the distribution of the original systematically collected NFSI data. Therefore, they are representative of the overall characteristics of the area (i.e., forest type, altitude, slope, climate). Each conglomerate contains four sampling sites that are distributed in an inverted “Y” shape and whose centroids are separated by 45.14 m. Each site has an area of 400 m2 and a radius of 11.28 m. The health conditions of all trees falling within this area and having diameter greater than 7.5 cm were recorded. As a result, 13,905 trees were measured during the NFSI 2004–2009 in the 177 conglomerates, 15,730 during the NFSI 2009–2014, and 23,172 during the first 3 years of the NFSI 2014–2019. Two classification systems were used to record the tree conditions. The first system, employed for the NFSI 2004–2009 and the NFSI 2009–2014, comprises the six following classes: stump, dead-standing, very poor vigor, poor vigor, good vigor, and maximum vigor. The second system, used for the NFSI 2014–2019, comprises the five following classes: stump, dead-standing, low vigor, moderate vigor, and high vigor. This incompatibility between classification schemes implies a limitation that is addressed in Section 4.3. For the purposes of this validation, the conditions from the two classification schemes were unified as follows: stump, dead-standing, very poor or low, poor, moderate, good, and maximum or high.
To obtain a single measure representative of all trees within each conglomerate, a health index was developed. First, the number and proportion of trees within each class was calculated. Then, the proportion was multiplied by the weight of the class (i.e., stump = 1, dead-standing = 2, very poor or low vigor = 3, poor vigor = 4, moderate vigor = 4.5, good vigor = 5, and maximum or high vigor= 6). The resulting values were summed to obtain an overall index that ranges from 1 to 6, where 6 is the optimum vigor condition (Table 1).

Table 1.
Example of health index calculation in a selected conglomerate (conglomerate ID 39373, National Forest and Soils Inventory (NFSI) 2004–2009).
Once three index values were computed per conglomerate (i.e., one per observation date), the presence of trends was evaluated by looking at the sign of the differences between two consecutive index values (later date minus earlier date). As there are three observations, two differences were calculated. When these differences share the same sign, a given location exhibits a trend, which is negative if both signs are negative and positive otherwise. The magnitude of change of all negative trends was calculated by subtracting the last observation from the first one and dividing the outcome by two. The resulting values were reclassified into three categories of severity (i.e., low, moderate, and high) based on a geometrical interval classification method. According to this methodology, each conglomerate can take one of the following classes: no trend, positive trend, low degradation, moderate degradation, or high degradation (Table 2). By means of a confusion matrix, these results were compared with the results of the trend analysis proposed in this research.

Table 2.
Examples of trend analysis in selected conglomerates based on the calculated health index values.
3. Results
3.1. LAI Trends
To achieve the objective of detecting forest degradation in Mexican forested areas, the STR procedure was used to decompose 295,298 monthly LAI pixel-based time series comprised of 192 values into trend, seasonal, and remainder components. Only the trend component was extracted from each of the time series to evaluate the presence and strength of significant monotonic trends through a modified Mann–Kendall test proposed by [57]. Additionally, a Theil–Sen slope was calculated to estimate the magnitude of change of the significant trends.
The trend analysis resulted in 63% of the study area (187,424 pixels) exhibiting trends at a significance level of 0.05 or higher. Of these significant trends, 52% are positive (i.e., they show a positive Kendall’s correlation coefficient), while only 11% are negative (Figure 3). Particularly, evergreen broadleaf forest presents the highest proportion of negative trends (18%), followed by evergreen needleleaf (12%), and deciduous broadleaf (7%). Significant trends do not cluster in a specific area, their distribution is regular across all the study area (Figure 4a). The majority of negative trends are located over the eastern portion of the study area (Figure 4b). The overall magnitude of change, measured by the Theil–Sen slope, ranges from −0.026 to 0.021 LAI/month and presents a median of 0.001 LAI/month. The steepest negative slopes are predominantly located in the state of Tamaulipas (eastern region), which, together with the state of Nayarit (western region), is also scenario of the steepest positive slopes. Lower magnitudes are located along the highest elevations of the Sierra Madre Oriental (east mountain range), as well as over the western states of Sinaloa and Durango (Figure 4c).
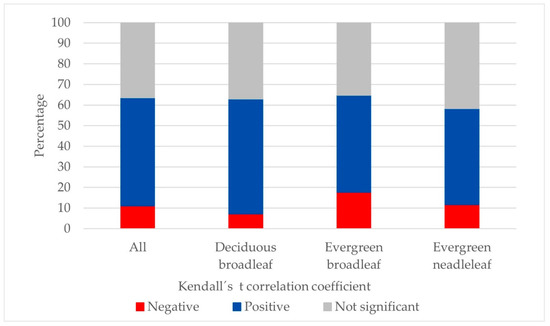
Figure 3.
Direction of trends at 95% confidence level per forest type, 2002–2017.
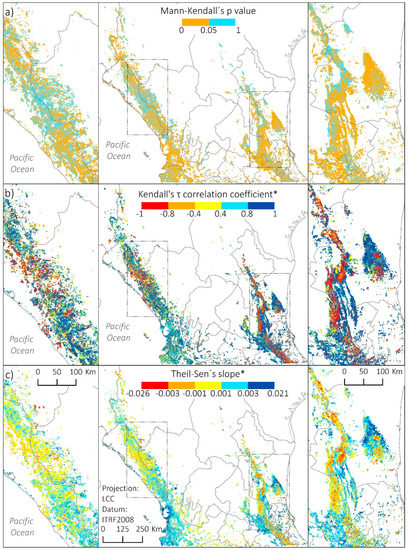
Figure 4.
Significance of all trends (a). Strength (b) and magnitude (c) of trends at 95% confidence level or higher, 2002–2017.
Figure 3 and Figure 4 provide context of the occurrence of negative trends (potential indicators of forest degradation), which extend over 7036 km2 and represent 11% of the study area. Two thirds of the negative trends present a strength of −1, which means that most of them display consistently decreasing trajectories; these trends are evenly distributed across the 7036 km2 (Figure 5a). The maximum negative magnitude is −0.0256 LAI/month and the median −0.0012 LAI/month, which are equivalent to an absolute change of −4.92 and −0.23 LAI units, respectively, between 2002 and 2017. Magnitudes are generally high in the east portion and generally low in the west (Figure 5b).
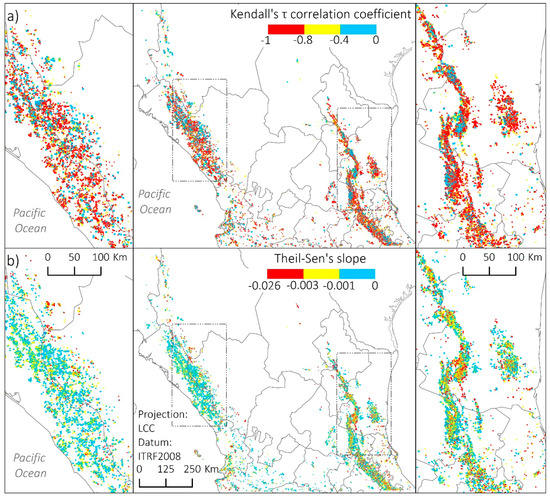
Figure 5.
Strength (a) and magnitude (b) of negative trends at 95% confidence level, 2002–2017. *The pixel size has been exaggerated for visualization proposes.
Forest degradation is presented as the dimensionless product of the strength and magnitude of negative trends (Figure 6). In this study area, the product ranges from 0 to 0.02 and was reclassified into three categories of severity (i.e., high, moderate, and low) based on a geometrical interval classification method. This classification method indicates that 385 km2 (0.6% of the study area) are highly degraded, while 3406 km2 (5.4%) and 3245 km2 (5.1%) are moderately and slightly degraded, respectively. Forest degradation is mostly low in the west and generally higher in the eastern region of Mexico, which is characterized by consistently decreasing trends with high magnitudes of change. Although the western portion also displays consistently decreasing trends (Figure 5a), the magnitudes of change are generally not high (Figure 5b). The most degraded areas are irregularly distributed along the Sierra Madre Oriental and, to a lesser extent, over southwest Chihuahua, the western fringe of Durango and Jalisco, and some isolated areas of Nayarit.
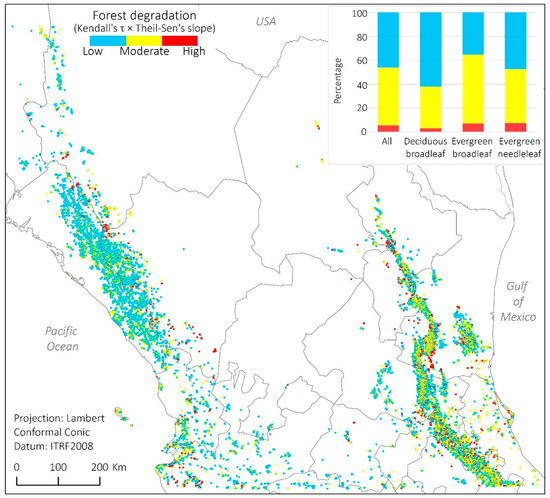
Figure 6.
Forest degradation based on the strength and magnitude of negative trends at 95% confidence level, 2002–2017. *The pixel size has been exaggerated for visualization proposes.
Regarding forest types, evergreen broadleaf has the highest median severity score of forest degradation (0.0011), followed by evergreen needleleaf (0.0008), and deciduous broadleaf (0.0006). In general, evergreen broadleaf forest is characterized by a combination of consistently decreasing trends with high magnitudes of change, evergreen needleleaf by a combination of irregularly decreasing trends with high magnitudes of change, and deciduous broadleaf by a combination of consistently decreasing trends with low magnitudes of change.
Evergreen needleleaf shows the highest proportion of highly degraded areas (8%), followed by evergreen broadleaf (7%), and deciduous broadleaf (3%, Figure 6). Deciduous broadleaf is almost free of highly degraded areas in the west part of the study area, but it presents a concentration of highly degraded pixels in the west portion, specifically over the state of Tamaulipas (Figure 7a). Evergreen broadleaf exhibits highly degraded pixels distributed throughout its range as well as a high proportion of moderately degraded pixels (Figure 7b). Unlike the other forest types, evergreen needleleaf displays more degraded areas in the east portion of the study area (Figure 7c).
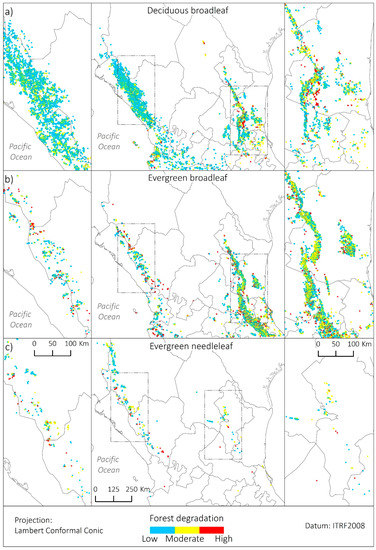
Figure 7.
Degradation of deciduous broadleaf forest (a), evergreen broadleaf forest (b), and evergreen needleleaf forest (c) based on the strength and magnitude of negative trends at 95% confidence level, 2002–2017. *The pixel size has been exaggerated for visualization proposes.
3.2. Validation
The comparison between the trend analysis of the MODIS LAI data and the reference data shows an overall agreement of 63%. This concordance between the remotely sensed products and the field observations is slightly better in the west side (69%) than in the east side (56%) of the study area (Figure 8). According to the confusion matrix (Table 3), the “high degradation” and “no trend” classes have the highest accuracy. All of the MODIS pixels classified as “high degradation” are actually highly degraded, while 81% of the MODIS pixels classified as “no trend” do not actually exhibit a significant trend. On the other hand, half of the reference data identified as highly degraded were correctly classified as “high degradation”, whereas 72% of the reference data without any trend were correctly classified as “no trend”.
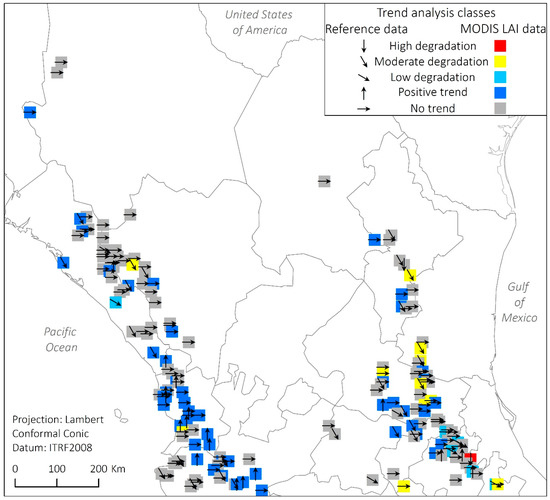
Figure 8.
Spatial comparison between the trend analysis of MODIS Leaf Area Index (LAI) data and the reference data.

Table 3.
Confusion matrix of the trend analysis of the MODIS LAI data and the reference data.
In contrast, the “moderate degradation” class exhibits the poorest accuracy. Forty five percent of the MODIS pixels classified as “moderate degradation” are actually moderately degraded and only 19% of the reference data identified as moderately degraded were correctly classified as “moderate degradation”. These pixels were erroneously classified as “no trend” and “positive trend”. Finally, the class with the highest contrast between accuracy types is “positive trend”. Although 78% of the reference positive trends were correctly classified as “positive trend”, only 27% of the MODIS pixels classified as “positive trend” exhibited positive trends.
4. Discussion
4.1. Potential Drivers of Forest Degradation
The objective of this research was to detect forest degradation through a trend analysis of monthly MODIS LAI collected over Central Mexico from 2002 to 2017. The overall results indicate that about half of the study area (52%, Figure 3) has exhibited positive trends of forest change, while the other half has either remained unchanged (37%) or experienced negative trends (11%). Of the 7036 km2 exhibiting negative trends, the proposed measure of forest degradation estimates that 385 km2 are highly degraded, 3406 km2 moderately degraded, and 3245 km2 slightly degraded. Most of the moderate and highly degraded areas are distributed over the east side of the study area (Figure 6) and evergreen broadleaf seems to be the most affected forest type (Figure 7).
The authors are not aware of other studies that examine vegetation trends at the regional scale in Mexico, which precludes a direct comparison of the results of this research. However, the set of INEGI’s Land Use and Vegetation Maps provides points of comparison. For example, this research reveals that 7036 km2 (11% of the study area) of the study area have experienced forest degradation between 2002 and 2017. According to the most recent INEGI’s cartography, 14,900 km2 (23%) were covered by perturbed secondary vegetation in 2014. Of that area, 12,787 km2 were already perturbed in 2002. As the level of disturbance of these areas is unknown for both dates, they could have experienced no changes, or slight negative or positive trends. In contrast, 1686 km2 were covered by undisturbed primary vegetation in 2002, which clearly translates into negative trends since in 2014 were classified as perturbed. The remaining 427 km2 were agriculture or water [42,64]. Thus, although this research and the INEGI’s cartography are not directly comparable, both show that important processes of forest degradation are of the order of a few thousands of km2.
In terms of spatial distribution, this research shows more severe levels of forest degradation in the eastern portion. The most common disturbance recorded by Mexico’s NFSI on this side of the study area is the presence of epiphytes, followed by drought and defoliating insects. On the western portion, the most frequent disturbance is fire, followed by logging and drought [34]. Although not all forest degradation can be attributed to these disturbances, they provide an indication of the factors affecting forest health in Central Mexico. For instance, changes in microclimate or vegetation structure may affect the abundance and distribution of epiphytes [65]. This seems to be a major problem because, although epiphytes do not obtain nutrients from their host as parasitic plants do, they use the host as support, which suffocates the branches and eventually kills the trees [66]. Drought has also been recorded as an important driver of forest disturbance. Indeed, in 2009 and 2011, Central Mexico suffered the most severe droughts in seven decades [67]. The effects of these droughts continue to affect the region and, according to [34], the impacts on forest vegetation have been most pronounced on the east side of the study area, where higher levels of forest degradation are encountered based on this research.
4.2. Methodological Approach
Assessing forest degradation has been a challenging task due to the generally slow-changing nature of the process, which demands long periods of observation with high frequency of records. In this research, the analysis of the trend component of monthly LAI time series helped to overcome the challenge of identifying subtle and gradual changes. This component extracts low frequency changes that occur throughout the time series. Figure 9 demonstrates how the proposed algorithm successfully classifies the trend components based on their strength and magnitude of change. Figure 9a is a good example of a very subtle consistently decreasing change that may pass unnoticed if only the original time series is analyzed. This was confirmed by a Seasonal Kendall test [58], which did not detect a significant trend in the raw time series. Figure 9b illustrates a very high magnitude of change, but a non-consistently decreasing trend. Although it is classified as highly degraded, it does not exhibit one of the highest scores of forest degradation because its trajectory is not typical of a forest degradation process. It is worth mentioning that many pixels show this abrupt change around 2009, which may correspond to the severe droughts that Central Mexico experienced in 2009 and 2011. Figure 9c shows a clear example of forest degradation, where LAI changed substantially during the study period following a consistently decreasing trajectory. The Seasonal Kendall test and the Theil–Sen slope test applied to the raw time series of examples 11b and 11c detected negative trends with a strength of −0.53 and −0.52 and a magnitude of −0.34 and −0.20, respectively. The product of these measures is higher for Figure 9b (0.18) than for Figure 9c (0.10), which would have assigned a higher score to a trajectory less representative of a typical process of forest degradation.
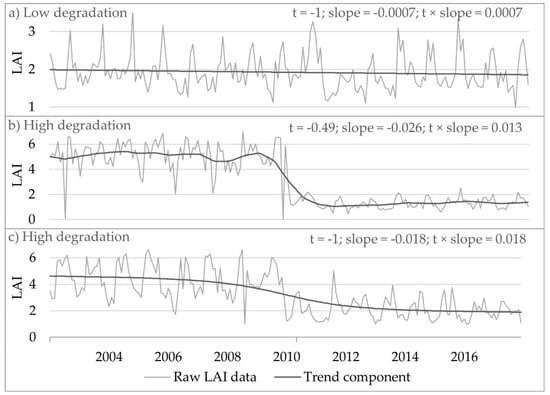
Figure 9.
Examples of slightly degraded (a) and highly degraded (b,c) pixels based on the strength (t) and magnitude (slope) of the extracted trend component.
4.3. Potential Sources of Validation Uncertainty
The difficulty of validating degradation models has been recognized and attributed to the considerable amount of economic and human resources needed to collect reference data during long periods of study [68]. This research made use of reference data that were not collected for the specific purpose of validating this study. Therefore, although these data are considered the best possible information available, they present some limitations. In this context, there are at least four reasons that may be associated with the moderate agreement (i.e., 63%) between the remotely sensed LAI and the field observations of tree conditions.
First, the spatial extent of the reference data is not ideally compatible with the spatial resolution of the MODIS pixels. Each sampling conglomerate extends over 1600 m2, while each MODIS pixel covers 216,516 m2. This means that the reference data are representative of less than 1% of the MODIS pixel with which they are compared. Second, the classification schemes of tree conditions are slightly different between forest inventories. The NFSI 2004–2009 and the NFIS 2009–2014 recognize four vigor conditions (i.e., very poor, poor, good, and maximum), while the NFSI 2014–2019 recognizes only three (i.e., low, moderate, and high). This incompatibility hindered an appropriate comparison of the vigor conditions through time. Third, the number of field observation dates within the study period is limited for the purposes of a trend analysis. Fourth, the collection of tree conditions may be subjective since it depends on the criterion and expertise of the data collector.
The accuracy of future validation efforts may be improved by including all field observations regardless of the position within a pixel, by establishing a unique classification scheme of tree conditions, by considering a longer study period that allows for the incorporation of more field observation dates, and by testing other reference data such as crown density or proportion of live crown. The latter two variables were not considered in this work due the high proportion of missing records in the study area and period of interest. On the other hand, forest degradation studies may need an entirely different validation approach. Although an index that aimed to identify the general condition of the forest in each conglomerate was created (see Section 2.4 for details), forest degradation studies may need field observations that evaluate forest as a whole in a given area rather than as single individuals (i.e., trees) or plots. Collecting data to properly validate forest degradation studies at a regional scale represents an area of opportunity for future research.
5. Conclusions
This research detected forest degradation over Central Mexico through a trend analysis of monthly MODIS LAI collected from 2002 to 2017. The results indicate that 52% of the study area has experienced positive trends of vegetation change, 37% has remained unchanged, and 11% has suffered some level of forest degradation. The proposed algorithm estimated that 385 km2 are highly degraded, 3406 km2 moderately degraded, and 3245 km2 slightly degraded. Most of the moderate and highly degraded areas are distributed over the east side of the study area and evergreen broadleaf appears to be the most affected forest type.
This research overcame the problem of detecting very slow and gradual changes associated with forest degradation by measuring the strength and magnitude of the trend component of pixel-based LAI time series. None of the algorithms cited in this paper have made use of LAI as vegetation greenness indicator, nor have performed this type of trend analysis to detect forest degradation. The main limitation of this study is the moderate accuracy of the validation effort (i.e., 63%). Some suggestions to improve this accuracy are expressed in Section 4.3, but also a different approach to validate this type of studies is suggested as an area of opportunity for future research.
This study is expected to be a contribution to the regional efforts to measuring and monitoring forest degradation in Mexico. It could serve as one of the first steps towards the mitigation of the serious impacts that forest degradation has on the environmental services that these ecosystems provide. Thus, this work suggests that this methodology can be applied at the national level and be used as a first look into hot spots of forest degradation.
Author Contributions
Conceptualization, Y.R.; methodology, Y.R.; software, Y.R.; validation, Y.R.; formal analysis, Y.R.; investigation, Y.R.; resources, Y.R.; data curation, Y.R.; writing—original draft preparation, Y.R.; writing—review and editing, J.L.R.J. and G.G.M.; visualization, Y.R.; supervision, J.L.R.J. and G.G.M.; funding acquisition, Y.R.
Funding
This research was funded by the Department of Geography, the Graduate College, and the International Office of Texas State University, as well as by the Consejo Nacional de Ciencia y Tecnología (CONACYT).
Acknowledgments
We would like to thank the Comisión Nacional Forestal (CONAFOR) for providing us with the National Forest and Soils Inventory Dataset (2004–2017).
Conflicts of Interest
The authors declare no conflict of interest.
References
- Brown, S.; Sathaye, J.; Cannell, M.; Kauppi, P.E. Mitigation of carbon emissions to the atmosphere by forest management. Commonw. For. Rev. 1996, 75, 80–91. [Google Scholar]
- Chazdon, R.L.; Brancalion, P.H.S.; Laestadius, L.; Bennett-Curry, A.; Buckingham, K.; Kumar, C.; Moll-Rocek, J.; Vieira, I.C.G.; Wilson, S.J. When is a forest a forest? Forest concepts and definitions in the era of forest and landscape restoration. Ambio 2016, 45, 538–550. [Google Scholar] [CrossRef]
- Schoene, D.; Killmann, W.; von Lupke, H.L.M. Definitional Issues Related to Reducing Emissions from Deforestation in Developing Countries; Food and Agriculture Organization: Rome, Italy, 2007; Volume 5. [Google Scholar]
- Strahler, A.; Muchoney, D.; Borak, D.J.; Fried, M.; Gopal, S.; Lambin, E.; Moody, A. MODIS land cover product: Algorithm theoretical basis document. Version 5.0. In MODIS Documentation; Boston University: Boston, MA, USA, 1999. [Google Scholar]
- ITTO. Revised ITTO Criteria and Indicators for the Sustainable Management of Tropical Forests Including Reporting Format. ITTO Policy Development Series No. 15; ITTO: Yokohama, Japan, 2005; ISBN 4 902045 20 6. [Google Scholar]
- UNEP/CBD/SBSTTA. Review of the Status and Trends of, and Major Threats to, the Forest Biological Diversity, Prepared by the Ad Hoc Technical Expert Group on Forest Biological Diversity; UNEP: Nairobi, Kenya; Earthprint: Cheltenham, UK, 2001; pp. 1–152. [Google Scholar]
- Penman, J.; Gytarsky, M.; Hiraishi, T.; Krug, T.; Kruger, D.; Pipatti, R.; Buendia, L.; Miwa, K.; Ngara, T.; Tanabe, K.; et al. Definitions and Methodological Options to Inventory Emissions from Direct Human-Induced Degradation of Forests and Devegetation of Other Vegetation Types; National Greenhouse Gas Inventories Programme, Intergovernmental Panel on Climate Change (IPCC): Geneva, Switzerland, 2003. [Google Scholar]
- FAO. Global Forest Resources Assessment 2005. Main Report; Food and Agriculture Organization: Rome, Italy, 2006. [Google Scholar]
- Sasaki, N.; Putz, F.E. Critical need for new definitions of “forest” and “forest degradation” in global climate change agreements. Conserv. Lett. 2009, 2, 226–232. [Google Scholar] [CrossRef]
- Shoch, D.; Eaton, J.; Settelmyer, S. Project Developer’s Guidebook to VCS REDD Methodologies; Conservation International: Virginia, UK, 2013; Version 2. [Google Scholar]
- Cohen, W.B.; Healey, S.P.; Yang, Z.; Stehman, S.V.; Brewer, C.K.; Brooks, E.B.; Gorelick, N.; Huang, C.; Hughes, M.J.; Kennedy, R.E.; et al. How Similar Are Forest Disturbance Maps Derived from Different Landsat Time Series Algorithms? Forests 2017, 8, 98. [Google Scholar] [CrossRef]
- Jin, S.; Sader, S.A. MODIS time-series imagery for forest disturbance detection and quantification of patch size effects. Remote Sens. Environ. 2005, 99, 462–470. [Google Scholar] [CrossRef]
- Xin, Q.; Olofsson, P.; Zhu, Z.; Tan, B.; Woodcock, C.E. Toward near real-time monitoring of forest disturbance by fusion of MODIS and Landsat data. Remote Sens. Environ. 2013, 135, 234–247. [Google Scholar] [CrossRef]
- de Beurs, K.M.; Owsley, B.C.; Julian, J.P. Disturbance analyses of forests and grasslands with MODIS and Landsat in New Zealand. Int. J. Appl. Earth Obs. Geoinf. 2016, 45, 42–54. [Google Scholar] [CrossRef]
- Tran, T.V.; de Beurs, K.M.; Julian, J.P. Monitoring forest disturbances in Southeast Oklahoma using Landsat and MODIS images. Int. J. Appl. Earth Obs. Geoinf. 2016, 44, 42–52. [Google Scholar] [CrossRef]
- Gao, Y.; Ghilardi, A.; Paneque-Galvez, J.; Skutsch, M.; Mas, J.F. Validation of MODIS Vegetation Continuous Fields for monitoring deforestation and forest degradation: Two cases in Mexico. Geocarto Int. 2015, 31, 1019–1031. [Google Scholar] [CrossRef]
- Hammer, D.; Kraft, R.; Wheeler, D. Alerts of forest disturbance from MODIS imagery. Int. J. Appl. Earth Obs. Geoinf. 2014, 33, 1–9. [Google Scholar] [CrossRef]
- Vandecar, K.L.; Lawrence, D.; Richards, D.; Schneider, L.; Rogan, J.; Schmook, B.; Wilbur, H. High Mortality for Rare Species Following Hurricane Disturbance in the Southern Yucatán. Biotropica 2011, 43, 676–684. [Google Scholar] [CrossRef]
- Sulla-Menashe, D.; Kennedy, R.E.; Yang, Z.; Braaten, J.; Krankina, O.N.; Friedl, M.A. Detecting forest disturbance in the Pacific Northwest from MODIS time series using temporal segmentation. Remote Sens. Environ. 2014, 151, 114–123. [Google Scholar] [CrossRef]
- Hashim, M.; Pour, A.B.; Wei, C.K. Comparison of ETM+ and MODIS Data for Tropical Forest Degradation Monitoring in the Peninsular Malaysia. J. Indian Soc. Remote Sens. 2014, 42, 383–396. [Google Scholar] [CrossRef]
- Mildrexler, D.J.; Zhao, M.; Heinsch, F.A.; Running, S.W. A new satellite-based methodology for continental-scale disturbance detection. Ecol. Appl. 2007, 17, 235–250. [Google Scholar] [CrossRef]
- Mildrexler, D.J.; Zhao, M.; Running, S.W. Testing a MODIS Global Disturbance Index across North America. Remote Sens. Environ. 2009, 113, 2103–2117. [Google Scholar] [CrossRef]
- Coops, N.C.; Wulder, M.A.; Iwanicka, D. Large area monitoring with a MODIS-based Disturbance Index (DI) sensitive to annual and seasonal variations. Remote Sens. Environ. 2009, 113, 1250–1261. [Google Scholar] [CrossRef]
- Pouliot, D.; Latifovic, R.; Fernandes, R.; Olthof, I. Evaluation of annual forest disturbance monitoring using a static decision tree approach and 250 m MODIS data. Remote Sens. Environ. 2009, 113, 1749–1759. [Google Scholar] [CrossRef]
- Myneni, R.B.; Hoffman, S.; Knyazikhin, Y.; Privette, J.L.; Glassy, J.; Tian, Y.; Wang, Y.; Song, X.; Zhang, Y.; Smith, G.R.; et al. Global products of vegetation leaf area and fraction absorbed PAR from year one of MODIS data. Remote Sens. Environ. 2002, 83, 214–231. [Google Scholar] [CrossRef]
- Loboda, T.V.; Zhang, Z.; O’Neal, K.J.; Sun, G.; Csiszar, I.A.; Shugart, H.H.; Sherman, N.J. Reconstructing disturbance history using satellite-based assessment of the distribution of land cover in the Russian Far East. Remote Sens. Environ. 2012, 118, 241–248. [Google Scholar] [CrossRef]
- Guindon, L.; Bernier, P.Y.; Beaudoin, A.; Pouliot, D.; Villemaire, P.; Hall, R.J.; Latifovic, R.; St-Amant, R. Annual mapping of large forest disturbances across Canada’s forests using 250 m MODIS imagery from 2000 to 2011. Can. J. For. Res. 2014, 44, 1545–1554. [Google Scholar] [CrossRef]
- Hilker, T.; Wulder, M.A.; Coops, N.C.; Linke, J.; McDermid, G.; Masek, J.G.; Gao, F.; White, J.C. A new data fusion model for high spatial- and temporal-resolution mapping of forest disturbance based on Landsat and MODIS. Remote Sens. Environ. 2009, 113, 1613–1627. [Google Scholar] [CrossRef]
- Schmidt, M.; Lucas, R.; Bunting, P.; Verbesselt, J.; Armston, J. Multi-resolution time series imagery for forest disturbance and regrowth monitoring in Queensland, Australia. Remote Sens. Environ. 2015, 158, 156–168. [Google Scholar] [CrossRef]
- Verbesselt, J.; Hyndman, R.; Newnham, G.; Culvenor, D. Detecting trend and seasonal changes in satellite image time series. Remote Sens. Environ. 2010, 114, 106–115. [Google Scholar] [CrossRef]
- Jacquin, A.; Sheeren, D.; Lacombe, J.P. Vegetation cover degradation assessment in Madagascar savanna based on trend analysis of MODIS NDVI time series. Int. J. Appl. Earth Obs. Geoinf. 2010, 12, 3–10. [Google Scholar] [CrossRef]
- Schucknecht, A.; Erasmi, S.; Niemeyer, I.; Matschullat, J. Assessing vegetation variability and trends in north-eastern Brazil using AVHRR and MODIS NDVI time series. Eur. J. Remote Sens. 2013, 46, 40–59. [Google Scholar] [CrossRef]
- Dokumentov, A.; Hyndman, R.J. STR: A Seasonal-Trend Decomposition Procedure Based on Regression; Monash University: Melbourne, Australia, 2015; p. 23. [Google Scholar]
- CONAFOR. National Forest and Soils Inventory Dataset, 2004–2017; CONAFOR: Zapopan, Mexico, 2019. [Google Scholar]
- Skutsch, M.; Simon, C.; Velazquez, A.; Fernández, J.C. Rights to carbon and payments for services rendered under REDD+: Options for the case of Mexico. Glob. Environ. Chang. 2013, 23, 813–825. [Google Scholar] [CrossRef]
- Klooster, D.; Masera, O. Community forest management in Mexico: Carbon mitigation and biodiversity conservation through rural development. Glob. Environ. Chang. 2000, 10, 259–272. [Google Scholar] [CrossRef]
- Morales-Barquero, L.; Skutsch, M.; Jardel-Peláez, E.J.; Ghilardi, A.; Kleinn, C.; Healey, J.R. Operationalizing the definition of forest degradation for REDD+, with application to Mexico. Forests 2014, 5, 1653–1681. [Google Scholar] [CrossRef]
- Kovacs, J.M.; Wang, J.; Blanco-Correa, M. Mapping disturbances in a mangrove forest using multi-date landsat TM imagery. Environ. Manag. 2001, 27, 763–776. [Google Scholar] [CrossRef]
- Brower, L.P.; Castilleja, G.; Peralta, A.; Lopez-garcia, J.; Bojorquez-tapia, L.; Diaz, S.; Melgarejo, D.; Missrie, M.; Melgarejo, D.; Missrie, M. Quantitative Changes in Forest Quality in a Principal Overwintering Area of the Monarch Butterfly in Mexico, 1971–1999. Conserv. Biol. 2002, 16, 346–359. [Google Scholar] [CrossRef]
- Vidal, O.; López-García, J.; Rendón-Salinas, E. Trends in Deforestation and Forest Degradation after a Decade of Monitoring in the Monarch Butterfly Biosphere Reserve in Mexico. Conserv. Biol. 2014, 28, 177–186. [Google Scholar] [CrossRef] [PubMed]
- Romero-Sanchez, M.E.; Ponce-Hernandez, R. Assessing and monitoring forest degradation in a deciduous tropical forest in Mexico via remote sensing indicators. Forests 2017, 8, 302. [Google Scholar] [CrossRef]
- INEGI. Land Use and Vegetation Map, Serie Land Use and Vegetation Map, Serie VI (2014), Scale 1: 250,000; National Institute of Statistics and Geography: Aguascalian, Mexico, 2017; Available online: https://www.inegi.org.mx/temas/usosuelo/default.html#Descargas (accessed on 23 October 2019).
- GFS Global Forecast System (GFS) | National Centers for Environmental Information (NCEI) Formerly Known as National Climatic Data Center (NCDC). Available online: https://www.ncdc.noaa.gov/gosic/gcos-essential-climate-variable-ecv-data-access-matrix (accessed on 19 September 2019).
- Yan, K.; Park, T.; Yan, G.; Liu, Z.; Yang, B.; Chen, C.; Nemani, R.R.; Knyazikhin, Y.; Myneni, R.B. Evaluation of MODIS LAI/FPAR product collection 6. Part 2: Validation and intercomparison. Remote Sens. 2016, 8, 460. [Google Scholar] [CrossRef]
- King, M.D.; Platnick, S.; Menzel, W.P.; Ackerman, S.A.; Hubanks, P.A. Spatial and temporal distribution of clouds observed by MODIS onboard the terra and aqua satellites. IEEE Trans. Geosci. Remote Sens. 2013, 51, 3826–3852. [Google Scholar] [CrossRef]
- Knyazikhin, Y.; Martonchik, J.V.; Diner, D.J.; Myneni, R.B.; Verstraete, M.; Pinty, B.; Gobron, N. Estimation of vegetation canopy leaf area index and fraction of absorbed photosynthetically active radiation from atmosphere-corrected MISR data. J. Geophys. Res. Atmos. 1998, 103, 32239–32256. [Google Scholar] [CrossRef]
- Jensen, J.L.; Humes, K.S.; Hudak, A.T.; Vierling, L.A.; Delmelle, E. Evaluation of the MODIS LAI product using independent lidar-derived LAI: A case study in mixed conifer forest. Remote Sens. Environ. 2011, 115, 3625–3639. [Google Scholar] [CrossRef]
- Yang, W.; Huang, D.; Tan, B.; Stroeve, J.C.; Shabanov, N.V.; Knyazikhin, Y.; Nemani, R.R.; Myneni, R.B. Analysis of leaf area index and fraction of PAR absorbed by vegetation products from the terra MODIS sensor: 2000–2005. IEEE Trans. Geosci. Remote Sens. 2006, 44, 1829–1841. [Google Scholar] [CrossRef]
- Harvey, A.C.; Todd, P.H.J. Forecasting economic time series with structural and box-jenkins models: A case study. J. Bus. Econ. Stat. 1983, 1, 299–307. [Google Scholar]
- Harvey, A.C. Trends and cycles in macroeconomic time series. J. Bus. Econ. Stat. 1985, 3, 216–227. [Google Scholar]
- Harvey, A.C.; Peters, S. Estimation procedures for structural time series models. J. Forecast. 1990, 9, 89–108. [Google Scholar] [CrossRef]
- Cleveland, R.B.; Cleveland, W.S.; McRae, J.E.; Terpenning, I. STL: A seasonal-trend decomposition. J. Off. Stat. 1990, 6, 3–73. [Google Scholar]
- Dokumentov, A.; Hyndman, R.J. stR: STR Decomposition. R Package Version 0.4. Available online: https://cran.r-project.org/package=stR (accessed on 19 September 2019).
- R Core Team. The R Project for Statistical Computing. Available online: https://www.r-project.org/ (accessed on 19 September 2019).
- Mann, H.B. Nonparametric Tests Against Trend. Econometrica 1945, 13, 245–259. [Google Scholar] [CrossRef]
- Kendall, M. Rank Correlation Methods; Griffin: Oxford, UK, 1948. [Google Scholar]
- Hamed, K.H.; Ramachandra Rao, A. A modified Mann-Kendall trend test for autocorrelated data. J. Hydrol. 1998, 204, 182–196. [Google Scholar] [CrossRef]
- Helsel, D.R.; Frans, L.M. Regional Kendall test for trend. Environ. Sci. Technol. 2006, 40, 4066–4073. [Google Scholar] [CrossRef] [PubMed]
- Bartels, R. The rank version of von Neumann’s ratio test for randomness. J. Am. Stat. Assoc. 1982, 77, 40–46. [Google Scholar] [CrossRef]
- Theil, H. A rank-invariant method of linear and polynomial. Mathematics 1950, 392, 387–392. [Google Scholar]
- Sen, P.K. Estimates of the Regression Coefficient Based on Kendall’s Tau. J. Am. Stat. Assoc. 1968, 63, 1379–1389. [Google Scholar] [CrossRef]
- Hollander, M.; Wolfe, D.A.; Chicken, E. Nonparametric Statistical Methods; John Wiley & Sons: Hoboken, NJ, USA, 2013; Volume 751. [Google Scholar]
- Patakamuri, S.K.; O’Brien, N. Package “modifiedmk” Title Modified Versions of Mann Kendall and Spearman’s Rho Trend Tests. R Package Version 1.3.0. Available online: https://cran.r-project.org/package=modifiedmk (accessed on 19 September 2019).
- INEGI. Land Use and Vegetation Map, Serie III (2002), Scale 1: 250,000; National Institute of Statistics and Geography: Aguascalian, Mexico, 2005; Available online: https://www.inegi.org.mx/temas/usosuelo/default.html#Descargas (accessed on 23 October 2019).
- Hietz, P.; Buchberger, G.; Winkler, M. Effect of forest disturbance on abundance and distribution of epiphytic bromeliads and orchids. Ecotropica 2006, 12, 103–112. [Google Scholar]
- SEMARNAT. Manual of Forest Health; Secretariat of Environment and Natural Resources: Mexico City, Mexico, 2007; Available online: http://www.conafor.gob.mx:8080/documentos/docs/15/810Manual%20de%20sanidad%20forestal.pdf (accessed on 23 October 2019).
- Domínguez, J. Revisión histórica de las sequías en México: De la explicación divina a la incorporación de la ciencia. Tecnol. Y Ciencias Del Agua 2016, 7, 77–93. [Google Scholar]
- Metternicht, G.; Zinck, J.A.; Blanco, P.D.; Del Valle, H.F. Remote sensing of land degradation: Experiences from Latin America and the Caribbean. J. Environ. Qual. 2010, 39, 42–61. [Google Scholar] [CrossRef]
© 2019 by the authors. Licensee MDPI, Basel, Switzerland. This article is an open access article distributed under the terms and conditions of the Creative Commons Attribution (CC BY) license (http://creativecommons.org/licenses/by/4.0/).