Variability of Major Aerosol Types in China Classified Using AERONET Measurements


Abstract
1. Introduction
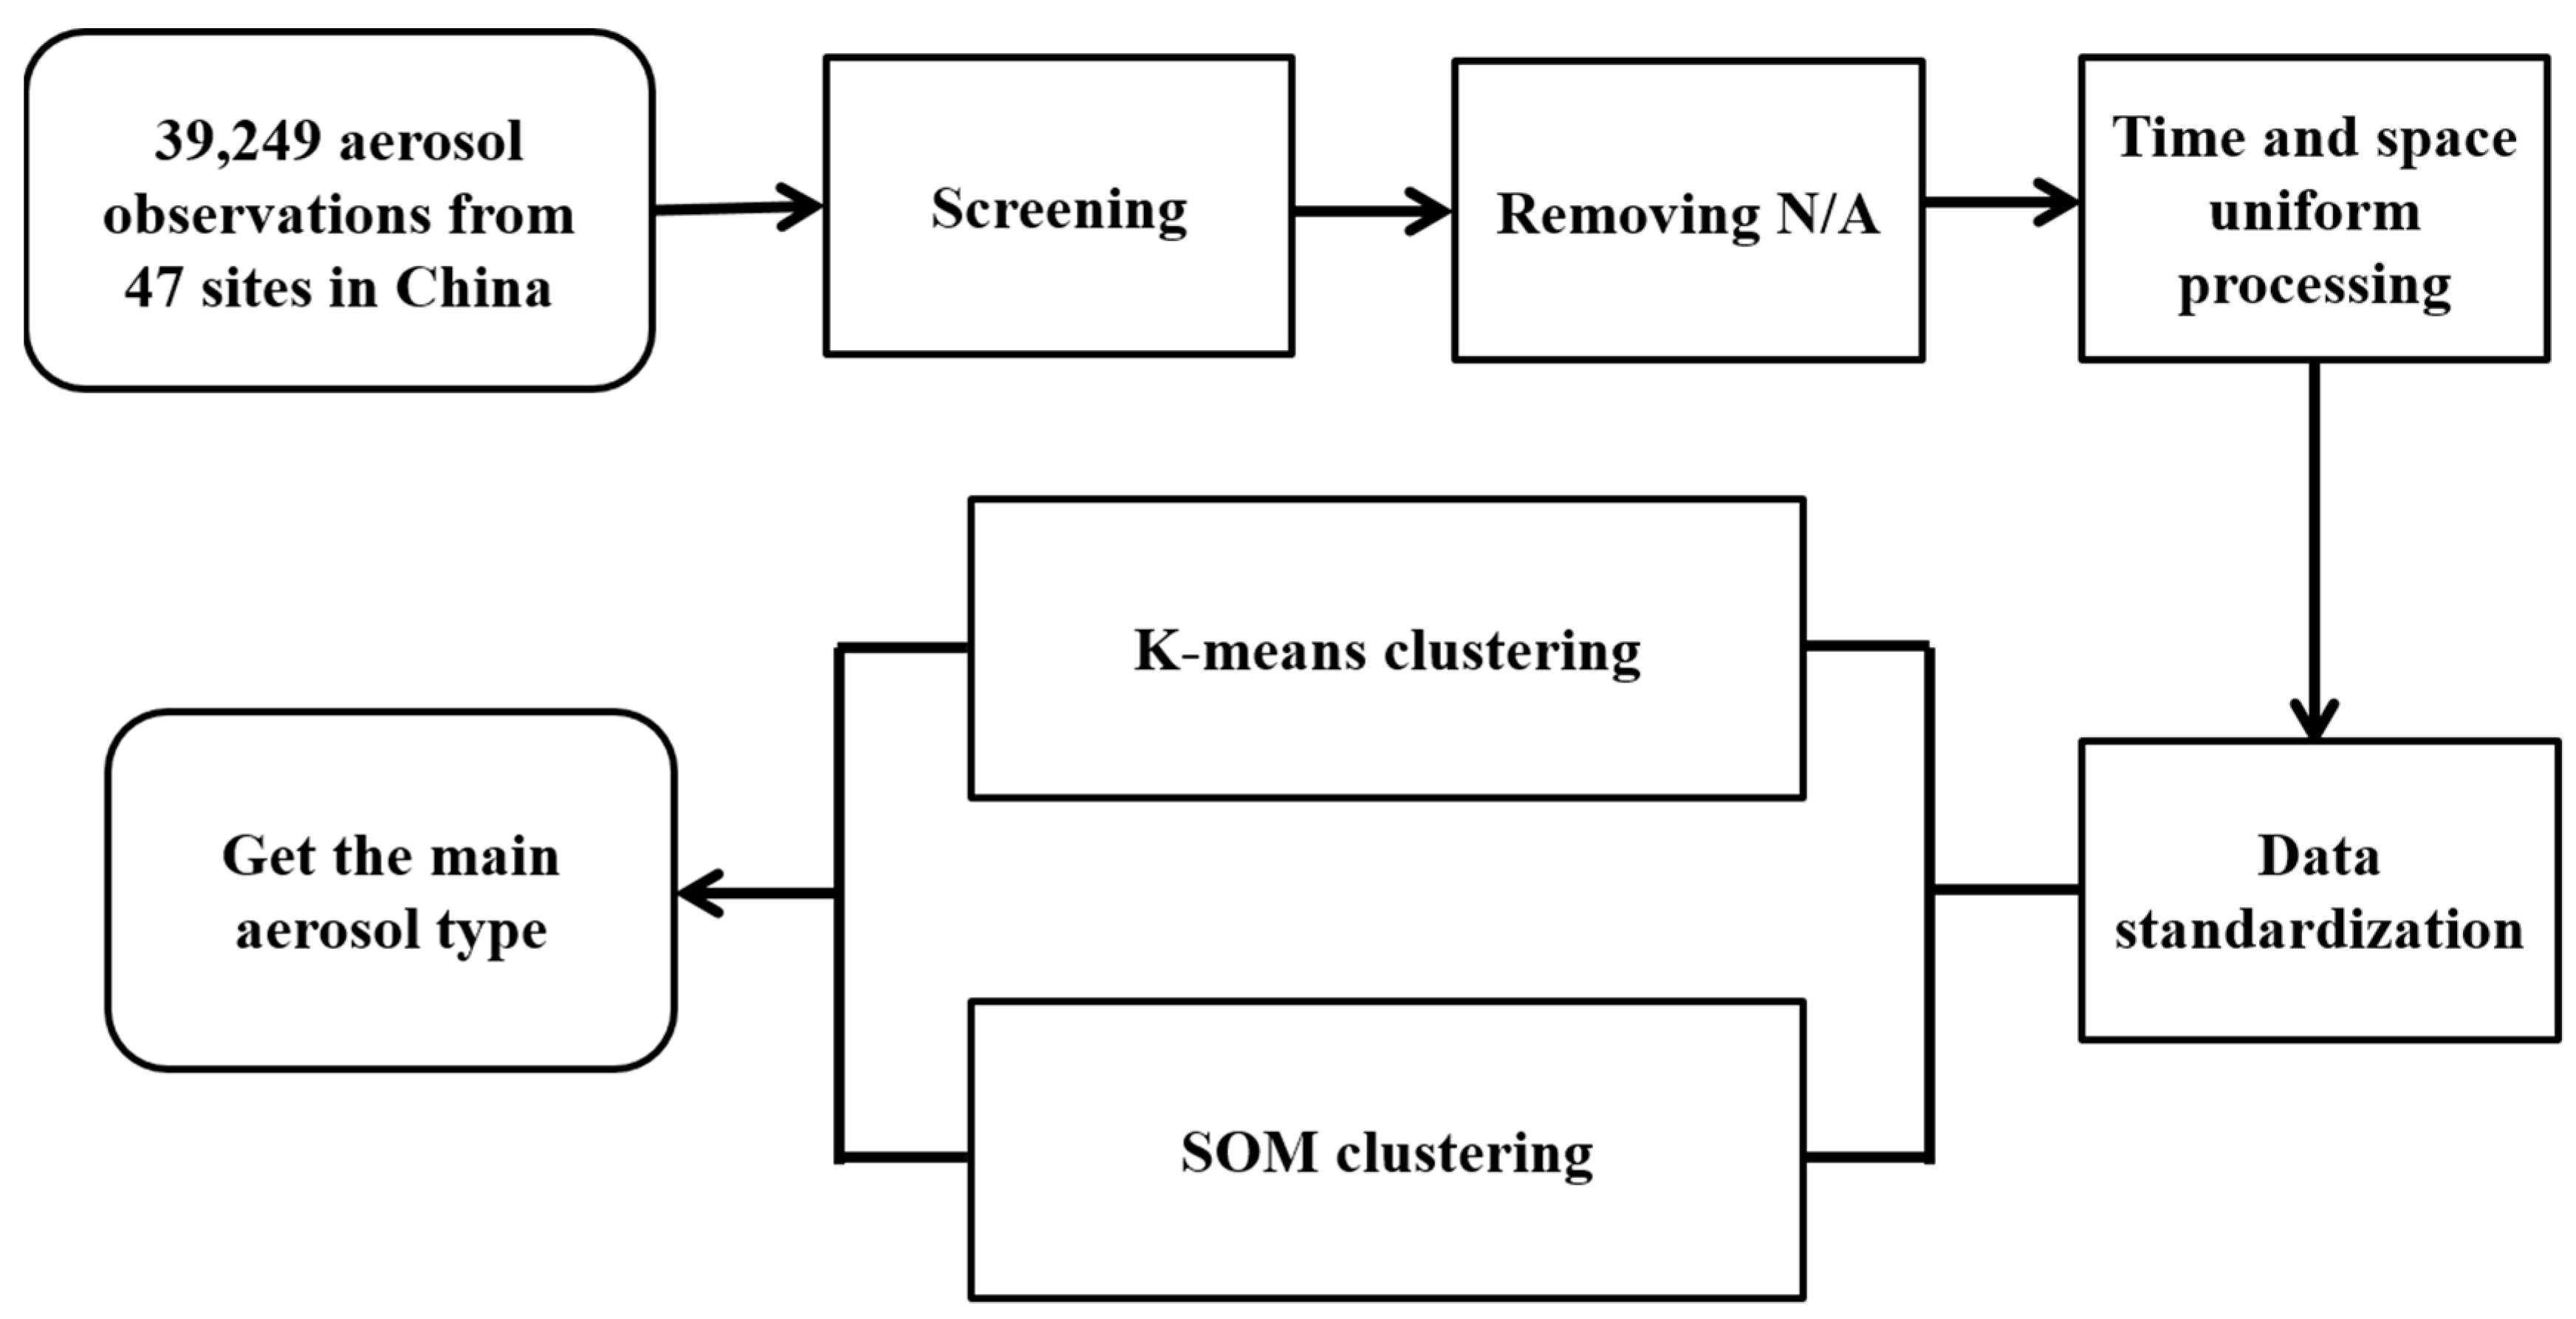
2. Data and Methods
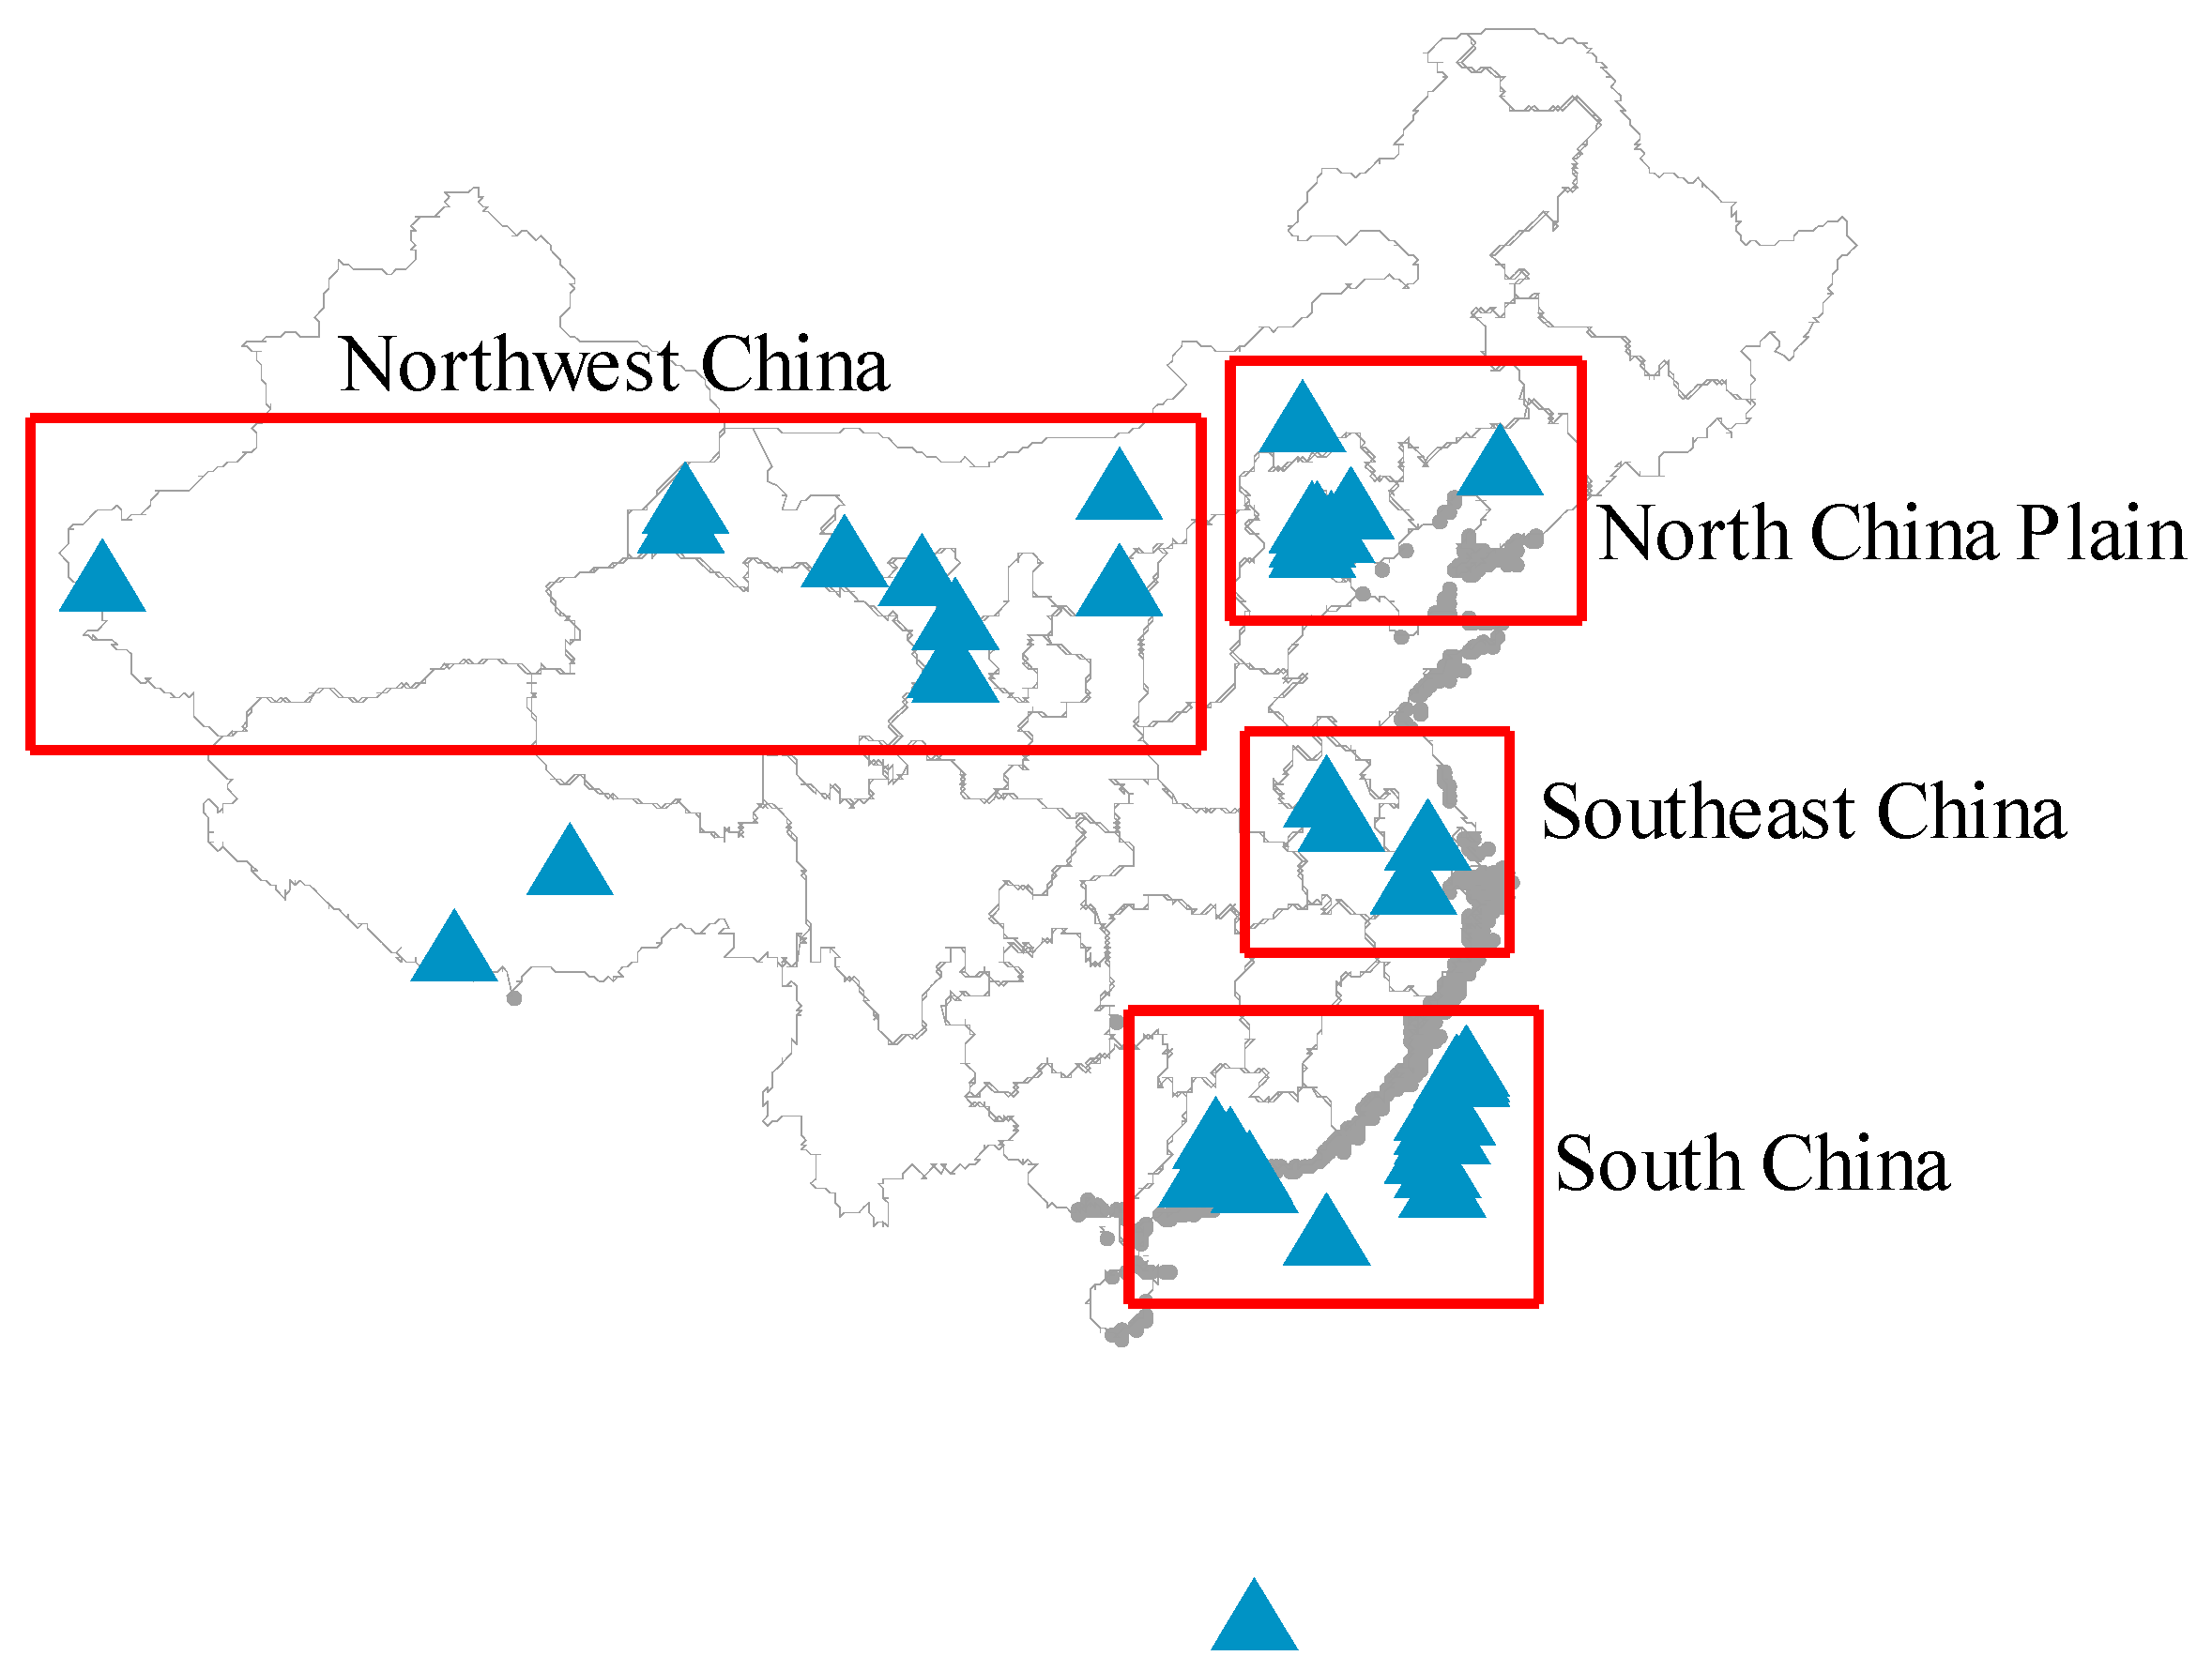
2.1. AERONET Data
2.2. Clustering Techniques
2.2.1. K Means Clustering
- Roughly divide all objects into K initial classes and determine their central points, where K is a given natural number.
- Adjust the existing classes and assign each object to the class nearest to its center (such as mean vector).
- Recalculate the center point of the class that has objects called out or called in, and repeat step 2 for readjustment and so on until a reasonable classification is obtained.
2.2.2. SOM Clustering
3. Results
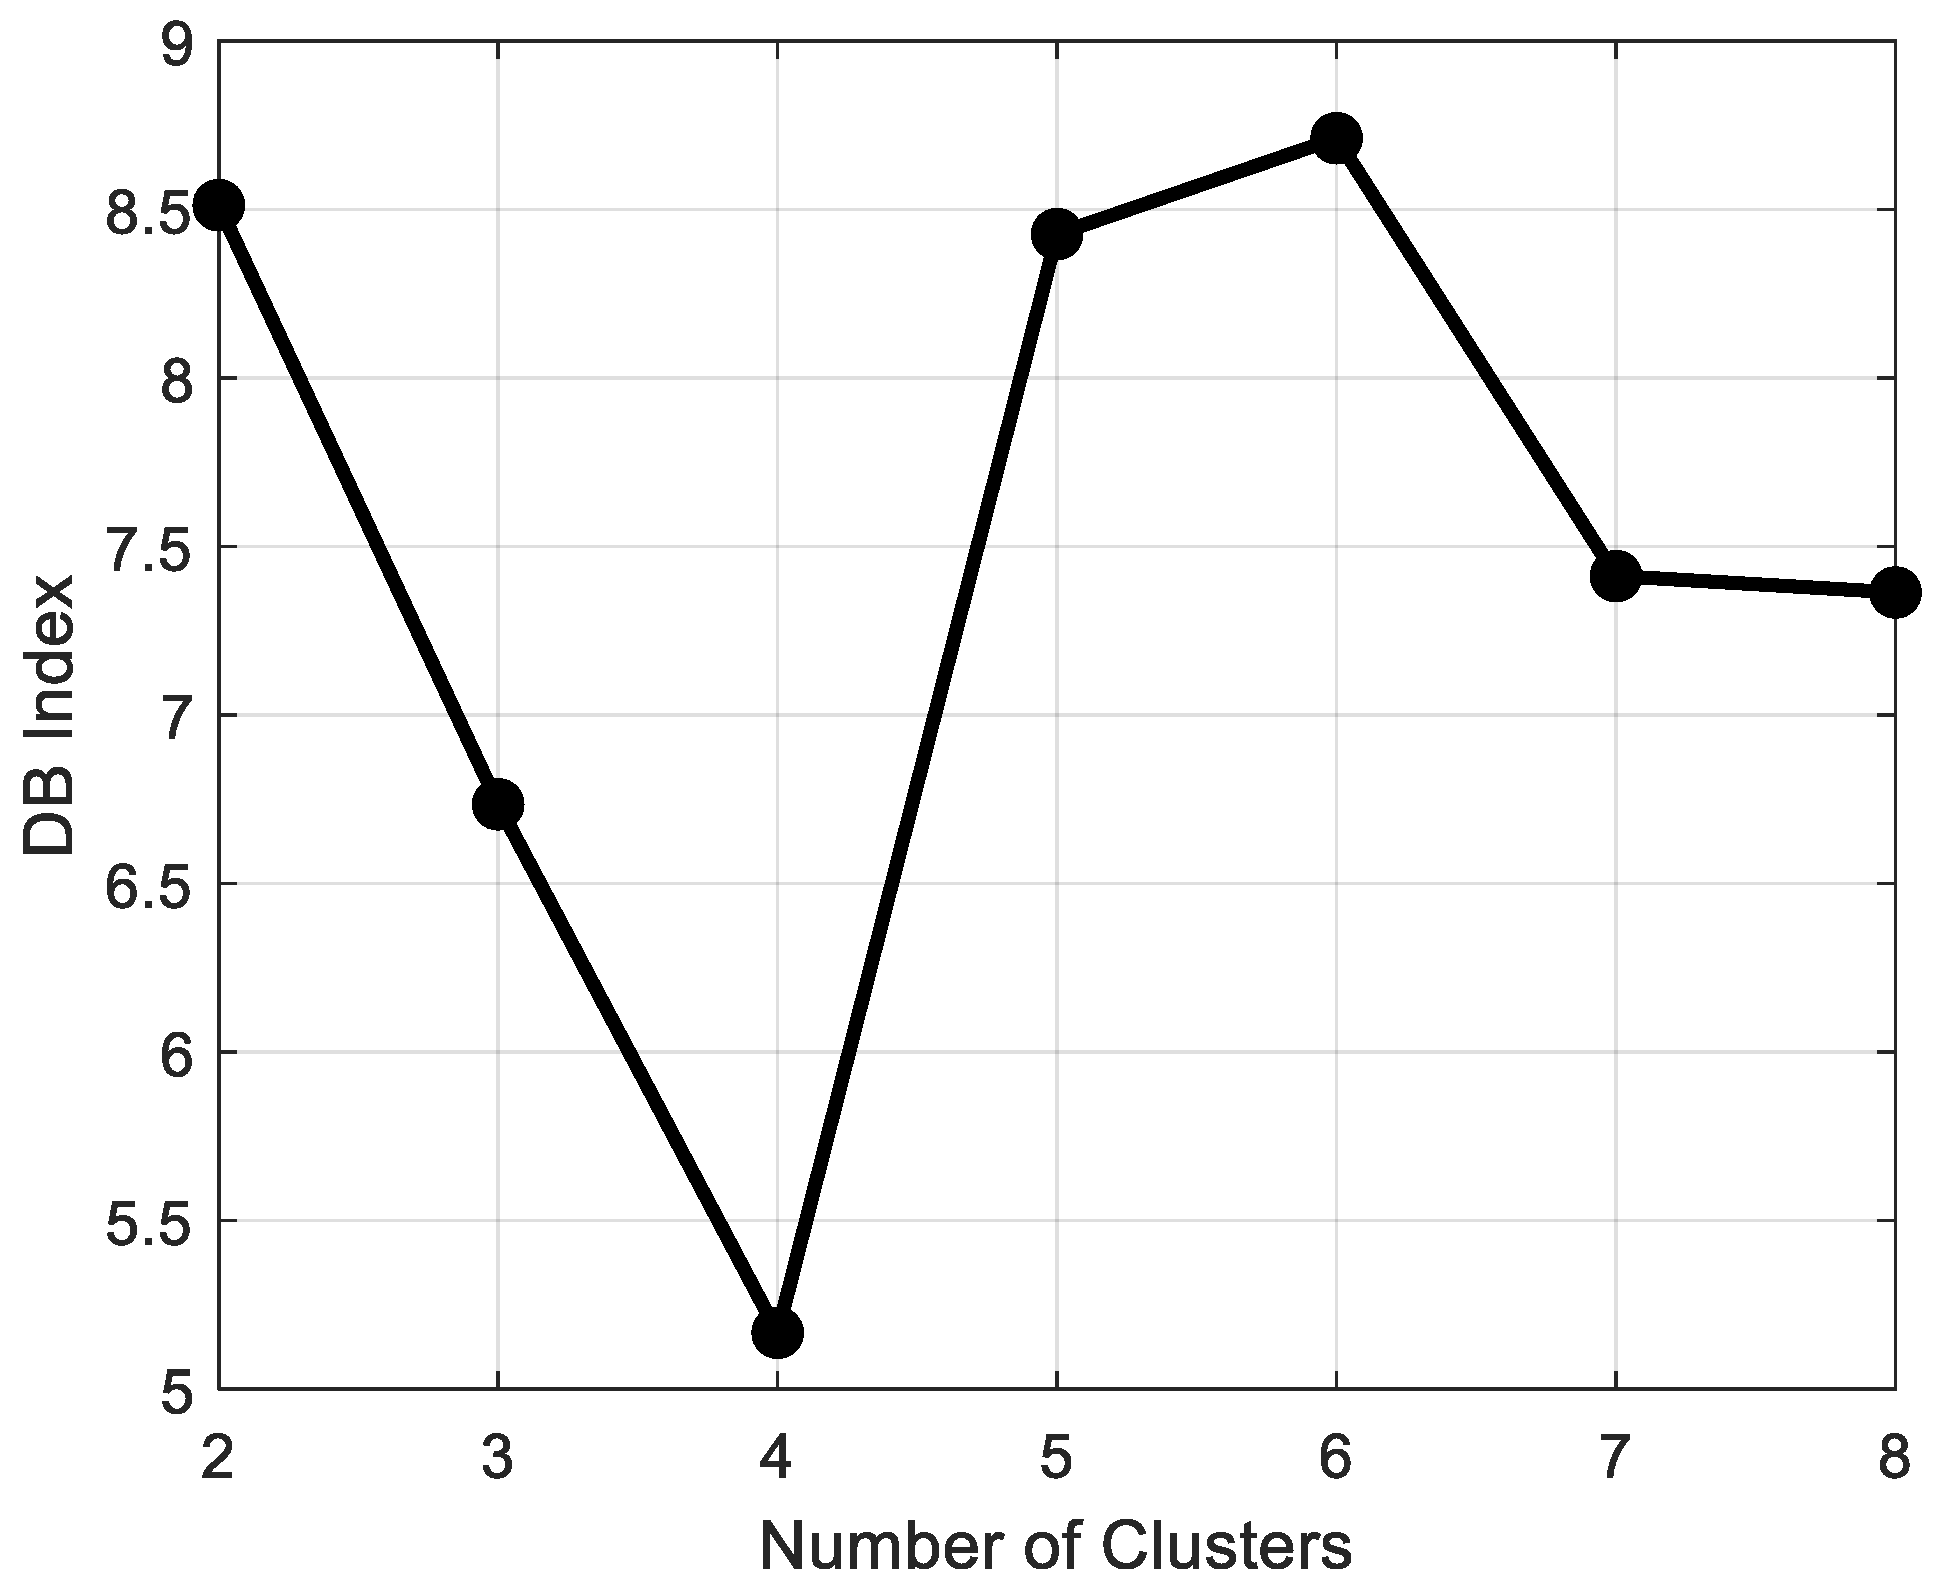
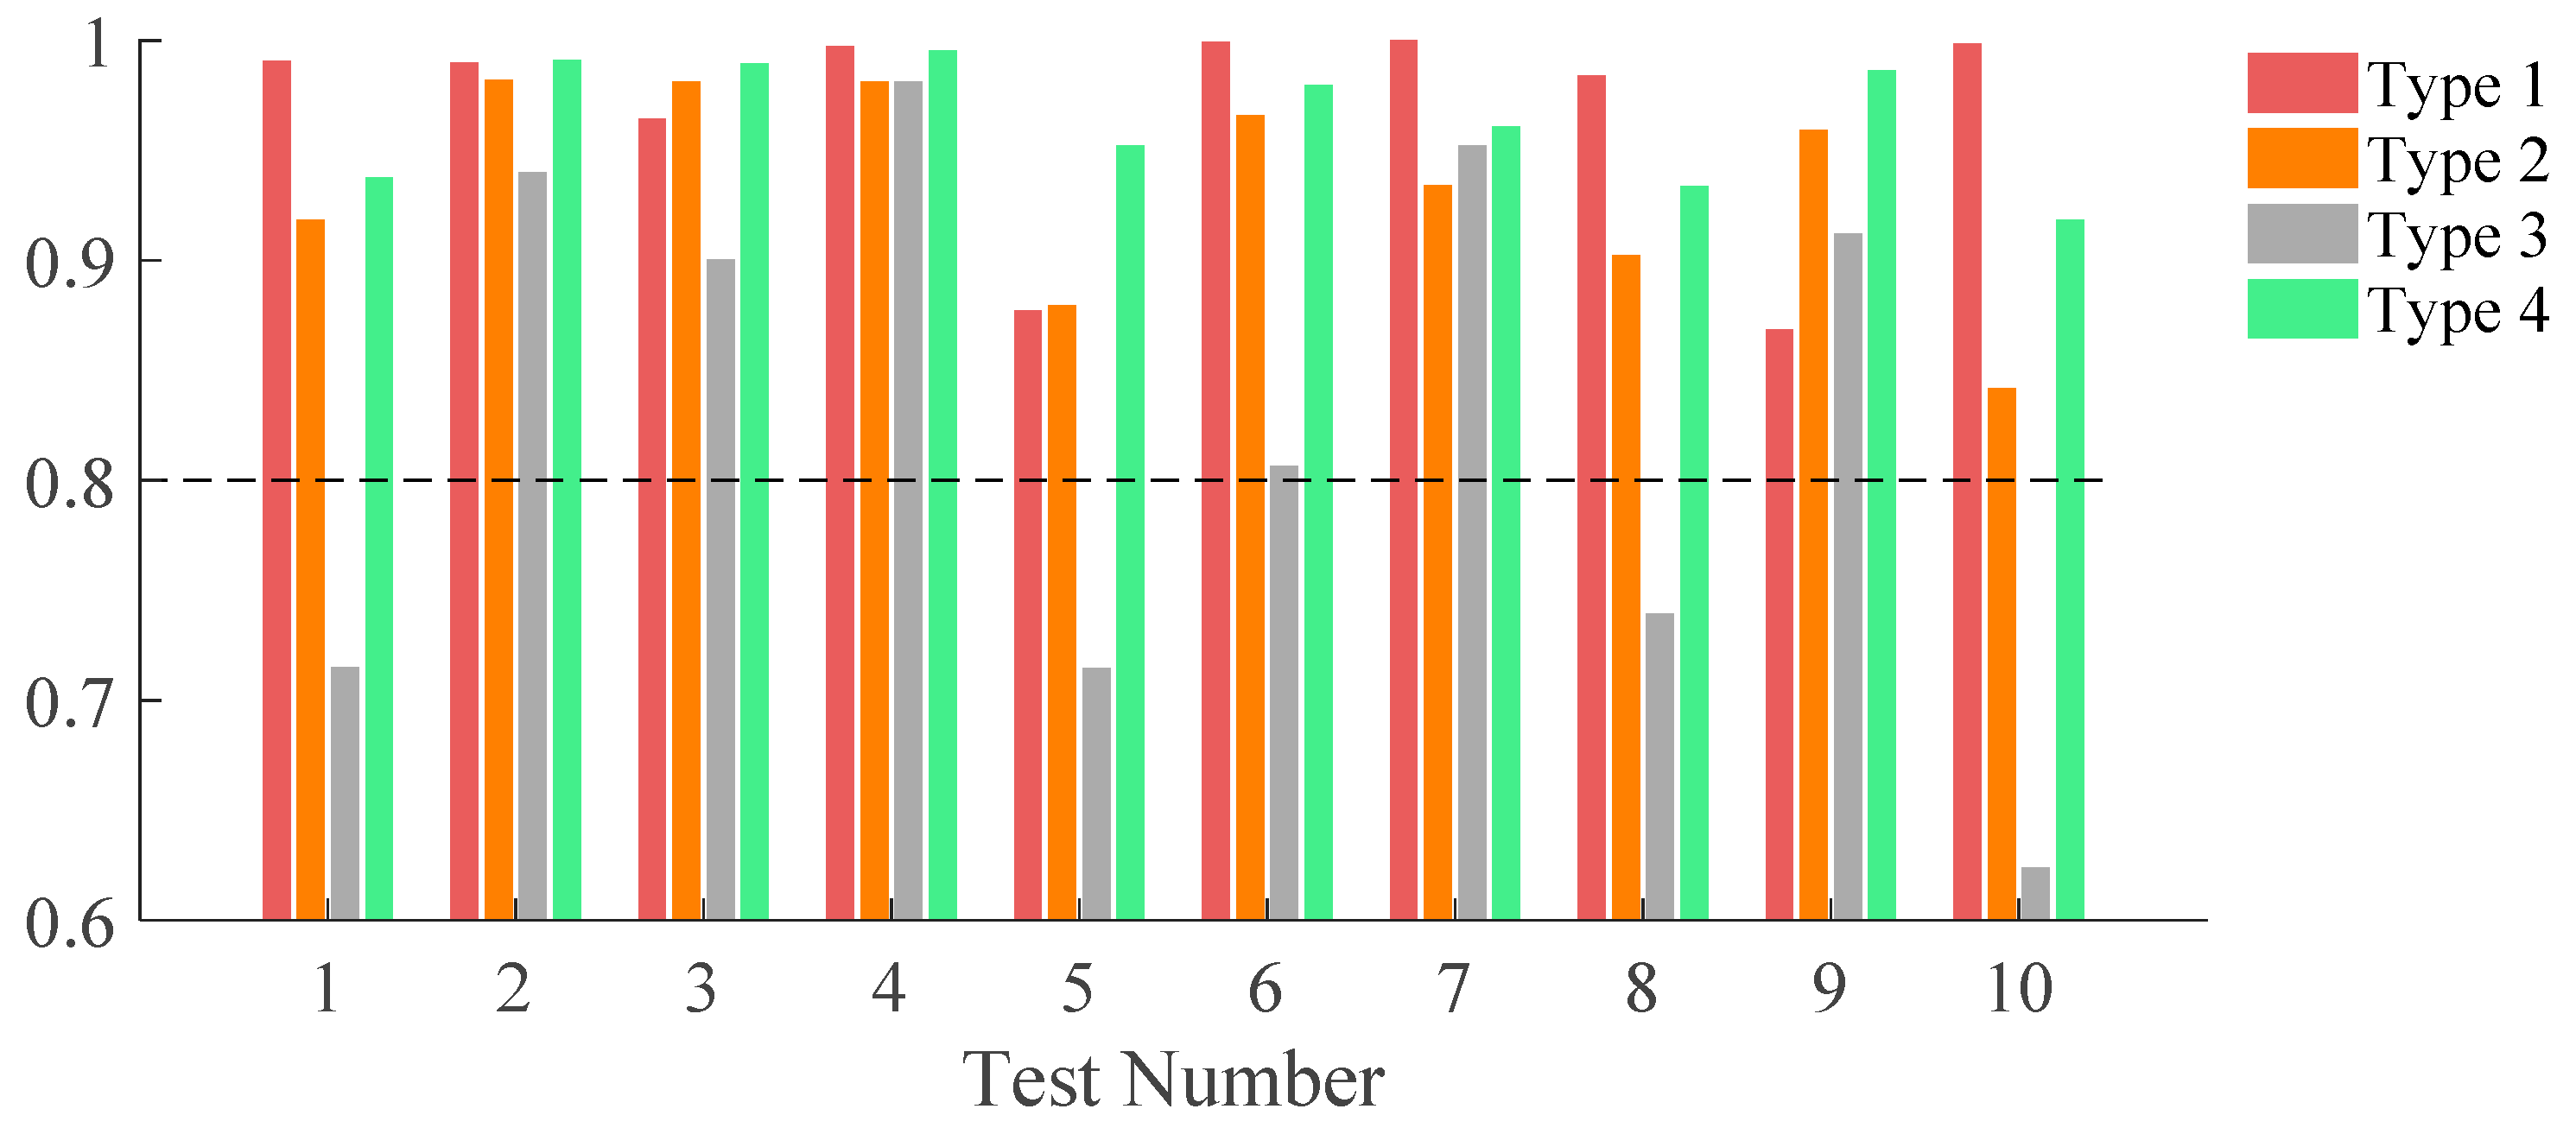
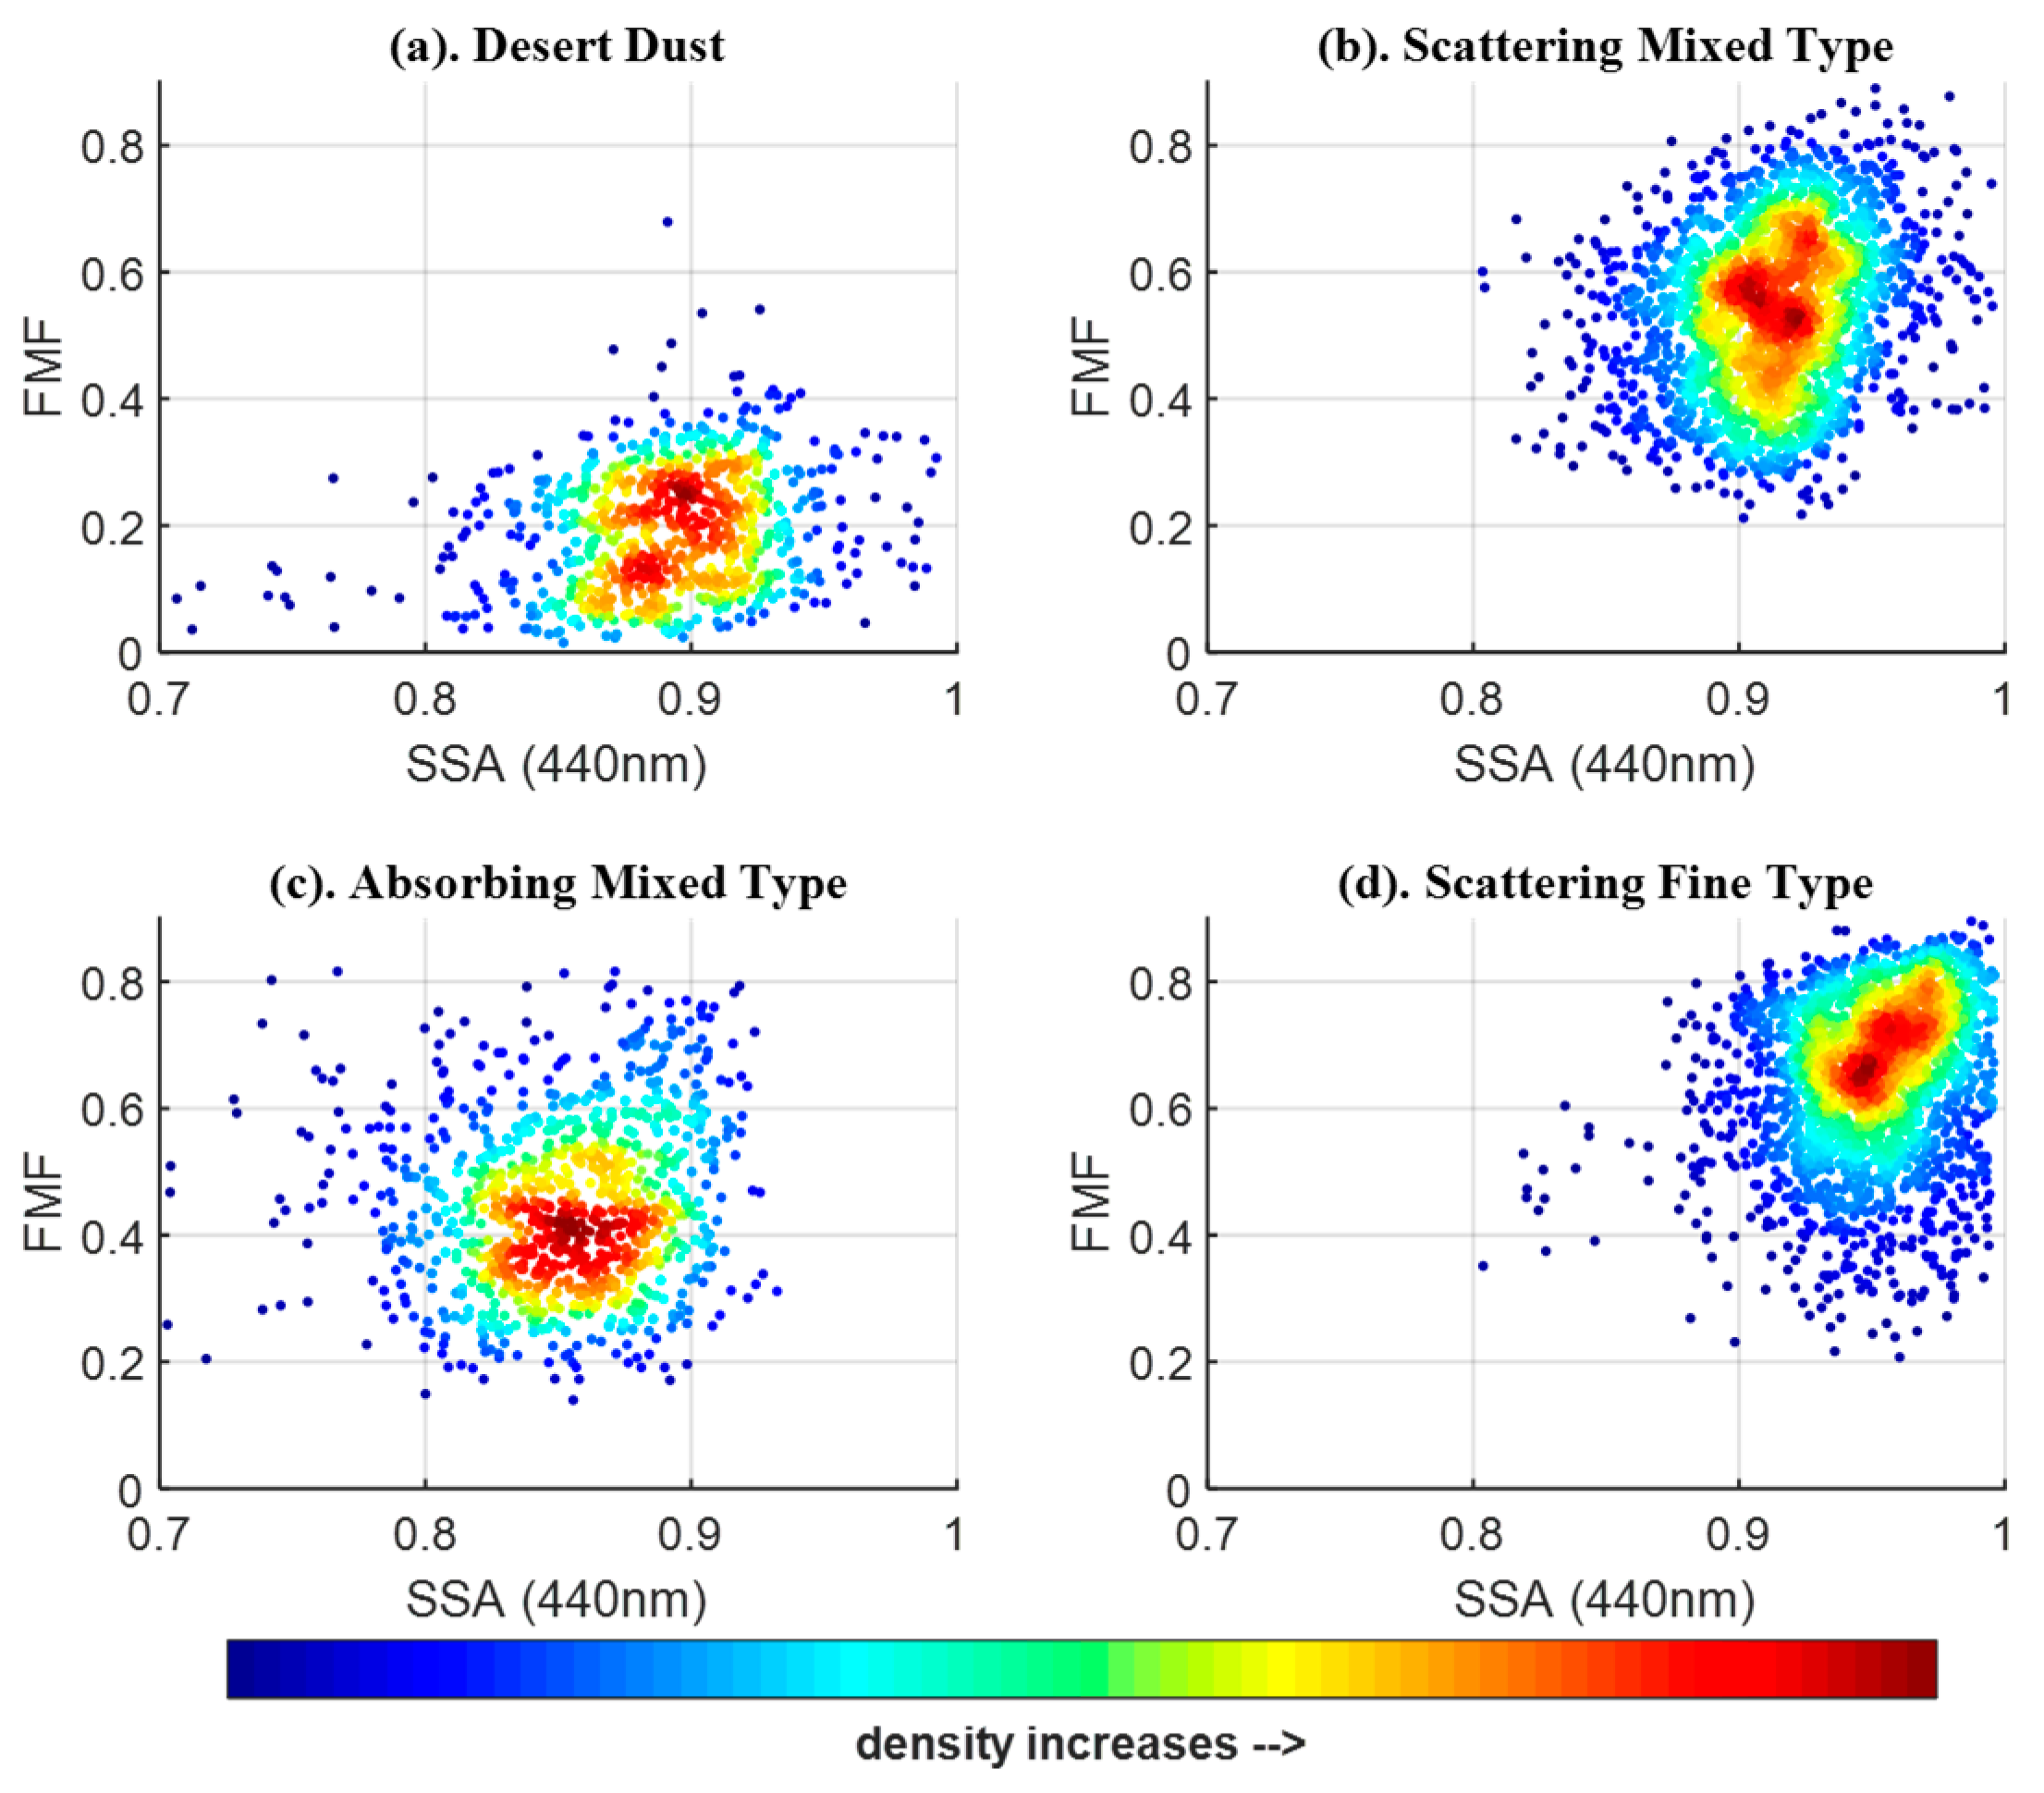
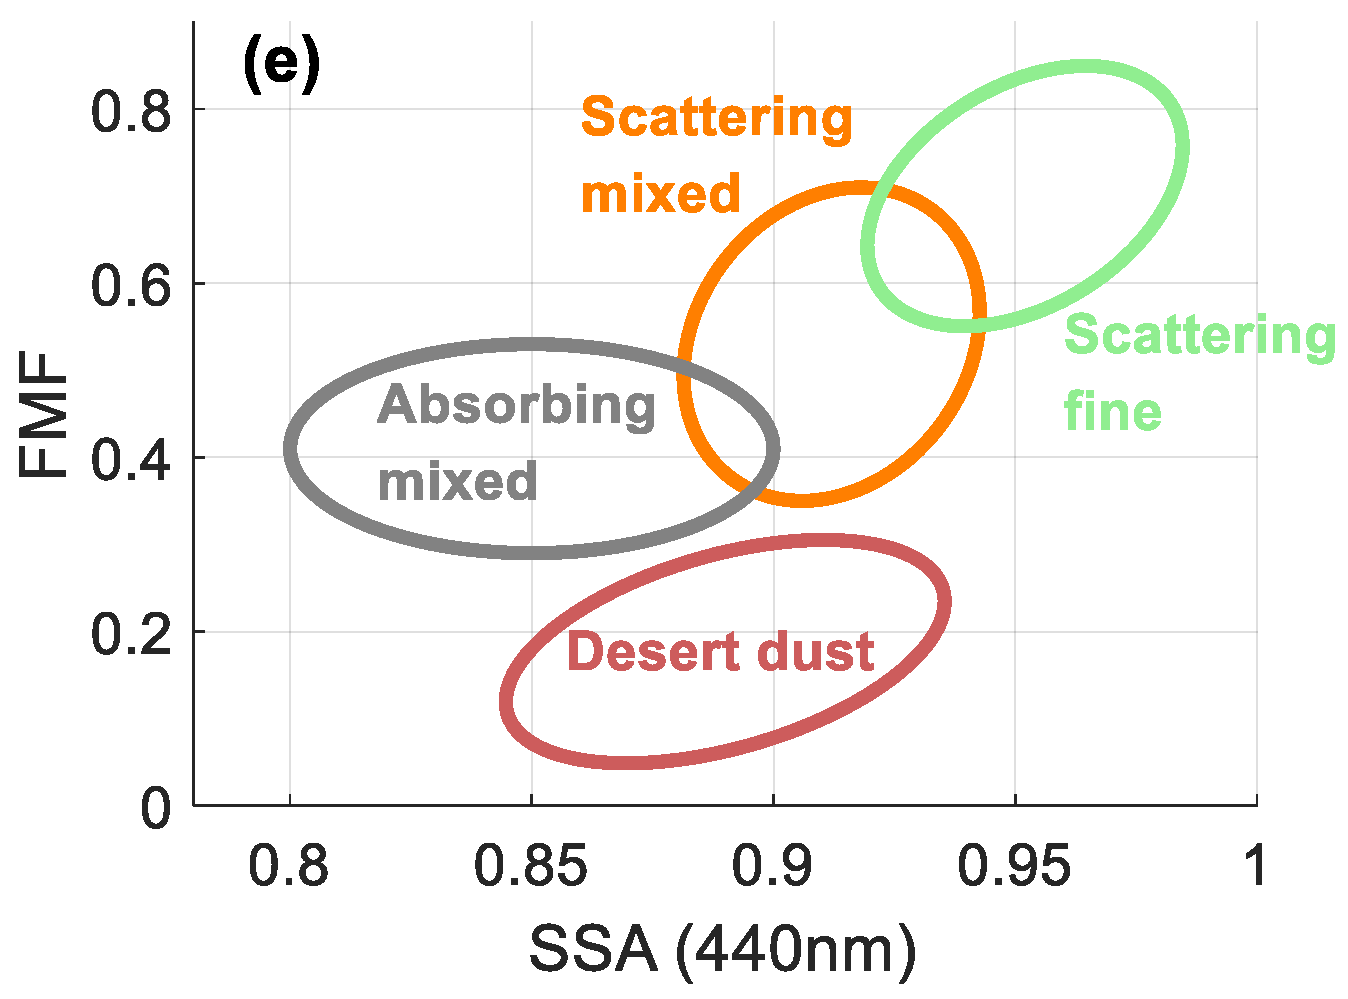
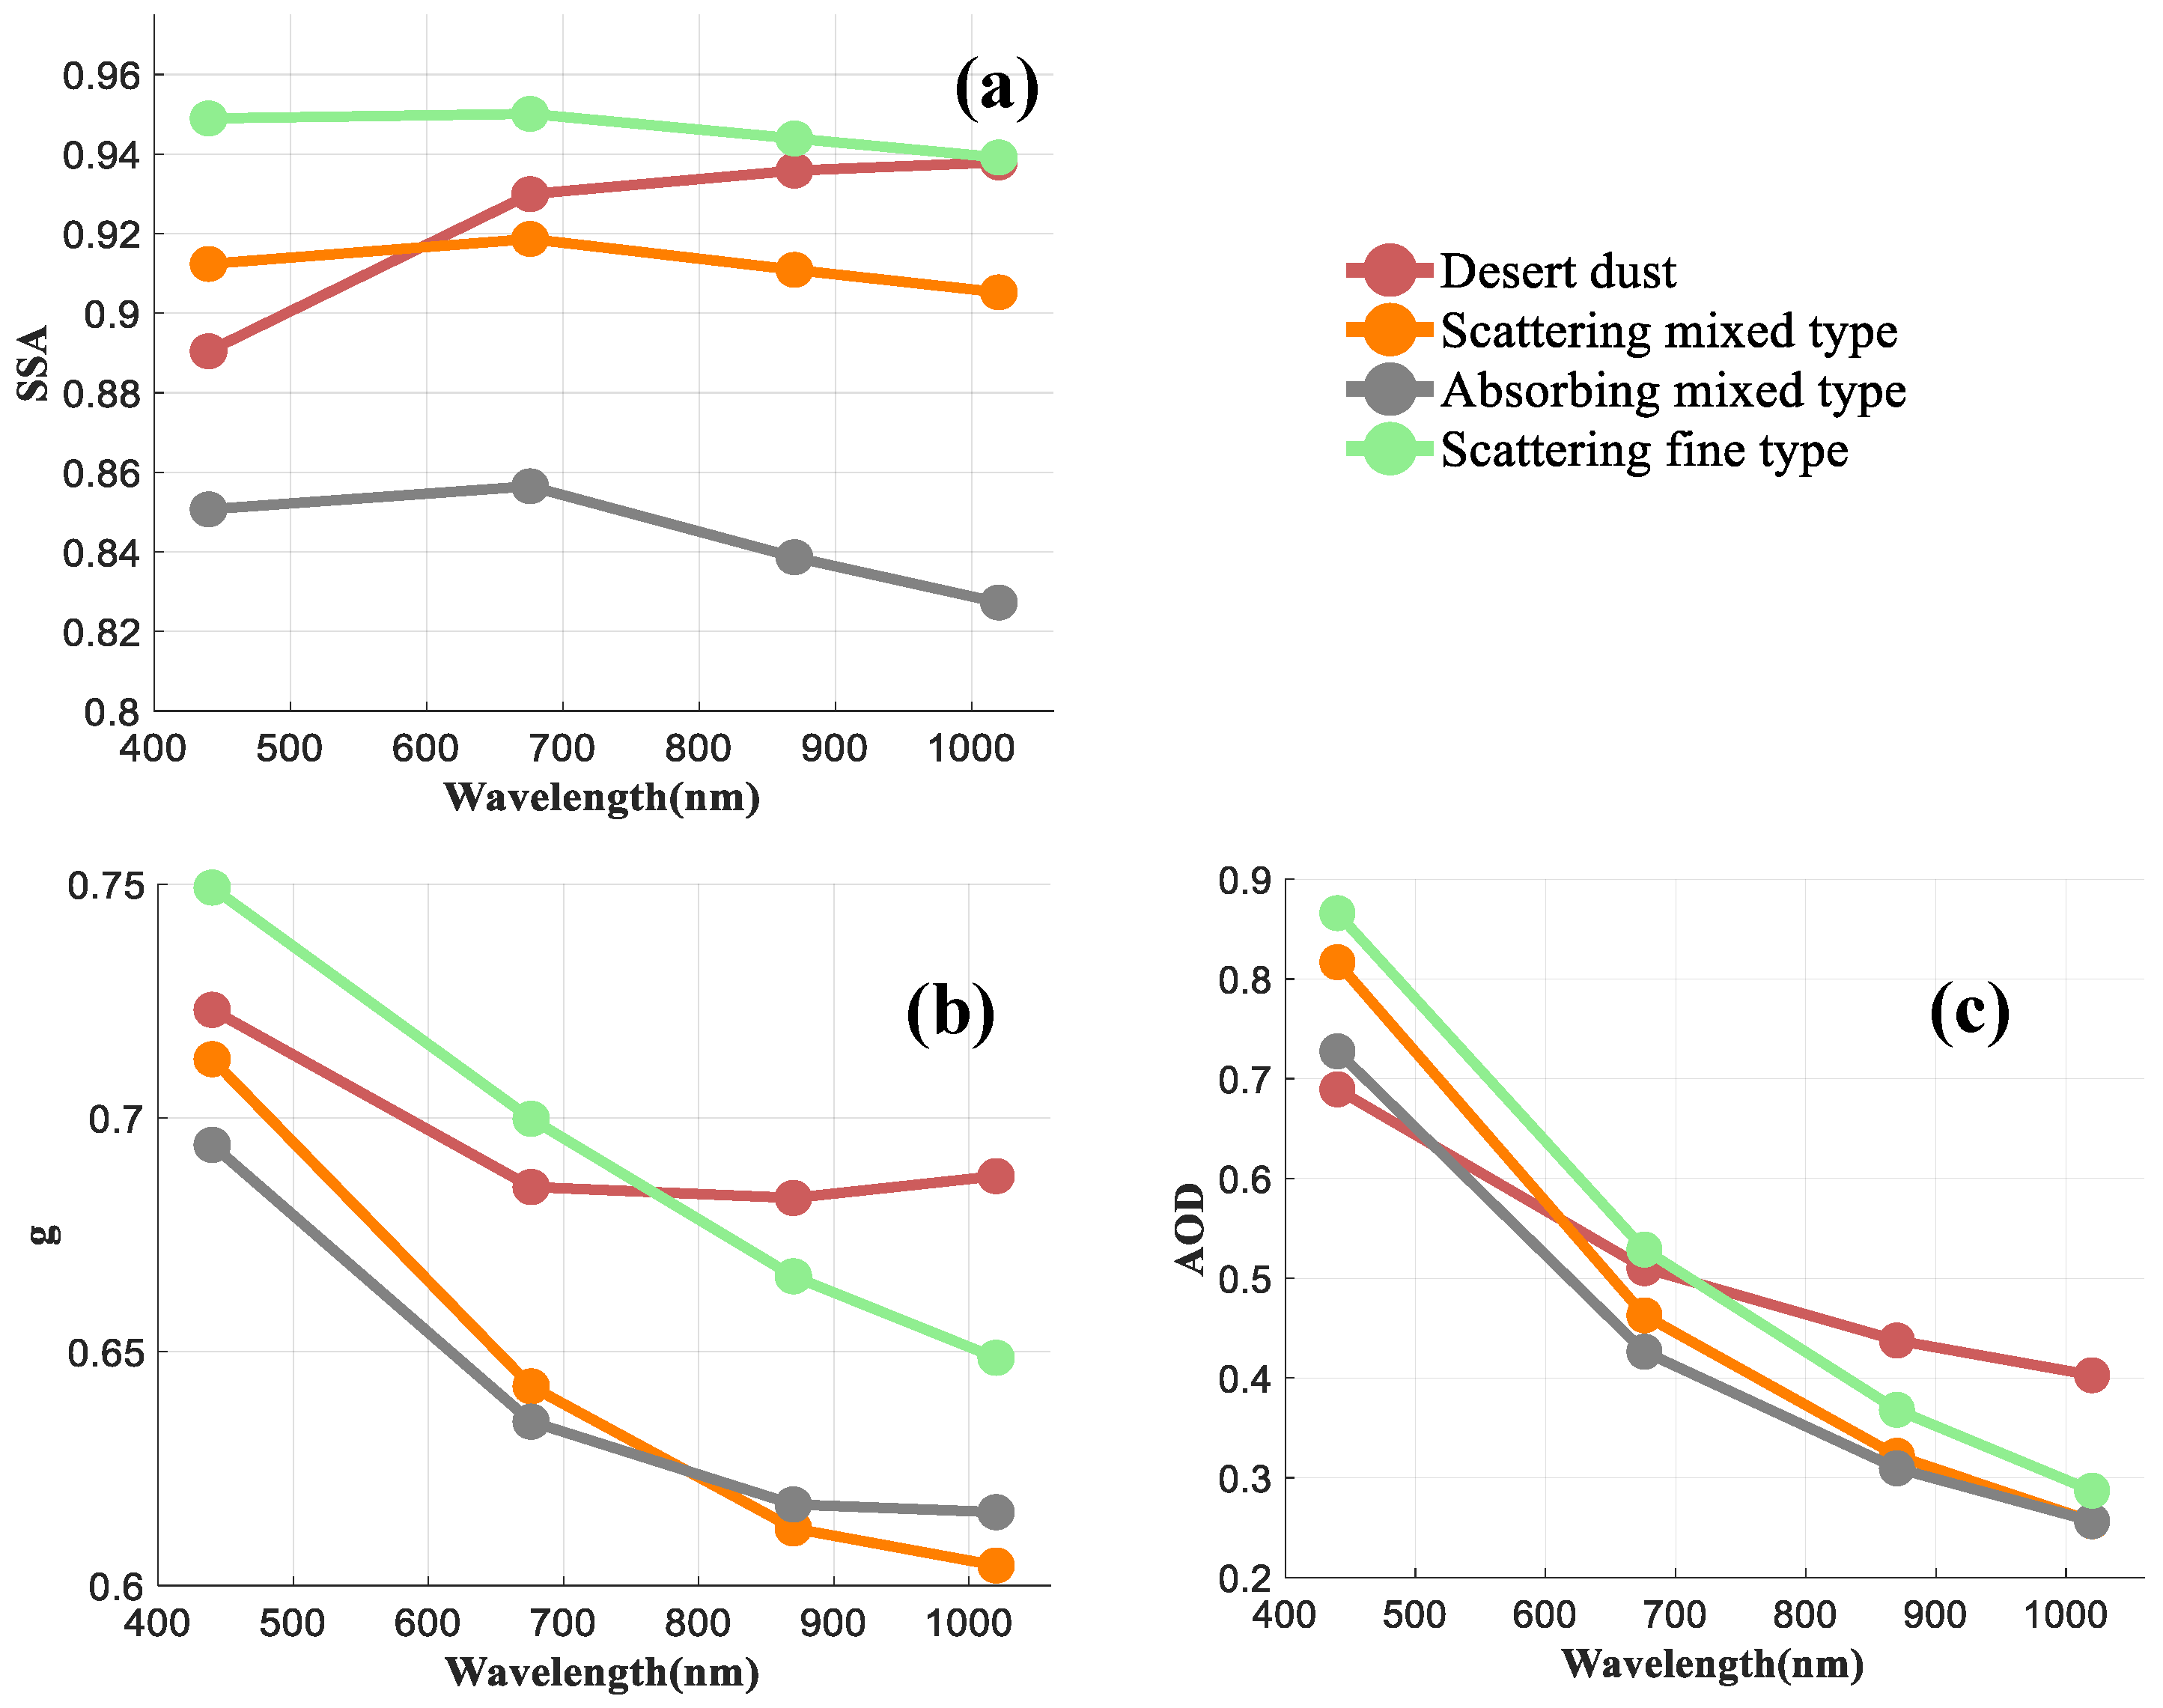
3.1. Clustering Analysis
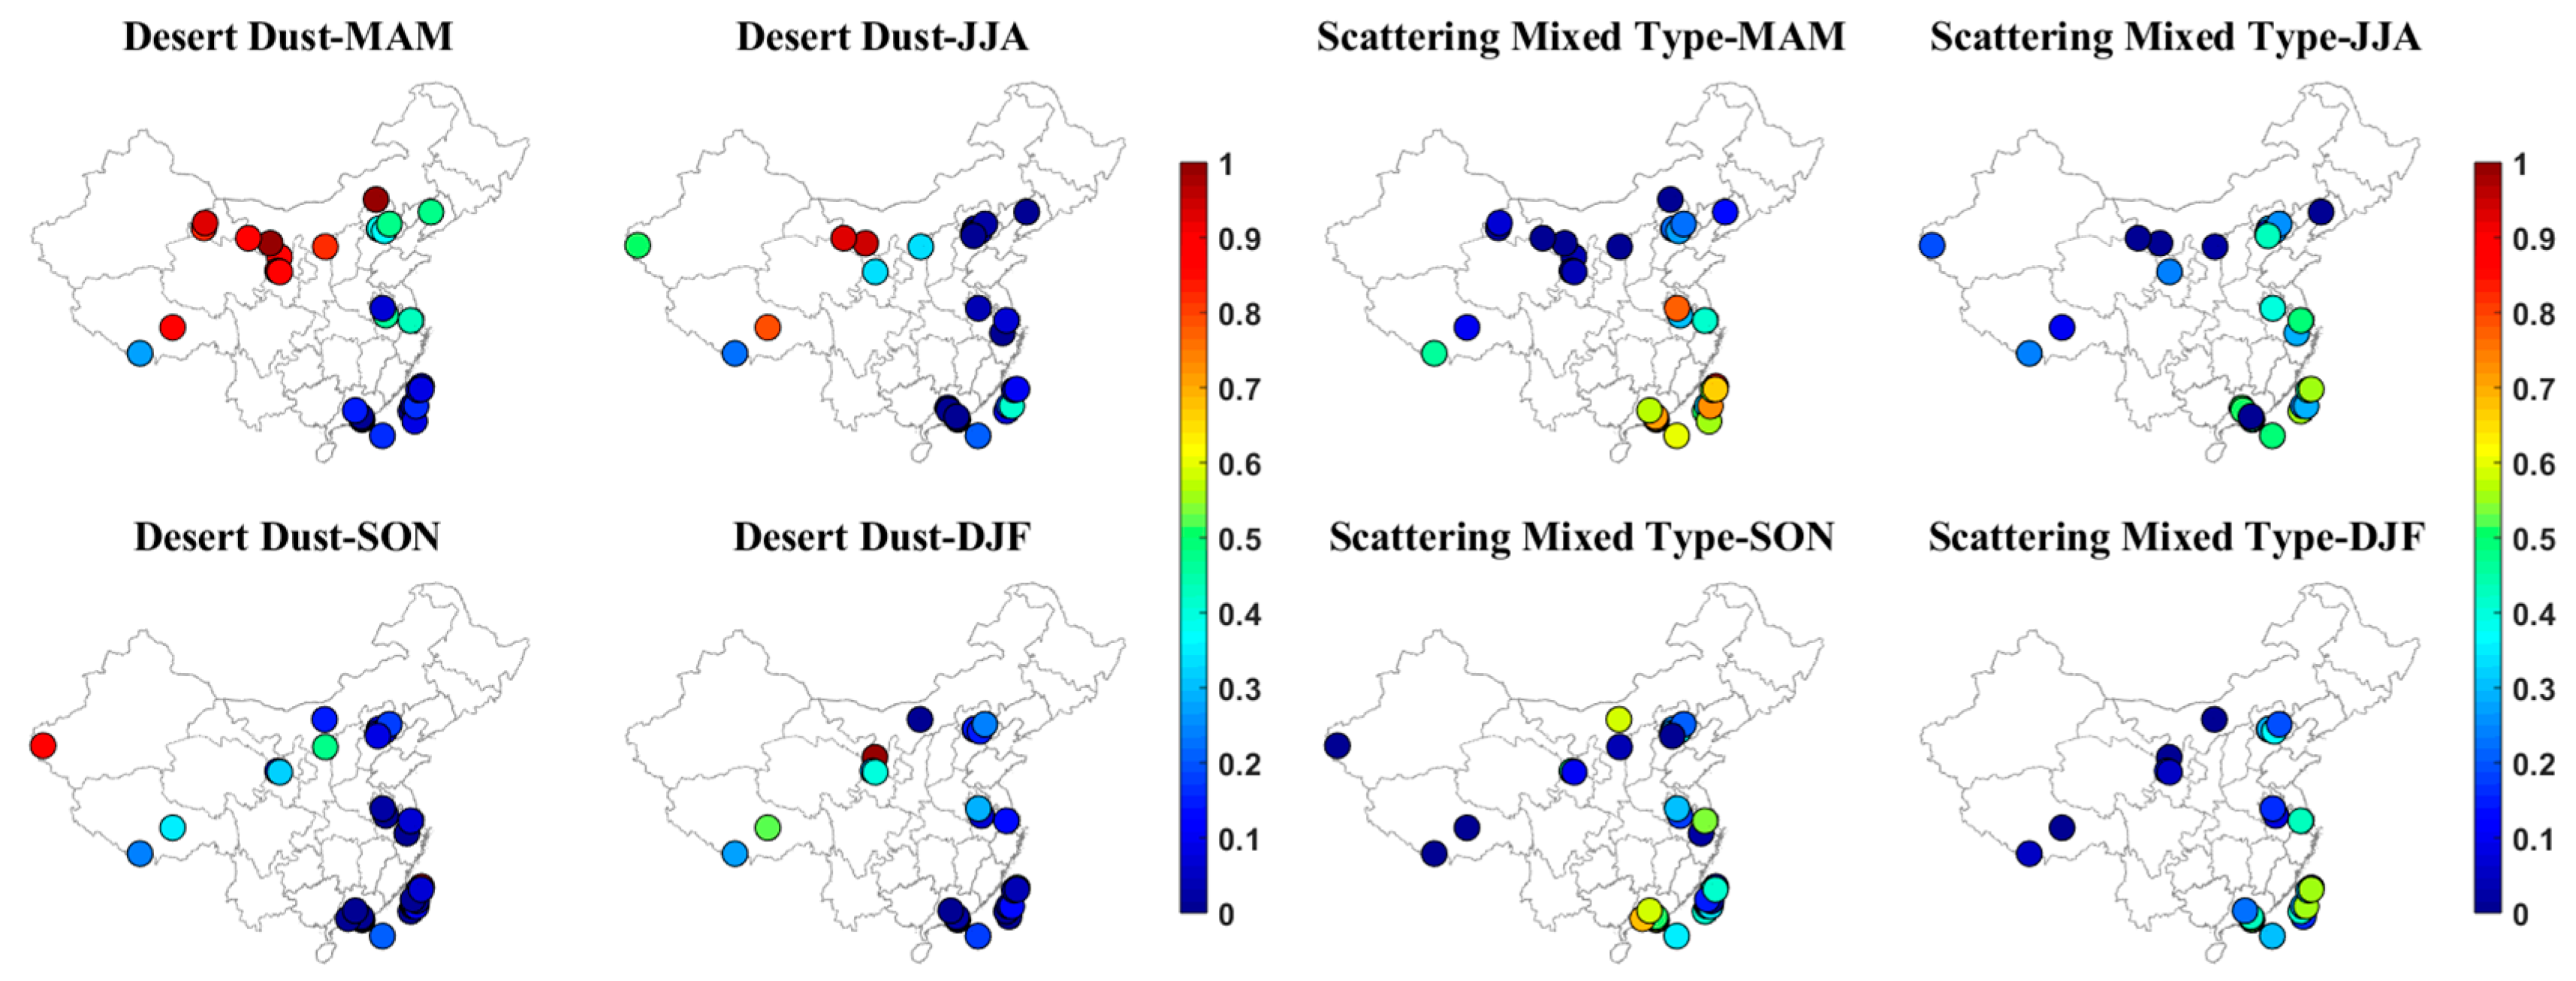
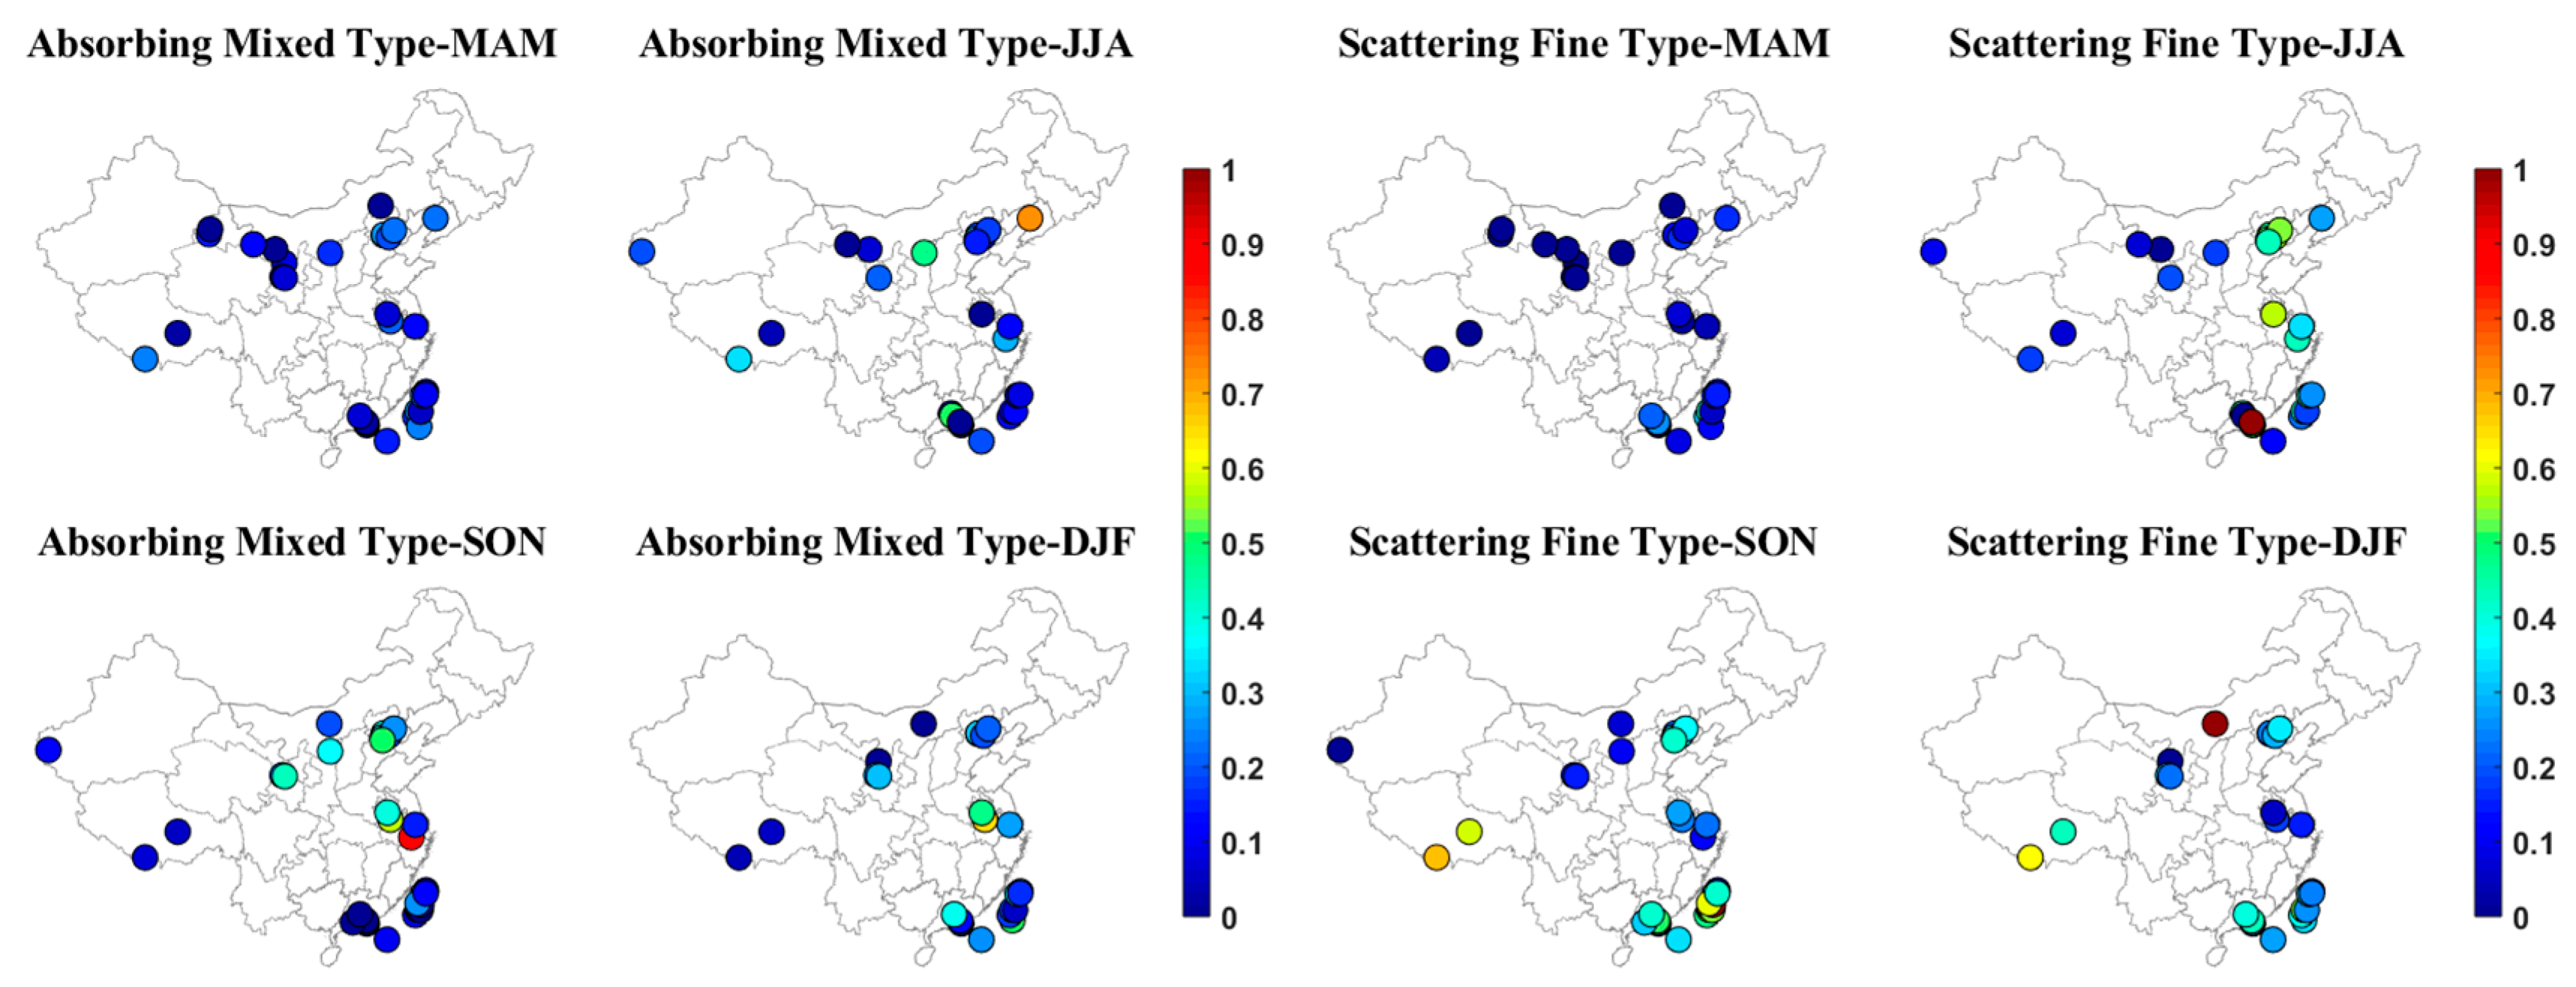
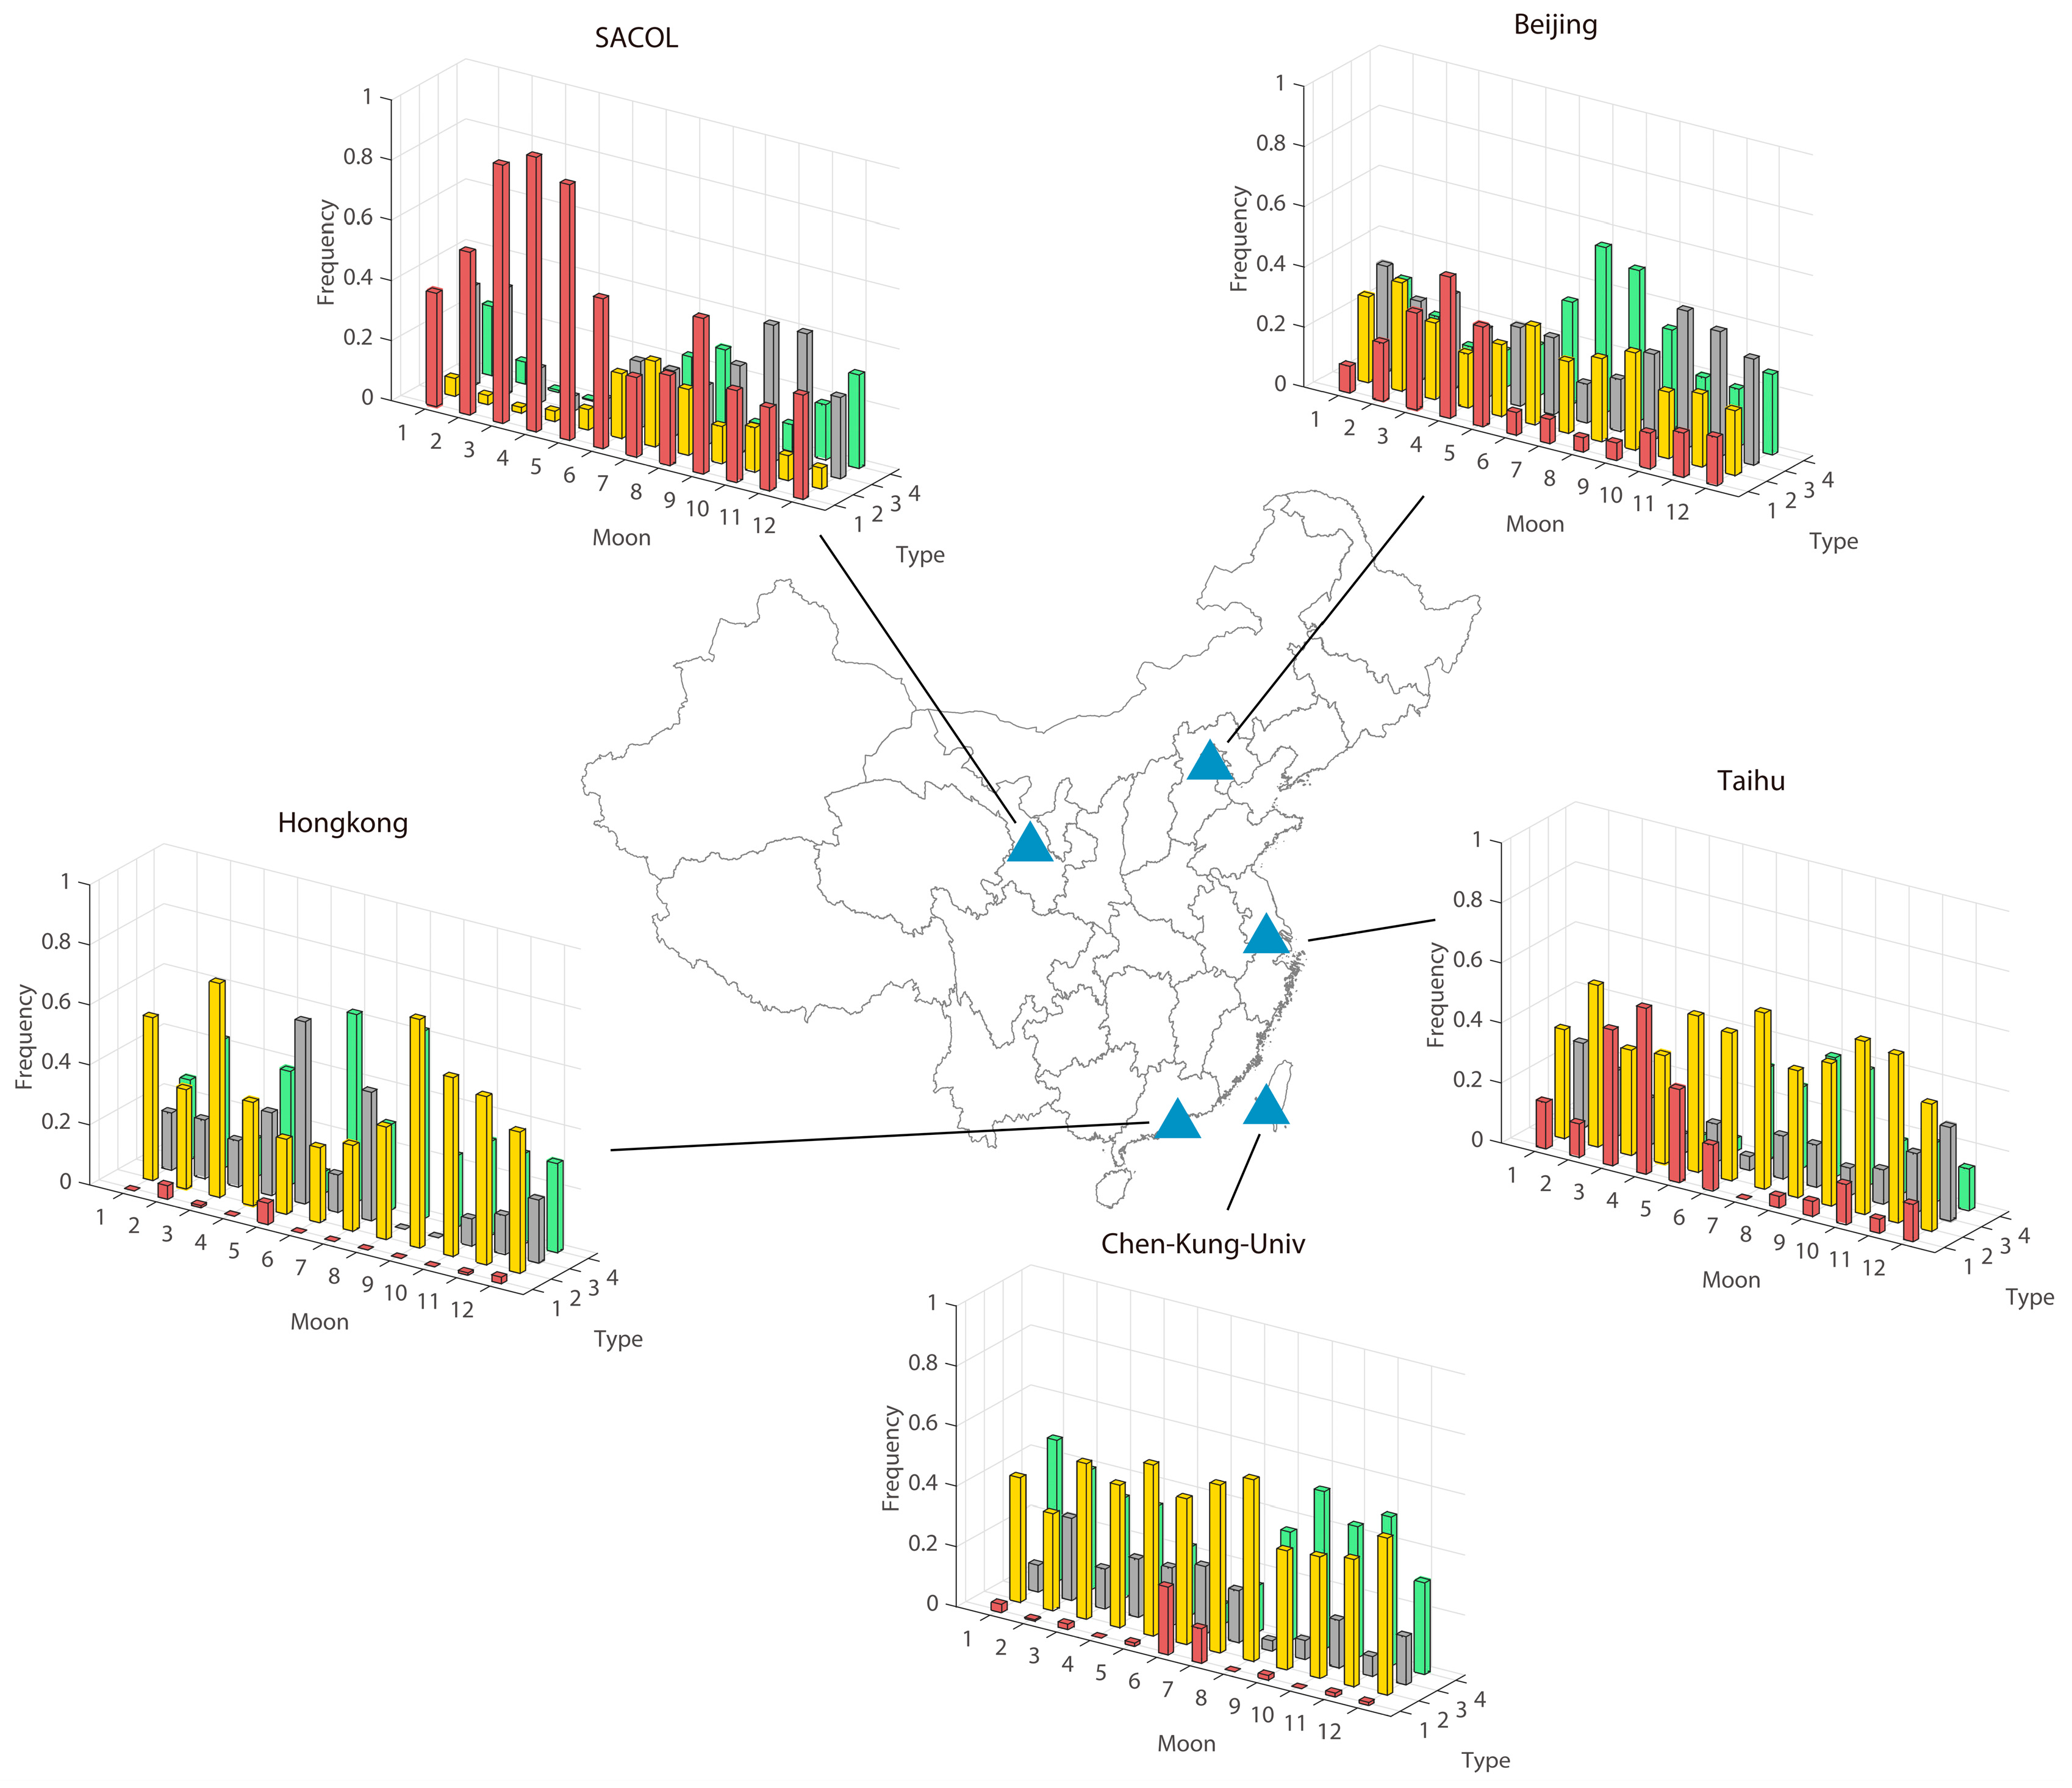
3.2. Spatial Distribution and Seasonal Variability of the Aerosol Types
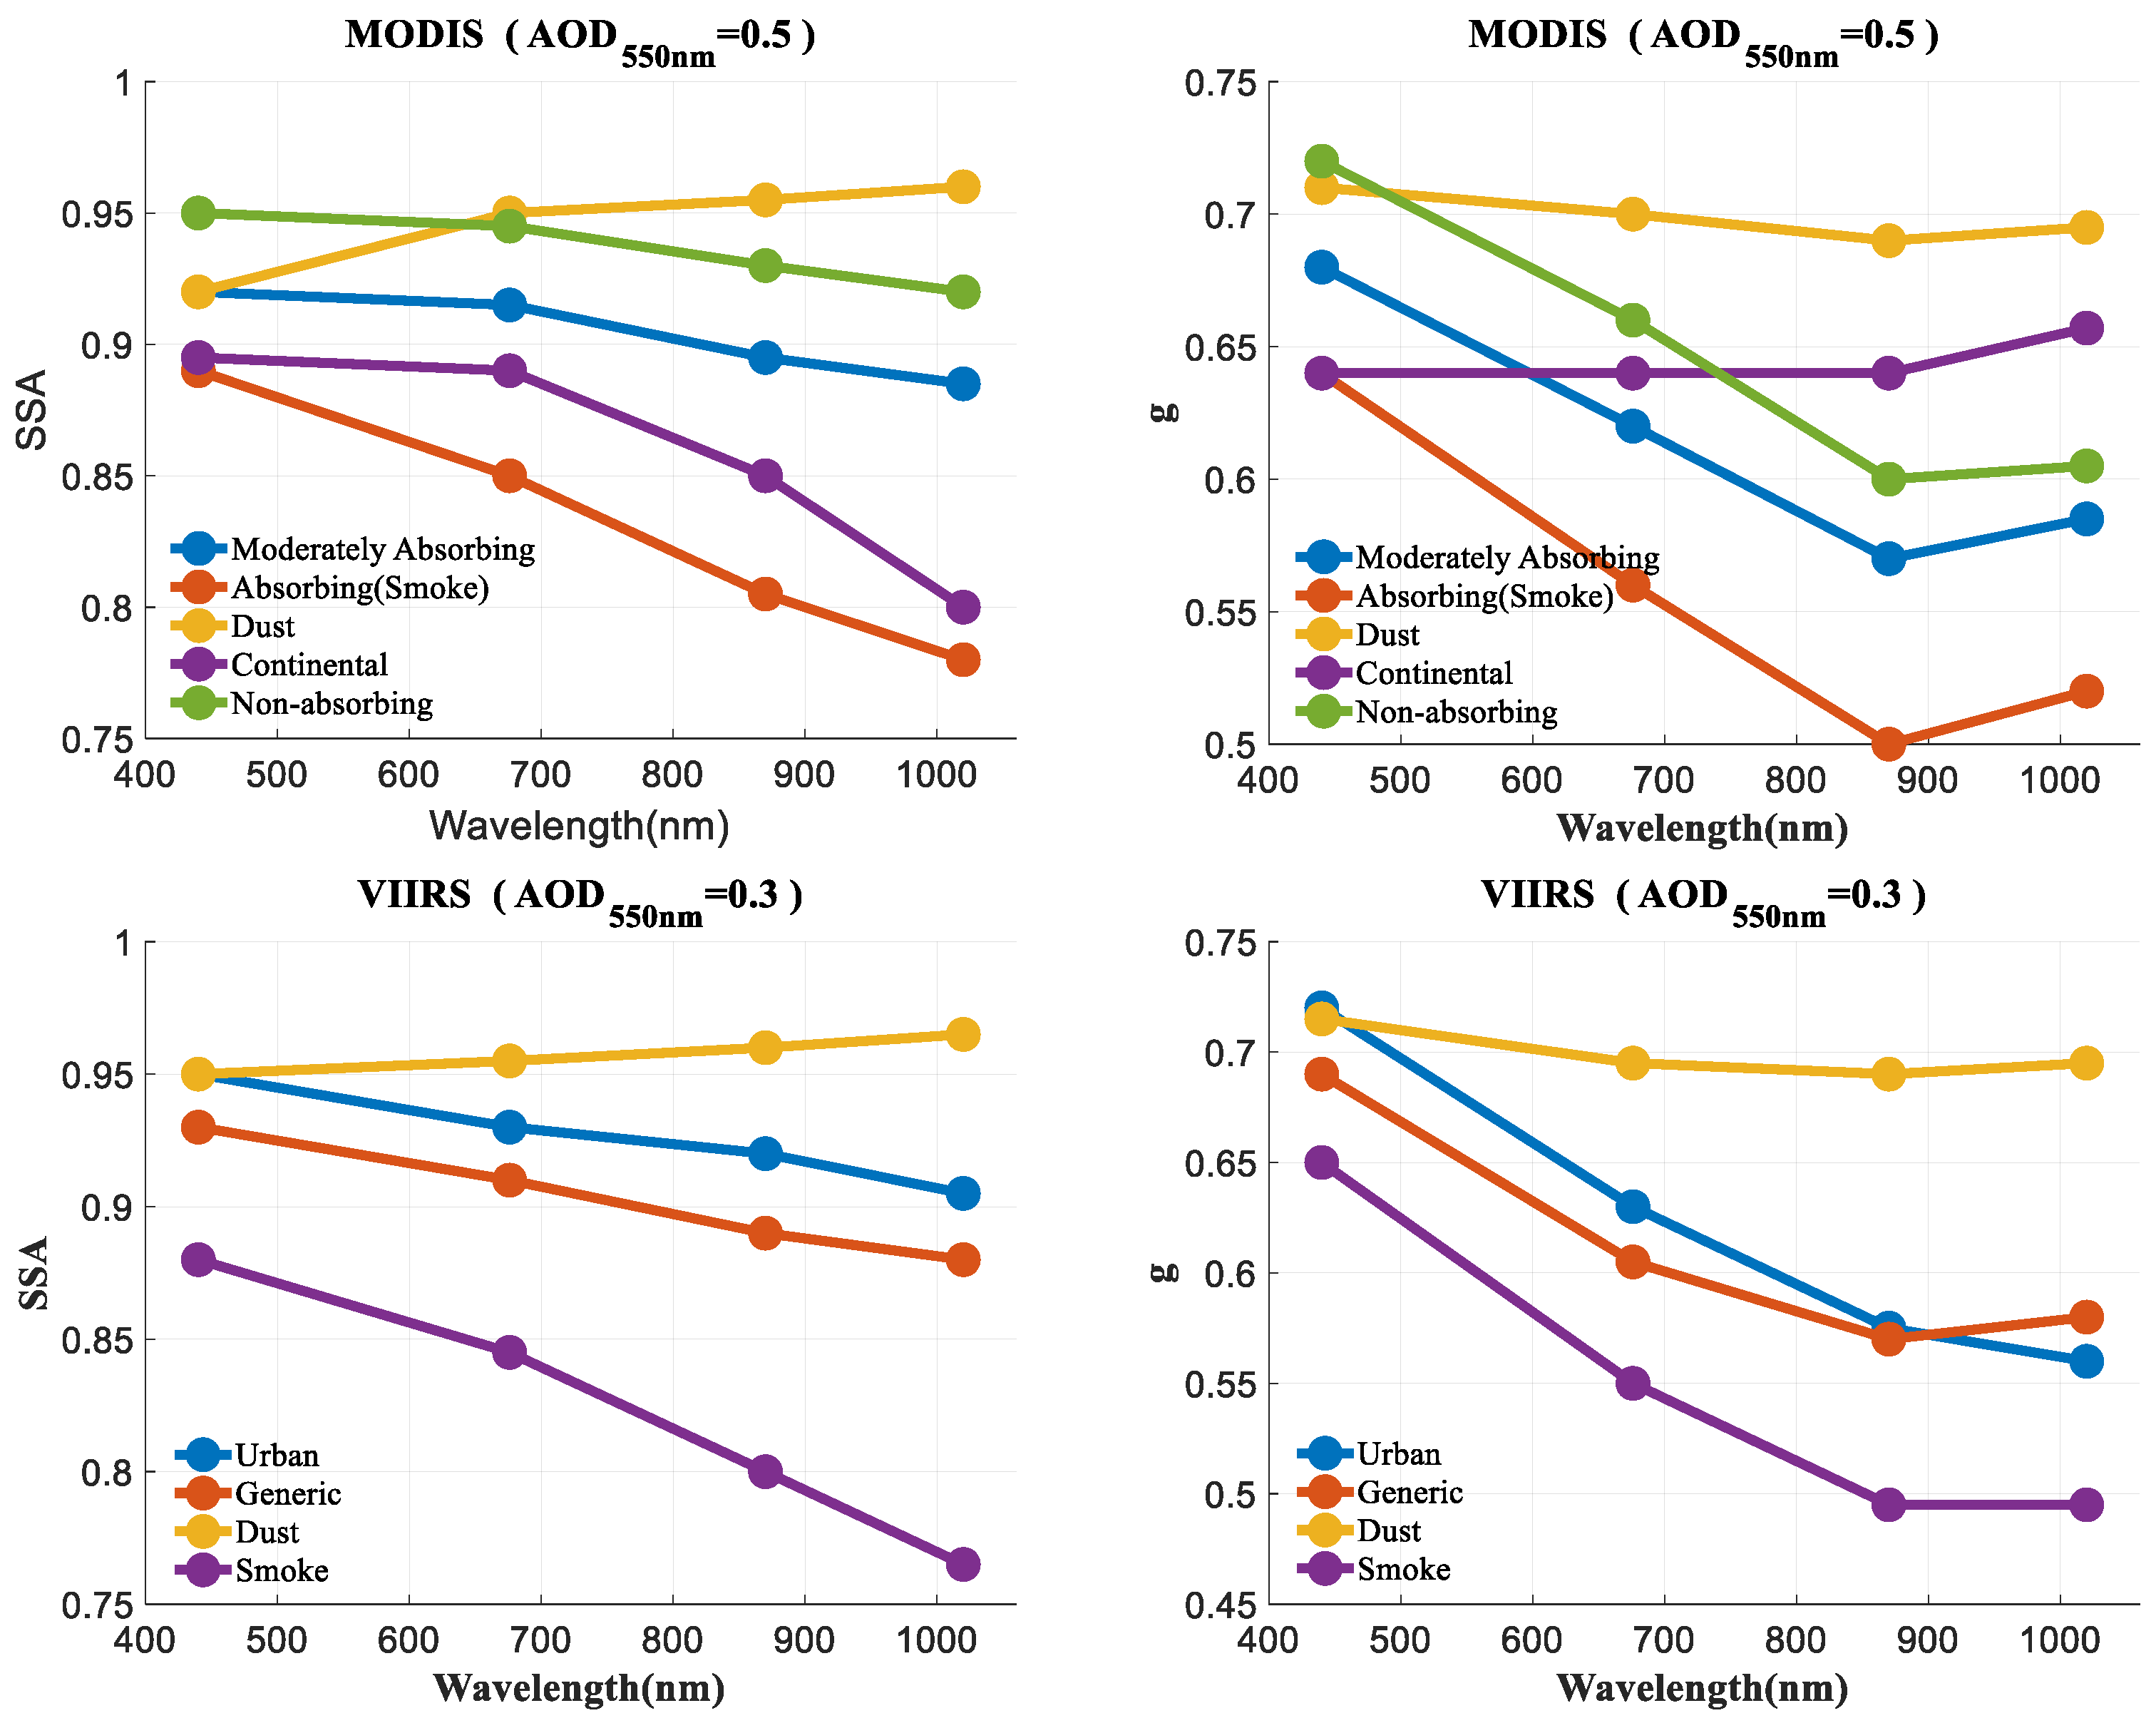
3.3. Aerosol Type Map for Satellite Remote Sensing
4. Conclusions and Discussion
Author Contributions
Funding
Acknowledgments
Conflicts of Interest
References
- Che, H.; Qi, B.; Zhao, H.; Xia, X.; Eck, T.F.; Goloub, P.; Dubovik, O.; Estelles, V.; Cuevasagullo, E.; Blarel, L.; et al. Aerosol optical properties and direct radiative forcing based on measurements from the China Aerosol Remote Sensing Network (CARSNET) in eastern China. Atmos. Chem. Phys. 2018, 18, 405–425. [Google Scholar] [CrossRef]
- Miao, Y.; Liu, S. Linkages between aerosol pollution and planetary boundary layer structure in China. Sci. Total Environ. 2019, 650, 288–296. [Google Scholar] [CrossRef]
- Mu, Q.; Liao, H. Simulation of the interannual variations of aerosols in China: Role of variations in meteorological parameters. Atmos. Chem. Phys. 2014, 14, 9597–9612. [Google Scholar] [CrossRef]
- Reddy, K.R.O.; Zhang, X.; Bi, L. Seasonal aerosol variations over a coastal city, Zhoushan, China from CALIPSO observations. Atmos. Res. 2019, 218, 117–128. [Google Scholar] [CrossRef]
- Sun, Y.; Wang, Z.F.; Fu, P.; Yang, T.; Jiang, Q.; Dong, H.; Li, J.; Jia, J.J. Aerosol composition, sources and processes during wintertime in Beijing, China. Atmos. Chem. Phys. 2013, 13, 4577–4592. [Google Scholar] [CrossRef]
- Tian, P.; Cao, X.; Zhang, L.; Sun, N.; Sun, L.; Logan, T.; Shi, J.; Wang, Y.; Ji, Y.; Lin, Y.; et al. Aerosol vertical distribution and optical properties over China from long-term satellite and ground-based remote sensing. Atmos. Chem. Phys. 2017, 17, 2509–2523. [Google Scholar] [CrossRef]
- Zhang, X.Y.; Wang, Y.; Niu, T.; Zhang, X.; Gong, S.L.; Zhang, Y.; Sun, J. Atmospheric aerosol compositions in China: Spatial/temporal variability, chemical signature, regional haze distribution and comparisons with global aerosols. Atmos. Chem. Phys. 2012, 12, 779–799. [Google Scholar] [CrossRef]
- Levy, R.C.; Remer, L.A.; Kleidman, R.; Mattoo, S.; Ichoku, C.; Kahn, R.A.; Eck, T.F. Global evaluation of the Collection 5 MODIS dark-target aerosol products over land. Atmos. Chem. Phys. 2010, 10, 10399–10420. [Google Scholar] [CrossRef]
- Levy, R.C.; Munchak, L.; Mattoo, S.; Patadia, F.; Remer, L.A.; Holz, R.E. Towards a long-term global aerosol optical depth record: Applying a consistent aerosol retrieval algorithm to modis and viirs-observed reflectance. Atmos. Meas. Tech. 2015, 8, 4083–4110. [Google Scholar] [CrossRef]
- Mielonen, T.; Levy, R.C.; Aaltonen, V.; Komppula, M.; Leeuw, G.D.; Huttunen, J.; Lihavainen, H.; Kolmonen, P.; Lehtinen, K.E.J.; Arola, A. Evaluating the assumptions of surface reflectance and aerosol type selection within the MODIS aerosol retrieval over land: The problem of dust type selection. Atmos. Meas. Tech. 2011, 4, 201–214. [Google Scholar] [CrossRef]
- Oo, M.M.; Jerg, M.; Hernandez, E.; Picon, A.; Gross, B.; Moshary, F.; Ahmed, S. Improved MODIS Aerosol Retrieval Using Modified VIS/SWIR Surface Albedo Ratio Over Urban Scenes. IEEE Trans. Geosci. Remote 2010, 48, 983–1000. [Google Scholar] [CrossRef]
- Zhang, H.; Kondragunta, S.; Laszlo, I.; Liu, H.; Remer, L.A.; Huang, J.; Superczynski, S.; Ciren, P. An enhanced VIIRS aerosol optical thickness (AOT) retrieval algorithm over land using a global surface reflectance ratio database. J. Geophys. Res. 2016, 121, 10738. [Google Scholar] [CrossRef]
- Li, C.; Li, J.; Xu, H.; Li, Z.; Xia, X.; Che, H. Evaluating VIIRS EPS Aerosol Optical Depth in China: An intercomparison against ground-based measurements and MODIS. J. Quant. Spectrosc. Radiat. 2019, 224, 368–377. [Google Scholar] [CrossRef]
- Tao, M.; Chen, L.; Wang, Z.; Tao, J.; Che, H.; Wang, X.; Wang, Y. Comparison and evaluation of the MODIS Collection 6 aerosol data in China. J. Geophys. Res. 2015, 120, 6992–7005. [Google Scholar] [CrossRef]
- Zhang, J.; Xin, J.; Zhang, W.; Wang, S.; Wang, L.; Xie, W.; Xiao, G.; Pan, H.; Kong, L. Validation of MODIS C6 AOD Products Retrieved by the Dark Target Method in the Beijing-Tianjin-Hebei Urban Agglomeration, China. Adv. Atmos. Sci. 2017, 34, 993–1002. [Google Scholar] [CrossRef]
- Zhu, J.; Xia, X.; Wang, J.; Che, H.; Chen, H.; Zhang, J.; Xu, X.; Levy, R.C.; Oo, M.; Holz, R.; et al. Evaluation of Aerosol Optical Depth and Aerosol Models from VIIRS Retrieval Algorithms over North China Plain. Remote Sens. 2017, 9, 432. [Google Scholar] [CrossRef]
- Omar, A.H.; Won, J.; Winker, D.M.; Yoon, S.; Dubovik, O.; Mccormick, M.P. Development of global aerosol models using cluster analysis of Aerosol Robotic Network (AERONET) measurements. J. Geophys. Res. 2005, 110, D10S14. [Google Scholar] [CrossRef]
- Logan, T.; Xi, B.; Dong, X.; Li, Z.; Cribb, M. Classification and investigation of Asian aerosol absorptive properties. Atmos. Chem. Phys. 2013, 13, 2253–2265. [Google Scholar] [CrossRef]
- Chen, H.; Gu, X.; Cheng, T.; Yu, T.; Li, Z. Characteristics of aerosol types over China. J. Remote Sens. 2013, 17, 1559–1571. [Google Scholar] [CrossRef]
- Xie, Y.; Li, Z.; Li, D.; Xu, H.; Li, K. Aerosol Optical and Microphysical Properties of Four Typic al Sites of SONET in China Based on Remote, Sensing Measurements. Remote Sens. 2015, 7, 9928–9953. [Google Scholar] [CrossRef]
- Schmeisser, L.; Andrews, E.; Ogren, J.A.; Sheridan, P.J.; Jefferson, A.; Sharma, S.; Kim, J.; Sherman, J.; Sorribas, M.; Kalapov, I.; et al. Classifying aerosol type using in situ surface spectral aerosol optical properties. Atmos. Chem. Phys. 2017, 17, 12097–12120. [Google Scholar] [CrossRef]
- Holben, B.N.; Eck, T.F.; Slutsker, I.; Tanre, D.; Buis, J.P.; Setzer, A.W.; Vermote, E.F.; Reagan, J.A.; Kaufman, Y.J.; Nakajima, T.; et al. AERONET—A Federated Instrument Network and Data Archive for Aerosol Characterization. Remote Sens. Environ. 1998, 66, 1–16. [Google Scholar] [CrossRef]
- Davies, D.L.; Bouldin, D.W. A cluster separation measure. IEEE Trans. Pattern Anal. 1979, 1, 224–227. [Google Scholar] [CrossRef]
- Vesanto, J. SOM-Based Data Visualization Methods. Intell. Data Anal. 1999, 3, 111–126. [Google Scholar] [CrossRef]
- Bergstrom, R.W.; Pilewskie, P.; Russell, P.B.; Redemann, J.; Bond, T.C.; Quinn, P.K.; Sierau, B. Spectral absorption properties of atmospheric aerosols. Atmos. Chem. Phys. 2007, 7, 5937–5943. [Google Scholar] [CrossRef]
- Dubovik, O.; Holben, B.; Eck, T.F.; Smirnov, A.; Kaufman, Y.J.; King, M.D.; Tanre, D.; Slutsker, I. Variability of Absorption and Optical Properties of Key Aerosol Types Observed in Worldwide Locations. J. Atmos. Sci. 2002, 59, 590–608. [Google Scholar] [CrossRef]
- Li, J.; Carlson, B.E.; Lacis, A.A. Using single-scattering albedo spectral curvature to characterize East Asian aerosol mixtures. J. Geophys. Res. Atmos. 2015, 120, 2037–2052. [Google Scholar] [CrossRef]
- Russell, P.B.; Bergstrom, R.W.; Shinozuka, Y.; Clarke, A.D.; Decarlo, P.F.; Jimenez, J.L.; Livingston, J.M.; Redemann, J.; Holben, B.; Dubovik, O.; et al. Absorption Angstrom Exponent in AERONET and related data as an indicator of aerosol composition. Atmos. Chem. Phys. 2010, 9, 21785–21817. [Google Scholar] [CrossRef]
- Cao, C.; Zheng, S.; Singh, R.P. Characteristics of aerosol optical properties and meteorological parameters during three major dust events (2005–2010) over Beijing, China. Atmos. Res. 2014, 150, 129–142. [Google Scholar] [CrossRef]
- Wehner, B.; Wiedensohler, A.; Tuch, T.M.; Wu, Z.J.; Hu, M.; Slanina, J.; Kiang, C.S. Variability of the aerosol number size distribution in Beijing, China: New particle formation, dust storms, and high continental background. Geophys. Res. Lett. 2004, 31, L22108. [Google Scholar] [CrossRef]
- Yu, X.; Lu, R.; Kumar, K.R.; Ma, J.; Zhang, Q.; Jiang, Y.; Kang, N.; Yang, S.; Wang, J.; Li, M. Dust aerosol properties and radiative forcing observed in spring during 2001–2014 over urban Beijing, China. Environ. Sci. Pollut. Res. 2016, 23, 15432–15442. [Google Scholar] [CrossRef] [PubMed]
- Sahu, L.K.; Sheel, V. Spatio-temporal variation of biomass burning sources over South and Southeast Asia. J. Atmos. Chem. 2014, 71, 1–19. [Google Scholar] [CrossRef]
- Che, H.; Xia, X.; Zhu, J.; Li, Z.; Dubovik, O.; Holben, B.N.; Goloub, P.; Chen, H.; Estelles, V.; Cuevasagullo, E.; et al. Column aerosol optical properties and aerosol radiative forcing during a serious haze-fog month over North China Plain in 2013 based on ground-based sunphotometer measurements. Atmos. Chem. Phys. 2014, 14, 2125–2138. [Google Scholar] [CrossRef]
- Zhang, X.Y.; Wang, Y.Q.; Zhang, X.; Guo, W.; Gong, S.L. Carbonaceous aerosol composition over various regions of China during 2006. J. Geophys. Res. 2008, 113, D14111. [Google Scholar] [CrossRef]
- Hennigan, C.J.; Bergin, M.H.; Dibb, J.E.; Weber, R.J. Enhanced Secondary Organic Aerosol Formation due to Water Uptake by Fine Particles. Geophys. Res. Lett. 2008, 35, L18801. [Google Scholar] [CrossRef]
- Tao, J.; Zhang, L.; Cao, J.; Zhang, R. A review of current knowledge concerning PM2.5 chemical composition, aerosol optical properties, and their relationships across China. Atmos. Chem. Phys. 2017, 17, 9485–9518. [Google Scholar] [CrossRef]
- Sun, Y.; Wang, Z.; Du, W.; Zhang, Q.; Wang, Q.Q.; Fu, P.; Pan, X.; Li, J.; Jayne, J.T.; Worsnop, D.R. Long-term real-time measurements of aerosol particle composition in Beijing, China: Seasonal variations, meteorological effects, and source analysis. Atmos. Chem. Phys. 2015, 15, 10149–10165. [Google Scholar] [CrossRef]
- Levy, R.C.; Remer, L.A.; Dubovik, O. Global aerosol optical properties and application to Moderate Resolution Imaging Spectroradiometer aerosol retrieval over land. J. Geophys. Res. 2007, 112. [Google Scholar] [CrossRef]
- Laszlo, I.; Liu, H. EPS Aerosol Optical Depth (AOD) Algorithm Theoretical Basis Document; NOAA NESDIS Center for Satellite Applications and Research: College Park, MD, USA, 2016.
- Li, C.; Li, J. Impact of aerosol vertical distribution of aerosol optical depth retrieval from passive satellite sensors. Remote Sens. Environ. (paper submitted).


| Parameters | Variables |
|---|---|
| Angstrom Exponent 3 | Angstrom Exponent-Total, |
| Absorption Angstrom Exponent, | |
| Alpha | |
| Single Scattering Albedo | SSA440 1 -T 2, SSA676 1 -T 2, |
| SSA869 1 -T 2, SSA1020 1 -T 2 | |
| Imaginary Part of the Complex Refractive Index | REFI (440 1), REFI (676 1), |
| REFI (869 1), REFI (1020 1) | |
| Real Part of the Complex Refractive Index | REFR (440 1), REFR (676 1), |
| REFR (869 1), REFR (1020 1) | |
| Asymmetry Parameter | ASYM440 1 -T 2, ASYM676 1 -T 2, |
| ASYM869 1 -T 2, ASYM1020 1 -T 2 | |
| Volume Concentration | VolCon-F 2, VolCon-C 2 |
| Effective Radius | EffRad-F 2, EffRad-C 2 |
| Standard Deviation of Effective Radius | StdDev-F 2, StdDev-C 2 |
| Area | Raw Data | After Removing N/A | After Time and Space Uniform Processing | |||
|---|---|---|---|---|---|---|
| Number of Sites | Number of Data | Number of Sites | Number of Data | Number of Sites | Number of Data | |
| Northwest China | 12 | 6882 | 10 | 1937 | 10 | 896 |
| North China Plain | 8 | 21,237 | 8 | 9235 | 6 | 2023 |
| Southeast China | 4 | 2942 | 4 | 2413 | 4 | 1025 |
| South China | 23 | 8188 | 21 | 4606 | 21 | 1938 |
| Type 1 (Desert Dust) | Type 2 (Scattering Mixed Type) | Type 3 (Absorbing Mixed Type) | Type 4 (Scattering Fine Type) | |
|---|---|---|---|---|
| Number of record | 802 (792) | 2071 (2090) | 976 (969) | 2033 (2031) |
| Angstrom Exponent − Total | 0.679 (0.674) | 1.375 (1.373) | 1.265 (1.264) | 1.269 (1.269) |
| SSA (440 nm) | 0.890 (0.890) | 0.912 (0.912) | 0.851 (0.850) | 0.949 (0.949) |
| SSA (676 nm) | 0.930 (0.930) | 0.919 (0.918) | 0.856 (0.856) | 0.950 (0.950) |
| SSA (869 nm) | 0.936 (0.936) | 0.911 (0.911) | 0.839 (0.838) | 0.944 (0.944) |
| SSA (1020 nm) | 0.938 (0.938) | 0.905 (0.905) | 0.827 (0.827) | 0.939 (0.939) |
| Absorption Angstrom Exponent | 1.577 (1.580) | 1.362 (1.361) | 1.184 (1.183) | 1.177 (1.178) |
| REFR (440 nm) | 1.500 (1.500) | 1.443 (1.443) | 1.489 (1.489) | 1.420 (1.420) |
| REFR (676 nm) | 1.527 (1.527) | 1.461 (1.462) | 1.508 (1.508) | 1.423 (1.423) |
| REFR (869 nm) | 1.530 (1.530) | 1.472 (1.472) | 1.520 (1.520) | 1.424 (1.424) |
| REFR (1020 nm) | 1.527 (1.527) | 1.471 (1.471) | 1.523 (1.523) | 1.419 (1.419) |
| REFI (440 nm) | 0.008 (0.008) | 0.011 (0.011) | 0.022 (0.022) | 0.007 (0.006) |
| REFI (676 nm) | 0.005 (0.005) | 0.008 (0.008) | 0.017 (0.018) | 0.006 (0.006) |
| REFI (869 nm) | 0.004 (0.004) | 0.008 (0.008) | 0.018 (0.018) | 0.006 (0.006) |
| ASYM (440 nm)-T | 0.723 (0.723) | 0.713 (0.712) | 0.694 (0.694) | 0.749 (0.749) |
| ASYM (676 nm)-T | 0.685 (0.686) | 0.643 (0.643) | 0.635 (0.635) | 0.700 (0.700) |
| ASYM (869 nm)-T | 0.683 (0.683) | 0.612 (0.612) | 0.617 (0.618) | 0.666 (0.666) |
| ASYM (1020 nm)-T | 0.688 (0.688) | 0.604 (0.605) | 0.616 (0.616) | 0.649 (0.649) |
| VolCon-F (/) | 0.059 (0.059) | 0.105 (0.104) | 0.084 (0.084) | 0.118 (0.118) |
| EffRad-F () | 0.137 (0.137) | 0.163 (0.163) | 0.150 (0.150) | 0.214 (0.214) |
| StdDev-F | 0.527 (0.527) | 0.491 (0.491) | 0.504 (0.505) | 0.543 (0.543) |
| VolCon-C (/) | 0.277 (0.278) | 0.094 (0.094) | 0.111 (0.111) | 0.067 (0.067) |
| EffRad-C () | 1.982 (1.981) | 2.199 (2.198) | 2.249 (2.252) | 2.481 (2.481) |
| StdDev-C | 0.621 (0.620) | 0.627 (0.628) | 0.639 (0.638) | 0.583 (0.583) |
| Alpha | 0.668 (0.663) | 1.378 (1.376) | 1.262 (1.261) | 1.279 (1.280) |
| Fine Mode Fraction | 0.177 (0.175) | 0.528 (0.526) | 0.431 (0.432) | 0.637 (0.637) |
© 2019 by the authors. Licensee MDPI, Basel, Switzerland. This article is an open access article distributed under the terms and conditions of the Creative Commons Attribution (CC BY) license (http://creativecommons.org/licenses/by/4.0/).
Share and Cite
Zhang, L.; Li, J. Variability of Major Aerosol Types in China Classified Using AERONET Measurements. Remote Sens. 2019, 11, 2334. https://doi.org/10.3390/rs11202334
Zhang L, Li J. Variability of Major Aerosol Types in China Classified Using AERONET Measurements. Remote Sensing. 2019; 11(20):2334. https://doi.org/10.3390/rs11202334
Chicago/Turabian StyleZhang, Lu, and Jing Li. 2019. "Variability of Major Aerosol Types in China Classified Using AERONET Measurements" Remote Sensing 11, no. 20: 2334. https://doi.org/10.3390/rs11202334
APA StyleZhang, L., & Li, J. (2019). Variability of Major Aerosol Types in China Classified Using AERONET Measurements. Remote Sensing, 11(20), 2334. https://doi.org/10.3390/rs11202334