Article

Evaluation of CLARA-A2 and ISCCP-H Cloud Cover Climate Data Records over Europe with ECA&D Ground-Based Measurements

by
Vasileios Tzallas
1,*,
Nikos Hatzianastassiou
1,
Nikos Benas
2,
Jan Fokke Meirink
2,
Christos Matsoukas
3,
Paul Stackhouse, Jr.
4 and
Ilias Vardavas
5
1
Laboratory of Meteorology, Department of Physics, University of Ioannina, 45110 Ioannina, Greece
2
R & D Satellite Observations Department, Royal Netherlands Meteorological Institute (KNMI), 3731 GA De Bilt, The Netherlands
3
Department of Environment, University of the Aegean, 81100 Mytilene, Greece
4
Science Directorate/Climate Science Branch, NASA Langley Research Center, Hampton, VA 23681, USA
5
Department of Physics, University of Crete, 71110 Heraklion, Crete, Greece
*
Author to whom correspondence should be addressed.
Remote Sens. 2019, 11(2), 212; https://doi.org/10.3390/rs11020212
Submission received: 9 November 2018 / Revised: 10 January 2019 / Accepted: 16 January 2019 / Published: 21 January 2019
(This article belongs to the Special Issue Assessment of Quality and Usability of Climate Data Records)

Abstract

:
Clouds are of high importance for the climate system but they still remain one of its principal uncertainties. Remote sensing techniques applied to satellite observations have assisted tremendously in the creation of long-term and homogeneous data records; however, satellite data sets need to be validated and compared with other data records, especially ground measurements. In the present study, the spatiotemporal distribution and variability of Total Cloud Cover (TCC) from the Satellite Application Facility on Climate Monitoring (CM SAF) Cloud, Albedo And Surface Radiation dataset from AVHRR data—edition 2 (CLARA-A2) and the International Satellite Cloud Climatology Project H-series (ISCCP-H) is analyzed over Europe. The CLARA-A2 data record has been created using measurements of the Advanced Very High Resolution Radiometer (AVHRR) instrument onboard the polar orbiting NOAA and the EUMETSAT MetOp satellites, whereas the ISCCP-H data were produced by a combination of measurements from geostationary meteorological satellites and the AVHRR instrument on the polar orbiting satellites. An intercomparison of the two data records is performed over their common period, 1984 to 2012. In addition, a comparison of the two satellite data records is made against TCC observations at 22 meteorological stations in Europe, from the European Climate Assessment & Dataset (ECA&D). The results indicate generally larger ISCCP-H TCC with respect to the corresponding CLARA-A2 data, in particular in the Mediterranean. Compared to ECA&D data, both satellite datasets reveal a reasonable performance, with overall mean TCC biases of 2.1 and 5.2% for CLARA-A2 and ISCCP-H, respectively. This, along with the higher correlation coefficients between CLARA-A2 and ECA&D TCC, indicates the better performance of CLARA-A2 TCC data.

Graphical Abstract

1. Introduction

Clouds play a vital role in the Earth’s climate system, being one of its main drivers, while in turn, they are affected by climate changes. It has already been shown that evidence of climate change is apparent in the satellite cloud record [1]. However, there is still limited knowledge about how cloud, atmospheric circulation and climate interact [2], while disagreement exists about how clouds will change under future global warming [3]. The inaccuracy of cloud representation in global climate models is at present the main source of uncertainty in climate sensitivity estimates and climate change predictions [2]. Therefore, it is crucial to improve our capabilities to observe even basic cloud properties as, for instance, the Total Cloud Cover (TCC), in order to create long-term, uniform, and stable global databases.
The rapid development and use of remote sensing techniques during the last decades have assisted the scientific community tremendously in producing numerous satellite cloud data records. For instance, various datasets have been developed from the Moderate Resolution Imaging Spectroradiometer (MODIS) measurements [4] aboard the National Aeronautics and Space Administration’s (NASA) Aqua and Terra satellites, the Pathfinder Atmospheres Extended (PATMOS-x) [5] and The Satellite Application Facility on Climate Monitoring (CM SAF) Cloud, Albedo and Surface Radiation (CLARA) [6,7] datasets, derived from measurements of the Advanced Very High Resolution Radiometer (AVHRR), mounted on the Polar Operational Environmental Satellites (POES) and Meteorological Operational Satellite Program of Europe (MetOp) platforms. An additional dataset is the International Satellite Cloud Climatology Project (ISCCP) [8,9] which uses, besides the AVHRR, a variety of instruments onboard numerous geostationary satellites (including Meteosat, Geostationary Operational Environmental Satellite (GOES), and Geostationary Meteorological Satellite (GMS)). Nevertheless, an in-depth evaluation and intercomparison of the various cloud datasets is necessary, given the systematic errors or artifacts that arise from the different instruments used and retrieval algorithms applied in each satellite data record, which could mislead our understanding of the climatic role of clouds. Moreover, surface observations of TCC and cloud type, despite their problems and limitations (e.g. scarcity and inhomogeneity) [10,11] have been performed since the second half of the 19th century [12] and enable us to study long-term cloud trends. Such surface data should be included in the framework of comparisons among satellite cloud data.
A substantial number of studies have focused on Europe or the Mediterranean since this particular region is considered a “hot spot” in the context of climate change [13,14,15]. Sanchez-Lorenzo et al. (2017) in [14] compared TCC from several satellite-based observational datasets (ISCCP-D2, CLARA-A1, PATMOS-x), surface observations (EECRA and ICOADS), reanalyses (ERA-Interim, MERRA), and CMIP5 simulations, and found an overall good agreement between the mean values of TCC of ISCCP, CLARA, PATMOS-x and surface observations over the Mediterranean. Meerkötter et al. (2004) [16] compared NOAA/AVHRR-derived TCC with surface observations for Europe and found pronounced latitudinal and seasonal variations and an overall good agreement with surface observations, except for the summer months during which the satellite-derived TCC was systematically lower than the surface observations. Other studies also validated short-term remote sensing products in specific European areas [17,18,19,20,21,22,23]. Since 2016, two state-of-the-art satellite cloud data sets have been released, namely CLARA-A2 [7] and ISCCP-H series [8], which are significant improvements to their previous versions, CLARA-A1 and ISCCP-D series. An intercomparison of these recent data sets as well as their evaluation, either on global or regional scales, is timely and will be useful for any research that includes these data sets. To date, the ISCCP-H cloud climatology has not been evaluated against ground measurements. On the other hand, the CLARA-A2 cloud data set has been compared to other satellite (MODIS, PATMOS-x) and surface (SYNOP) products, but on a global scale. An intercomparison and evaluation of both CLARA-A2 and ISCCP-H cloud data sets is attempted here for the first time over Europe, which, as already stated, is a very interesting study region in terms of ongoing climate change and the ascertained role of clouds in this. Indeed, Europe is appropriate for such a study given its diverse geomorphology and geography, which along with the prevailing atmospheric circulation modes results in variable cloud patterns [15,24,25].
In this study, apart from their intercomparison, both CLARA-A2 and ISCCP-H are validated against the European Climate Assessment and Dataset (ECA&D) surface-based cloud dataset over Europe. It should be emphasized that the two utilized satellite data records have the advantage of providing long time series of cloud cover data and also offer a complete spatial coverage, which is of high importance when analyzing retrieved climate parameters and assessing regional averages and associated trends. It should be pointed out that both CLARA-A2 and ISCCP-H are recently produced data sets, derived by improved and state-of-the-art satellite algorithms, and therefore, an intercomparison between them, as well as a validation study with ground measurements is timely and important. The aim of our study is to identify differences between these two distinct new satellite data records and to validate them against ground-based measurements. This will help to further develop, correct or improve the algorithms utilized for the production of the two satellite data sets. The data records and the methods used in this study are presented in Section 2. Results of the comparison between the two satellite products as well as their validation against the ground measurements are described in Section 3. Section 4 provides the conclusions and a discussion about further research on the subject.

2. Data and Methods

TCC observations with global coverage were taken from CLARA-A2 and ISCCP-H satellite datasets, while TCC observations were also taken from the European surface-based ECA&D dataset. From all datasets, monthly means were taken or created, and the gridded satellite observations were compared with each other and with the corresponding ECA&D data from the station contained in the grid cell. More details about the respective datasets are given in the remainder of this section.

2.1. CLARA-A2

CLARA-A2 [7] is an updated (from previous CLARA-A1 [26]) dataset produced by EUMETSAT CM SAF using measurements of the AVHRR instrument onboard polar orbiting National Oceanic and Atmospheric Administration (NOAA) and EUMETSAT MetOp satellites, and extends from 1982 to 2015. The TCC product of CLARA-A2 is derived with a multi-spectral thresholding method implemented in the Satellite Application Facility on Nowcasting (NWC SAF) polar platform system (PPS) cloud processing software [27]. TCC is defined as the fraction of cloudy pixels per grid square compared to the total number of analyzed pixels in the grid square and it is expressed in percentage [6,7]. In this study, the monthly mean CLARA-A2 TCC data have been averaged to a 2.5° × 2.5° latitude-longitude grid and cover the 29-year period 1984–2012, constrained by the availability of ISCCP-H data. The CLARA-A2 product that combines day and night measurements from all available satellites was selected in order to represent as well as possible the diurnally averaged monthly TCC. The number of satellites varies from one in the early part of the record to at least four in the last decade. With each satellite having two (daytime plus nighttime) or—towards higher latitudes—more overpasses over a specific location per day, CLARA-A2 reaches a variable coverage of the full diurnal cycle.
AVHRR measures radiation in six spectral channels: 0.58–0.68 μm, 0.725–1.10 μm, 1.58–1.64 μm, 3.55–3.93 μm, 10.5–11.5 μm, and 11.5–12.5 μm, of which only one of the 1.58–1.64 μm and 3.55–3.93 μm channels is available at a given time. Radiance measurements from all these channels are used in the CLARA-A2 cloud-masking algorithm. The original horizontal field-of-view (FOV) size of the measurements at nadir is 1.1 km. The data used in CLARA-A2 are a resampled version of these measurements at a reduced resolution of about 5 km, defined as global area coverage (GAC).
Original shortwave radiances were inter-calibrated and homogenised using MODIS (Moderate Resolution Imaging Spectroradiometer) data as a reference, before generating each component of the CLARA-A2 product portfolio. The inter-calibration was based on the method introduced by Heidinger et al. (2010) in [28], which has now been updated (MODIS Collection 6) and extended (6 years have been added). This updated calibration is described by Devasthale et al. (2017) in [29].

2.2. ISCCP-H

The second satellite dataset used is ISCCP-H, processed by the National Centers for Environmental Information (NCEI) of NOAA. Similarly to the ISCCP-D series products, the primary instruments that serve as inputs to the ISCCP-H series are the imaging radiometers on operational weather satellites. These include the AVHRR on the polar-orbiting satellites and a variety of imagers that fly onboard geostationary meteorological satellites [8,9]. Many improvements have been made in the ISCCP H-series, compared to its predecessors C- and D-series [30], such as higher resolution input satellite data and expanded period of record. Monthly-mean ISCCP-H TCC was averaged to the same 2.5° × 2.5° latitude-longitude grid as CLARA-A2. The ISCCP-H data cover the 29-year period 1984–2012, which is the common period of both satellite datasets.
In contrast to CLARA-A2, the ISCCP-H products incorporate only one visible (VIS ≈ 0.65 ± 0.05–0.20 μm) and one infrared (IR ≈ 10.5 ± 0.5–0.75 μm) “window” channel. At latitudes between 55°S and 55°N these measurements are provided by the geostationary satellites if available, while the second and third options are the afternoon and morning AVHRR satellite instruments, respectively. At higher latitudes, ISCCP uses both morning and afternoon polar orbiting satellites with AVHRR simultaneously for the gridded data products. However, if there are more than 2 afternoon orbiters ISCCP chooses only 1, while it does the same for morning orbiters. In the ISCCP analysis the orbiter with the equator overpass time closest to the intended orbit is selected. Both the geostationary and the AVHRR GAC measurements are resampled to a resolution of ~10 km. The radiances from imagers onboard the geostationary satellites are normalized to the AVHRR radiances from the afternoon polar orbiter satellite series. In this approach, NOAA-9 acts as the absolute reference through 2009 [31]. The temporal resolution of the ISCCP-H dataset is 3-hourly where geostationary data is used, and varies with latitude where the polar orbiters are used.
The ISCCP-H cloud masking algorithm can be described by four steps. First, tests of the space and time variations of the observed radiances on several scales are used to estimate cloud-free radiances. Results of the space–time tests are used in conjunction with the ancillary products to obtain a global composite of clear-sky radiances for each image pixel location and time. Second, cloudy conditions are diagnosed when IR- or VIS-observed satellite radiances sufficiently deviate from estimated values using various combinations of VIS and IR thresholds [32,33]. Then, the composite clear-sky radiances are revised based on the prior detection threshold results and application of revised threshold tests of each image’s pixels against the revised composite clear-sky radiance values using the ancillary products. Finally, cloud properties are retrieved producing the HXS product (H-series pixel level single satellite product) [8,30,34] which are then used to produce the HGM products (H-series Gridded Monthly products) that provide the monthly averages that are used here [8].

2.3. Summary of Differences between CLARA-A2 and ISCCP-H

Apart from the detailed information about CLARA-A2 and ISCCP-H cloud Climate Data Records (CDRs) reported in Section 2.1 and Section 2.2, their main differences are summarized in Table 1, which also lists the Fundamental Climate Data Records (FCDRs) and ancillary data used for their production. In addition, Table 2 shows the temporal coverage of the satellites used by the two data records, as well as which satellites are included in each one of them.

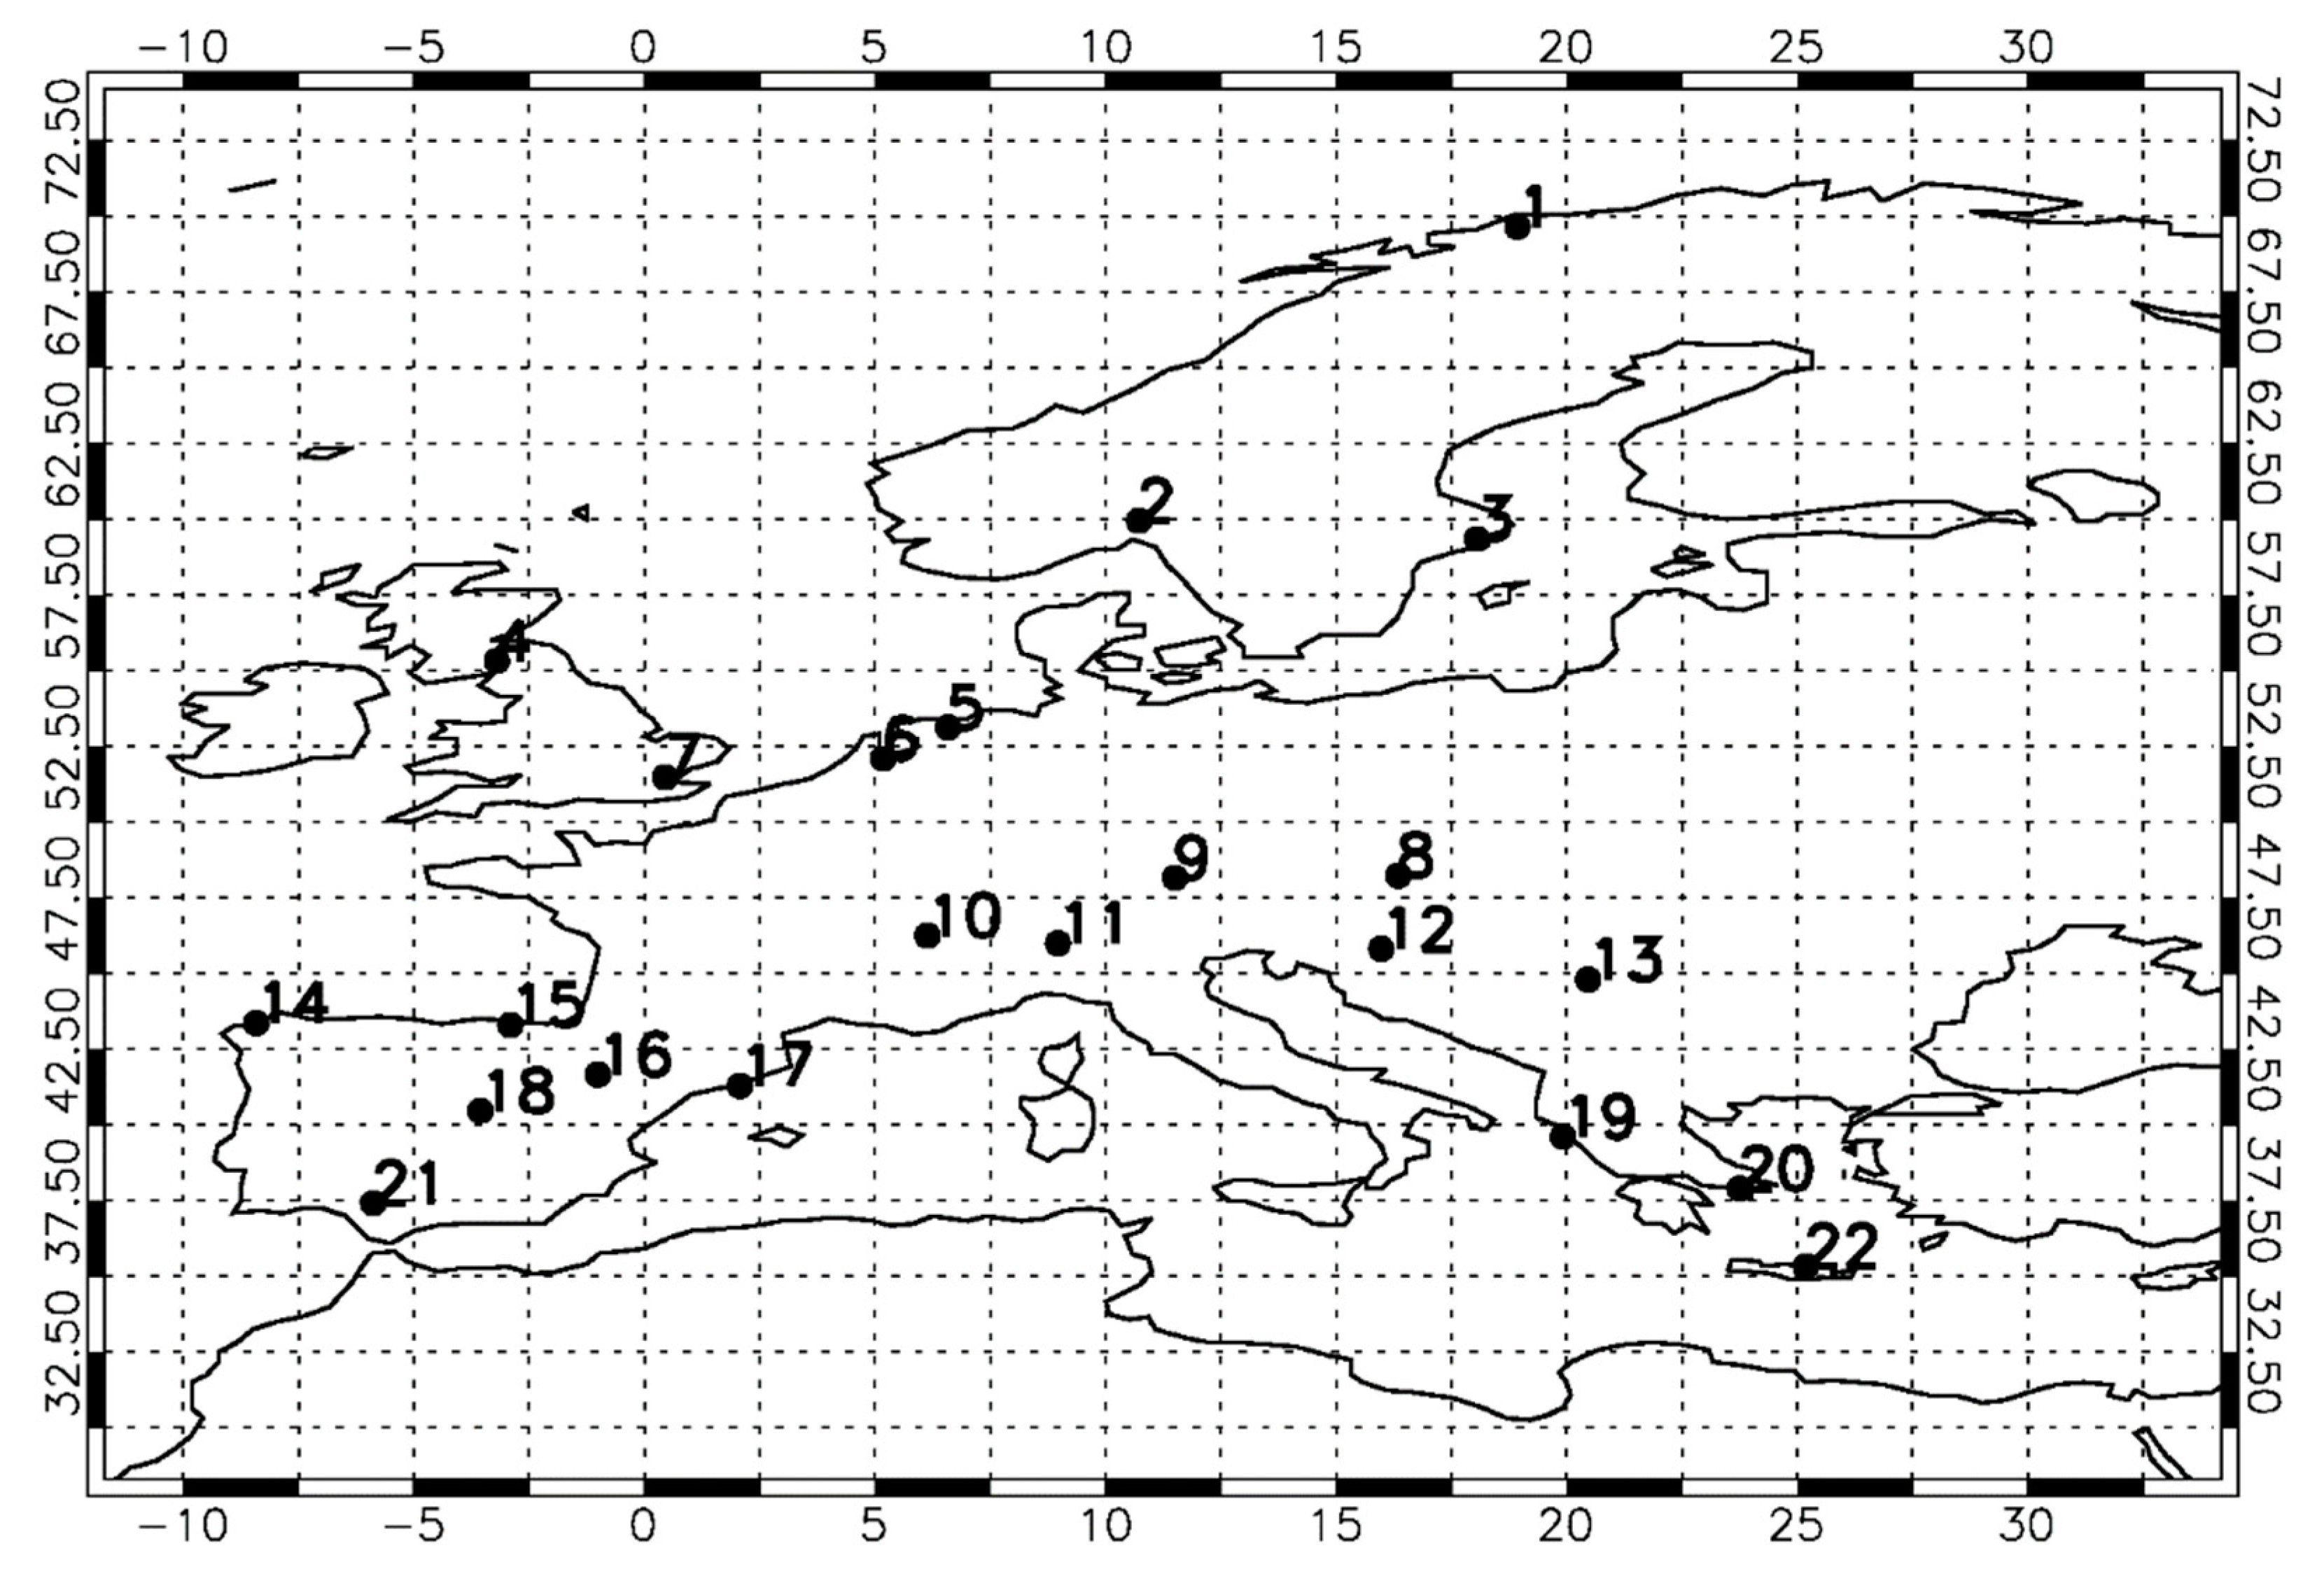
2.4. ECA&D Surface Observations

TCC data from both CLARA-A2 and ISCCP-H are compared with the corresponding data from surface observations from 22 stations across Europe, the locations of which are provided in Table 3 and Figure 1. These come from a European dataset compiled within the ECA&D project. ECA&D is a well-established database of daily WMO station observations which are analyzed for WMO Region IV (Europe and Middle East), putting particular emphasis on changes in daily extremes [49]. Twenty-two stations were selected to broadly cover Europe and to provide observations for the full 1984–2012 time period. For the comparisons, monthly mean TCC values were computed from the originally available daily ECA&D data in order to match the temporal resolution of the satellite data. The daily data of each station include either human observations or data from ceilometers. For a number of stations, ceilometers replaced human observations at some point in time. However, this is not the case for all the stations. Finally, the CLARA-A2 and ISCCP-H gridded data were compared against the corresponding ECA&D data from the station contained in the grid cell.

3. Results

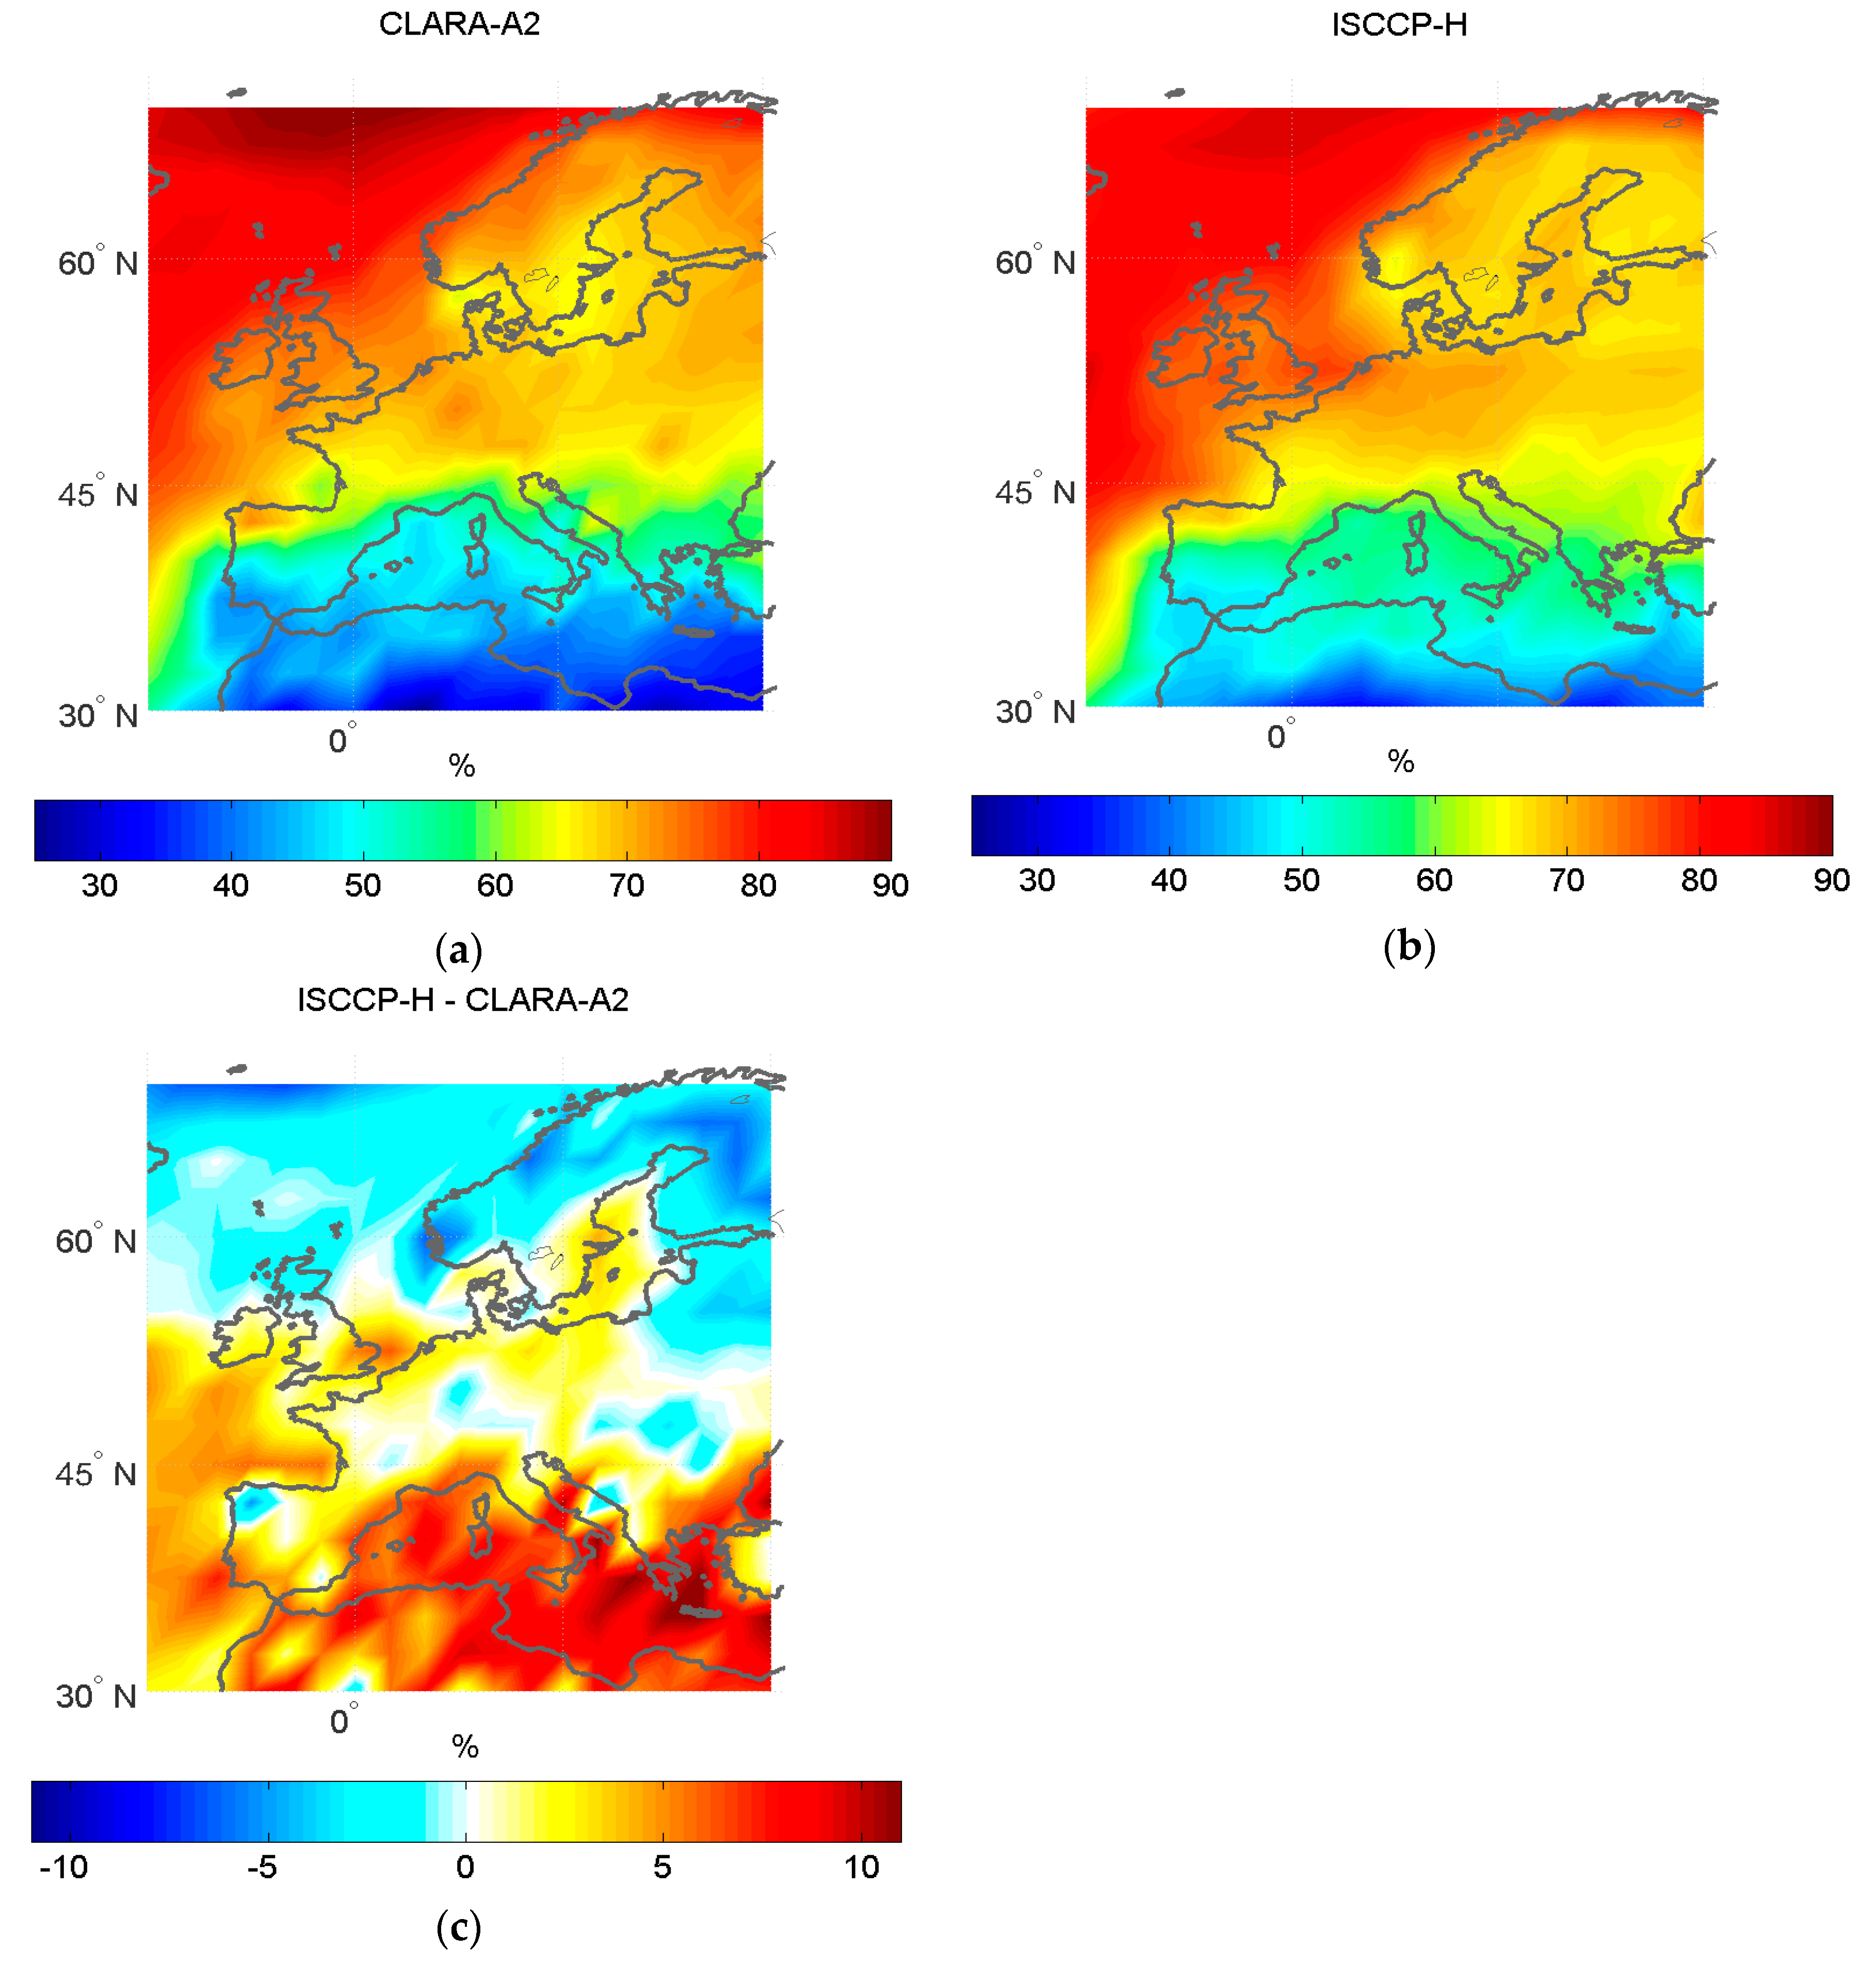
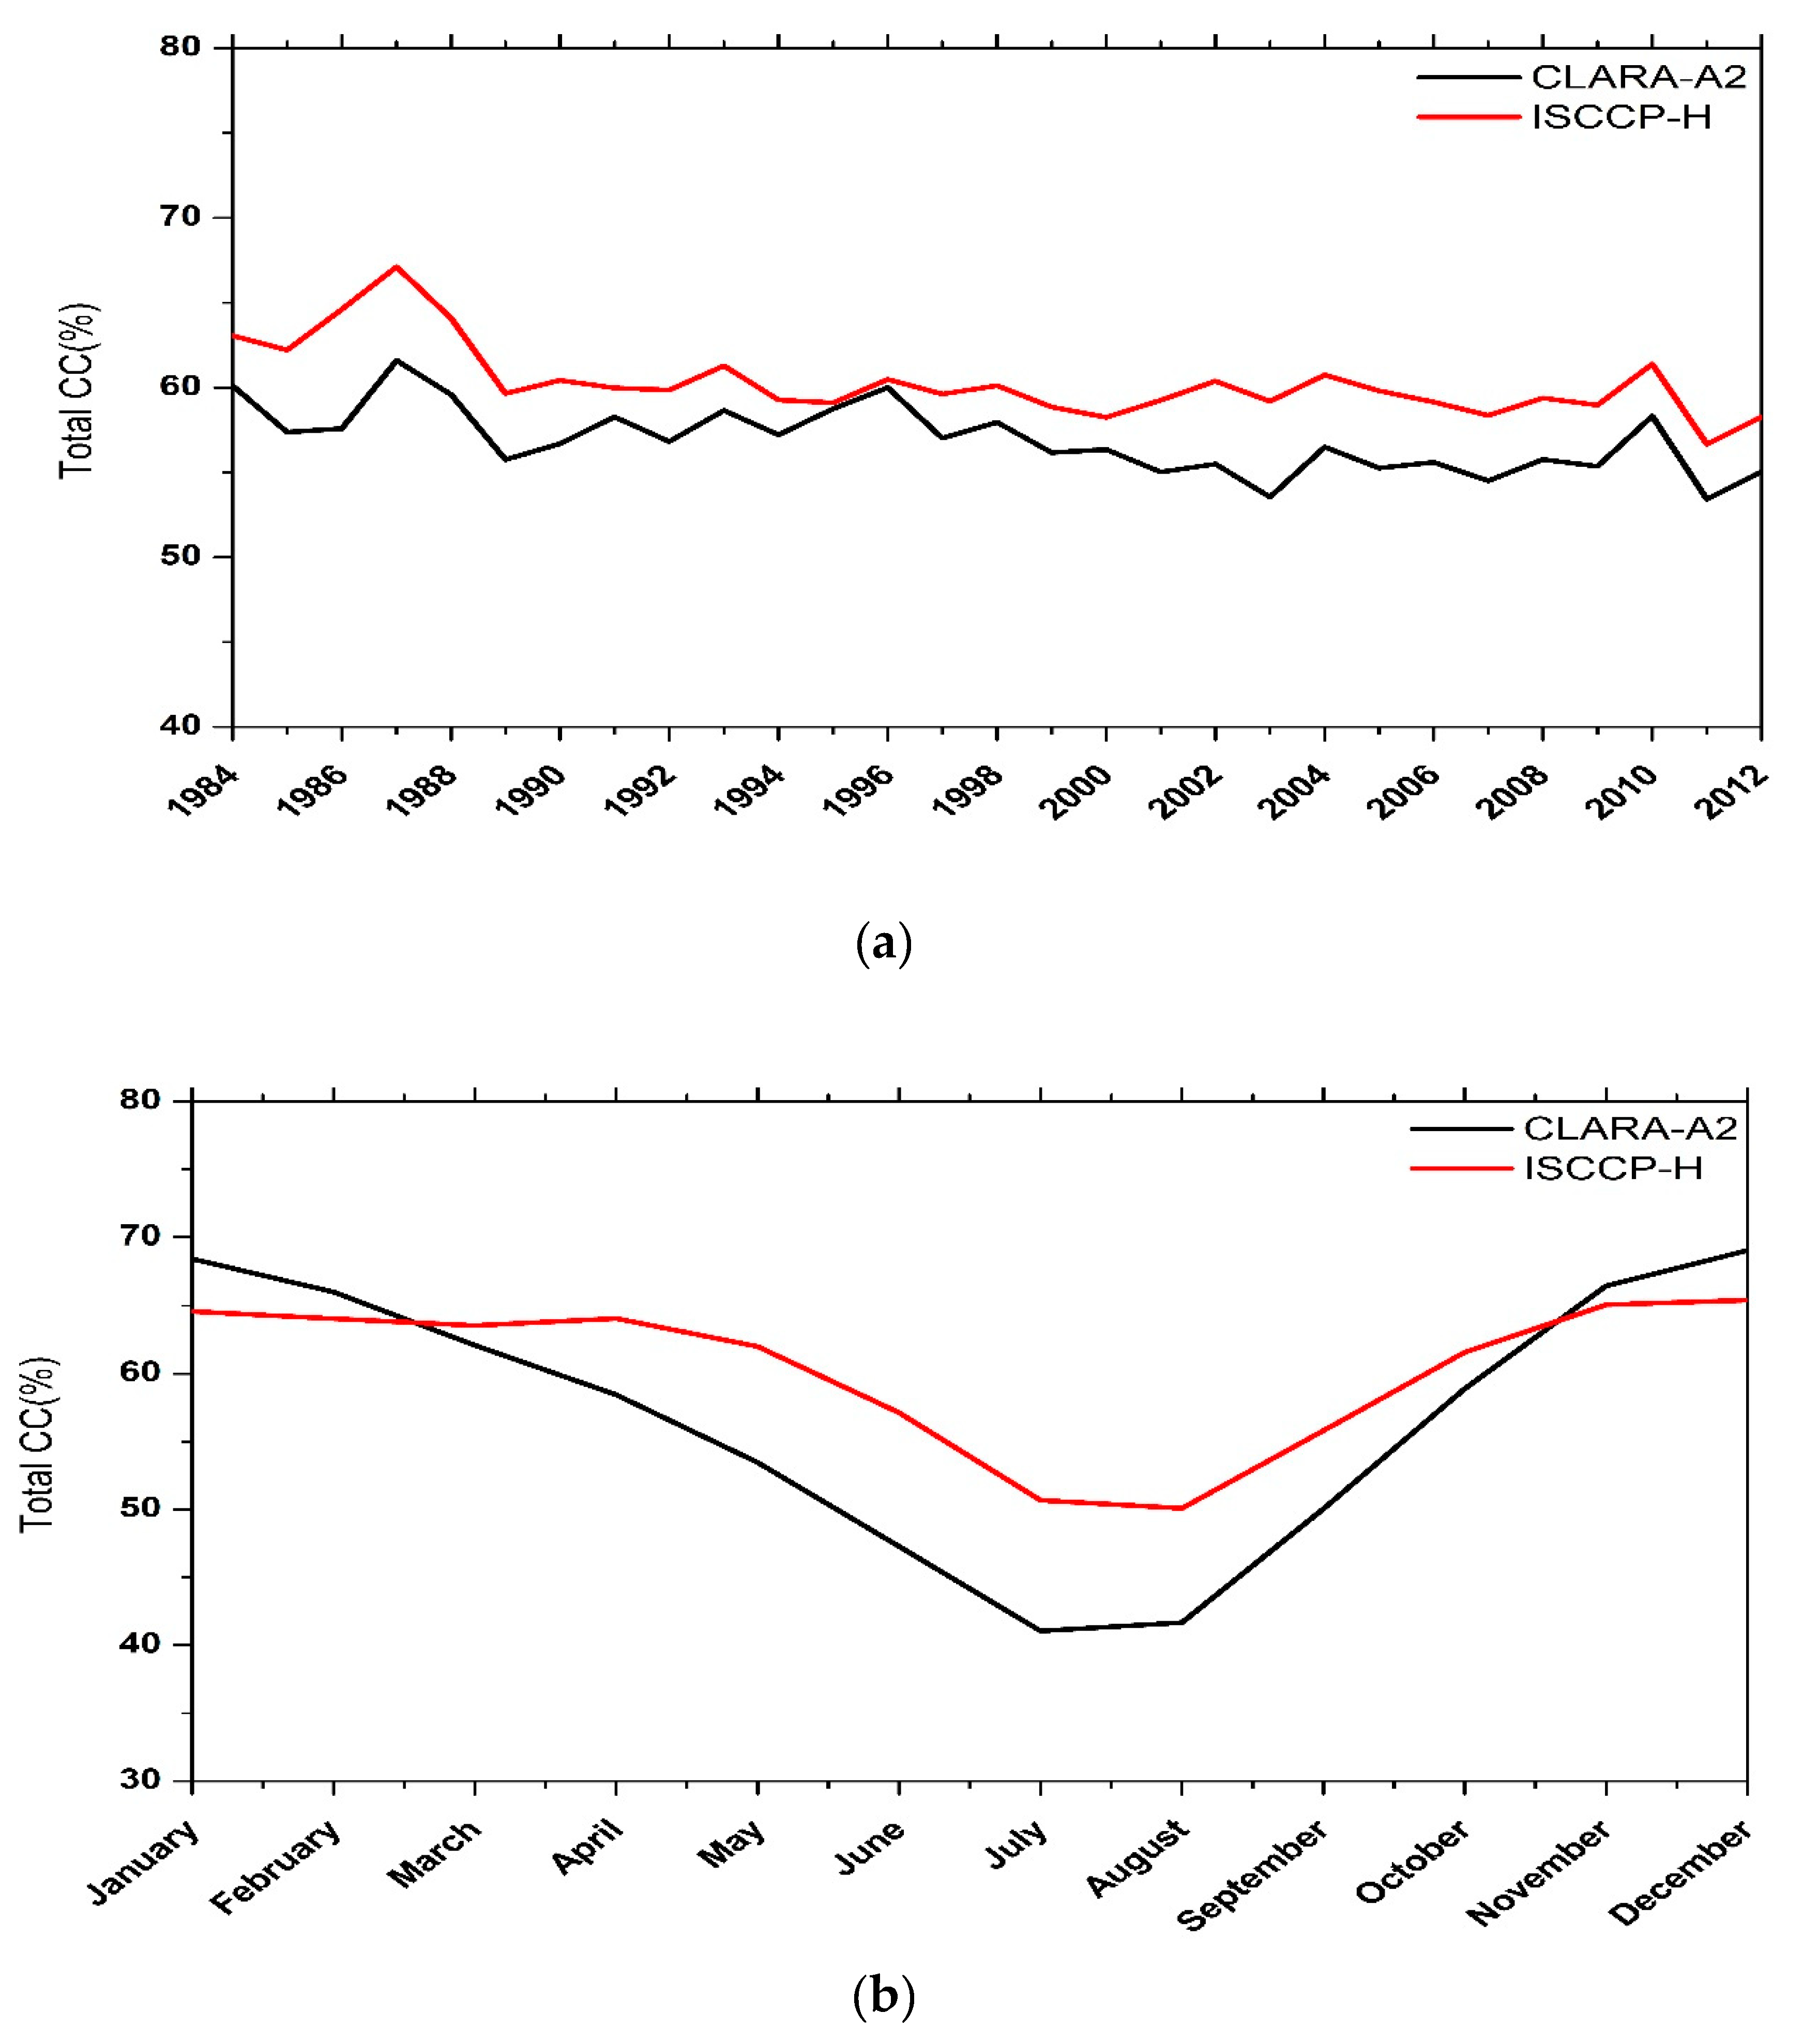
3.1. Climatologies and Differences of CLARA-A2 and ISCCP-H

Average values of the TCC were calculated for the European region for the 29-year period of 1984–2012, which is the common period for the two satellite data records, CLARA-A2 and ISCCP-H. The selected study region extends from 30°N to 70°N and from 10°W to 30°E, and includes areas of distinct geomorphology characterized by diverse climatic regimes, ranging from the Mediterranean to oceanic, continental and sub-Arctic, thus encompassing different cloud regimes. Figure 2a,b shows the overall mean TCC for CLARA-A2 and ISCCP-H. The general geographical pattern regarding the two satellite data sets appears quite similar, with a gradual increase in cloud cover from the South to the North-West. Minimum values for both data records are located over the region of North Africa and the South Mediterranean basin with cloud cover values of approximately 25% and 30% for CLARA-A2 and ISCCP-H respectively. Moreover, the two satellite data records present the maximum TCC values to the North of the United Kingdom and North-West of Norway (Norwegian Sea). For CLARA-A2 the absolute maximum is slightly larger than that of ISCCP-H.
The absolute differences between ISCCP-H and CLARA-A2 TCC, shown in Figure 2c, indicate that apart from the similarity in spatial patterns, there is a good quantitative agreement between the two data records over a significant part of the study region (covering almost the entire continental Europe) with differences less than 2.5% in absolute terms. However, a greater contrast can be observed over the Mediterranean Sea and North Africa where ISCCP-H has higher TCC in comparison to CLARA-A2 (reddish colors). Specifically, the magnitude of differences varies from 5% to 10% for most of the Mediterranean basin, with an absolute maximum of approximately 15% over the Aegean Sea. Secondarily, large TCC differences (larger ISCCP-H than CLARA-A2 values) between the two satellite datasets appear off the western coasts of the Iberian Peninsula and France. In contrast, ISCCP-H TCC values are smaller than CLARA-A2 over the northernmost part of the study region, namely over areas with higher latitude than 65°N, mainly over the Scandinavian countries and to the northwest of Norway where absolute differences range from approximately -2.5% to -7.5%. Similar findings, namely larger ISCCP-H than CLARA-A2 TCC over the southernmost parts of the study region and lower ISCCP-H TCC over its northernmost parts, are shown by Karlsson and Devasthale 2018 (Figure 1) [50] also in nearby regions. Moreover, our results in Supplementary Figures S1 and S2 show that the differences in the northernmost parts exist throughout the year and those in the southernmost ones are apparent in all seasons except winter.
The observed differences may, to some extent, be related to the switch of preferred ISCCP-H input data source at 55°N. South of this latitude, geostationary imager measurements are used, which are taken with a relatively large viewing zenith angle (VZA). For example, at 45°N the geostationary VZA over Europe is around 52–58 degrees depending on the longitude, while the average VZA for AVHRR is estimated to be around 32 degrees. The differences in VZA between the two TCC datasets are shown in Figure S3 (Supplement) where the mean VZAs of the two datasets over Europe (30°–70°N) are plotted. There is an obvious changing pattern of differences at 55°N. South of this latitude, the ISCCP-H (MSG based) VZAs are larger than the CLARA-A2 (AVHRR based) VZAs, while north of it the VZAs of the two datasets coincide since AVHRR is used in both of them. As an example, at 45°N, the geostationary VZA over Europe is around 52–58 degrees depending on the longitude, while the average VZA for AVHRR is estimated to be around 32 degrees. Maddux et al. (2010) in [51] demonstrated a strong increase in MODIS Collection 5 cloud fraction with VZA. Their Figure 5 yields a difference in cloud fraction of about 8% between VZAs of 55 and 32 degrees. Although this value should only be considered as a very rough estimate, it suggests that the differences between CLARA-A2 and ISCCP-H TCC south of 55°N can at least partly be attributed to the different viewing geometries of the employed satellite instruments. Indeed, global difference plots between ISCCP-H and CLARA-A2 (see Supplementary Figure S2) show signs of discontinuities at 55°N and 55°S, especially over ocean. These discontinuities are also evident in the results of Karlsson and Devasthale (2018) [50] who inter-compared and evaluated four satellite cloud data sets, including CLARA-A2 and ISCCP-H, on a global scale. Over land, which covers most of our study area, retrieval differences related to surface heterogeneity, surface temperature, snow cover, or other factors may be present and obscure the discontinuity described above. The north–south gradient apparent in the differences between CLARA-A2 and ISCCP-H TCC datasets may also be attributed to the different number of polar orbiting satellites and AVHRR instruments used in the two analyses (see Table 2). CLARA-A2 uses all available instruments. On the other hand, while ISCCP uses both morning and afternoon polar orbiters as availability simultaneously, it does not use more than 1 afternoon (or 1 morning) at a time for the gridded products. In fact, ISCCP uses one operational NOAA satellite/AVHRR instrument, usually the satellite with the equator crossing time closest to the original intended orbit.
The inter-annual and seasonal variability of total cloudiness over the whole study region as estimated from CLARA-A2 and ISCCP-H is shown in Figure 3a,b, respectively. The time series of the annual mean TCC values averaged over Europe (Figure 3a) show a fairly good agreement between CLARA-A2 and ISCCP-H. Both satellite-derived data records exhibit a comparable year-to-year pattern for their common period 1984–2012. Nevertheless, ISCCP-H shows systematically higher TCC values during the whole period in comparison to CLARA-A2, with an average annual difference of 3.4%. The largest (reaching or exceeding 5%) differences (higher ISCCP-H values) are found in the 1980s. Similarly, higher ISCCP-D2 TCC data compared to PATMOS-x in the 1980s has been reported in the past and was regarded as an artifact due to systematically larger satellite zenith angles in some regions for the geostationary satellites contributing to the ISCCP dataset [22,52,53]. These differences were subsequently reduced as the number of satellites contributing to ISCCP increased. Therefore, it appears that a similar behavior is still present in the ISCCP-H data, as corroborated by global results [22]. Another distinguishable feature of the TCC over Europe is a local minimum in 2003 which has been related to a very hot and dry summer in Central Europe [16] and can be clearly noticed for CLARA-A2, but is less pronounced for ISCCP-H. Even if the 29-year study period is long enough for estimating trends, we do not attempt to do this, because long-term variations should be treated with caution. Most importantly, the satellite constellation changes over the years, and in addition most of the AVHRR-carrying satellites have a changing local overpass time, also referred to as orbital drift. These features can cause misleading artificial trends. Considering the seasonal variation of CLARA-A2 and ISCCP-H, there is a well distinguishable similar seasonality for the two datasets (Figure 3b), which present the largest TCC values during the winter months and the lowest during summer in accordance to the usual meteorological conditions in the European region [16]. However, the amplitude of the annual cycle of ISCCP-H is considerably smaller than the one of CLARA-A2, mainly attributed to seemingly greater minimum summer values (by up to 10%) and secondarily to smaller maximum winter values (by up to 5%). ISCCP-H shows quite constant TCC values during winter and early spring, resulting in a flat pattern in Figure 3b which is not reproduced by CLARA-A2. The average TCC values computed for CLARA-A2 vary from about 41% in August to 69% in December, whereas the corresponding values of ISCCP-H have shorter range from 50% in August to 65% in December. ISCCP-H gives lower TCC values during local winter and higher for the other months of the year with respect to CLARA-A2 causing the overall systematically higher values shown in Figure 3a. In addition, the biggest differences take place during the summer months, where ISCCP-H overestimates CLARA-A2 by about 9% on average. The underestimation of the winter TCC of ISCCP-H with respect to CLARA-A2 is significantly less intense than the summer overestimation, with a mean difference of −3%. The aforementioned seasonal differences between ISCCP-H and CLARA-A2 are also confirmed by the results obtained on a pixel-level basis (see Supplementary Figure S1) which display widespread negative differences (up to −15 to −20%) in winter and positive differences (up to +20 to 25%) in summer spread over almost the entire study region.

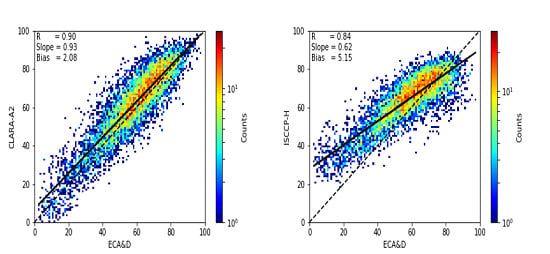
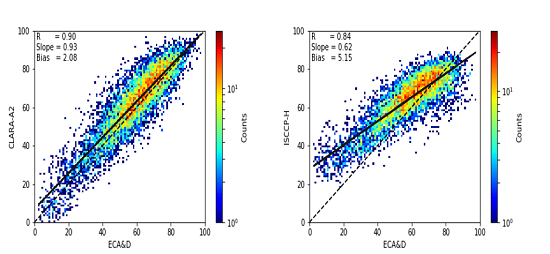
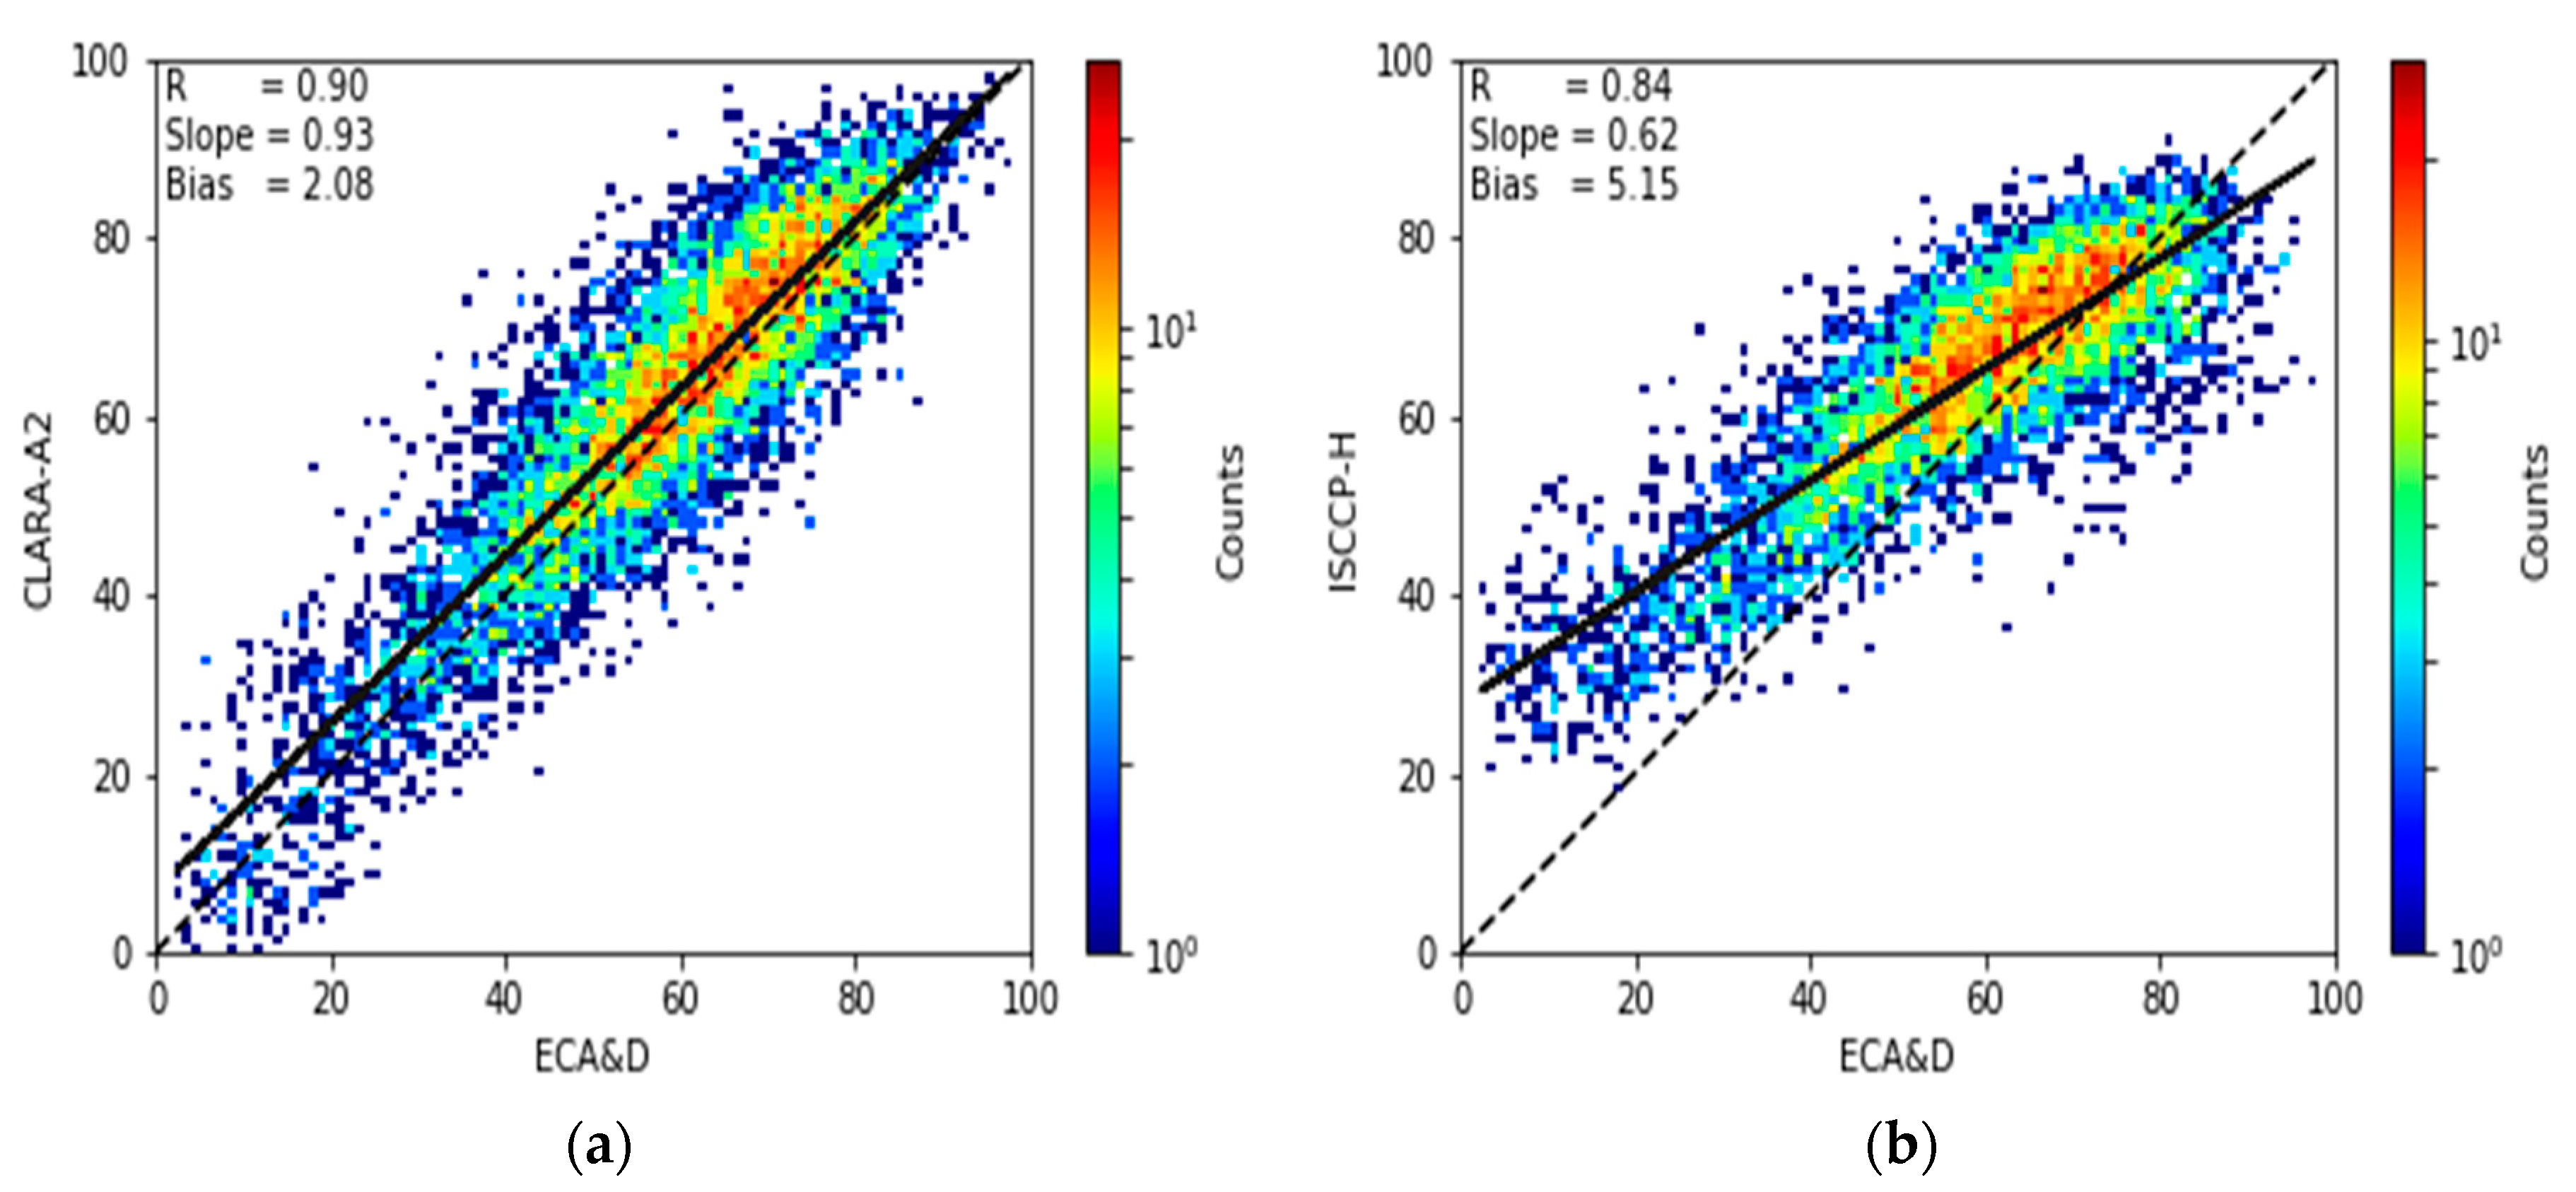
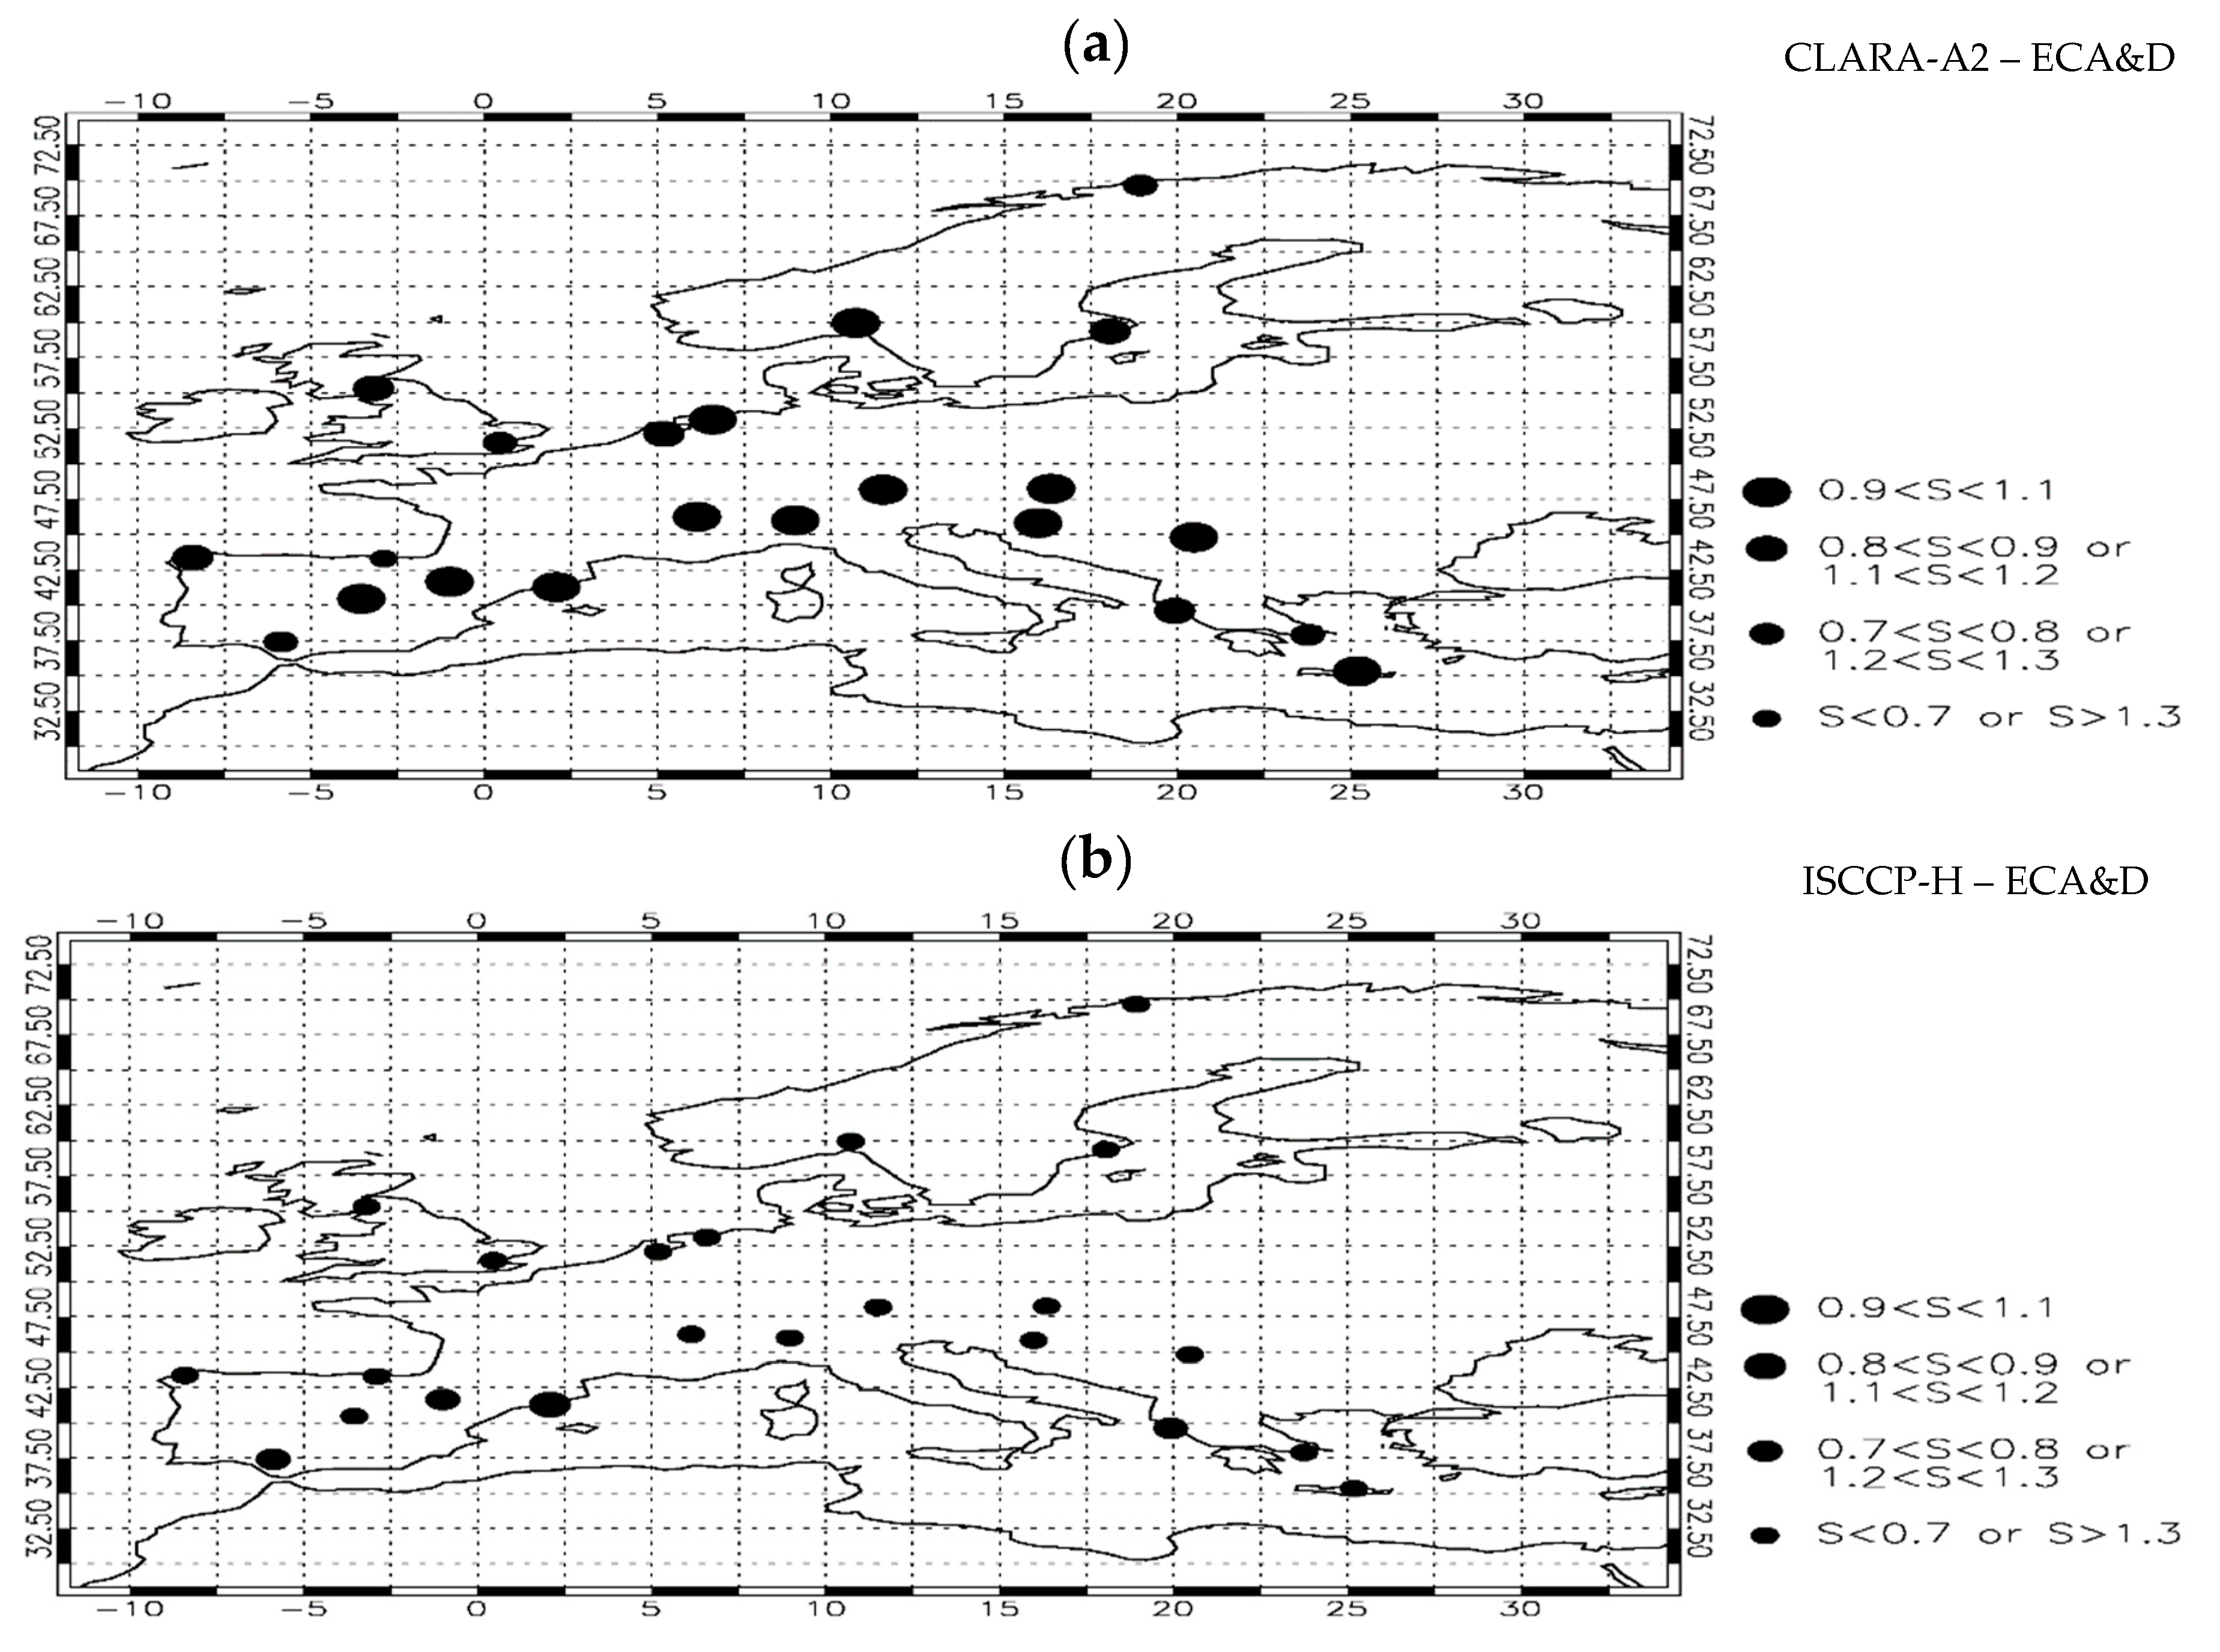
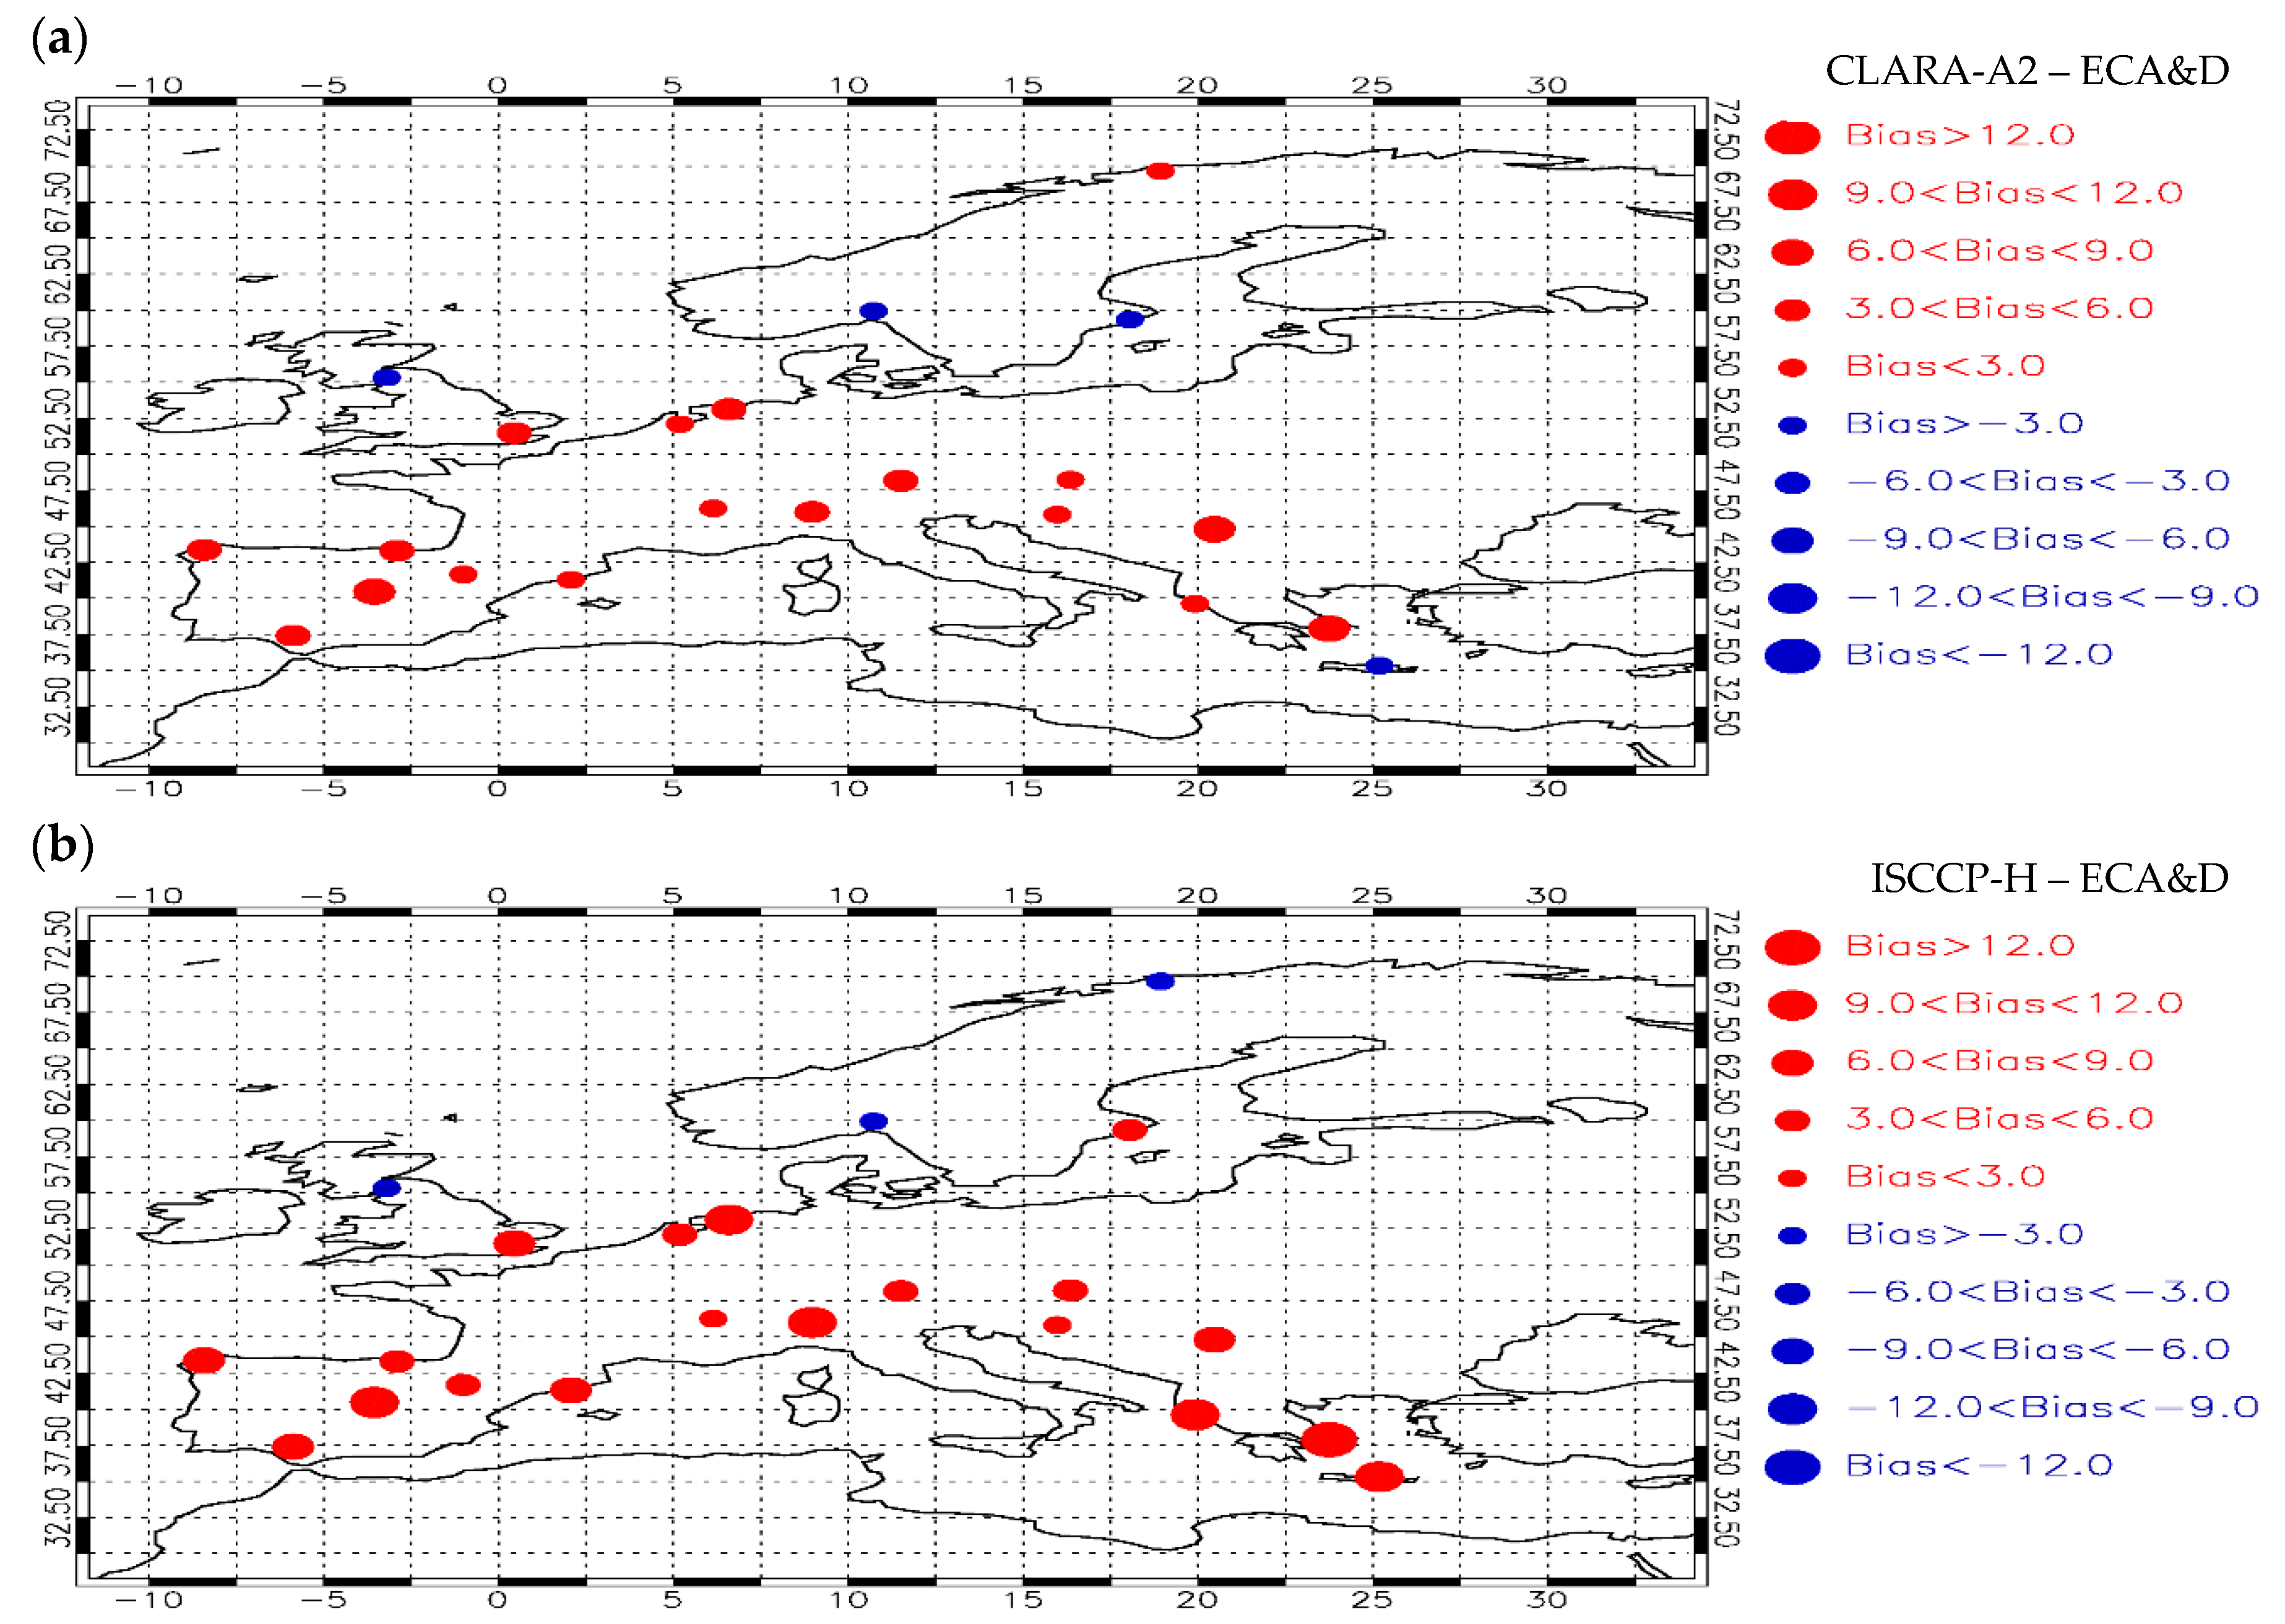
3.2. Validation against ECA&D Ground Measurements

In order to validate the performance of the two satellite data records, TCC data from ECA&D were used as ground truth. For every station the TCC values of the corresponding grid cell from CLARA-A2 and ISCCP-H were analyzed for their common period (1984–2012). TCC time-series for each station were created for both CLARA-A2 and ISCCP-H and were compared to the corresponding ECA&D ones.
The overall comparison between CLARA-A2, ISCCP-H, and ECA&D is presented in Figure 4. TCC data from all the corresponding grid cells of CLARA-A2 and ISCCP-H were analyzed against all the ECA&D stations. Both satellite data records perform fairly well against the ground measurements. However, CLARA-A2 is overall better correlated to ECA&D ground measurements in comparison to ISCCP-H, having a correlation coefficient of 0.90 versus 0.84, respectively. Satellite measurements from both data records mainly overestimate ground measurements from ECA&D. CLARA-A2 is slightly less biased against ECA&D (2.08%) with respect to the bias value of ISCCP-H (5.15%). CLARA-A2 shows only a minor overestimation and only for a few TCC values, whereas ISCCP-H appears to overestimate TCC, particularly for low TCC values, resulting in a slope value of 0.62 compared to 0.93 for CLARA-A2. An overestimation of satellite-based TCC with respect to ground measurements has frequently been found before on a global basis since there is a slight tendency for surface observations to give less TCC in comparison to satellites, which may be caused by an effect of the viewing angle of the geostationary satellites or the fact that satellites may detect cirrus that are not observed from the surface [17,26,30,54]. However, underestimations of satellite cloud cover with respect to surface-based observations have also been reported by Meerkötter et al. [16] who attributed them to different observational geometries and to characteristics in the satellite algorithm or, in particular, for higher latitudes (i.e., the Arctic) by Schweiger et al. [55], which seems to be in accordance with the negative bias values computed in this study for the northern stations (i.e., Scandinavia and the UK). Furthermore, Yousef et al. (2018) compared satellite retrieved cloud cover to ground measurements for the Arabian Peninsula and found similar results. They reported both CLARA-A2 and ISCCP-D2 overestimating TCC compared to ground measurements, with the TCC values of CLARA being closer to the ground observations and better correlated than ISCCP-D2 [56].
The computed correlation coefficients for the comparison between the satellite data and ECA&D are shown in Figure 5. Both CLARA-A2 and ISCCP-H compare fairly well to ECA&D, having correlation coefficients larger than 0.7 for most cases and larger than 0.8 for a considerable number of stations. However, CLARA-A2 appears to have quite higher correlation coefficient values, which are greater than 0.8 or 0.9 for the majority of the stations, but even more so primarily over central and northern Europe and secondarily over the UK. It should be noted that over these areas, the correlation coefficient values between ISCCP-H and ECA&D drop to 0.5, whereas the correlation coefficients computed for CLARA-A2, remain higher than 0.7. Furthermore, with increasing latitude there is an obvious decrease in the correlation between both comparisons (CLARA-A2-ECA&D and ISCCP-H-ECA&D), where the correlation coefficient drops to values less than 0.7 (over Scandinavia and the UK). This can be attributed to the stronger TCC covariability between satellite data and ECA&D in southern than northern stations combined with a smaller TCC seasonality in northern stations (Figure S4). This finding is just based on the 22 stations used in the present study and could be further validated using a larger number of stations. The different behavior between higher and lower latitudes could be attributed to differences in the seasonal variation for Northern and Southern regions. A smaller seasonal variation over high latitudes could lead to lower correlations. Considering areas of lower latitude, besides the overall better performance of the satellite data in comparison to northern regions, correlation values between ISCCP-H and ECA&D are considerably high and much closer to those of the CLARA-A2 and ECA&D comparison. Moreover, the overall better performance of CLARA-A2 can be clearly confirmed by the higher linear regression slope values for each station (Figure 6). It is evident that CLARA-A2 has slope values close to 1 (0.9–1.0), whereas the corresponding slope values for ISCCP-H indicate stronger deviations, being smaller than 0.7 or larger than 1.3 for most stations.
Biases for the two comparisons were computed from the overall mean TCC value of each station and corresponding grid cell (Figure 7). For grid cells and stations located in higher latitudes (Scandinavia and the Northern UK) biases acquire negative values (greater than −3.0%), showing a tendency of underestimation (blue circles) of the satellite TCC data in comparison to the ground-based observations from ECA&D. In lower latitudes (i.e., Iberian Peninsula, Greece etc.), there is widespread overestimation (red circles) of both CLARA-A2 and ISCCP-H to the ECA&D measurements of TCC (biases mainly greater than 6.0%). Enriquez-Alonso et al. (2016), while studying TCC over the Mediterranean, also found that surface observations show a slight tendency to lower mean values of TCC compared to ISCCP-D and CLARA-A1, especially over land areas [17]. A similar overestimation of satellite MODIS TCC against ECA&D has been also reported over the Mediterranean taking place mainly in winter [25]. On the other hand, the magnitude of the biases decreases with increasing latitude especially for ISCCP-H. This could be attributed to the shift from geostationary to polar orbiting satellite measurements, above 55°N, in the ISCCP-H data set. It is also apparent that ISCCP-H is significantly more biased to ECA&D in comparison to CLARA-A2. For CLARA-A2 biases range from −3.0% to +6.0% for the majority of cases with the exception of a few stations. ISCCP-H biases are greater than +6.0% for more stations and for some stations even greater than +12.0%.
The conclusions derived from Figure 5, Figure 6 and Figure 7, i.e., the better performance of CLARA-A2 than ISCCP-H TCC data, is also confirmed by the results for another two statistical parameters, namely the Mean Absolute Error (MAE) and Root Mean Squared Error (RMSE), shown in Table 4. In 16/22 stations for MAE and 14/22 stations for RMSE CLARA-A2 performs better.
By averaging over the 22 selected ECA&D stations and the corresponding grid cells, we created a mean of the station-based TCC and an average of the corresponding grid cells of CLARA-A2 and ISCCP-H, in order to evaluate the overall inter-annual long-term and seasonal variability of the biases between CLARA-A2, ISCCP-H and ECA&D (Figure 8). In this way, better insight is given into the year-to-year and season-to-season patterns of differences between the satellite and surface TCC datasets. As expected, ISCCP-H and CLARA-A2 show a positive bias for most of their common period; however, ISCCP-H is constantly more biased than CLARA-A2 with respect to ECA&D. In spite of the general pattern, it can be noticed that from 2004 until 2011, CLARA-A2 is slightly underestimating ECA&D-derived TCC. In addition, since approximately 1999 a considerably improved agreement between CLARA-A2 and ECA&D can be discerned, having bias values mostly less than 2% in absolute terms. That might be explained by the fact that more satellites were included in CLARA-A2, leading to a better representation of daily averages. However, apart from the aforementioned difficulties imposed by the orbital drifts and the satellite changes in the evaluation of the satellite-derived TCC trends, the TCC time series from ground-based observations should also be treated with caution due to potential changes in the observation method (e.g., from human observers to ceilometers) that might induce artifacts in the trends [57]. Regarding the seasonal variability of mean TCC over the stations (Figure 8b), we found that, as expected, all three data records have their maximum values during winter and the minimum values in summer. The overall pattern of the variability of ECA&D is similar to the ones of CLARA-A2 and ISCCP-H (see also Figure 3b). However, the CLARA-A2 TCC is much closer to ECA&D than ISCCP-H. For the summer months CLARA-A2 just shows slightly lower TCC than ECA&D whereas for the rest of the months CLARA-A2 overestimates the ground measurements of TCC. On the other hand, ISCCP-H TCC is constantly higher in magnitude than ECA&D. Although from November to February the overestimation of ISCCP-H is lower than that of CLARA-A2 with respect to ECA&D, during the rest of the months ISCCP-H overestimates considerably (by up to 9%) more than CLARA-A2, which has values much closer to ECA&D (biases less than 3.5%). Thus, the seasonal cycle of ECA&D matches better with the one of CLARA-A2 than ISCCP-H, which is largely due to the fact that ISCCP-H exhibits a flattened curve in winter months. Note however, that this is within the range of interannual variability of the ECA&D winter cloudiness. This can be clearly seen in Figure 8c which depicts the month-to-month variability of the bias value computed between the mean grid cell of the two satellite data records and the equivalent average of the ground stations. An additional feature of the seasonality that is more evident in Figure 8c is that there is also an obvious opposite seasonality of the biases between CLARA-A2, ISCCP-H and ECA&D. CLARA-A2 is more biased during winter and less during the summer months, whereas ISCCP-H (which is positively biased throughout the year) has increased biases during summer and is less biased for the winter months.
A final remark about the sensitivity of the measurements to specific cloud types should be made. The cloud detection sensitivity of CLARA-A2 has been assessed through extensive comparisons against Cloud-Aerosol Lidar and Infrared Pathfinder Satellite Observations (CALIPSO) cloud products for the period between October 2006 and December 2015. The results, Figure 6, in Karlsson and Hakansson 2018 [58] show that the probability of cloud detection drastically decreases below 70% for optically thin clouds (cloud optical thickness—COT—smaller than 1). For a probability of detection larger than 50% the COT values must be larger than 0.225. On the other hand, to our knowledge, no similar reported limit of ISCCP-H COT values is available in the literature, but it is expected that the ISCCP-H retrieval algorithm has a similar reduced sensitivity to optically thin clouds. Indeed, night-time ISCCP retrieval depends only on the IR, so thin high clouds could be at least partially missed. It should be noted that CLARA-A2 and ISCCP-H determine cloud top in different ways. ISCCP-H uses the nnHIRS T/q profiles and/or detectability limits in order to determine cloud top. In CLARA-A2 no HIRS information is used. The cloud top height retrieval for semi-transparent clouds is done using the difference between the 11- and 12-micron channels. Another type of clouds posing challenges to the satellite retrievals are broken, sub-pixel clouds, the sensitivity to which may differ between the datasets. Ground-based measurements can also suffer from limited sensitivity to certain cloud types. In particular, some types of ceilometers are not able to detect thin high clouds. These varying sensitivities of the different observing systems discussed in this study provide additional potential reasons why the observed cloud fractions, as shown, for example, in Figure 8b, do not line up.

4. Conclusions

In this study, two recent satellite Total Cloud Cover data records (CLARA-A2 and ISCCP-H) were intercompared over the region of Europe for their coinciding years (1984–2012) and validated against surface-based observations from 22 selected stations of a European dataset of WMO stations (ECA&D). Such intercomparisons are essential for validating and assessing uncertainties in Satellite Climate Data Records [59,60,61]. Both ISCCP-H and CLARA-A2 show a similar geographical pattern, however ISCCP-H has higher TCC values over lower latitudes (i.e., Mediterranean region and North Africa) and slightly lower TCC over Northern Europe. This changing pattern of differences between the two satellite TCC data sets could be attributed to the shift from geostationary to polar orbiting satellite measurements in the ISCCP-H data set, while the differences poleward of 55°N may be partly explained by the different number of AVHRR instruments onboard polar orbiting satellites used in the two satellite analyses. Throughout the common period of the two satellite data records, both ISCCP-H and CLARA-A2 have a similar year-to-year variability with ISCCP-H having constantly higher TCC. The aforementioned datasets have a similar seasonality with higher ISCCP-H TCC for most of the months. The validation against the ECA&D ground observations indicates a reasonable performance of the two satellite datasets. Nevertheless, CLARA-A2 is better correlated (especially over Central Europe) and less biased (in particular over Southern Europe) than ISCCP-H, with respect to ECA&D. Our results indicate a changing pattern of the comparison between the two satellite data sets and ECA&D stations with increasing latitude. More specifically, the correlation coefficients decrease with increasing latitude, above 55°N, while the biases improve. The improving ISCCP-H–ECA&D TCC biases could be attributed to the shift from geostationary to polar orbiting satellite measurements in the ISCCP-H data set. Although the latitudinal patterns of differences are not expected to significantly change using more stations, this deserves to be further investigated and validated in a future work. In addition, future research could focus on potential systematic differences that may appear when studying individual cloud types. Both ISCCP-H and CLARA-A2 overestimate TCC compared to ECA&D for most of the study period, resulting in overall mean overestimations of 5.2% and 2.1%, respectively. The TCC biases also vary seasonally, with maximum overestimations by CLARA-A2 in winter and by ISCCP-H in summer. Trends of both the satellite and ground-based datasets should be treated with caution because of potential artifacts due to changes in satellite configurations and their local overpass times as well as changes in ground-based instrumentation.

Supplementary Materials

The following are available online at https://www.mdpi.com/2072-4292/11/2/212/s1, Figure S1: European Geographical difference (in absolute terms) between ISCCP-H and CLARA-A2 TCC for (a) January, (b) April, (c) July and (d) October. Results are averaged over the 29-year period 1984-2012. Figure S2. Global geographical difference (in absolute terms) between ISCCP-H and CLARA-A2 TCC for (a) January, (b) April, (c) July and (d) October. Results are averaged over the 29-year period 1984-2012. Figure S3. Latitudinal dependence of the mean satellite zenith angle of CLARA-A2 and ISCCP-H over Europe (30°–70°N). For ISCCP-H two curves are plotted: the lower and upper curves show the mean satellite zenith angle at a longitude of 0° and 30°E, respectively. For latitudes larger than 50°N the CLARA-A2 and ISCCP-H curves overlap. Figure S4. Seasonal variation of TCC averaged over all ECA&D stations (in blue) south (left) and north (right) of 55N and the corresponding grid cells of ISCCP-H (in red) and CLARA-A2 (in black). These results are similar to those of Figure 8b of the manuscript but given separately for northern and southern stations.

Author Contributions

Conceptualization, N.H.; Data curation, V.T.; Investigation, V.T.; Methodology, N.H., N.B., J.F.M., C.M. and P.S.J.; Supervision, N.H., N.B. and J.F.M.; Writing—original draft, V.T.; Writing—review & editing, V.T., N.H., N.B., J.F.M., C.M., P.S.J. and I.V.

Funding

This research received no external funding.

Acknowledgments

The CLARA-A2 data used in our study are available at http://www.cmsaf.eu. The ISCCP-H data record can be accessed at https://www.ncdc.noaa.gov. ECA&D data are obtainable at https://www.ecad.eu.

Conflicts of Interest

The authors declare no conflict of interest.

References

  1. Norris, J.R.; Allen, R.J.; Evan, A.T.; Zelinka, M.D.; O’Dell, C.W.; Klein, S.A. Evidence for climate change in the satellite cloud record. Nature 2016, 536, 72–75. [Google Scholar] [CrossRef] [PubMed]
  2. Bony, S.; Stevens, B.; Frierson, D.M.W.; Jacob, C.; Kageyama, M.; Pincus, R.; Shepherd, T.G.; Sherwood, S.C.; Siebesma, A.P.; Sobel, A.H.; et al. Clouds, circulation and climate sensitivity. Nat. Geosci. 2015, 8, 261–268. [Google Scholar] [CrossRef]
  3. Boucher, O.; Randall, D.; Artaxo, P.; Bretherton, C.; Feingold, G.; Forster, P.; Kerminen, V.-M.; Kondo, Y.; Liao, H.; Lohmann, U.; et al. 2013: Clouds and aerosols. Climate Change 2013: The Physical Science Basis. Contribution of Working Group I to the Fifth Assessment Report of the Intergovernmental Panel on Climate Change; Stocker, T.F., Qin, D., Plattner, G.-K., Tignor, M., Allen, S.K., Doschung, J., Nauels, A., Xia, Y., Bex, V., Midgley, P.M., Eds.; Cambridge University Press: Cambridge, UK, 2013; pp. 571–657. [Google Scholar]
  4. Platnick, S.; Meyer, K.G.; King, M.D.; Wind, G.; Amarasinghe, N.; Marchant, B.; Arnold, G.T.; Zhang, Z.B.; Hubanks, P.A.; Holz, R.E.; et al. The MODIS Cloud Optical and Microphysical Products: Collection 6 Updates and Examples from Terra and Aqua. IEEE Trans. Geosci. Remote Sens. 2017, 55, 502–525. [Google Scholar] [CrossRef] [PubMed]
  5. Heidinger, A.K.; Foster, M.J.; Walther, A.; Zhao, X. The Pathfinder Atmospheres Extended (PATMOS-x) AVHRR Climate Dataset. Bull. Amer. Meteor. Soc. 2013. [Google Scholar] [CrossRef]
  6. Karlsson, K.G.; Hanschmann, T.; Stengel, M.; Meirinh, J.F. Algorithm Theoretical Basis Document, CM SAF Cloud, Albedo, Radiation data record, AVHRR-based, Edition 2 (CLARA-A2); Cloud Products (level-1 to level-3); Satellite Application Facility on Climate Monitoring (CM SAF): Darmstadt, Germany, 2017. [Google Scholar]
  7. Karlsson, K.G.; Antilla, K.; Trentmann, J.; Stengel, M.; Meirink, J.F.; Devasthale, A.; Hanschmann, T.; Kothe, S.; Jääskeläinen, E.; Sedlar, J.; et al. CLARA-A2: The second edition of the CM SAF cloud and radiation data record from 34 years of global AVHRR data. Atmos Chem. Phys. 2017, 17, 5809–5828. [Google Scholar] [CrossRef]
  8. Young, A.H.; Knapp, K.R.; Inamdar, A.; Hankinns, W.; Rossow, W.B. The International Cloud Climatology Project H-Series climate data record product. Earth Syst. Sci. Data 2018, 10, 583–593. [Google Scholar] [CrossRef]
  9. Rossow, W.B.; Walker, A.; Golea, V.; Knapp, K.R.; Young, A.; Inamdar, A.; Hankins, B. NOAA’s Climate Data Record Program: International Satellite Cloud Climatology Project Climate Data Record; H-Series; NOAA National Centers for Environmental Information: Asheville, NC, USA, 2016.
  10. Karl, T.R.; Steuer, P.M. Increased cloudiness in the United States during the first half of the Twentieth Century: Fact or fiction? Geophys. Res. Lett. 1990, 17, 1925–1928. [Google Scholar] [CrossRef]
  11. Free, M.; Sun, B. Trends in US total cloud cover from a homogeneity-adjusted dataset. J. Clim. 2014, 27, 4959–4969. [Google Scholar] [CrossRef]
  12. Sanchez-Lorenzo, A.; Calbó, J.; Wild, M. Increasing cloud cover in the 20th century: Review and new findings in Spain. Clim. Past 2012, 8, 1199–1212. [Google Scholar] [CrossRef]
  13. Christensen, J.H.; Hewitson, B.; Busuioc, A.; Chen, A.; Gao, X.; Held, I.; Jones, R.; Kolli, R.K.; Kwon, W.-T.; Laprise, R.; et al. Regional Climate Projections. In Climate Change 2007: The Physical Science Basis. Contribution of Working Group I to the Fourth Assessment Report of the Intergovernmental Panel on Climate Change; Solomon, S., Qin, D., Manning, M., Chen, Z., Marquis, M., Averyt, K.B., Tignor, M., Miller, H.L., Eds.; Cambridge University Press: Cambridge, UK; New York, NY, USA, 2007. [Google Scholar]
  14. Sanchez-Lorenzo, A.; Enriquez-Alonso, A.; Calbó, J.; González, J.A.; Wild, M.; Folini, D.; Norris, J.R.; Vicente-Serano, S.M. Fewer Clouds in the Mediterranean: Consistency of observations and climate simulations. Sci. Rep. 2017, 7, 414715. [Google Scholar] [CrossRef]
  15. Kotsias, G.; Lolis, C.J. A study on the total cloud cover variability over the Mediterranean region during the period 1979-2014 with the use of the ERA-Interim database. Theor. Appl. Climatol. 2017. [Google Scholar] [CrossRef]
  16. Meerkötter, R.; Köning, C.; Bissoli, P.; Gesell, G.; Mannstein, H. A 14-year European Cloud Climatology from NOAA/AVHRR data in comparison to surface observations. Geophys. Res. Lett. 2004, 31, L15103. [Google Scholar] [CrossRef]
  17. Enriquez-Alonso, A.; Sanchez-Lorenzo, A.; Calbó, J.; González, J.A.; Norris, J.R. Cloud Cover climatologies in the Mediterranean obtained from satellites, surface observations, reanalyses, and CMIP5 simulations: Validation and future scenarios. Clim. Dyn. 2016, 47, 249. [Google Scholar] [CrossRef]
  18. Levizzani, V.; Pinelli, F.; Pasqui, M.; Melani, S.; Laing, A.G.; Carbone, R.E. A 10-year climatology of warm-season cloud patterns over Europe and the Mediterranean from Meteosat IR observations. Atmos. Res. 2010, 97, 555–576. [Google Scholar] [CrossRef]
  19. Azorin-Molina, C.; Baena-Calatrava, R.; Echave-Calvo, I.; Connell, B.H.; Vicente-Serrano, S.M.; López-Moreno, J.I. A daytime over land algorithm for computing AVHRR convective cloud climatologies for the Iberian Peninsula and the Balearic Islands. Int. J. Clim. 2013, 33, 2113–2128. [Google Scholar] [CrossRef]
  20. Karlsson, K.G. A 10-year cloud climatology over Scandinavia derived from NOAA Advanced Very High Resolution Radiometer imagery. Int. J. Climatol. 2003, 23, 1023–1044. [Google Scholar] [CrossRef]
  21. Kästner, M.; Kriebel, K.T. Alpine cloud climatology using long-term NOAA-AVHRR satellite data. Theor. Appl. Clim. 2001, 57, 181–185. [Google Scholar] [CrossRef]
  22. Norris, J.R.; Wild, M. Trends in aerosol radiative effects over Europe inferred from observed cloud cover, solar “dimming,” and solar “brightening”. J. Geophys. Res. 2007, 112, D08214. [Google Scholar] [CrossRef]
  23. Warren, S.G.; Eastman, R.M.; Hahn, C.J. A Survey of Changes in Cloud Cover and Cloud Types over Land from Surface Observations, 1971–96. J. Clim. 2007, 20, 717–738. [Google Scholar] [CrossRef] [Green Version]
  24. Rojas, M.; Li, L.Z.; Kanakidou, M.; Hatzianastassiou, N.; Seze, G.; Le Treut, H. Winter weather regimes over the Mediterranean region: their role for the regional climate and projected changes in the twenty-first century. Clim. Dyn. 2013, 41, 551–571. [Google Scholar] [CrossRef]
  25. Ioannidis, E.; Lolis, C.J.; Papadimas, C.D.; Hatzianastassiou, N.; Bartzokas, A. On the intra-annual variation of cloudiness over the Medirranean region. Atmos. Res. 2017, 208, 246–256. [Google Scholar] [CrossRef]
  26. Karlsson, K.G.; Riihelä, A.; Müller, R.; Meirink, J.F.; Sedlar, J.; Stengel, M.; Lockhoff, M.; Trentmann, J.; Kaspar, F.; Hollmann, R.; et al. CLARA-A1: A cloud, albedo, and radiation dataset from 28 yr of global AVHRR data. Atmos. Chem. Phys. 2013, 13, 5251–5367. [Google Scholar] [CrossRef]
  27. Dybbroe, A.; Thoss, A.; Karlsson, K.-G. NWCSAF AVHRR cloud detection and analysis using dynamic thresholds and radiative transfer modeling. Part 1: Algorithm description. J. Appl. Meteor. 2005, 44, 39–54. [Google Scholar] [CrossRef]
  28. Heidinger, A.K.; Evan, A.T.; Foster, M.J.; Walther, A. A naive Bayesian cloud-detection scheme derived from CALIPSO and applied within PATMOS-x. J. Appl. Meteorol. Climatol. 2012, 51, 1129–1144. [Google Scholar] [CrossRef]
  29. Devasthale, A.; Raspaud, M.; Schlundt, C.; Hanschmann, T.; Finkensieper, S.; Dybbroe, A.; Hörnquist, S.; Håkansson, N.; Stengel, M.; Karlsson, K.-G. PyGAC: An open-source, community-driven Python interface to preprocess the nearly 40- year AVHRR Global Area Coverage (GAC) data record. GSICS Quartherly Newsl. 2017, 11. [Google Scholar] [CrossRef]
  30. Rossow, W.B.; Schiffer, R.A. Advances in understanding clouds from ISCCP. Bull. Am. Meteorol. Soc. 1999, 80, 2261–2287. [Google Scholar] [CrossRef]
  31. Rossow, W.B.; Ferrier, J. Evaluation of long-term calibrations of the AVHRR visible radiances. J. Atmos. Ocean. Technol. 2015, 32, 744–766. [Google Scholar] [CrossRef]
  32. Rossow, W.B.; Garder, L.C. Cloud Detection Using Satellite Measurements of Infrared and Visible Radiances for ISCCP. J. Clim. 1993, 6, 2341–2369. [Google Scholar] [CrossRef] [Green Version]
  33. Rossow, W.B.; Walker, A.W.; Garder, L.C. Comparison of ISCCP and other Cloud Amounts. J. Clim. 1993, 6, 2394–2418. [Google Scholar] [CrossRef]
  34. Rossow, W.B.; Schiffer, R.A. ISCCP Cloud Data Products. Bull. Am. Meteorol. Soc. 1991, 72, 2–20. [Google Scholar] [CrossRef] [Green Version]
  35. Anderson, J.; Hardy, E.; Roach, J.; Witmer, R. A Land Use and Land Cover Classification System for Use with Remote Sensor Data; Technical Report; U.S. Geological Survey: Reston, VA, USA, 1976.
  36. Van der A, R.J.; Allaart, M.A.F.; Eskes, H.J. Multi sensor reanalysis of total ozone. Atmos. Chem. Phys. 2010, 10, 11277–11294. [Google Scholar] [CrossRef] [Green Version]
  37. OSI SAF: The EUMETSAT OSI SAF Sea Ice Concentration Algorithm; Algorithm Theoretical Basis Document, SAF/OSI/CDOP/DMI/SCI/MA/189, Version 1.5; EUMETSAT: Darmstadt, Germany, 2016.
  38. Moody, E.G.; King, M.D.; Platnick, S.; Schaaf, C.B.; Gao, F. Spatially complete global spectral surface albedos: Value-added datasets derived from Terra MODIS land products. IEEE Trans. Geosci. Remote Sens. 2004, 43, 144–158. [Google Scholar] [CrossRef]
  39. Seemann, S.W.; Borbas, E.E.; Knuteson, R.O.; Stephenson, G.R.; Huang, H.-L. Development of a Global Infrared Land Surface Emissivity Database for Application to Clear Sky Sounding Retrievals from Multi-spectral Satellite Radiance Measurements. J. Appl. Meteorol. Clim. 2008, 47, 108–123. [Google Scholar] [CrossRef]
  40. Shi, L.; Matthews, J.L.; Ho, S.-P.; Yang, Q.; Bates, J.J. Algorithm Development of Temperature and Humidity Profile Retrievals for Long-Term HIRS Observations. Remote Sens. 2016, 8, 280. [Google Scholar] [CrossRef]
  41. Davis, S.; Rosenlof, K.; Hassler, B.; Hurst, D.; Read, W.; Vömel, H.; Selkirk, H.; Fujiwara, M.; Damadeo, R. The Stratospheric Water and Ozone Satellite Homogenized (SWOOSH) database: A long-term database for climate studies. Earth Syst. Sci. Data 2016, 8, 461–490. [Google Scholar] [CrossRef]
  42. Reale, A.; Tilley, F.; Ferguson, M.; Allegrino, A. NOAA operational sounding products for advanced TOVS. Int. J. Remote Sens. 2008, 29, 4615–4651. [Google Scholar] [CrossRef]
  43. Kinne, S.; O’Donnel, D.; Stier, P.; Kloster, S.; Zhang, K.; Schmidt, H.; Rast, S.; Giorgetta, M.; Eck, T.F.; Stevens, B. MAC-v1: A new global aerosol climatology for climate studies. J. Adv. Model. Earth Syst. 2013, 5, 704–740. [Google Scholar] [CrossRef] [Green Version]
  44. Robinson, D.A.; Frei, A. Seasonal variability of Northern Hemisphere snow extent using visible satellite data. Prof. Geogr. 2000, 52, 307–315. [Google Scholar] [CrossRef]
  45. Brown, R.D.; Robinson, D.A. Northern Hemisphere spring snow cover variability and change over 1922–2010 including an assessment of uncertainty. Cryosphere 2011, 5, 219–229. [Google Scholar] [CrossRef] [Green Version]
  46. Breivik, L.-A.; Eastwood, S.; Lavergne, T. Use of C-Band Scatterometer for Sea Ice Edge Identification. IEEE Trans. Geosci. Remote Sens. 2012, 50, 2669–2677. [Google Scholar] [CrossRef]
  47. Cavalieri, D.J.; Crawford, J.P.; Drinkwater, M.R.; Eppler, D.T.; Farmer, L.D.; Jentz, R.R.; Wackerman, C.C. Aircraft active and passive microwave validation of sea ice concentration from the Defense Meteorological Program Special Sensor Microwave Imager. J. Geophys. Res. 1991, 96, 21989–22008. [Google Scholar] [CrossRef]
  48. Loveland, T.R.; Merchant, J.W.; Ohlen, D.O.; Brown, J.F. Development of land-cover characteristics database for the conterminous U.S. Photogramm. Eng. Remote Sens. 1991, 57, 1453–1463. [Google Scholar]
  49. Klein Tank, A.M.G.; Wijngaard, J.B.; Konnen, G.P.; Böhm, R.; Demarée, G.; Gocheva, A.; Mileta, M.; Pashiardis, S.; Hejkrlik, L.; Kern-Hansen, C.; et al. Daily dataset of 20th-century surface air temperature and precipitation series for the European climate assessment. Int. J. Climatol. 2002, 22, 1441–1453. [Google Scholar] [CrossRef]
  50. Karlsson, K.-G.; Devasthale, A. Inter-Comparison and Evaluation of the Four Longest Satellite-Derived Cloud Climate Data Records: CLARA-A2, ESA Cloud CCI V3, ISCCP-HGM, and PATMOS-x. Remote Sens. 2018, 10, 1567. [Google Scholar] [CrossRef]
  51. Maddux, B.C.; Ackerman, S.A.; Platnick, S. Viewing Geometry Dependencies in MODIS Cloud Products. J. Atmos. Ocean. Technol. 2010, 27, 1519–1528. [Google Scholar] [CrossRef]
  52. Norris, J.R. What can cloud observations tell us about climate variability? Space Sci. Rev. 2000, 94, 375–380. [Google Scholar] [CrossRef]
  53. Norris, J.R.; Evan, A.T. Empirical Removal of Artifacts from the ISCCP and PATMOS-x Satellite Cloud Records. J. Atmos. Ocean. Technol. 2015, 32, 691–702. [Google Scholar] [CrossRef]
  54. Hahn, C.J.; Rossow, W.B.; Warren, S.G. ISCCP cloud properties associated with standard cloud types identified in individual surface observations. J. Clim. 2001, 14, 11–28. [Google Scholar] [CrossRef]
  55. Schweiger, A.J.; Lindsay, R.W.; Vavrus, S.; Francis, J.A. Arctic Clouds in Multiyear Satellite Data Sets. Geophys. Res. Lett. 1999, 26, 1845–1848. [Google Scholar] [CrossRef]
  56. Yousef, L.A.; Temini, M.; Youssef, W.; Weston, M.; Al Mandous, A. Assessment of Total Cloud Amounts and Analysis of Cloud Cover Climatology over the Arabian Peninsula. Geophys. Res. Abstr. 2018, 20, EGU2018-7909. [Google Scholar]
  57. Boers, R.; Brandsma, T.; Siebesma, A.P. Impact of aerosols and clouds on decadal trends in all-sky solar radiation over the Netherlands (1966–2015). Atmos. Chem. Phys. 2017, 17, 8081–8100. [Google Scholar] [CrossRef] [Green Version]
  58. Karlsson, K.-G.; Håkansson, N. Characterization of AVHRR global cloud detection sensitivity based on CALIPSO-CALIOP cloud optical thickness information: Demonstration of results based on the CM SAF CLARA-A2 climate data record. Atmos. Meas. Tech. 2018, 11, 633–649. [Google Scholar] [CrossRef]
  59. Zeng, Y.; Su, Z.; Calvet, J.-C.; Manninen, T.; Swinnen, E.; Schulz, J.; Roebeling, R.; Poli, P.; Tan, D.; Riihelä, A.; et al. Analysis of current validation practices in Europe for space-based Climate Data Records of Essential Climate Variables. Int. J. Appl. Earth Obs. Geoinf. 2015, 42, 150–161. [Google Scholar] [CrossRef]
  60. Loew, A.; Bell, W.; Brocca, L.; Bulgin, C.E.; Burdanowitz, J.; Calbet, X.; Donner, R.V.; Ghent, D.; Gruber, A.; Kaminski, T.; et al. Validation practices for satellite-based Earth observation data across communities. Rev. Geophys. 2017, 55, 779–817. [Google Scholar] [CrossRef] [Green Version]
  61. Su, Z.; Timmermans, W.J.; Zeng, Y.; Schulz, J.; John, V.O.; Roebeling, R.A.; Poli, P.; Tan, D.; Kaspar, F.; Kaiser-Weiss, A.K.; et al. An overview of European efforts in generating climate data records. Bull. Am. Meteorol. Soc. 2018, 99, 349–359. [Google Scholar] [CrossRef]
Figure 1. Geographical distribution of the ECA&D stations used in this study. The numbers are listed in Table 3.
Remotesensing 11 00212 g001
Figure 2. Average TCC for the 29-year period 1984-2012 over Europe based on (a) CLARA-A2 and (b) ISCCP-H, and (c) difference (in absolute terms) between ISCCP-H and CLARA-A2 TCC.
Remotesensing 11 00212 g002
Figure 3. (a) Time series of the mean annual TCC and (b) average seasonal variation of TCC from ISCCP-H and CLARA-A2 over the domain shown in Figure 2 for their common period (1984–2012).
Remotesensing 11 00212 g003
Figure 4. Scatter density plots of monthly mean TCC (%) of (a) CLARA-A2 and (b) ISCCP-H against all selected ECA&D stations.
Remotesensing 11 00212 g004
Figure 5. Correlation coefficients between (a) CLARA-A2 and ECA&D and (b) ISCCP-H and ECA&D TCC values. Correlation coefficient values are given for each one of the 22 selected stations and are increasing with increasing circle size.
Remotesensing 11 00212 g005
Figure 6. Same as in Figure 5, but for the slope of the linear regressions applied to the scatter plots, having the satellite-based TCC on the y axis and the ground-based TCC on the x axis.
Remotesensing 11 00212 g006
Figure 7. Same as in Figure 5, but for the TCC bias value (in percent).
Remotesensing 11 00212 g007
Figure 8. (a) Mean annual TCC and (b) seasonal variation of TCC averaged over all ECA&D stations and the average of the corresponding grid cells of ISCCP-H and CLARA-A2 for their common period (1984–2012). Vertical bars denote the year-to-year variability of monthly TCC values. (c) Seasonal variation of the bias of CLARA-A2 and ISCCP-H with respect to ECA&D.
Remotesensing 11 00212 g008
Table 1. Summary of main differences between the CLARA-A2 and ISCCP-H cloud data records.
CLARA-A2ISCCP-H
Fundamental Climate Data Records (FCDRs)Based on an AVHRR GAC FCDR described in [7], including shortwave calibration with MODIS Collection 6 as a reference, removal of corrupt data, and noise reduction for AVHRR channel 3b.Generated by applying HBT tables to B1U geostationary satellite data and AVHRR GAC radiances.
Cloud Detection AlgorithmsBased on an upgraded version (patch 1) of the PPS (Polar Platform System) Version 2014 cloud processing package.Improved version of the D-series algorithm with applied modifications that mostly serve to reduce uncertainties.
Ancillary dataVarious parameters from ERA-Interim (atmospheric temperature and humidity profiles, surface skin temperature, integrated water vapor, snow cover), land use from Unites States Geological Survey (USGS) in [35], surface elevation from GTOPO30 (http://edcdaac.usgs.gov/gtopo30/), total ozone column from [36], sea ice observations from (OSI SAF, 2016) [37], and MODIS-based surface albedo [38] and surface emissivity [39].Atmospheric temperature-humidity profiles (HIRS, SAGE, MLS) [40,41], total column ozone abundance (TOMS, OMI, SBUV, TOVS) [42], tropospheric and stratospheric aerosol optical properties (MACv.1, SAGEII) [43], land snow cover (NOAA) [44,45] and ocean sea ice cover (OSI-SAF, SSM/I) [46,47], land surface type (MODIS IGBP) [48] and topographic height information (USGS EROS) and land water mask (USGS AVHRR).
SatellitesCombines day and night measurements from all available satellites. The number of satellites varies from one in the early part of the record to at least four in the last decade. With each satellite having two (daytime plus nighttime) or—towards higher latitudes—more overpasses over a specific location per day.Between 55°S and 55°N geostationary satellites are used. At higher latitudes, ISCCP uses both morning and afternoon polar orbiting satellites simultaneously for the gridded data products.
Spectral ChannelsIncorporates six spectral channels.Incorporates one VIS and one IR channel.
Table 2. Satellites and their temporal coverage in CLARA-A2 and ISCCP-H. Only the satellites covering the European study domain and being operational before the end of the study period (31 Dec 2012) are listed.
SatelliteStartEndEquatorial Overpass TimeIn CLARA-A2In ISCCP-H
NOAA-724 Aug 19817 Jun 19860230 PMyesyes
NOAA-83 May 198331 Oct 19850730 AMnoyes
NOAA-925 Feb 198511 May 19940230 AMyesyes
NOAA-1017 Nov 198617 Sep 19910730 AMnoyes
NOAA-118 Nov 198813 Sep 19940200 AMyesyes
NOAA-1214 May 199115 Dec 19940730 AMyesyes
NOAA-1430 Dec 199423 May 20070130 PMyesyes
NOAA-1513 May 199831 Dec 20120730 AMyesyes
NOAA-1621 Sep 20009 Jun 20140200 PMyesyes
NOAA-1724 Jun 200231 Dec 20121000 AMyesyes
NOAA-1830 Aug 200531 Dec 20120200 PMyesyes
NOAA-192 Jun 200931 Dec 20120200 PMyesyes
MetOp-A20 Jun 200731 Dec 20120930 AMyesyes
MET-2Jul 1983Jul 1988 noyes
MET-3Aug 1988Apr 1990 noyes
MET-4May 1990Jan 1994 noyes
MET-5Feb 1994Dec 2006 noyes
MET-6Mar 1997May 1998 noyes
MET-7Jun 1998Dec 2012 noyes
MSG-1Jul 2006Apr 2007 noyes
MSG-2May 2007Dec 2012 noyes
Table 3. European Climate Assessment & Dataset (ECA&D) stations used in this study along with their coordinates.
ECA&D StationLatitudeLongitude
Tromsø (1)69.65°N18.93°E
Oslo-Blindern (2)59.94°N10.72°E
Stockholm (3)59.35°N18.05°E
Eskdalemuir (4)55.32°N03.20°W
Groningen (5)53.12°N06.58°E
De Bilt (6)52.10°N05.18°E
Heathrow (7)51.48°N00.45°E
Wien (8)48.23°N16.35°E
München-Botanischer Garten (9)48.16°N11.50°E
Geneve-Observatoire (10)46.25°N06.13°E
Lugano (11)46.00°N08.97°E
Zagreb-Gric (12)45.82°N15.98°E
Belgrade (13)44.80°N20.47°E
A Coruña (14)43.37°N08.42°W
Bilbao-Aeropuerto (15)43.30°N02.91°W
Zaragoza-Aeropuerto (16)41.66°N01.01°W
Barcelona-Aeropuerto (17)41.29°N02.07°E
Madrid-Barajas (18)40.47°N03.56°W
Corfu (19)39.62°N19.92°E
Athens-Hellinikon (20)37.90°N23.75°E
Sevilla-San Pablo (21)37.42°N05.88°W
Heraklion (22)35.33°N25.18°E
Table 4. Mean Absolute Error (MAE) and Root Mean Squared Error (RMSE), both in percent cloud cover, for the comparison between CLARA-A2 and ISCCP-H against ECA&D stations.
ECA&D StationMAERMSE
CLARA-A2—ECA&DISCCP-H—ECA&DCLARA-A2—ECA&DISCCP-H—ECA&D
Tromsø7.06.29.07.8
Oslo-Blindern7.25.89.37.6
Stockholm6.26.28.28.0
Eskdalemuir4.34.76.46.2
Groningen6.710.48.812.4
De Bilt4.77.86.49.7
Heathrow7.26.59.58.5
Wien4.89.26.610.8
München-Botanischer Garten6.69.28.611.1
Geneve-Observatoire4.28.36.210.2
Lugano5.710.48.012.5
Zagreb-Gric4.66.86.28.7
Belgrade8.710.210.811.9
A Coruña5.97.18.08.7
Bilbao-Aeropuerto7.77.210.49.6
Zaragoza-Aeropuerto5.98.67.89.8
Barcelona-Aeropuerto5.79.17.510.8
Madrid-Barajas9.79.711.811.2
Corfu8.513.111.415.3
Athens-Hellinikon7.016.712.618.7
Sevilla-San Pablo8.18.410.510.2
Heraklion6.811.79.214.8

