Article

Applications of TRMM- and GPM-Era Multiple-Satellite Precipitation Products for Flood Simulations at Sub-Daily Scales in a Sparsely Gauged Watershed in Myanmar

1
State Key Laboratory of Hydrology-Water Resources and Hydraulic Engineering, College of Hydrology and Water Resources, Hohai University, 1 Xikang Road, Nanjing 210098, China
2
Department of Meteorology and Hydrology, Office No. 5, Ministry of Transport and Communications, Naypyitaw 15011, Myanmar
*
Author to whom correspondence should be addressed.
Remote Sens. 2019, 11(2), 140; https://doi.org/10.3390/rs11020140
Submission received: 23 October 2018 / Revised: 7 January 2019 / Accepted: 9 January 2019 / Published: 12 January 2019
(This article belongs to the Special Issue Remote Sensing for Streamflow Simulation)

Abstract

:
Tropical Rainfall Measuring Mission (TRMM) and its successor, Global Precipitation Measurement (GPM), have provided hydrologists with important precipitation data sources for hydrological applications in sparsely gauged or ungauged basins. This study proposes a framework for statistical and hydrological assessment of the TRMM- and GPM-era satellite-based precipitation products (SPPs) in both near- and post-real-time versions at sub-daily temporal scales in a poorly gauged watershed in Myanmar. It evaluates six of the latest GPM-era SPPs: Integrated Multi-satellite Retrievals for GPM (IMERG) “Early”, “Late”, and “Final” run SPPs (IMERG-E, IMERG-L, and IMERG-F, respectively), and Global Satellite Mapping of Precipitation (GSMaP) near-real-time (GSMaP-NRT), standard version (GSMaP-MVK), and standard version with gauge-adjustment (GSMaP-GAUGE) SPPs, and two TRMM Multi-satellite Precipitation Analysis SPPs (3B42RT and 3B42V7). Statistical assessment at grid and basin scales shows that 3B42RT generally presents higher quality, followed by IMERG-F and 3B42V7. IMERG-E, IMERG-L, GSMaP-NRT, GSMaP-MVK, and GSMaP-GAUGE largely underestimate total precipitation, and the three GSMaP SPPs have the lowest accuracy. Given that 3B42RT demonstrates the best quality among the evaluated four near-real-time SPPs, 3B42RT obtains satisfactory hydrological performance in 3-hourly flood simulation, with a Nash–Sutcliffe model efficiency coefficient (NSE) of 0.868, and it is comparable with the rain-gauge-based precipitation data (NSE = 0.895). In terms of post-real-time SPPs, IMERG-F and 3B42V7 demonstrate acceptable hydrological utility, and IMERG-F (NSE = 0.840) slightly outperforms 3B42V7 (NSE = 0.828). This study found that IMERG-F demonstrates comparable or even slightly better accuracy in statistical and hydrological evaluations in comparison with its predecessor, 3B42V7, indicating that GPM-era IMERG-F is the reliable replacement for TRMM-era 3B42V7 in the study area. The GPM scientific community still needs to further refine precipitation retrieving algorithms and improve the accuracy of SPPs, particularly IMERG-E, IMERG-L, and GSMaP SPPs, because ungauged basins urgently require accurate and timely precipitation data for flood control and disaster mitigation.

Graphical Abstract

1. Introduction

Myanmar is the second largest country in Southeast Asia. Four main rivers travel through the country: the Ayeyarwaddy, Chindwin, Thanlwin, and Sittoung. As the third largest river in Myanmar, the Chindwin River serves as one of the principal water resources of the country. The river flows into the Central Valley Region, which is the most economically developed area of the country (Figure 1). Owing to the effects of complex topography and the southwest monsoon, the Chindwin River basin suffers from severe floods every year at one location or another, causing enormous damage to local society. Myanmar is a country with an underdeveloped economy and limited infrastructure investment, particularly in meteorological observation. The rainfall-monitoring network in the Chindwin River basin is very sparse, with a limited number of rain gauges, which likely affects the accuracy of local flood forecasting for prompt flood control and timely disaster mitigation to some degree. The recent rapid development of satellite-based precipitation retrieving techniques has provided hydrologists an unprecedented opportunity to acquire alternative precipitation data sources for flood simulation and forecasting in data-sparse or ungauged basins. The development of satellite-based precipitation products (SPPs) has undergone two important stages, namely, the Tropical Rainfall Measuring Mission (TRMM) era [1] and the Global Precipitation Measurement (GPM) era [2]. The representative SPPs in these two eras include Precipitation Estimation from Remotely Sensed Information using Artificial Neural Network (PERSIANN) [3], Climate Precipitation Center morphing method (CMORPH) [4], Climate Hazards Group Infrared Precipitation with Stations [5], TRMM Multi-satellite Precipitation Analysis (TMPA) [1], Global Satellite Mapping of Precipitation (GSMaP) [6], and Integrated Multi-satellite Retrievals for GPM (IMERG) [2]. These SPPs generally provide quasi-global precipitation maps on high spatiotemporal resolutions (finer than 0.25° spatial resolution and shorter than the daily time interval); TRMM-era SPPs, in particular, have been widely adopted in hydrological applications in many parts of the world [7,8,9,10,11,12,13,14,15,16,17,18,19,20,21,22,23].
Developed by the Goddard Space Flight Center of the National Aeronautics and Space Administration (NASA), TMPA SPPs are regarded as reliable and were broadly used satellite products during the TRMM era [22,23,24,25]. TMPA combines low-earth orbiting microwave (MW) data and geostationary infrared (IR) data from multiple satellites and provides precipitation estimates on high spatiotemporal resolution (0.25° × 0.25° and 3-h interval), thereby covering the 50°N–50°S latitude band [1]. TMPA SPPs in near- and post-real-time versions have been extensively used in water resources management, hydrological simulations, and flood monitoring [11,12,13,14,15,16,17,18,19,20,21,22,23]. These studies proved that TMPA has acceptable or even satisfactory accuracy and hydrological prediction ability in many regions of the world.
The GPM mission was officially launched by NASA and the Japan Aerospace Exploration Agency (JAXA) in February 2014, and the TRMM mission was terminated in April 2015, symbolizing the beginning of a new era for SPPs, that is, the GPM era [2]. As a global successor of TRMM, GPM comprises an international satellite constellation (1 core observatory satellite and approximately 10 partner satellites), and its core observatory satellite is equipped with an advanced Dual-Frequency Precipitation Radar (DRP, the Ku-band at 13.5 GHz and Ka-band at 35.5 GHz) and a multi-channel GPM MW IMAGER (GMI) (frequency of 10–183 GHz) [26]. NASA released its first GPM-era global precipitation product, IMERG, in March 2014. IMERG provides global precipitation estimates at finer spatiotemporal scales (0.1° × 0.1° and 30-min interval) and more expansive quasi-global coverage (60°N–60°S) than TMPA products [26]. IMERG includes three products with different latencies: the near-real-time “Early” and “Late” run (IMERG-E and IMERG-L, respectively) and the post-real-time “Final” run (IMERG-F) [26]. Many previous studies demonstrated that IMERG SPPs generally present a relatively higher accuracy in comparison with TMPA in many regions, such as the conterminous USA [27,28], Brazil [29], West and East Africa [30], the northern highlands of Pakistan [31], Malaysia [32], India [33,34], the Mekong River basin [35,36], Iran [37,38], South Korea [39], Japan [39], Mainland China [40,41], the Qinghai–Tibet Plateau [42,43], the Beijiang River basin [24], the Mishui basin [25], and the Yellow River source region [44] of China.
Not many previous studies [24,25,36,44,45,46,47,48,49,50] have evaluated the performance of IMERG in streamflow simulations at the basin scale because it has only been released for four years. For instance, in the Ganjiang River basin of China, Tang et al. [45] highlighted that IMERG-F version 03 (V03) performs similarly to the ground precipitation data in daily discharge simulations and outperforms TMPA version 7 (V7) near-real-time product (3B42RT) and post-real-time product with gauge-based bias-correction (3B42V7) in many cases. Li et al. [46] further proved that the gauge-corrected radar precipitation estimates and rain-gauge-interpolated data exhibit better hydrological performance in hourly streamflow simulations in the Ganjiang River basin compared with IMERG-F V03. Yuan et al. [47] demonstrated that IMERG-F V03 and 3B42V7 are feasible in daily discharge simulations in the Chindwin River basin in Myanmar, in which 3B42V7 is more suitable than IMERG-F in terms of Nash-Sutcliffe model efficiency coefficient (NSE) and relative bias of total runoff. In the Beijiang River basin of China, the variable infiltration capacity model-based daily streamflow simulations showed that IMERG-F V03 has high accuracy and good hydrological utility, IMERG-E and IMERG-L have satisfactory hydrological utility during the flood season, and IMERG-F generally outperforms 3B42V7 [24]. Zubieta et al. [48] indicated that IMERG-F V03 is as useful as 3B42V7 and 3B42RT in simulating daily streamflow in the southern regions of the Peruvian−Ecuadorian Amazon basin, but none of the three SPPs properly simulate streamflow in the northern regions. Yuan et al. [44] concluded that IMERG-F version 05 (V05) and 3B42V7 are feasible for 3-hourly flood simulations in the Yellow River source region of China, and IMERG-F is better suited than 3B42V7, with the IMERG-F-based simulation runs presenting higher NSEs and lower systematic biases of total runoff relative to the 3B42V7-driven model runs. In the Mishui basin of China, IMERG-F V05 demonstrates the best performance in daily streamflow simulation, and IMERG-E presents comparable performance to that of 3B42V7 [25]. Most of these studies [24,25,36,44,45,48] indicated that IMERG improves hydrological utilities over TMPA standard products owing to its enhanced precipitation retrieving techniques. However, most relevant studies [24,25,36,45,47,48,50] focused on assessing the hydrological utility of IMERG at daily or monthly time scales, while evaluations at sub-daily temporal scales have seldom been reported [44,46,49]. Furthermore, studies on the hydrological performance of all the “Early”, “Late”, and “Final” runs of IMERG are rare [24,25,50]. Focusing on the hydrological utilities of IMERG in near- and post-real-time versions at sub-daily temporal scales is necessary, considering that near-real-time SPPs in fine spatiotemporal resolutions and short latencies are expected to be reliable precipitation data sources for flood forecasting and monitoring.
Another prevailing satellite-based global precipitation monitoring project in the TRMM and GPM eras is GSMaP, which was supported by the Core Research for Evolutional Science and Technology of the Japan Science and Technology Agency and promoted by the JAXA Precipitation Measuring Mission (PMM) science team [6]. The GSMaP algorithm combines information from TRMM and other satellites to produce high-resolution (0.1° × 0.1°, 1 hourly) global precipitation products over the 60°N–60°S domain [6]. As the Japanese partner of GPM, the JAXA PMM science team recently updated the GSMaP algorithm for the GPM mission by merging passive MW (PMW) radiometer data from GPM Core GMI. GSMaP provides a series of precipitation estimates with different latencies, such as near-real-time product (GSMaP-NRT), post-real-time product with MW-IR reanalysis (GSMaP-MVK), and gauge-corrected post-real-time product (GSMaP-GAUGE). These products have been used for hydrological applications, such as flash flood simulations in the Nile River basin in Egypt [51], the Huong River basin in Vietnam [52], the Karpuz River basin in Turkey [10], and the Jhelum, Chenab, and upper Indus River basins in Pakistan [53,54]; flood inundation modeling in the Thua Thien Hue Province in Vietnam [55] and the Mundeni Aru River basin in Sri Lanka [9]; daily streamflow simulations in the Tocantins–Araguaia basin in Brazil [7], the Soyang dam basin in South Korea [56], and the Biliu basin in China [8]; annual runoff analysis in West Africa [57]; and global surface runoff mapping [58]. However, most of these studies [7,8,9,10,51,52,53,54,55,56,57] mainly adopted TRMM-era GSMaP SPPs (e.g., GSMaP versions 04 and 05) for hydrological evaluations or applications, and the hydrological assessment of GPM-era GSMaP SPPs (e.g., versions 06 and 07) was rarely reported. Since IMERG and GSMaP are two parallel SPPs for the GPM mission, these two products should be hydrologically evaluated and quantitatively compared in different regions of the world.
This study evaluates two parallel GPM-era IMERG and GSMaP SPPs in comparison with TRMM-era TMPA products from the statistical and hydrological aspects in the poorly gauged Chindwin River basin in Myanmar (Figure 1). Given that few previous studies have focused on the statistical and hydrological evaluations of GPM-era IMERG and GSMaP SPPs in both near- and post-real-time versions at sub-daily time scales, the main goals of this study are as follows:
(1)
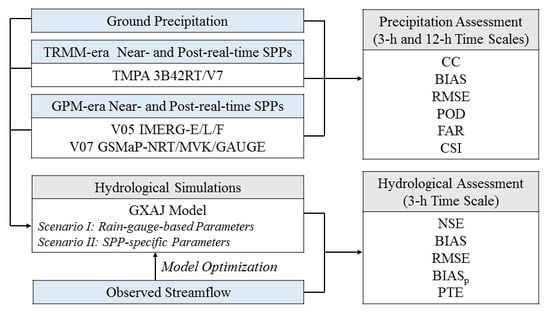
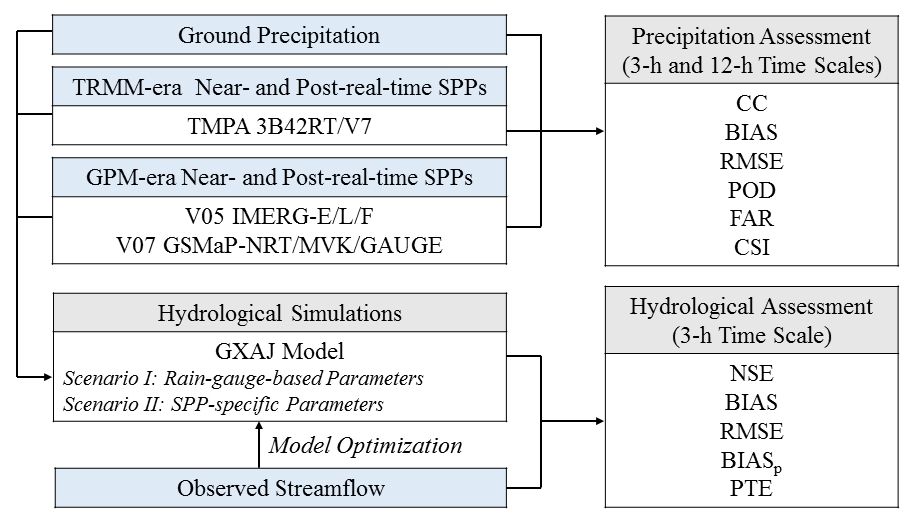
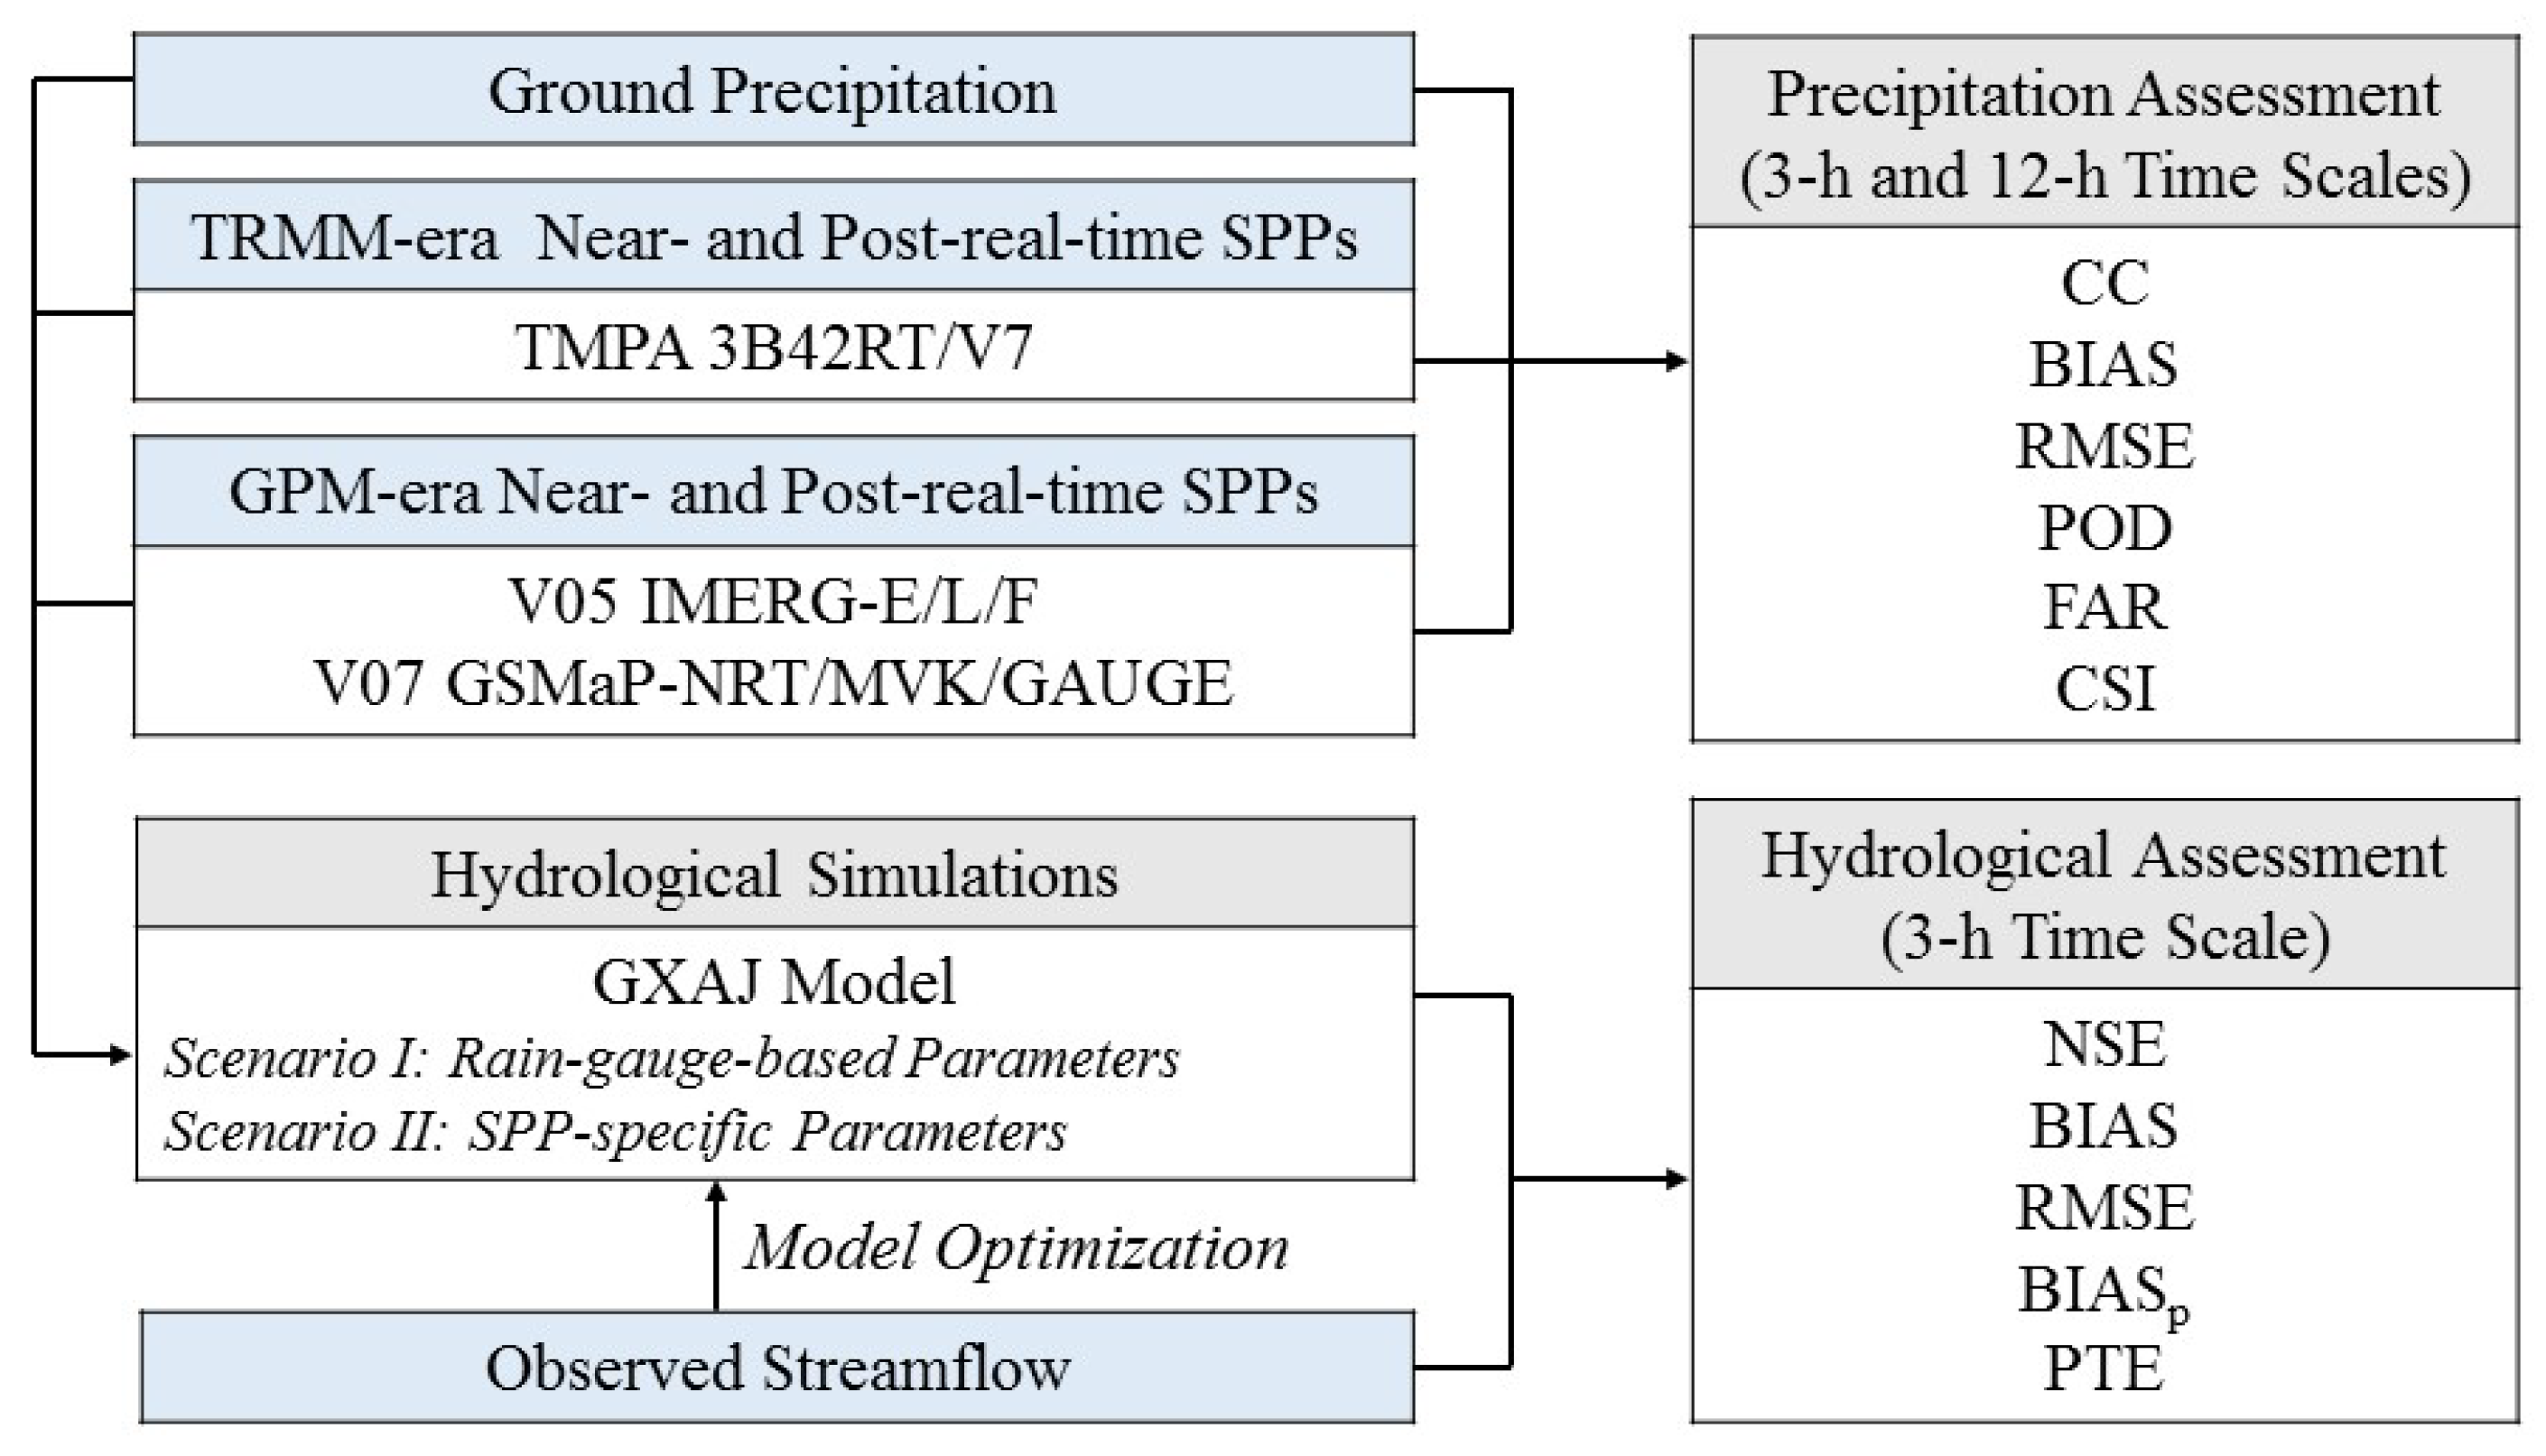
statistically assess and compare the accuracy of the latest GPM-era IMERG (IMERG-E, IMERG-L, and IMERG-F) and GSMaP (GSMaP-NRT, GSMaP-MVK, and GSMaP-GAUGE) SPPs with that of the TRMM-era TMPA SPPs (3B42RT and 3B42V7) at sub-daily time scales (3 h for daytime precipitation estimates and 12 h for nighttime precipitation retrievals) in the study area; and
(2)
comprehensively assess the hydrological performance of the latest GPM-era SPPs in simulating historical discharge processes at 3-h temporal scales in comparison with TMPA SPPs.
This manuscript presents the first comprehensive study on the feasibility of the latest GPM-era SPPs in flood simulations in the Chindwin River basin. The findings reported in this manuscript are expected to provide SPP researchers with timely and useful feedbacks from the poorly gauged basin in Myanmar with regards to the quality of the latest GPM-era SPPs. This study also has the potential to provide valuable guidelines for the hydrological applications of SPPs in the Chindwin River basin.

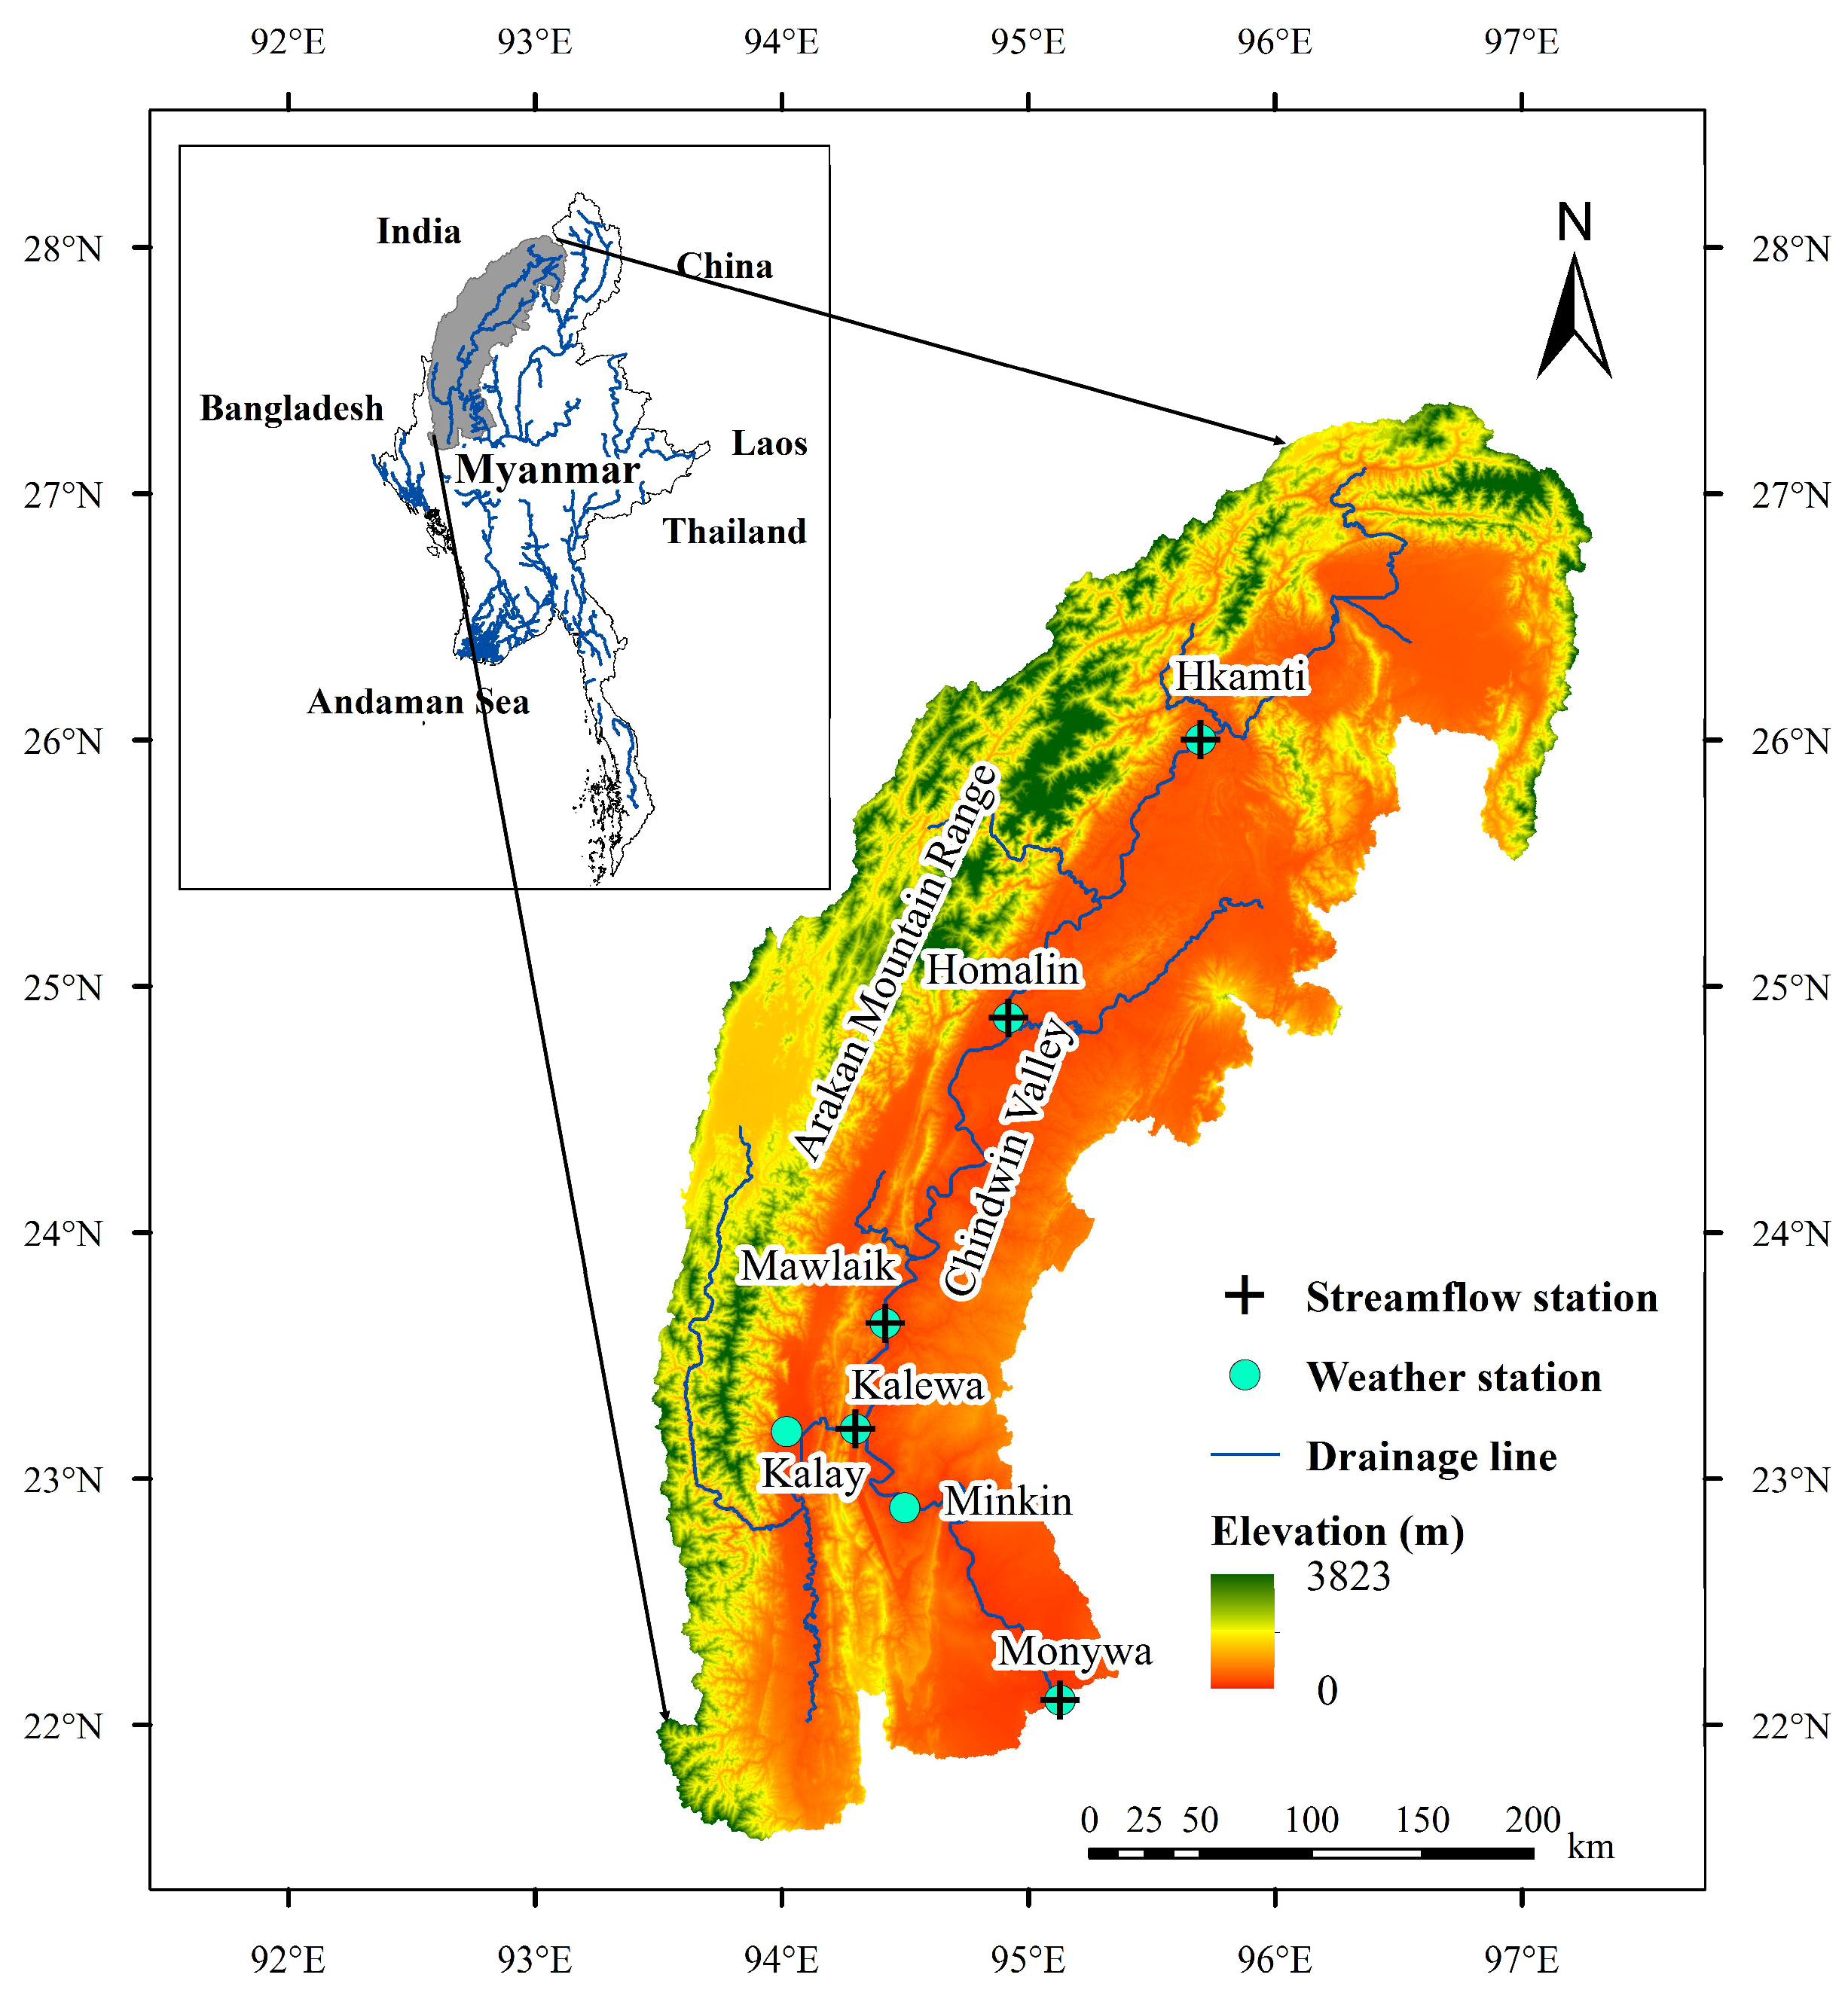
2. Study Area and Data Processing

2.1. Study Area

The Chindwin River basin is located in the northwestern part of Myanmar within the latitude of 21.6°–27.4°N and longitude of 93.5°–97.3°E (Figure 1). The river has a drainage area of 110,350 km2 and a length of 985 km. The Chindwin River basin is mainly characterized by a complex mountainous terrain (the Arakan Mountain Range) in the north and west, and the wide Chindwin Valley at its central and southern parts (Figure 1). The basin is situated in subtropical and tropical climate regions and has distinct humid and dry seasons controlled by monsoon systems. The southwest monsoon season begins in June and ends in September, with a rainy and hot summer. The northeast monsoon prevails from December to April, leading to the dry and cool season. Precipitation is highly spatially uneven due to the effects of complex topography and the southwest monsoon. The mean annual precipitation tends to decline sharply from the north (approximately 3700 mm) to the south (approximately 750 mm) [47]. The basin suffers from severe floods every year, and floods occur most frequently and seriously in July and August, contributing 72% of the total number of flood events because of the high rainfall intensities with considerable spatiotemporal variations in the southwest monsoon season [47,59,60,61,62]. Severe flood disasters cause enormous damage to the local society, leading to serious threats to people’s lives, property, and safety. Thus, predicting and monitoring flood risks and employing effective prevention measures are urgent and necessary. However, the local rainfall-monitoring network is sparse, with a density of 0.63 rain gauge per 10,000 km2, which hampers the accuracy of flood forecasting. Therefore, adopting SPPs on fine spatiotemporal resolutions as supplementary precipitation data sources is a promising approach for effective flood simulation and timely flood forecasting.

2.2. Ground Weather Data

The weather data set at seven stations (Figure 1) from 1 January 2014 to 31 December 2016 was collected from the Department of Meteorology and Hydrology (DMH), Myanmar. These seven weather stations are not included in the Global Precipitation Climatology Centre (GPCC) gridded gauge-analysis precipitation data set or the Climate Prediction Center (CPC) Unified Gauge-based Analysis of Global Daily Precipitation data set. The local time is six and a half hours ahead of Coordinated Universal Time (UTC). Local weather stations measure precipitation at 3-h time intervals in the daytime (00:00–12:00 UTC), while precipitation data are collected only once at night (12:00–00:00 UTC). Thus, precipitation data in one diurnal cycle are composed of four 3-h precipitation amount records in the daytime and one 12-h record at night time. The weather data set also includes the daily maximum and minimum near-surface air temperature data from 1 January 2014 to 31 December 2016. DMH has conducted data quality control on the ground weather data, which includes checks of internal consistency, extreme values, and spatial consistency.
The 12-h precipitation records at night time were evenly decomposed into four 3-h precipitation values, and the inverse-distance weighting method was used to interpolate the gauge-based precipitation and air temperature data to the 0.25° spatial resolution to facilitate 3-hourly flood simulations using a distributed hydrological model (Section 3.3).

2.3. Satellite Precipitation Data

This study evaluated eight SPPs from 1 April 2014 to 31 December 2016. A brief description of these SPPs is given as follows.

2.3.1. TMPA Version 7 Products

TMPA SPPs were designed to combine various MW and IR satellite-based measurements and ground-based gauge observations to provide 3-hourly quasi-global quantitative precipitation estimates [1]. The TMPA V7 3-hourly rainfall products were released in late 2013 and comprises two products, near-real-time version (3B42RT) and post-real-time version (3B42V7), with a spatial resolution of 0.25°. 3B42RT is directly produced from the combination of calibrated PMW estimates and IR data calibrated by the PMW from satellites with a latency of 8 h. The 3B42V7 product is derived by bias-adjusting the near-real-time product with the GPCC monthly gauge-analysis precipitation data set, and it has a two-month latency. In this study, the 3B42RT and 3B42V7 3-hourly SPPs from 1 April 2014 to 31 December 2016 were downloaded from the PMM website [63]. Using the method suggested by Yuan et al. [47], the present study converted 3B42RT and 3B42V7 SPPs into 3-hourly precipitation estimates in accordance with the local time that is six and a half hours ahead of UTC.

2.3.2. IMERG Version 05B Products

IMERG is the unified U.S. algorithm that provides multi-satellite precipitation products for the U.S. GPM team [26]. The latest IMERG version 05B (V05B) products were released to the public in January 2018. IMERG V05B uses the 2017 version of the Goddard Profiling Algorithm to retrieve precipitation estimates from the GPM constellation using various precipitation-relevant satellite PMW sensors. Then the precipitation estimates are gridded and inter-calibrated into the GPM combined instrument product, further interpolated, and re-calibrated by the CPC Morphing-Kalman Filter Lagrangian time interpolation and the PERSIANN-Cloud Classification System recalibration schemes. The IMERG system is run twice in near-real time and provides IMERG-E and IMERG-L with 4-h and 12-h latencies, respectively. Moreover, IMERG adopts the GPCC monthly gridded gauge-analysis precipitation data set to adjust the near-real-time products and provides IMERG-F with a latency of two and half months. These products have spatial and temporal resolutions of 0.1° and 30 min, respectively. In this study, IMERG-E, IMERG-L, and IMERG-F half-hourly SPPs from 1 April 2014 to 31 December 2016 were acquired from the PMM website [64]. Precipitation values in the six sequential half-hourly precipitation files were summed up, and the time difference between local time and UTC (+6.5 h) were considered to derive the IMERG precipitation estimates at 3-h intervals. The three IMERG products were aggregated from a 0.1° to 0.25° spatial resolution using the approach suggested by Yuan et al. [47] to facilitate flood simulations on a spatial resolution of 0.25°.

2.3.3. GSMaP Version 07 Products

The GSMaP version 07 (V07) products were released by JAXA in January 2017 using the latest algorithm for the GPM mission and have provided retrospective precipitation data since March 2014. This study evaluated three GSMaP V07 products, namely, GSMaP-NRT, GSMaP-MVK, and GSMaP-GAUGE. GSMaP-NRT synergistically uses available MW imagers and sounders, including GPM, with a 4-h latency. Similar to GSMaP-NRT, GSMaP-MVK also uses IR to correct satellite estimates but adopts various PWM imagers and sounders; it has a latency of 3 d. In addition to PWM and IR, GSMaP-GAUGE uses the CPC Unified Gauge-based Analysis of Global Daily Precipitation data set to adjust precipitation biases with a latency of 3 d. All three products are on a 0.1° spatial resolution and at 1-h time intervals. In this study, GSMaP-NRT, GSMaP-MVK, and GSMaP-GAUGE hourly SPPs from 1 April 2014 to 31 December 2016 were obtained from the JAXA Global Rainfall Watch website [65]. The hourly GSMaP SPPs were converted into precipitation estimates at 3-h time intervals, and the time gap between local time and UTC was considered. The three GSMaP products were also transformed from a 0.1° spatial resolution to 0.25° using the same approach for the IMERG products [47].

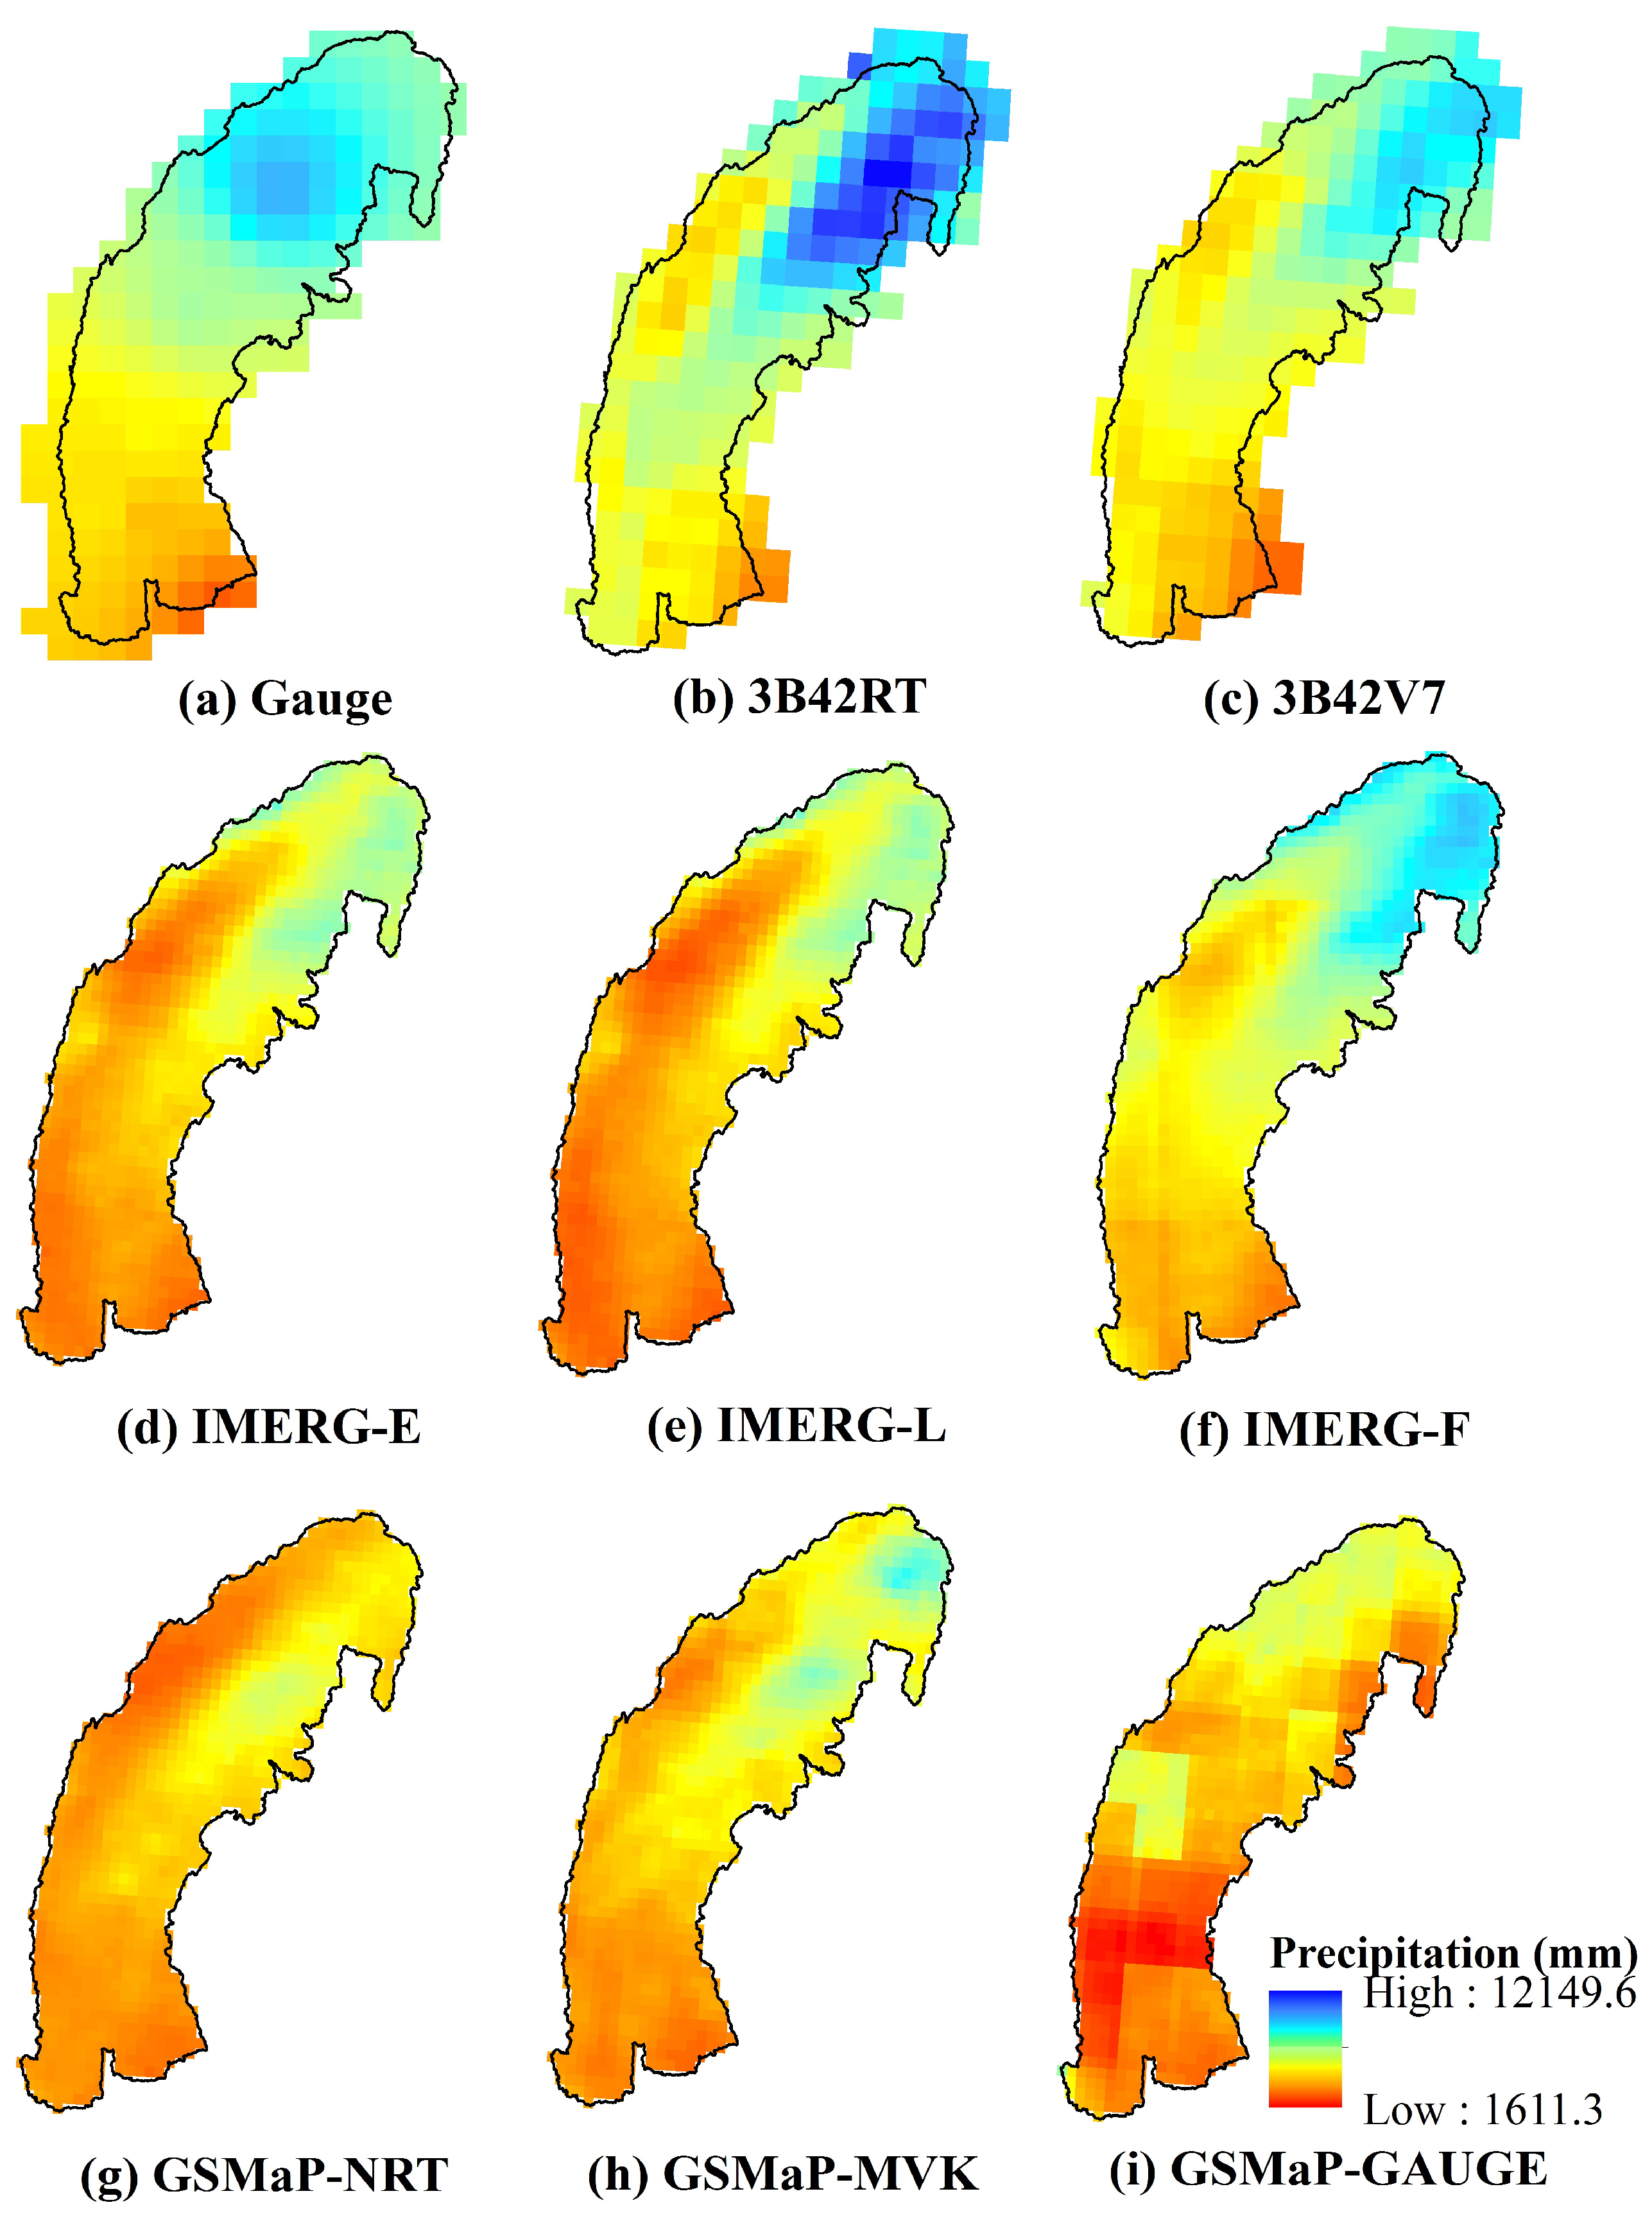
2.3.4. Spatial Distribution of Total Precipitation from SPPs and Gauge-Based Precipitation Data

Figure 2a shows the spatial distribution of total precipitation amount, which was derived from the gauge-based gridded precipitation data on a 0.25° resolution during the period of 1 April 2014–31 December 2016. This figure indicates that precipitation has large spatial variability and tends to decrease sharply from north to south. The maximum total precipitation amount (9701.4 mm) was observed in the headwater region, whereas the lowest amount (2506.5 mm) appeared in the basin outlet region. Since part of the Arakan Mountain Range is located in the northern region of the watershed, the high mountains remarkably block the atmospheric moist from moving northward and considerably increase precipitation in the northern mountainous region. Figure 2b–i show that the eight SPPs demonstrate a spatial pattern similar to that of the gauge-based gridded precipitation data, with a noticeable decreasing trend from the upper to the lower reaches. However, 3B42RT generally estimates a wetter condition throughout the watershed than the gauge-based data set, except in the western highland region, where remarkably less precipitation is derived (Figure 2b). 3B42V7 and IMERG-F generally provide slightly lower precipitation estimates in the northern part of the watershed than the gauge-based data set does (Figure 2c,f). IMERG-E, IMERG-L, GSMaP-NRT, GSMaP-MVK, and GSMaP-GAUGE derive an obviously dry situation throughout the basin, particularly in the northern and western parts of the watershed (Figure 2d,e,g–i), and GSMaP-GAUGE provides the driest situation among all SPPs (Figure 2i). Notably, nearly all SPPs (excluding GSMaP-GAUGE) estimate that precipitation in the west part of the river basin and the southern flood plain region is lesser than those in other regions. These regions, where less precipitation is estimated, are located in the eastern slopes of the Arakan Mountains. Meteorologically, the Arakan Mountains act as a barrier to the southwestern monsoon rains, thereby making the western slopes extraordinarily wet and the eastern slopes dry during the monsoon. However, the spatial precipitation pattern derived from the gauge-based data set does not show this topographical effect. The possible reason is that all seven weather stations are situated in the Chindwin Valley, while the Arakan highland region has no stations (Figure 1). As a result, the gauge-based gridded precipitation data might not sufficiently capture the actual precipitation situation in the Arakan mountainous region. IMERG-E, IMERG-L, IMERG-F, GSMaP-NRT, and GSMaP-MVK also represent more detailed spatial characteristics than 3B42RT and 3B42V7 do because IMERG and GSMaP provide precipitation estimates on a finer spatial resolution (0.1°) than TMPA (0.25°). Nevertheless, the GSMaP-GAUGE precipitation map (Figure 2i) appears spatially coarser than other SPPs, because the GSMaP-GAUGE precipitation estimates are bias-adjusted using the CPC Unified Gauge-based Analysis of Global Daily Precipitation data set at a coarse spatial resolution (0.5°).

2.4. Discharge Data

Figure 1 shows that five hydrological stations are situated in the basin. Discharge data at the five stations from 1 January 2014 to 31 December 2016 were obtained from DMH. These data were derived from water level observations using rating curves. The local hydrological stations routinely measure water level at 6:30, 12:30, and 18:30 UTC+06:30 every day. In the flooding season, water level is observed hourly when it reaches 100 cm below the dangerous stage. Thus, the obtained discharge time series vary in time intervals (1 h, 6 h, or 12 h), and the linear interpolation method was used to transform the discharge data into 3-h temporal intervals. These historical discharge data were adopted for calibrating hydrological models and evaluating flood simulation performance.

3. Methodology

Figure 3 shows the designed framework for statistical and hydrological evaluation of GPM-era IMERG and GSMaP SPPs in both near- and post-real-time versions at sub-daily time scales. First, two TRMM-era TMPA (3B42RT and 3B42V7), three IMERG (IMERG-E, IMERG-L, and IMERG-F), and three GSMaP (GSMaP-NRT, GSMaP-MVK, and GSMaP-GAUGE) SPPs from 1 April 2014 to 31 December 2016 were compared against the ground precipitation observations by using several diagnostic indices. Such assessments were statistically conducted at sub-daily time scales (6 h for daytime precipitation and 12 h for night precipitation). Afterward, based on the statistical evaluations of the eight SPPs, the best SPPs in near- and post-real-time versions and the rain-gauge-based precipitation data were used to drive the Grid-based Xinanjiang (GXAJ) hydrological model to perform 3-hourly discharge simulations at the five hydrological stations (Figure 1) from 1 April 2014 to 31 December 2016. Hydrological simulations were performed under two model parameter setup scenarios (rain-gauge-calibrated parameters and SPP-specific recalibrated parameters). Finally, the simulated 3-hourly streamflow time series from the rain-gauge- and SPP-based model runs were evaluated against the observed streamflow with several statistical indicators. The detailed descriptions of statistical indices for precipitation and hydrological assessment, the GXAJ model, and the streamflow simulation schemes under two model parameter setup scenarios are given in the following sub-sections.

3.1. Evaluation Statistics

Several diagnostic indices were used to quantitatively evaluate the quality of eight SPPs versus ground precipitation observations and their feasibility in flood simulations. Pearson correlation coefficient (CC) measures the agreement between simulated and observed data (Equation (1)); in this study, “simulated data” refers to SPPs or simulated discharge, and “observed data” denotes ground precipitation observations or measured discharge. Relative bias (BIAS) indicates the systematic bias of the simulated data (Equation (2)). Root mean square error (RMSE) represents the average absolute error magnitude between the simulated and observed data (Equation (3)). The probability of detection (POD), false alarm ratio (FAR), and critical success index (CSI) were selected to measure the contingency of satellite precipitation estimates. POD denotes the proportion of precipitation events that are correctly detected by satellites among all real precipitation events (Equation (4)). FAR describes the fraction of false events among all the rain events identified by the satellites (Equation (5)). CSI denotes the overall proportion of precipitation events that are correctly identified by the satellites (Equation (6)). Moreover, NSE was adopted to assess the performance of flood simulations (Equation (7)). These diagnostic indices are expressed as follows:
C C = i = 1 n ( X i o X ¯ o ) ( X i s X ¯ s ) i = 1 n ( X i o X ¯ o ) 2 i = 1 n ( X i s X ¯ s ) 2
B I A S = i = 1 n ( X i s X i o ) i = 1 n X i o × 100 %
R M S E = i = 1 n ( X i s X i o ) 2 n
P O D = H H + M
F A R = F H + F
C S I = H H + M + F
N S E = 1 i = 1 n ( X i s X i o ) 2 i = 1 n ( X i o X o ¯ ) 2
where n is the sample size of the simulated and observed data pair; X i s and X i o denote the ith values of the simulated and observed data, respectively; X ¯ s and X ¯ o are the mean values of the simulated and observed data, respectively; H represents the number of real rain events correctly identified by the satellites; M denotes the number of real precipitation events that satellites failed to detect; and F is the number of precipitation events that satellites detected but did not actually occur. In addition, two diagnostic indices (BIASp and PTE) were specifically adopted to measure the accuracy of the simulated flood peaks in major historical flood events. BIASp represents the relative bias between the simulated and observed flood peak flows and is given by
B I A S p = Q p s Q p o Q p o × 100 %
where Q p s and Q p o are the simulated and measured flood peak flows, respectively. PTE indicates the flood peak time error and is expressed by
P T E = T s T o
where T s and T o are the simulated and measured flood peak time, respectively. A negative PTE denotes that the simulated peak flow is ahead of the measured peak flow, and a positive value represents that the simulated peak flow appears behind the observed.

3.2. Grid-Based Xinanjiang Hydrological Model

The GXAJ model is a spatially distributed conceptual hydrological model [66] developed from the lumped Xinanjiang (XAJ) model [67]. On a grid cell basis, the GXAJ model uses the saturation excess runoff scheme of the lumped XAJ model for runoff calculation [67]. At the permeable part of a grid cell, runoff generation occurs when soil tension water storage reaches its capacity value. In the impervious region of a grid cell, direct runoff is produced when precipitation exceeds open-water evaporation. The evapotranspiration (ET) parameterization scheme of GXAJ is presented as a three-soil-layer model. In the upper soil layer, actual ET occurs at the potential ET rate (PE). After the exhaustion of soil tension water in the upper layer, ET proceeds to the lower layer at a decreased rate that is proportional to the tension water storage in that layer. When the total ET in the upper and lower layers is less than a pre-set threshold, denoted as a fraction of PE, ET further proceeds to the deep layer to maintain this pre-set minimum value. GXAJ employs a gravitational water reservoir with bottom and side outlets to divide the computed total runoff into surface, interflow, and groundwater runoffs and adopts three linear reservoirs to simulate the hillslope concentration processes of the three runoff components in each grid cell. The Muskingum routing method is used to represent the routing effect of the river channel system that connects each grid cell. The GXAJ model uses gridded precipitation and PE as its forcing inputs. The daily minimum and maximum air temperature data are used to calculate the daily PE through the air-temperature-based Hargreaves method [68], and a sinusoidal function is adopted to disaggregate the daily PE into PE values at sub-daily temporal scales. The GXAJ model has a total of 15 parameters, including 8 parameters for ET and runoff calculations and 7 for hillslope runoff concentration and streamflow routing. Several model parameters are very sensitive and need to be calibrated. For instance, the coefficient of PE (K) predominately controls the simulated total runoff. The product of K and PE calculated using the air-temperature-based Hargreaves method [68] represents the corrected PE input for the hydrological model. A large K value gives a high PE value, tends to generate high actual ET, and hence produces a low total runoff and vice versa. The areal mean free water storage capacity (SM) represents the depth of the gravitational water reservoir and largely regulates the magnitude of high flow. A low SM usually partitions a large proportion of overland flow from the computed total runoff and generates high flood peak flows. The recession constants of surface, interflow and groundwater runoffs (CS, CI, and CG) regulate the recession rate of each runoff component. Low values of CS, CI, and CG may accelerate runoff recession and augment high flows to a certain extent. For the detailed description of the GXAJ model parameters and their suggested physical values, please refer to Zhao [67].

3.3. Discharge Simulations Using Multiple Precipitation Data Sets under Two Model Setup Scenarios

Based on the findings of statistical evaluations of multiple SPPs against the ground precipitation observations, the comparatively better SPPs in near- and post-real-time versions were selected to drive the GXAJ model for 3-hourly streamflow simulations. The hydrological performance of these SPPs was evaluated according to two model setup scenarios.
Scenario I: Discharge simulations with rain-gauge-calibrated parameters. The GXAJ model parameters were calibrated using the rain-gauge-based precipitation data. Then, the GXAJ model was replaced by different SPPs to execute discharge simulations using the rain-gauge-calibrated model parameters. This method was widely applied to hydrological simulations over gauged basins [19].
Scenario II: Discharge simulations with SPP-specific parameters. The GXAJ model parameters were recalibrated using different SPPs, and the model with the SPP-specific parameters were used to perform streamflow simulations. This approach is an alternative for hydrological modeling in ungauged basins, wherein only SPPs are available [19].
The calibration period in this study was from 1 April 2014 to 31 December 2015, and the validation period was from 1 January 2016 to 31 December 2016. The watershed was divided into five computational blocks (sub-basins) according to the drainage area controlled by the five hydrological stations. The GXAJ model parameters in each computational block were calibrated using the shuffled complex evolution (SCE-UA) automatic optimization method [69,70]. At all grid cells with each sub-basin, the parameter values are defined to be spatially uniform. Maximum NSE was used as the objective function for hydrological model optimization. Given that this objective function tends to provide high importance to high flows, the optimized hydrological model may not accurately simulate low-flow processes. Yuan et al. [47] suggested the use of the maximum sum of NSE and log-transformed NSE as the objective function and found that the optimized GXAJ model can comprehensively characterize high- and low-flow processes in the Chindwin River basin. However, this method tends to sacrifice the accuracy of high-flow simulations to some degree. The maximum of NSE was still used as the objective function, because the present study focused on flood simulations. Finally, the simulated 3-hourly discharge time series using different precipitation inputs under each simulation scenario were compared with the observations to assess the hydrologic utility of multiple SPPs in the study area.
Although the SCE-UA algorithm has been proved to be effective, consistent, and efficient in retrieving the parameter values of a hydrologic model with a given objective function, it has a critical deficiency in population degeneration, which assumes that the global optimum is located in a linearly operated subspace of the parameter space [71]. As a result, this assumption is likely to cause the situation where SCE-UA misses the global optimum or misconverges. To locate a hydrological parameter set that best possibly approximates the global optimum, 20 independently initialized runs of the SCE-UA optimizations were executed. For each run, optimization was terminated when iteration reached 10,000 times or population converged within 0.1% of the parameter space. Finally, the parameter set in the optimization run with the highest objective function value was adopted for discharge simulation.

4. Results

4.1. Statistical Assessment of Multiple SPPs

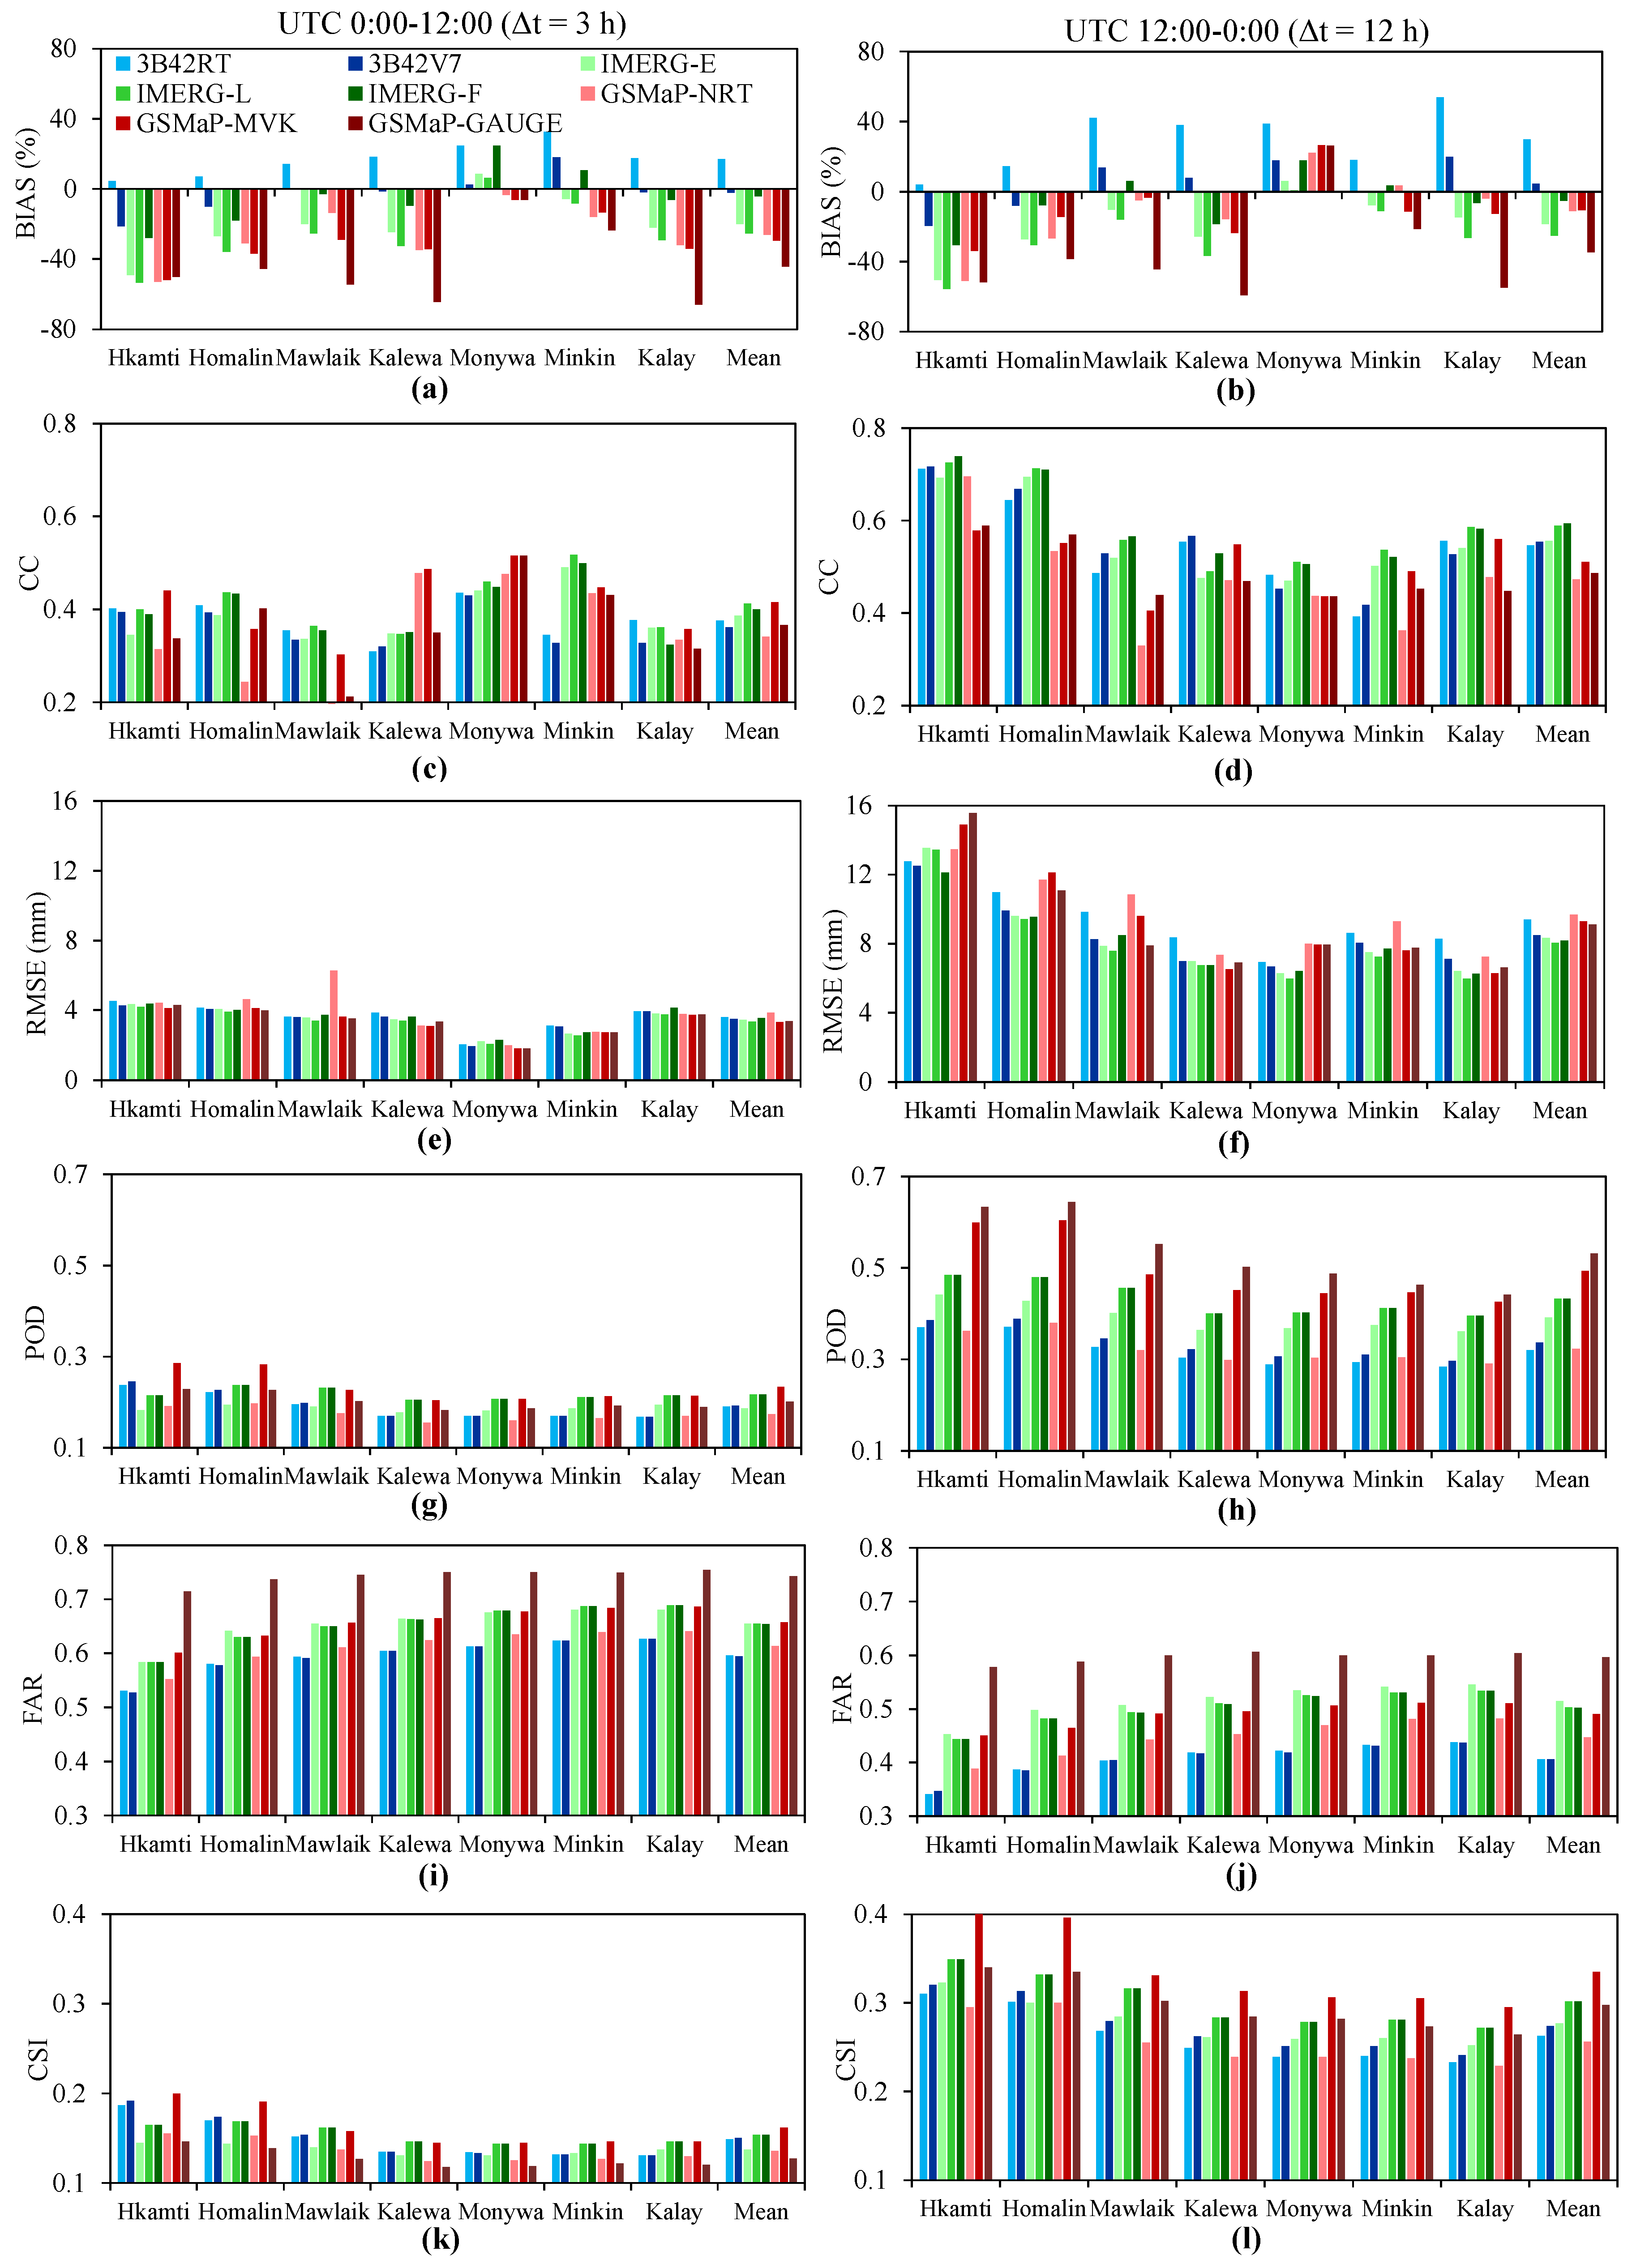
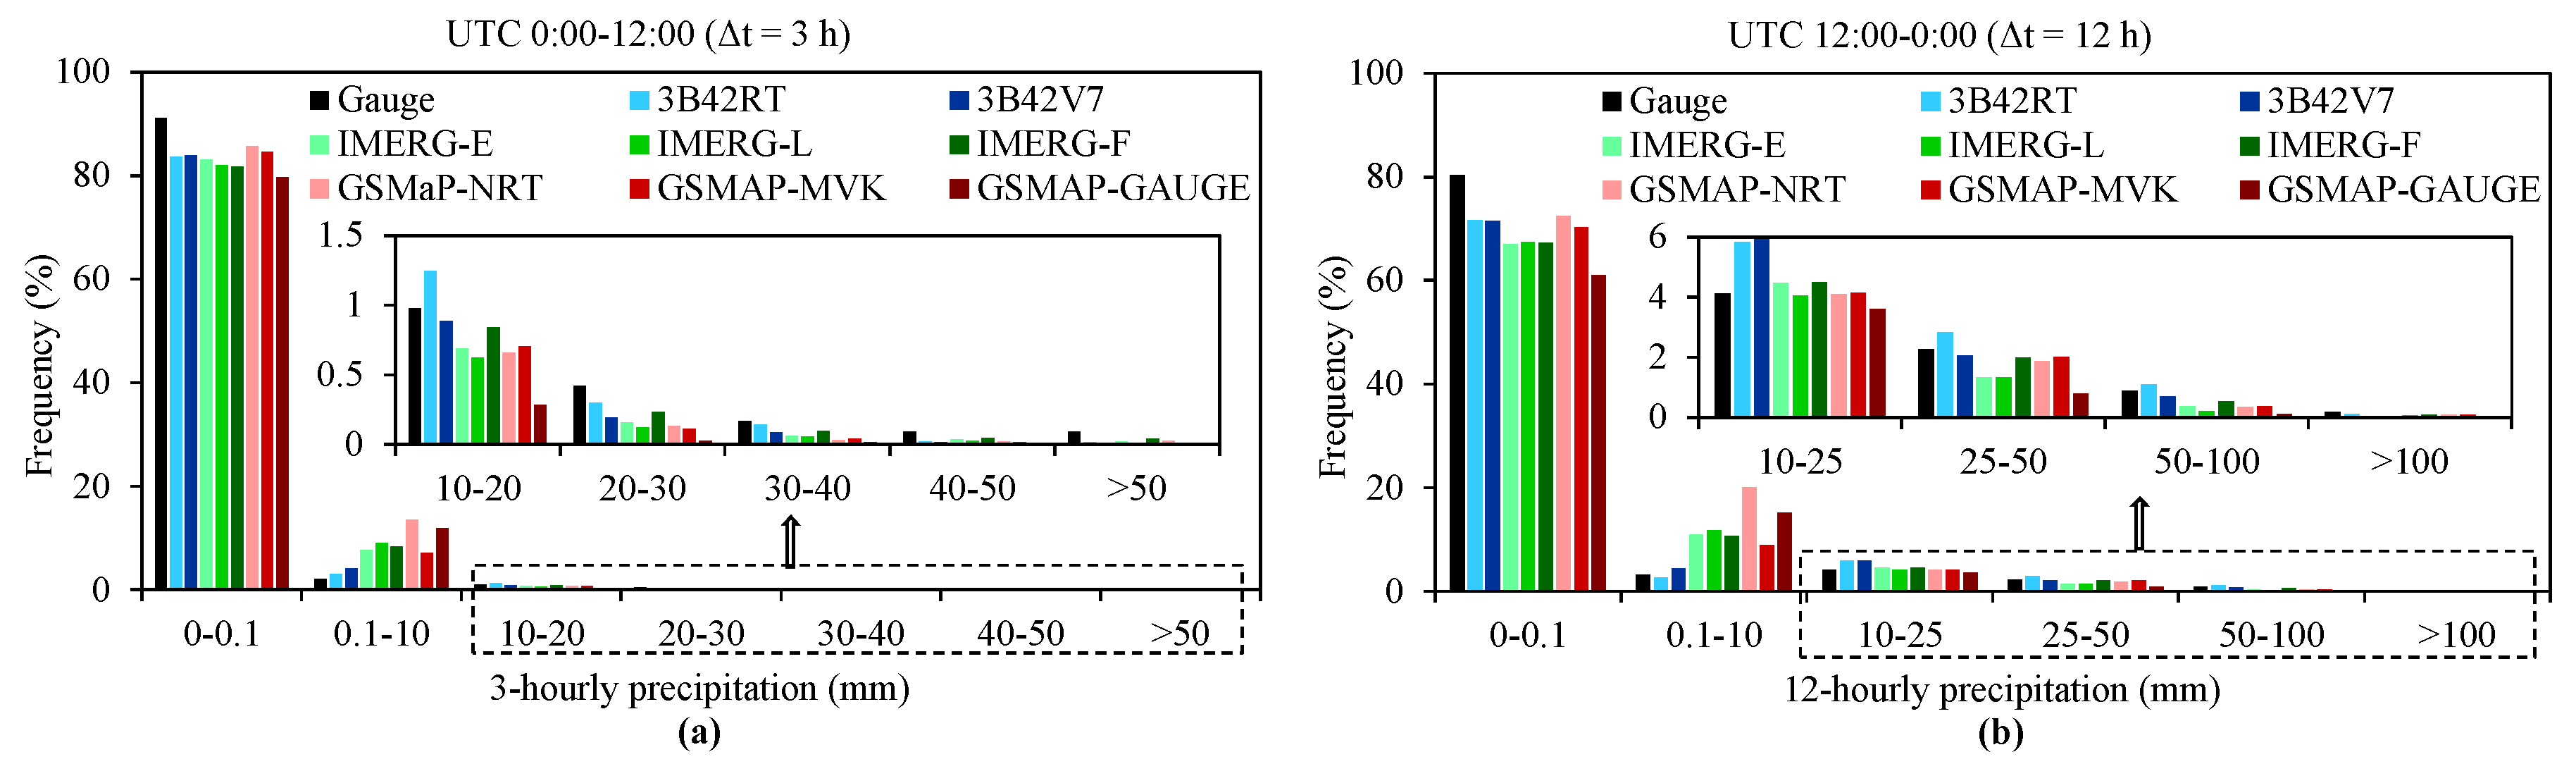
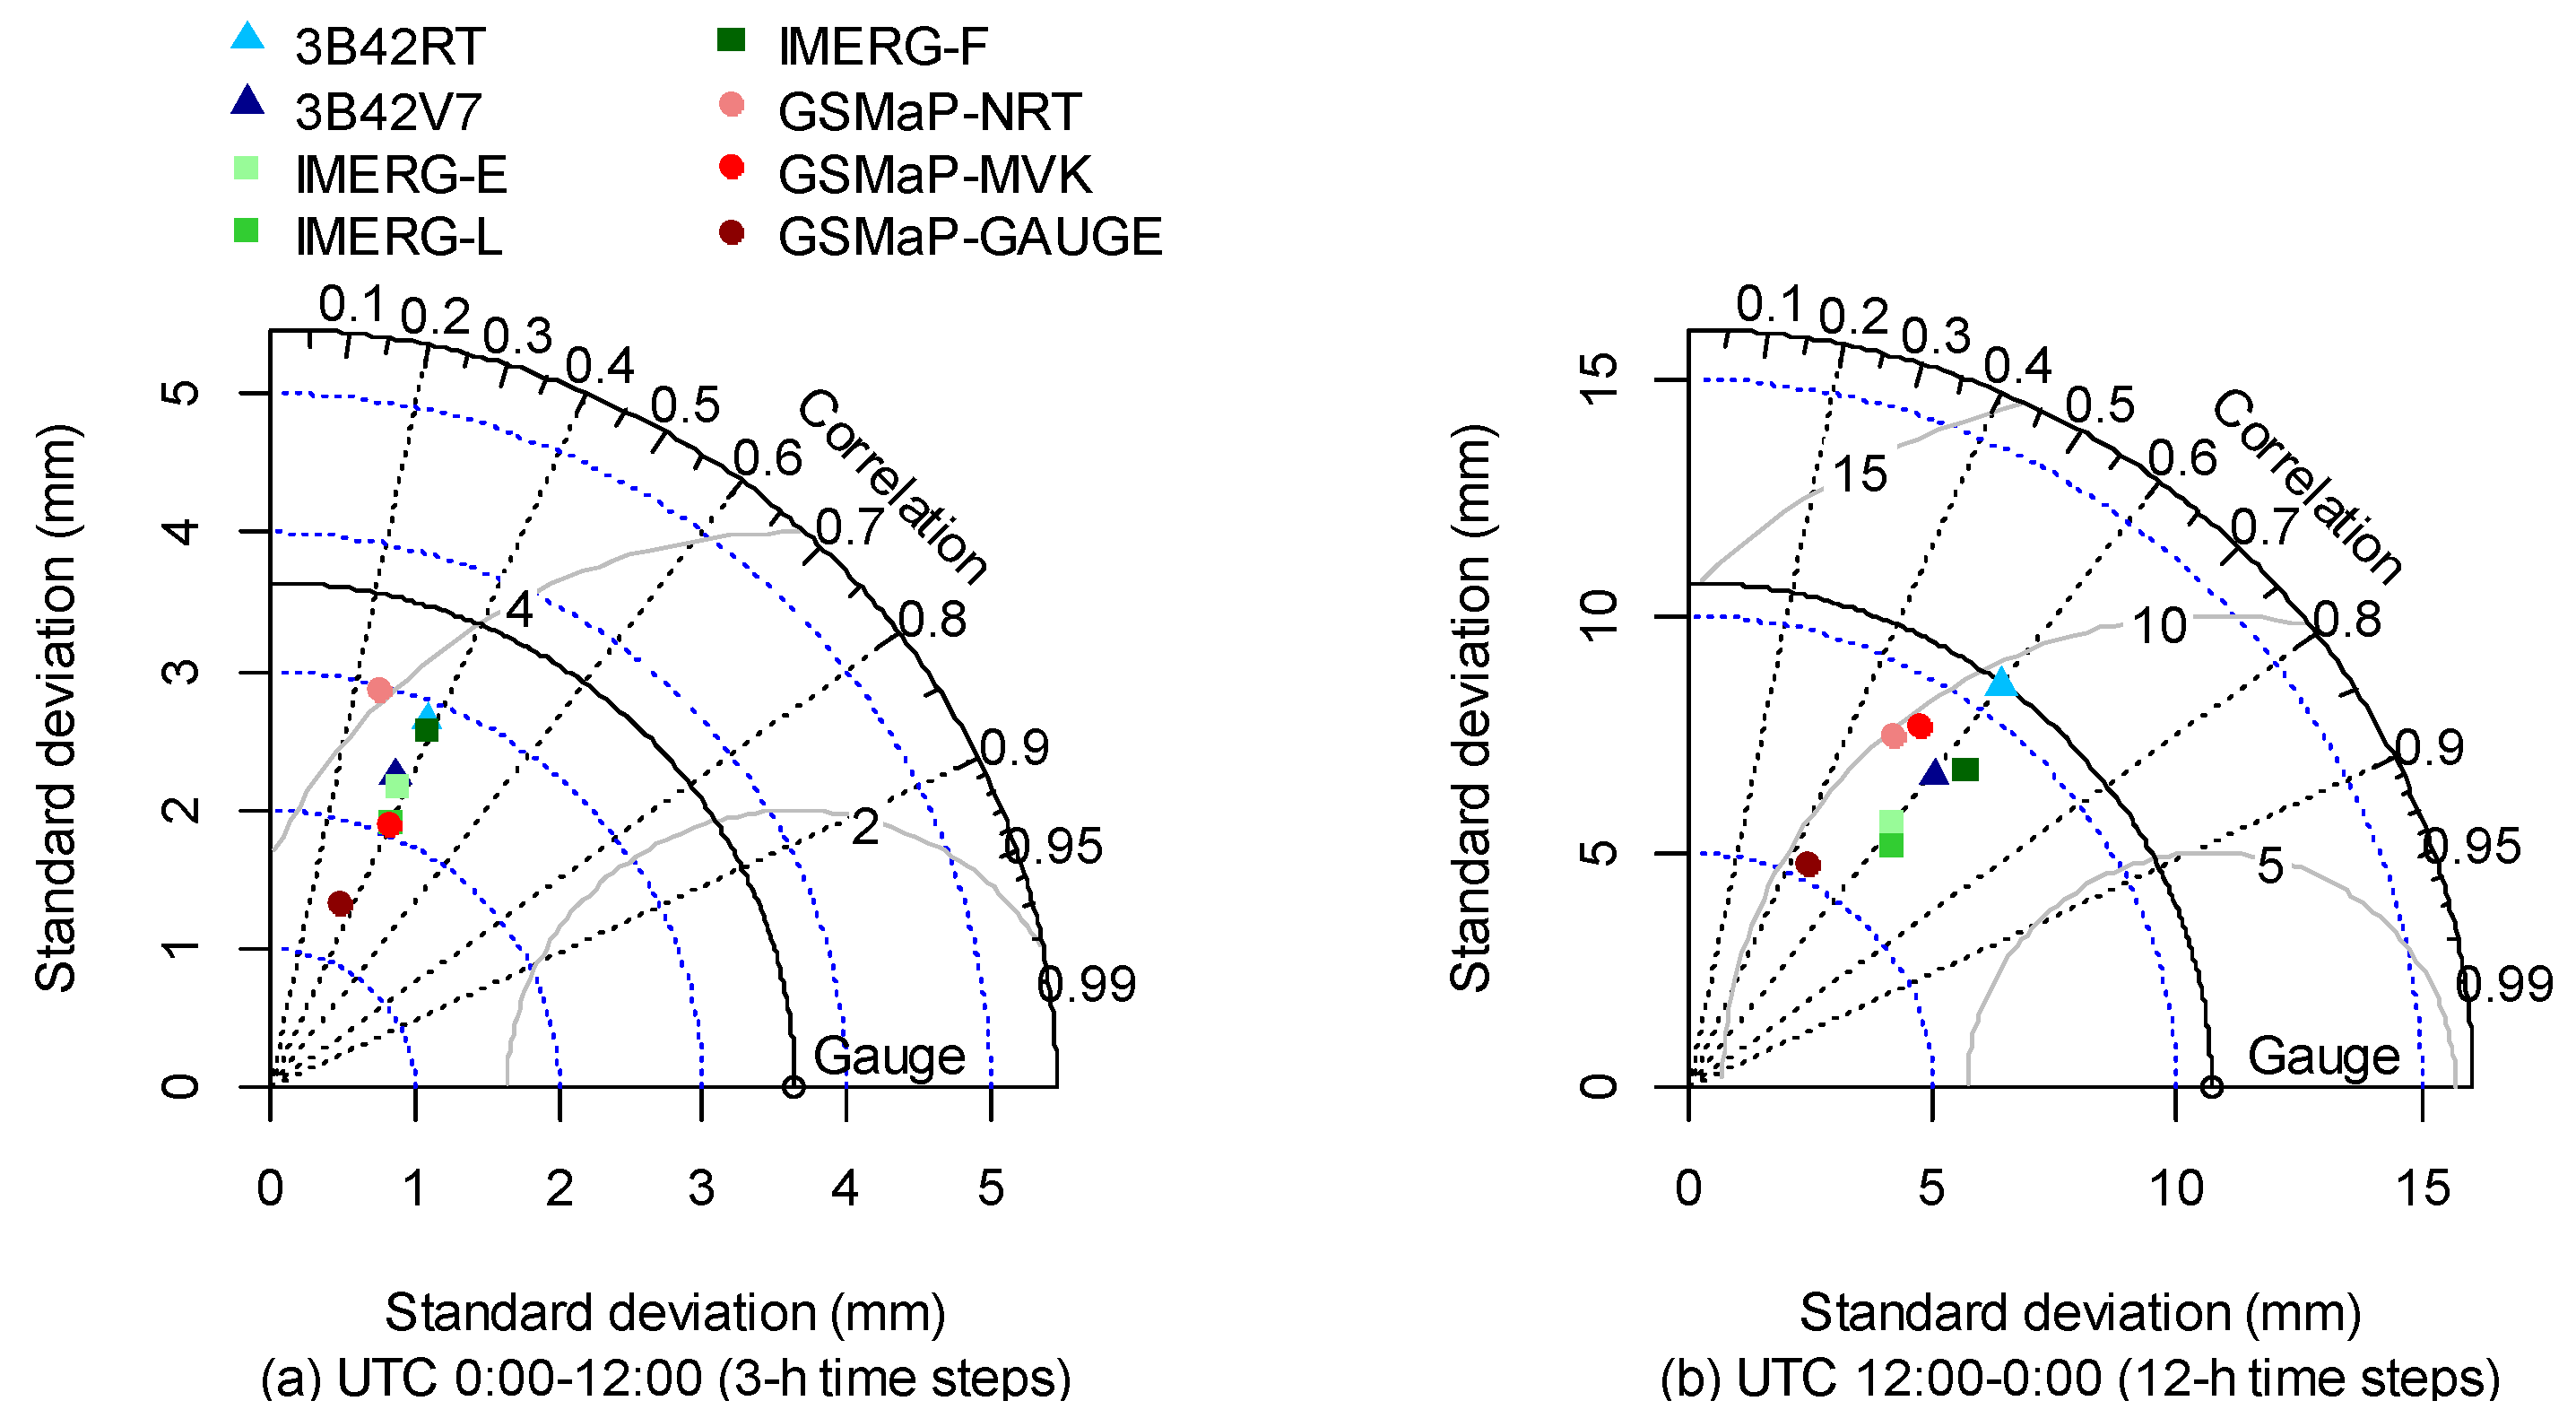
4.1.1. Precipitation at Gauge-Located Grid Cells

Figure 4a,b demonstrates that 3B42RT overestimates precipitation in daytime and nighttime at all seven rain gauges, with mean BIAS values of 16.9% and 29.9%, respectively. 3B42V7 effectively reduces the systematic errors of 3B42RT at most rain gauges with bias-correction using the GPCC monthly gauge-analysis precipitation data set and with mean BIAS values of −2% and 4.5% for daytime and nighttime, respectively. The two near-real-time IMERG SPPs (IMERG-E and IMERG-L) largely underestimate daytime and nighttime precipitation at six out of the seven gauges. Bias-adjustment with the GPCC precipitation data set shows that the post-real-time product IMERG-F averagely reduces the systematic errors to −4.2% and −5.1% for daytime and nighttime precipitation, respectively. All three GSMaP SPPs tend to underestimate precipitation at most rain gauges. Although the post-real-time product GSMaP-GAUGE was calibrated with the CPC precipitation data, it significantly underestimates daytime and nighttime precipitation by 44.3% and 43.8% on average, with higher magnitudes of underestimation than those by GSMaP-NRT and GSMaP-MVK.
Figure 4c,d show that the CC values of the 3-hourly daytime precipitation estimates from all eight SPPs are generally lower than those of the 12-hourly nighttime precipitation retrievals. The three IMERG SPPs obtain slightly higher CC values than their predecessor—that is, TMPA products—at most rain gauges. The averaged CCs for the 3-hourly daytime precipitation estimates from IMERG-E, IMERG-L, and IMERG-F are 0.387, 0.412, and 0.400, respectively, while those for 3B42RT and 3B42V7 are 0.376 and 0.361, respectively. In the case of the 12-hourly nighttime precipitation retrievals, the mean CCs increase to 0.556, 0.588, and 0.593 for IMERG-E, IMERG-L, and IMERG-F, respectively, and those for 3B42RT and 3B42V7 are 0.547 and 0.554, respectively. GSMaP-MVK has the highest averaged CC (0.416) for daytime precipitation estimation, but the CC values of GSMaP-NRT and GSMaP-GAUGE are relatively low (0.341 and 0.367, respectively). On average, all three GSMaP-based 12-hourly nighttime precipitation time series are in poorer correlations with the ground observations than TMPA and IMERG, which have mean CC values of 0.472, 0.510, and 0.486 for GSMaP-NRT, GSMaP-MVK, and GSMaP-GAUGE, respectively.
Concerning the absolute errors of satellite precipitation estimates, GSMaP-NRT has the highest RMSEs among all the near-real-time products for both time slots, with mean RMSE values of 3.9 mm in the daytime and 9.7 mm in the nighttime, whereas IMERG-L provides the lowest averaged RMSEs (3.3 and 8.0 mm in the daytime and nighttime, respectively) (Figure 4e,f). For the four post-real-time SPPs, IMERG-F obtains a slightly higher averaged RMSE (3.6 mm) than do 3B42V7 (3.5 mm), GSMaP-MVK (3.3 mm), and GSMaP-GAUGE (3.4 mm) for the 3-hourly daytime precipitation estimations. However, the averaged RMSE values in the nighttime precipitation retrievals from GSMaP-MVK and GSMaP-GAUGE (9.3 and 9.1 mm, respectively) are higher than those from 3B42V7 (8.5 mm) and IMERG-F (8.2 mm).
With respect to the contingency of SPPs, the POD values are lower at all the weather stations on the 3-h temporal scale in daytime than those on the 12-h scale in nighttime (Figure 4g,h). Among all the near-real-time products, IMERG-L obtains the highest PODs (averaged PODs = 0.217 and 0.433) for daytime and nighttime precipitation estimates, and the lowest PODs exist in the GSMaP-NRT daytime precipitation estimates (0.173) and the 3B42RT nighttime precipitation retrievals (0.320). For the post-real-time products, the highest averaged POD values are found in GSMaP-MVK (0.233) in daytime and GSMaP-GAUGE (0.532) in nighttime, and 3B42V7 provides the lowest detection probabilities (0.192 and 0.336) in both time slots. Figure 4i,j denote that GSMaP-GAUGE has the highest false alarm ratios among all SPPs, with mean FAR values of 0.743 and 0.597 in daytime and nighttime, respectively. By contrast, the averaged FARs found in 3B42RT and 3B42V7 are the lowest, reaching, on average, 0.596 and 0.595 in daytime and 0.406 and 0.406 in the nighttime. In addition, GSMaP-MVK obtains the highest CSIs in both time slots (0.162 and 0.335 on average) among all eight SPPs, whereas GSMaP-GAUGE and GSMaP-NRT provide the lowest values for the daytime precipitation estimates (0.127) and nighttime precipitation (0.256), respectively (Figure 4k,i).
Figure 5 compares the histograms of the eight SPPs at the locations of the seven stations in the Chindwin River basin according to the ground observations for daytime and nighttime slots. Figure 5a shows that approximately 91.1% of the observed 3-hourly daytime precipitation data samples are under 0.1 mm, and all SPPs underestimate this frequency by 6.5–10.4%. All SPPs present an overestimation for 3-hourly daytime precipitation ranging from 0.1 mm to 10 mm. In particular, GSMaP-NRT and GSMaP-GAUGE provide evident overestimations of 11.3% and 9.8%, respectively, and 3B42RT and 3B42V7 are in slight overestimations of 1.0% and 2.1%, respectively. Nearly all products underestimate the occurrence frequency of daytime precipitation between 10 and 20 mm, except for 3B42RT with a mild overestimation of 0.2%. In addition, Figure 5a illustrates that an underestimation of 3-hourly daytime precipitation that exceeds 20 mm is found in all SPPs. All these observations indicate that the eight SPPs in this study tend to underestimate the occurrence frequencies of non-rain and heavy rain events and overestimate light and moderate rain events. A similar finding is also indicated in the 12-hourly satellite nighttime precipitation estimates (Figure 5b).
Taylor diagrams were likewise plotted to visualize the concise statistical summary on how well each SPP agrees with the ground precipitation observations in the Chindwin River basin (Figure 6). Figure 6a indicates that among all the near-real-time products, GSMaP-NRT is most inferior in capturing daytime precipitation dynamics, whereas 3B42RT presents the best overall performance, followed by IMERG-L and IMERG-E. Concerning the accuracy of the four post-real-time products in retrieving daytime precipitation, IMERG-F demonstrates the best performance, which is slightly superior to 3B42V7. GSMaP-MVK is ranked third, and GSMaP-GAUGE is inferior due to its low relative mean squared deviation and CC (Figure 6a). The overall performance of the eight SPPs in retrieving nighttime precipitation is similar to the situation of the daytime precipitation estimates (Figure 6b).

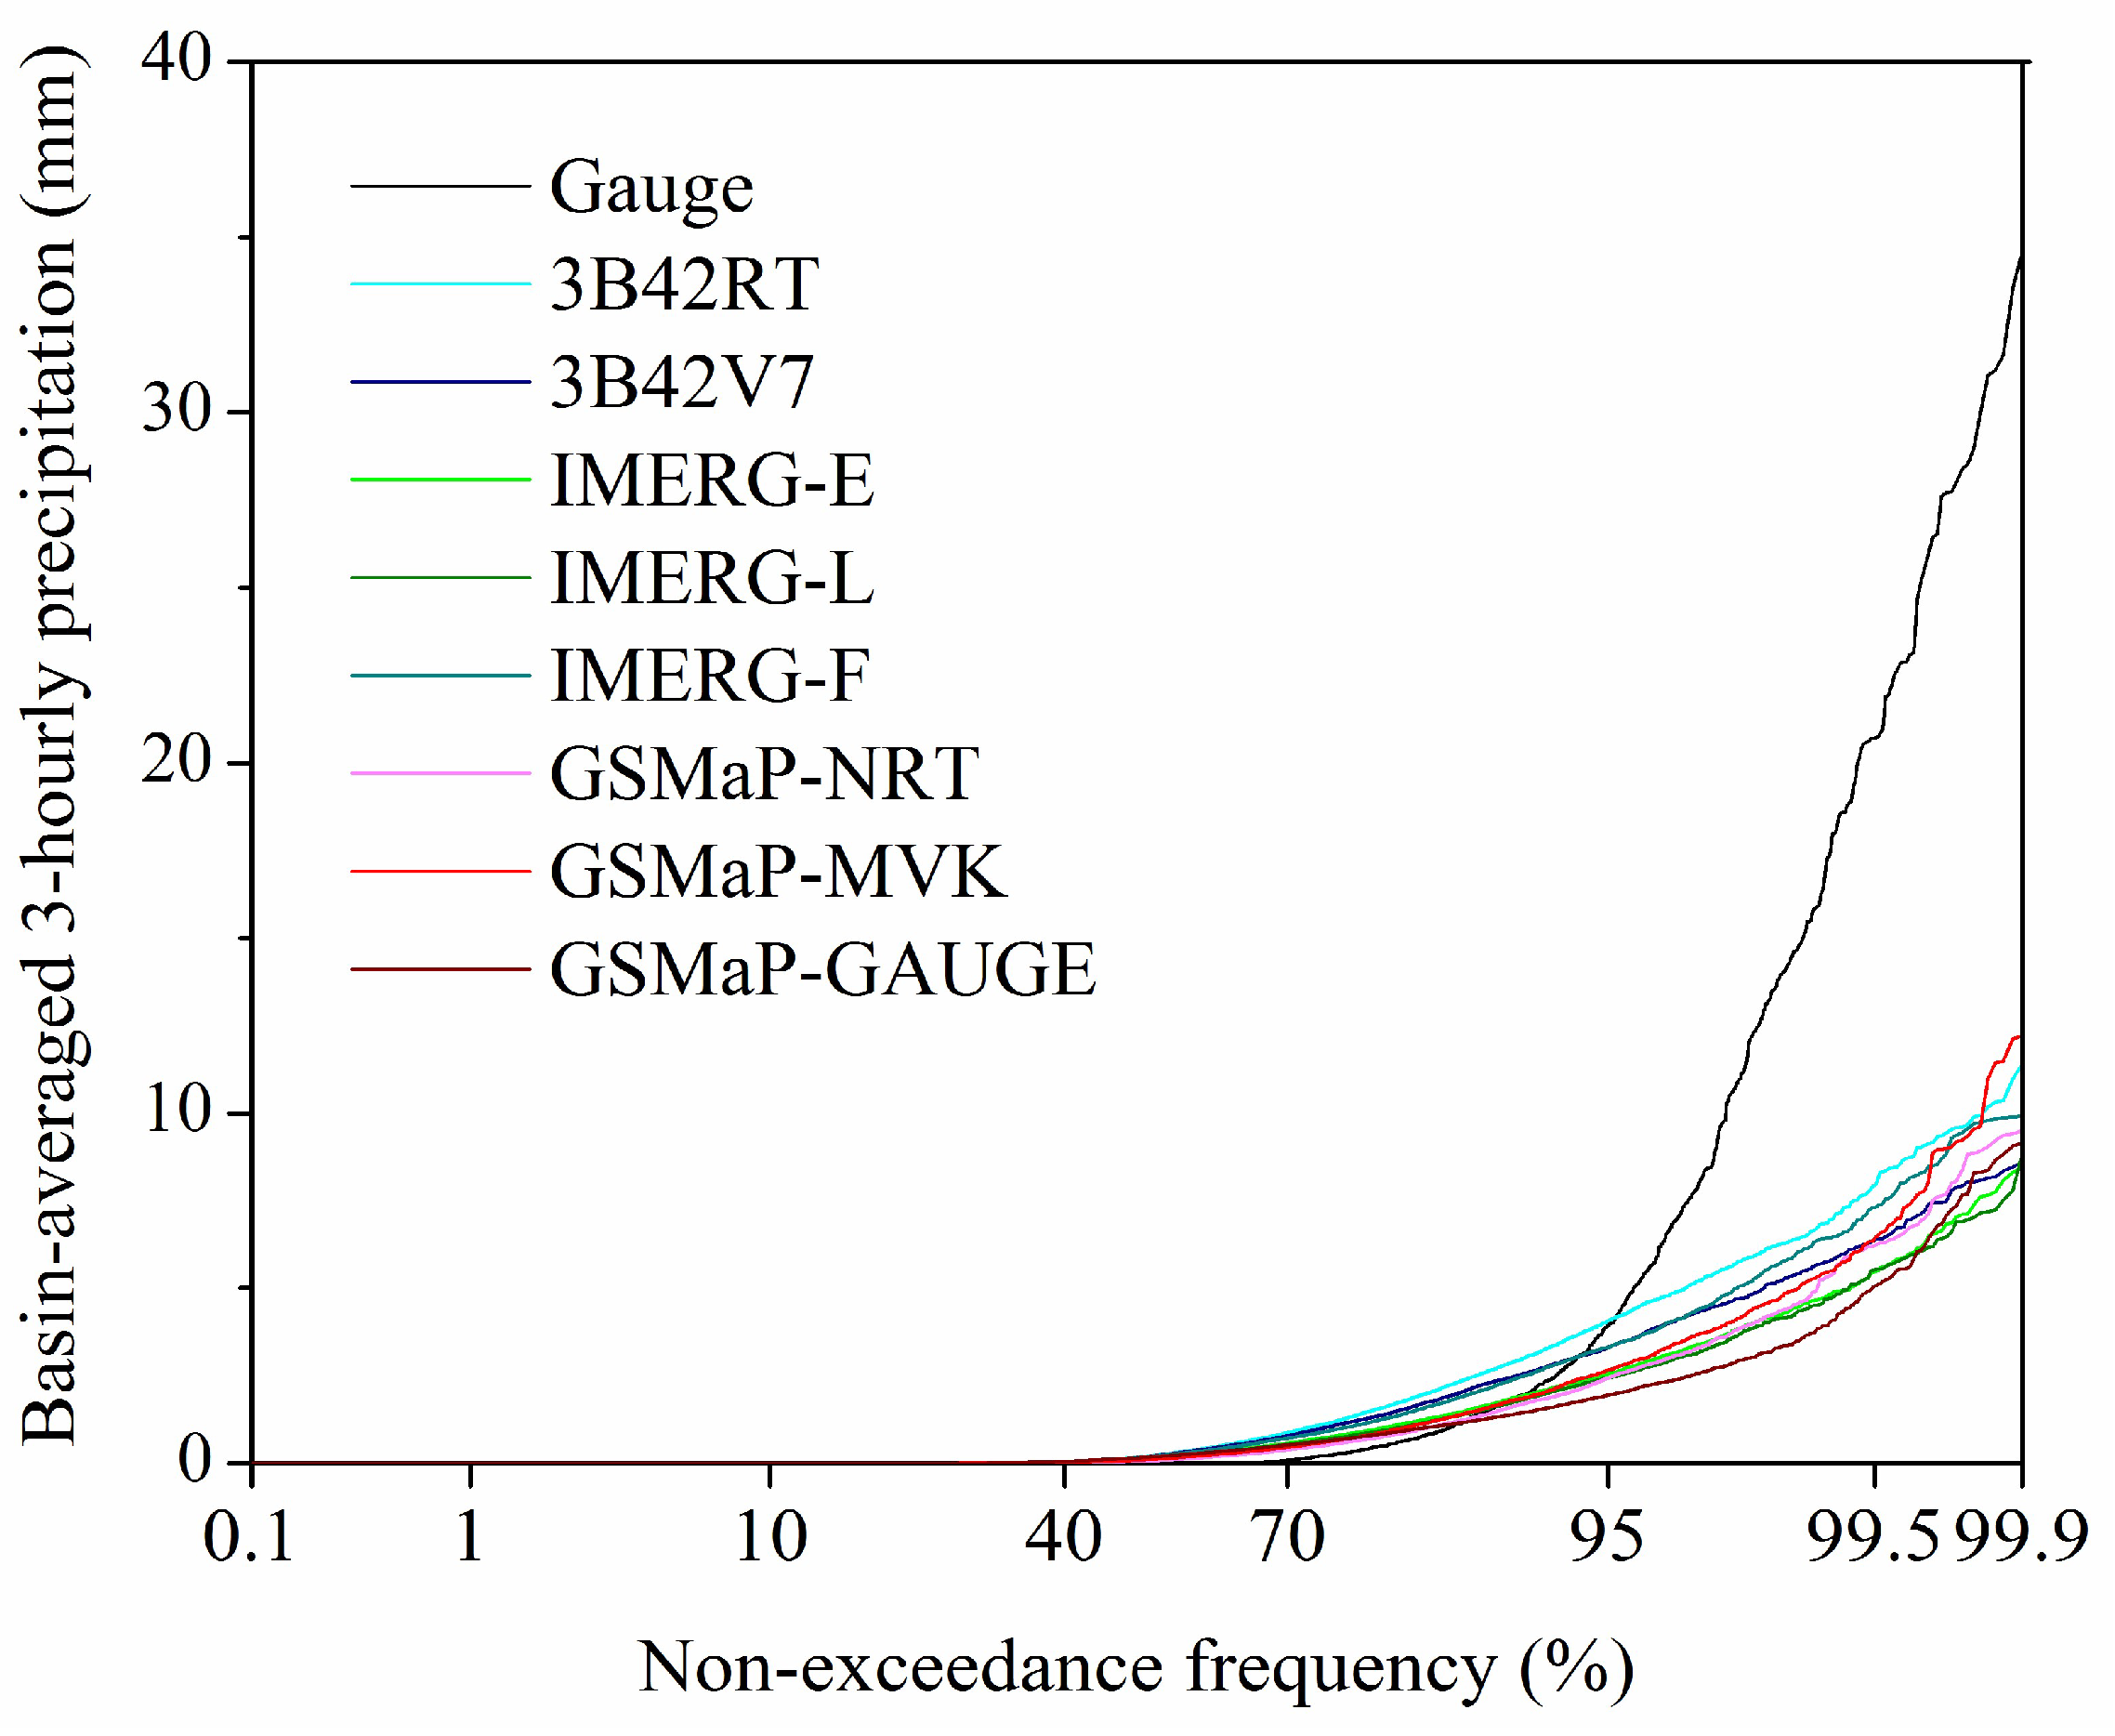
4.1.2. Watershed-Averaged Precipitation

The watershed-averaged 3-hourly precipitation estimates from the eight SPPs were evaluated in contrast with the gauge-based time series. Table 1 shows that 3B42RT moderately overestimates the watershed-averaged precipitation by 11.1%, and 3B42V7 presents a minor underestimation of 4.8%. All three IMERG SPPs systematically underestimate the basin-averaged precipitation with BIAS values of −27.0%, −30.6%, and −6.8% for IMERG-E, IMERG-L, and IMERG-F, respectively, and IMERG-F demonstrates a slight underestimation. A significant underestimation of 28.7–39.0% was found in the three GSMaP SPPs. Table 1 also displays that TMPA and IMERG SPPs are in a higher correlation with the gauge-based watershed-averaged precipitation time series than GSMaP SPPs. IMERG-E has the highest CC (0.323) among all the near-real-time products, and IMERG-F presents the highest CC value (0.330) among the four post-real-time data sets. The absolute errors of all SPPs have similar RMSE magnitudes, ranging from 2.9 mm to 3.1 mm. Overall, 3B42RT has the best performance in retrieving the basin-averaged precipitation among the four near-real-time products, followed by IMERG-E and IMERG-L, whereas GSMaP-NRT presents the most unsatisfactory performance. Regarding the post-real-time SPPs, IMERG-F demonstrates the best performance, slightly better than 3B42V7. GSMaP-GAUGE demonstrates inferior quality.
In addition, the non-exceedance frequency distributions of the basin-averaged precipitation estimates from the eight SPPs were compared with those of the gauge-based data set on 3-h temporal scales. Figure 7 shows that all SPPs significantly underestimate the basin-averaged precipitation at the high quantile levels (≥87.2–95.3%) and clearly overestimate the intermediate precipitation quantiles at the levels of 45.6–87.2%. The reason is that all SPPs at the grid scale tend to overestimate the occurrence frequency of light and moderate rain events and largely underestimate the frequency of heavy rain events (Figure 5). This satellite-derived basin-averaged precipitation estimate feature would likely greatly influence the discharge simulations, particularly high-flow simulations, when these SPPs are adopted as the forcings of a hydrological model.

4.2. Assessment of Discharge Simulations Using Multiple SPPs

The aforementioned statistical evaluation of multiple SPPs against the ground precipitation data shows that 3B42RT presents the best overall quality among all near-real-time products, and IMERG-F and 3B42V7 demonstrate a relatively higher accuracy than the other two post-real-time products. Therefore, 3B42RT, IMERG-F, 3B42V7, and the gauge-based gridded precipitation data set were adopted to drive the GXAJ hydrological model for 3-hourly discharge simulations from 1 April 2014 to 31 December 2016 at the five hydrological stations in the Chindwin River basin. Hydrological simulations were performed under two scenarios: discharge simulations with rain-gauge-calibrated parameters and discharge simulations with satellite-product-specific parameters (detailed description in Section 3.3). The results under these simulation scenarios are discussed in the following subsections.

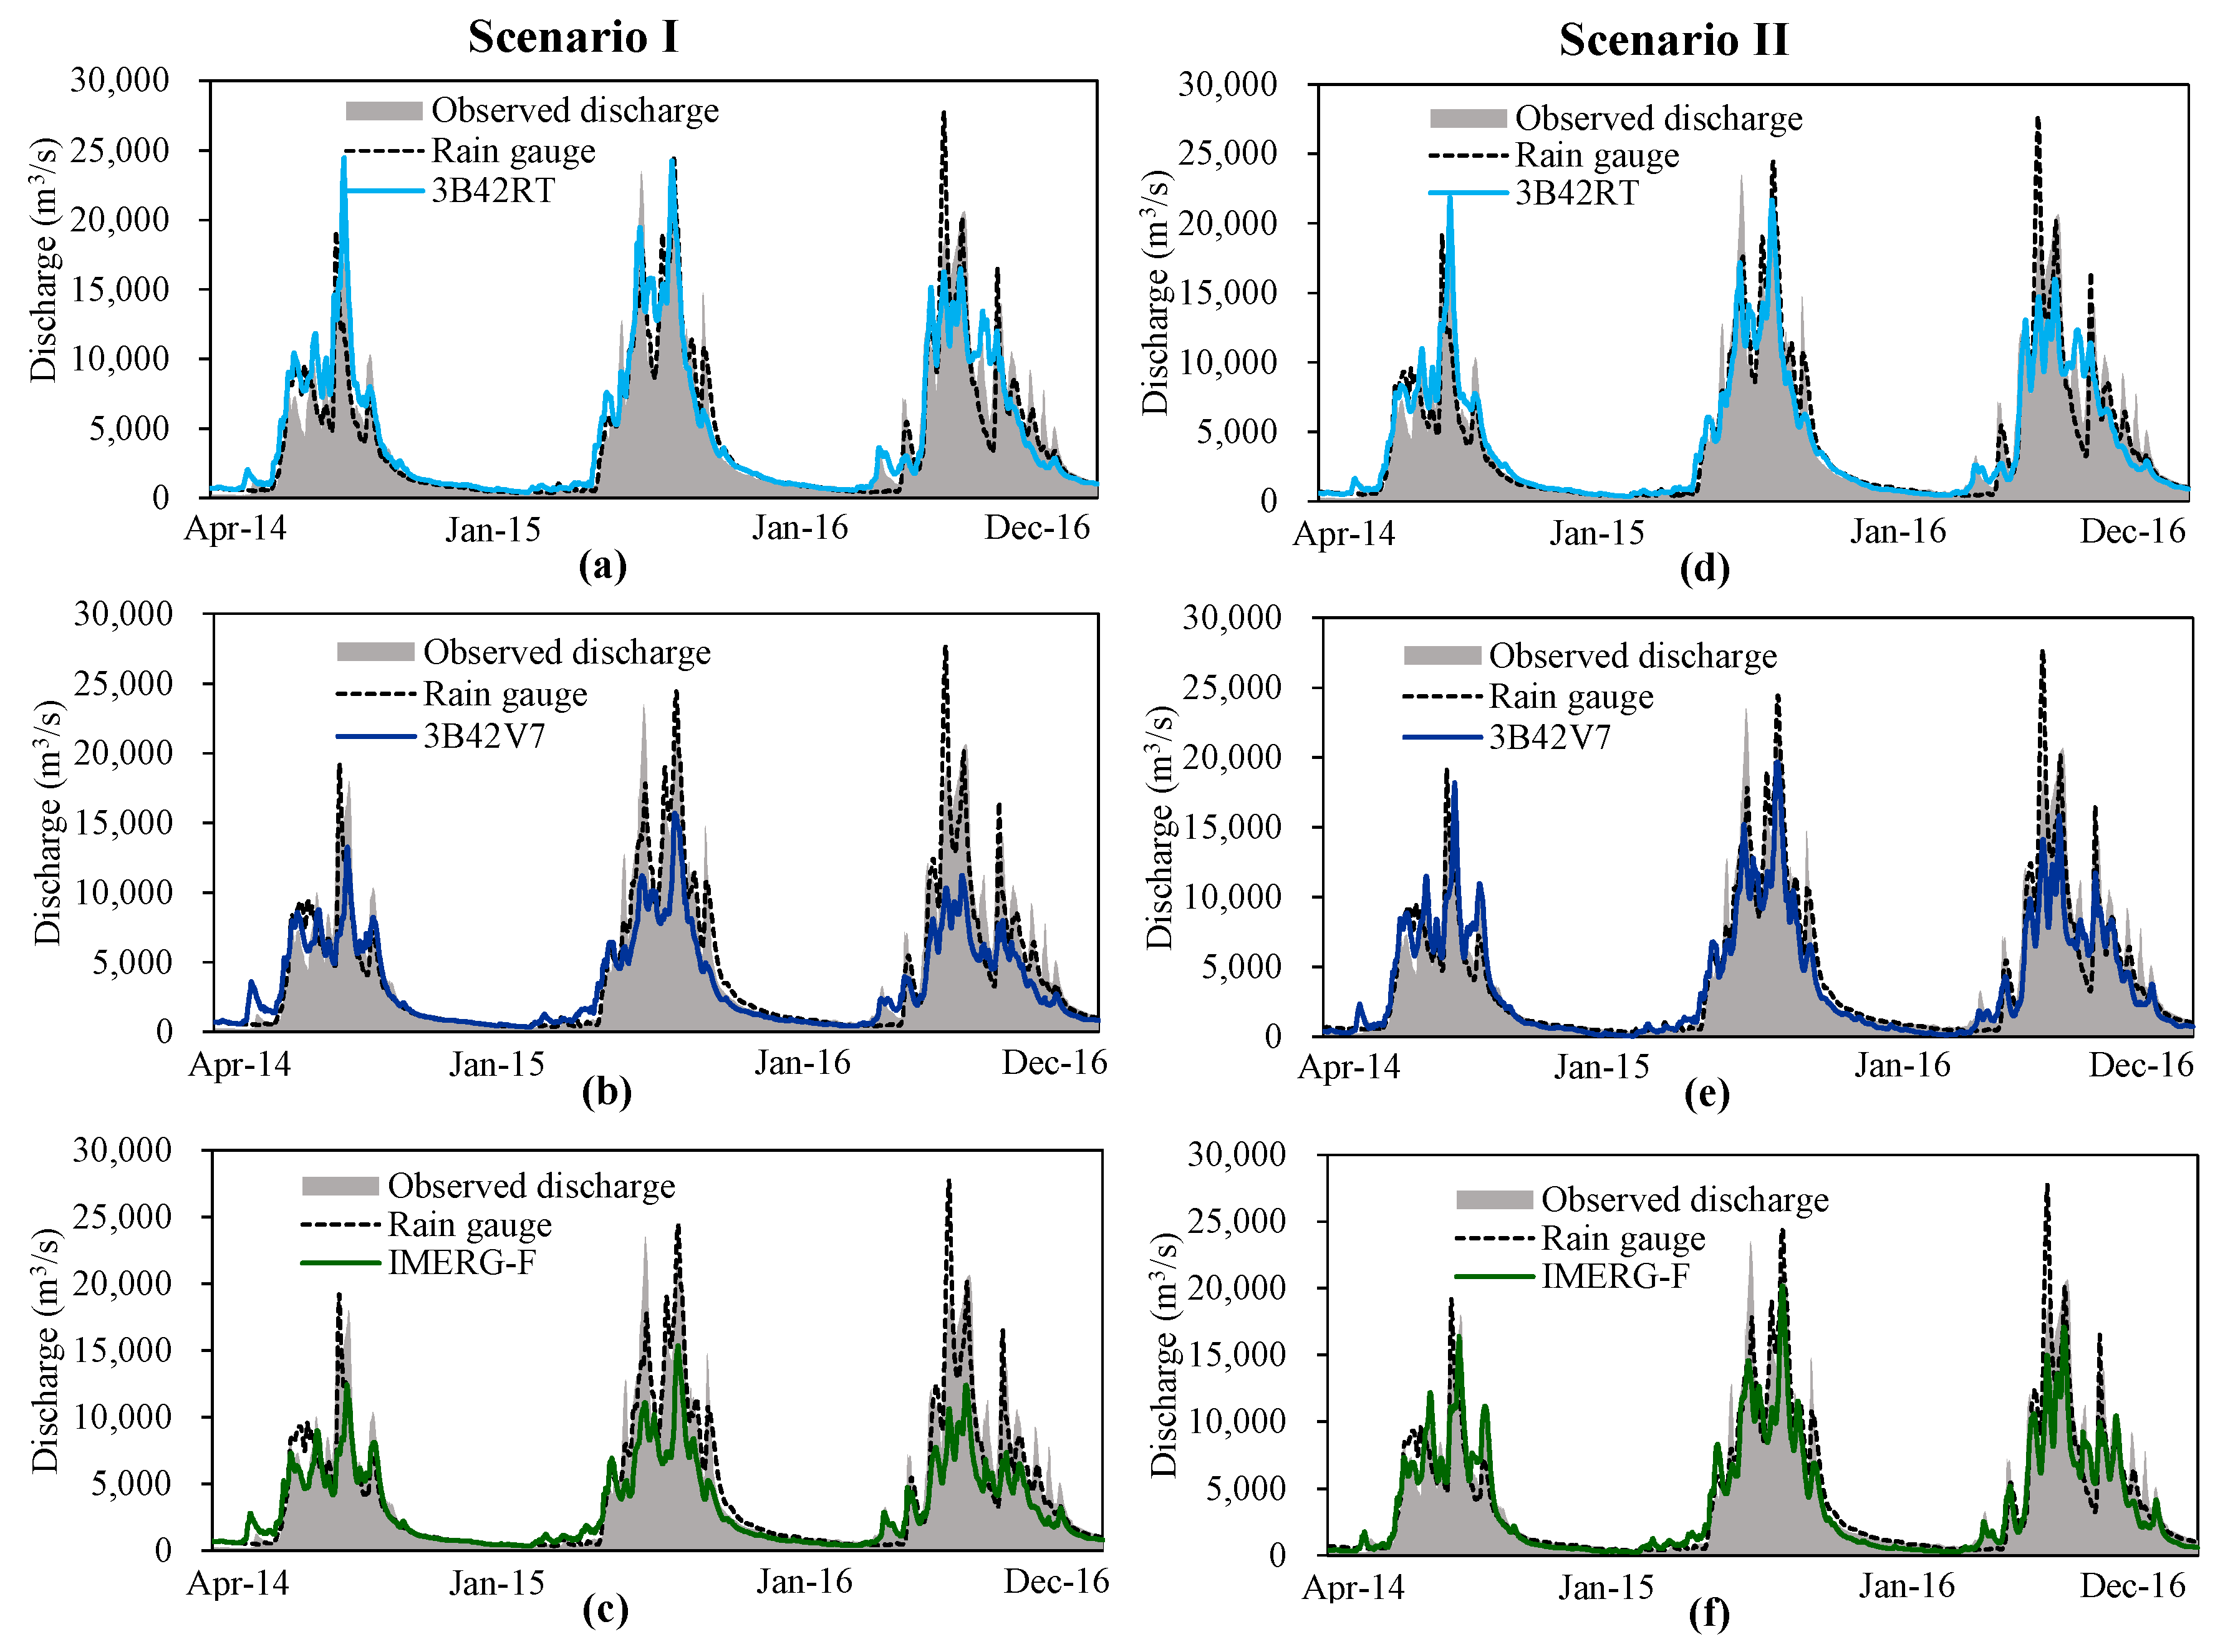
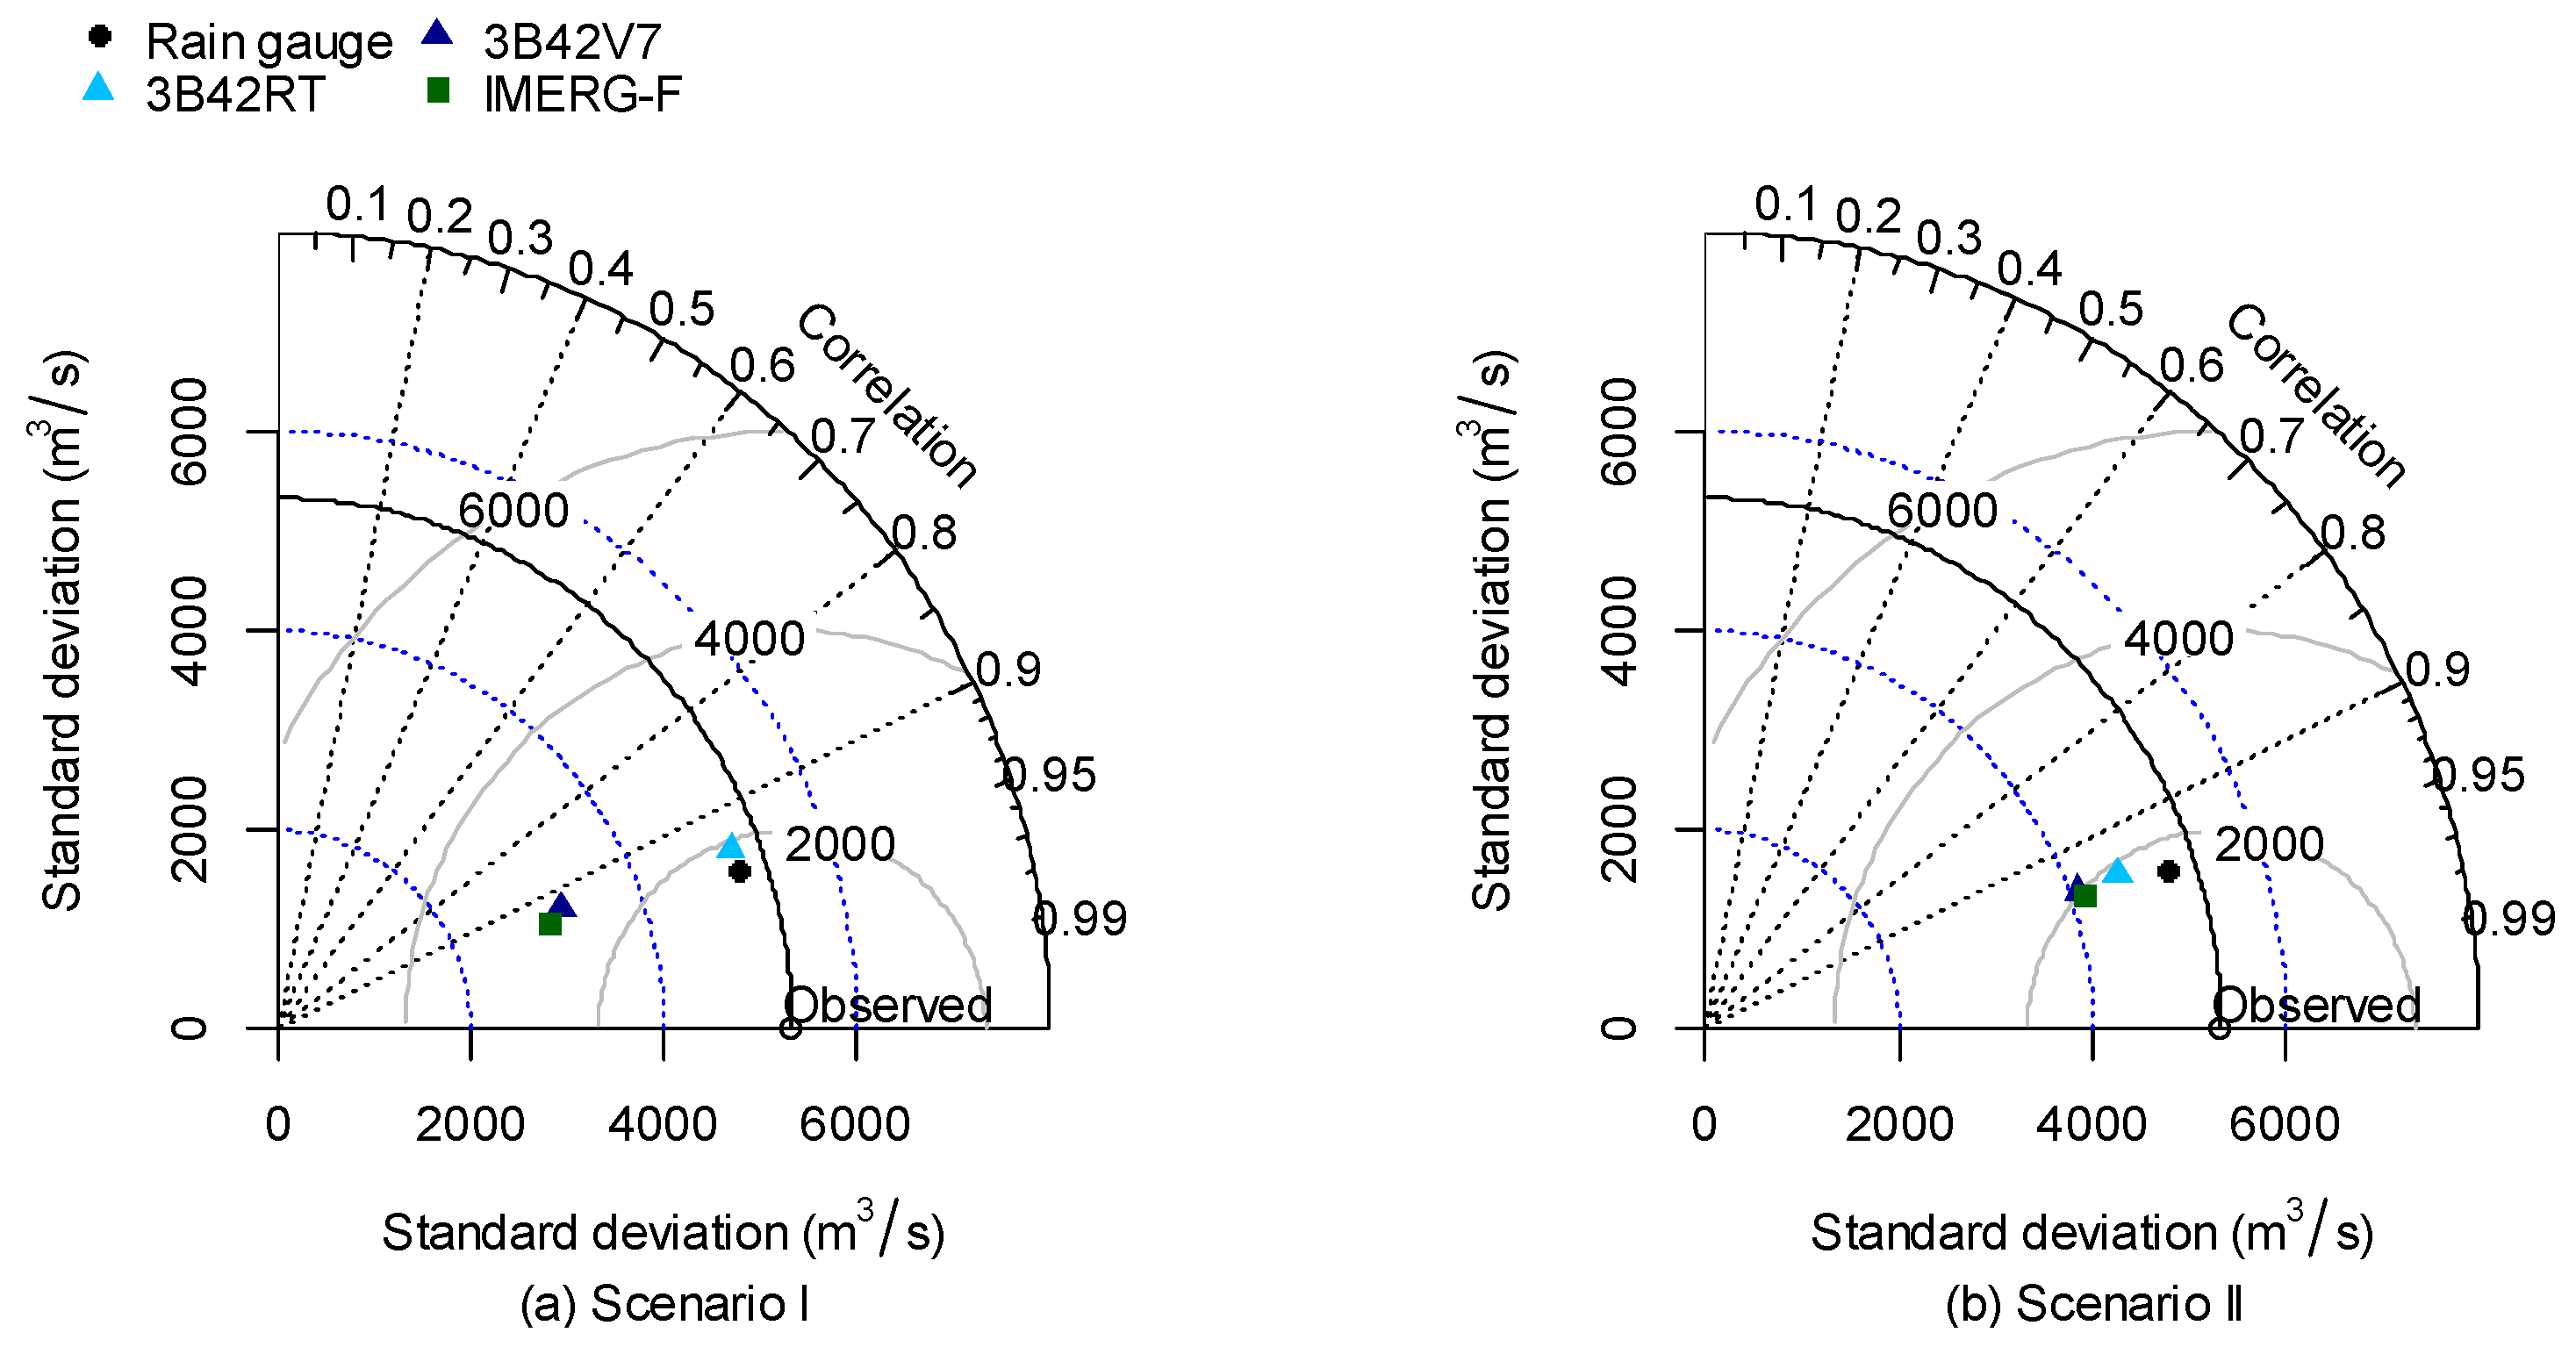
4.2.1. Scenario I: Discharge Simulations with Rain-Gauge-Calibrated Parameters

Figure 8a depicts the 3-hourly hydrographs at the watershed outlet (Monywa station, Figure 1) that were simulated using the gauge-based gridded precipitation data set and 3B42RT SPP under Scenario I. The figure illustrates that the simulated discharge forced by rain gauge data agrees well with the measured discharge in the calibration (1 April 2014–31 December 2015) and validation periods (January 1 2016–31 December 2016). Figure 9a shows that the GXAJ model driven by the rain gauge data produces a slight runoff underestimation of 3.7% in the calibration period and a moderate underestimation of 15.0% in the validation period, and the BIAS value for the entire simulation period is −8.3%. The rain-gauge-forced simulation run provides high NSEs, with 0.917, 0.856, and 0.895 for the calibration, validation, and entire periods (Figure 9b), respectively, and corresponding RMSE values of 1517.2, 2048.5, and 1729.5 m3/s, respectively. Figures S1a, S2a, S3a, and S4a show that the rain-gauge-driven XAJ model can accurately reproduce the historical 3-hourly discharge processes at the four upstream hydrological stations.
The GXAJ model using the rain-gauge-benchmarked parameters was forced by 3B42RT, 3B42V7, and IMERG-F SPPs for 3-hourly discharge simulations. Figure 8a shows that the 3B42RT-forced simulated hydrograph is fairly in line with the observed data, with BIAS, NSE, and RMSE values of −0.4%, 0.871, and 1913.1 m3/s, respectively, for the entire simulation period (Figure 9a–c), and the performance of the 3B42RT-based model run is nearly comparable with that of the rain-gauge-based model run, except for a noticeable underestimation of high flows in 2016. However, the 3B42V7- and IMERG-F-driven simulation runs presents an obvious flow underestimation in most of the simulation period (Figure 8b,c), with the BIAS values of −27.4% and −31.3% for the entire period, respectively (Figure 9a). The 3B42V7- and IMERG-F-based model runs also obtain lower NSEs (0.690 and 0.664, respectively) and higher RMSEs (2965.8 m3/s and 3089.5 m3/s, respectively) than the 3B42RT-based model run (Figure 9b,c).
Figure 10a compares the simulated discharge–duration curves using the rain-gauge-based precipitation data, 3B42RT, 3B42V7, and IMERG-F SPPs with the observations. This figure indicates that the rain-gauge-based simulation generates the 3-hourly discharge frequency distribution that basically agrees with the observations, except for a moderate discharge overestimation at the quantile levels of <12.6% and >98.7% and a slight underestimation of the intermediate discharge quantiles (12.6–98.7%). Among the three SPP-driven simulations, the 3B42RT-forced model run produces the discharge–duration curve that has the best approximation to the observations despite a noticeable overestimation of low and moderate streamflow quantiles (<90%) and a considerable underestimation of high flow quantiles (>90%). However, the 3B42V7- and IMERG-F-driven model runs remarkably underestimate moderate- and high-flow quantiles, which, for instance, systematically underestimate the 95% flow quantile by 43.8% and 46.3%, respectively. The reason for this phenomenon is that all SPPs tend to underestimate the occurrence frequency of heavy rain events at the grid scale (Figure 5) and the frequency of the basin-averaged precipitation at the high-quantile levels (≥87.2–95.3%) (Figure 7).
Moreover, the simulated flood peak flows and peak timing at the Monywa station in four major historical flood events were analyzed to describe how the GXAJ model captures high flows using the rain-gauge-based precipitation data set and three SPPs. As shown in Table 2, the rain-gauge-forced model run overestimates the flood peak flow of Event 20150908 by 13.4%, gives an underestimation of 2.4%–30.1% in other three flood events, and has considerable flood peak time errors (PTE ≥ 24 h). The 3B42V7-driven simulation overestimates the flood peak flows of Events 20140523 and 20150908 (BIASp = 36.0% and 12.6%, respectively) and produces an underestimation for Events 20150803 and 20160803 (BIASp = −17.1% and −20.1%, respectively). The 3B42V7-and IMERG-F-driven simulation runs consistently underestimate flood peak flows for all events (BIASp = −52.3–−26.1% and −52.9–−28.8%, respectively). All SPP-forced model runs have large errors in capturing the peak timing in certain events. For instance, the peak flow of Event 20160803 is simulated to appear ahead of the observed peak by 66–75 h.
Additionally, the Taylor diagrams were plotted to evaluate the overall hydrological performance of 3B42RT, 3B42V7, and IMERG-F SPPs based on the observed discharge data at the Monywa station under Scenario I. Figure 11a indicates that the rain-gauge-forced model run provides the best approximation to the observed discharge time series. The performance of the 3B42RT-driven simulation run is satisfactory, which is comparable to that of the rain-gauge-based simulation. The 3B42V7- and IMERG-F-based simulations achieve acceptable and similar hydrological performance. The overall hydrological performance of 3B42RT, 3B42V7, and IMERG-F SPPs at the four upstream hydrological stations is similar to that at the Monywa station (Figures S5a, S6a, S7a, and S8a).

4.2.2. Scenario II: Discharge Simulations with Satellite-product-specific Parameters

The GXAJ model was recalibrated using 3B42RT, 3B42V7, and IMERG-F SPPs to further assess the hydrological utilities of these SPPs. Figure 8 and Figure 9 demonstrate that model recalibration effectively improves most SPP-based discharge simulations at the Monywa station in the calibration and validation periods. The only exception is the 3B42RT-forced model run. The 3B42RT-based recalibration improves streamflow simulation in the calibration period but slightly worsens it in the validation period. Its BIAS, NSE, and RMSE values for the entire simulation period are 9.2%, 0.868, and 1937.5 m3/s, respectively (Figure 9d–f), which are slightly worse than those under Scenario I (Figure 9a–c). The 3B42V7-specific model calibration alleviates streamflow underestimation under Scenario I and improves the high-flow simulation (Figure 8a,d), which reduces BIAS and RMSE from −27.4% and 2965.8 m3/s to −18.9% and 2209.6 m3/s, respectively, and increases NSE from 0.690 to 0.828 in the entire simulation period (Figure 9). Such improvement is also found in the IMERG-F-based model run. BIAS is reduced from −32.3% under Scenario I to −18.5% under Scenario II, and RMSE for the entire period is cut down by 30.9%, and NSE is remarkably increased from 0.664 to 0.840 (Figure 9). Figures S1–S4 indicate that the input-specific model calibration generally enhances the hydrological performance of all three SPPs at the four upstream hydrological stations.
Moreover, the satellite-product-specific recalibration generally improves the discharge–duration curves in the high-flow section. Figure 10b shows that model recalibration effectively dampens the magnitudes of discharge underestimation at the quantile level higher than 50% for all SPP-forced simulations, except for the 3B42RT-based model run. The 3B42RT-forced model presents even more severe high-flow underestimation after recalibration (Figure 10b) than the situation that uses rain-gauge-calibrated parameters (Figure 10a). The 3B42RT-forced model presents a considerable overestimation of quite a few flood peaks in the calibration period under Scenario I (Figure 8a). Model recalibration that uses 3B42RT effectively reduces high flows in the calibration period and consequently decreases high flows for the entire period (Figure 8d). Notably, the satellite-precipitation-based model recalibration does not effectively enhance the low-flow simulations. The reason is probably due to the fact that the objective function for hydrological model optimization, the maximum of NSE tends to provide high importance to high flows, and thus the optimized model may not accurately simulate low-flow processes.
The SPP-specific recalibration generally improves the model’s capability in capturing flood peak flows. Table 2 shows that model recalibration obviously augments flood peak flows for all flood events and clearly cuts down the BIASp values for the model runs driven by all SPPs except 3B42RT. The 3B42RT-forced simulation runs reduce the magnitudes of flood peak overestimation for Events 20140523 and 20150908 by 14.6% and 12.0%, respectively, but exacerbate the flood peak underestimation for Events 20150803 and 20160803 by 9.8% and 2.5%, respectively. Although the systmatic errors of the simulated flood peak flows are obviously reduced in the 3B42V7- and IMERG-F-based model runs for all flood events, considerable flood peak underestimations still exist in Events 20150803 (BIASp = −35.3% and −38.0%, respectively) and 20160803 (BIASp = −23.3% and −17.2%, respectively). Moreover, model recalibration reduces PTE for Events 20140523, 20150908, and 20160803, but not for Event 20150803 with large PTE values of −63 h–−57 h.
After model recalibration, the overall performance of the SPP-forced simulations at the Monywa station is remarkably enhanced (Figure 11b), except for the 3B42RT-based model run that already obtained satisfactory hydrological abilities under Scenario I (Figure 11a). Under Scenario II, 3B42RT has the best hydrological performance among all three SPPs, and IMERG-F and 3B42V7 have acceptable performance, with IMERG-F being slightly better than 3B42V7 (Figure 11b). The general hydrological performance of 3B42RT, 3B42V7, IMERG-F SPPs at the four upstream hydrological stations is similar to that at the Monywa station (Figures S5b, S6b, S7b, and S8b).

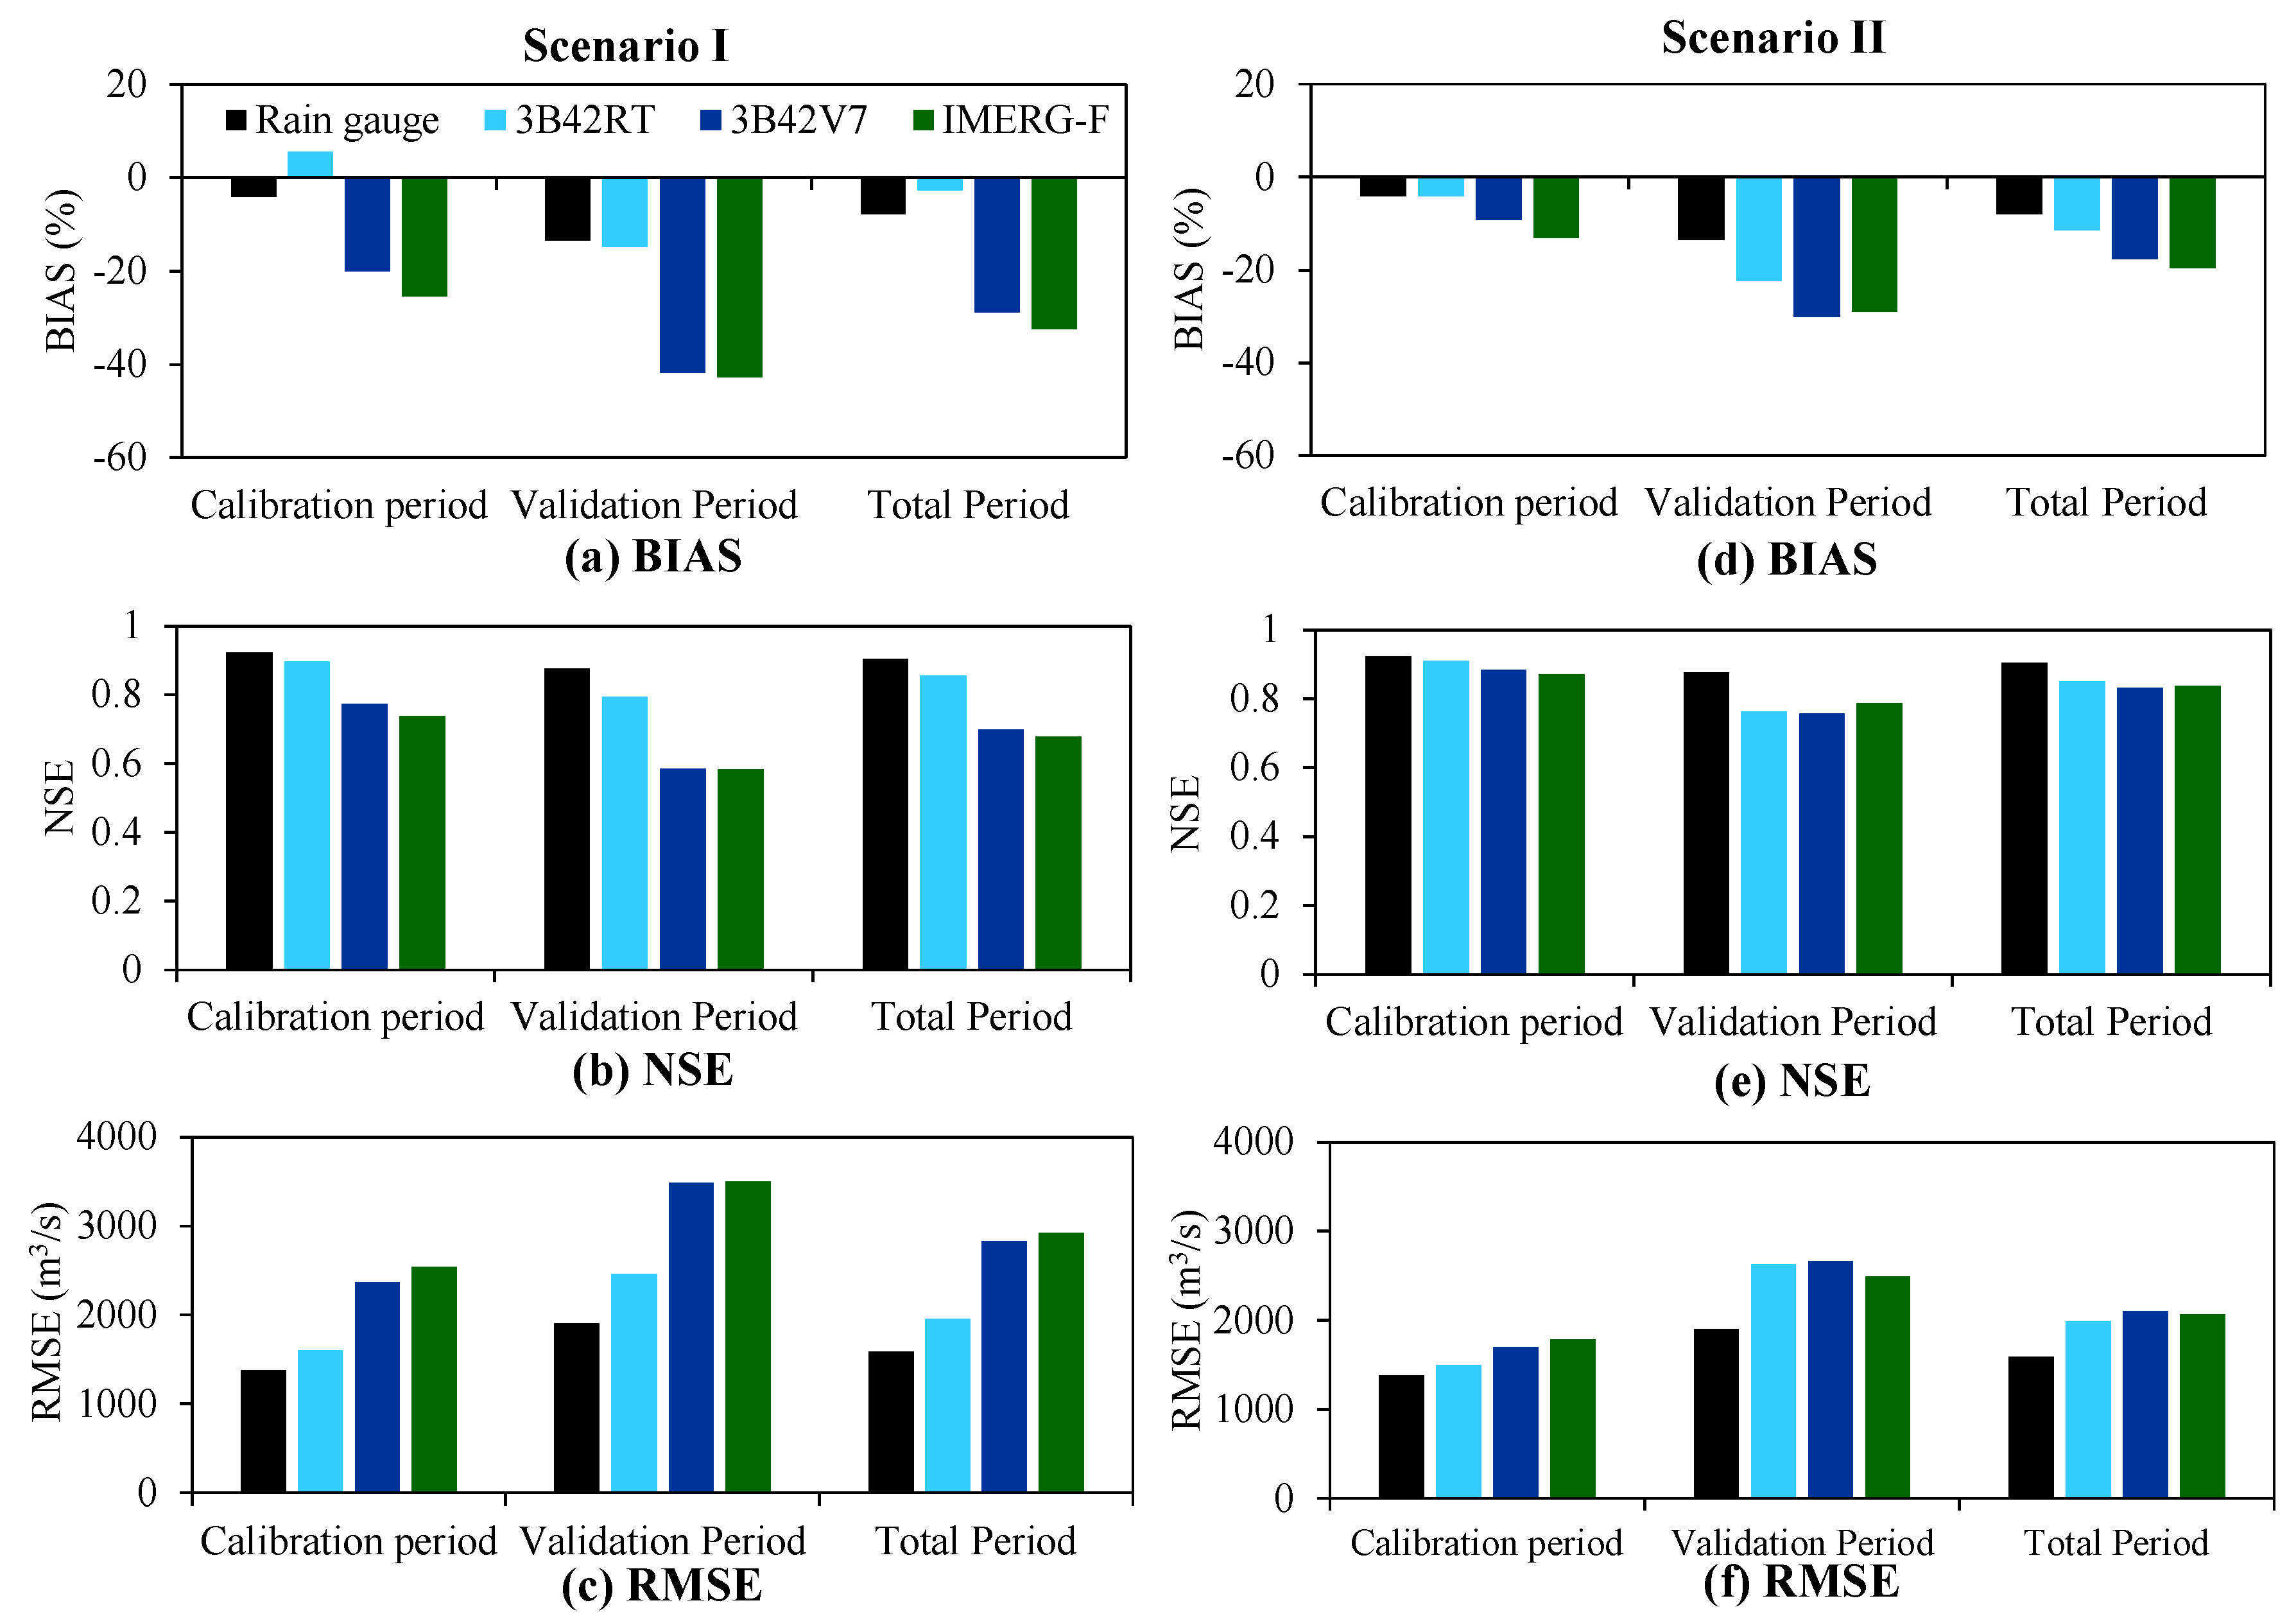
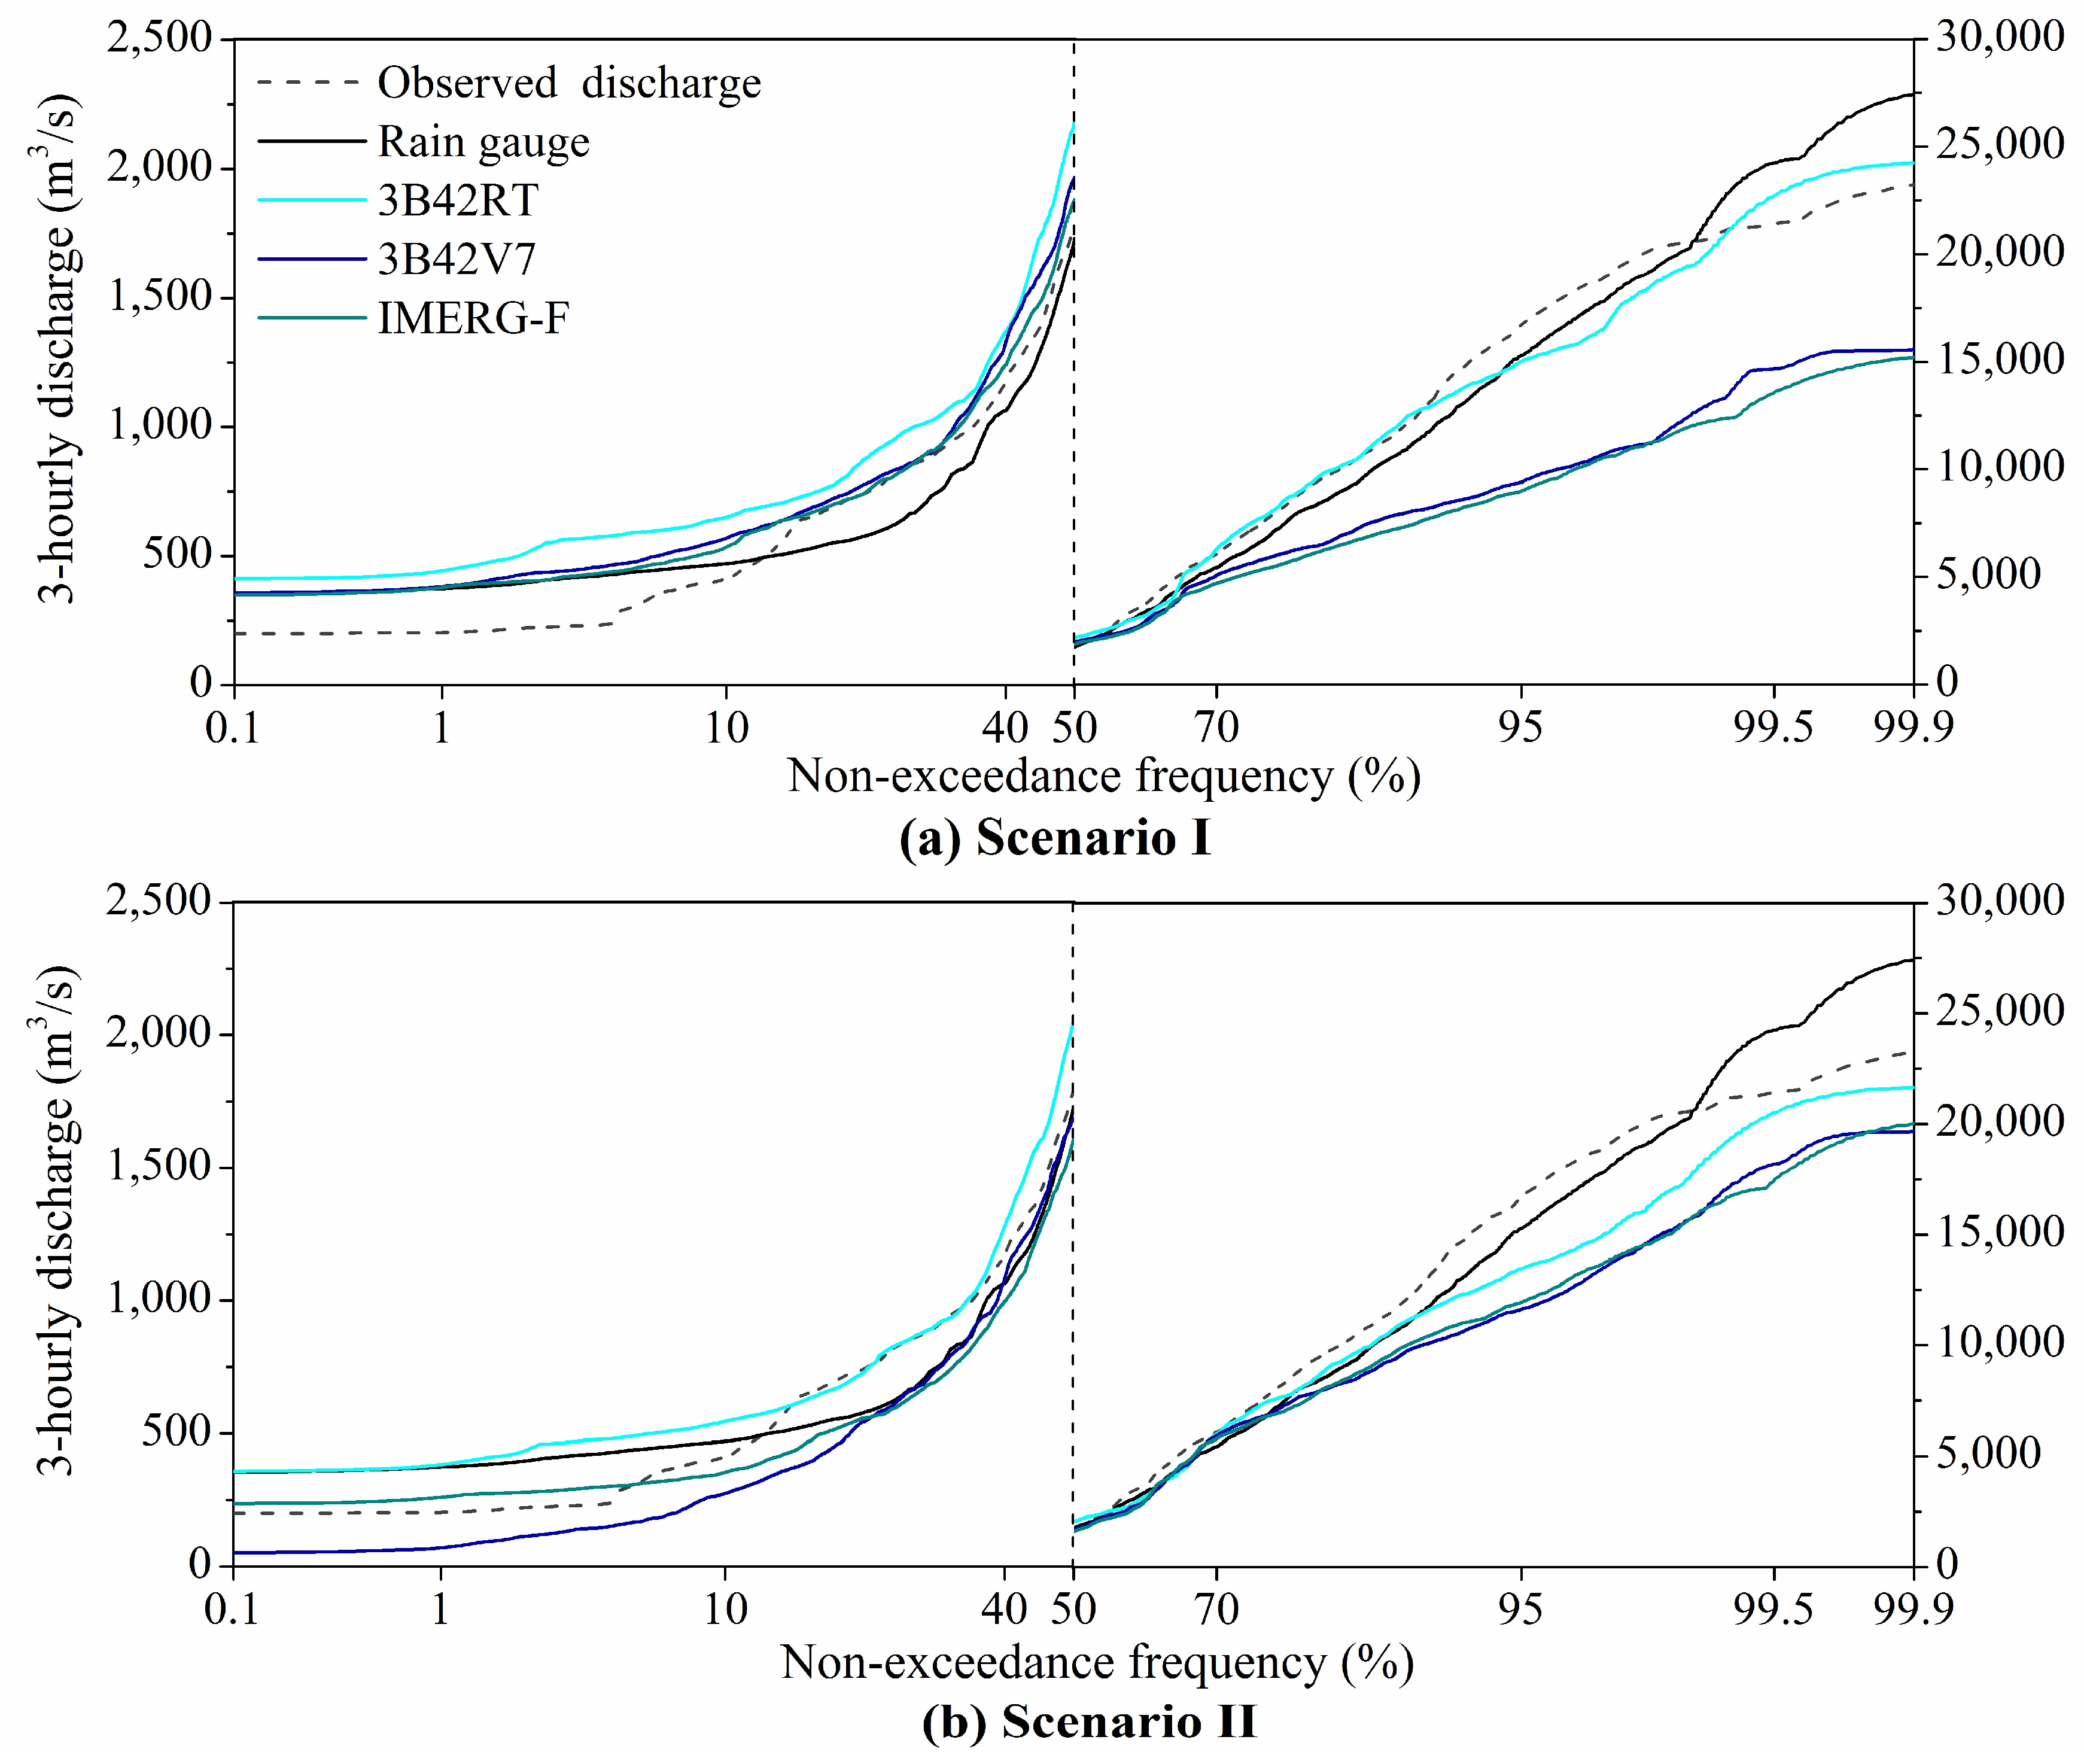
4.2.3. Effects of Product-Specific Model Recalibration on Flood Simulations

The basin-averaged model parameter values calibrated using 3B42RT, 3B42V7, and IMERG-F were compared with the rain-gauge-benchmarked parameter set (Table S1) to evaluate the effects of satellite-product-specific model recalibration on flood simulations. As stated in Section 3.2, the GXAJ model parameter K (coefficient of PE) predominantly controls the simulated total runoff [67]. A large K value inclines to produce high actual ET and hence generates a low total runoff. The 3B42RT-based simulation run using the gauge-based parameters overestimates the total runoff by 9.1% in the calibration period (Figure 9a) because of the considerable overestimation of basin-averaged precipitation in 3B42RT (Table 1). The 3B42RT-based model recalibration increases K from 1.104 to 1.184 (Table S1) and effectively cuts down the systematic error to −1.0% in the calibration period (Figure 9d). In contrast to 3B42RT, 3B42V7 and IMERG-F systematically underestimate basin-averaged precipitation (Table 1). As a result, the GXAJ model that uses the gauge-based parameters considerably or even largely underestimates the total runoff in the studied basin, when forced by 3B42V7 and IMERG-F SPPs (Figure 9a). Model recalibration using 3B42V7 and IMERG-F considerably decreases K from 1.104 to 0.921 and 0.954, respectively (Table S1). Thus, the magnitude of total runoff underestimation is remarkably dampened (Figure 9d).
The areal mean free water storage capacity (SM) predominately regulates the high flow magnitude [67]. Reducing SM tends to partition a lower proportion of surface runoff from the total runoff and hence produce high flood peaks. Under Scenario I, the GXAJ model driven by 3B42V7 and IMERG-F underestimates most high flows (Figure 8b,c), as a result of the remarkable systematic underestimation of heavy rain events in these SPPs (Figure 5 and Figure 7). The model recalibration alleviates the magnitudes of high-flow underestimation (Figure 8e,f) via decreasing SM from 134.575 mm to 101.161 mm for 3B42V7 and 117.526 mm for IMERG-F, respectively (Table S1). The 3B42RT-based recalibration increases SM to 142.720 mm (Table S1) because the 3B42RT-driven simulation presents a slight high-flow overestimation in the calibration period under Scenario I (Figure 8a), and thus moderately decreases flood peaks in the entire simulation period under Scenario II (Figure 8d).
Moreover, reducing the recession constants of surface, interflow and groundwater runoffs (CS, CI, and CG) may lead to a faster recession rate for each runoff component and consequently augment high flows to a certain extent. Table S1 shows that the IMERG-F-based recalibration optimizes these three runoff recession coefficients to be consistently lower than the rain-gauge-benchmarked parameter values, thereby partially compensating for the high-flow underestimation.
Table S1 also shows that the optimized parameters using 3B42RT exhibit less deviation from the gauge-based parameter set than those calibrated using 3B42V7 and IMERG-F. This finding indicates that 3B42RT has less compensation effect of model recalibration than other SPPs. This result is likely due to the situation where 3B42RT, in general, has the best quality among all SPPs in the Chindwin River basin (Figure 6). In the Wangchu basin of Bhutan, Xue et al. [19] found that 3B42V7 was generally improved than its predecessor, 3B42V6. As a result, 3B42V7 has less obvious recalibration effect relative to 3B42V6.

5. Discussion

5.1. Evaluation of SPPs against Ground Rainfall Observations

This study employs an early evaluation of the near- and post-real-time versions of the TRMM-era SPPs (TMPA) and the GPM-era SPPs (IMERG and GSMaP) on sub-daily time scales in contrast with the ground rainfall observations in the Chindwin River basin, Myanmar. This study found that among all near-real-time SPPs, TMPA 3B42RT has the best overall performance, followed by IMERG-L and IMERG-E, whereas GSMaP-NRT demonstrates inferior capability in capturing precipitation dynamics at grid and basin scales (Figure 6 and Table 1). IMERG-F presents the highest accuracy, slightly superior to 3B42V7 among the four post-real-time SPPs. GSMaP-MVK is ranked as third, and the performance of GSMaP-GAUGE is unsatisfactory (Figure 6 and Table 1). Yuan et al. [47] carried out the first comparative study on the quality of the 3B42V7 and IMERG-F version 03D (V03D) data sets in the same region and found that 3B42V7 generally outperforms IMERG-F at daily and monthly time scales. Our study demonstrates that the rainfall retrieval algorithms of IMERG-F were remarkably enhanced, and the quality of IMERG-F V05B was greatly improved in comparison with its previous version (V03D) and even surpassed its predecessor, 3B42V7, in the Chindwin River basin. This finding implies that the current release of IMERG-F can be considered the suitable replacement for 3B42V7 in the study area.
Many previous studies [24,25,50,72,73,74] found that post-real-time SPPs generally present higher quality than their near-real-time versions in many regions of the world because of gauge-based adjustment. In this study, IMERG-F evidently outperforms the near-real-time SPPs (IMERG-E and IMERG-L) in the Chindwin River basin. However, this case is different from those of GSMaP and TMPA SPPs. Although calibrated with the CPC precipitation data, the post-real-time product GSMaP-GAUGE greatly underestimates precipitation with higher magnitudes of underestimation than the near-real-time product GSMaP-NRT (Figure 4a,b), and GSMaP-GAUGE has the lowest overall score among all the three GSMaP SPPs (Figure 6). The precipitation estimates from GSMaP-GAUGE largely depend on the CPC data set. If the CPC data set has good precipitation estimates in a region, then GSMaP-GAUGE will also show remarkable scores in this region [75]. The present study checked the CPC data set [76] to explore the possible error sources for GSMaP-GAUGE and found that the CPC data do not include any gauges within the Chindwin River basin but mainly adopt the rainfall records at a few gauges located at the western slopes of the Arakan Mountains to extrapolate the rainfall situation in the investigated basin. The CPC precipitation data extrapolated from the rainfall records at the rain gauges outside of the studied basin are likely to contain large biases because precipitation in the Chindwin River basin is largely affected by the southwest monsoon activities and complex topography. Thus, this phenomenon might remarkably influence the accuracy of the GSMaP-GAUGE precipitation estimates. This study also analyzed the gauge density of the GPCC monthly gauge precipitation analysis data set [77] and found that the number of gauges is very limited and highly varies in the Chindwin River basin, usually two to five stations in the dry season (October–April) and zero to two stations in the rainy season (May–September). Bias-corrected using the GPCC data set, 3B42V7 considerably reduces the systematic errors in 3B42RT (Figure 4a,b). However, the GPCC-based bias-correction does not evidently improve other diagnostic statistics (Figure 4), and even 3B42RT has better overall performance than 3B42V7 (Figure 6). In addition to the errors in the GPCC data set, other error sources of 3B42V7 should be analyzed as well. This work will be conducted in the near future.
As parallel SPPs in the GPM-era, IMERG and GSMaP products in several regions of the world were evaluated and quantitatively compared [29,72,74,78,79,80]. Ning et al. [78] concluded that GSMaP-GAUGE version 06 (V06) performs better and has more stable quality results than IMERG-F version 04 (V04) on daily and monthly scales in Mainland China in terms of mean error (ME), RMSE, CC, and POD. Ning et al. [79] also found that GSMaP-GAUGE V06 generally outperforms IMERG-F V04 with high CC and low absolute ME values on daily and monthly scales over eight river basins in China. IMERG-F V04 performs relatively better than GSMaP-GAUGE V06 in most areas in China but tends to overestimate precipitation when rainfall intensity exceeds 20 mm/d in four regions of China [72]. Among the four near-real-time products (PERSIANN, 3B42RT, IMERG-L, and GSMaP-NRT), Tang et al. [80] found that IMERG-L and GSMaP-NRT perform closest-to-ground observations in South China and recommended IMERG-F as the best satellite product in capturing flood hazard events with low false alarms. Rozante et al. [29] evaluated IMERG-F V05, GSMaP-GAUGE V07, and 3B42V7 in six Brazilian regions and the entire Brazil territory and found that GSMaP-GAUGE presents better performance than IMERG-F and 3B42V7 in all regions and at various precipitation intensity levels with respect to CSI and equitable threat score (ETS). Regarding CSI, ETS, POD, FAR and BIAS, IMERG-F and 3B42V7 demonstrate similar behavior with better performance for IMERG-F [29]. Rozante et al. [29] inferred that the different precipitation characteristics from these three products might partially result from the quality of the CPC and GPCC global precipitation data sets. In Brazil, the mean gauge number of the CPC data used to calibrate GSMaP is approximately 1000, whereas only approximately 300 rain gauges are included in the GPCC data set for bias-correcting the IMERG and TMPA products [29]. In Bangladesh, GSMaP-GAUGE V07 was found to have better correspondence with the rain gauge measurements than IMERG-F version 04A [74]. This observation is partly ascribed to the situation where GSMaP-GAUGE uses auxiliary data sources, such as topographic data, JMA Global Analysis (GANAL) data, and JMA Merged Satellite and in situ Global Daily Sea Surface Temperatures (MGDSST) forecast data set [74]. Our study demonstrates that IMERG is generally superior to GSMaP in retrieving near- and post-real-time precipitation in the Chindwin River basin (Figure 6). The relatively better performance of IMERG-F in contrast with GSMaP-GAUGE might be partially attributed to the fact that around five rain gauges are included in the GPCC data, but the CPC data set do not contain local stations for bias-correction. Other causes for this phenomenon should be analyzed in the future, particularly the comparison and analysis of the algorithms of the near-real-time versions of IMERG and GSMaP with consideration of monsoon activities and local topographical effects. The auxiliary data sets for GSMaP gauge-adjustment, such as GANAL and MGDSST, should also be evaluated.
Despite the inherent non-negligible biases, nearly all SPPs (excluding GSMaP-GAUGE) have an advantage over the gauge-based gridded precipitation data in effectively identifying the low precipitation region in the basin (the Arakan highland region, Figure 3), where rainfall occurrence is strongly affected by the southwestern monsoon activities and large topographic relief. This phenomenon reflects that ground precipitation observations at a limited number of rain gauges (seven stations in this study) might not sufficiently capture the actual precipitation distribution in the watershed. Therefore, the watershed-averaged precipitation time series derived from the gauge-based gridded precipitation data are likely to contain considerable biases, and caution should be taken on the findings of the watershed-scale precipitation evaluation. In the light of the strength of SPPs in detecting reasonable spatial distribution of precipitation over the studied basin, reproducing rational precipitation data sets by merging the satellite precipitation data, ground precipitation observations, and other data sources is desirable. Ma et al. [81] evaluated an ensemble multi-satellite precipitation data set that optimally merges four mainstream SPPs (3B42RT, 3B42V7, CMORPH, and PERSIANN-CDR) using the dynamic Bayesian model averaging scheme. They found that the ensemble satellite data set outperforms IMERG and GSMaP-MVK in almost all metrics in the summers of 2014 and 2015 at daily and 0.25° scales over the Tibetan Plateau, as well as performs remarkably in reproducing the probability density function for daily rainfall amount and estimating moderate and heavy rainfall [81]. Beck et al. [82] developed the Multi-Source Weighted-Ensemble Precipitation global data set by merging two global gauge-based precipitation data (GPCC and CPC unified), three SPPs (CMORPH, GSMaP-MVK, and 3B42V7), and two atmospheric model reanalysis (ERA-interim and JRA-55) as a function of timescale and location. Unlike the four gauge-adjusted data sets (WFDEI-CRU, GPCP-1DD, 3B42V7, and CPC Unified) that use independent precipitation data from 125 FLUXNET tower stations around the globe, the ensemble precipitation shows the highest daily CC among the five data sets over 60% of stations, and the merged data generally present improved hydrological capabilities than other data sets [82]. These merging techniques could be used in the Chindwin River basin in the future.

5.2. Evaluation of Hydrological Performance of the GPM-Era SPPs

A few recent studies have been conducted to evaluate the hydrological utilities of the GPM-era SPPs in several basins in the world (Table S2). The three main findings are generalized in this table: (1) IMERG-F is generally superior to 3B42V7 in hydrological simulations in many regions owing to its enhanced precipitation estimates; (2) the IMERG post-real-time product (IMERG-F) tends to have better hydrological abilities than the near-real time products (IMERG-E and IMERG-L); and (3) although a few previous studies show that the earlier versions of GSMaP are feasible for flash flood simulations [10,51] and flood inundation modeling [9,55], the hydrological evaluations of the latest GPM-era versions of the GSMaP products were seldom reported in recent studies. Although Section 4.2 only demonstrates the hydrological performance of the best near-real-time SPP (3B42RT) and the comparatively better post-real-time SPPs (IMERG-F and 3B42V7), our study also evaluated the hydrological utility of the other five SPPs (IMERG-E, IMERG-L, GSMaP-NRT, GSMaP-MVK, and GSMaP-GAUGE), which is summarized in Table S2. Our study found that IMERG-F V05 and 3B42V7 have acceptable hydrological capabilities in the Chindwin River basin, with IMERG-F being slightly better than 3B42V7. Similar findings were reported in the Ganjiang River basin [45], Beijiang River basin [24], upper Mekong River basin [36], Mishui basin [25], Yellow River source region of China [44], and Amazon basin of Peru and Ecuador [48]. Yuan et al. [47] employed the first hydrological evaluation research in the Chindwin River basin and found that IMERG-F V03 performs comparatively worse than 3B42V7 in daily streamflow simulations. In comparison with Yuan et al. [47], our study demonstrates that the updated precipitation retrieval algorithms (V05B) effectively enhanced the hydrological utility of IMERG-F in the study area. Moreover, our study generally agrees with the findings of several previous studies [24,25,50] that IMERG-F with the rain-gauge-adjustment has better hydrological performance than IMERG-E and IMERG-L. In the Mishui basin of China, Jiang et al. [25] found that IMERG-E presents better daily hydrological performance than 3B42RT, even comparable to 3B42V7. Our study displays that all near- and post-real-time products of IMERG present poorer hydrological abilities than TMPA near-real-time product 3B42RT, mainly because 3B42RT has the best quality among all the evaluated SPPs. Moreover, our work is also among the early attempts to evaluate the hydrological performance of the latest GPM-era GSMaP products. Compared with IMERG, GSMaP presents unsatisfactory flood simulation capabilities in near- and post-real-time cases in the Chindwin River basin; these outcomes are mainly caused by their inferior precipitation retrievals. Specifically, the quality of satellite precipitation retrievals predominantly affects their hydrological utilities. The findings of this study emphasize the need for the GPM technical community to further refine the algorithms and enhance the accuracy of the IMERG and GSMaP products in Myanmar. In particular, the expected enhanced near-real-time SPPs would be promising for effective real-time flood forecasts and warnings in large ungauged watersheds, which would be helpful for local flood control and damage mitigation, considering that the latency of the near-real-time products is short (e.g., 4 h for IMERG-E and GSMaP-NRT). Notably, this study demonstrates the overall quality and hydrological feasibility of multiple SPPs in the period from 1 April 2014 to 31 December 2016. It is very possible that SPPs might have various performance in retrieving precipitation in different time periods. Thus, future work will focus on dividing the evaluation period into pre-, mid-, and post-monsoon seasons and assessing the quality and hydrological utility of SPPs in these sub-periods, respectively.
This study is associated with large uncertainties from precipitation input, parameter calibration, and hydrological model structure. This work found that the gauge-based gridded precipitation data set might not capture the spatial pattern of precipitation, which mainly results from the limited number of rain gauges (seven stations) in such a large watershed (110,350 km2). Despite of the unrepresentativeness of the gauge-based gridded precipitation data set, the rain-gauge-based GXAJ model run provides satisfactory streamflow simulations at the five streamflow stations in the watershed. This good hydrological performance mainly results from the compensation effect of model calibration. Hydrological models are, to some degree, tolerant of the biased forcing data via model calibration, and hence the models might reproduce reasonable streamflow processes at the hydrological stations where local streamflow data are used for calibration. However, the calibrated model parameter set likely fails to represent real basin features and further lowers the model’s predictive capability in internal basins or sub-basins [19]. Future work will entail investigating the impact of the spatially unrepresentative precipitation input on hydrological modeling performance, by calibrating the model only at the outlet station and analyzing the simulated streamflow at the stations within the watershed. Meanwhile, it is necessary to construct an enhanced precipitation data set for model calibration by means of bias-correction, such as using ground precipitation data for magnitude correction and using SPPs for spatial pattern correction. The unrepresentativeness of the gauge-based precipitation data might also be caused by the simple interpolation method (inverse-distance weighting). Using complicated interpolation methods, such as the revised Kriging method that accounts for elevation, is desirable. However, this method requires sufficient sample size of rain gauges to establish the reliable relationship between precipitation and topographic features. Therefore, it emphasizes that local authorities must establish a denser rainfall observation network. This measure will not only facilitate the validation of satellite-derived precipitation but also help improve the accuracy of streamflow simulations/forecasting for effective flood warning and disaster mitigation. Moreover, this study employed the SCE-UA algorithm to optimize the hydrological model and selected the parameter set with the highest NSE for flood simulations. This procedure ignores the uncertainty from parameter estimation, in particular the effect of parameter equifinality. Thus, the generalized likelihood uncertainty estimation (GLUE) method should be applied to quantify parameter uncertainty in future research. Furthermore, parameter calibration is also influenced by the length of observed discharge data. In this study, the discharge data in a three-year length (from 1 January 2014 to 31 December 2016) were obtained from DMH, and IMERG and GSMaP provided precipitation estimates since mid-March 2014. For this reason, the streamflow data in a 21-month length (from 1 April to 31 December 2015) were used for model calibration, and one-year discharge data (from 1 January 2016 to 31 December 2016) for model validation. The model parameters calibrated using discharge data in such a short length might not accurately capture the hydrological features of the basin. Consequently, the calibrated model is likely to generate considerable biases in streamflow simulations. Since the GPM technical community continuously releases the up-to-date precipitation data, we will actively contact DMH and try to extend the length of streamflow and weather data, which will facilitate model calibration and evaluation of GPM-era SPPs for a longer time period. In addition, this study only used one hydrological model to assess the hydrological feasibility of SPPs and did not consider the uncertainty from model structure. Hence, employing different hydrological models and conducting multi-model simulations and comparisons are necessary.
This study shows that the utility of SPPs for flood simulations still largely relies on model calibration, which limits the applicability of SPPs in ungauged basins with no streamflow data available for calibration. To employ SPPs in flood simulations in ungauged basins, it is advisable to calibrate the hydrological model over a nearby gauged basin that is hydrologically similar to the studied ungauged basin and transfer the calibrated parameter set from the gauged basin to the ungauged basin. Another alternative is to use a hydrological model whose parameters are able to be estimated a priori from topography, land cover, and soil texture information. Actually, most of the GXAJ model parameters have clear physical meanings. Yuan and Ren [83] associated the free water storage capacity (SM) with the maximum plant root depth and soil porosity and established the empirical relationship of the outflow coefficients of interflow and groundwater runoffs with soil texture information. Shi et al. [84] derived an empirical equation that computes the tension water storage capacity according to the topographic index. Obtaining detailed topography, land cover, and soil texture information in ungauged basins and hence deriving model parameters through these empirical relationships for hydrological simulations are desirable.

6. Conclusions

Few previous studies have focused on the statistical and hydrological evaluations of the latest GPM-era IMERG and GSMaP SPPs in both near- and post-real-time versions at sub-daily time scales. Therefore, this study proposed an assessment framework addressing this issue. With the aid of this framework, the 3-hourly daytime precipitation retrievals and 12-hourly nighttime retrievals from six GPM-era SPPs (IMERG-E, IMERG-L, IMERG-F, GSMaP-NRT, GSMaP-MVK, and GSMaP-GAUGE) and two TRMM-era SPPs (3B42RT and 3B42V7) were statistically evaluated and compared in the sparsely gauged Chindwin River basin of Myanmar. Subsequently, the comparatively better near- and post-real-time SPPs were selected to drive the GXAJ hydrological model to investigate their hydrological utility in 3-hourly discharge simulations. The main findings of this study are summarized as follows:
(1)
Statistical assessment at grid and basin scales demonstrates that 3B42RT generally presents a higher quality, followed by IMERG-F and 3B42V7. IMERG-E, IMERG-L, GSMaP-NRT, GSMaP-MVK, and GSMaP-GAUGE obviously underestimate total precipitation, and the three GSMaP SPPs have the lowest accuracy.
(2)
Given that 3B42RT demonstrates the best quality among the four near-real-time SPPs, 3B42RT obtains satisfactory hydrological ability (NSE = 0.871) in 3-hourly streamflow simulations using the rain-gauge-benchmarked parameters, which is comparable with the rain-gauge-based precipitation data (NSE = 0.895). Although 3B42V7 and IMERG-F have comparatively better quality than the other two post-real-time SPPs, these two SPPs have mildly poorer hydrological performance (NSE = 0.690 and 0.664 for 3B42V7 and IMERG-F, respectively).
(3)
The input-specific model recalibration greatly improves the SPP-based streamflow simulations. 3B42RT obtains good hydrological performance (NSE = 0.868). Following 3B42RT, IMERG-F (NSE = 0.840) slightly outperforms 3B42V7 (NSE = 0.828).
These aforementioned findings have implications for SPP development and can provide the local community with guidance to alternative choice of SPPs for hydrological applications. This study found that the post-real-time SPP, IMERG-F V05B, demonstrates comparable or even slightly better accuracy in statistical and hydrological evaluations in comparison with its predecessor, 3B42V7, indicating that the latest release of IMERG-F can be considered a suitable substitute for 3B42V7 in the Chindwin River basin in the evaluation period. However, in the case of near-real-time SPPs, the overall performance of IMERG-E and IMERG-L is still behind that of 3B42RT, which even outperforms the post-real-time 3B42V7 and IMERG-F SPPs. The near-real-time IMERG products have fine spatiotemporal resolutions and short latencies, which add to their great potential for applications in real-time hydrological forecasting and flood monitoring. Therefore, the GPM scientific team should further refine the retrieving algorithms and improve the accuracy of IMERG-E and IMERG-L SPPs in the Chindwin River basin, where local precipitation is sparsely gauged and accurate and timely precipitation data are urgently needed for flood control and disaster mitigation. Several previous studies have likewise reported that the quality of GSMaP SPPs in China [72,78,79,80], Brazil [29], and Bangladesh [74] is comparable with that of IMERG, or that GSMaP is slightly superior to IMERG. Nevertheless, this study shows that GSMaP SPPs in near- and post-real-time versions have relatively poorer performance in the study area, in comparison with TMPA and IMERG SPPs. Thus, there is a need for the GSMaP technical community to improve the quality of GSMaP SPPs in the Chindwin River basin. Furthermore, this work strengthens the necessity for the local authority to establish a denser rainfall-monitoring network. It not only helps avoid direct comparison of SPPs with a sparse gauge network and the subsequent gauge spatial representativeness problem, but also facilitates effective flood forecasting and prompt disaster mitigation.
The world is diverse in topography and climate, which might influence the accuracy of SPPs at different levels in various regions. Therefore, the quality of the latest IMERG and GSMaP SPPs, as well as their hydrological utility in other regions of the world, must be assessed and compared. The assessment framework proposed in this study is expected to be applicable to other river basins. To implement this framework for assessment at sub-daily time scales, two critical issues should be addressed. First, obtaining the ground precipitation and observed streamflow data in shorter-than-daily time intervals is prerequisite. Such data might be easily accessed in most watersheds of the developed countries. However, collecting these data might be difficult in many underdeveloped regions owing to the limited local infrastructure investment for ground hydrometeorological monitoring, and this largely restricts the applicability of the assessment framework in these regions. Second, given that hydrological models generally have certain preconditions for applications, selecting a suitable model for hydrological evaluation of SPPs according to local land surface and hydrometeorological features and data acquisition conditions is an effective measure to reduce the uncertainty from hydrological model structure and improve the reliability of the assessment.
This study involves large uncertainties from precipitation input, parameter calibration, and hydrological model structure. Future work will focus on reducing and quantifying these uncertainties, such as bias-correcting SPPs, extending discharge data length for parameter calibration, using the GLUE scheme to explicitly quantify the effect of parameter equifinality, employing different hydrological models, and conducting multi-model simulations and comparisons. Additionally, future work will also entail assessing more basins in Southeast Asian countries using the error decomposition scheme [85], which separates the errors of SPPs into three independent components (hit bias, missed precipitation, and false precipitation) and helps better track the error sources associated with the satellite retrieval processes.

Supplementary Materials

The following are available online at https://www.mdpi.com/2072-4292/11/2/140/s1, Figures S1–S4: Performance of 3-hourly discharge simulations from 1 April 2014 to 31 December 2016 at the Hkamti, Homalin, Mawlaik, and Kalewa hydrological stations using the gauge-based gridded precipitation data set, 3B42RT, 3B42V7, and IMERG-F SPPs under two simulation scenarios, Figures S5–S8: Taylor diagrams showing the comparison of the simulated discharge at the Hkamti, Homalin, Mawlaik, and Kalewa stations using the rain-gauge-based precipitation data set, 3B42RT, 3B42V7, and IMERG-F SPPs with respect to the observed discharge data: (a) Scenario I and (b) Scenario II, Table S1: Physical meaning and sensitivity of the GXAJ model parameters and their parameter values calibrated using the gauge-based precipitation data set, 3B42RT, 3B42V7, and IMERG-F SPPs, Table S2: Summary of previous studies regarding the hydrological utility of the GPM-era SPPs.

Author Contributions

Conceptualization, F.Y.; methodology, F.Y.; writing—original draft preparation, F.Y.; funding acquisition, F.Y. and L.R.; investigation: F.Y., L.Z., K.M.W.S., and C.Z.; data curation: L.Z. and K.M.W.S.; visualization, L.Z.; writing—review and editing, L.R.,Y.Z., S.J., and Y.L.

Funding

This research was funded by the National Key Research and Development Program (Grant No. 2016YFA0601500) approved by the Ministry of Science and Technology of China; the National Natural Science Foundation of China (Grant Nos. 51779070, 41730750, and 51579066); the Natural Science Fundation of Jiangsu Province (Grand No. BK20150815), the 111 Project from the Ministry of Education and State Administration of Foreign Experts Affairs, P. R. China (Grant No. B08048); and the Fundamental Research Funds for the Central Universities (Grand No. 2019B10314).

Acknowledgments

We extend our sincere gratitude to the TRMM, GPM, and GSMaP research communities for making the satellite rainfall data available for this work. The authors extend their appreciation to the reviewers for their thoughtful comments and valuable advice.

Conflicts of Interest

The authors declare no conflict of interest.

References

  1. Hou, A.Y.; Kakar, R.K.; Neeck, S.; Azarbarzin, A.A.; Kummerow, C.D.; Kojima, M.; Oki, R.; Nakamura, K.; Iguchi, T. The global precipitation measurement mission. Bull. Am. Meteorol. Soc. 2014, 95, 701–722. [Google Scholar] [CrossRef]
  2. Huffman, G.J.; Bolvin, D.T.; Nelkin, E.J.; Wolff, D.B.; Adler, R.F.; Gu, G.; Hong, Y.; Bowman, K.P.; Stocker, E.F. The TRMM multisatellite precipitation analysis (TMPA): Quasi-global, multiyear, combined-sensor precipitation estimates at fine scales. J. Hydrometeorol. 2007, 8, 38–55. [Google Scholar] [CrossRef]
  3. Hsu, K.; Gao, X.; Sorooshian, S.; Gupta, H.V. Precipitation estimation from remotely sensed information using artificial neural networks. J. Appl. Meteorol. 1997, 36, 1176–1190. [Google Scholar] [CrossRef]
  4. Joyce, R.J.; Janowiak, J.E.; Arkin, P.A.; Xie, P. CMORPH: A method that produces global precipitation estimates from passive microwave and infrared data at high spatial and temporal resolution. J. Hydrometeorol. 2004, 5, 487–503. [Google Scholar] [CrossRef]
  5. Chris, F.; Peterson, P.; Landsfeld, M.; Pedreros, D.; Verdin, J.; Shukla, S.; Husak, G.; Rowland, J.; Harrison, L.; Hoell, A.; et al. The climate hazards infrared precipitation with stations—A new environmental record for monitoring extremes. Sci. Data 2015, 2, 150066. [Google Scholar]
  6. Kubota, T.; Shige, S.; Hashizume, H.; Aonashi, K.; Takahashi, N.; Seto, S.; Hirose, M.; Takayabu, Y.N.; Ushio, T.; Nakagawa, K.; et al. Global precipitation map using satellite-borne microwave radiometers by the GSMaP project: Production and validation. IEEE Trans. Geosci. Remote Sens. Lett. 2007, 45, 2259–2275. [Google Scholar] [CrossRef]
  7. Falck, A.S.; Maggioni, V.; Tomasella, J.; Vila, D.A.; Diniz, F.L.R. Propagation of satellite precipitation uncertainties through a distributed hydrologic model: A case study in the Tocantins–Araguaia basin in Brazil. J. Hydrol. 2015, 527, 943–957. [Google Scholar] [CrossRef]
  8. Qi, W.; Zhang, C.; Fu, G.; Sweetapple, C.; Zhou, H. Evaluation of global fine-resolution precipitation products and their uncertainty quantification in ensemble discharge simulations. Hydrol. Earth Syst. Sci. 2016, 20, 903–920. [Google Scholar] [CrossRef] [Green Version]
  9. Yoshimoto, S.; Amarnath, G. Applications of Satellite-Based Rainfall Estimates in Flood Inundation Modeling—A Case Study in Mundeni Aru River Basin, Sri Lanka. Remote Sens. 2017, 9, 998. [Google Scholar] [CrossRef]
  10. Saber, M.; Yilmaz, K.K. Evaluation and Bias Correction of Satellite-Based Rainfall Estimates for Modelling Flash Floods over the Mediterranean region: Application to Karpuz River Basin, Turkey. Water 2018, 10, 657. [Google Scholar] [CrossRef]
  11. Jiang, S.H.; Ren, L.L.; Hong, Y.; Yang, X.L.; Yuan, F.; Ma, M.W. Comprehensive evaluation of multi-satellite precipitation products with a dense rain gauge network and optimally merging their simulated hydrological flows using the bayesian model averaging method. J. Hydrol. 2012, 452–453, 213–225. [Google Scholar] [CrossRef]
  12. Nikolopoulos, E.I.; Anagnostou, E.N.; Borga, M. Using High-resolution Satellite Rainfall Products to Simulate a Major Flash Flood Event in Northern Italy. J. Hydrometeorol. 2013, 14, 171–185. [Google Scholar] [CrossRef]
  13. Tuo, Y.; Duan, Z.; Disse, M. Evaluation of precipitation input for SWAT modeling in Alpine catchment: A case study in the Adige river basin (Italy). Sci. Total Environ. 2016, 573, 66–82. [Google Scholar] [CrossRef] [PubMed] [Green Version]
  14. Ciabatta, L.; Brocca, L.; Massari, C. Rainfall-runoff modelling by using SM2RAIN-derived and state-of-the-art satellite rainfall products over Italy. Int. J. Appl. Earth Obs. 2016, 48, 163–173. [Google Scholar] [CrossRef]
  15. Behrangi, A.; Khakbaz, B.; Jaw, T.C.; AghaKouchak, A.; Hsu, K.; Sorooshian, S. Hydrologic evaluation of satellite precipitation products over a mid-size basin. J. Hydrol. 2011, 397, 225–237. [Google Scholar] [CrossRef]
  16. Tarnavsky, E.; Mulligan, M.; Ouessar, M.; Faye, A.; Black, E. Dynamic hydrological modeling in drylands with TRMM based rainfall. Remote Sens. 2013, 5, 6691–6716. [Google Scholar] [CrossRef]
  17. Hong, Y.; Adler, R.; Huffman, G. Applications of TRMM-based multi-satellite precipitation estimation for global runoff simulation: Prototyping a global flood monitoring system. In Satellite Rainfall Applications for Surface Hydrology, 1st ed.; Gebremichael, M., Hossain, F., Eds.; Springer: Dordrecht, The Netherlands, 2010; pp. 245–265. [Google Scholar]
  18. Yong, B.; Ren, L.-L.; Hong, Y.; Wang, J.-H.; Gourley, J.J.; Jiang, S.-H.; Chen, X.; Wang, W. Hydrologic evaluation of Multisatellite Precipitation Analysis standard precipitation products in basins beyond its inclined latitude band: A case study in Laohahe basin, China. Water Resour. Res. 2010, 46, W07542. [Google Scholar] [CrossRef]
  19. Xue, X.; Hong, Y.; Limaye, A.S.; Gourley, J.J.; Huffman, G.J.; Khan, S.I.; Dorji, C.; Chen, S. Statistical and hydrological evaluation of TRMM-based multi-satellite precipitation analysis over the Wangchu basin of Bhutan: Are the latest satellite precipitation products 3B42V7 ready for use in ungauged basins? J. Hydrol. 2013, 499, 91–99. [Google Scholar] [CrossRef]
  20. Behrangi, A.; Andreadis, K.; Fisher, J.B. Satellite-based precipitation estimation and its application for streamflow prediction over mountainous western US basins. J. Appl. Meteorol. Clim. 2014, 53, 2823–2842. [Google Scholar] [CrossRef]
  21. Tobin, K.J.; Bennett, M.E. Temporal analysis of Soil and Water Assessment Tool (SWAT) performance based on remotely sensed precipitation products. Hydrol. Process. 2013, 27, 505–514. [Google Scholar] [CrossRef]
  22. Tong, K.; Su, F.; Yang, D.; Hao, Z. Evaluation of satellite precipitation retrievals and their potential utilities in hydrologic modeling over the Tibetan Plateau. J. Hydrol. 2014, 519, 423–437. [Google Scholar] [CrossRef]
  23. Su, F.; Hong, Y.; Lettenmaier, D.P. Evaluation of TRMM Multisatellite Precipitation Analysis (TMPA) and its utility in hydrologic prediction in the La Plata basin. J. Hydrometeorol. 2008, 9, 622–640. [Google Scholar] [CrossRef]
  24. Wang, Z.; Zhong, R.; Lai, C.; Chen, J. Evaluation of the GPM IMERG satellite-based precipitation products and the hydrological utility. Atmos. Res. 2017, 196, 151–163. [Google Scholar] [CrossRef]
  25. Jiang, S.; Ren, L.; Xu, C.; Yong, B.; Yuan, F.; Liu, Y.; Yang, X. Statistical and hydrological evaluation of the latest Integrated Multi-satellitE Retrievals for GPM (IMERG) over a midlatitude humid basin in South China. Atmos. Res. 2018, 214, 418–429. [Google Scholar] [CrossRef]
  26. Huffman, G.J.; Bolvin, D.T.; Dan, B.; Hsu, K.; Joyce, R.; Kidd, C.; Nelkin, E.J.; Sorooshian, S.; Tan, J.; Xie, P. Algorithm Theoretical Basis Document (ATBD) Version 5.2 NASA Global Precipitation Measurement (GPM) Integrated Multi-satellitE Retrievals for GPM (IMERG); NASA/GSFC: Greenbelt, MD, USA, 2018.
  27. Tan, J.; Peterson, W.A.; Kirstetter, P.E.; Tian, Y. Performance of IMERG as a function of spatiotemporal scale. J. Hydrometeorol. 2017, 18, 307–319. [Google Scholar] [CrossRef] [PubMed]
  28. Gebregiorgis, A.S.; Kirstetter, P.E.; Hong, Y.; Gourley, J.J.; Huffman, G.J.; Peterson, W.A.; Xue, X.W.; Schwaller, M.R. To what extent is the day 1 GPM IMERG satellite precipitation estimate improved as compared to TRMM TMPA-RT? J. Geophys. Res. Atmos. 2018, 123, 1694–1707. [Google Scholar] [CrossRef]
  29. Rozante, J.R.; Vila, D.A.; Chiquetto, J.B.; Fernandes, A.A.; Alvim, D.S. Evaluation of TRMM/GPM Blended Daily Products over Brazil. Remote Sens. 2018, 10, 882. [Google Scholar] [CrossRef]
  30. Dezfuli, A.K.; Ichoku, C.M.; Mohr, K.I.; Huffman, G.J. Precipitation characteristics in West and East Africa from satellite and in situ observations. J. Hydrometeorol. 2017, 18, 1799–1805. [Google Scholar] [CrossRef]
  31. Anjum, M.N.; Ding, Y.J.; Shangguan, D.H.; Ahmad, L.; Ijaz, M.W.; Faird, H.U.; Yagoub, Y.E.; Zaman, M.; Adnan, M. Performance evaluation of latest integrated multi-satellite retrievals for global precipitation measurement (IMERG) over the northern highlands of Pakistan. Atmos. Res. 2018, 205, 134–146. [Google Scholar] [CrossRef]
  32. Tan, M.L.; Harrif, S. Comparison of GPM IMERG, TMPA 3B42 and PERSIANN-CDR satellite precipitation products over Malaysia. Atmos. Res. 2018, 203, 63–76. [Google Scholar] [CrossRef]
  33. Prakash, S.; Mitra, A.K.; Pai, D.S.; AghaKouchak, A. From TRMM to GPM: How well can heavy rainfall be detected from space? Adv. Water Resour. 2016, 88, 1–7. [Google Scholar] [CrossRef]
  34. Prakash, S.; Mitra, A.K.; AghaKouchak, A. A preliminary assessment of GPM-based multi-satellite precipitation estimates over a monsoon dominated region. J. Hydrol. 2018, 556, 865–876. [Google Scholar] [CrossRef]
  35. Wang, W.; Lu, H.; Zhao, T.; Jiang, L.; Shi, J. Evaluation and comparison of daily rainfall from latest GPM and TRMM products over the Mekong River basin. IEEE J. Sel. Top. Appl. Earth Obs. Remote Sens. 2017, 10, 2540–2549. [Google Scholar] [CrossRef]
  36. He, Z.; Yang, L.; Tian, F.; Ni, G.; Hou, A.; Lu, H. Intercomparisons of rainfall estimates for TRMM and GPM multisatellite products over the upper Mekong River basin. J. Hydrometeorol. 2017, 18, 413–430. [Google Scholar] [CrossRef]
  37. Sharifi, E.; Steinacker, R.; Saghafian, B. Assessment of GPM-IMERG and other precipitation products against gauge data under different topographic and climatic conditions in Iran: Preliminary results. Remote Sens. 2016, 8, 135. [Google Scholar] [CrossRef]
  38. Siuki, S.K.; Saghafian, B.; Moazami, S. Comprehensive evaluation of 3-hourly TRMM and half-hourly GPM-IMERG satellite precipitation products. Int. J. Remote Sens. 2017, 38, 558–571. [Google Scholar] [CrossRef]
  39. Kim, K.; Park, J.; Baik, J.; Choi, M. Evaluation of topographical and seasonal feature using GPM IMERG and TRMM 3B42 over Far-east Asia. Atmos. Res. 2017, 187, 95–105. [Google Scholar] [CrossRef]
  40. Tang, G.; Ma, Y.; Long, D.; Zhong, L.; Hong, Y. Evaluation of GPM Day-1 IMERG and TMPA Version-7 legacy products over Mainland China at multiple spatiotemporal scales. J. Hydrol. 2016, 533, 152–167. [Google Scholar] [CrossRef]
  41. Guo, H.; Chen, S.; Bao, A.; Behrangi, A.; Hong, Y.; Ndayisaba, F.; Hu, J.; Stepanian, P.M. Early assessment of Integrated Multi-satellite Retrievals for Global Precipitation Measurement over China. Atmos. Res. 2016, 176–177, 121–133. [Google Scholar] [CrossRef]
  42. Ma, Y.; Tang, G.; Long, D.; Yong, B.; Zhong, L.; Wan, W.; Hong, Y. Similarity and error intercomparison of the GPM and its predecessor-TRMM multisatellite precipitation analysis using the best available hourly gauge network over the Tibetan Plateau. Remote Sens. 2016, 8, 569. [Google Scholar] [CrossRef]
  43. Xu, R.; Tian, F.; Yang, L.; Hu, H.; Lu, H.; Hou, A. Ground validation of GPM IMERG and TRMM 3B42V7 rainfall products over southern Tibetan Plateau based on a high-density rain gauge network. J. Geophys. Res. Atmos. 2017, 122, 910–924. [Google Scholar] [CrossRef]
  44. Yuan, F.; Wang, B.; Shi, C.; Cui, W.; Zhao, C.; Liu, Y.; Ren, L.; Zhang, L.; Zhu, Y.; Chen, T.; et al. Evaluation of hydrological utility of IMERG Final run V05 and TMPA 3B42V7 satellite precipitation products in the Yellow River source region, China. J. Hydrol. 2018, 567, 696–711. [Google Scholar] [CrossRef]
  45. Tang, G.; Zeng, Z.; Long, D.; Guo, X.; Yong, B.; Zhang, W.; Hong, Y. Statistical and hydrological homparison between TRMM and GPM level-3 products over a midlatitude basin: Is Day-1 IMERG a good successor of TMPA 3B42V7? J. Hydrometeorol. 2016, 17, 121–137. [Google Scholar] [CrossRef]
  46. Li, N.; Tang, G.; Zhao, P.; Hong, Y.; Gou, Y.; Yang, K. Statistical assessment and hydrological utility of the latest multi-satellite precipitation analysis IMERG in Ganjiang River basin. Atmos. Res. 2017, 183, 212–223. [Google Scholar] [CrossRef]
  47. Yuan, F.; Zhang, L.; Win, K.W.W.; Ren, L.; Zhao, C.; Zhu, Y.; Jiang, S.; Liu, Y. Assessment of GPM and TRMM multi-satellite precipitation products in streamflow simulations in a data-sparse mountainous watershed in Myanmar. Remote Sens. 2017, 9, 302. [Google Scholar] [CrossRef]
  48. Zubieta, R.; Getirana, A.; Espinoza, J.C.; Lavado-Casimiro, W.; Aragon, L. Hydrological modeling of the Peruvian-Ecuadorian Amazon Basin using GPM-IMERG satellite-based precipitation dataset. Hydrol. Earth Syst. Sci. 2017, 21, 3543–3555. [Google Scholar] [CrossRef]
  49. Sharif, H.O.; Al-Zahrani, M.; Hassan, A.E. Physically, fully-distributed hydrological simulations driven by GPM satellite rainfall over an urbanizing arid catchment in Saudi Arabia. Water 2017, 9, 163. [Google Scholar] [CrossRef]
  50. Tan, M.L.; Samat, N.; Chan, N.W.; Roy, R. Hydro-Meteorological Assessment of Three GPM Satellite Precipitation Products in the Kelantan River Basin, Malaysia. Remote Sens. 2018, 10, 1011. [Google Scholar] [CrossRef]
  51. Saber, M.; Hamaguchi, T.; Kojiri, T.; Tanaka, K.; Sumi, T. A physically based distributed hydrological model of wadi system to simulate flash floods in arid regions. Arab. J. Geosci. 2015, 8, 143–160. [Google Scholar] [CrossRef]
  52. Ryo, M.; Valeriano, O.C.S.; Kanae, S.; Ngoc, T.D. Temporal Downscaling of Daily Gauged Precipitation by Application of a Satellite Product for Flood Simulation in a Poorly Gauged Basin and Its Evaluation with Multiple Regression Analysis. J. Hydrometeorol. 2014, 15, 563–580. [Google Scholar] [CrossRef]
  53. Shahzad, A.S.; Gabriel, H.F.; Haider, S.; Mubeen, A.; Siddiqui, M.J. Development of a flood forecasting system using IFAS: A case study of scarcely gauged Jhelum and Chenab river basins. Arab. J. Geosci. 2018, 11, 383. [Google Scholar] [CrossRef]
  54. Sugiura, A.; Fujioka, S.; Nabesaka, S.; Tsuda, M.; Iwami, Y. Development of a flood forecasting system on the upper Indus catchment using IFAS. J. Flood Risk Manag. 2016, 9, 265–277. [Google Scholar] [CrossRef]
  55. Pham, N.T.T.; Nguyen, Q.H.; Ngo, A.D.; Le, H.T.T.; Nguyen, C.T. Investigating the impacts of typhoon-induced floods on the agriculture in the central region of Vietnam by using hydrological models and satellite data. Nat. Hazards 2018, 92, 189–204. [Google Scholar] [CrossRef]
  56. Kim, J.P.; Jung, I.W.; Park, K.W.; Yoon, S.K.; Lee, D. Hydrological Utility and Uncertainty of Multi-Satellite Precipitation Products in the Mountainous Region of South Korea. Remote Sens. 2016, 8, 608. [Google Scholar] [CrossRef]
  57. Gosset, M.; Viarre, J.; Quantin, G.; Alcoba, M. Evaluation of several rainfall products used for hydrological applications over West Africa using two high-resolution gauge networks. Q. J. R. Meteorol. Soc. 2013, 139, 923–940. [Google Scholar] [CrossRef] [Green Version]
  58. Zeng, Z.; Tang, G.; Hong, Y.; Zeng, C.; Yang, Y. Development of an NRCS curve number global dataset using the latest geospatial remote sensing data for worldwide hydrologic applications. Remote Sens. Lett. 2017, 8, 528–536. [Google Scholar] [CrossRef]
  59. Latt, Z.Z.; Wittenberg, H. Improving flood forecasting in a developing country: A comparative study of stepwise multiple linear regression and artificial neural network. Water Resour. Manag. 2014, 28, 2109–2128. [Google Scholar] [CrossRef]
  60. Latt, Z.Z.; Wittenberg, H.; Urban, B. Clustering hydrological homogeneous regions and neural network based index flood estimation for ungauged catchments: An example of the Chindwin River in Myanmar. Water Resour. Manag. 2014, 29, 913–918. [Google Scholar] [CrossRef]
  61. Latt, Z.Z.; Wittenberg, H. Hydrology and flood probability of the monsoon-dominated Chindwin River in northern Myanmar. J. Water Clim. Chang. 2015, 6, 144–160. [Google Scholar] [CrossRef]
  62. Latt, Z.Z. Application of feedforward artificial neural network in Muskingum flood routing: A black-box forecasting approach for a natural river system. Water Resour. Manag. 2015, 29, 4995–5014. [Google Scholar] [CrossRef]
  63. TRMM Website. Available online: https://pmm.nasa.gov/TRMM (accessed on 20 October 2018).
  64. GPM Website. Available online: https://pmm.nasa.gov/GPM (accessed on 20 October 2018).
  65. JAXA Global Rainfall Watch Website. Available online: http://sharaku.eorc.jaxa.jp/GSMaP/index.htm (accessed on 20 October 2018).
  66. Yuan, F.; Ren, L.; Yu, Z. A river flow routing model based on digital drainage network. J. Hydrodyn. 2005, 17, 483–488. [Google Scholar]
  67. Zhao, R. The Xinanjiang model applied in China. J. Hydrol. 1992, 135, 371–381. [Google Scholar]
  68. Hargreaves, G.H.; Samni, Z.A. Estimation of potential evapotranspiration. J. Irrig. Drain. Div. 1982, 108, 223–230. [Google Scholar]
  69. Duan, Q.; Soorooshian, S.; Gupta, V. Effective and efficient global optimization for conceptual rainfall-runoff models. Water Resour. Res. 1992, 28, 1015–1031. [Google Scholar] [CrossRef]
  70. Duan, Q.; Gupta, V.K.; Sorooshian, S. A shuffled complex evolution approach for effective and efficient global minimization. J. Optim. Method Appl. 1993, 76, 501–521. [Google Scholar] [CrossRef]
  71. Chu, W.; Gao, X.; Sorrooshian, S. Improving the shuffled complex evolution scheme for optimization of complex nonlinear hydrological systems: Application to the calibration of the Sacramento soil-moisture accounting model. Water Resour. Res. 2010, 46, W09530. [Google Scholar] [CrossRef]
  72. Zhao, H.; Yang, B.; Yang, S.; Huang, Y.; Dong, G.; Bai, J.; Wang, Z. Systematical estimation of GPM-based global satellite mapping of precipitation products over China. Atmos. Res. 2018, 201, 206–217. [Google Scholar] [CrossRef]
  73. Guo, H.; Bao, A.; Ndayisaba, F.; Liu, T.; Kurban, A.; De Meayer, P. Systematical Evaluation of Satellite Precipitation Estimates Over Central Asia Using an Improved Error-Component Procedure. J. Geophys. Res. Atmos. 2017, 122, 10906–10927. [Google Scholar] [CrossRef]
  74. Islam, M.A. Statistical comparison of satellite-retrieved precipitation products with rain gauge observations over Bangladesh. Int. J. Remote Sens. 2018, 39, 2906–2936. [Google Scholar] [CrossRef]
  75. Global Precipitation Measurement (GPM) GSMaP Product V04 (Algorithm version 7) Release Note. Available online: http://www.eorc.jaxa.jp/GPM/doc/product_info/release_note_gsmapv04-v7_en.pdf (accessed on 20 October 2018).
  76. Climate Prediction Center Unified Gauge-Based Analysis of Global Daily Precipitation Data Set Website. Available online: http://ftp.cpc.ncep.noaa.gov/precip/CPC_UNI_PRCP/GAUGE_GLB/ (accessed on 20 October 2018).
  77. Global Precipitation Climatology Centre Gridded Gauge-Analysis Precipitation Data Set Website. Available online: https://kunden.dwd.de/GPCC/Visualizer (accessed on 20 October 2018).
  78. Ning, S.; Wang, J.; Jin, J.; Ishidaira, H. Assessment of the Latest GPM-Era High-Resolution Satellite Precipitation Products by Comparison with Observation Gauge Data over the Chinese Mainland. Water 2016, 8, 481. [Google Scholar] [CrossRef]
  79. Ning, S.; Song, F.; Udmale, P.; Jin, J.; Thapa, B.R.; Ishidaira, H. Error Analysis and Evaluation of the Latest GSMap and IMERG Precipitation Products over Eastern China. Adv. Meteorol. 2017, 2017, 1803492. [Google Scholar] [CrossRef]
  80. Tang, G.; Zeng, Z.; Ma, M.; Liu, R.; Wen, Y.; Hong, Y. Can Near-Real-Time Satellite Precipitation Products Capture Rainstorms and Guide Flood Warning for the 2016 Summer in South China? IEEE Geosci. Remote Sens. Lett. 2017, 14, 1208–1212. [Google Scholar] [CrossRef]
  81. Ma, Y.; Yang, Y.; Han, Z.; Tang, G.; Maguire, L.; Chu, Z.; Hong, Y. Comprehensive evaluation of Ensemble Multi-Satellite Precipitation Dataset using the Dynamic Bayesian Model Averaging scheme over the Tibetan plateau. J. Hydrol. 2018, 556, 634–644. [Google Scholar] [CrossRef]
  82. Beck, H.E.; van Dijk, A.I.J.M.; Levizzani, V.; Schellekens, J.; Miralles, D.G.; Martens, B.; de Roo, A. MSWEP: 3-hourly 0.25 global gridded precipitation (1979–2015) by merging gauge, satellite, and reanalysis data. Hydrol. Earth Syst. Sci. 2017, 21, 589–615. [Google Scholar] [CrossRef]
  83. Yuan, F.; Ren, L. Application of the Xinanjiang vegetation-hydrology model to streamflow simulation over the Hanjiang River basin. In Hydrology in Mountain Regions: Observations, Processes and Dynamics. IAHS Proceedings and Reports; Marks, D., Hock, R., Lehning, M., Hayashi, M., Gurney, R., Eds.; IAHS Press: Wallingford, UK, 2009; Volume 326, pp. 63–69. [Google Scholar]
  84. Shi, P.; Rui, X.; Qu, S.; Chen, X. Calculating storage capacity with topographic index. Adv. Water Sci. 2008, 19, 264–267. (In Chinese) [Google Scholar]
  85. Tian, Y.; Peters-Lidard, C.D.; Eylander, J.B.; Joyce, R.J.; Huffman, G.J.; Adler, R.F.; Hsu, K.; Turk, F.J.; Garcia, M.; Zeng, J. Component analysis of errors in satellite-based precipitation estimates. J. Geophys. Res. Atmos. 2009, 114, D24101. [Google Scholar] [CrossRef]
Figure 1. Location of the Chindwin River basin.
Remotesensing 11 00140 g001
Figure 2. Spatial distribution of total precipitation depth estimated from the gauge-based gridded precipitation data set and eight SPPs during the period 1 April 2014–31 December 2016.
Remotesensing 11 00140 g002
Figure 3. Diagram of the assessment framework in this study.
Remotesensing 11 00140 g003
Figure 4. Statistical indices of the precipitation estimates from eight SPPs at seven weather stations in the Chindwin River basin in the period of 1 April 2014–31 December 2016.
Remotesensing 11 00140 g004
Figure 5. Histograms of the eight satellite precipitation estimates at seven stations in the Chindwin River basin in contrast with the observations (1 April 2014–31 December 2016): (a) 3-hourly daytime precipitation and (b) 12-hourly nighttime precipitation.
Remotesensing 11 00140 g005
Figure 6. Taylor diagrams showing the comparison of the eight SPPs at the locations of the seven gauges in the Chindwin River basin with respect to the gauge observations (1 April 2014–31 December 2016): (a) 3-hourly daytime precipitation and (b) 12-hourly nighttime precipitation.
Remotesensing 11 00140 g006
Figure 7. Non-exceedance frequency distributions of the 3-hourly watershed-averaged precipitation estimates from the rain-gauge-based precipitation data and eight SPPs.
Remotesensing 11 00140 g007
Figure 8. Comparison of the measured and simulated 3-hourly hydrographs at the Monywa hydrological station using the rain-gauge-based gridded precipitation data set, 3B42RT, 3B42V7, and IMERG-F SPPs in the calibration (1 April 2014–31 December 2015) and validation periods (1 January 2016–31 December 2016) under two simulation scenarios.
Remotesensing 11 00140 g008
Figure 9. Performance of 3-hourly discharge simulations from 1 April 2014 to 31 December 2016 at the Monywa hydrological station using the rain-gauge-based gridded precipitation data set, 3B42RT, 3B42V7, and IMERG-F SPPs under two simulation scenarios.
Remotesensing 11 00140 g009
Figure 10. Comparison of the observed and simulated discharge–duration curves using the rain-gauge-based precipitation data, 3B42RT, 3B42V7, and IMERG-F SPPs under two simulation scenarios: (a) Scenario I and (b) Scenario II.
Remotesensing 11 00140 g010
Figure 11. Taylor diagrams of the simulated discharge comparison at the Monywa station using the rain-gauge-based precipitation data set, 3B42RT, 3B42V7, and IMERG-F SPPs based on the observed discharge data: (a) Scenario I and (b) Scenario II.
Remotesensing 11 00140 g011
Table 1. Diagnostic statistics of the basin-averaged 3-hourly precipitation estimates from the eight SPPs from 1 April 2014 to 31 December 2016.
Satellite Precipitation ProductsDiagnostic Statistics
BIAS (%)CCRMSE (mm)
3B42RT11.10.2813.0
3B42V7−4.80.2773.0
IMERG-E−27.00.3232.9
IMERG-L−30.60.3192.9
IMERG-F−6.80.3302.9
GSMaP-NRT−37.60.2323.0
GSMaP-MVK−28.70.2113.1
GSMaP-GAUGE−39.00.2153.0
Table 2. Performance of four major flood event simulations at the Monywa station using the rain-gauge-based precipitation data, 3B42RT, 3B42V7, and IMERG-F SPPs under two simulation scenarios.
Flood EventsPrecipitation Inputs Scenario IScenario II
Q p o (m3/s) Q p s (m3/s)BIASp (%)PTE (h) Q p s (m3/s)BIASp (%)PTE (h)
20140523Rain Gauge18,00012,586−30.1−48
3B42RT24,47136.0−1521,85221.4−9
3B42V713,284−26.2−1218,1981.1−6
IMERG-F12,424−31.0−916,385−9.0−9
20150803Rain Gauge23,50017,818−24.266
3B42RT19,478−17.1−917,170−26.9−12
3B42V711,201−52.3−2415,208−35.3−27
IMERG-F11,073−52.91514,576−38.0−36
20150908Rain Gauge21,55024,43213.424
3B42RT24,25712.6−3021,6720.6−18
3B42V715,711−27.1−2119,677−8.715
IMERG-F15,347−28.82420,181−6.418
20160803Rain Gauge20,66020,162−2.4−36
3B42RT16,499−20.1−7515,999−22.6−63
3B42V711,229−45.7−7215,845−23.3−69
IMERG-F12,387−40.0−6617,096−17.2−63

