Measuring Urban Subsidence in the Rome Metropolitan Area (Italy) with Sentinel-1 SNAP-StaMPS Persistent Scatterer Interferometry

Abstract
1. Introduction
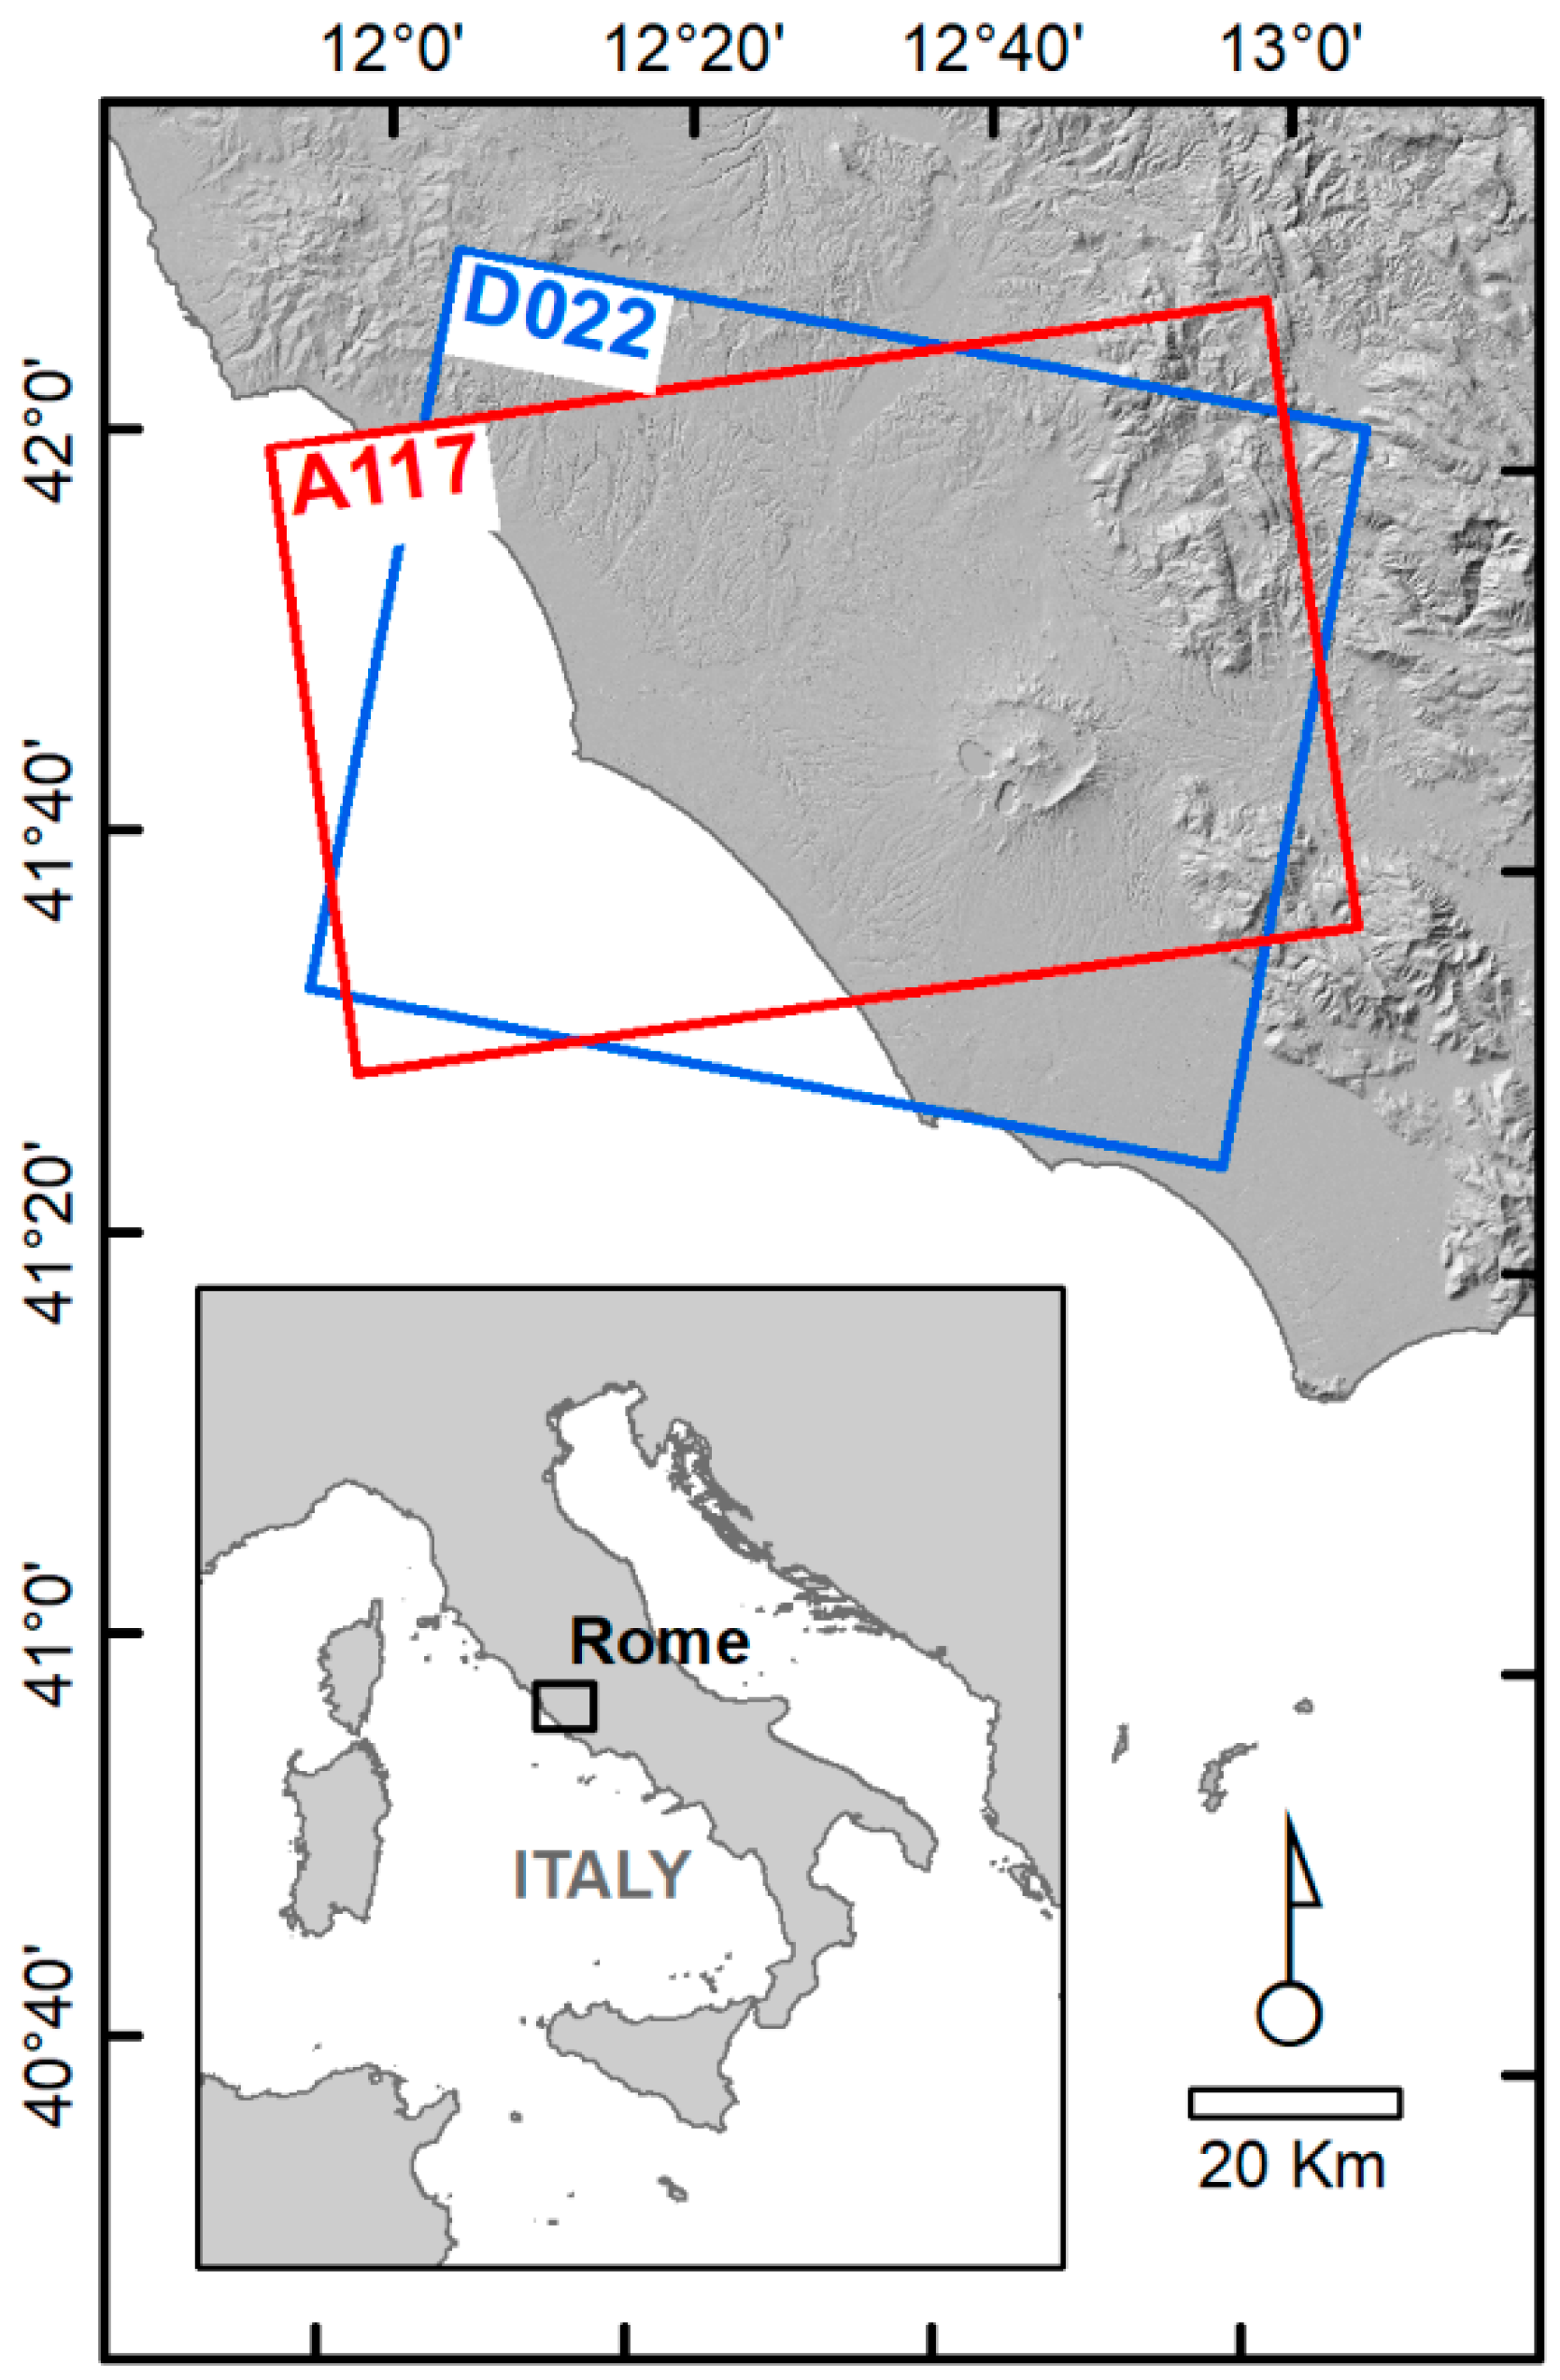
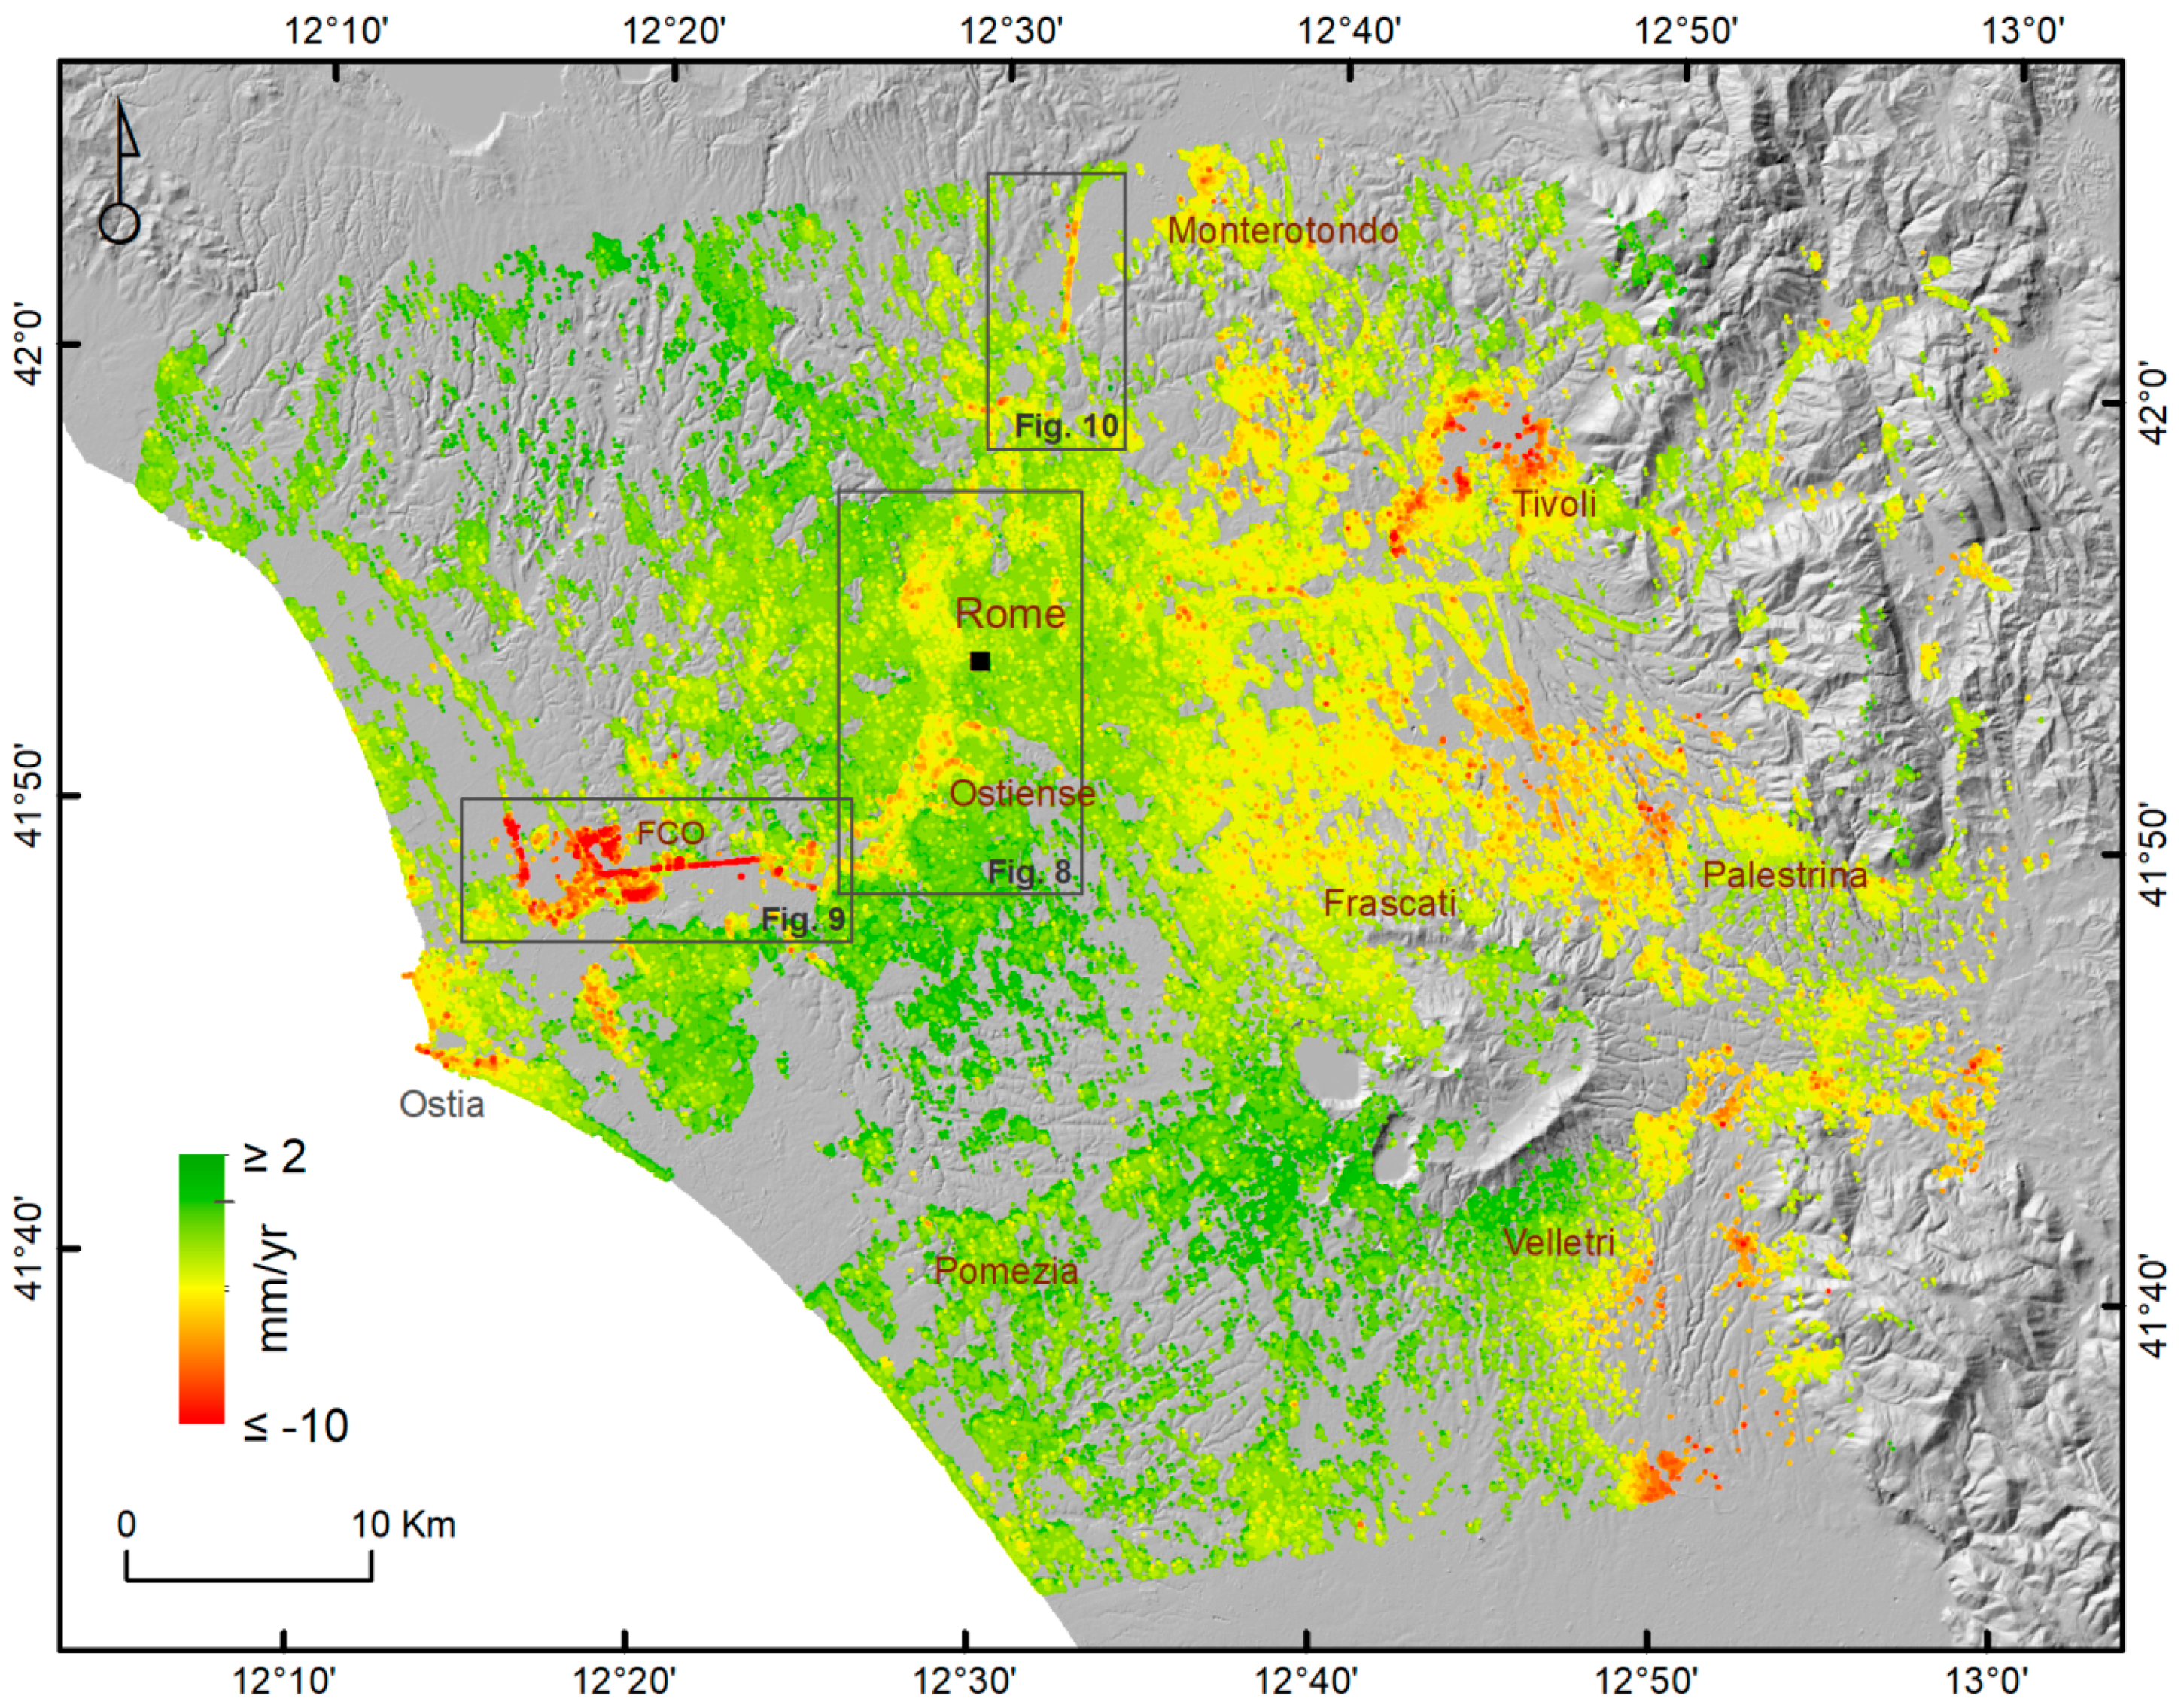
1.1. Study Area
2. Materials and Methods
2.1. Open Source Toolboxes
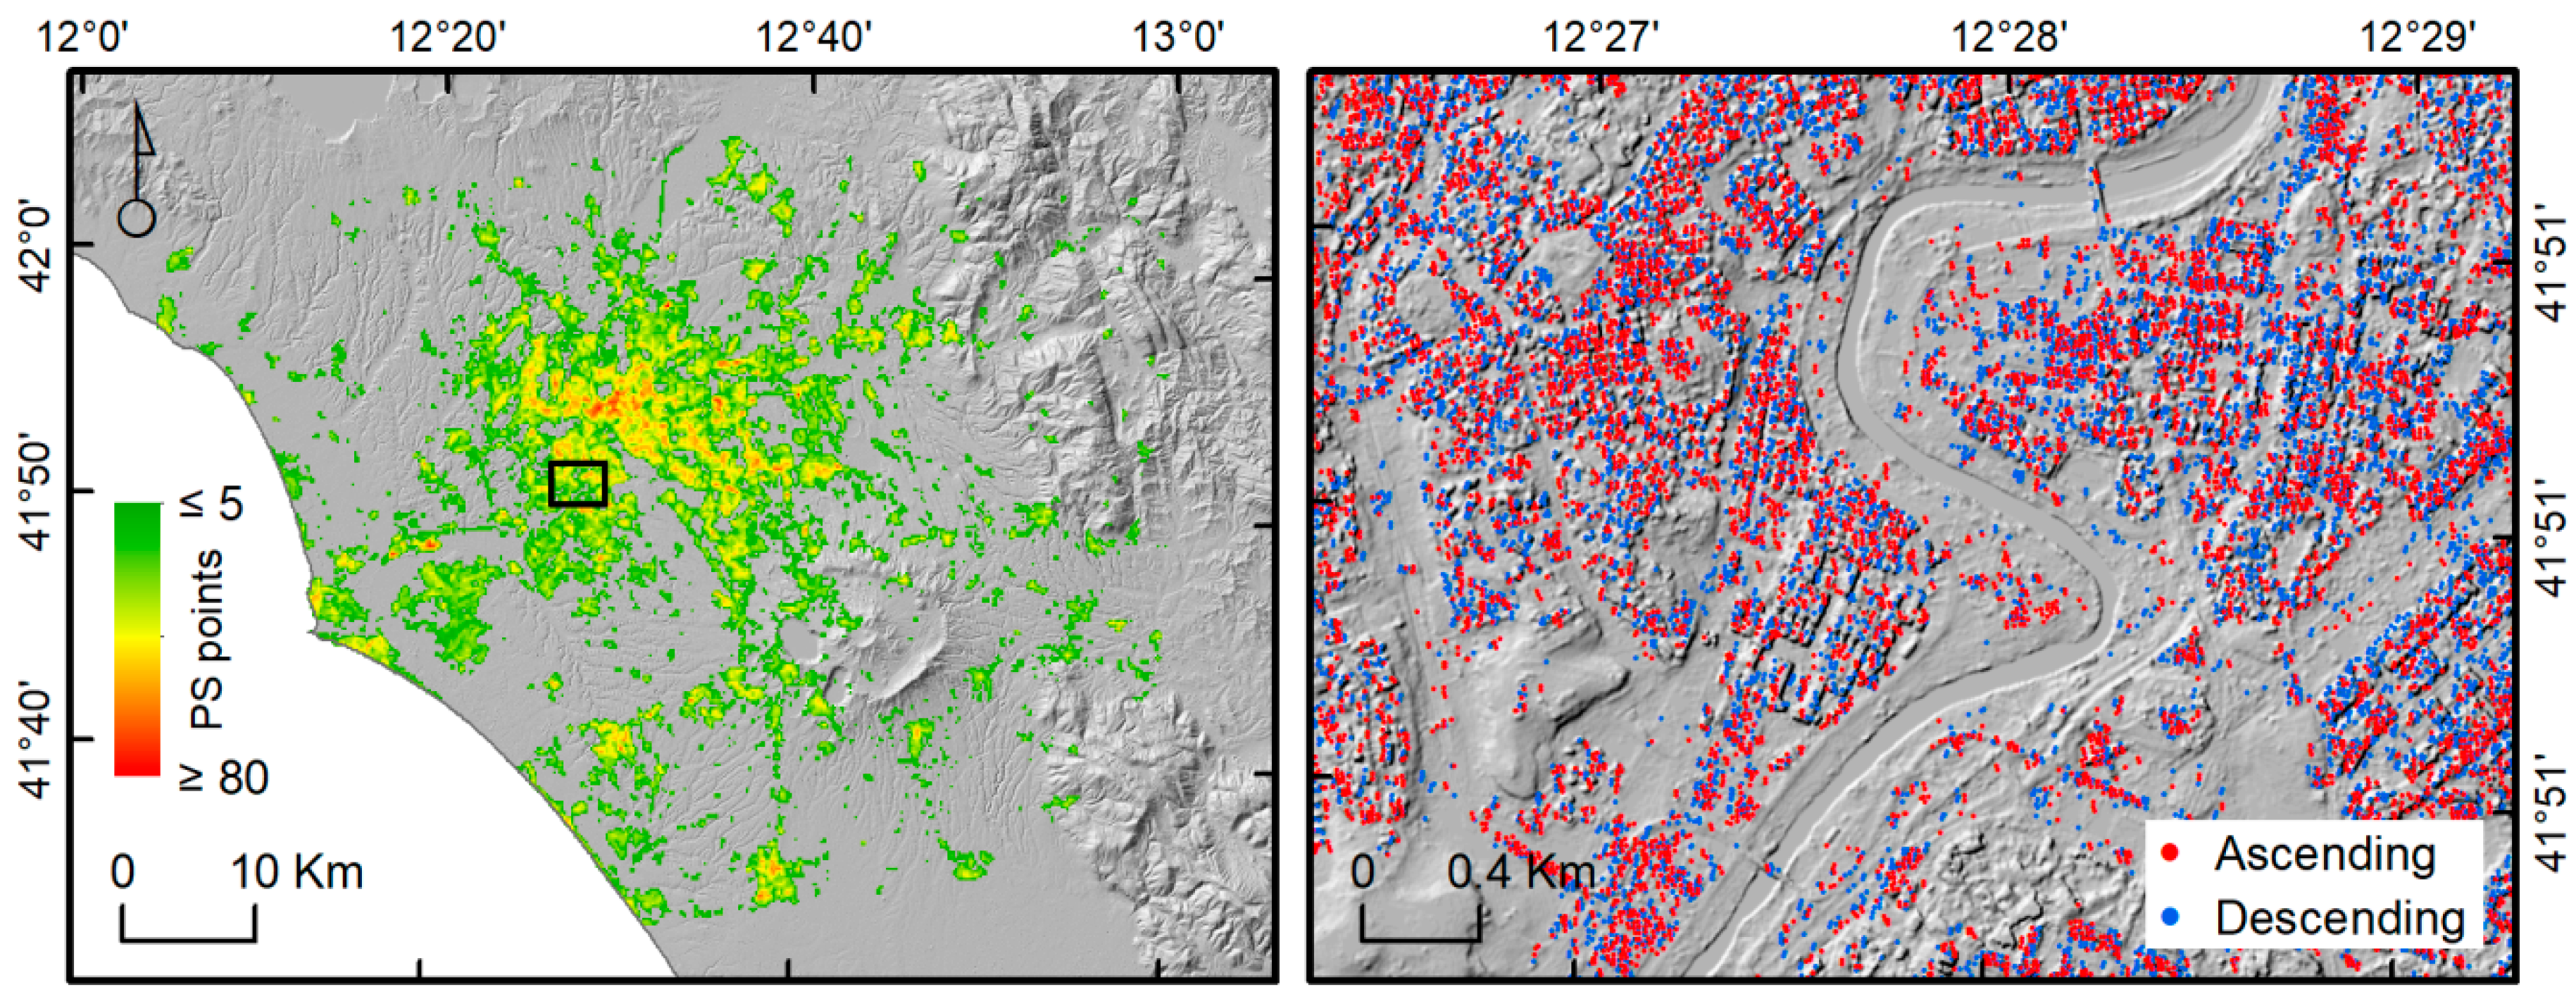
2.2. Data and Processing
2.2.1. Copernicus Sentinel-1 Data
2.2.2. SNAP-StaMPS PSI Processing
- Slave preparation. In this step, the Sentinel-1 Single Look Complex (SLC) data are sorted by acquisition date while checking if SLC assembly (concatenation procedure) is necessary, depending on whether the defined AOI is covered by more than one scene per acquisition date.
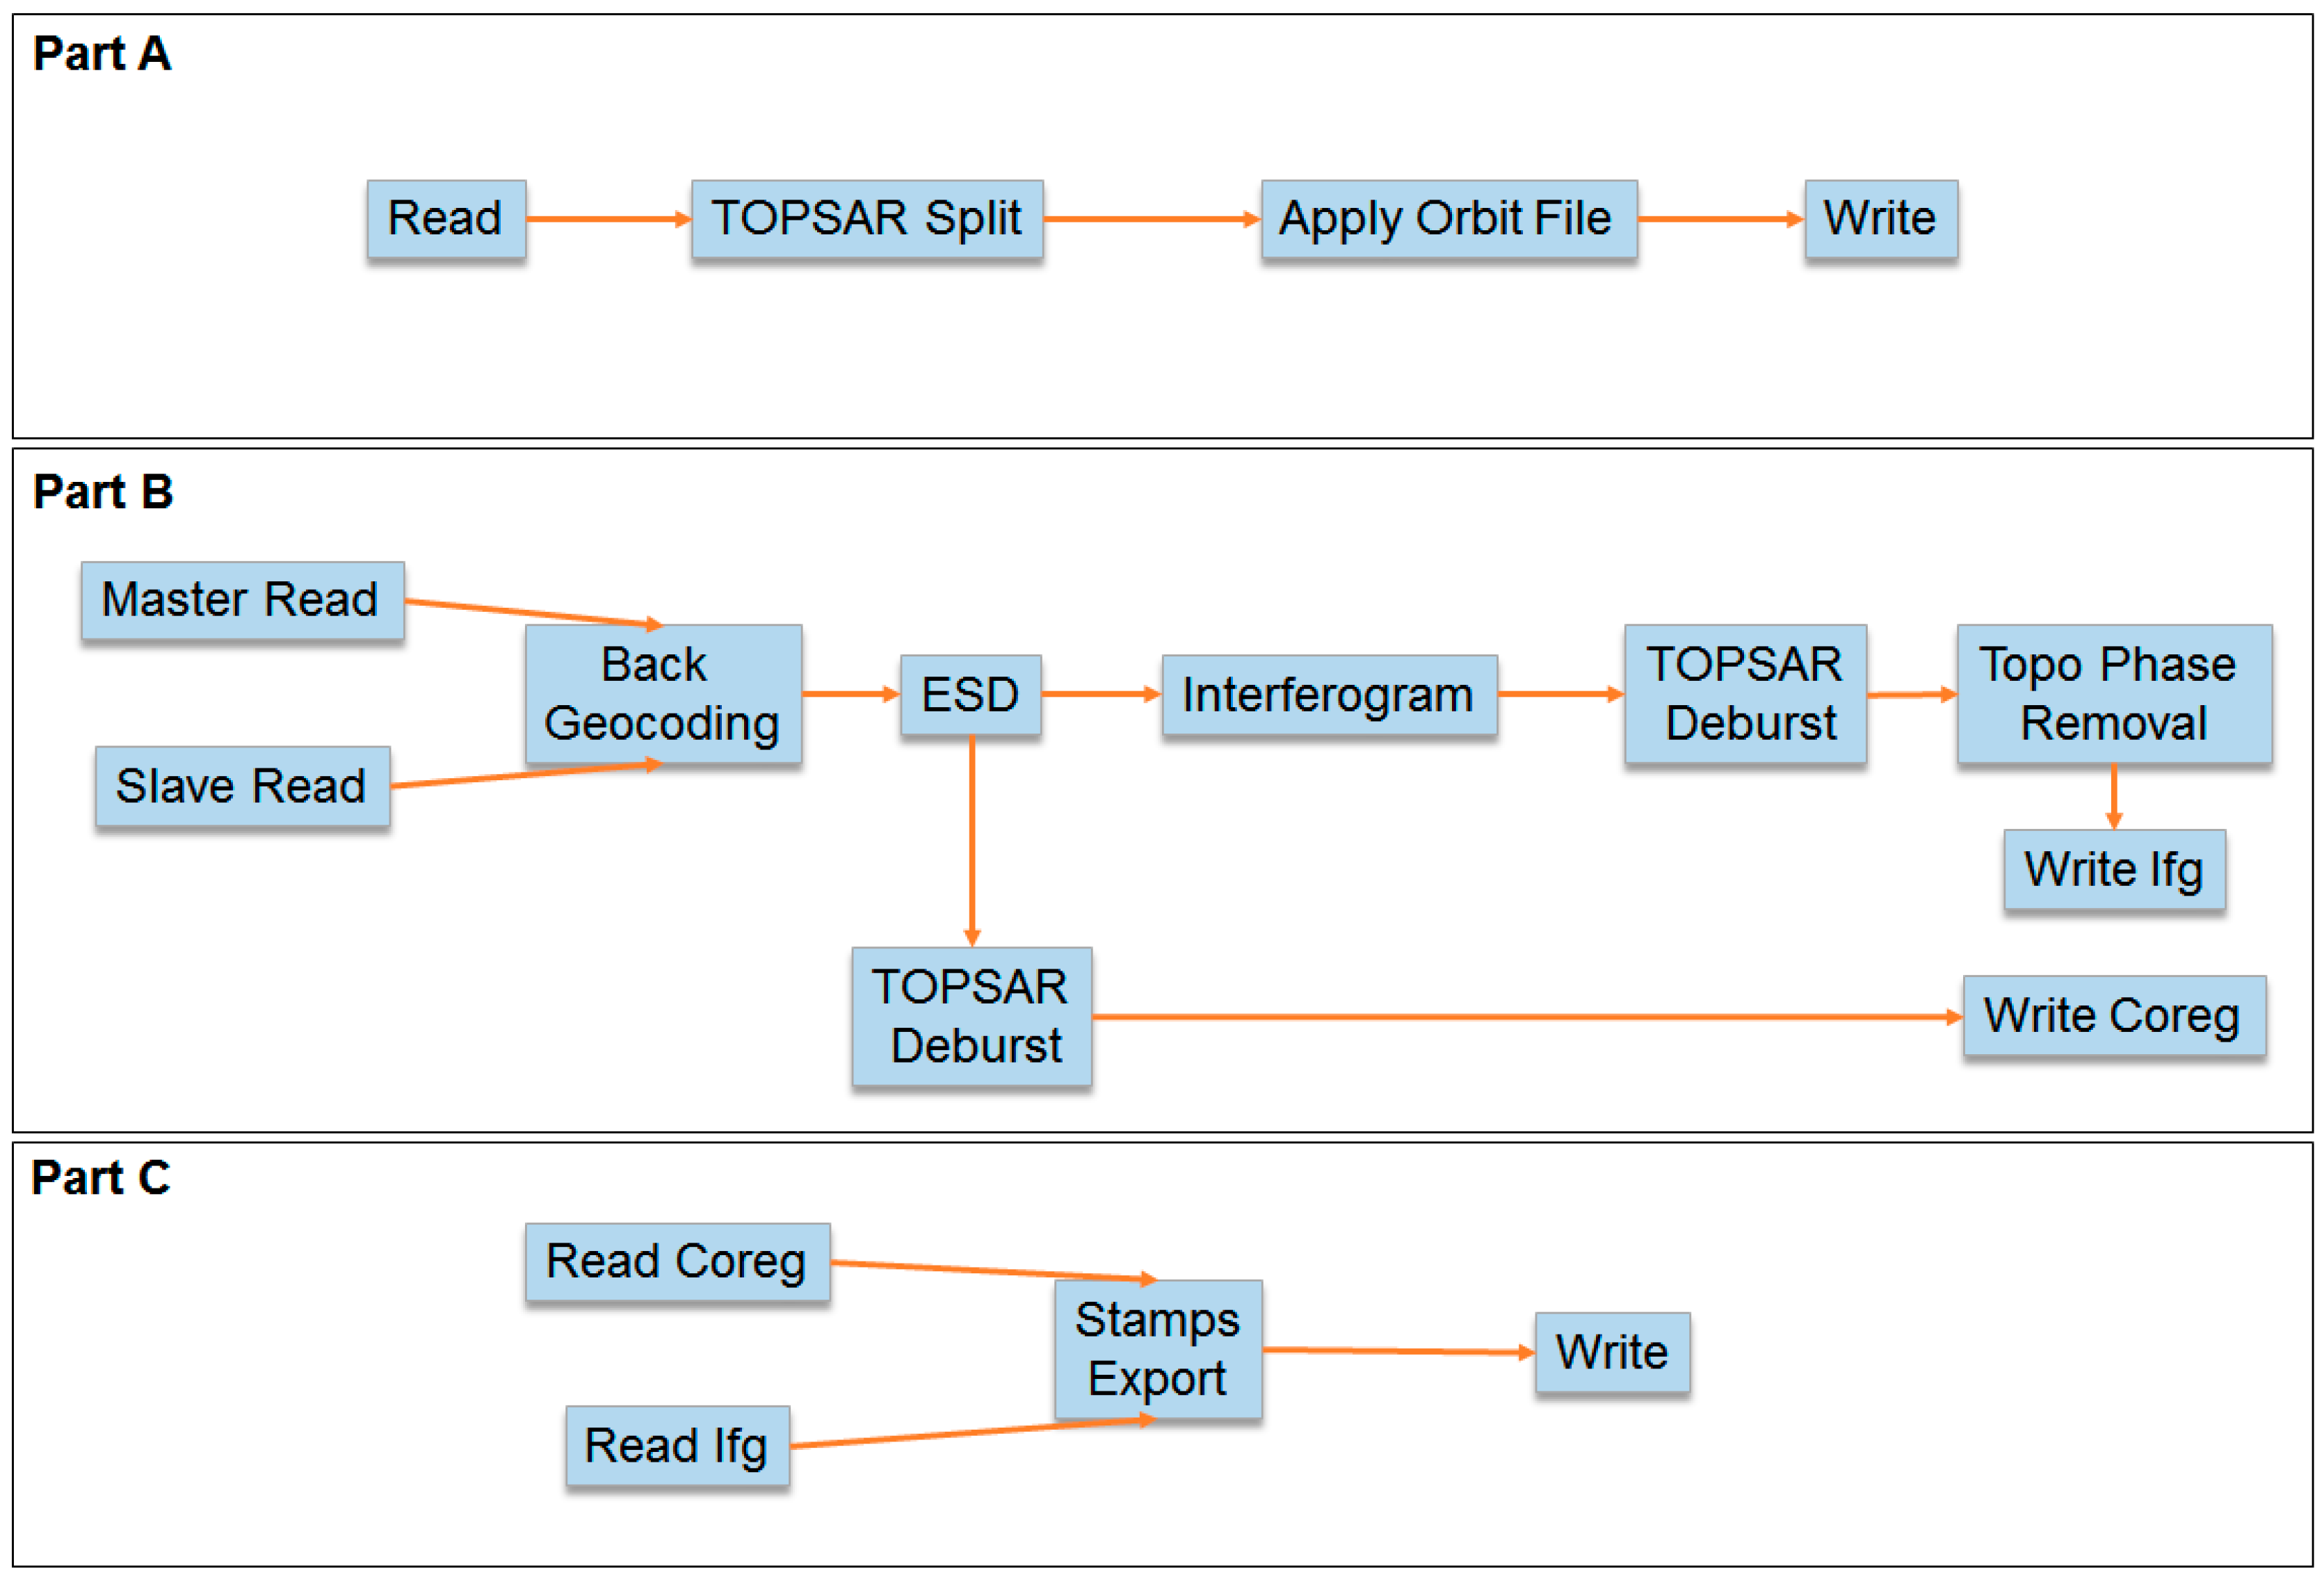
- Slave splitting. To enable processing in batch mode, the SNAP Graph Processing Tool (GPT) is used, which runs already-defined processing chains (graphs in xml format). For this step, the TOPSAR-Splitting and Apply Orbit operators are called, to update the annotated orbit information with more precise ones according to their availability (restituted or precise). These orbits are automatically downloaded by SNAP. The corresponding graph is illustrated in Figure 2, part A.
- Coregistration and interferogram computation. This is the most computationally demanding step, as it performs the coregistration of the TOPSAR data (Back-geocoding with Enhanced Spectral Diversity [26] refinement) and produces the interferograms with the Flat-Earth and topographic phase contributions removed. Optionally, a finer subset can be applied over an AOI, as defined in the project configuration file. If no information is provided by the user, the full burst interferograms are generated. The outputs of this step are two debursted stacks of master-slave Single Look Complex (SLC) files and the master-slave interferogram. Supplementary data files required by StaMPS are also generated, including elevation band and orthorectified latitude and longitude coordinates as independent products. The graph employed for this step is shown in Figure 2, part B.
- Stamps export. This is the final step of the single master DInSAR processing, which converts previous processing results into binary raster files compatible with StaMPS readers. Graph shown in Figure 2, part C.
2.2.3. Post-Processing
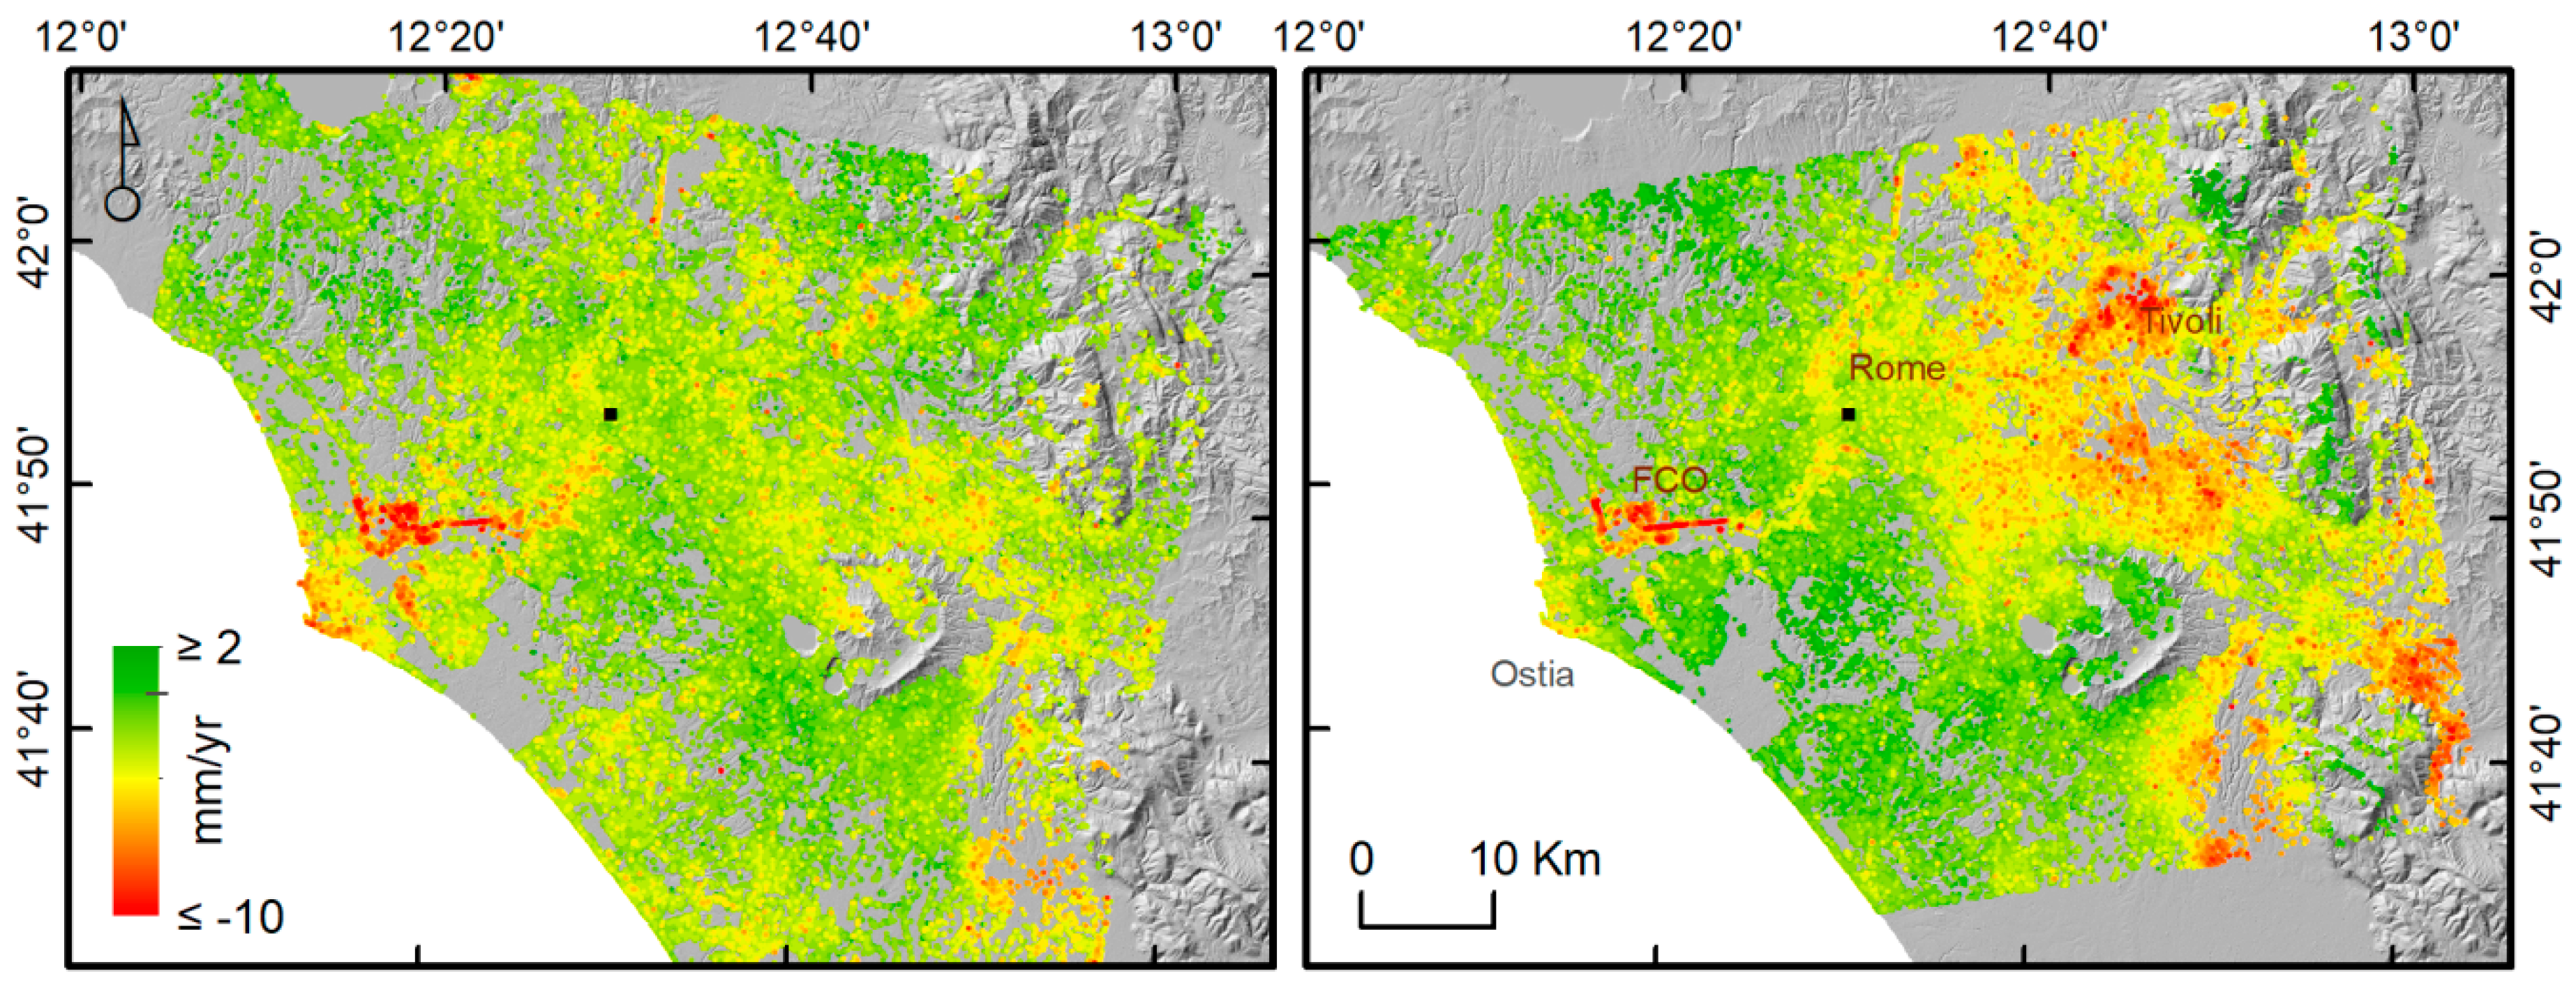
3. Results
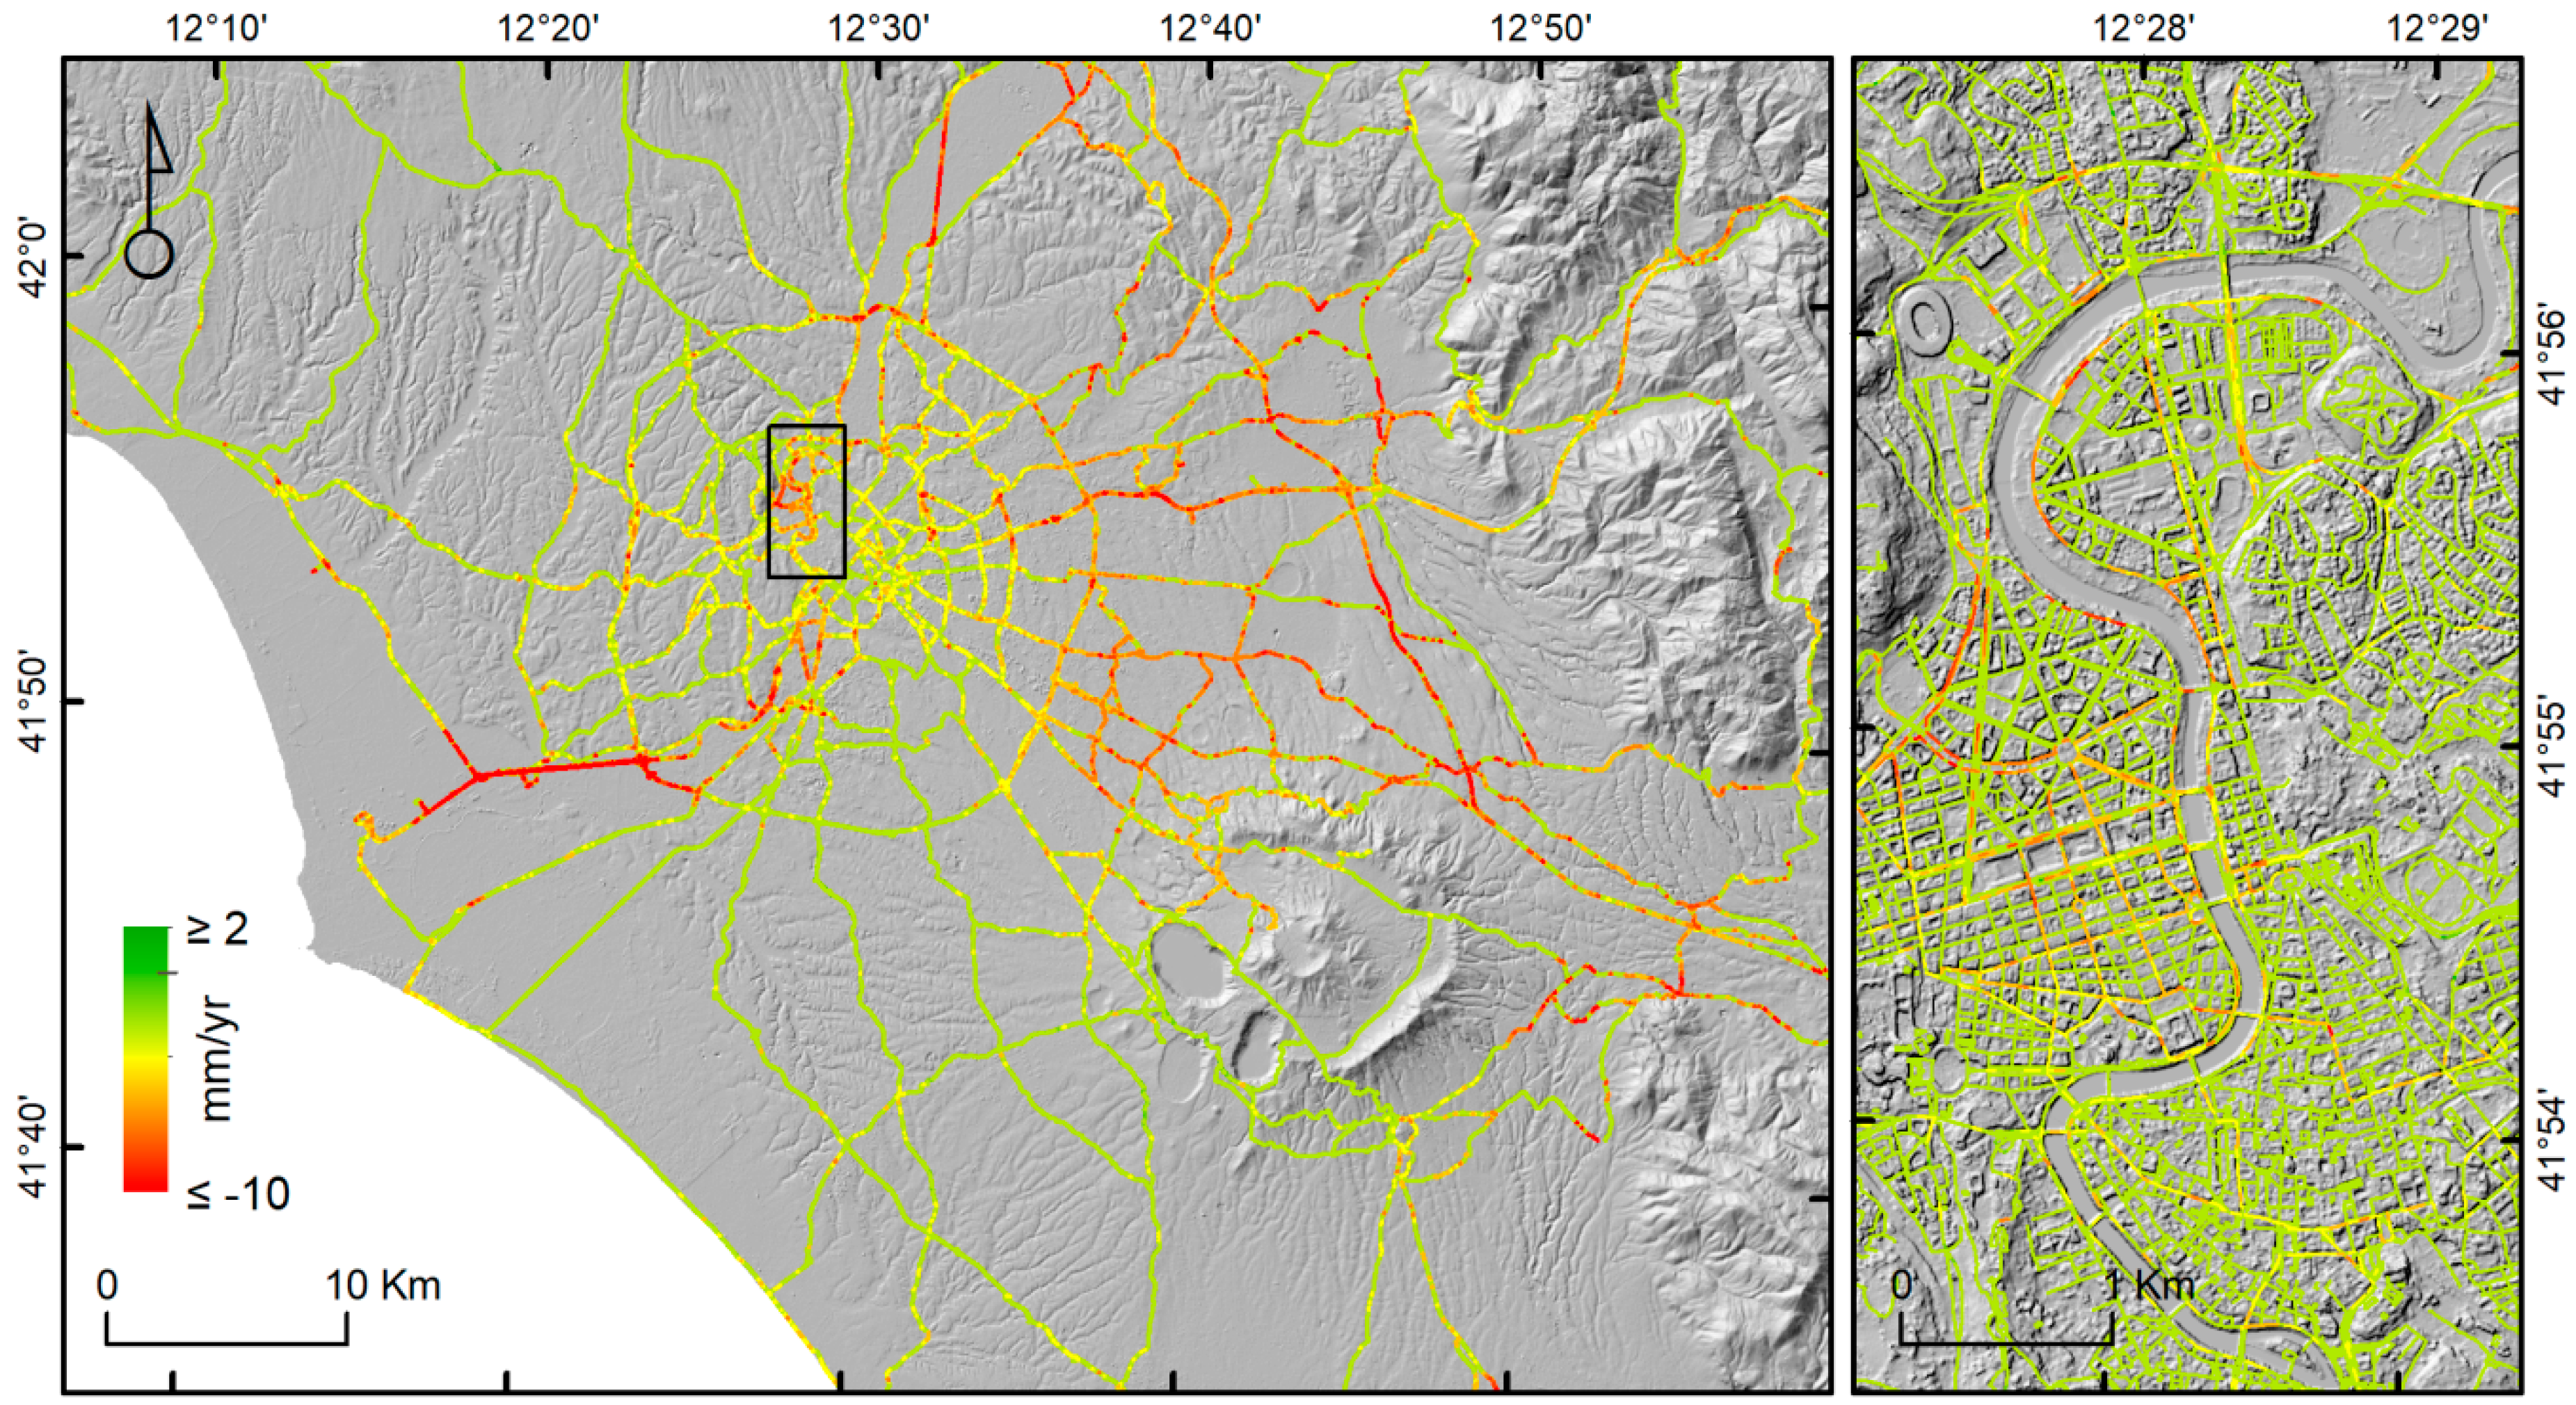
3.1. Critical Urban Infrastructures: Global Road Network
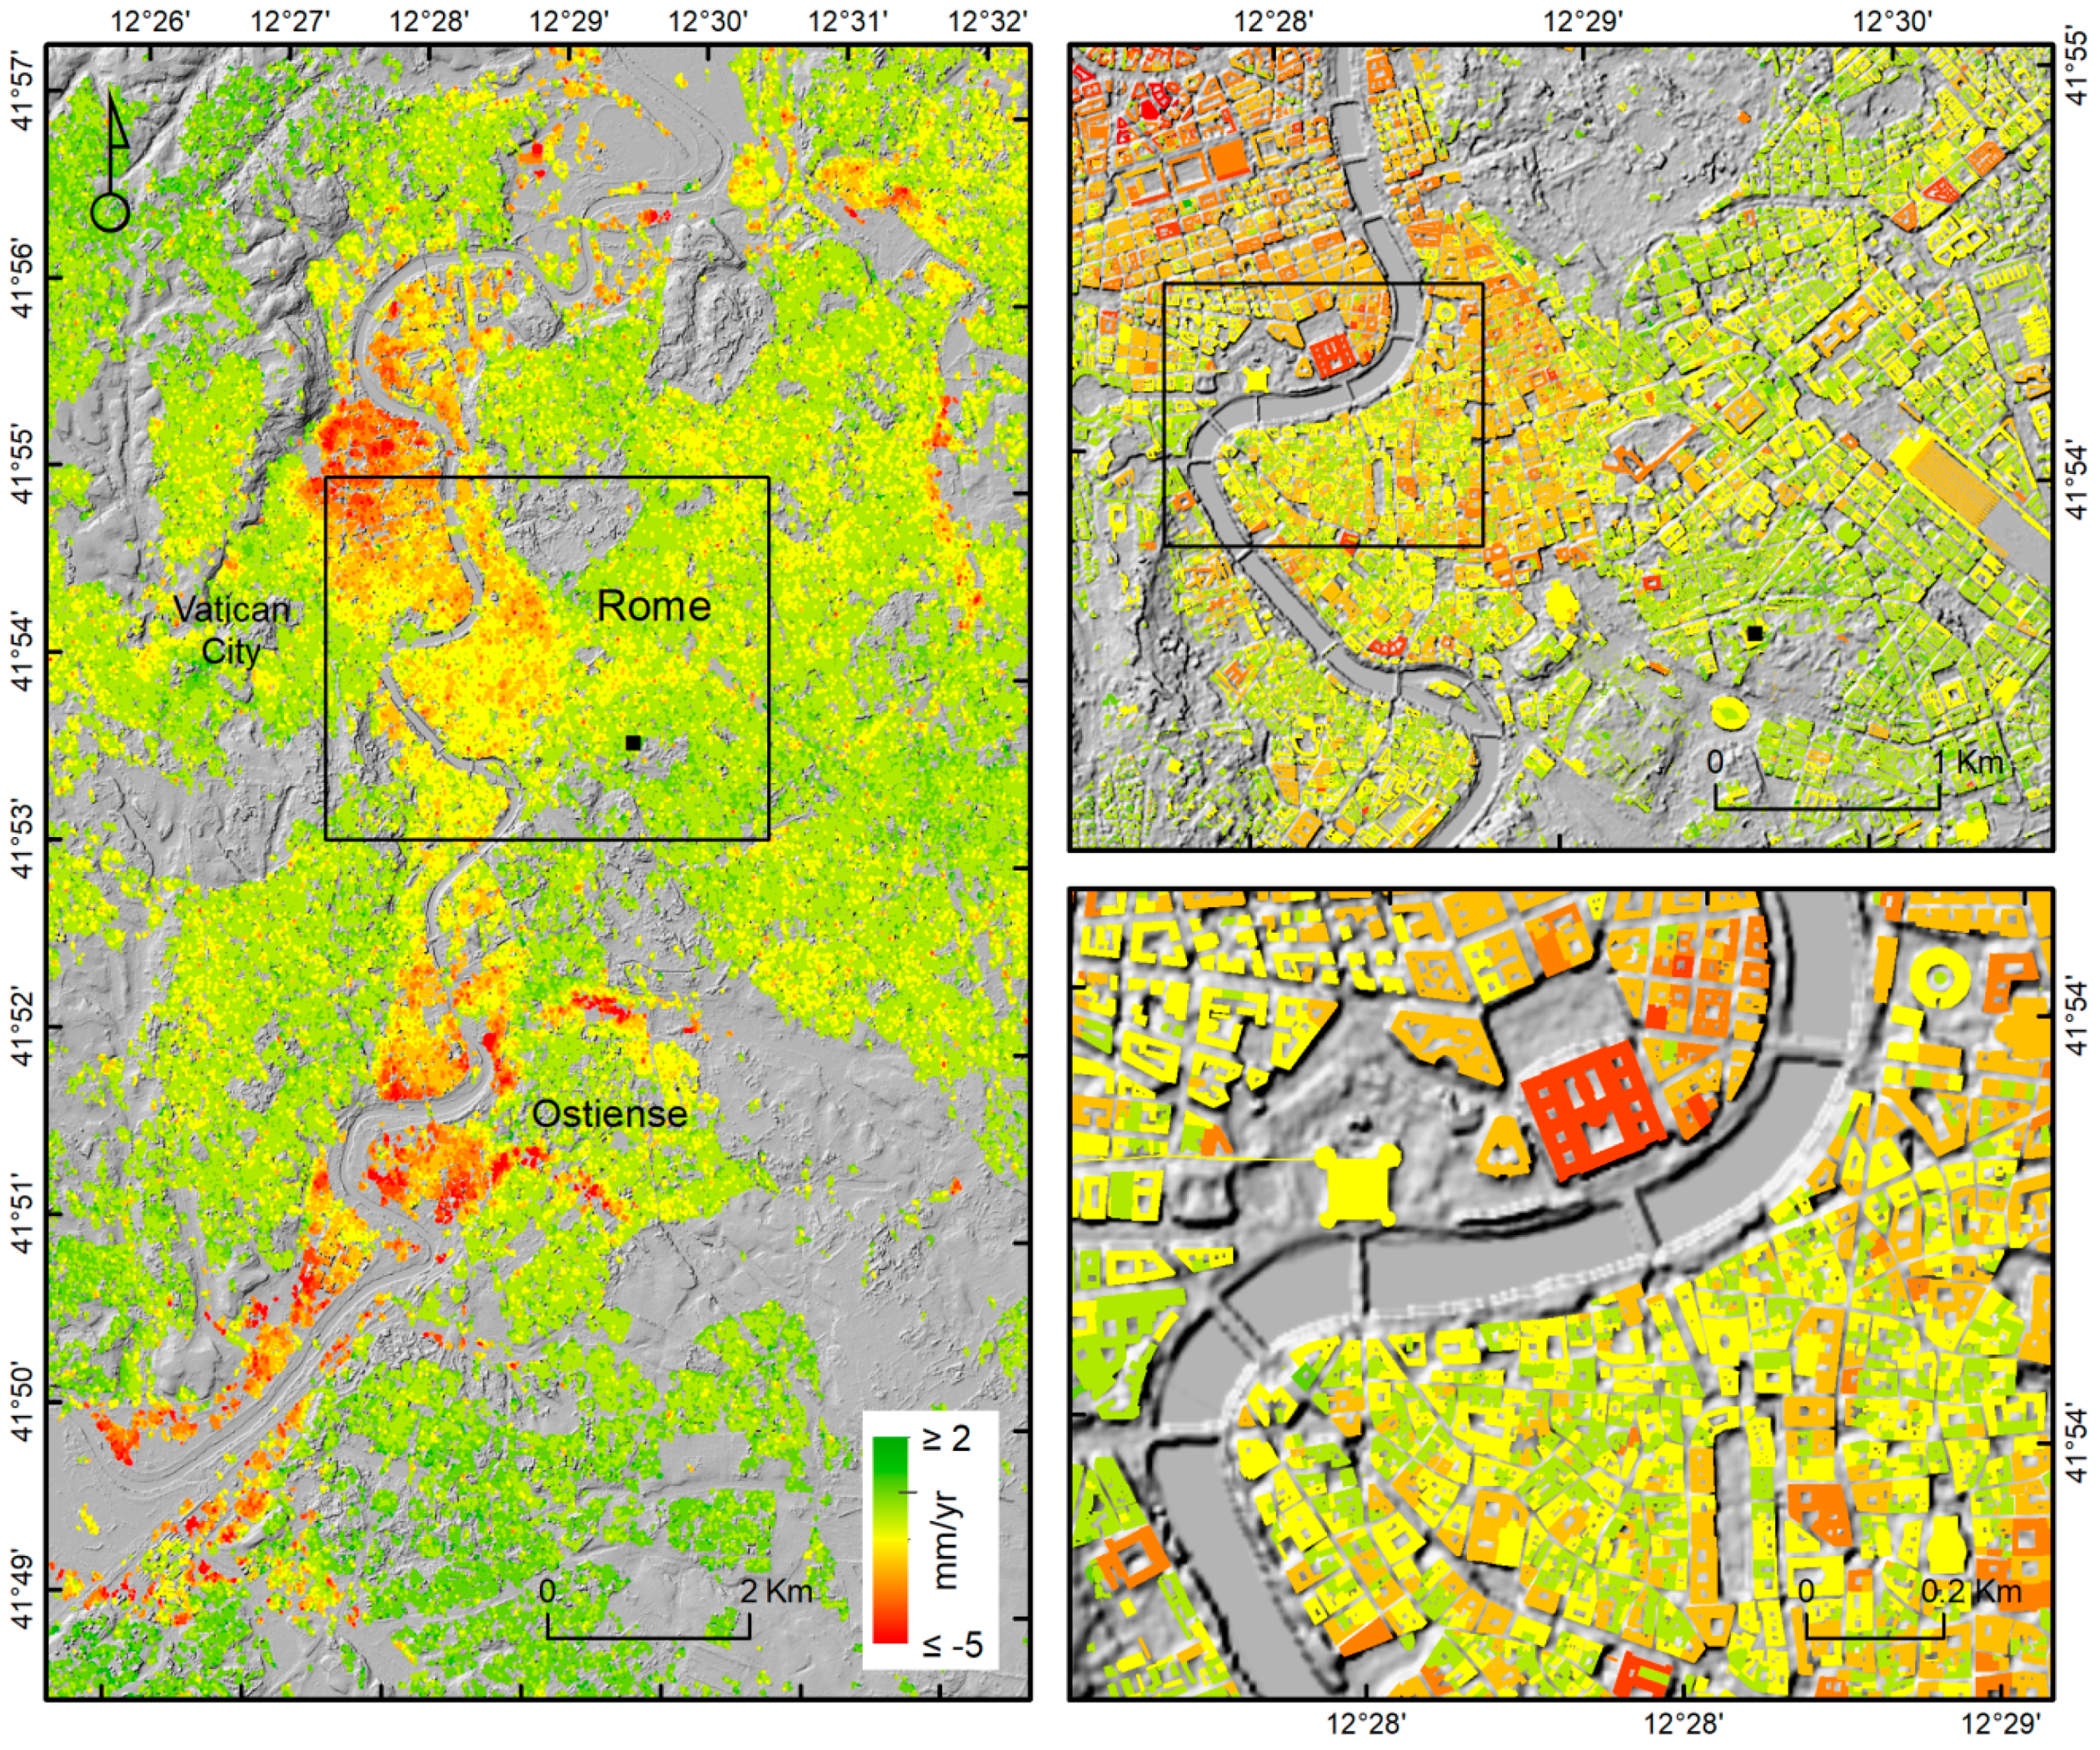
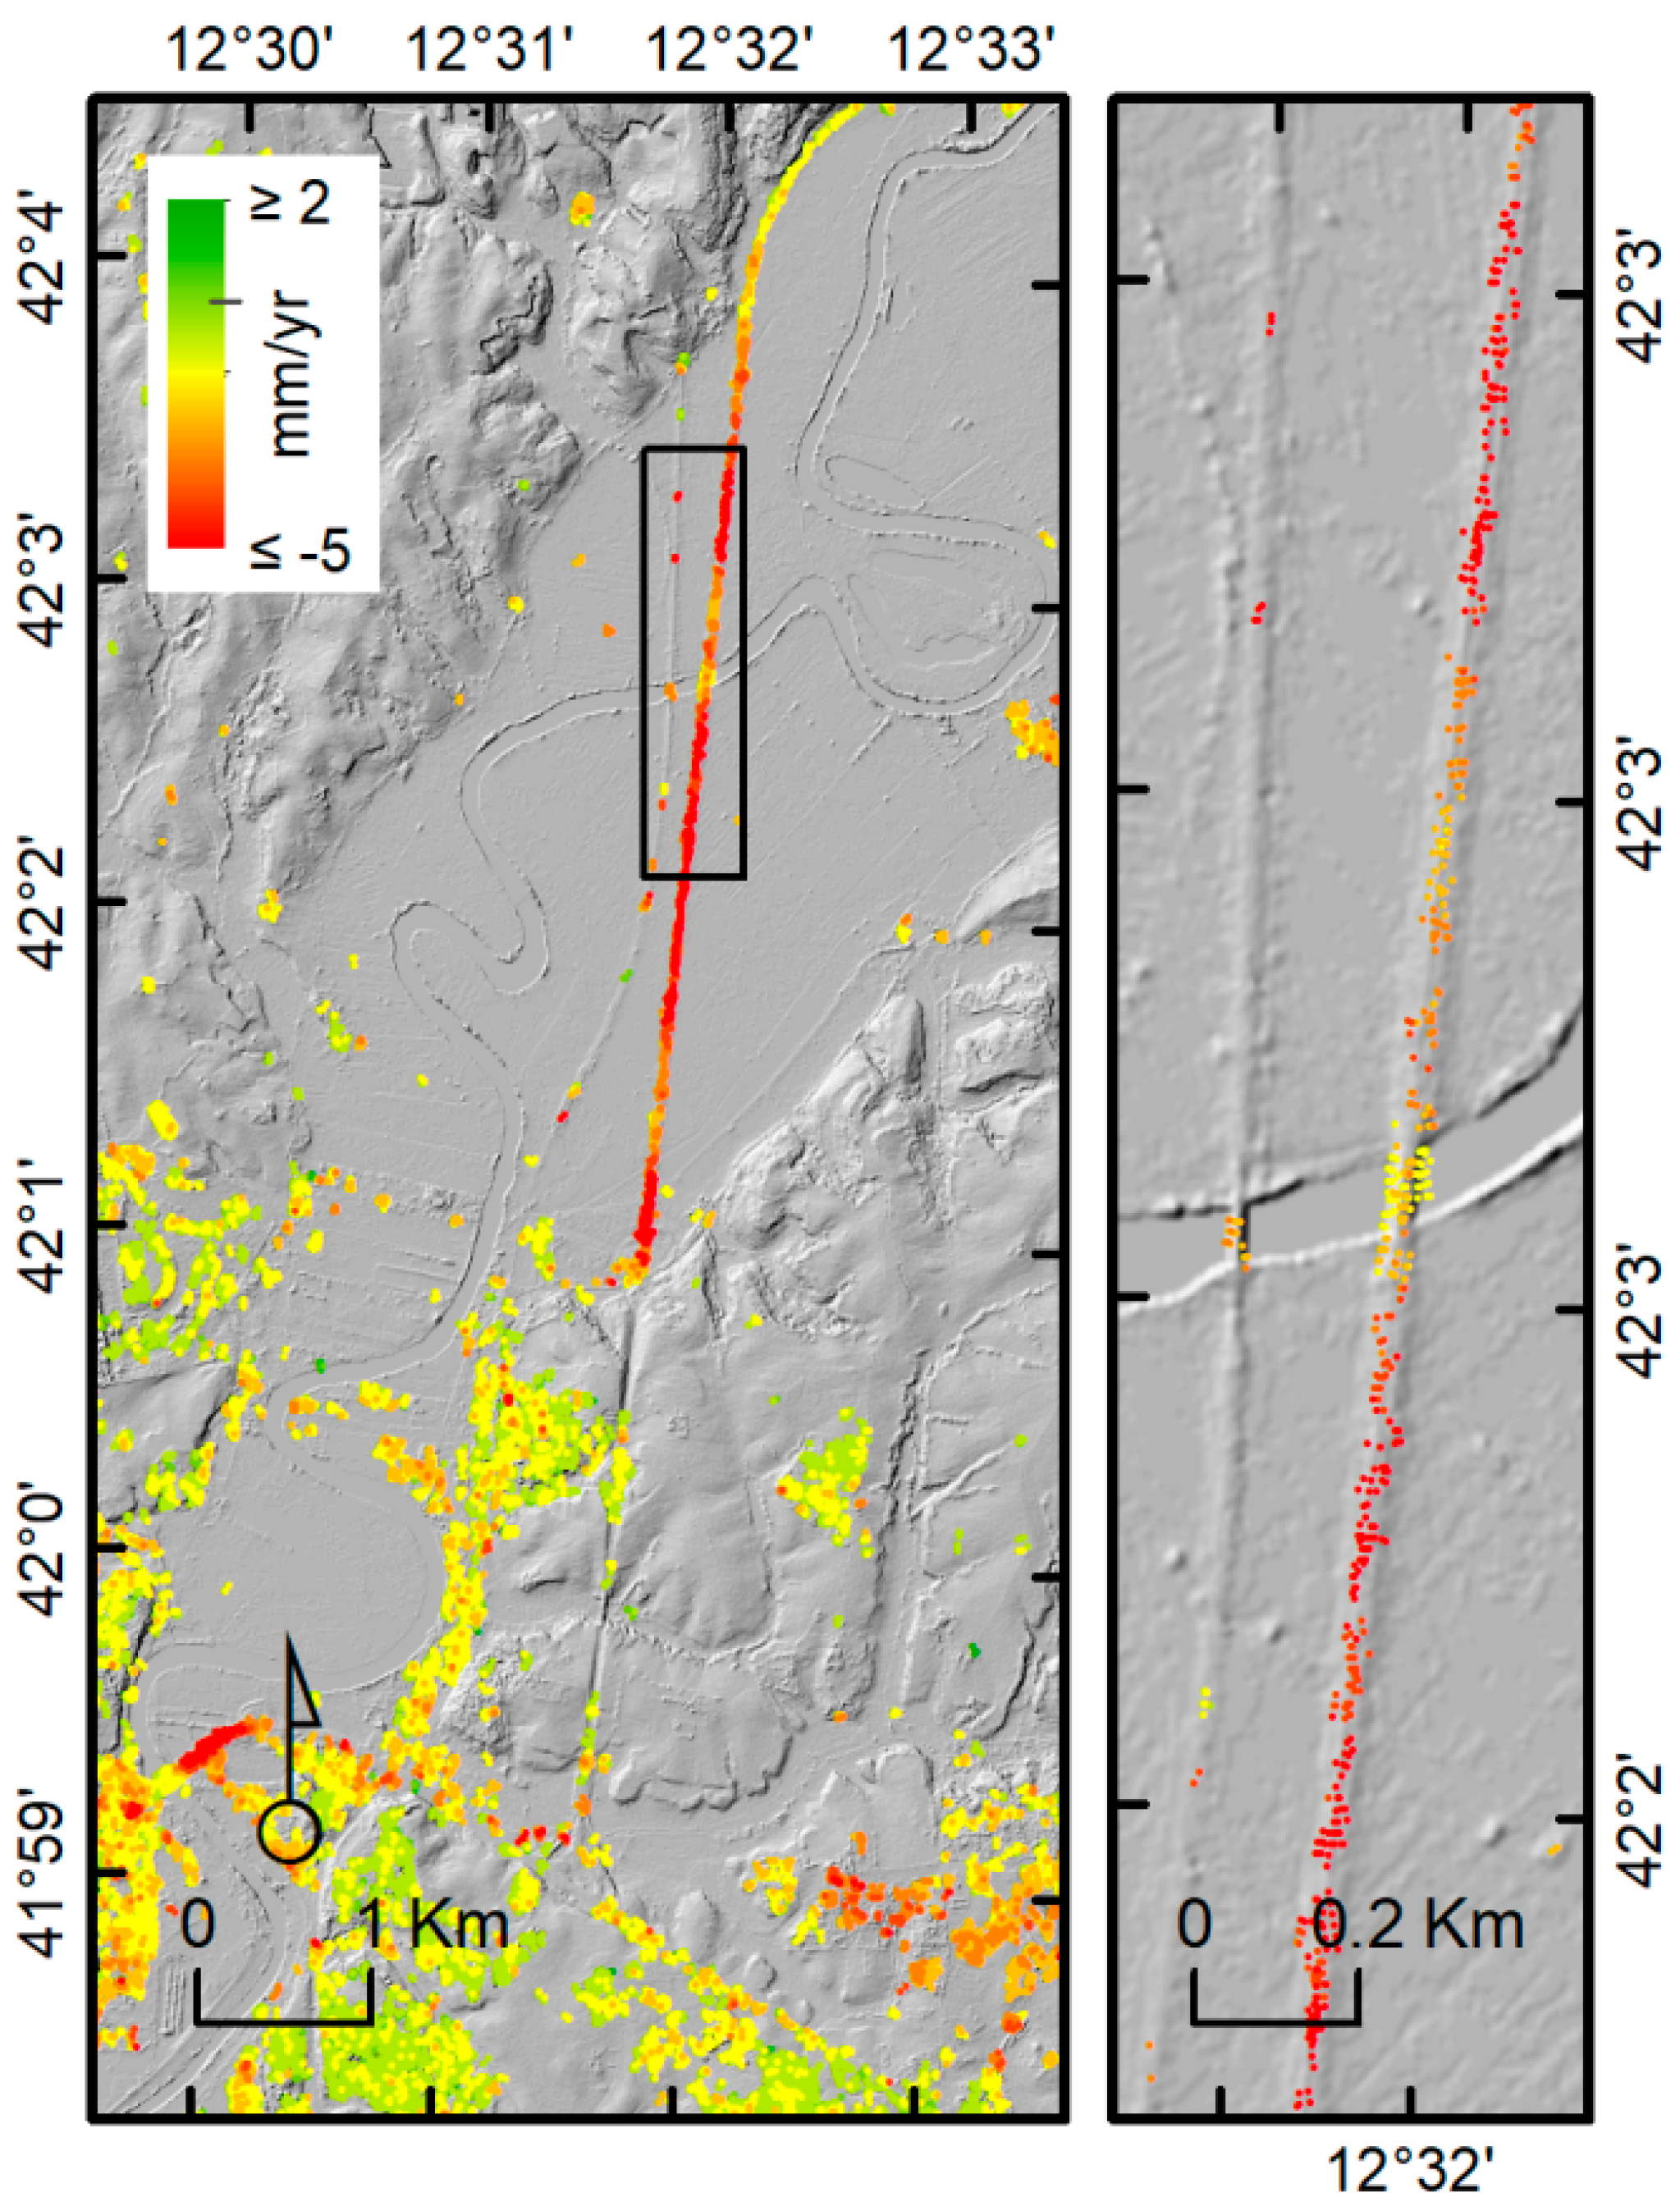
3.2. Subsidence along the Tiber River
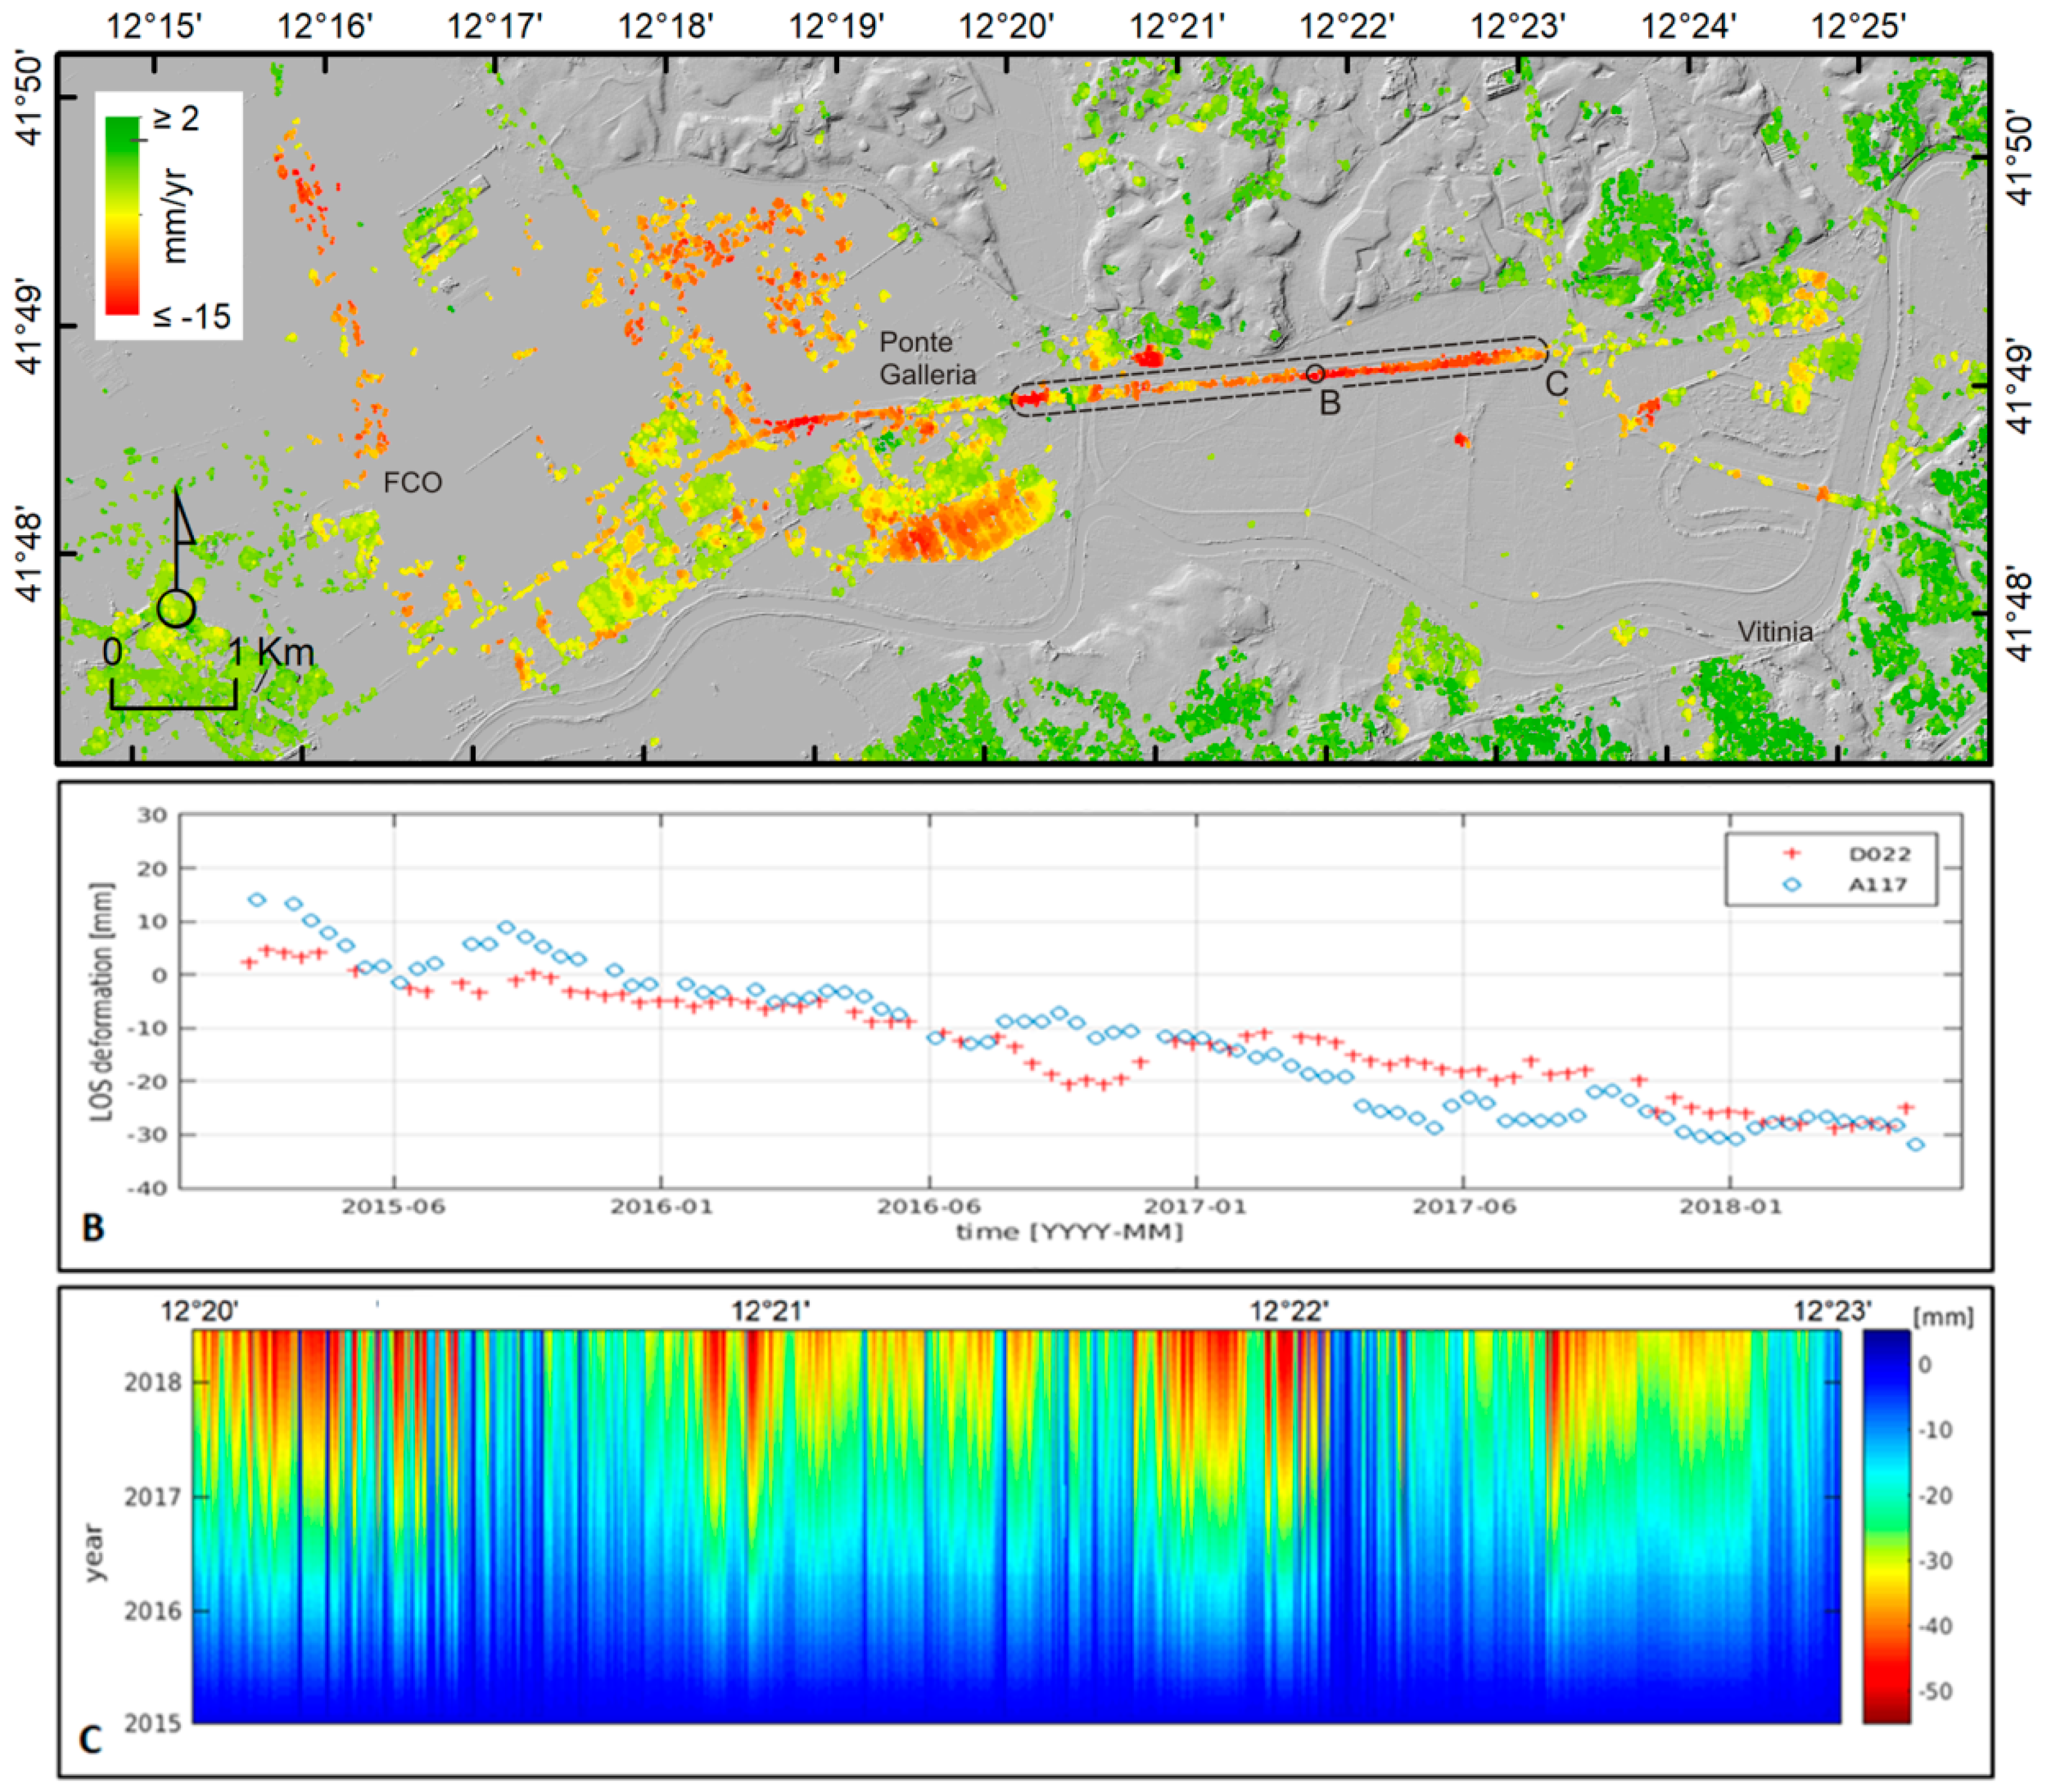
3.3. Fiumicino Airport and Ostia Coastal Region
3.4. Other Cases of Strong Displacement Patterns
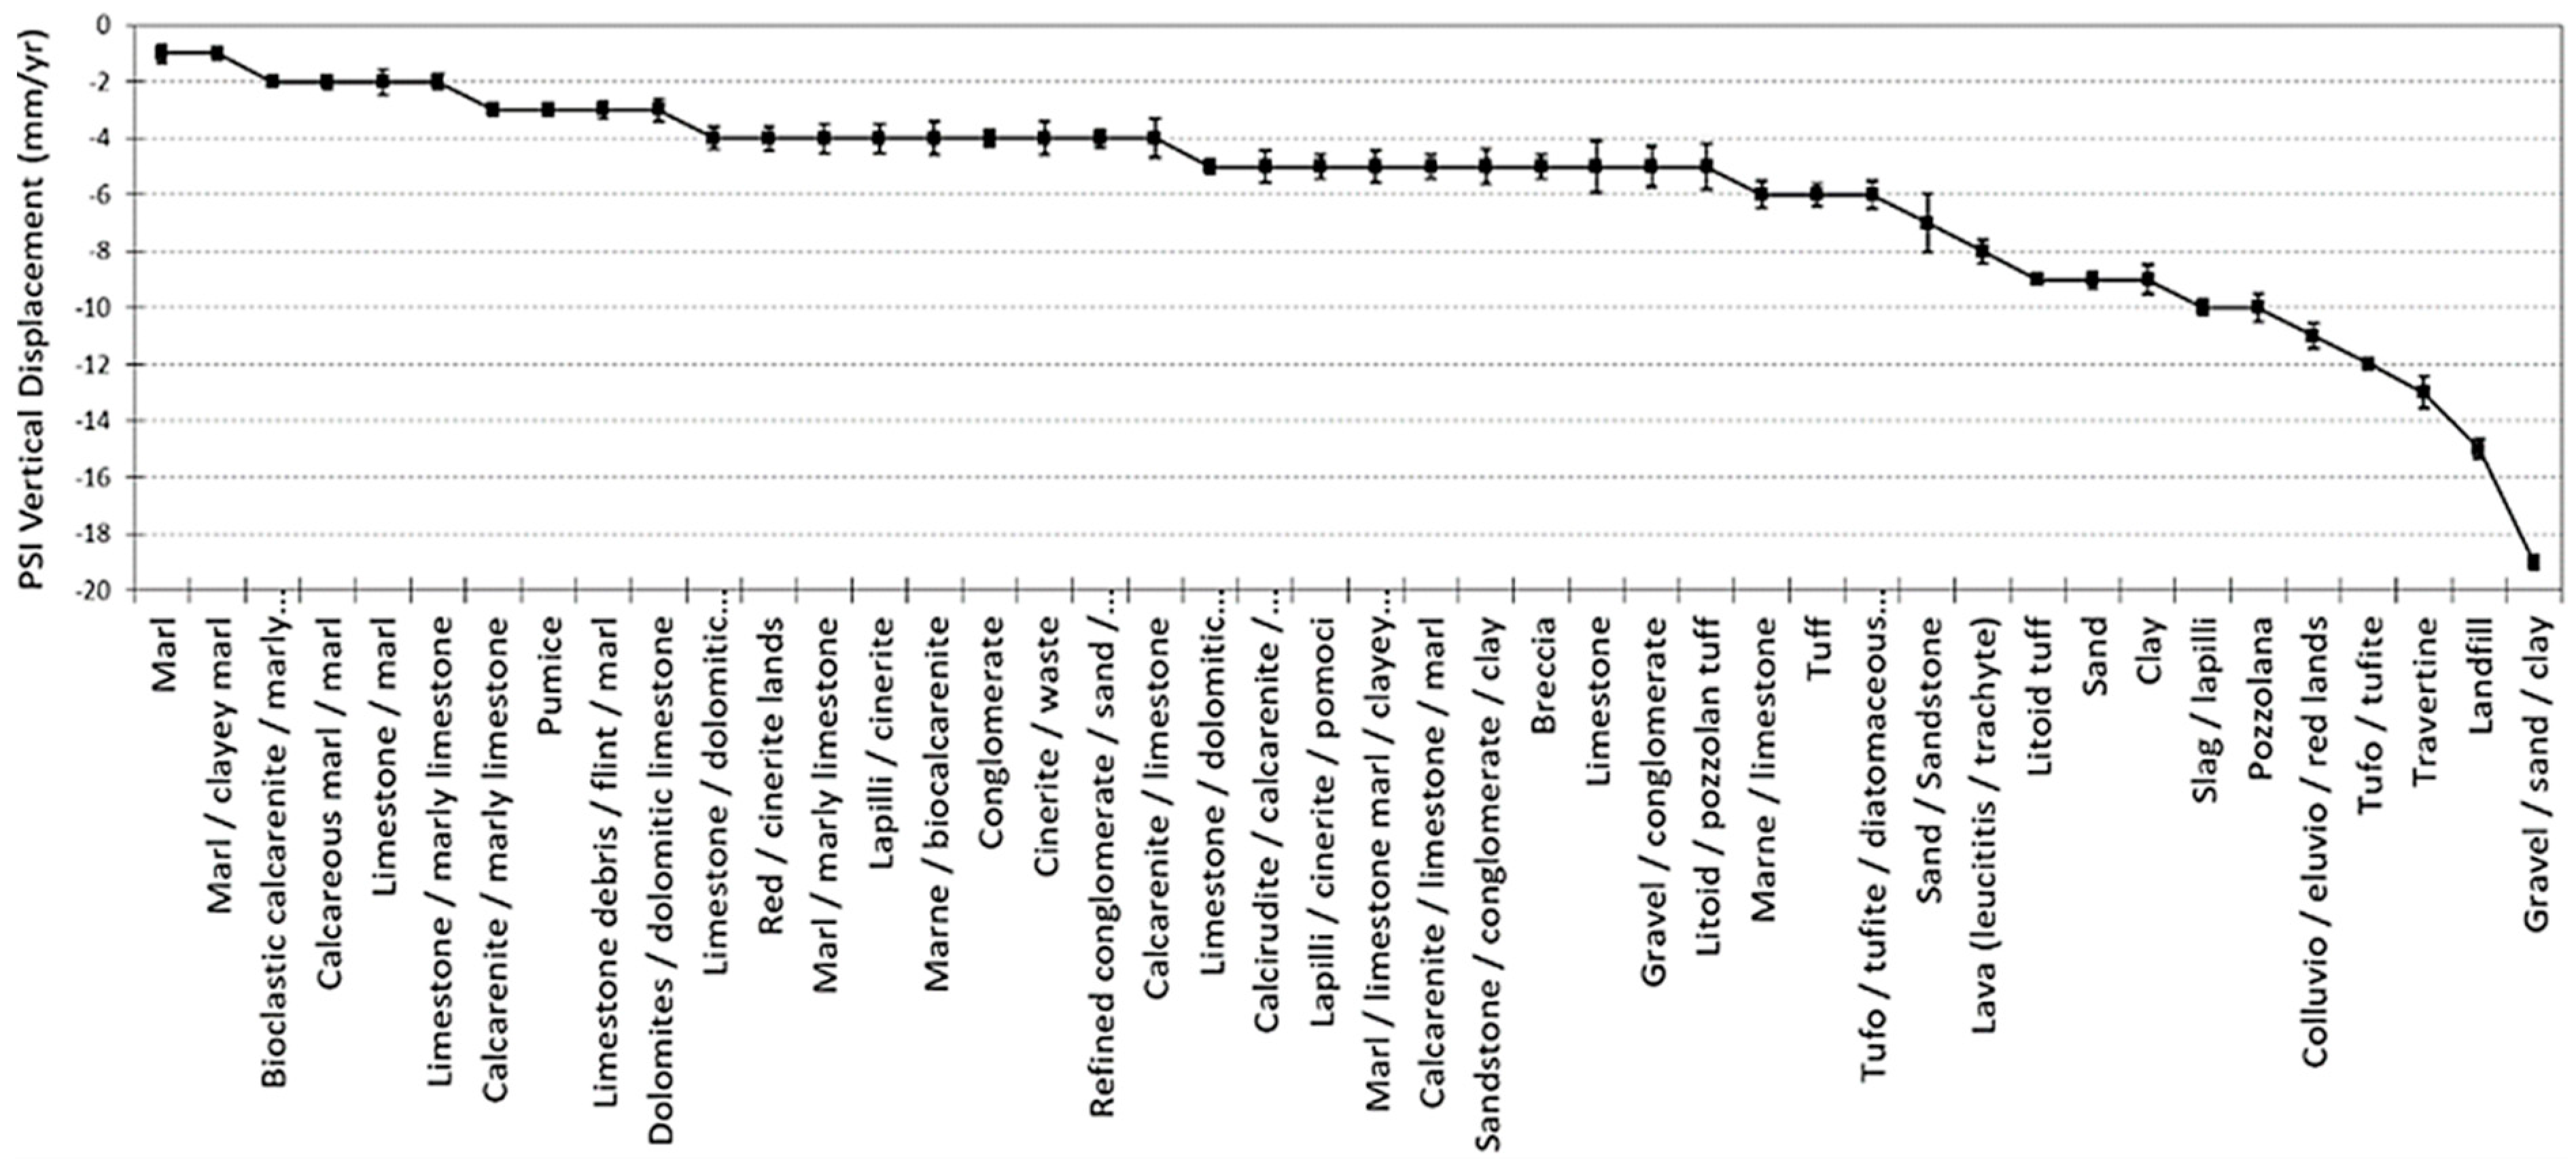
4. Discussion
5. Conclusions
Supplementary Materials
Author Contributions
Funding
Acknowledgments
Conflicts of Interest
References
- Veci, L.; Lu, J.; Prats-Iraola, P.; Scheiber, R.; Collard, F.; Fomferra, N.; Engdahl, M. The Sentinel-1 Toolbox. In Proceedings of the IEEE International Geoscience and Remote Sensing Symposium (IGARSS), Quebec City, QC, Canada, 13–18 July 2014; pp. 1–3. [Google Scholar]
- De Zan, F.; Guarnieri, A.M. TOPSAR: Terrain observation by progressive scans. IEEE Trans. Geosci. Remote Sens. 2006, 44, 2352–2360. [Google Scholar] [CrossRef]
- Prats-Iraola, P.; Nannini, M.; Yague-Martinez, N.; Pinheiro, M.; Kim, J.-S.; Vecchioli, F.; Minati, F.; Costantini, M.; Borgstrom, S.; De Martino, P.; et al. Interferometric investigations with the Sentinel-1 constellation. In Proceedings of the 2017 IEEE International Geoscience and Remote Sensing Symposium (IGARSS), Fort Worth, TX, USA, 23–28 July 2017; pp. 5537–5540. [Google Scholar]
- Prats-Iraola, P.; Nannini, M.; Yague-Martinez, N.; Scheiber, R.; Minati, F.; Vecchioli, F.; Costantini, M.; Borgstrom, S.; De Martino, P.; Siniscalchi, V.; et al. Sentinel-1 tops interferometric time series results and validation. In Proceedings of the 2016 IEEE International Geoscience and Remote Sensing Symposium (IGARSS), Beijing, China, 10–15 July 2016; pp. 3894–3897. [Google Scholar]
- GUNCE, H.B.; SAN, B.T. Measuring Earthquake-Induced Deformation in the South of Halabjah (Sarpol-e-Zahab) Using Sentinel-1 Data on November 12, 2017. Proceedings 2018, 2, 346. [Google Scholar] [CrossRef]
- Ganas, A.; Elias, P.; Bozionelos, G.; Papathanassiou, G.; Avallone, A.; Papastergios, A.; Valkaniotis, S.; Parcharidis, I.; Briole, P. Coseismic deformation, field observations and seismic fault of the 17 November 2015 M = 6.5, Lefkada Island, Greece earthquake. Tectonophysics 2016, 687, 210–222. [Google Scholar] [CrossRef]
- Jelének, J.; Kopačková, V.; Fárová, K. Post-Earthquake Landslide Distribution Assessment Using Sentinel-1 and-2 Data: The Example of the 2016 Mw 7.8 Earthquake in New Zealand. Proceedings 2018, 2, 361. [Google Scholar] [CrossRef]
- Hooper, A.; Bekaert, D.; Spaans, K.; Arıkan, M. Recent advances in SAR interferometry time series analysis for measuring crustal deformation. Tectonophysics 2012, 514–517, 1–13. [Google Scholar] [CrossRef]
- Foumelis, M.; Delgado Blasco, J.M.; Desnos, Y.-L.; Engdahl, M.; Fernandez, D.; Veci, L.; Lu, J.; Wong, C. ESA SNAP-StaMPS Integrated Processing for Sentinel-1 Persistent Scatterer Interferometry. In Proceedings of the 2018 IEEE International Geoscience and Remote Sensing Symposium, Valencia, Spain, 22–27 July 2018; pp. 1364–1367. [Google Scholar]
- Delgado Blasco, J.M.; Foumelis, M. Automated SNAP Sentinel-1 DInSAR Processing for StaMPS PSI with Open Source Tools. Available online: https://zenodo.org/record/1322353 (accessed on 29 July 2018).
- Stramondo, S.; Bozzano, F.; Marra, F.; Wegmuller, U.; Cinti, F.R.; Moro, M.; Saroli, M. Subsidence induced by urbanisation in the city of Rome detected by advanced InSAR technique and geotechnical investigations. Remote Sens. Environ. 2008, 112, 3160–3172. [Google Scholar] [CrossRef]
- Bozzano, F.; Esposito, C.; Mazzanti, P.; Patti, M.; Scancella, S. Imaging Multi-Age Construction Settlement Behaviour by Advanced SAR Interferometry. Remote Sens. 2018, 10, 1137. [Google Scholar] [CrossRef]
- Funiciello, R.; Heiken, G.; De Rita, D. I Sette Colli: Guida Geologica a Una Roma Mai Vista; Raffaello Cortina Editore: Milano, Italy, 2006. [Google Scholar]
- Cigna, F.; Lasaponara, R.; Masini, N.; Milillo, P.; Tapete, D. Persistent scatterer interferometry processing of COSMO-skymed stripmap HIMAGE time series to depict deformation of the historic centre of Rome, Italy. Remote Sens. 2014, 6, 12593–12618. [Google Scholar] [CrossRef]
- Manunta, M.; Marsella, M.; Zeni, G.; Sciotti, M.; Atzori, S.; Lanari, R. Two-scale surface deformation analysis using the SBAS-DInSAR technique: A case study of the city of Rome, Italy. Int. J. Remote Sens. 2008, 29, 1665–1684. [Google Scholar] [CrossRef]
- Fornaro, G.; Serafino, F.; Reale, D. 4-D SAR imaging: The case study of Rome. IEEE Geosci. Remote Sens. Lett. 2010, 7, 236–240. [Google Scholar] [CrossRef]
- Comerci, V.; Cipolloni, C.; di Manna, P.; Guerrieri, L.; Vittori, E.; Bertoletti, E.; Ciuffreda, M.; Succhiarelli, C. PanGeo: Enabling Access to Geological Information in Support of GMES-D7.1.26 Geohazard Description for Rome. 2012. Available online: http://www.pangeoproject.eu/pdfs/english/rome/Geohazard-Description-rome.pdf (accessed on 19 September 2018).
- Zeni, G.; Bonano, M.; Casu, F.; Manunta, M.; Manzo, M.; Marsella, M.; Pepe, A.; Lanari, R. Long-term deformation analysis of historical buildings through the advanced SBAS-DInSAR technique: The case study of the city of Rome, Italy. J. Geophys. Eng. 2011, 8, S1. [Google Scholar] [CrossRef]
- Tapete, D.; Fanti, R.; Cecchi, R.; Petrangeli, P.; Casagli, N. Satellite radar interferometry for monitoring and early-stage warning of structural instability in archaeological sites. J. Geophys. Eng. 2012, 9, S10–S25. [Google Scholar] [CrossRef]
- Bozzano, F.; Esposito, C.; Franchi, S.; Mazzanti, P.; Perissin, D.; Rocca, A.; Romano, E. Analysis of a Subsidence Process by Integrating Geological and Hydrogeological Modelling with Satellite InSAR Data. In Engineering Geology for Society and Territory-Volume 5; Springer: New York, NY, USA, 2015; pp. 155–159. [Google Scholar]
- Perissin, D.; Wang, T. Repeat-pass SAR interferometry with partially coherent targets. IEEE Trans. Geosci. Remote Sens. 2012, 50, 271–280. [Google Scholar] [CrossRef]
- Bekaert, D.P.S.; Walters, R.J.; Wright, T.J.; Hooper, A.J.; Parker, D.J. Statistical comparison of InSAR tropospheric correction techniques. Remote Sens. Environ. 2015, 170, 40–47. [Google Scholar] [CrossRef]
- Delgado Blasco, J.M.; Sabatino, G.; Cuccu, R.; Rivolta, G.; Pelich, R.; Matgen, P.; Chini, M.; Marconcini, M. Support for Multi-temporal and Multi-mission data processing: The ESA Research and Service Support. In Proceedings of the 2017 9th International Workshop on the Analysis of Multitemporal Remote Sensing Images (MultiTemp), Brugge, Belgium, 27–29 June 2017. [Google Scholar]
- Takaku, J.; Tadono, T.; Tsutsui, K.; Ichikawa, M. VALIDATION of “aW3D” GLOBAL DSM GENERATED from ALOS PRISM. In Proceedings of the ISPRS Annals of the Photogrammetry, Remote Sensing and Spatial Information Sciences, Prague, Czech Republic, 12–19 July 2016. [Google Scholar]
- D’Angelo, P.; Lehner, M.; Krauss, T.; Hoja, D.; Reinartz, P. Towards automated DEM generation from high resolution stereo satellite images. Int. Arch. Photogramm. Remote Sens. Spat. Inf. Sci. 2008, 37, 1137–1342. [Google Scholar]
- Scheiber, R.; Moreira, A. Coregistration of interferometric SAR images using spectral diversity. IEEE Trans. Geosci. Remote Sens. 2000, 38, 2179–2191. [Google Scholar] [CrossRef]
- Hooper, A.J.; Bekaert, D.; Hussain, E.; Spaans, K. StaMPS/MTI Manual; School of Earth and Environment: Leeds, UK, 2018. [Google Scholar]
- EUREF Permanent GNSS Network. M0SE00ITA (Roma, Italy). Available online: http://www.epncb.oma.be/_productsservices/coordinates/crd4station.php?station=M0SE00ITA (accessed on 1 October 2018).
- Samieie-Esfahany, S.; Hanssen, R.F.; Van Thienen-Visser, K.; Muntendam-Bos, A.; Systems, S. On the effect of horizontal deformation on insar subsidence estimates. In Proceedings of the 2009 Workshop on Fringe, Frascati, Italy, 30 November–4 December 2009. [Google Scholar]
- Foumelis, M. Vector-based approach for combining ascending and descending persistent scatterers interferometric point measurements. Geocarto Int. 2018, 33, 38–52. [Google Scholar] [CrossRef]
- Estratti OpenStreetmap: Regione Lazio. Available online: https://osm-estratti.wmflabs.org/estratti/ (accessed on 16 September 2018).
- Crosetto, M.; Monserrat, O.; Cuevas-González, M.; Devanthéry, N.; Crippa, B. Persistent Scatterer Interferometry: A review. ISPRS J. Photogramm. Remote Sens. 2016, 115, 78–89. [Google Scholar] [CrossRef]


| Satellite | First Image | Last Image | Orbit Pass | Track | N Acquisitions |
|---|---|---|---|---|---|
| S1A | 2015/03/24 | 2018/04/13 | Descending | 22 | 82 |
| S1A | 2015/03/30 | 2018/04/19 | Ascending | 117 | 87 |
| Track | Acquisition Date | Mean Inc. Angle (rad/degrees) | Sub-Swath | Polarization | Initial Burst | Last Burst |
|---|---|---|---|---|---|---|
| D022 | 2015/05/23 | 0.75/42.97 | IW3 | VV | 5 | 8 |
| A117 | 2015/08/09 | 0.67/38.39 | IW2 | VV | 5 | 7 |
| Orbit | No Merging LOS/Vertical | 20 m LOS/Vertical | 40 m LOS/Vertical |
|---|---|---|---|
| Ascending (A117) | 1065328/947386 | 486188/418481 | 264024/211999 |
| Descending (D022) | 1342924/1061976 | 580578/439738 | 311615/217237 |
© 2019 by the authors. Licensee MDPI, Basel, Switzerland. This article is an open access article distributed under the terms and conditions of the Creative Commons Attribution (CC BY) license (http://creativecommons.org/licenses/by/4.0/).
Share and Cite
Delgado Blasco, J.M.; Foumelis, M.; Stewart, C.; Hooper, A. Measuring Urban Subsidence in the Rome Metropolitan Area (Italy) with Sentinel-1 SNAP-StaMPS Persistent Scatterer Interferometry. Remote Sens. 2019, 11, 129. https://doi.org/10.3390/rs11020129
Delgado Blasco JM, Foumelis M, Stewart C, Hooper A. Measuring Urban Subsidence in the Rome Metropolitan Area (Italy) with Sentinel-1 SNAP-StaMPS Persistent Scatterer Interferometry. Remote Sensing. 2019; 11(2):129. https://doi.org/10.3390/rs11020129
Chicago/Turabian StyleDelgado Blasco, José Manuel, Michael Foumelis, Chris Stewart, and Andrew Hooper. 2019. "Measuring Urban Subsidence in the Rome Metropolitan Area (Italy) with Sentinel-1 SNAP-StaMPS Persistent Scatterer Interferometry" Remote Sensing 11, no. 2: 129. https://doi.org/10.3390/rs11020129
APA StyleDelgado Blasco, J. M., Foumelis, M., Stewart, C., & Hooper, A. (2019). Measuring Urban Subsidence in the Rome Metropolitan Area (Italy) with Sentinel-1 SNAP-StaMPS Persistent Scatterer Interferometry. Remote Sensing, 11(2), 129. https://doi.org/10.3390/rs11020129