Technical Note

Field-Scale Rice Yield Estimation Using Sentinel-1A Synthetic Aperture Radar (SAR) Data in Coastal Saline Region of Jiangsu Province, China

1
Jiangsu Key Laboratory of Crop Genetics and Physiology/Jiangsu Key Laboratory of Crop Cultivation and Physiology, Agricultural College of Yangzhou University, Yangzhou 225009, China
2
Jiangsu Co-Innovation Center for Modern Production Technology of Grain Crops, Yangzhou University, Yangzhou 225009, China
3
Ottawa Research and Development Centre, Agriculture and Agri-Food Canada, Ottawa, Ontario K1A OC6, Canada
4
Institute of Crop Sciences, Chinese Academy of Agricultural Sciences/Key Laboratory of Crop Physiology and Ecology, Ministry of Agriculture, Beijing 100081, China
5
Joint International Research Laboratory of Agriculture and Agricultural Product Safety, Yangzhou University, Yangzhou 225009, China
*
Author to whom correspondence should be addressed.
Remote Sens. 2019, 11(19), 2274; https://doi.org/10.3390/rs11192274
Submission received: 31 July 2019 / Revised: 19 September 2019 / Accepted: 26 September 2019 / Published: 29 September 2019

Abstract

:
In recent years, a large number of salterns have been converted into rice fields in the coastal region of Jiangsu Province, Eastern China. The high spatial heterogeneity of soil salinity has caused large within-field variabilities in grain yield of rice. The identification of low-yield areas within a field is an important initial step for precision farming. While optical satellite remote sensing can provide valuable information on crop growth and yield potential, the availability of cloud-free optical image data is often hampered by unfavorable weather conditions. Synthetic aperture radar (SAR) offers an alternative due to its nearly day-and-night and all-weather capability in data acquisition. Given the free data access of the Sentinels, this study aimed at developing a Sentinel-1A-based SAR index for rice yield estimation. The proposed SAR simple difference (SSD) index uses the change of the Sentinel-1A backscatter in vertical-horizontal (VH) polarization between the end of the tillering stage and the end of grain filling stage (SSDVH). A strong exponential relationship has been identified between the SSDVH and rice yield, producing accurate yield estimation with a root mean square error (RMSE) of 0.74 t ha−1 and a relative error (RE) of 7.93%.

Graphical Abstract

1. Introduction

With rapid economic development and urban sprawl, the area of agricultural land in China has decreased dramatically over the past thirty years [1]. In an attempt to increase cropland acreage, a large number of salterns have been converted into farmland in China’s coastal provinces such as Jiangsu. While Jiangsu is one of the major rice producing provinces in China, the high soil salinity of its coastal regions has produced a consistently low yield [2]. The accurate and detailed mapping of rice yield can help to locate areas associated with low grain yield, which can guide farmers in their decision making when selecting proper land management practices.
In recent years, optical satellite remote sensing has been frequently used to map grain yield over a wide range of crop types and geographical locations with good accuracies [3,4]. However, optical remote sensing is not a choice for operational rice yield estimation in the coastal regions of Jiangsu because of their almost always rainy/cloudy conditions during rice growth period. In contrast, microwave remote sensing can penetrate cloud, haze and light rain, making it more suitable for operational crop monitoring. For example, researchers have used C-band SAR data to study the relationships between the SAR signals and crop parameters of various crop types [5,6]. Toan et al. suggested the use of the backscattering coefficient values in vertical-vertical (VV) co-polarization ( σ V V 0 ) from European Remote-Sensing Satellite-1 (ERS-1) in rice yield estimation [7]. Similarly, Inoue et al. found that the σ V V 0 values from COSMO-SkyMed and TerraSAR-X are significantly correlated with late rice maturing stage and rice panicle biomass [8]. A few studies used different SAR data to estimate the yield or biomass of various crops [9,10,11,12,13]. Little research has been conducted in yield or biomass estimation of rice or other crops from satellite SAR data in saline regions.
Sentinel-1 is the first to offer worldwide open-access SAR data [14]. Two satellites, Sentinel-1A and Sentinel-1B, launched on April 3, 2014 and April 25, 2016, respectively, carry a C-band SAR sensor. Sentinel-1 (1A or 1B only) acquires with a 12-day revisit cycle with a 185 km swath, and a nominal resolution of 10 m in the default interferometric wide (IW) mode [15] either in VV co-polarization or vertical-horizontal (VH) cross-polarization.
There have been very few studies in the literature to date that employed Sentinel-1 C-band SAR data for crop yield estimation. The objective of this study was to evaluate the potential of Sentinel-1A data for estimating rice grain yield in a saline field in a coastal region of Eastern China.

2. Materials and Methods
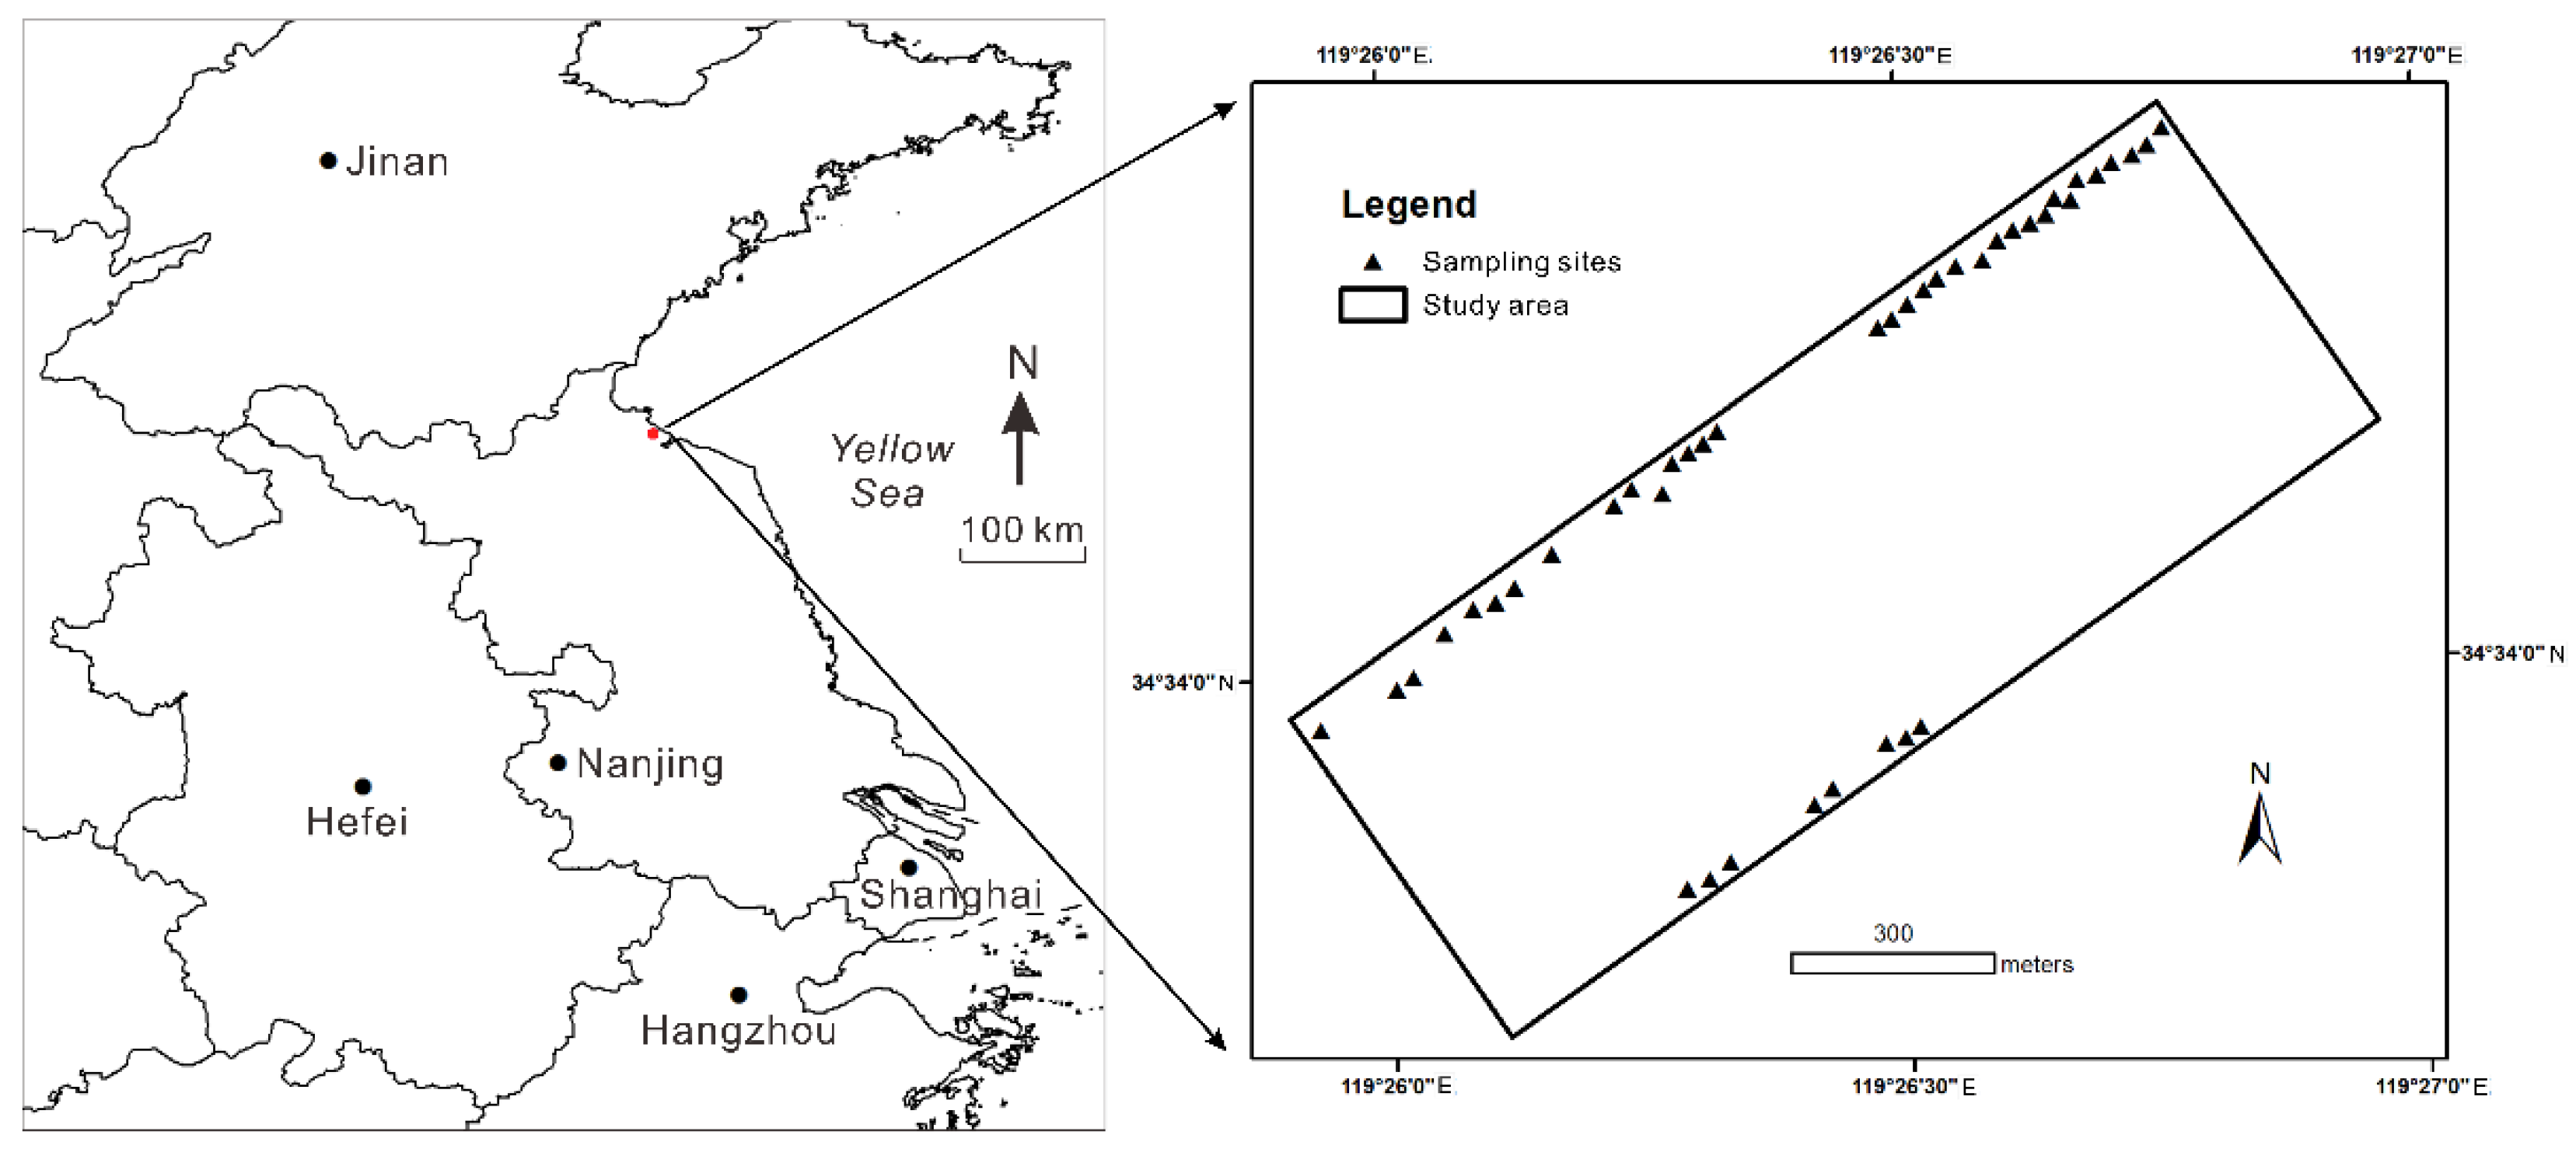
2.1. Study Area

The study area covers a 600 × 1600 m field located in the coastal Dongxin Farm, Lianyungang City, Jiangsu Province in Eastern China (Figure 1). It belongs to humid subtropical monsoon climate. The mean temperature of the region is 26.6 °C and 21.5 °C in August and September, respectively. The mean precipitation is 210.3 mm and 117.4 mm in August and September, respectively [16]. The study area is a former saltern, and the soil was salty clay [17]. Soil salinity at the 0–20 cm depth is around 3.40‰, i.e., moderate salinity.

2.2. Determination of Rice Grain Yield

A single rice variety (Huaidao 5) was grown in the study area, Huaidao 5, a popular cultivar in the province. Forty-two 16 × 16 m plots distributed across the field were selected for sampling (Figure 1). Based on local knowledge from the corresponding author of the paper, soil salinity showed a southwest-northeast trend in the study area; hence, the sampling sites were deployed along two southwest-northeast transects. All sampling sites were over 60 m away from the field edge to avoid the contamination of SAR signals from outside the field. The center location of each site or plot was recorded using a GPS receiver. Within each plot, sampling was carried out over five 50 × 66 cm subplots. The subplots were arranged with one plot located at the center of the plot and the rest of the subplots located near the four corners of the plot.
Rice plants were manually harvested on October 30, 2016 for all five subplots within each plot. Grains were separated using a small grain thresher and weighed individually. Grain moisture was determined immediately after weighing. Gross grain yield was adjusted to a moisture content of 14%.

2.3. Acquisition and Processing of Sentinel-1A Data

Two Level 1 ground range detected (GRD) Sentinel-1A (~5.405 GHz) interferometric wide (IW) 10-m resolution images with both VV and VH polarizations were download from the Copernicus Open Access Hub (https://scihub.copernicus.eu/dhus/#/home). The acquisition dates of the two images were July 19 and September 29, 2016, reflecting the end of the tillering stage of the vegetative phase and the end of the grain filling stage of the reproductive phase, respectively.
The Sentinel-1A image data were preprocessed using the Sentinel Application Platform (SNAP) open-source software (http://step.esa.int/main/download/). The preprocessing included applying precise orbit file, thermal noise removal, radiometric calibration, multi-looking (Range Look = 2), speckle filtering (a 5 × 5- Gamma-MAP filter), terrain correction (Range Doppler Terrain Correction), and radiometric normalization. The processed SAR data with a 20-m spatial resolution were then projected onto WGS 1984 Universal Transverse Mercator (UTM) coordinates. The produced images of VV and VH polarizations ( σ 0 in decibels (dB)) are shown in Figure 2.

2.4. Analytical Approaches

The σ 0 in VV and VH polarizations were extracted from each Sentinel-1A SAR image using the ENvironment for Visualizing Images (ENVI) software (ITT Exelis, Boulder, Colorado, USA) for each of the individual sampling sites. These σ 0 values at the tillering stage and the grain filling stage (denoted as σ V V , T 0 , σ V H , T 0 , σ V V , F 0 , and σ V H , F 0 , respectively) were used for analysis in this study.
From σ V V , T 0 , σ V H , T 0 , σ V V , F 0 , and σ V H , F 0 , two SAR indices, σ V V , T 0 / σ V H , T 0 and σ V V , F 0 / σ V H , F 0 , were calculated, and then three types of SAR indices including the SAR simple difference (SSD) index, SAR simple ratio (SSR) index and SAR normalized difference (SND) index were calculated (Table 1).
In total, 15 SAR indices (i.e., σ V V , T 0 , σ V H , T 0 , σ V V , F 0 , σ V H , F 0 , σ V V , T 0 / σ V H , T 0 , σ V V , F 0 / σ V H , F 0 , SSDVV, SSRVV, SNDVV, SSDVH, SSRVH, SNDVH, SSDVV/VH, SSRVV/VH and SNDVV/VH) were calculated (Table 1). Their relationships with measured rice grain yield were analyzed to determine the best three SAR indices as candidates of grain yield indicators. A leave-one-out cross-validation (LOOCV) technique was applied to perform an unbiased assessment of the estimation capacity of the model [18]. The model goodness-of-fit was assessed by comparing the root mean square error (RMSE) and relative error (RE) obtained from the LOOCV process [19,20]. The SAR index that achieved the lowest RMSE and RE was determined as the optimum grain yield indicator. Thus, the SAR index was calculated for each pixel of the studied field, and then the calculated SAR index values were converted into rice grain yields using the built regression relationship.

3. Results

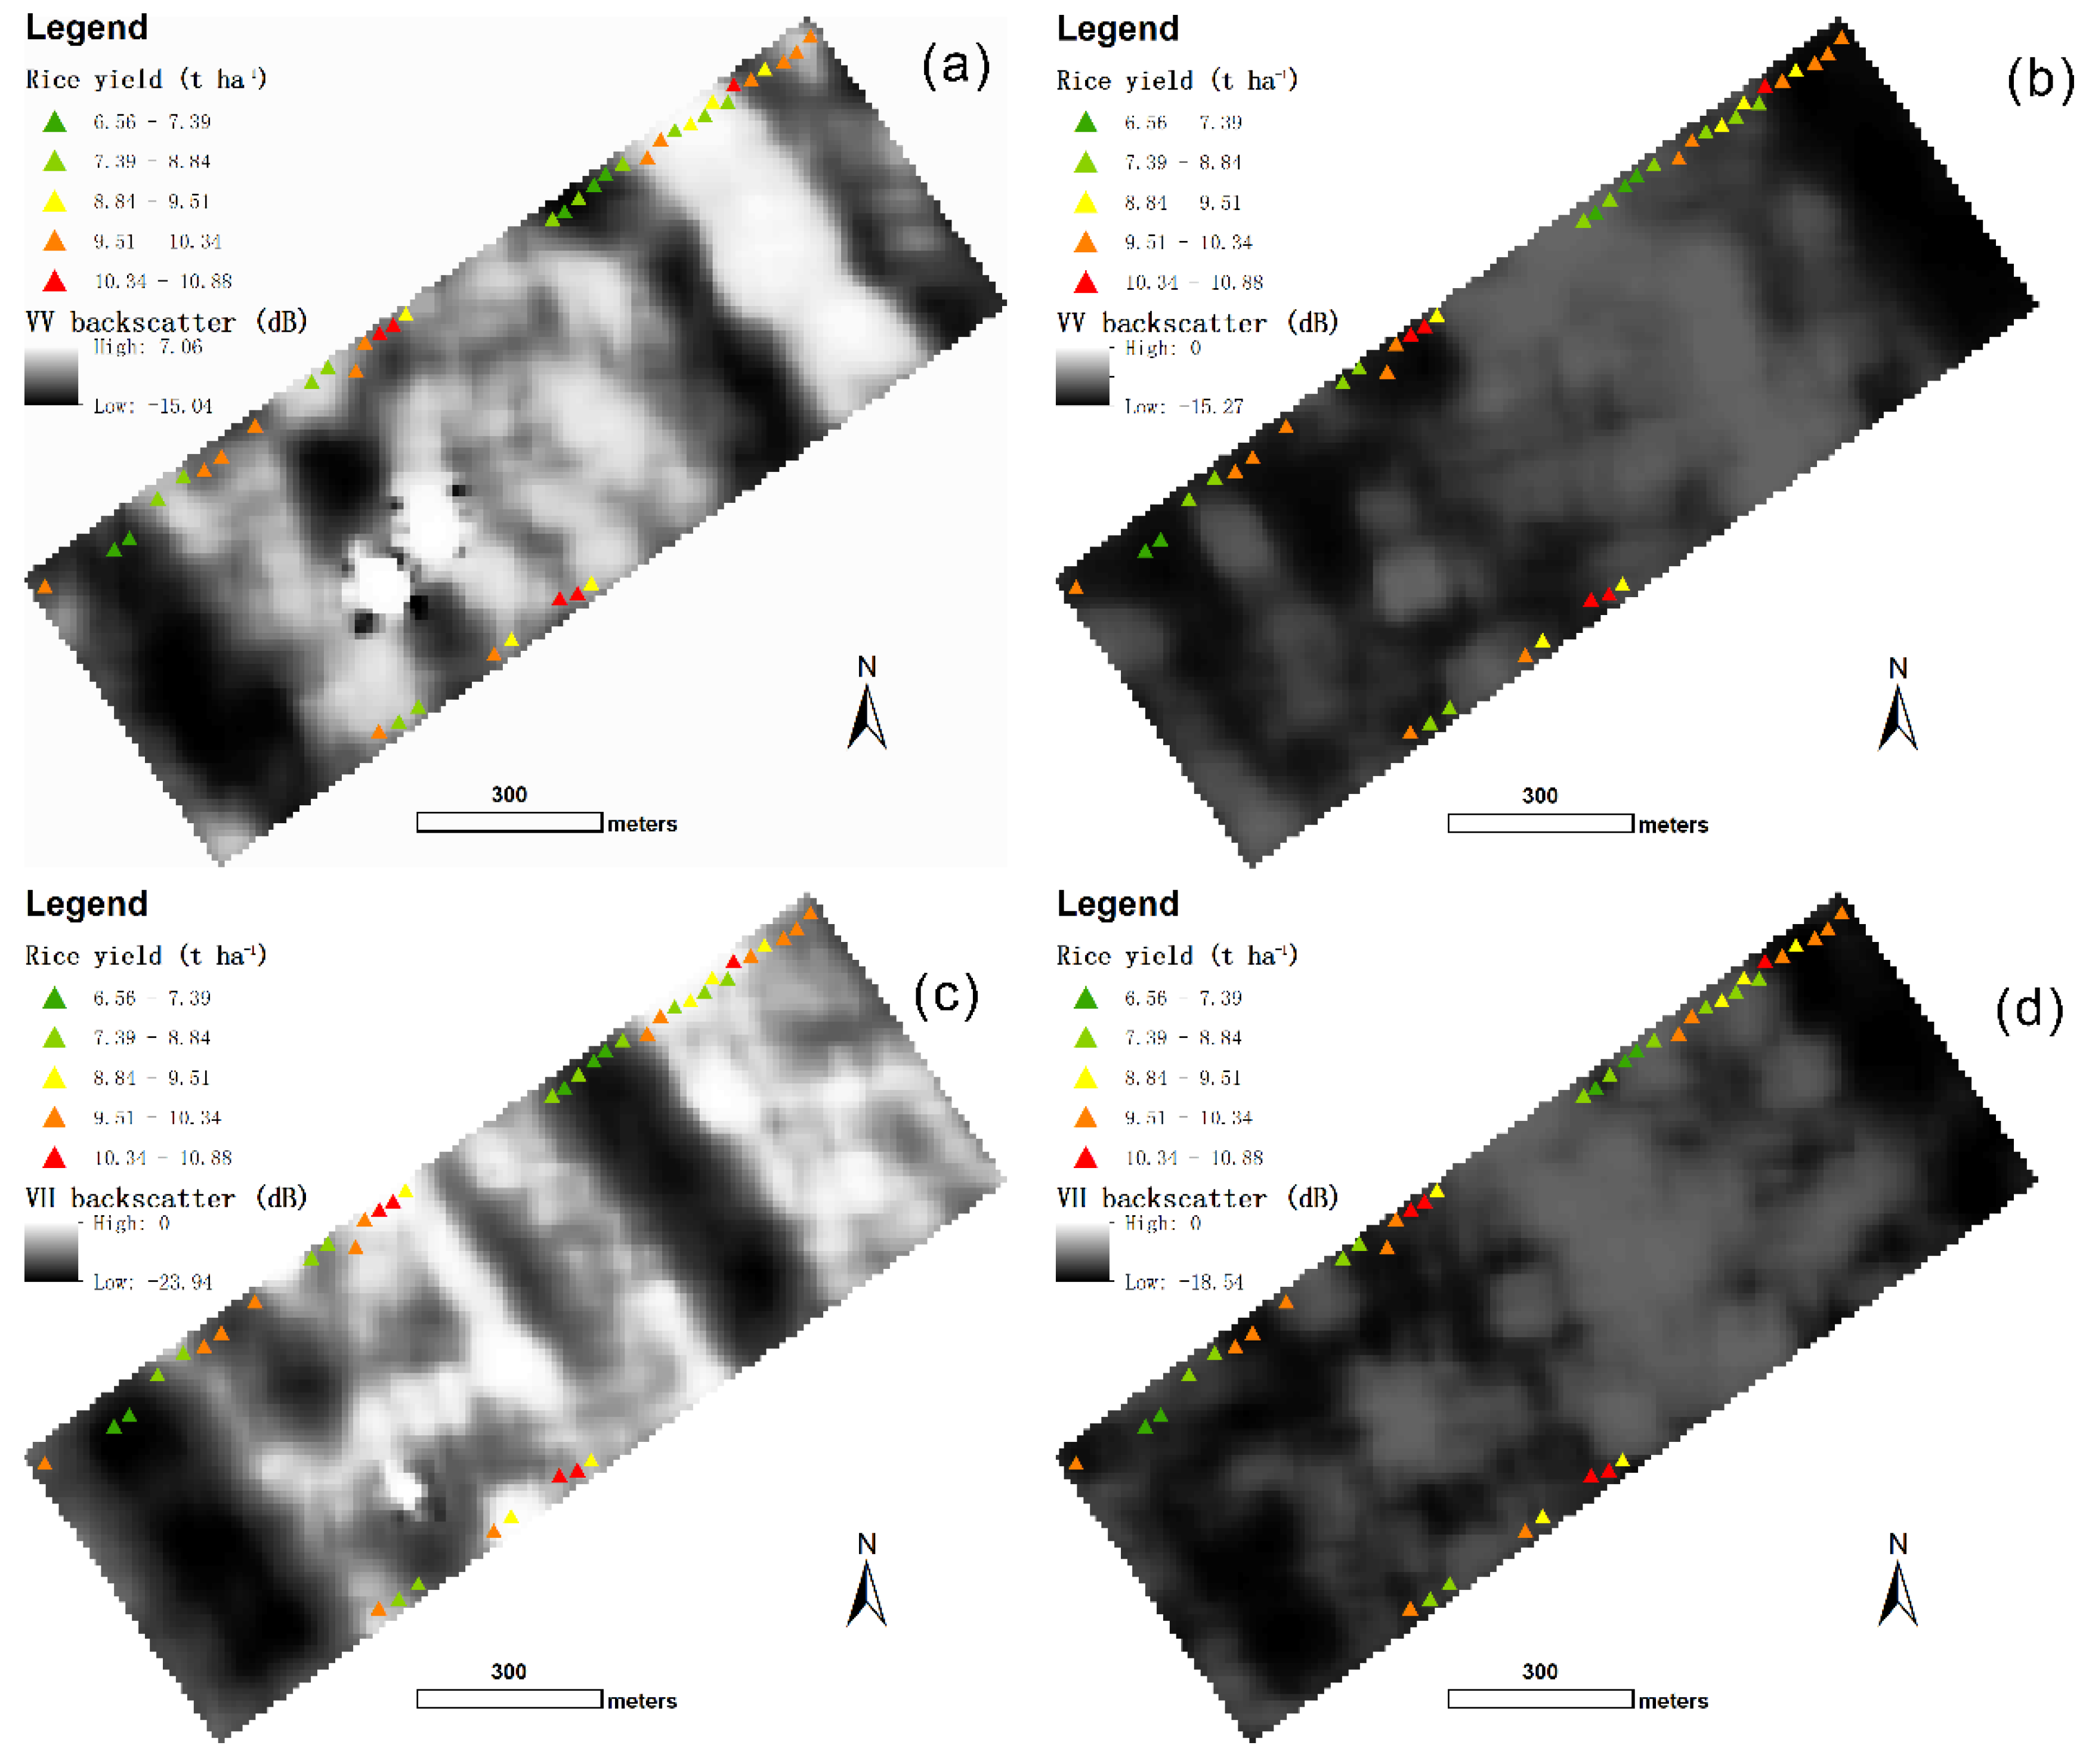
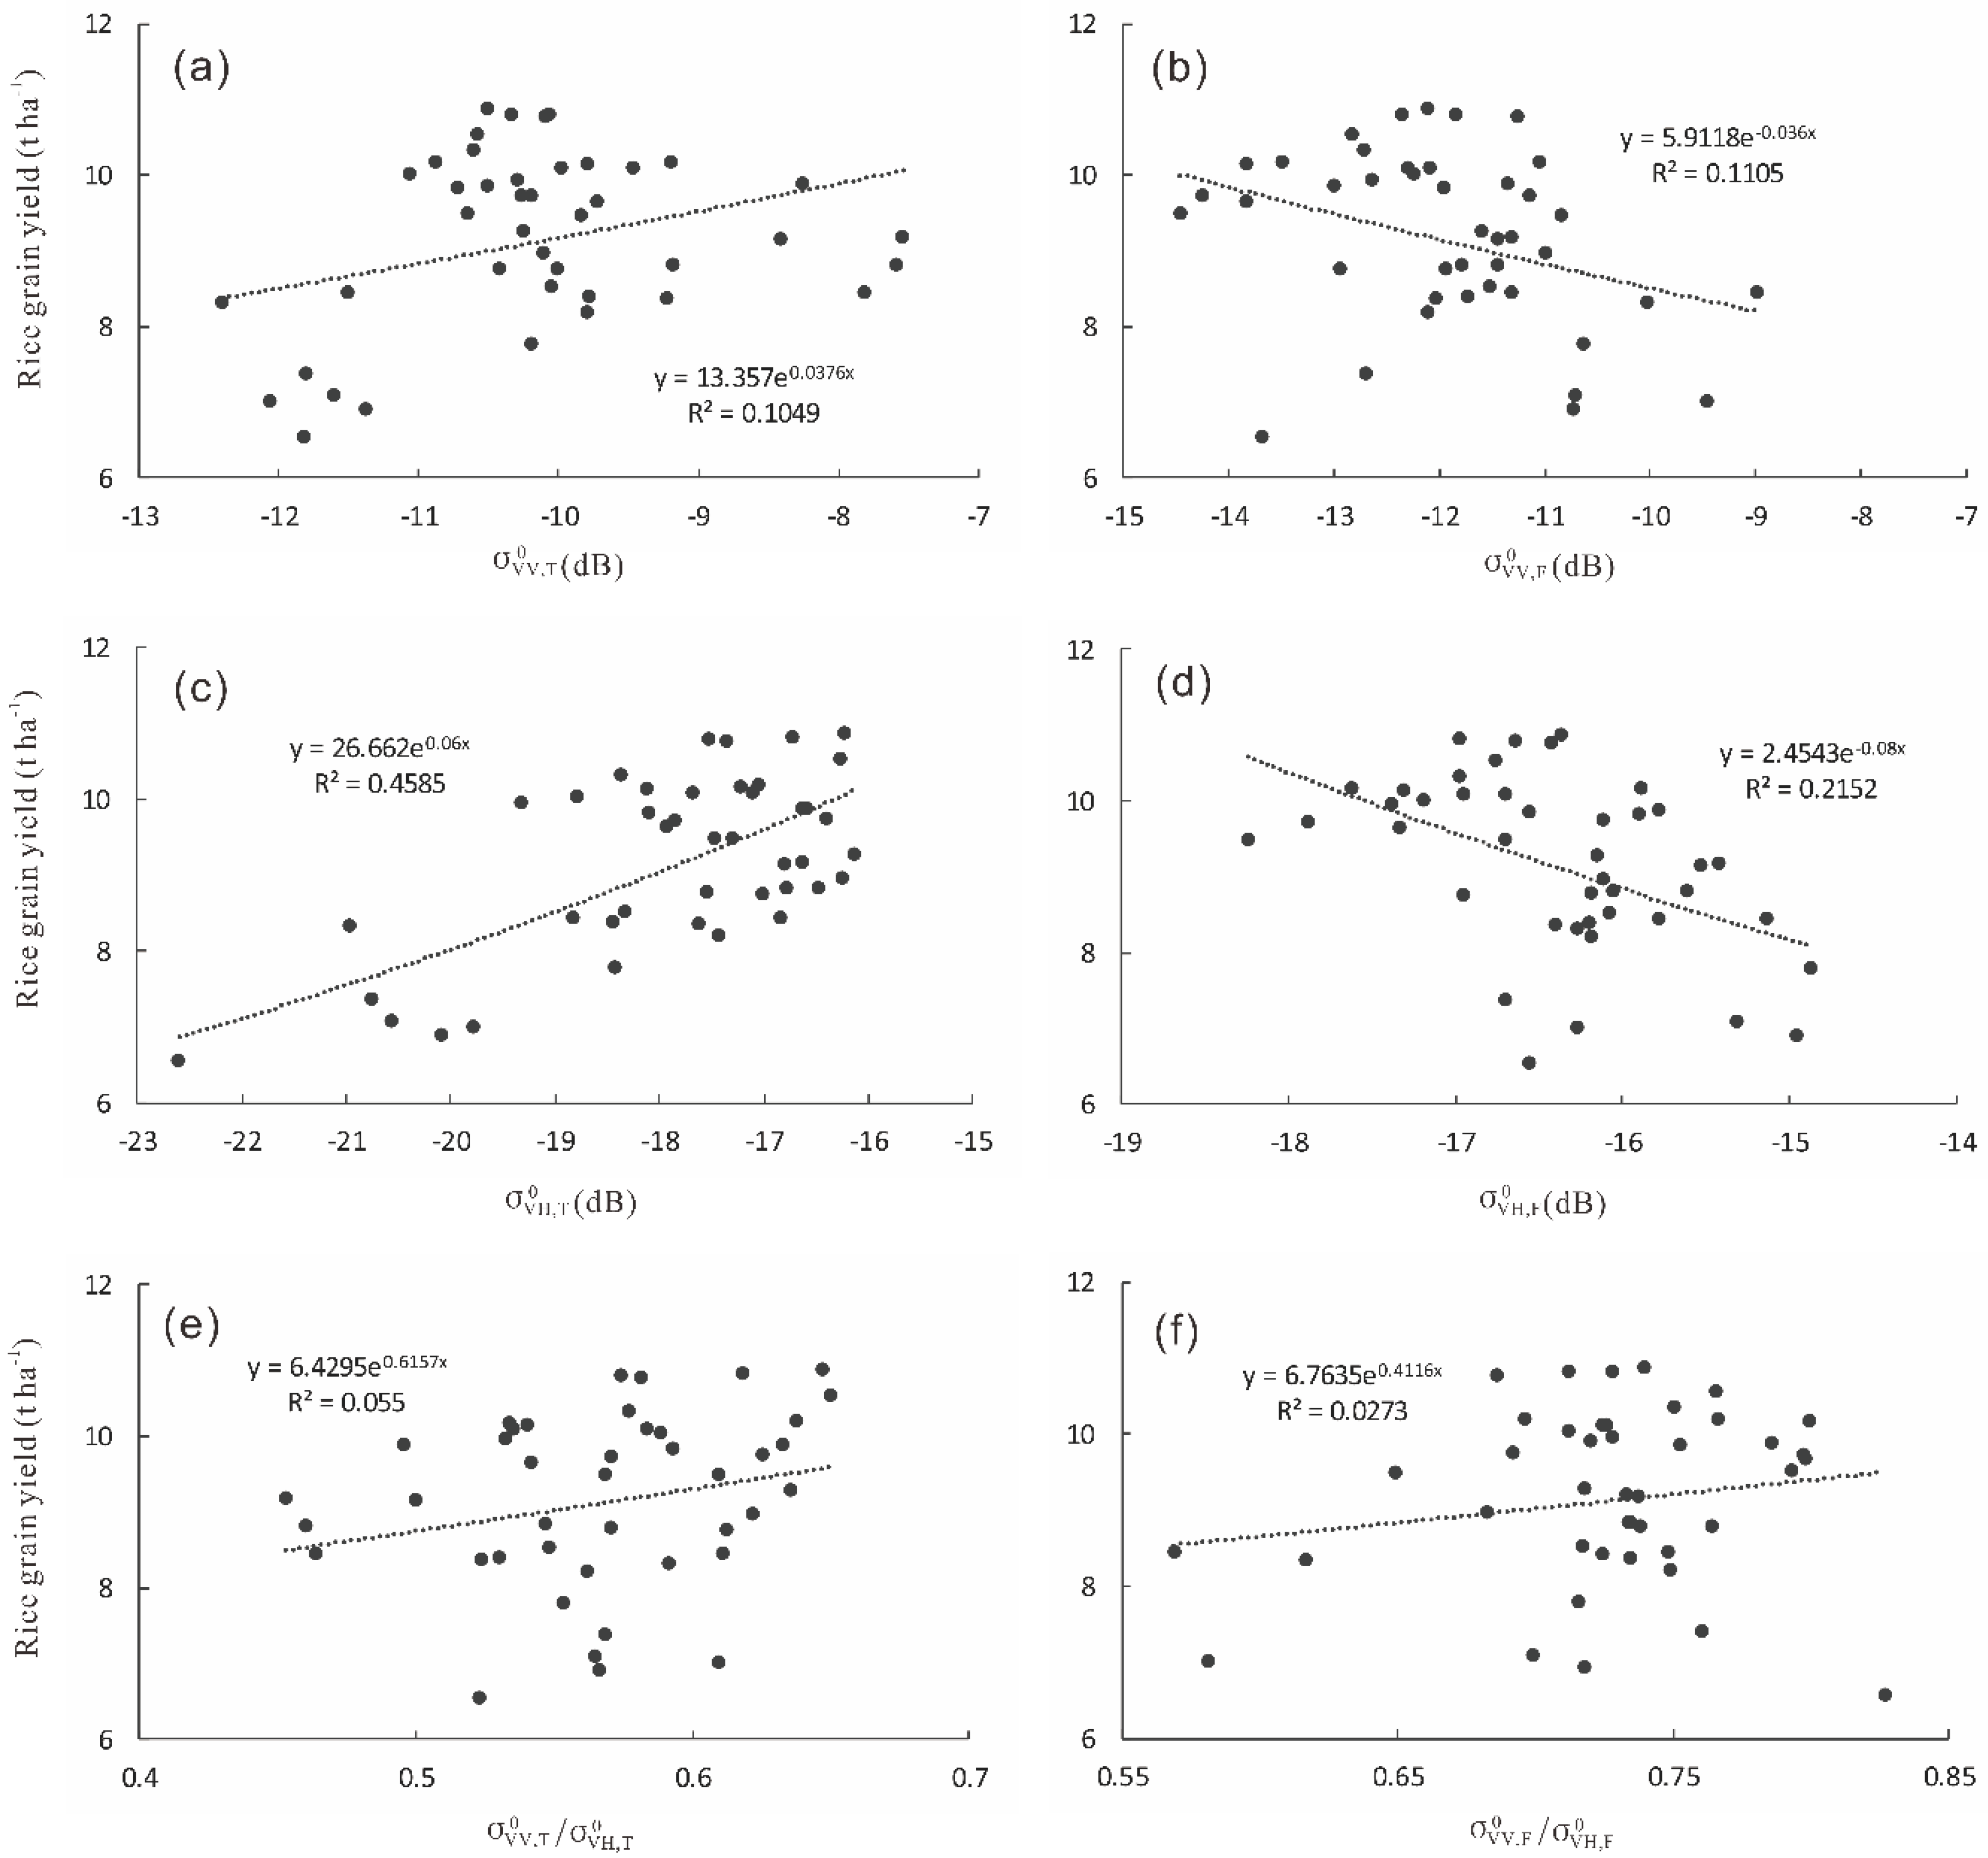
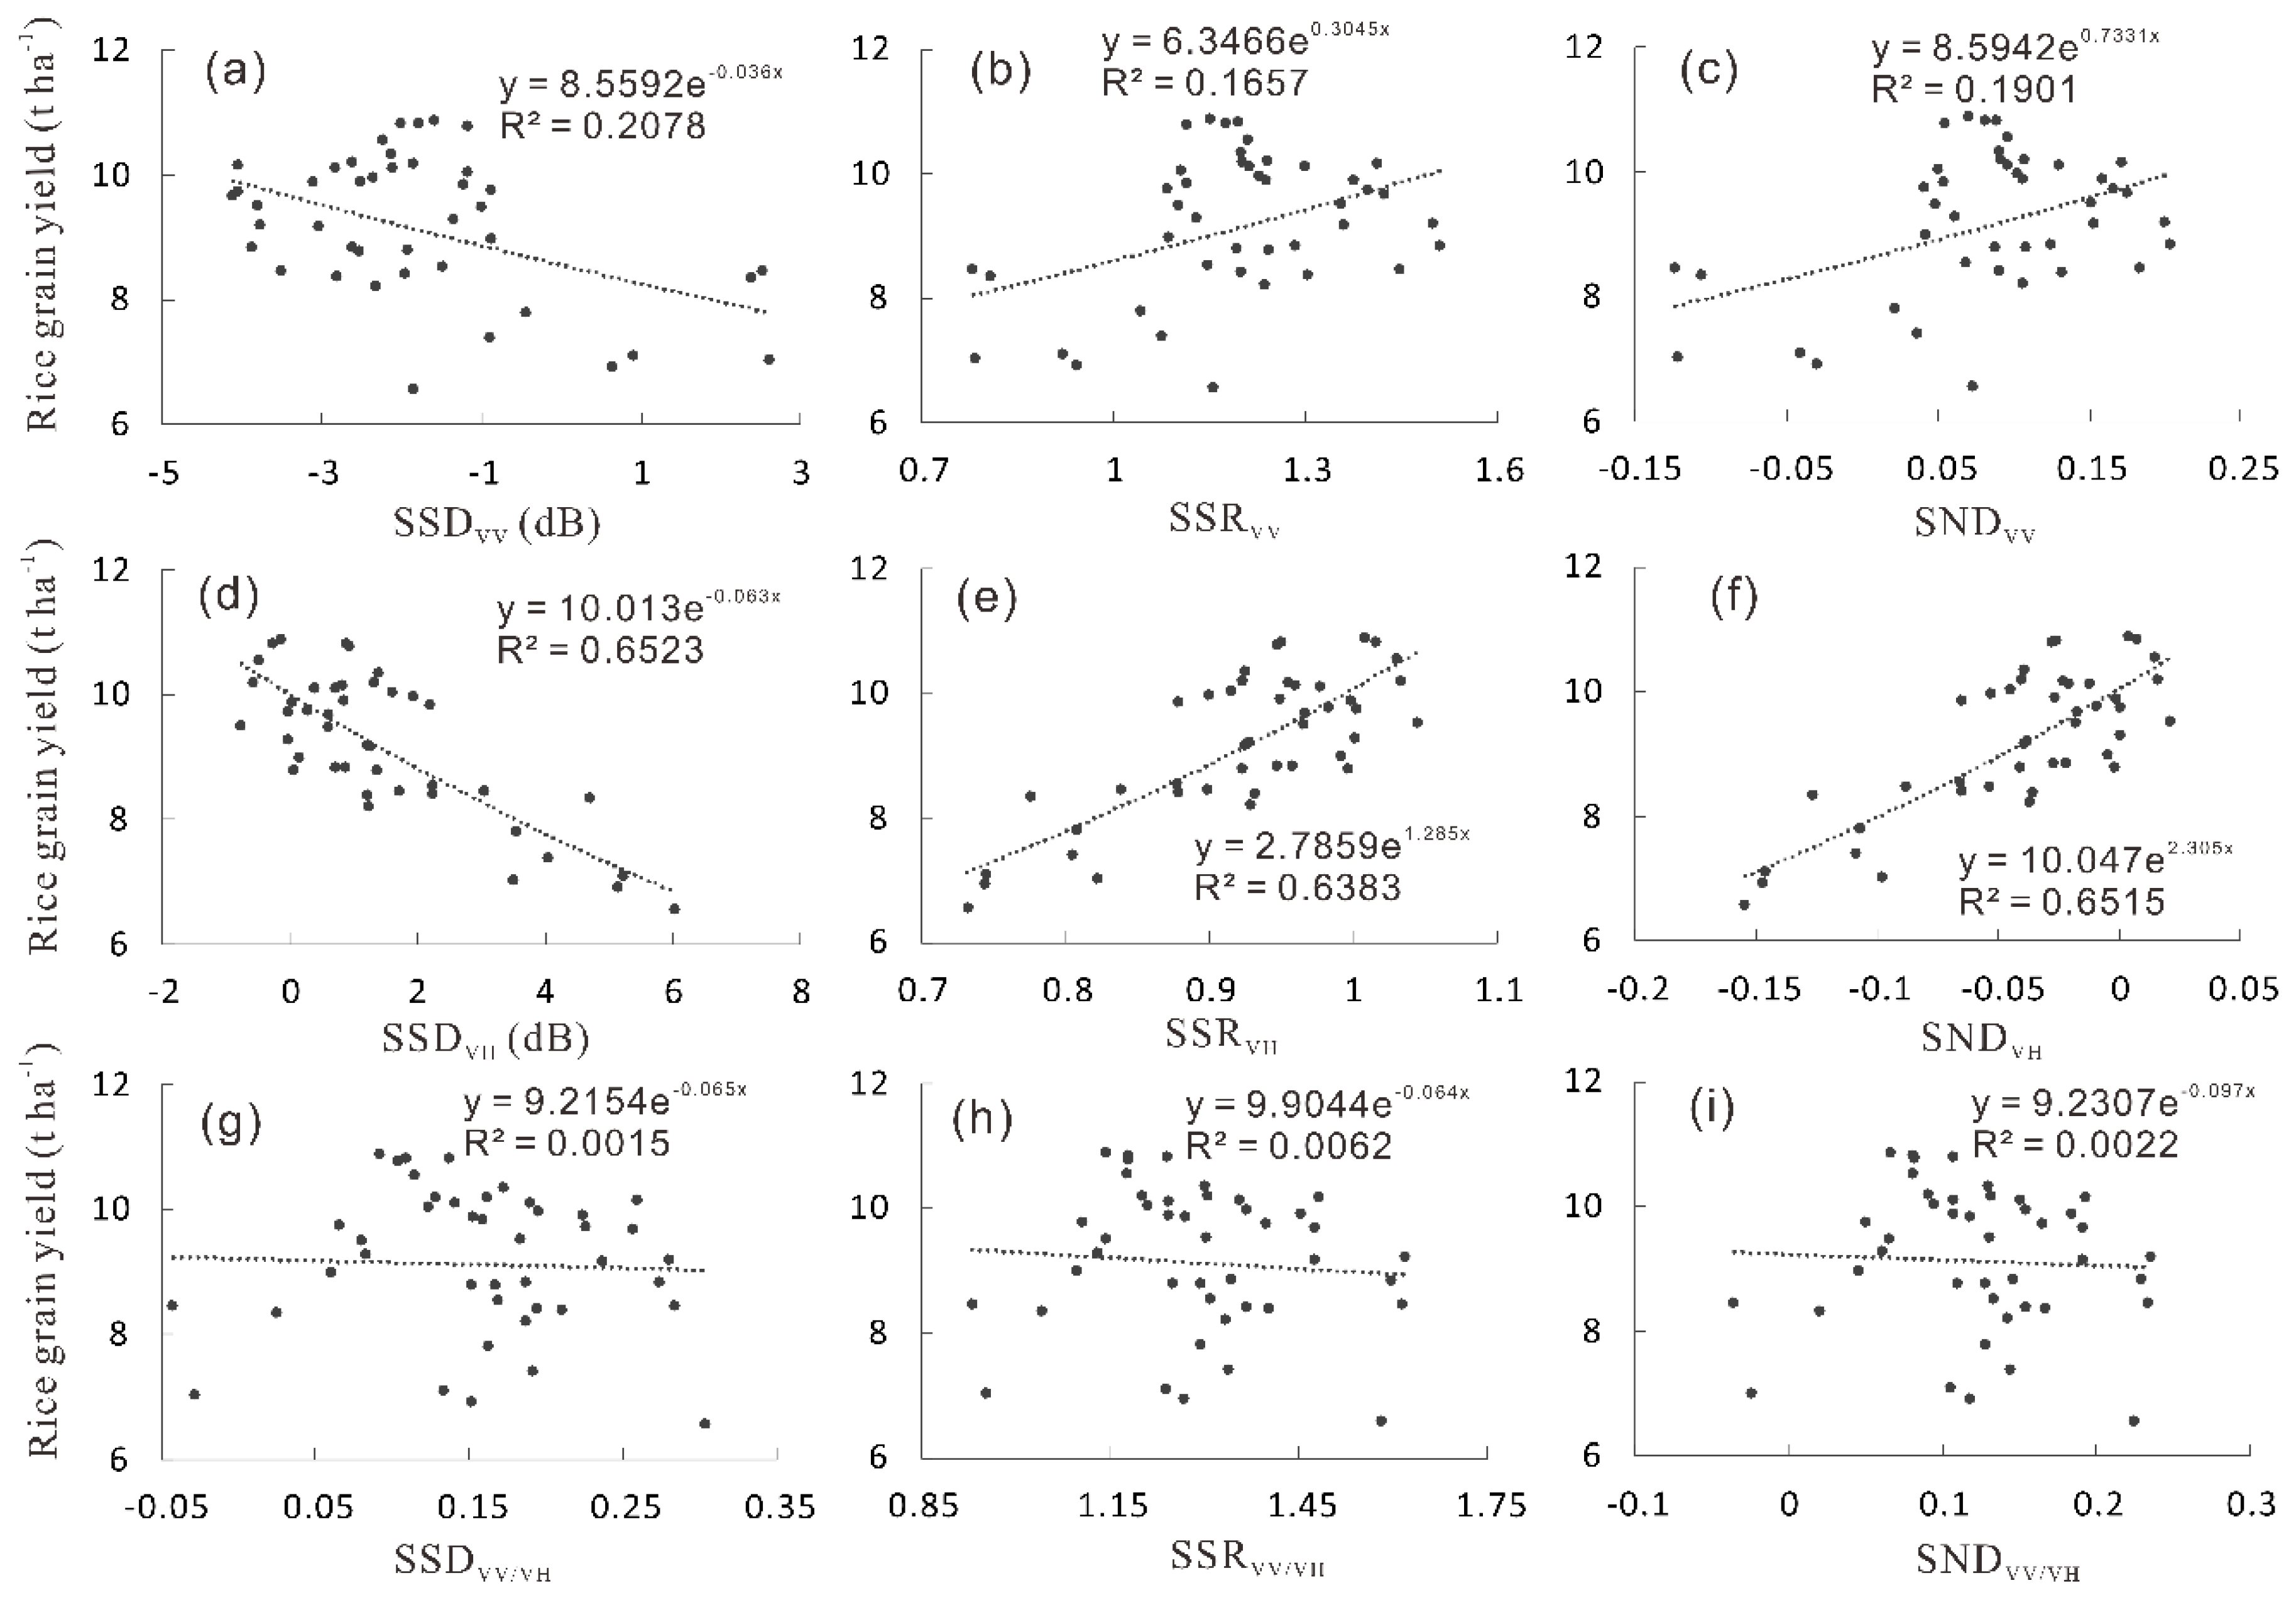
3.1. Relationships Between Rice Grain Yield and SAR Indices at Single Growth Stage

Results from this study revealed that three SAR indices σ V V , T 0 , σ V H , T 0 and σ V H , F 0 showed significant exponential relationships with grain yield at the 95% confidence level (Figure 3). Both σ V V 0 and σ V H 0 at the tillering stage showed positive relationships with grain yield; while at the grain filling stage, negative relationships with grain yield were observed. In comparison, σ V H 0 exhibited stronger relationship with grain yield than σ V V 0 did at either of the two growth stages. Among all six SAR indices calculated at a single growth stage, σ V H , T 0 achieved the highest coefficient of determination (R2) of 0.46.

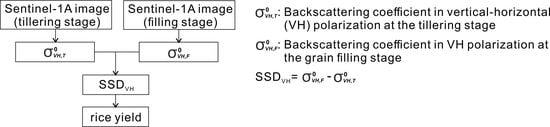
3.2. Relationships Between Rice Grain Yield and SAR Indices Combining Both Growth Stages

As can be seen from Figure 4, six SAR indices (SSDVV, SSRVV, SNDVV, SSDVH, SSRVH and SNDVH) that were calculated using data pooled from both stages had significant exponential relationships with rice grain yield at the 95% confidence level. For both VV and VH polarizations, the SSD indices showed negative relationships, while the SSR and SND indices showed positive relationships with grain yield. In addition, the VH-polarized SSD, SSR and SND indices showed stronger relationships with grain yield than the VV-polarized indices.
Among all nine SAR indices (SSDVV, SSRVV, SNDVV, SSDVH, SSRVH, SNDVH, SSDVV/VH, SSRVV/VH, and SNDVV/VH) combining both growth stages, SSDVH, SSRVH, and SNDVH achieved the highest R2 of 0.65, 0.64, and 0.65, respectively, much higher than the R2 value of 0.46 at a single growth stage achieved by using σ V H , T 0 —the best one among all six SAR indices at the single growth stage.

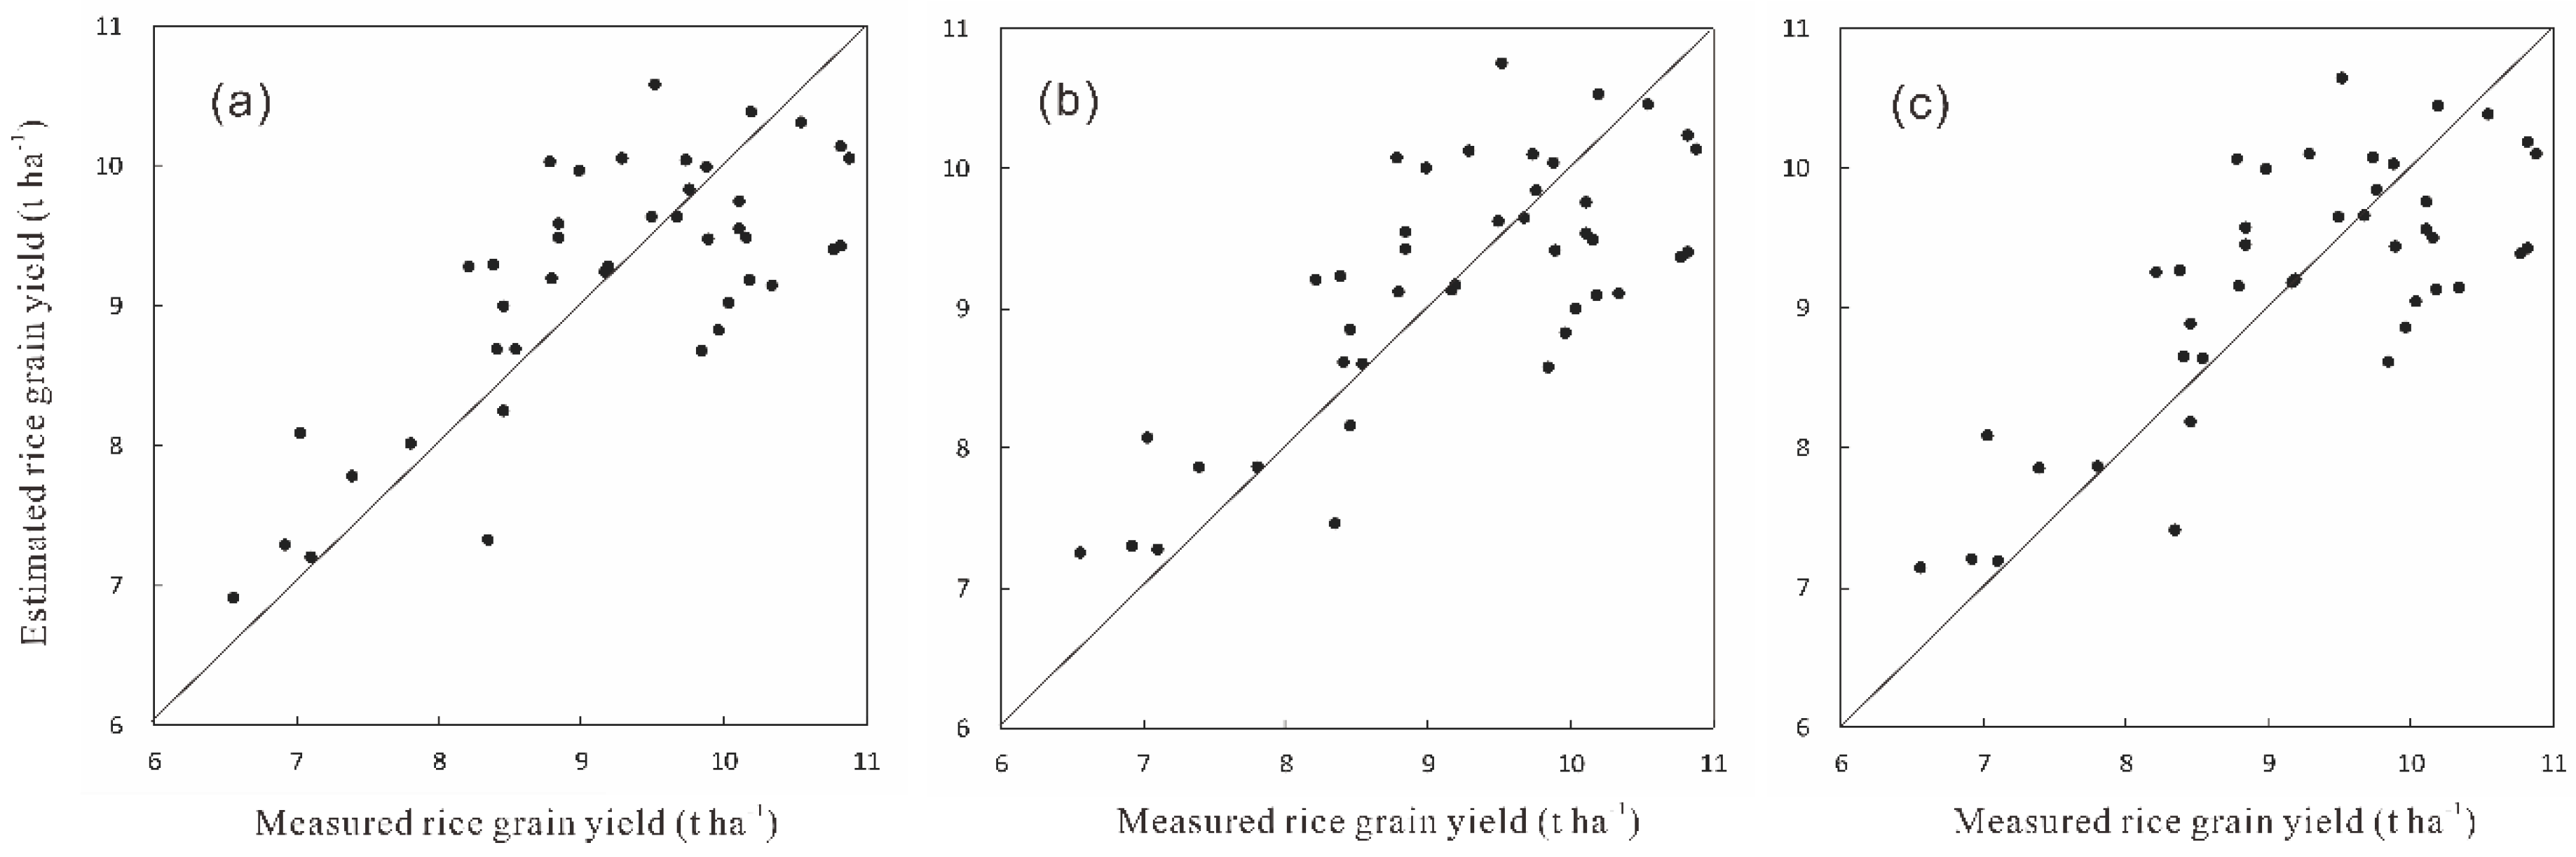
3.3. Determination of Optimum SAR Index

Among all SAR indices tested, three indices (SSDVH, SSRVH, and SNDVH) having the highest R2 values were further evaluated to determine the optimum SAR index as rice grain yield indicator using LOOCV.
As shown in Table 2, SSDVH, SSRVH and SNDVH achieved RMSE of 0.74 t ha−1, 0.75 t ha−1 and 0.74 t ha−1 respectively, and RE of 7.93%, 8.12%, and 7.96%, respectively. Figure 5 shows the scatter plots of measured grain yield against estimated grain yield. All data points are close to the 1:1 line of the three SAR indices. Hence, either one of the three SAR indices can be used for grain yield estimation, while SSDVH produced a slightly better yield estimation with the smallest RE than SSRVH and SNDVH.
The best performed SAR index, SSDVH, for rice grain yield estimation was selected as the optimum remote-sensing indicator for rice grain yield. The resultant rice grain yield estimation model is as follows:
y   =   10.0127526   ×   e 0.063187121   ×   S S D V H ,
where y is rice grain yield in t ha−1, SSDVH is in dB, R2 = 0.65, P < 0.001 and n = 42.

4. Discussion

Figure 3 revealed that grain yield had a much more significant relationship with σ V H 0 at the tillering stage than at the grain filling stage. This might be explained by the fact that the VH backscatter lost its sensitivity to rice growth at the grain filling stage. It has been reported by Inoue et al. that the RADARSAT-2 C-band VH backscatter saturated at high rice leaf area index (LAI), leaf biomass, and total biomass values [21]. Other studies have also reported reduced sensitivity of RADARSAT-2 to the dry biomass of corn, canola, soybeans, and wheat from mid to late season [6]. Similarly, studies have shown that C-band SAR backscatter saturate and become insensitive to further increases in LAI (LAI > 2–3) [22,23].
In the present study, although rice grain yield showed positive relationship with VH backscatter at the end of tillering stage and negative relationship at the end of grain filling stage, the correlations are not strong enough to produce highly accurate yield estimation. By using SSDVH representing the temporal change of σ V H 0 between the two Sentinel-1A image acquisition dates, this study found that the accuracy of SSDVH in yield estimation increased significantly, achieving RMSE of 0.74 t ha−1 and RE of 7.93%. There were five stages between the two image acquisition dates, i.e., internode elongation stage in the vegetative phase of growth, as well as prebooting, booting, heading, and grain filling stages in the reproductive phase of growth. The growth of rice during the five stages was critical to yield formation, and this may explain why the temporal change of σ V H 0 during the five stages had better relationship with rice yield than σ V H 0 at single date had.
This study also found that the three Sentinel-1A C-band cross-polarized backscatter (VH) based indices have better correlation with rice grain yield than co-polarized backscatter (VV) based indices. Although Inoue et al. concluded that rice panicle biomass was best correlated with X-band co-polarized backscatter (VV) [8], most previous works that used C-band SAR confirmed with the results from the present study. For instance, Wiseman et al. reported that RADARSAT-2 polarimetric C-Band SAR HV can discriminate the level of biomass for canola and alfalfa crops [6]. Furthermore, C-band data, Advanced Land Observing Satellite-Phased Array type L-band Synthetic Aperture Radar (ALOS-PALSAR) cross-polarized HV backscatter information also showed a better relationship with the above-ground biomass of different forest types than co-polarized HH did [24]. A possible reason for this may be that the cross-polarized data (HV or VH) mainly originate from multiple scattering within the canopy and are less influenced by the canopy surface condition [25]. In contrast, the co-polarized data (HH or VV) are more sensitive to changes in canopy surface conditions [26]. In addition, SAR backscattering of cross-polarization is insensitive to row direction effect [27].

5. Conclusions, Limitations and Future Research

This study demonstrated the potential of the latest Sentinel-1A C-band SAR data for estimating rice grain yield in a saline field in the coastal region of eastern China. The newly developed SAR index SSDVH, employing the change of VH backscattering between the end of tillering and the end of grain filling stages, exhibits a strong exponential relationship with rice grain yield, RMSE of 0.74 t ha−1 and RE of 7.93%.
This preliminary study used only data from one growing season over a single field. The results also indicate an over estimation of grain yield when the yield was below 9.5 t ha−1 and an under estimation of grain yield when the yield was above 9.5 t ha−1 as revealed in Figure 5. To further perfect the performance, future research should employ multi-year data collected from multiple fields across different geographical conditions. In addition, future research will apply the newly proposed method to study the spatial relationship between rice yield and soil salinity for the proper management of the rice crop in the coastal saline region of Jiangsu Province, China.

Author Contributions

Conceptualization, J.W.; Formal analysis, J.W.; Funding acquisition, J.W. and Q.D. (Qigen Dai); Investigation, J.W., Q.D. (Qixing Dai) and G.Z.; Methodology, J.W.; Supervision, J.W. and Q.D. (Qigen Dai); Visualization, J.W, Q.S., Q.D. (Qixing Dai); Writing—original draft, J.W., J.S. and X.J.; Writing—review and editing, J.W. and J.S.

Funding

This research was funded by Natural Science Foundation of Jiangsu Province, China (grant no. BK20171286), Ministry of Science and Technology of China (project no. 2015BAD01B03), the Key Research and Development Program of Jiangsu Province, China (project no. BE2015337-11), and the Priority Academic Program Development of Jiangsu Higher Education Institutions (PAPD), China.

Acknowledgments

Special thanks to Ms. Hongyan Du, Lianyungang Institute of Agriculture and Reclamation Science, Lianyungang, Jiangsu, for her kind help when we looked for study area.

Conflicts of Interest

The authors declare no conflict of interest.

References

  1. Tan, Y.; He, J.; Yue, W.; Zhang, L.; Wang, Q. Spatial pattern change of the cultivated land before and after the second national land survey in China. J. Nat. Resour. 2017, 32, 186–197, (In Chinese with English Abstract). [Google Scholar]
  2. Jing, P.; Cui, M.; Qin, T.; Zhou, Z.; Dai, Q. Effects of different saline stress on yield and physiological properties of rice in soil culture. Chin. Rice 2017, 23, 26–33, (In Chinese with English Abstract). [Google Scholar]
  3. Siyal, A.A.; Dempewolf, J.; Beckerreshef, I. Rice yield estimation using Landsat ETM+ data. J. Appl. Remote Sens. 2015, 9, 095986. [Google Scholar] [CrossRef]
  4. Liaqat, M.U.; Cheema, M.J.M.; Huang, W.; Mahmood, T.; Zaman, M.; Khan, M.M. Evaluation of MODIS and Landsat multiband vegetation indices used for wheat yield estimation in irrigated Indus Basin. Comput. Electron. Agric. 2017, 138, 39–47. [Google Scholar] [CrossRef]
  5. Canisius, F.; Shang, J.; Liu, J.; Huang, X.; Ma, B.; Jiao, X.; Geng, X.; Kovacs, J.M.; Waters, D. Tracking crop phenological development using multi-temporal polarimetric Radarsat-2 data. Remote Sens. Environ. 2018, 210, 508–518. [Google Scholar] [CrossRef]
  6. Wiseman, G.; McNairn, H.; Homayouni, S.; Shang, J. RADARSAT-2 polarimetric SAR response to crop biomass for agricultural production monitoring. IEEE J. Sel. Top. Appl. Earth Obs. Remote Sens. 2014, 7, 4461–4471. [Google Scholar] [CrossRef]
  7. Toan, T.L.; Ribbes, F.; Wang, L.F.; Floury, N.; Ding, K.H.; Kong, J.A.; Fujita, M.; Kurosu, T. Rice crop mapping and monitoring using ERS-1 data based on experiment and modeling results. IEEE Trans. Geosci. Remote Sens. 1997, 35, 41–56. [Google Scholar] [CrossRef]
  8. Inoue, Y.; Sakaiya, E.; Wang, C. Potential of X-band images from high-resolution satellite SAR sensors to assess growth and yield in paddy rice. Remote Sens. 2014, 6, 5995–6019. [Google Scholar] [CrossRef]
  9. Betbeder, J.; Fieuzal, R.; Baup, F. Assimilation of LAI and dry biomass data from optical and SAR images into an agro-meteorological model to estimate soybean yield. IEEE J. Sel. Top. Appl. Earth Obs. Remote Sens. 2016, 9, 2540–2553. [Google Scholar] [CrossRef]
  10. Fieuzal, R.; Sicre, C.M.; Baup, F. Estimation of sunflower yield using a simplified agrometeorological model controlled by optical and SAR satellite data. IEEE J. Sel. Top. Appl. Earth Obs. Remote Sens. 2017, 10, 5412–5422. [Google Scholar] [CrossRef]
  11. Zhang, Y.; Yang, B.; Liu, X.; Wang, C. Estimation of rice grain yield from dual-polarization Radarsat-2 SAR data by integrating a rice canopy scattering model and a genetic algorithm. Int. J. Appl. Earth Obs. Geoinf. 2017, 57, 75–85. [Google Scholar] [CrossRef]
  12. Yang, H.; Yang, G.; Gaulton, R.; Zhao, C.; Li, Z.; Taylor, J.; Wicks, D.; Minchella, A.; Chen, E.; Yang, X. In-season biomass estimation of oilseed rape (Brassica napus L.) using fully polarimetric SAR imagery. Precis. Agric. 2019, 20, 630–648. [Google Scholar] [CrossRef]
  13. Mandal, D.; Kumar, V.; McNairn, H.; Bhattacharya, A.; Rao, Y.S. Joint estimation of Plant Area Index (PAI) and wet biomass in wheat and soybean from C-band polarimetric SAR data. Int. J. Appl. Earth Obs. Geoinf. 2019, 79, 24–34. [Google Scholar] [CrossRef]
  14. Mateus, P.; Catalão, J.; Nico, G. Sentinel-1 interferometric SAR mapping of precipitable water vapor over a country-spanning area. IEEE Trans. Geosci. Remote Sens. 2017, 55, 2993–2999. [Google Scholar] [CrossRef]
  15. Kussul, N.; Lemoine, G.; Gallego, F.J.; Skakun, S.V.; Lavreniuk, M.; Shelestov, A.Y. Parcel-based crop classification in Ukraine using Landsat-8 data and Sentinel-1A data. IEEE J. Sel. Top. Appl. Earth Obs. Remote Sens. 2016, 9, 2500–2508. [Google Scholar] [CrossRef]
  16. Pan, C.; Chen, Y.; Zha, R.; Ma, Y. Cultivation measures of high-yielding rice and wheat in the region north of the Huaihe River in Jiangsu Province, China. Agric. Technol. Lett. 2013, 4, 167–169. (In Chinese) [Google Scholar]
  17. Meng, Q.D.; Du, H.Y. Effects of different nitrogen application levels on agronomic traits and nitrogen use efficiency (NUE) of paddy rice. Agric. Sci. Jiangsu 2013, 41, 46–48. (In Chinese) [Google Scholar]
  18. Bouvier, M.; Durrieu, S.; Fournier, R.A.; Renaud, J.P. Generalizing predictive models of forest inventory attributes using an area-based approach with airborne LiDAR data. Remote Sens. Environ. 2015, 156, 322–334. [Google Scholar] [CrossRef]
  19. Jamieson, P.D.; Porter, J.R.; Wilson, D.R. A test of the computer simulation model ARC-WHEAT1 on wheat crops grown in New Zealand. Field Crops Res. 1991, 27, 337–350. [Google Scholar] [CrossRef]
  20. Wang, J.J.; Lu, X.X. Estimation of suspended sediment concentrations using Terra MODIS: An example from the Lower Yangtze River, China. Sci. Total Environ. 2010, 408, 1131–1138. [Google Scholar] [CrossRef]
  21. Inoue, Y.; Sakaiya, E.; Wang, C. Capability of C-band backscattering coefficients from high-resolution satellite SAR sensors to assess biophysical variables in paddy rice. Remote Sens. Environ. 2014, 140, 257–266. [Google Scholar] [CrossRef]
  22. Ulaby, F.T.; Allen, C.T.; Eger, G., III; Kanemasu, E. Relating the microwave backscattering coefficient to leaf area index. Remote Sens. Environ. 1984, 14, 113–133. [Google Scholar] [CrossRef]
  23. Jiao, X.; McNairn, H.; Shang, J.; Pattey, E.; Liu, J.; Champagne, C. The sensitivity of RADARSAT-2 polarimetric SAR data to corn and soybean leaf area index. Can. J. Remote Sens. 2011, 37, 69–81. [Google Scholar] [CrossRef]
  24. Thumaty, K.C.; Fararoda, R.; Middinti, S.; Gopalakrishnan, R.; Jha, C.S.; Dadhwal, V.K. Estimation of above ground biomass for central Indian deciduous forests using ALOS PALSAR L-band data. J. Indian Soc. Remote Sens. 2016, 44, 31–39. [Google Scholar] [CrossRef]
  25. Ranson, K.J.; Sun, G. Mapping biomass of a northern forest using multifrequency SAR data. IEEE Trans. Geosci. Remote Sens. 1994, 32, 388–396. [Google Scholar] [CrossRef]
  26. Ghasemi, N.; Sahebi, M.R.; Mohammadzadeh, A. A review on biomass estimation methods using synthetic aperture radar data. Int. J. Geomat. Geosci. 2011, 1, 776–788. [Google Scholar]
  27. McNairn, H.; Brisco, B. The application of C-band polarimetric SAR for agriculture: A review. Can. J. Remote Sens. 2004, 30, 525–542. [Google Scholar] [CrossRef]
Figure 1. Map shows the location of the study area and the spatial distribution of 42 sampling sites within the field.
Remotesensing 11 02274 g001
Figure 2. Maps show measured rice grain yields at 42 sampling sites overlaid on top of images of VV ((a) & (b)) and VH ((c) & (d)) backscatter values ( σ 0 ) in decibels (dB) calculated from two Sentinel-1A synthetic aperture radar (SAR) images acquired on July 19, 2016 ((a) & (c)) and September 29, 2016 ((b) & (d)).
Remotesensing 11 02274 g002
Figure 3. Scatter plots of SAR indices at single growth stage (x-axis) and grain yield (y-axis). (a), (c) & (e) tillering stage, (b), (d) & (f) grain filling stage.
Remotesensing 11 02274 g003
Figure 4. Scatter plots of SAR indices combining both growth stages (x-axis) and grain yield (y-axis). (a) SSDVV, (b) SSRVV, (c) SNDVV, (d) SSDVH, (e) SSRVH, (f) SNDVH, (g) SSDVV/VH, (h) SSRVV/VH, (i) SNDVV/VH.
Remotesensing 11 02274 g004
Figure 5. Comparison between the measured rice grain yield and the grain yield estimated from the leave-one-out cross-validation (LOOCV) using SSDVH (a), SSRVH (b) and SNDVH (c), respectively. The diagonal lines showed the 1:1 relationship.
Remotesensing 11 02274 g005
Table 1. Used 15 SAR indices in this study.
IndexFormula
σ V V , T 0 σ V V , T 0
σ V H , T 0 σ V H , T 0
σ V V , F 0 σ V V , F 0
σ V H , F 0 σ V H , F 0
σ V V , T 0 / σ V H , T 0 σ V V , T 0 / σ V H , T 0
σ V V , F 0 / σ V H , F 0 σ V V , F 0 / σ V H , F 0
SSDVV σ V V , F 0 σ V V , T 0
SSRVV σ V V , F 0 / σ V V , T 0
SNDVV ( σ V V , F 0 σ V V , T 0 ) / ( σ V V , F 0 + σ V V , T 0 )
SSDVH σ V H , F 0 σ V H , T 0
SSRVH σ V H , F 0 / σ V H , T 0
SNDVH ( σ V H , F 0 σ V H , T 0 ) / ( σ V H , F 0 + σ V H , T 0 )
SSDVV/VH σ V V , F 0 / σ V H , F 0 σ V V , T 0 / σ V H , T 0
SSRVV/VH ( σ V V , F 0 / σ V H , F 0 ) / ( σ V V , T 0 / σ V H , T 0 )
SNDVV/VH ( σ V V , F 0 / σ V H , F 0 σ V V , T 0 / σ V H , T 0 ) / ( σ V V , F 0 / σ V H , F 0 + σ V V , T 0 / σ V H , T 0 )
1T denotes the tillering stage and F denotes the grain filling stage.
Table 2. Quantitative relationships between SAR indices and rice grain yield by the leave-one-out cross-validation (LOOCV).
IndexR2RMSE (t ha−1)RE (%)
SSDVH0.650.747.93
SSRVH0.640.758.12
SNDVH0.650.747.96

