Article

Validation of AERONET-Estimated Upward Broadband Solar Fluxes at the Top-Of-The-Atmosphere with CERES Measurements

by
Michaël Sicard
1,2
1
CommSensLab, Dept. of Signal Theory and Communications, Universitat Politècnica de Catalunya (UPC), 08034 Barcelona, Spain
2
Ciències i Tecnologies de l’Espai-Centre de Recerca de l’Aeronàutica i de l’Espai/Institut d’Estudis Espacials de Catalunya (CTE-CRAE/IEEC), Universitat Politècnica de Catalunya (UPC), 08034 Barcelona, Spain
Remote Sens. 2019, 11(18), 2168; https://doi.org/10.3390/rs11182168
Submission received: 16 July 2019 / Revised: 10 September 2019 / Accepted: 13 September 2019 / Published: 18 September 2019
(This article belongs to the Section Atmospheric Remote Sensing)

Abstract

:
The AERONET (Aerosol Robotic Network) global network provides estimations of broadband solar radiative fluxes at the surface and at the TOA (Top-Of-the-Atmosphere). This paper reports on the validation of AERONET flux estimations at the TOA with the CERES (Clouds and the Earth’s Radiant Energy System) instrument. The validation was made at eight AERONET sites worldwide with at least seven years of Level 2.0 and Version 3 data and representatives of mineral dust, biomass burning, background continental, and urban-industrial aerosol regimes. To co-locate in time and space the AERONET and CERES fluxes, several criteria based on time and distance differences and cloud coverage were defined. When the strictest criterion was applied to all sites, the linear relationship between the observed and estimated fluxes (y = 1.04x – 3.67 Wm−2) was very close to the 1:1 ideal line. The correlation coefficient was 0.96 and nearly all points were contained in the ±15% region around the 1:1 line. The average flux difference was –2.52 Wm−2 (−0.84% in relative terms). AERONET overestimations were observed at two sites and were correlated with large aerosol optical depth (AOD) (>0.2) Underestimations were observed at one desert site and were correlated with large surface albedos (>0.2).

Graphical Abstract

1. Introduction

AERONET (Aerosol Robotic Network) is a well-known monitoring network of atmospheric aerosols at the global scale [1]. The inversion of the direct sun and diffuse sky radiance measurements gives a long list of aerosol and atmospheric properties, among them the broadband solar radiative fluxes at the surface and at the TOA (top of the atmosphere) in both upward and downward directions. These fluxes, if estimated with a known uncertainty, are precious information for the calculation of the radiative forcing effects produced by atmospheric aerosols. In this sense, the advantage of the broad and dense spatial coverage of AERONET sites at the global scale (>600 instruments in 2018 [2]) is certainly an added value.
While AERONET-estimated surface fluxes have been compared with surface flux measurements collected during the AMMA (African Monsoon Multidisciplinary Analysis) campaign by [3] and validated worldwide with surface flux measurements of networked pyranometers by [4], the TOA fluxes have never been validated in an intensive manner. The purpose of this article is to perform a validation, or at least to present a statistically representative estimation of the quality of AERONET-estimated TOA upward solar fluxes by comparing them with satellite measurements. A similar approach was undertaken by [5] who did a comparison at eight AERONET sites for a period of three years between TOA upward solar fluxes estimated not directly from AERONET but with a column radiative model parametrized with AERONET data, and fluxes measured by CERES (Clouds and the Earth’s Radiant Energy System) onboard the NASA Terra satellite. They used monthly mean values and a very coarse spatial resolution of CERES data of 2.5º × 2.5º and found discrepancies (underestimation and overestimation depending on the site) of up to 17%. More recently, [6] made first time comparisons of AERONET TOA fluxes with CERES measurements. Their research was limited to three AERONET insular sites in the western Mediterranean basin and to data spanning the time range 2008–2014. Their dataset consisted of 29 coincident points that were the result of a tedious selection of the data to cope with land/water contaminated CERES pixels and the effect of sun glint above the sea.
The work involved in this paper consists of elaborating two databases of TOA upward solar fluxes above sites influenced by key aerosol types (mineral dust, biomass burning, urban-industrial and continental background): One of AERONET-estimated fluxes and another one of space-time co-located satellite-based fluxes measured by CERES. After the definition of the space-time co-location criteria, the comparison of both AERONET estimations and CERES measurements is performed in order to validate AERONET estimations for each one of the aerosol types considered, and as a whole. The discrepancies found, if any, of either underestimation or overestimation of AERONET fluxes, are discussed as a function of optical depth, Ångström exponent, and surface albedo.

2. Materials and Methods

2.1. Instruments

2.1.1. AERONET

AERONET is a federated global network of ground-based sun/sky-photometers [1] which retrieves optical properties in the total atmospheric column derived from direct and diffuse radiation measurements. AERONET inversion products include aerosol parameters both retrieved (i.e., size distribution, complex refractive index, and partition of spherical/non-spherical particles) and calculated (e.g., phase function, single scattering albedo, spectral and broad-band fluxes) on the basis of the retrieved aerosol properties. Among these calculated parameters, one finds the upward flux at the TOA in the spectral interval of 0.2 to 4 μm, F A E R S W , , T O A . A brief description of the inversion assumptions and flux calculations is given in [7] and in the AERONET Inversion Products (Version 3) [8]. In brief, the flux calculation relies on the interpolation/extrapolation in the whole shortwave spectral range of the retrieved real part and imaginary part of the refractive index at AERONET wavelengths and of the assumed surface albedo at AERONET wavelengths. The assumed surface albedo is modelled by different BRDF (Bidirectional Reflectance Distribution Function) models depending on the surface type [8,9]. The gaseous absorption is accounted using the GAME (Global Atmospheric ModEl) radiative transfer model [10]. This model performs spectral integration using the correlated-k distribution based on line-by-line simulations [11]. As mentioned in the introduction, while the validation of AERONET downward flux at the surface has been performed against surface radiation measurements by [4], very little is known about the validity of AERONET flux estimates at the TOA.
The data shown in this work are based on instantaneous AERONET Level 2.0 (L2.0), cloud-screened and quality-assured data [12] inverted with the AERONET Version 3 (V3) retrieval algorithm [2]. All AERONET data are downloaded from the AERONET web page at http://aeronet.gsfc.nasa.gov/. In practice, the main difference between Version 2 and Version 3 is the full automation of the cloud screening and instrument anomaly quality controls.

2.1.2. CERES

CERES is a 3-channel radiometer measuring the reflected solar radiation in the 0.3–5 µm wavelength band, the emitted terrestrial radiation in the 8–12 µm band, and the total radiation from 0.3 µm to beyond 100 µm [13]. The ±78° cross-track mode of the radiometer defines a large swath that allows for complete coverage of the Earth surface. The CERES instrument is currently onboard four satellites: Aqua, Terra, Suomi National Polar-orbiting Partnership (S-NPP), and NOAA-20 (formerly JPSS-1, named after the Joint Polar Satellite System–1 mission). However data of CERES/NOAA-20 are not available yet. CERES Data from Terra, Aqua, and S-NPP are used here, indistinctively. To fulfill the space-time co-location criterion, the only CERES data product useful for our study is the instantaneous Single Scanner Footprint (SSF) product which is given at the resolution of the field-of-view instantaneous footprint (20 km at nadir). We used SSF Level 2 Edition 4 products for CERES/Terra (1 March 2000 to 31 October 2018) and Aqua (3 July 2002 to 31 October 2018), and SSF Level 2 Edition 1 for CERES/S-NPP (27 January 2012 to 31 December 2018). All CERES data were downloaded from the CERES subsetting and browsing web page at https://ceres-tool.larc.nasa.gov/ord-tool/products?CERESProducts=SSFlevel-2_Ed4. CERES measures the upward energy (radiance) at the TOA. Shortwave upward fluxes are estimated using angular distribution models (ADMs) described by [14,15]. In this work we used the CERES shortwave TOA flux-upward (SSF-38) product, F C E R S W , , T O A . In addition to the upward shortwave fluxes, we also downloaded the clear-sky fraction (SSF-81) which gives the portion of the CERES field-of-view for clear sky and up to two cloud layer combinations. In particular, we used the first coverage corresponding to clear sky. Finally the broadband surface albedo (SSF-50) was also downloaded to investigate possible correlations between the difference observed and the surface albedo at each site. This parameter is based on broadband albedo lookup tables, derived from on field observations, for each of the 17 IGBP (International Geosphere–Biosphere Programme) surface types and three surface types defined for CERES (tundra, fresh snow, and sea ice). For the calculation of the broadband surface albedo, up to 8 surface types per pixel can be considered. Values are scaled by the percent coverage of the corresponding surface type and summed. Information about these products can be found in the CERES collection guides available at https://ceres.larc.nasa.gov/collect_guide.php. In the CERES Data Quality Summaries available at: https://ceres.larc.nasa.gov/dqs.php for the different satellites and editions, one finds the data quality of the estimated fluxes which highly depends on the scene classification and the ADMs used to convert the measured radiance in a radiative flux [16]. To calculate an overall flux uncertainty for CERES/Terra (Aqua) we considered the largest seasonal value of the regional mean all-sky SW TOA flux bias, –0.20 (–0.17) Wm−2, and the RMS error, 0.91 (0.87) Wm−2. In addition, and because we do not know a priori the satellite viewing angle, we also summed up the relative RMS errors due to the difference between nadir-viewing and oblique-viewing (50–60º) in clear-sky conditions: 4.2%. No data quality summary has been released yet for CERES/S-NPP. Thus, in order to stay on the safe side, we apply the worst accuracy (CERES/Terra) to all CERES fluxes, i.e.,
0.20 ± 0.91 ± F C E R S W , , T O A × 0.042 = + 0.71 / 1.11 ± F C E R S W , , T O A × 0.042 W m 2 ,

2.2. Strategy

Although initially the idea was to validate AERONET TOA upward fluxes at the same AERONET stations as the validation at the surface performed by [4], we quickly found out that space-truths (as opposed to ground-truths) are much more tedious to obtain in a reliable manner. Since the database of CERES is almost 18 years long, we looked for the AERONET stations with the longest records (>15 years). Only four AERONET stations have more than 15 years of V3L2.0 data: Banizoumbou, GSFC, Mauna Loa, and Sede Boker. These stations are included in this study. We then looked for stations with data for more than 10 years, and, if not, for more than 7 years. Besides the length of the AERONET records at a specific sites, we also wanted to select stations attempting to cover different aerosol influences: Mineral dust (MD), biomass burning (BB), background continental (BC), and urban-industrial (UI). Conversely to [4] and although Mauna Loa was initially considered in our work, the aerosol regimes of the free troposphere (Mauna Loa) and maritime aerosols were not further studied because of the complexity of extracting the radiative fluxes from space over dark surfaces (oceans) or over land surrounded by oceans in a reliable manner. With these criteria, we finally selected two AERONET stations per aerosol type considered. They are listed in Table 1 and their geographic position is shown in Figure 1. It is important to note the inherent limitation of the aerosol type representativeness of the selected sites due to the selection process itself. In such conditions, MD is probably more representative of North African mineral dust, BB of Brazilian biomass burning, and BC of Canadian background continental.

2.2.1. Space-Time Co-Location Criteria

To guarantee the most exact possible space-time co-location of both AERONET estimates and CERES measurements we had to define several criteria based on the time difference, Δt, between AERONET estimates and CERES measurements, and on the distance difference, Δr, between AERONET coordinates and the center of the CERES pixel footprint. To guarantee time co-location we first allowed a restrictive criterion of 1 min on the time difference. With such a criterion, no coincidence was found in most of the stations. The main reason lies in the equator crossing time of the CERES satellites. For example CERES/Terra (Aqua) has a 10:30 AM (1:30 PM) equator crossing time. For small solar zenith angles near solar noon, when an optical airmass of 2 or less is not achieved, AERONET almucantar sequences (needed for the inversion algorithm) are made only hourly between 9:00 AM and 3:00 PM local solar time for the standard instrument and skipping only the noon almucantar for the polarization instrument [1]. Latitude-wise, most of our selected AERONET stations are not too far from the equator (see Figure 1), and in such conditions the AERONET measurements to compare are available only hourly at the best: The 1-min criterion was too restrictive. Then we tried a criterion of 5 min on the time difference. This criterion worked well at some stations but not at others. So, our first criterion was set to Δt < 5 min and a distance difference Δr < 10 km. This criterion, called 1a (see Table 2), is the most restrictive. As CERES SSF products are given at the instantaneous footprint resolution of diameter 20 km at nadir, a 10-km difference allows us to select usually no more than one pixel at a time, namely, the only one containing the AERONET coordinates. In very few cases the AERONET coordinates fall into the intersection of two CERES pixels, which results in two CERES coincident measurements for one AERONET estimate. These cases are not problematic if the assumption is made that both pixels are looking at nearly the same target, and they present the great advantage of enlarging the dataset, and thus of improving the statistics. At the stations with poor datasets with criterion 1a we also defined criterion 1b with Δt < 5 min and Δr < 20 km for the same purpose of improving the statistics. For the rest of the stations with no or almost no time co-located data with Δt < 5 min, we set a much smoother criterion of Δt < 60 min associated again to Δr < 10 km (criterion 2a) or to Δr < 20 km (criterion 2b). Criterion 1b (2b) was applied when the criterion 1a (2a) resulted in a number of points less than 40.
Finally we also force all cases to be clear-sky cases by selecting only cases with a CERES clear-sky fraction larger than 97%. The definition of the criteria used is given in Table 2.

2.2.2. Corrections Applied

The spectral ranges of AERONET (0.2 to 4 μm) and CERES (0.3 to 5 μm) are slightly different. The shift of AERONET spectral range towards the ultra violet almost compensates the loss in the infrared. By means of a radiative transfer model, we performed various simulations of the diurnal cycle (from sunset to sunrise) of the upward fluxes at the TOA in both AERONET and CERES spectral ranges. These simulations showed that in the same conditions, the ratio of these fluxes (CERES divided by AERONET) was 0.998, which only started varying after the fourth digit. We multiplied all values of F A E R S W , , T O A by this value of 0.998 in order to correct the very slight increase of radiation detected by AERONET with respect to CERES.
Criteria 2a and 2b (Δt < 60 min) can obviously lead to significant differences in the fluxes measured/estimated, since a 60-min difference at the hour of the day of highest solar flux gradient can lead to differences in solar zenith angles (SZA) of ~10º and to differences in the solar fluxes of up to 20%. To cope with this problem, we perform an SZA correction on AERONET fluxes. The SZA correction is a two-step process. We first look for space-time co-located AERONET and CERES data without correction to get an estimate of the period of occurrence of these coincidences and of the mean SZA difference between both datasets (Table 3). Then we use a radiative transfer model, namely, GAME (the Global Atmospheric Model) described in [10,17], at the coordinates of the AERONET station and for the day corresponding to the middle of the occurrence period (overpass time in Table 3) to get an estimation of the upward shortwave fluxes at the TOA, i.e., the radiation reflected back to space, F S W , , T O A , as a function of solar time. We look for the solar zenith angles corresponding to our mean values, S Z A C E R ¯ and S Z A A E R ¯ , and calculate a correction factor as
C F = F S W , , T O A ( S Z A C E R ¯ ) F S W , , T O A ( S Z A A E R ¯ ) ,
This correction factor multiplied to F A E R S W , , T O A simulates, on average, the TOA upward solar flux that AERONET would have detected at CERES SZA.

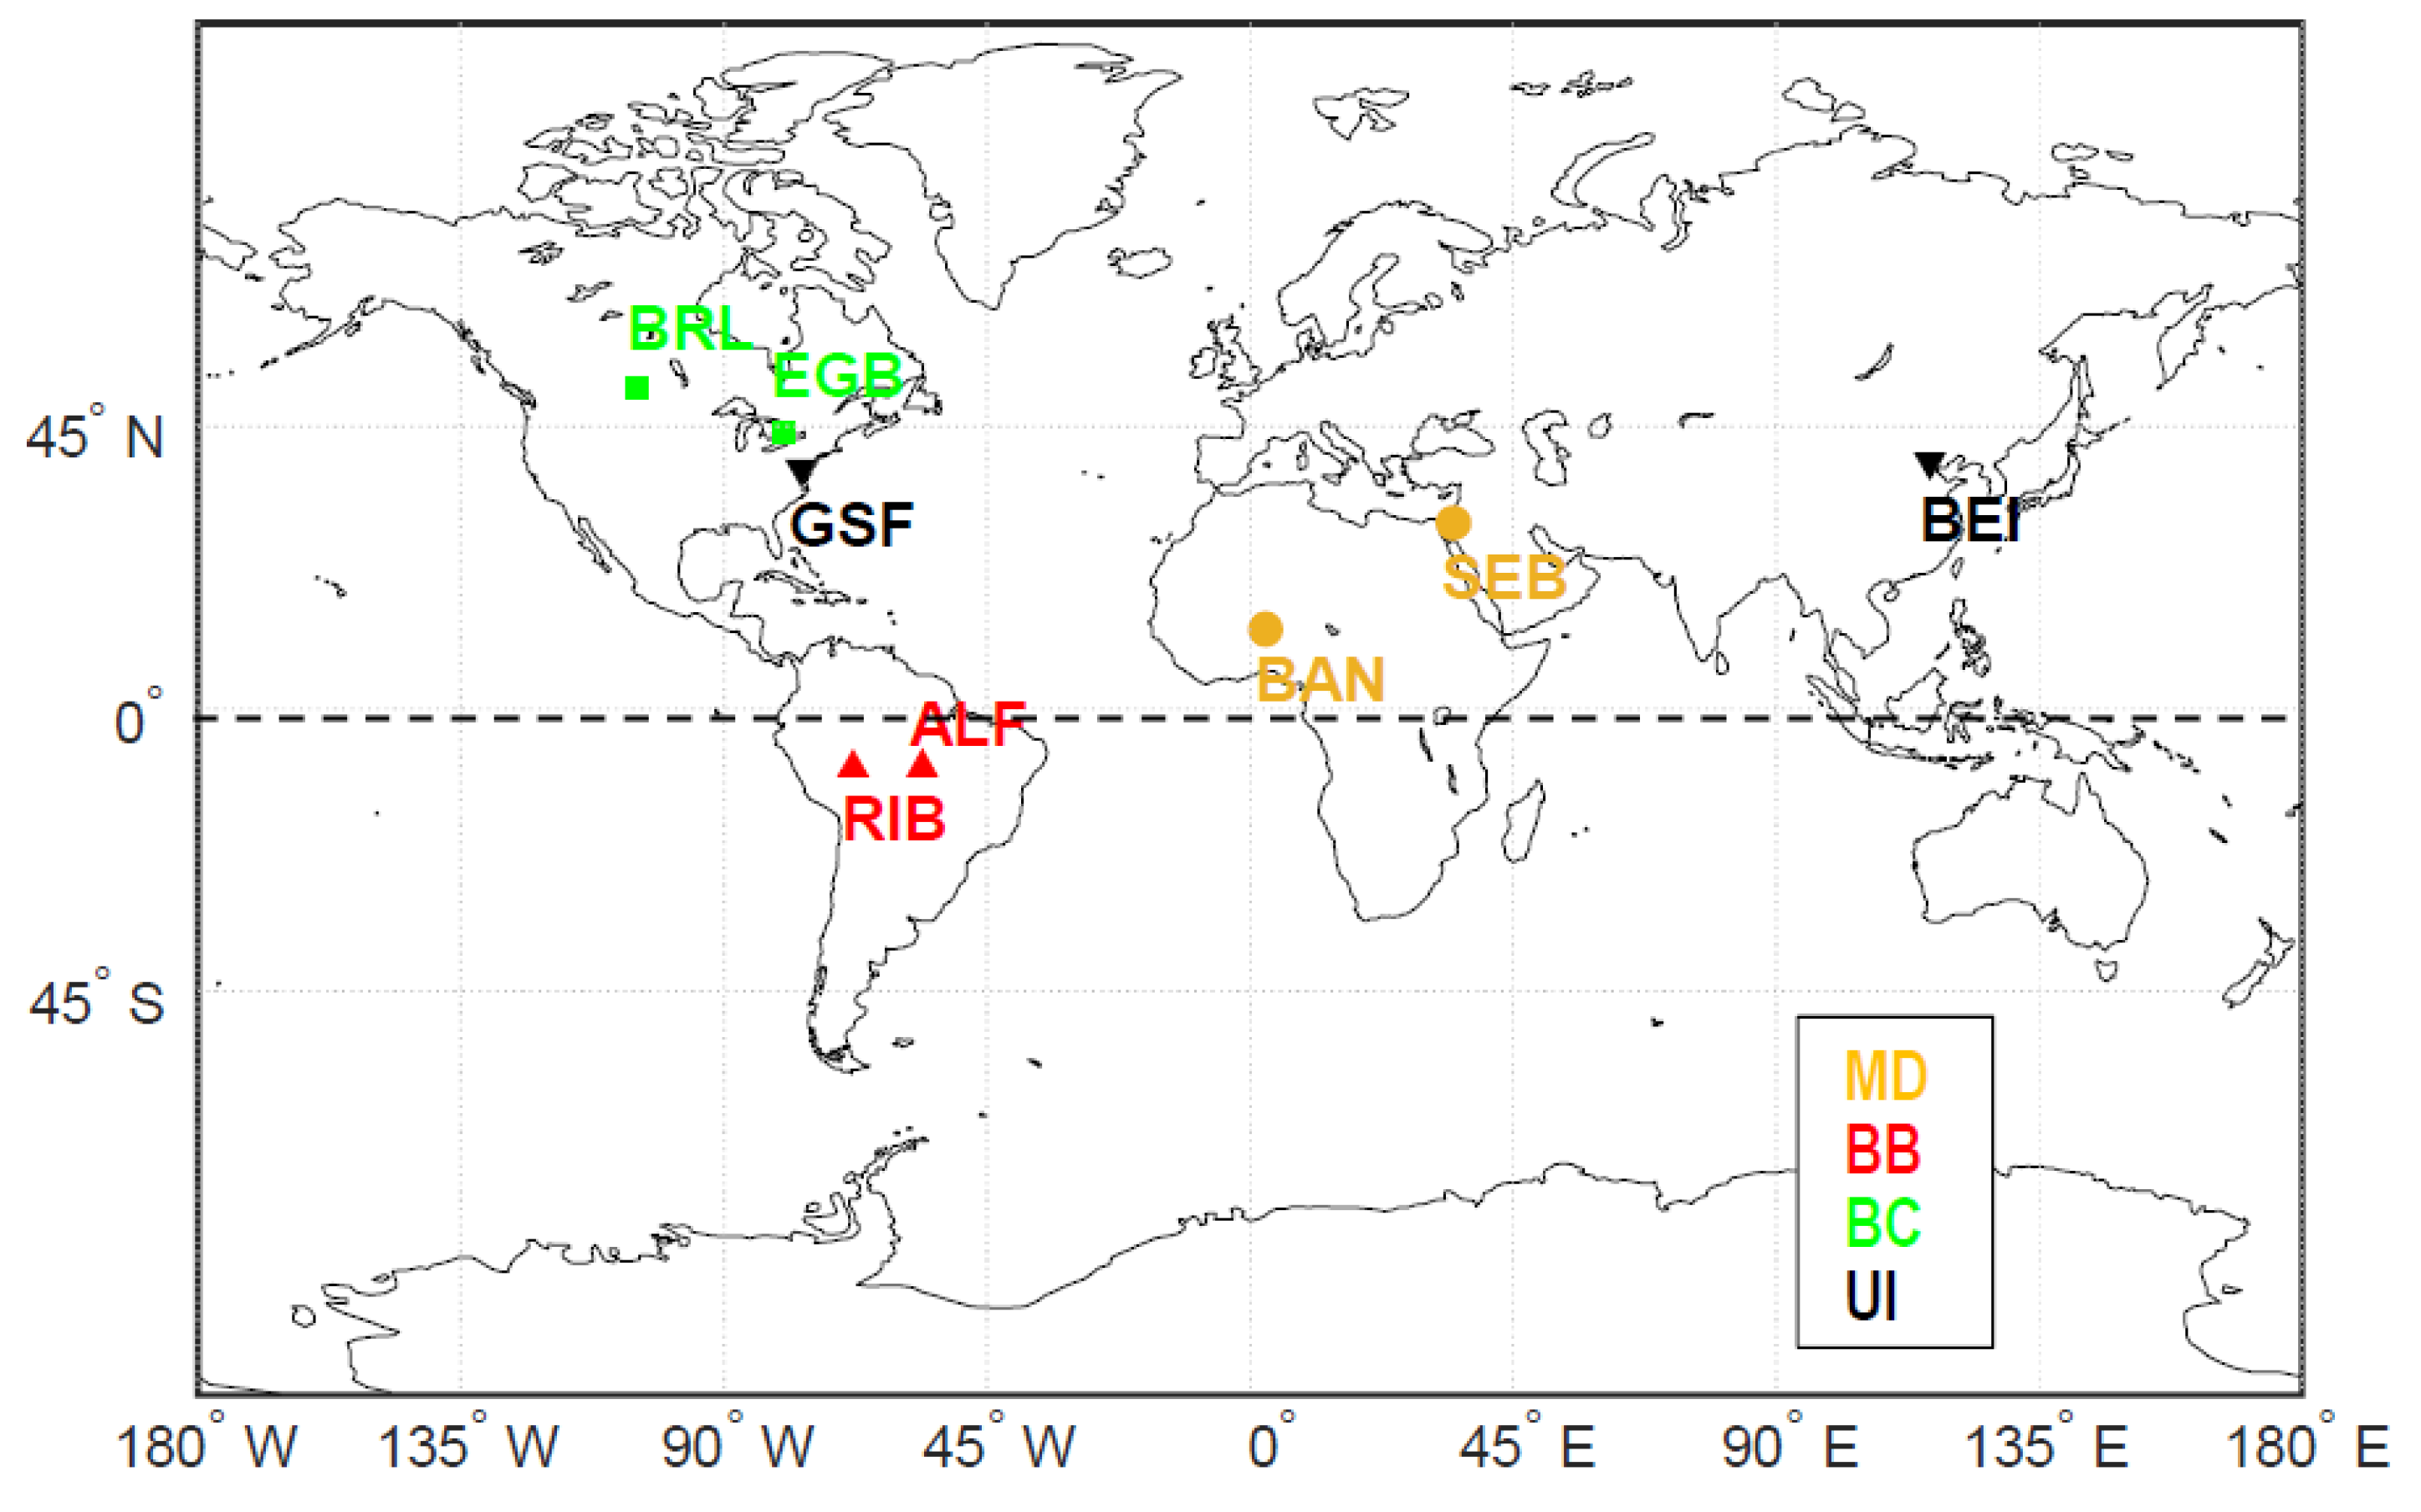
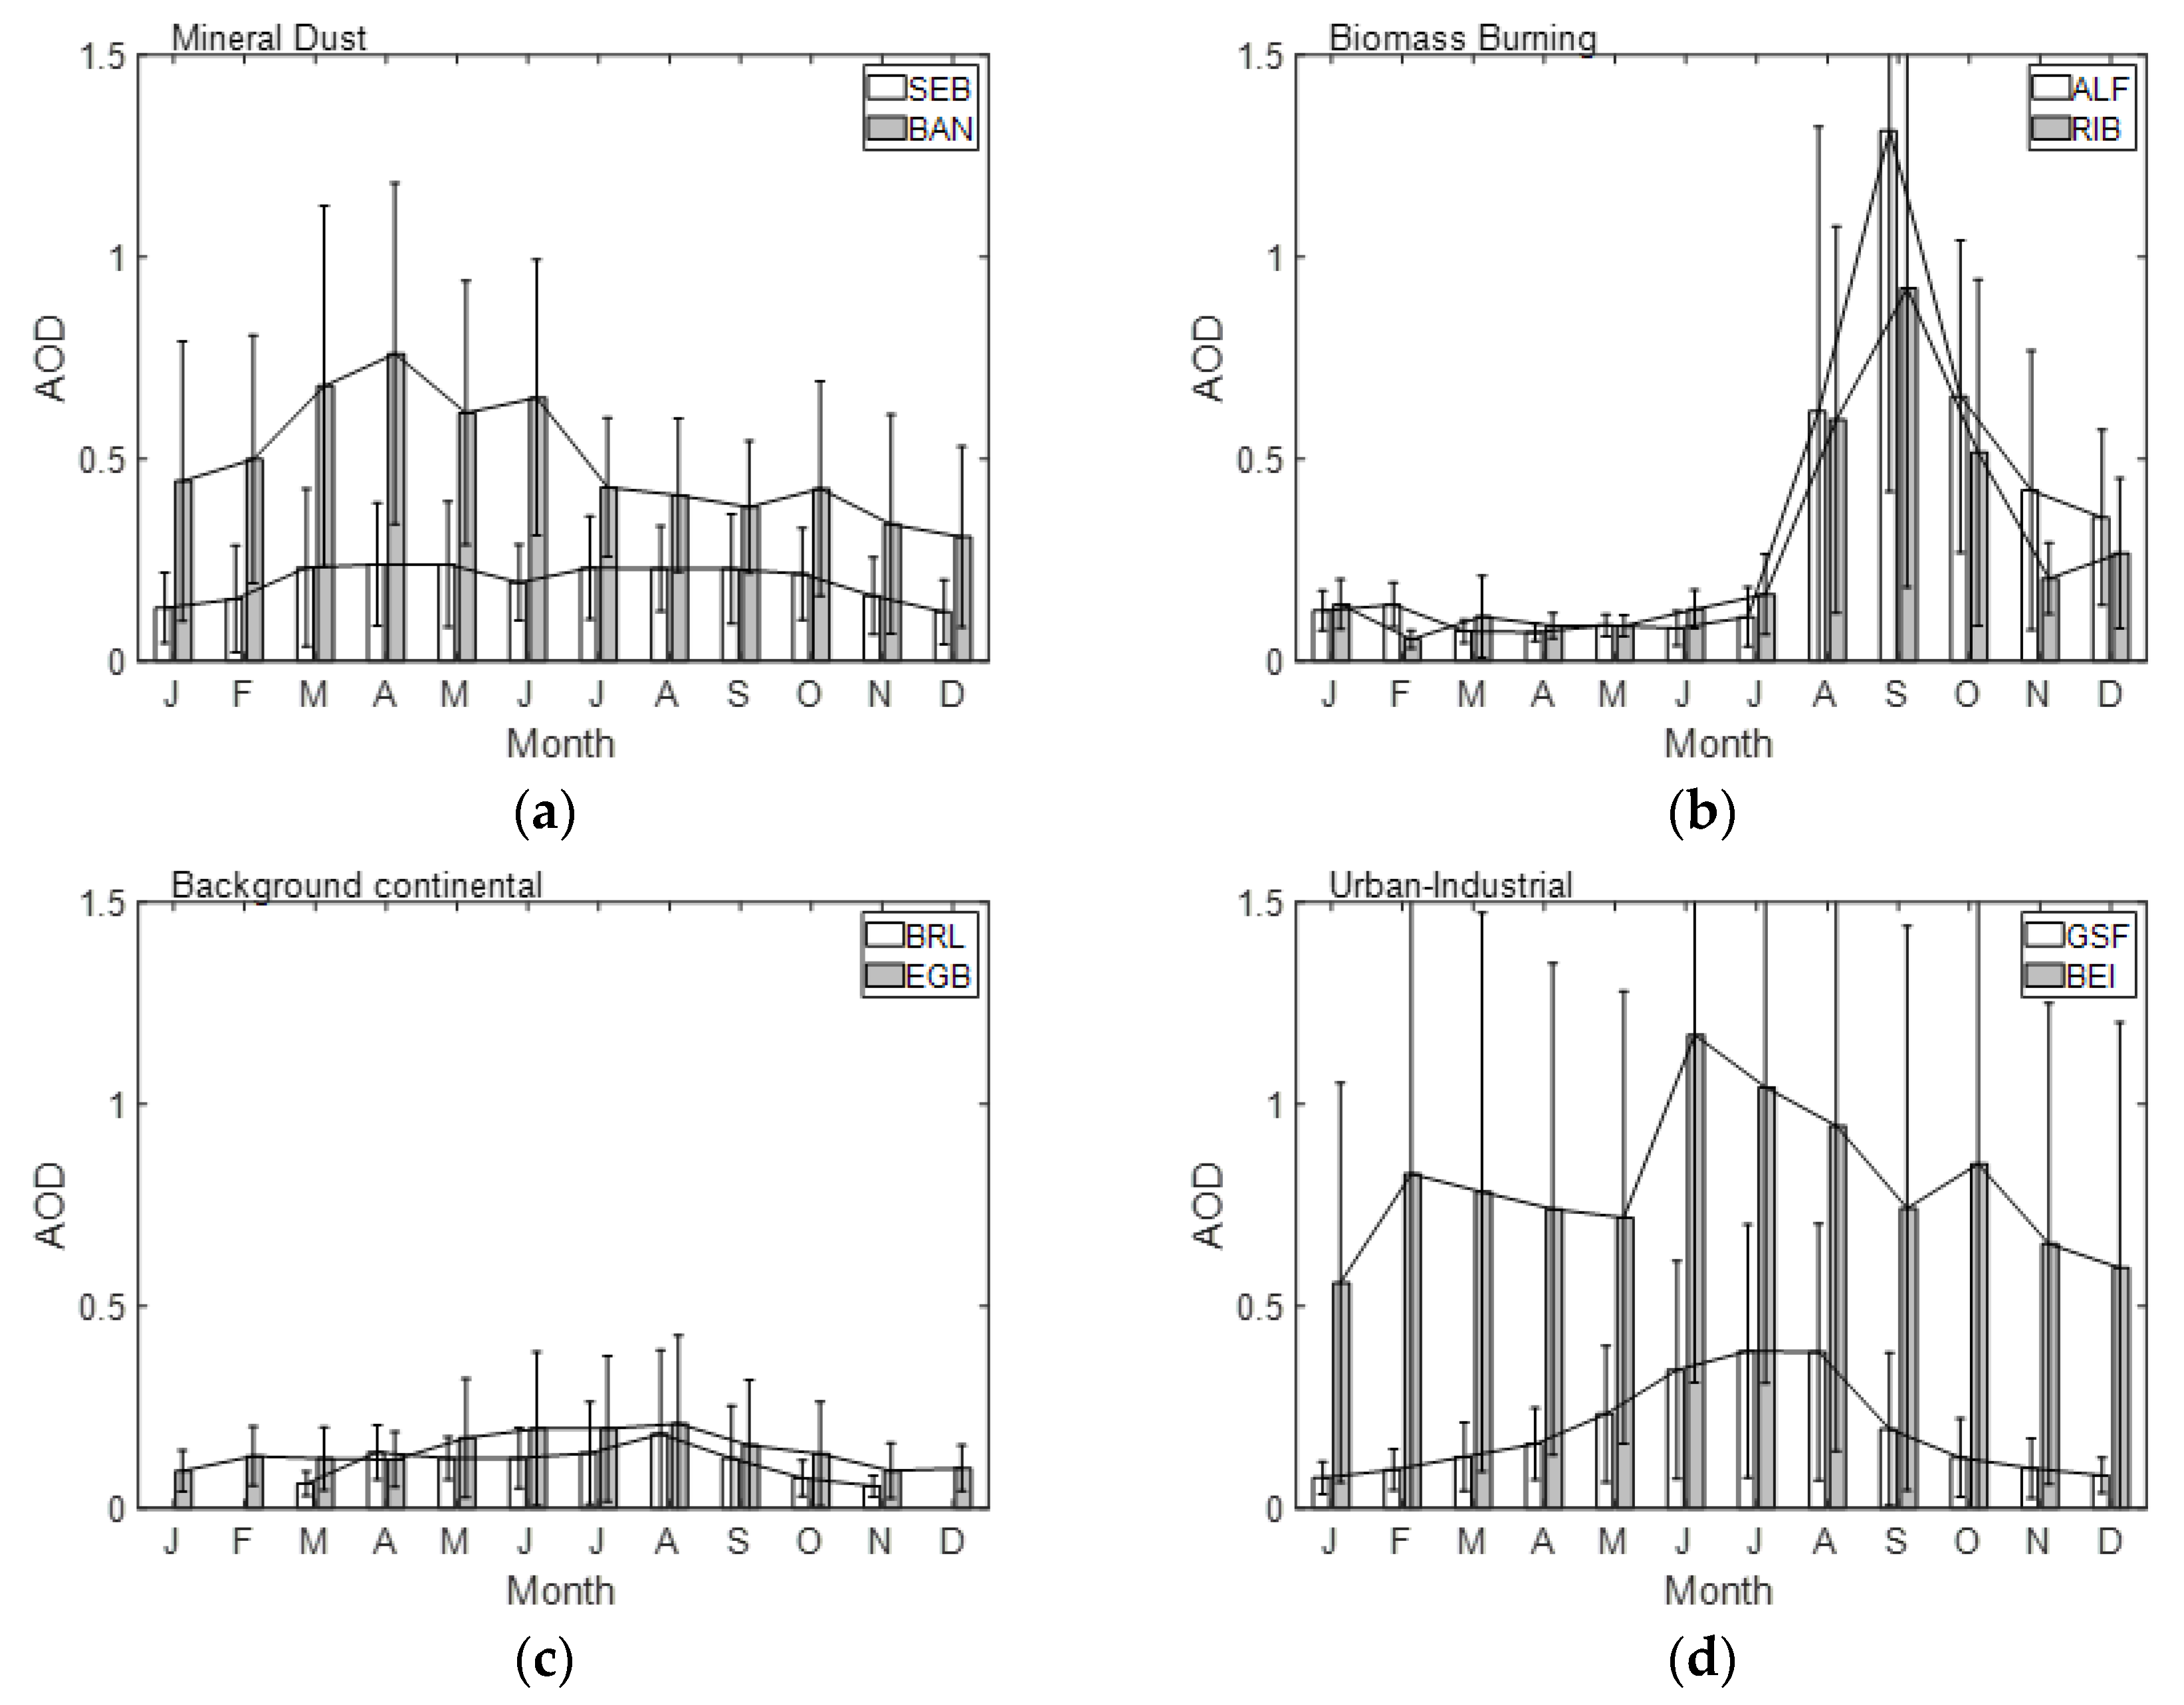
2.3. Selected Stations and Aerosol Types

Eight sites were selected worldwide. The stations of Sede Boker and Banizombou were representatives of MD, Alta Floresta and Rio Branco of BB, Bratts Lake and Egbert of BC and GSFC and Beijing of UI. The geographical location of the stations are represented in Figure 1. Among them, five (SEB, ALF, RIB, BRL, and GSF) have already been described in [4], which the reader is referred to. To show the representativeness of each site selected, we plot in Figure 2 the monthly aerosol optical depth (AOD) per aerosol type.
While SEB is located in the northern part of the Israeli Negev desert, BAN is at the southern border of the Sahel desert. Both sites are influenced by MD from different source regions and have been used in the study of [18] who used the graphical framework introduced by [19] based on AOD, the Ångström exponent, AE, and its spectral curvature, δAE, i.e., the difference between AEs measured at two different pairs of wavelength. In brief, this study showed that each site is affected by MD at different periods of the year; that much higher AOD are found in BAN than in SED; and that AOD increases in BAN are often related to an increase of coarse particles (δAE < 0). Figure 2a reflects partially these results: AOD reaches its peak in April in BAN and in April-May and July – September in SEB. The AOD peak in BAN is three times higher than in SEB. Large AOD (>0.3) are observed all year round in BAN. There is a strong intra-month variation at both sites reflected by the large error bars.
The BB sites, ALF and RIB, are two out of the five stations that [4] averaged and considered as a unique case that they called Brazilian forest. Figure 2b shows that both sites have a similar annual cycle of the monthly AOD. The BB season is clearly visible between August and December with peaks in September. During the BB season, the AOD is larger in ALF than in RIB while the rest of the year the AOD (<0.2) is similar at both sites. Maximum monthly AOD of 1.31 and 0.92 are reached in September in ALF and RIB, respectively. This difference is mostly due to the location of both sites with respect to the synoptic conditions over South America during the dry season. [20] related the main corridors of smoke dilution with the presence of a high pressure area over central Brazil and the subsequent displacement of both the South Atlantic Subtropical High (westward) and the Intertropical Convergence Zone (northward), and the presence of the Andes Mountains acting as a barrier to the west.
BRL and EGB are located in non-industrial areas in the southern Canadian prairies. The type of aerosols is of a background nature, with episodic occurrences of BB. EGB may be sometime influenced by anthropogenic pollution as it is 80 km north of a large city (Toronto). Figure 2c shows similar annual cycles at both stations with AOD peaks in August of 0.21 and 0.18 in EGB and BRL, respectively. Except in April, the AOD in BRL is lower than in EGB by an average difference of 0.03. According to [21], Canadian western sites like BRL are more affected by forest fire smoke than southeastern sites like EGB. The fact that BRL AOD is slightly higher than EGB AOD in April, before the BB season, may be related to the presence in BRL of mineral dust from tilling at the start of the cropping season [21].
Finally the two UI sites, GSF and BEI, have quite different features (see Figure 2d). While GSF is described in [4], BEI is described in a recent paper from [22]. The most striking difference between both sites is the AOD difference: BEI has levels of pollution much more elevated than GSF, by an almost constant 0.5 AOD bias all year-round. If we compare the monthly AOD in BEI to the monthly occurrence vs. aerosol size of [22], one clearly sees that the AOD peak (1.17) in June is related to a predominance of fine particles, thus pollution. In GSF, the AOD peak (0.39) occurs in July and August.

3. Results and Discussion

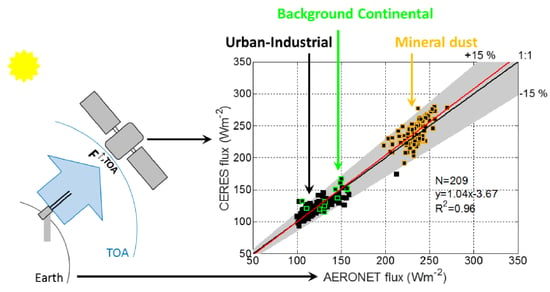
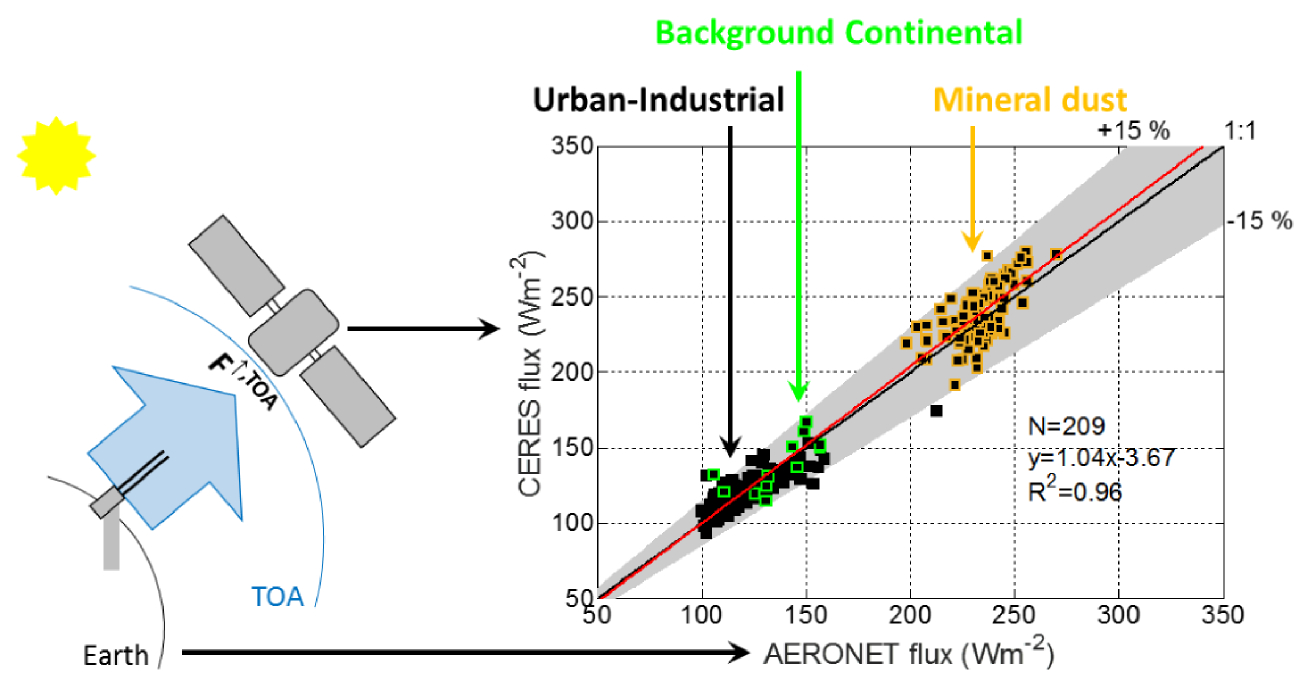
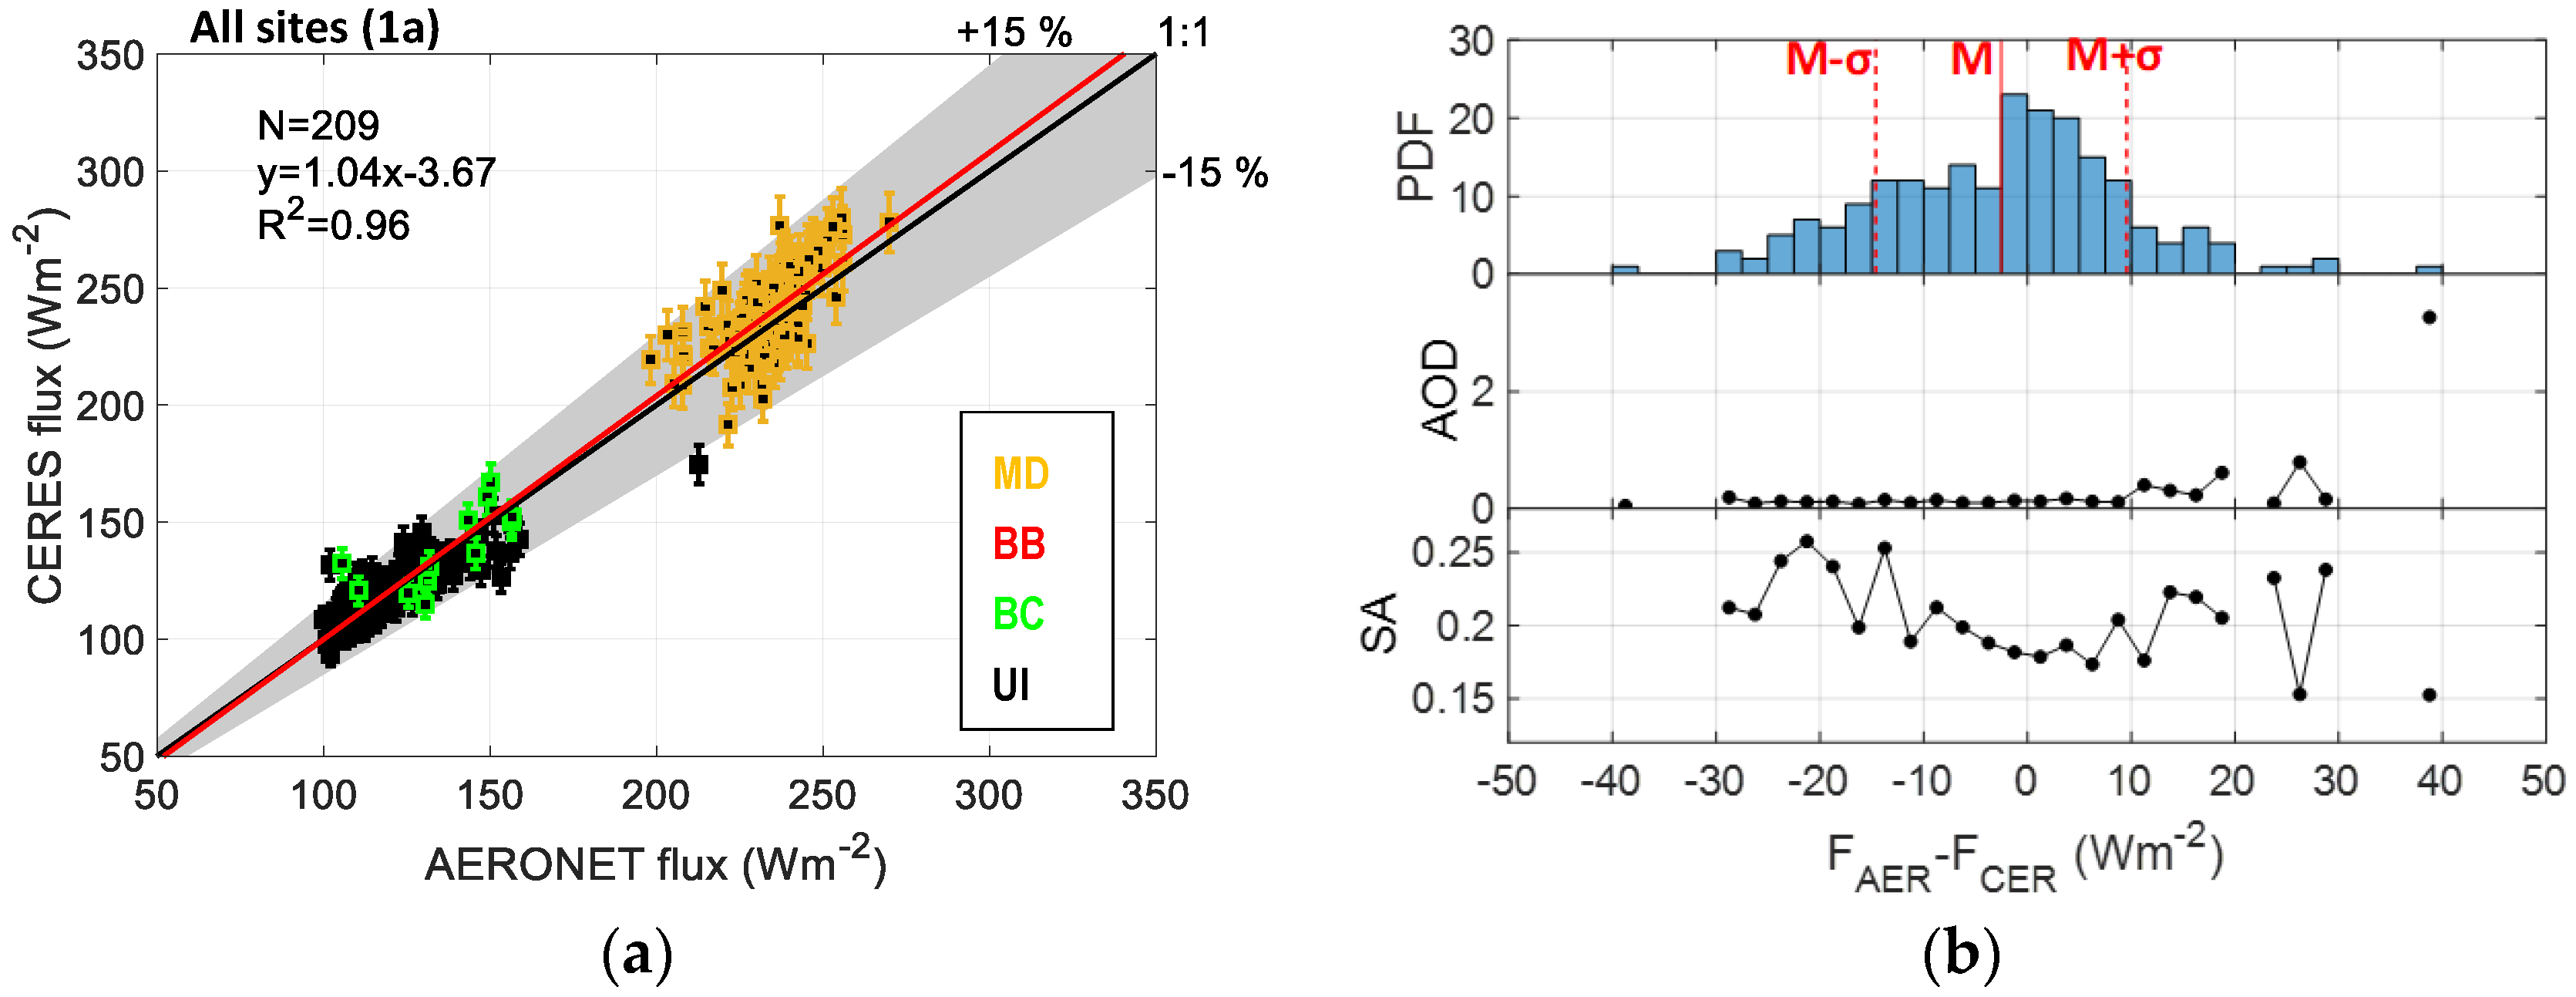
3.1. AERONET Flux Validation at the TOA: All Sites, Criterion 1a

We first had a look at the database. Four out of the eight sites selected had good temporal coincidences of AERONET and CERES and thus criterion 1 could be applied (see Table 3). In the rest of the sites, criterion 2 was applied. In these cases, the SZA difference goes from 1.1º up to 9.7º. Once the adequate criterion at each site was selected, we saw that the number of space-time co-located measurements was not very high taking into account the large time series considered (sometimes >15 years): It ranged from 45 in BRL (criterion 1b) up to 177 in ALF (criterion 2b). These numbers are relatively low. For example, let’s consider SEB: Our dataset (>15 years) consists in 93 coincidences, while [4] had 1590 coincidences of AERONET estimates with ground-based pyranometer measurements for a period much shorter (2003–2005) than ours and a more restrictive temporal criterion (<30 s). This reflects the complexity of the validation of atmospheric parameters at the global scale with satellite-based measurements. An important note has to be made at this point. As it can be contrasted from Figure 2b and Table 3, the coincidences at the BB sites occur between April and August and are thus nearly outside of the BB season which is from August to December. In such conditions the coincidences at the BB sites are not going to be representative of BB but rather of Brazilian forest without nearly any BB influence.
Before analyzing the results site-by-site or per aerosol influence, we applied criterion 1a to the entire database (all sites). Statistical results are shown in the first column (“All”) of Table 4 and the scattergram CERES vs. AERONET is shown in Figure 3. Table 4 summarizes the results of our comparisons in terms of slope of the least-square fit, bias, root mean square error (RMSE), and correlation coefficient (R2). In order to quantify the level of accuracy we also added the difference D i f f = F A E R S W , , T O A F C E R S W , , T O A , the relative difference (i.e., the difference normalized to CERES flux, N o r m D i f f ) and the 5th and 95th percentiles. Figure 3a shows the scattergram of the coincidences and Figure 3b the histogram of the probability density function (PDF) of the difference F A E R S W , , T O A F C E R S W , , T O A , as well as the AOD and the surface albedo (SA) as a function of this difference (each point represents the mean in each PDF bins). Figure 3b is intended to bring light on the possible causes of discrepancies observed between the fluxes estimated by AERONET and those measured by CERES. The total of coincidences with criterion 1a while considering all sites is 209. In Figure 3, BB is not represented. MD is represented by SEB (93 points), BC by BRL (12 points) and UI by GSF (75 points) and BEI (29 points). From these sites, SEB is the closest to the equator (Figure 1) and has the lowest SZA (Table 3) it is thus logical that MD coincidences in Figure 3a fall in a cluster of higher flux values (>190 Wm−2) whereas BC and UI fall in a cluster of lower flux values (<170 Wm−2). Nearly all points fall within the shaded [–15%; +15%] area. Overall, the scattergram shows a convincing agreement with the shortwave upward flux at the TOA highly correlated (R2 = 0.96) where the linear relation of observed to modeled flux is given by a slope of 1.04 and a small, negative bias of –3.67 Wm−2, well below the accuracy of CERES measurements. To get an idea of this accuracy, in the range of fluxes of Figure 3a, [90; 273 Wm−2], the error associated to CERES fluxes varies in the range [5; 13 Wm−2]. Compared to this accuracy, the average flux difference, –2.52 Wm−2, is also very small and the relative difference is lower than 1% in absolute values. If we have a look at the PDF histogram of the flux difference (Figure 3b), one sees that it is not perfectly symmetrical and that it is slightly shifted towards negative values. This tendency may suggest that AERONET fluxes are slightly lower, in average, than the measured ones. However, this result cannot be generalized and prescribed to a possible underestimation of AERONET fluxes since the average difference is within the accuracy of the measured fluxes.
The interpretation of the plots of AOD and SA vs. the flux difference is not straightforward. As far as the AOD is concerned, large positive differences (>+10 Wm−2) seem to be caused by large AOD (>0.2). No such correlation exists for the large negative differences. The points of the positive tail of the histogram correspond to BEI: Large AOD and strong absorption properties [22]. In such conditions it seems that the AERONET radiative transfer model overestimates the flux reflected back to space, i.e., that either the atmospheric extinction is underestimated and/or the AERONET SA is overestimated. One of the most important improvements in the AERONET Version 3 algorithm (implemented in Version 2 already), regarding Version 1, is the assumption of a dynamic spectral and spatial satellite and model estimation of the surface albedo, including the bidirectional reflectance distribution function [9]. It has been shown that, at short wavelengths (440 nm), the retrieved spectral surface albedo increases with increasing AOD for AOD > 0.5; such dependence of surface retrievals on aerosol loading and vertical distribution can be due to contributions from multiple scattering interactions between aerosol and vertically stable Rayleigh (molecular) scattering, e.g., [23,24]. At short wavelengths where Rayleigh scattering is strong, the sensitivity of the algorithm to aerosol loading and vertical distribution increases with aerosol optical depth. Another possible source of error exists. According to [25], large AOD scenes, even in the presence of absorbing aerosols (the case of BEI), brightens the total reflectance (atmosphere + surface) over moderately reflecting targets. In such conditions, an underestimation of AERONET absorption contribution may also cause an overestimation of the TOA fluxes. If we now look at the SA vs. flux difference, a general tendency is observed: AERONET fluxes are underestimated for large SA (>0.2), i.e., bright surfaces. For large negative D i f f values (negative tail of the histogram, Figure 3b), all values of SA > 0.22 are from the SEB desert station. According to the sensitivity tests performed by [9], the AERONET surface albedo (used in the calculation of the TOA fluxes) uncertainty is produced mostly by an assumed aerosol profile and the retrieved angular shape uncertainty in the BRDF. They quantify the uncertainty on the SA due to both error source of the order of 0.04 for AOD < 0.7. Reference [26] developed a method to determine broadband surface albedo from CERES measurements and estimated in their introduction that an offset of 0.04 on the SA could produce a difference in terms of radiative fluxes at the TOA of the order of 15 to 20 Wm−2. This range of values is comparable to what is observed in Figure 3b. However, this surface albedo error is not limited to AERONET retrievals. As [27] explained very well in their 2004 paper, satellite measurements of aerosol (dust) optical properties over bright desert surfaces are particularly difficult to make because: (1) the surface contribution to the radiance received by the satellite is larger than that over vegetated areas, (2) dust absorption is poorly known, and (3) the angular properties due to particle non-sphericity is also of limited availability. For more than two decades now, the atmospheric community has been seeking to develop time-varying BRDF models at the global scale to minimize the errors on the aerosol retrieval due to point (1). All in all, it seems that AERONET flux underestimation over bight surface may be due to an underestimation of the broadband surface albedo used in the calculation of the TOA fluxes. At the surface, [4] found an overestimation of AERONET downward fluxes over bright surfaces. It is important to recall that [4] used AERONET Version 1 products. Above bright desert surfaces the spectrally neutral SSA (single scattering albedo) of Version 1 tends to decrease the effect of iron-rich dust absorption compared to the improved SSA magnitude and spectra for coarse-mode dust implemented in Version 2 [9,27]. Such an underestimation of the absorption is probably the cause of the AERONET Version 1 overestimation of the downward fluxes over bright surfaces found by [4].

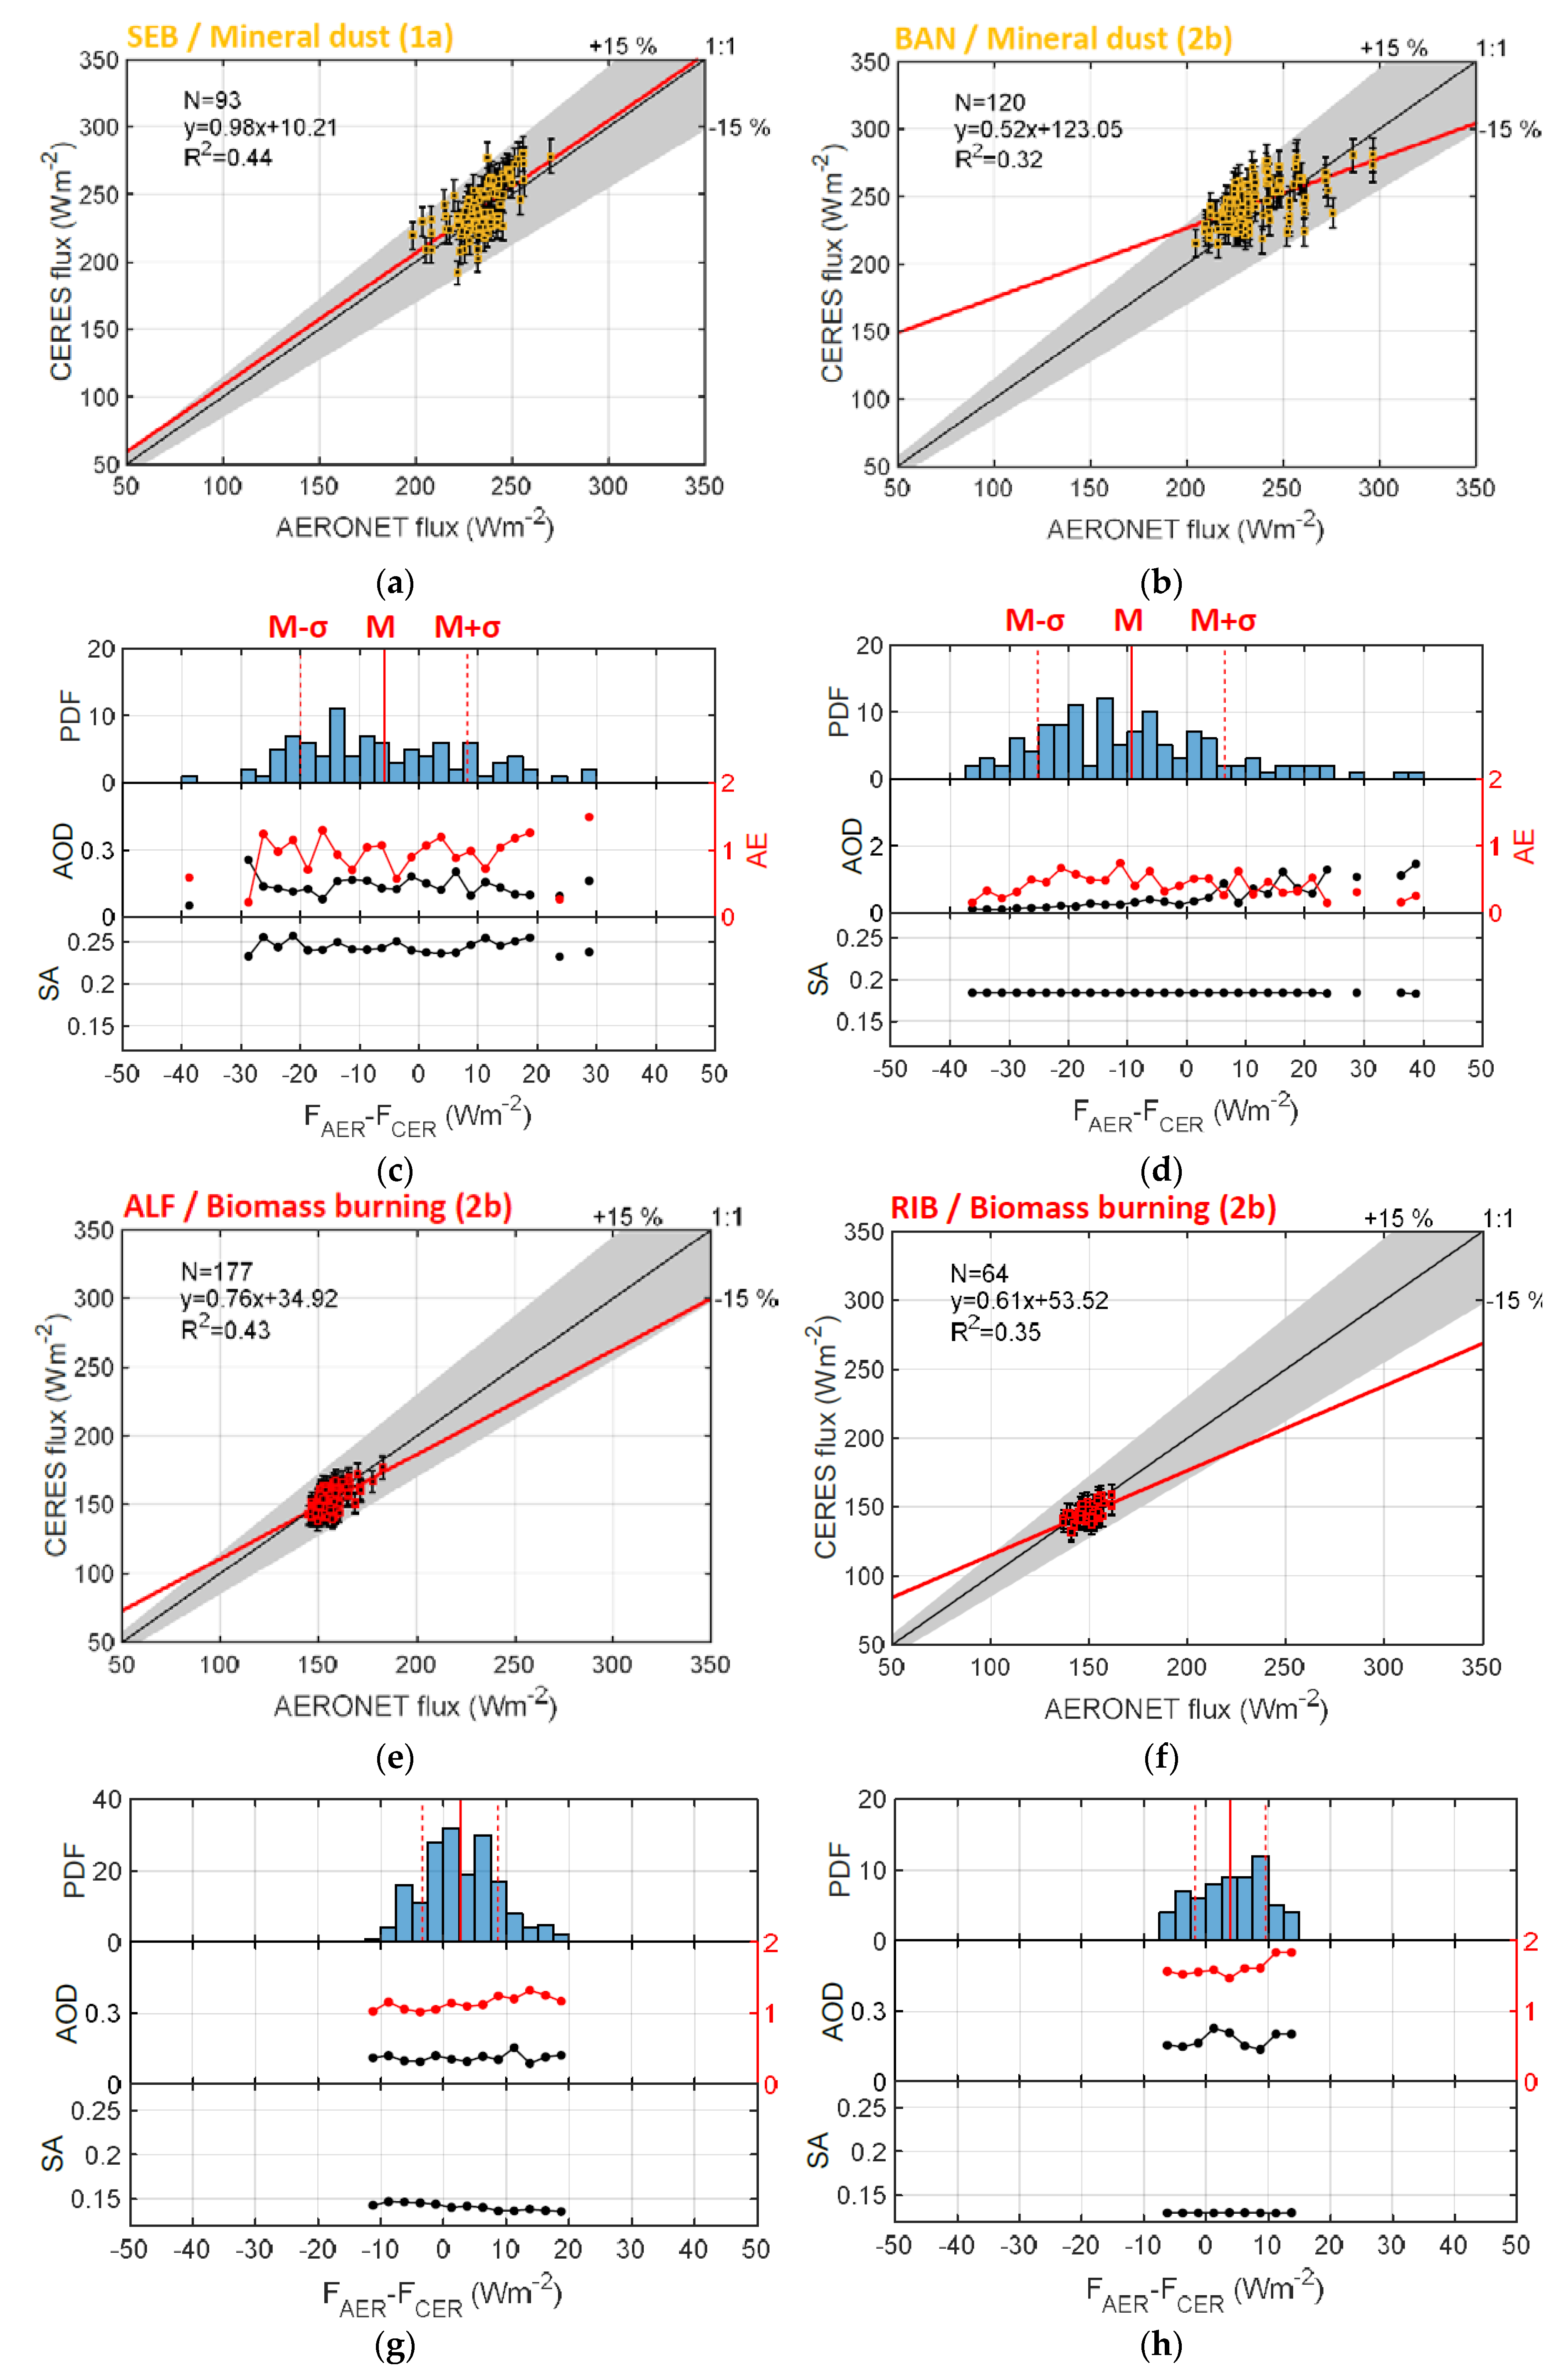
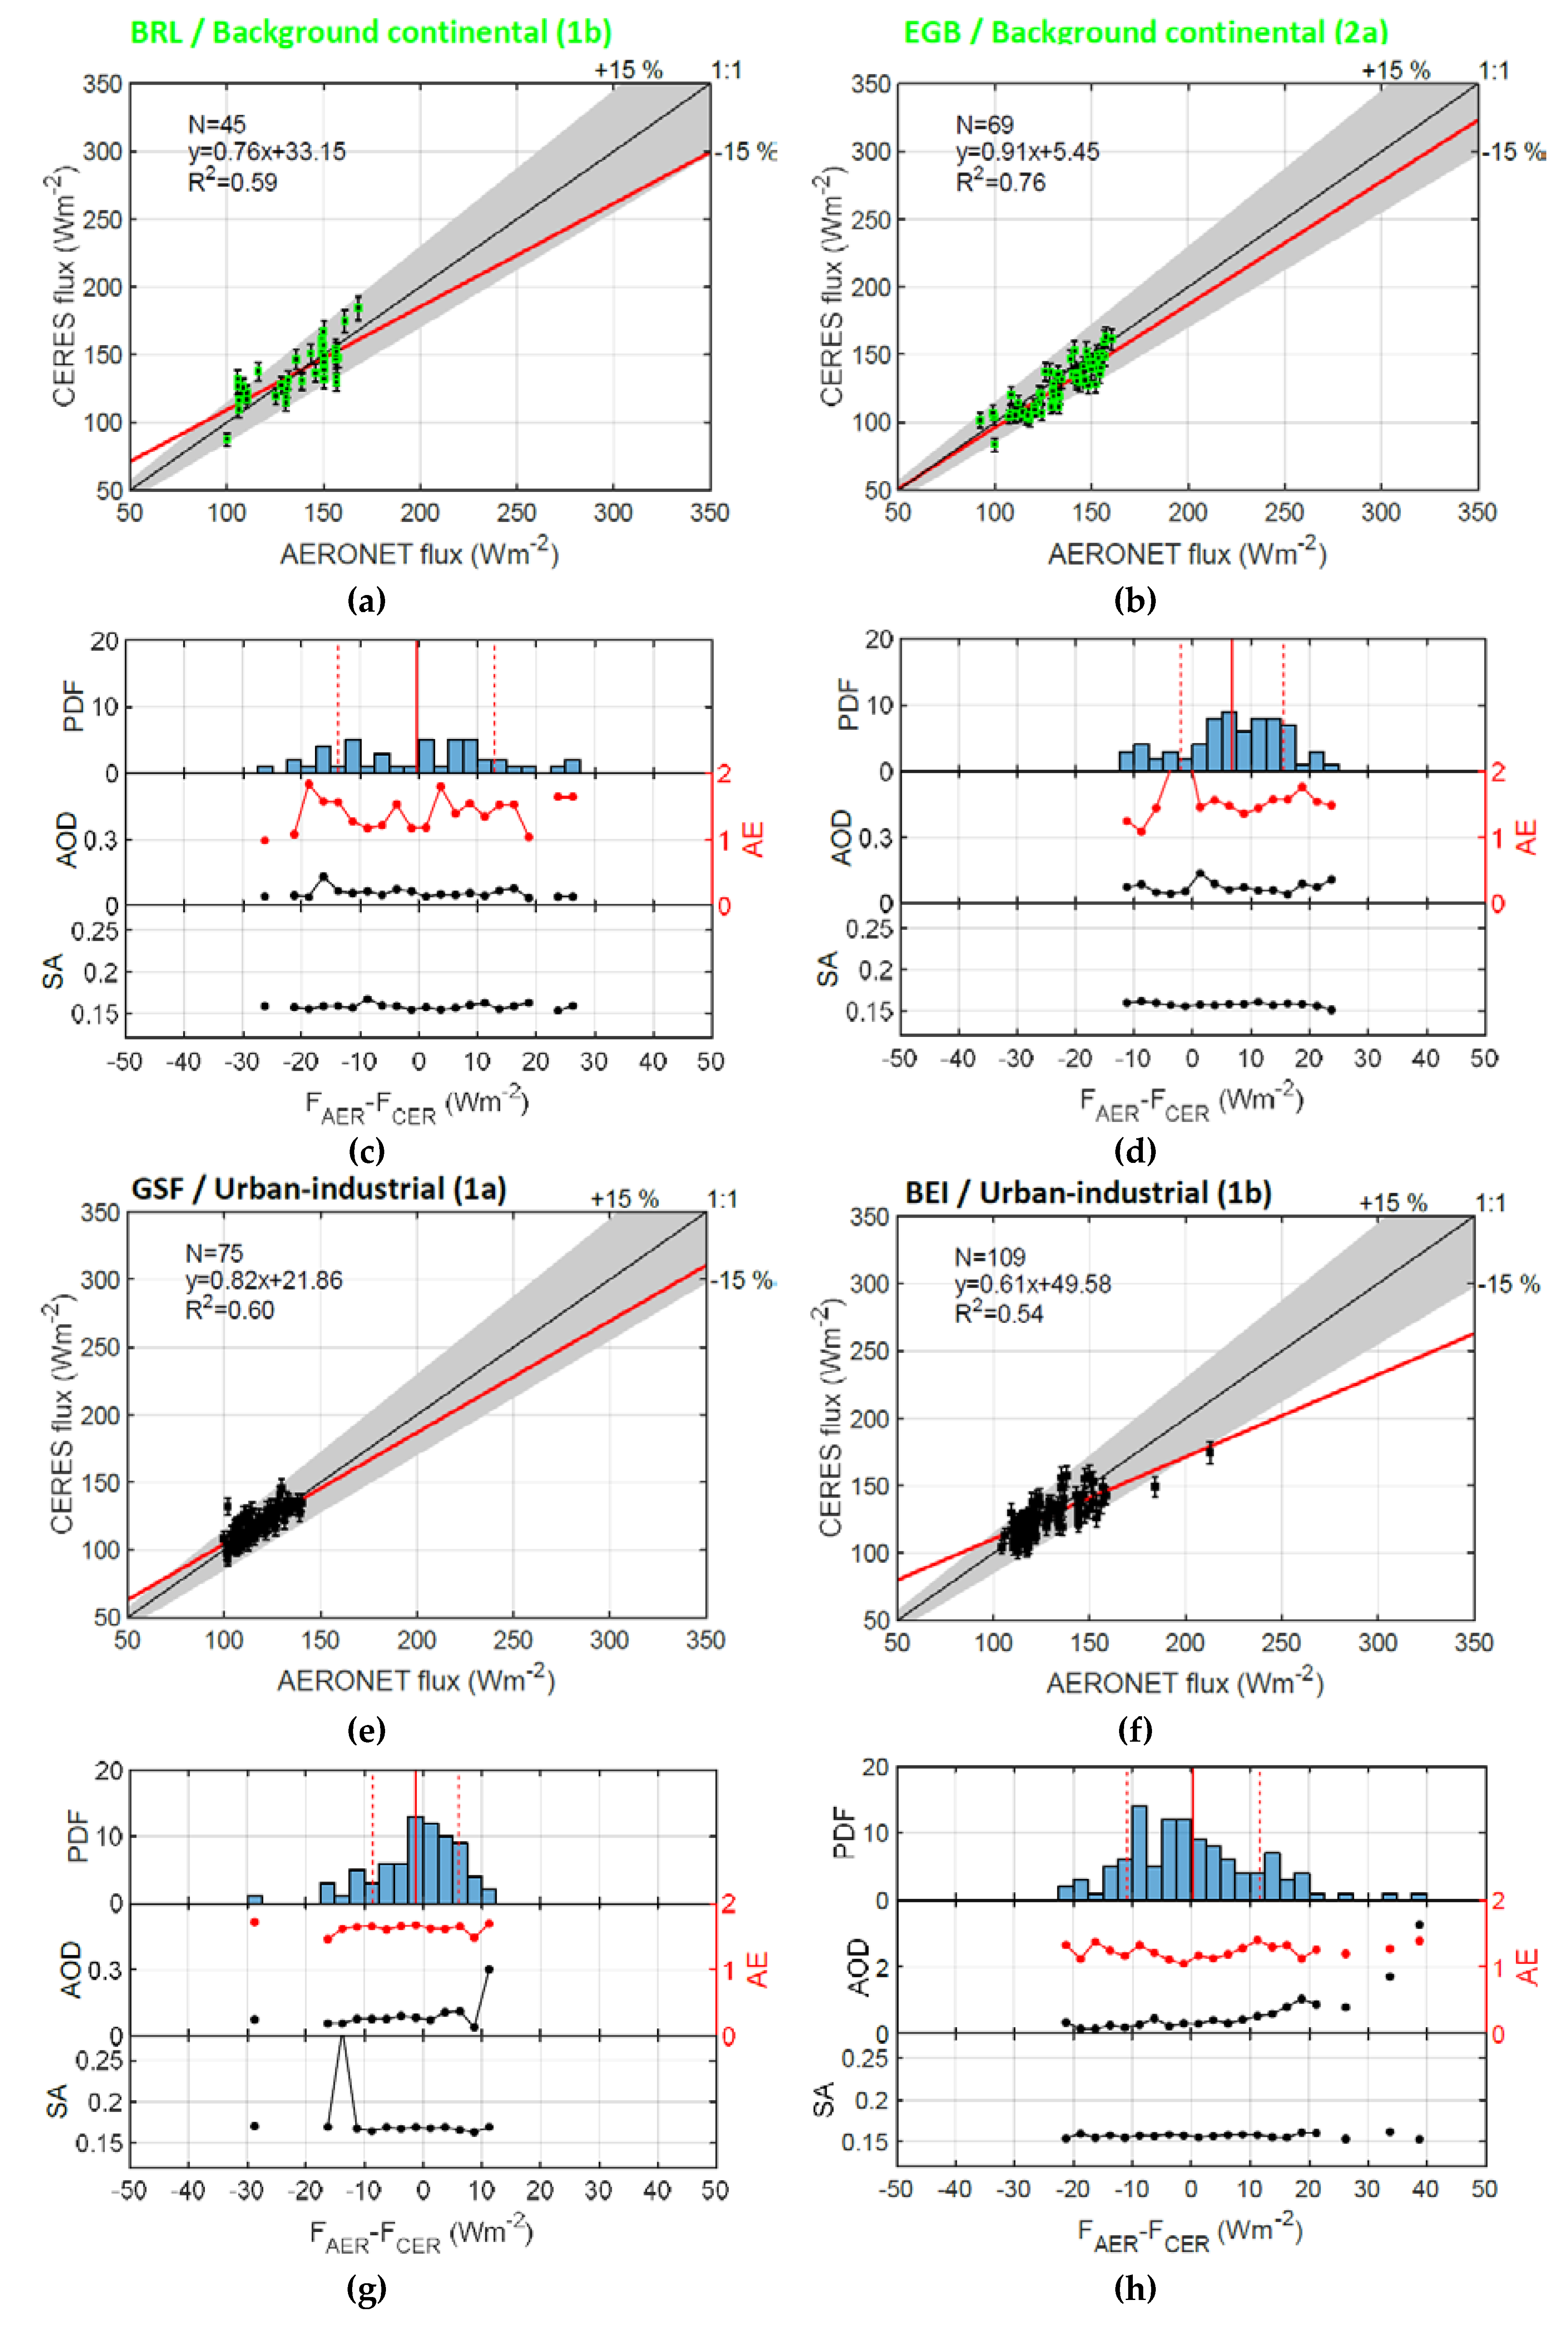
3.2. AERONET Flux Validation at the TOA: Site by Site Analysis

Site-by-site results are summarized in Table 4 and shown in Figure 4 (MD and BB) and Figure 5 (BC and UI) in the same way they were presented in Figure 3 for all sites. For the site-by-site analysis, the Ångström exponent AE has been added to the AOD plot to investigate possible correlations with a size-dependent parameter. With very few exceptions, the points of the scattergram at all sites fall within the ±15% region around the 1:1 line. Some of this variability is caused by the possible change in the aerosol optical properties due to the time difference (5 and 60 min) between both datasets. At all sites, the slope of the linear fitting is lesser than 1 and varies between 0.52 and 0.98. This result indicates that AERONET tendency, in average, is to underestimate low TOA fluxes and/or overestimate high TOA fluxes. However the flux interval of the coincident measurements at each site is usually rather small (<50 Wm−2); this is inherent to the principle of space-time co-location with satellites in a sun-synchronous orbit) which makes the analysis more sensitive to the variability of the estimated and measured fluxes. In addition, when all sites are analyzed together with criterion 1a (Figure 3), low and high fluxes compensate (slope = 1.04 and R2 = 0.96). The correlation coefficient R2 at individual sites is reasonably good and varies between 0.32 and 0.76. It is in the lower part of the interval (0.32–0.44) for MD and BB, and in the upper part (>0.54) for BC and UI, and seems anti-correlated with the number of points used in the linear fitting. The flux difference, D i f f , is in the range [–9.37; 6.76 Wm−2]. If we compare these absolute differences to the error associated to CERES fluxes, [5; 13 Wm−2] (see the previous section), for the interval of fluxes observed one sees that they are of the same order of magnitude, and that on average no systematic bias is detected. With respect to the criteria used, the only relevant difference between sites where criterion 1 was applied and those where criterion 2 was applied is in terms of the relative flux difference, N o r m D i f f . Where criterion 1 was applied, N o r m D i f f is less than 1% in absolute value (except in SEB where it is –2.13%), whereas at sites where criterion 2 was applied, N o r m D i f f varies, in absolute value, between 1.86% and 5.77%. The most probable explanation of this difference is the SZA correction which was made “on average” and not on a point-by-point basis.
The site-by-site analysis reveals that for MD the PDF is shifted slightly towards the negative values ( D i f f = –5.87 and –9.37 Wm−2 for SEB and BAN, respectively) with a large interval of spread values (>40 Wm−2, see the difference between 95th and 5th percentiles). No correlation of D i f f with AOD, AE, or SA is observed in SEB (Figure 4c) while a clear correlation is visible in BAN (Figure 4d): High AOD (>0.5) associated with low AE (<0.5) cause AERONET to overestimate the TOA fluxes. As seen in Section 3, desert dust produces much higher AOD values in BAN than in SEB. The surface albedo in BAN is flat and equal to 0.18 and smaller than in SEB (0.24). Consequently, the high AOD in BAN produces the same effect (an overestimation) than the high AOD in BEI (see the previous section). The cause is thus very likely the same: Multiple scattering interactions between aerosol and Rayleigh scattering as well as a possible underestimation of the aerosol absorption.
For the BB sites, the PDF are much more compact: The difference between 95th and 5th percentiles is less than 20 Wm−2. The absolute difference between AERONET and CERES fluxes is positive (2.67 and 3.91 Wm−2 in ALF and RIB, respectively). The plots of AOD vs. flux difference show rather flat, low AOD and confirm that no strong BB events were detected. The highest AOD (~0.23; AE~1.59; Figure 4h) is reached in RIB and is well above the background value of the BB off-season, 0.11 (Figure 2b). Thus it contains very likely some coincidences corresponding to BB events. No clear correlation can be deduced between the flux difference and the AOD or the surface albedo.
At BC sites, like at MD sites, the PDF of the flux difference D i f f is quite spread as it ranges from –27.5 to 25 Wm−2. No significant bias is observed in BRL (–0.41 Wm−2) while a positive bias is observed in EGB (6.76 Wm−2). In relative terms this bias corresponds to 5.77% of the observed flux. Such a high difference (compared to the other sites) is probably due to the approximation made in the SZA correction applied, as mentioned earlier. It is worth noting that EGB is the site with the longest coincident period between September and March, and thus with the largest variation of solar illumination. No clear correlation is observed between the flux difference and the AOD or the surface albedo either at BRL or at EGB. Although the analysis of [6] was made at background maritime sites, it seems appropriate to compare their results in the BC category. Out of their 29 co-located points, [6] found a linear relation of observed to modeled flux with a slope of 0.88, a positive bias of 8.70 Wm−2 (which in relative terms represented ~8%–9%), and a correlation of R2 = 0.87. Except for R2 which is a little higher than in BRL (0.59) or EGB (0.76), the slope and the bias in [6] are within the range of values found at BRL and EGB.
As far UI sites are concerned, although the PDF is not symmetric in shape, the flux difference D i f f is small (–1.27 and 0.37 Wm−2 at GSF and BEI, respectively) and corresponds to less than 1% of the observed flux. No correlation between D i f f and the SA is visible at none of both sites. By contrast, the results in BEI discussed in the previous section are visible again in Figure 5h: High AOD values (>0.5) produce high positive D i f f values (>10 Wm−2).

4. Conclusions

We report for the first time a statistically representative comparison at global scale between time-space co-located AERONET-estimated upward solar fluxes at the top of the atmosphere and fluxes measured by CERES, a satellite-based 3-channel radiometer. The comparison was performed for eight AERONET sites with more than seven years of V3L2.0 data in the period 1993–2018 and representative of mineral dust, biomass burning, background continental, and urban-industrial aerosol types.
Prior to the analysis, we set up four criteria to guarantee space-time co-location and a minimum number of coincidences (>40) for the dataset to be statistically representative. The most restrictive criteria allows for a maximum time difference (Δt) of 5 min and a maximum distance difference (Δr) of 10 km. The other three criteria were set as (Δt < 5 min, Δr < 20 km), (Δt < 60 min, Δr < 10 km), and (Δt < 60 min, Δr < 20 km). For the last two criteria, for which a 60 min time difference can lead to large solar zenith angle differences and thus to large flux differences, a correction factor was applied to estimate the TOA upward solar flux that AERONET would have detected at CERES solar zenith angle.
When considering all stations and the most restrictive criterion, 209 coincidences were found. The linear relation of observed to modeled flux is given by a slope of 1.04, a small, negative bias of –3.67 Wm−2 (which in relative terms represent less than 1%), well below the accuracy of CERES measurements, and a high correlation (R2 = 0.96). From the histogram of the PDF of the flux difference D i f f = F A E R S W , , T O A F C E R S W , , T O A , we observe that AERONET overestimation (the positive tail of the histogram), observed at MD (BAN) and UI (BEI) sites, is correlated with large AOD (>0.2). Our review of the literature and discussions point out that the driving causes are multiple scattering interactions between aerosol and Rayleigh scattering as well as a possible underestimation of the aerosol absorption in AERONET retrievals. We also observe that AERONET underestimation (the negative tail of the histogram), observed at the desert site of SEB, is correlated with large surface albedos (>0.2) and is probably due to an underestimation of the broadband surface albedo used in the calculation of the TOA fluxes in AERONET retrievals.
The site-by-site analysis reveals that the instantaneous difference, i.e., the difference of individual points, between AERONET-estimated and satellite-measured TOA upward solar fluxes never exceeds ±15%. Some of this variability is caused by the possible change in the aerosol optical properties due to the time difference (5 and 60 min) between both datasets. The slope of the linear fitting varies between 0.52 and 0.98, and the correlation coefficient at individual sites is reasonably good and varies between 0.32 and 0.76. The relative differences between AERONET and CERES fluxes is usually lesser than 1% at sites where the criteria with Δt < 5 min were applied and between roughly 2% and 6% at the sites where the criteria with Δt < 60 min were applied, pointing out the limitation of the “average” SZA correction performed at those sites. Despite (1) AERONET TOA fluxes being more complex to estimate than surface fluxes because of the inherent technique of the sun/sky-photometer it employs (a ground-based instrument, directly pointing at the sun), and (2) the complexity of obtaining space-truths (as opposed to ground-truths) and their reliability, we conclude that AERONET TOA fluxes compare rather well with satellite-based flux measurements. The agreement within 15% found at the TOA in this work is not much larger than the agreement of about 10% found at the surface by [3,4].

Funding

The research leading to these results has received funding from the H2020 program from the European Union (grant agreement no. 654109, 778349) and also from the Spanish Ministry of Industry, Economy and Competitiviness (ref. TEC2015-63832-P), the Spanish Ministry of Science, Innovation and Universities (ref. CGL2017-90884-REDT); and the Unity of Excellence Maria de Maeztu (ref. MDM-2016-0600) financed by the Spanish Agencia Estatal de Investigación.

Acknowledgments

CERES Science team is thanked for the use of CERES data. The PIs of the AERONET sites used in this work (Arnon Karnieli, Didier Tanré, Paulo Artaxo, Ihab Abboud, Brent Holben and Hong-Bin Chen) are also acknowledged. David Pujol is warmly thanked for the handling of AERONET and CERES data.

Conflicts of Interest

The authors declare no conflict of interest.

References

  1. Holben, B.N.; Eck, T.F.; Slutsker, I.; Tanre, D.; Buis, J.P.; Setzer, A.; Vermote, E.; Reagan, J.A.; Kaufman, Y.J.; Nakajima, T. AERONET—A federated instrument network and data archive for aerosol characterization. Remote Sens. Environ. 1998, 66, 1–16. [Google Scholar] [CrossRef]
  2. Giles, D.M.; Sinyuk, A.; Sorokin, M.G.; Schafer, J.S.; Smirnov, A.; Slutsker, I.; Eck, T.F.; Holben, B.N.; Lewis, J.R.; Campbell, J.R.; et al. Advancements in the Aerosol Robotic Network (AERONET) Version 3 database—Automated near-real-time quality control algorithm with improved cloud screening for Sun photometer aerosol optical depth (AOD) measurements. Atmos. Meas. Tech. 2019, 12, 169–209. [Google Scholar] [CrossRef]
  3. Derimian, Y.; Leon, J.F.; Dubovik, O.; Chiapello, I.; Tanré, D.; Sinyuk, A.; Auriol, F.; Podvin, T.; Brogniez, G.; Holben, B.N. Radiative properties of aerosol mixture observed during the dry season 2006 over M’Bour, Senegal (African Monsoon Multidisciplinary Analysis campaign). J. Geophys. Res. 2008, 113, D00C09. [Google Scholar] [CrossRef]
  4. García, O.E.; Díaz, A.M.; Expósito, F.J.; Díaz, J.P.; Dubovik, O.; Dubuisson, P.; Roger, J.C.; Eck, T.F.; Sinyuk, A.; Derimian, Y.; et al. Validation of AERONET estimates of atmospheric solar fluxes and aerosol radiative forcing by ground-based broadband measurements. J. Geophys. Res. 2008, 113, D21207. [Google Scholar] [CrossRef]
  5. Yoon, S.-C.; Won, J.-G. Evaluation of the aerosol direct radiative forcing out of the AERONET data. Óptica Pura y Aplicada 2004, 37, 3153–3158. [Google Scholar]
  6. Sicard, M.; Barragan, R.; Dulac, F.; Alados-Arboledas, L.; Mallet, M. Aerosol optical, microphysical and radiative properties at regional background insular sites in the western Mediterranean. Atmos. Chem. Phys. 2016, 16, 12177–12203. [Google Scholar] [CrossRef] [Green Version]
  7. Derimian, Y.; Dubovik, O.; Tanre, D.; Goloub, P.; Lapyonok, T.; Mortier, A. Optical properties and radiative forcing of the Eyjafjallajokull volcanic ash layer observed over Lille, France, in 2010. J. Geophys. Res. 2012, 117, D00U25. [Google Scholar] [CrossRef]
  8. AERONET Inversion Products (Version 3). Available online: https://aeronet.gsfc.nasa.gov/new_web/Documents/Inversion_products_for_V3.pdf (accessed on 12 July 2019).
  9. Sinyuk, A.; Dubovik, O.; Holben, B.; Eck, T.F.; Breon, F.M.; Martonchik, J.; Kahn, R.; Diner, D.J.; Vermote, E.F.; Roger, J.C.; et al. Simultaneous retrieval of aerosol and surface properties from a combination of AERONET and satellite data. Remote Sens. Environ. 2007, 107, 90–108. [Google Scholar] [CrossRef]
  10. Dubuisson, P.; Buriez, J.C.; Fouquart, Y. High spectral resolution solar radiative transfer in absorbing and scattering media: Application to the satellite simulation. J. Quant. Spectrosc. Ra. 1996, 55, 103–126. [Google Scholar] [CrossRef]
  11. Scott, N.A. A direct method of computation of the transmission function of an inhomogeneous gaseous medium-I: Description of the method. J. Quant. Spectros. Radiat. Transfer. 1974, 14, 691–704. [Google Scholar] [CrossRef]
  12. Smirnov, A.; Holben, B.N.; Dubovik, O.; Slutsker, I. Cloud screening and quality control algorithms for the AERONET data base. Remote Sens. Environ. 2000, 73, 73337–73349. [Google Scholar] [CrossRef]
  13. Wielicki, B.A.; Barkstrom, B.R.; Harrison, E.F.; Lee III, R.B.; Smith, G.L.; Cooper, J.E. Clouds and the Earth’s Radiant Energy System (CERES): An Earth Observing System Experiment. Bull. Amer. Meteor. Soc. 1996, 77, 853–868. [Google Scholar] [CrossRef]
  14. Loeb, N.G.; Kato, S.; Loukachine, K.; Smith, N.M. Angular distribution models for top-of-atmosphere radiative flux estimation from the Clouds and the Earth’s Radiant Energy System instrument on the Terra satellite: Part I. Methodology. J. Atmos. Ocean. Tech. 2005, 22, 338–351. [Google Scholar] [CrossRef]
  15. Kato, S.; Loeb, N.G. Top-of-atmosphere shortwave broadband observed radiance and estimated irradiance over polar regions from Clouds and the Earth’s Radiant Energy System (CERES) instruments on Terra. J. Geophys. Res. 2005, 110, D07202. [Google Scholar] [CrossRef]
  16. Su, W.; Corbett, J.; Eitzen, Z.A.; Liang, L. Next-Generation Angular Distribution Models for Top-of-Atmosphere Radiative Flux Calculation from the CERES Instruments: Methodology. Atmos. Meas. Tech. 2015, 8, 611–632. [Google Scholar] [CrossRef]
  17. Dubuisson, P.; Giraud, V.; Chomette, O.; Chepfer, H.; Pelon, J. Fast radiative transfer modeling for infrared imaging radiometry. J. Quant. Spectrosc. Ra. 2005, 95, 201–220. [Google Scholar] [CrossRef]
  18. Basart, S.; Pérez, C.; Cuevas, E.; Baldasano, J.M.; Gobbi, G.P. Aerosol characterization in Northern Africa, Northeastern Atlantic, Mediterranean Basin and Middle East from direct-sun AERONET observations. Atmos. Chem. Phys. 2009, 9, 8265–8282. [Google Scholar] [CrossRef] [Green Version]
  19. Gobbi, G.P.; Kaufman, Y.J.; Koren, I.; Eck, T.F. Classification of aerosol properties derived from AERONET direct sun data. Atmos. Chem. Phys. 2007, 7, 453–458. [Google Scholar] [CrossRef] [Green Version]
  20. Hoelzemann, J.J.; Longo, K.M.; Fonseca, R.M.; do Rosário, N.M.E.; Elbern, H.; Freitas, S.R.; Pires, C. Regional representativity of AERONET observation sites during the biomass burning season in South America determined by correlation studies with MODIS Aerosol Optical Depth. J. Geophys. Res. 2009, 114, D13301. [Google Scholar] [CrossRef]
  21. Sioris, C.E.; Abboud, I.; Fioletov, V.E.; McLinden, C.A. AEROCAN, the Canadian sub-network of AERONET: Aerosol monitoring and air quality applications. Atmos. Environ. 2017, 167, 444–457. [Google Scholar] [CrossRef]
  22. Chen, H.; Cheng, T.; Gu, X.; Li, Z.; Wu, Y. Characteristics of aerosols over Beijing and Kanpur derived from the AERONET dataset. Atmos. Poll. Res. 2016, 7, 162–169. [Google Scholar] [CrossRef]
  23. Gordon, H.R. Atmospheric correction of ocean color imaginary in the Earth Observing System era. J. Geophys. Res. 1997, 102, 17081–17102. [Google Scholar] [CrossRef]
  24. Torres, O.; Bhartia, P.K.; Sinyuk, A.; Welton, E.J.; Holben, B. Total Ozone Mapping Spectrometer measurements of aerosol absorption from space: Comparison to SAFARI 2000 ground-based observations. J. Geophys. Res. 2005, 110. [Google Scholar] [CrossRef] [Green Version]
  25. Hsu, N.C.; Tsay, S.C.; King, M.D.; Herman, J.R. Aerosol properties over bright-reflecting source regions. IEEE Trans. Geosci. Remote Sens. 2004, 42, 557–569. [Google Scholar] [CrossRef]
  26. Rutan, D.; Rose, F.; Roman, M.; Manalo-Smith, N.; Schaaf, C.; Charlock, T. Development and assessment of broadband surface albedo from Clouds and the Earth’s Radiant Energy System Clouds and Radiation Swath data product. J. Geophys. Res. 2009, 114, D08125. [Google Scholar] [CrossRef]
  27. Giles, D.M.; Holben, B.N.; Eck, T.F.; Sinyuk, A.; Smirnov, A.; Slutsker, I.; Dickerson, R.R.; Thompson, A.M.; Schafer, J.S. An analysis of AERONET aerosol absorption properties and classifications representative of aerosol source regions. J. Geophys. Res. 2012, 117, D17203. [Google Scholar] [CrossRef]
Figure 1. AERONET stations and aerosol types selected for the validation. SEB stands for Sede Boker, BAN for Banizombou, ALF for Alta Floresta, RIB for Rio Branco, BRL for Bratts Lake, EGB for Egbert, GSF for GSFC, and BEI for Beijing.
Remotesensing 11 02168 g001
Figure 2. Monthly AERONET aerosol optical depth (AOD) at 440 nm (and standard deviation) at the stations representatives of (a) MD, (b) BB, (c) BC, and (d) UI aerosol types.
Remotesensing 11 02168 g002
Figure 3. (a) Scattergram of F C E R S W , , T O A vs. F A E R S W , , T O A for the entire database (all sites) and criterion 1a; (b) histogram of the PDF of the difference F A E R S W , , T O A F C E R S W , , T O A , and AOD (from AERONET) and SA (from CERES) vs. F A E R S W , , T O A F C E R S W , , T O A . On the histogram, the vertical red solid line represents the mean (M), and the vertical red dash lines the mean ± 1 sigma (σ).
Remotesensing 11 02168 g003
Figure 4. (a,b) Scattergram and (c,d) histogram for MD and (e,f) scattergram, and (g,h) histogram for BB. See caption of Figure 3 for more details.
Remotesensing 11 02168 g004
Figure 5. (a,b) Scattergram and (c,d) histogram for BC and (e,f) scattergram, and (g,h) histogram for UI. See caption of Figure 3 for more details.
Remotesensing 11 02168 g005
Table 1. Main characteristics of the selected AERONET stations. MD stands for mineral dust, BB for biomass burning, BC for background continental, and UI for urban-industrial. NAER is the number of instantaneous AERONET V3L2.0 inversions available.
StationAcronymAerosol TypeV3L2.0LongitudeLatitudeDate RangeNAER
Sede BokerSEBMD>15 y34.782E30.855N16/10/95–14/01/1817005
BanizombouBANMD>15 y2.655E13.547N17/10/95–07/07/189030
Alta FlorestaALFBB>10 y56.104W9.871S22/06/93–03/03/182904
Rio BrancoRIBBB>7 y67.869W9.957S24/08/00–18/10/171628
Bratts LakeBRLBC>7 y104.713W50.204N22/06/97–06/11/122987
EgbertEGBBC>10 y79.781W44.232N03/09/97–29/05/184430
GSFCGSFUI>15 y76.840W38.992N27/05/93–05/03/1811682
BeijingBEIUI>10 y116.381E39.977N09/03/01–04/06/184815
Table 2. Criteria for selecting space and time co-located AERONET and CERES measurements.
CriterionRestrictionΔt(min)Δr(km)SZA CorrectionCloud Coverage(%)
1aHigh +±5±10No>97
1bHigh -±5±20No>97
2aMedium +±60±10Yes>97
2bMedium -±60±20Yes>97
Table 3. Information of the coincident space-time co-located measurements. N is the number of coincidences and CF is the correction factor.
StationCriterionNOverpass TimeSatellite S Z A C E R ¯ (º) S Z A A E R ¯ (º) CF
SEB1a93Oct.–Feb.All54.754.7-
BAN2b120Oct.–Feb.Aqua46.255.91.103
ALF2b177Apr.–Aug.Aqua44.453.41.106
RIB2b64May–Aug.All45.253.91.108
BRL1b45Sep.–Nov.Terra, Aqua59.859.8-
EGB2a69Sep.-Jan.; Mar.All; Terra, Aqua56.357.41.012
GSF1a75Oct.-Mar.All58.358.3-
BEI1b109Sep.-Mar.All56.957.0-
Table 4. Statistics of the scattergrams of CERES vs. AERONET space and time co-located fluxes.
StationSlope ± σBias ± σ
(Wm−2)
RMSE
(Wm−2)
R2Diff ± σ
(Wm−2)
NormDiff ± σ
(%)
Percentile 5,95
(Wm−2)
All (1a, N = 209)1.04 ± 0.01–3.67 ± 2.6611.950.96–2.52 ±12.09–0.84 ± 6.74–22.76, 16.06
SEB (1a, N = 93)0.98 ± 0.1210.21 ± 26.8614.160.44–5.87 ± 14.08–2.13 ± 5.98–24.35, 17.50
BAN (2b, N = 120)0.52 ± 0.07123.05 ± 16.4313.380.32–9.37 ± 15.80–3.67 ± 6.36–31.62, 21.45
ALF (2b, N = 177)0.76 ± 0.0734.92 ± 10.295.800.432.67 ± 6.001.86 ± 3.99–7.04, 13.25
RIB (2b, N = 64)0.61 ± 0.1153.52 ± 16.015.210.353.91 ± 5.682.78 ± 3.99–5.36, 12.67
BRL (1b, N = 45)0.76 ± 0.1033.15 ± 13.3512.640.59–0.41 ± 13.360.10 ± 10.04–21.38, 24.05
EGB (2a, N = 69)0.91 ± 0.065.45 ± 8.308.680.766.76 ± 8.765.77 ± 7.39–9.40, 20.69
GSF (1a, N = 75)0.82 ± 0.0821.86 ± 9.247.160.60–1.27 ± 7.35–0.83 ± 6.00–15.35, 8.52
BEI (1b, N = 109)0.61 ± 0.0549.58 ± 6.999.320.540.37 ± 11.310.46 ± 8.47–17.39, 19.24

