On the Combination of Remote Sensing and Geophysical Methods for the Digitalization of the San Lázaro Middle Paleolithic Rock Shelter (Segovia, Central Iberia, Spain)

 ,
,  ,
,  ,
,  , ,
, ,  ,
,
Abstract
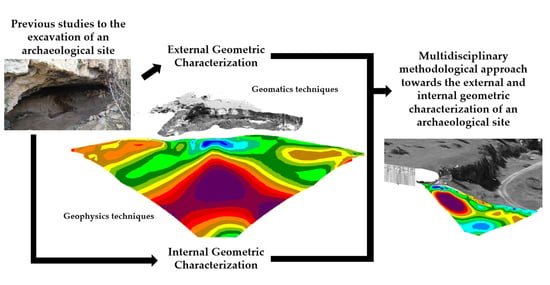
1. Introduction
- -
- Image-based methods: this group includes terrestrial and aerial photogrammetry (on board airborne systems like drones, among others). These methods use the image based modelling strategy, more specifically the Structure from Motion (SfM) approach, making a 3D reconstruction of the scene by the use of digital images (2D information). Images must follow a certain shooting protocol to obtain a rigorous geometric model. Topography support (GPS, Total Station, rulers, etc.) is also required for the scale definition [9,10].
- -
- Range-based methods: these methods are based on active sensors that emit a laser beam, which is reflected from the object or scene to capture metric information. The final product only includes spatial information of the scene with a unique radiometric value that depends on the laser wavelength [11].
2. Materials and Methods
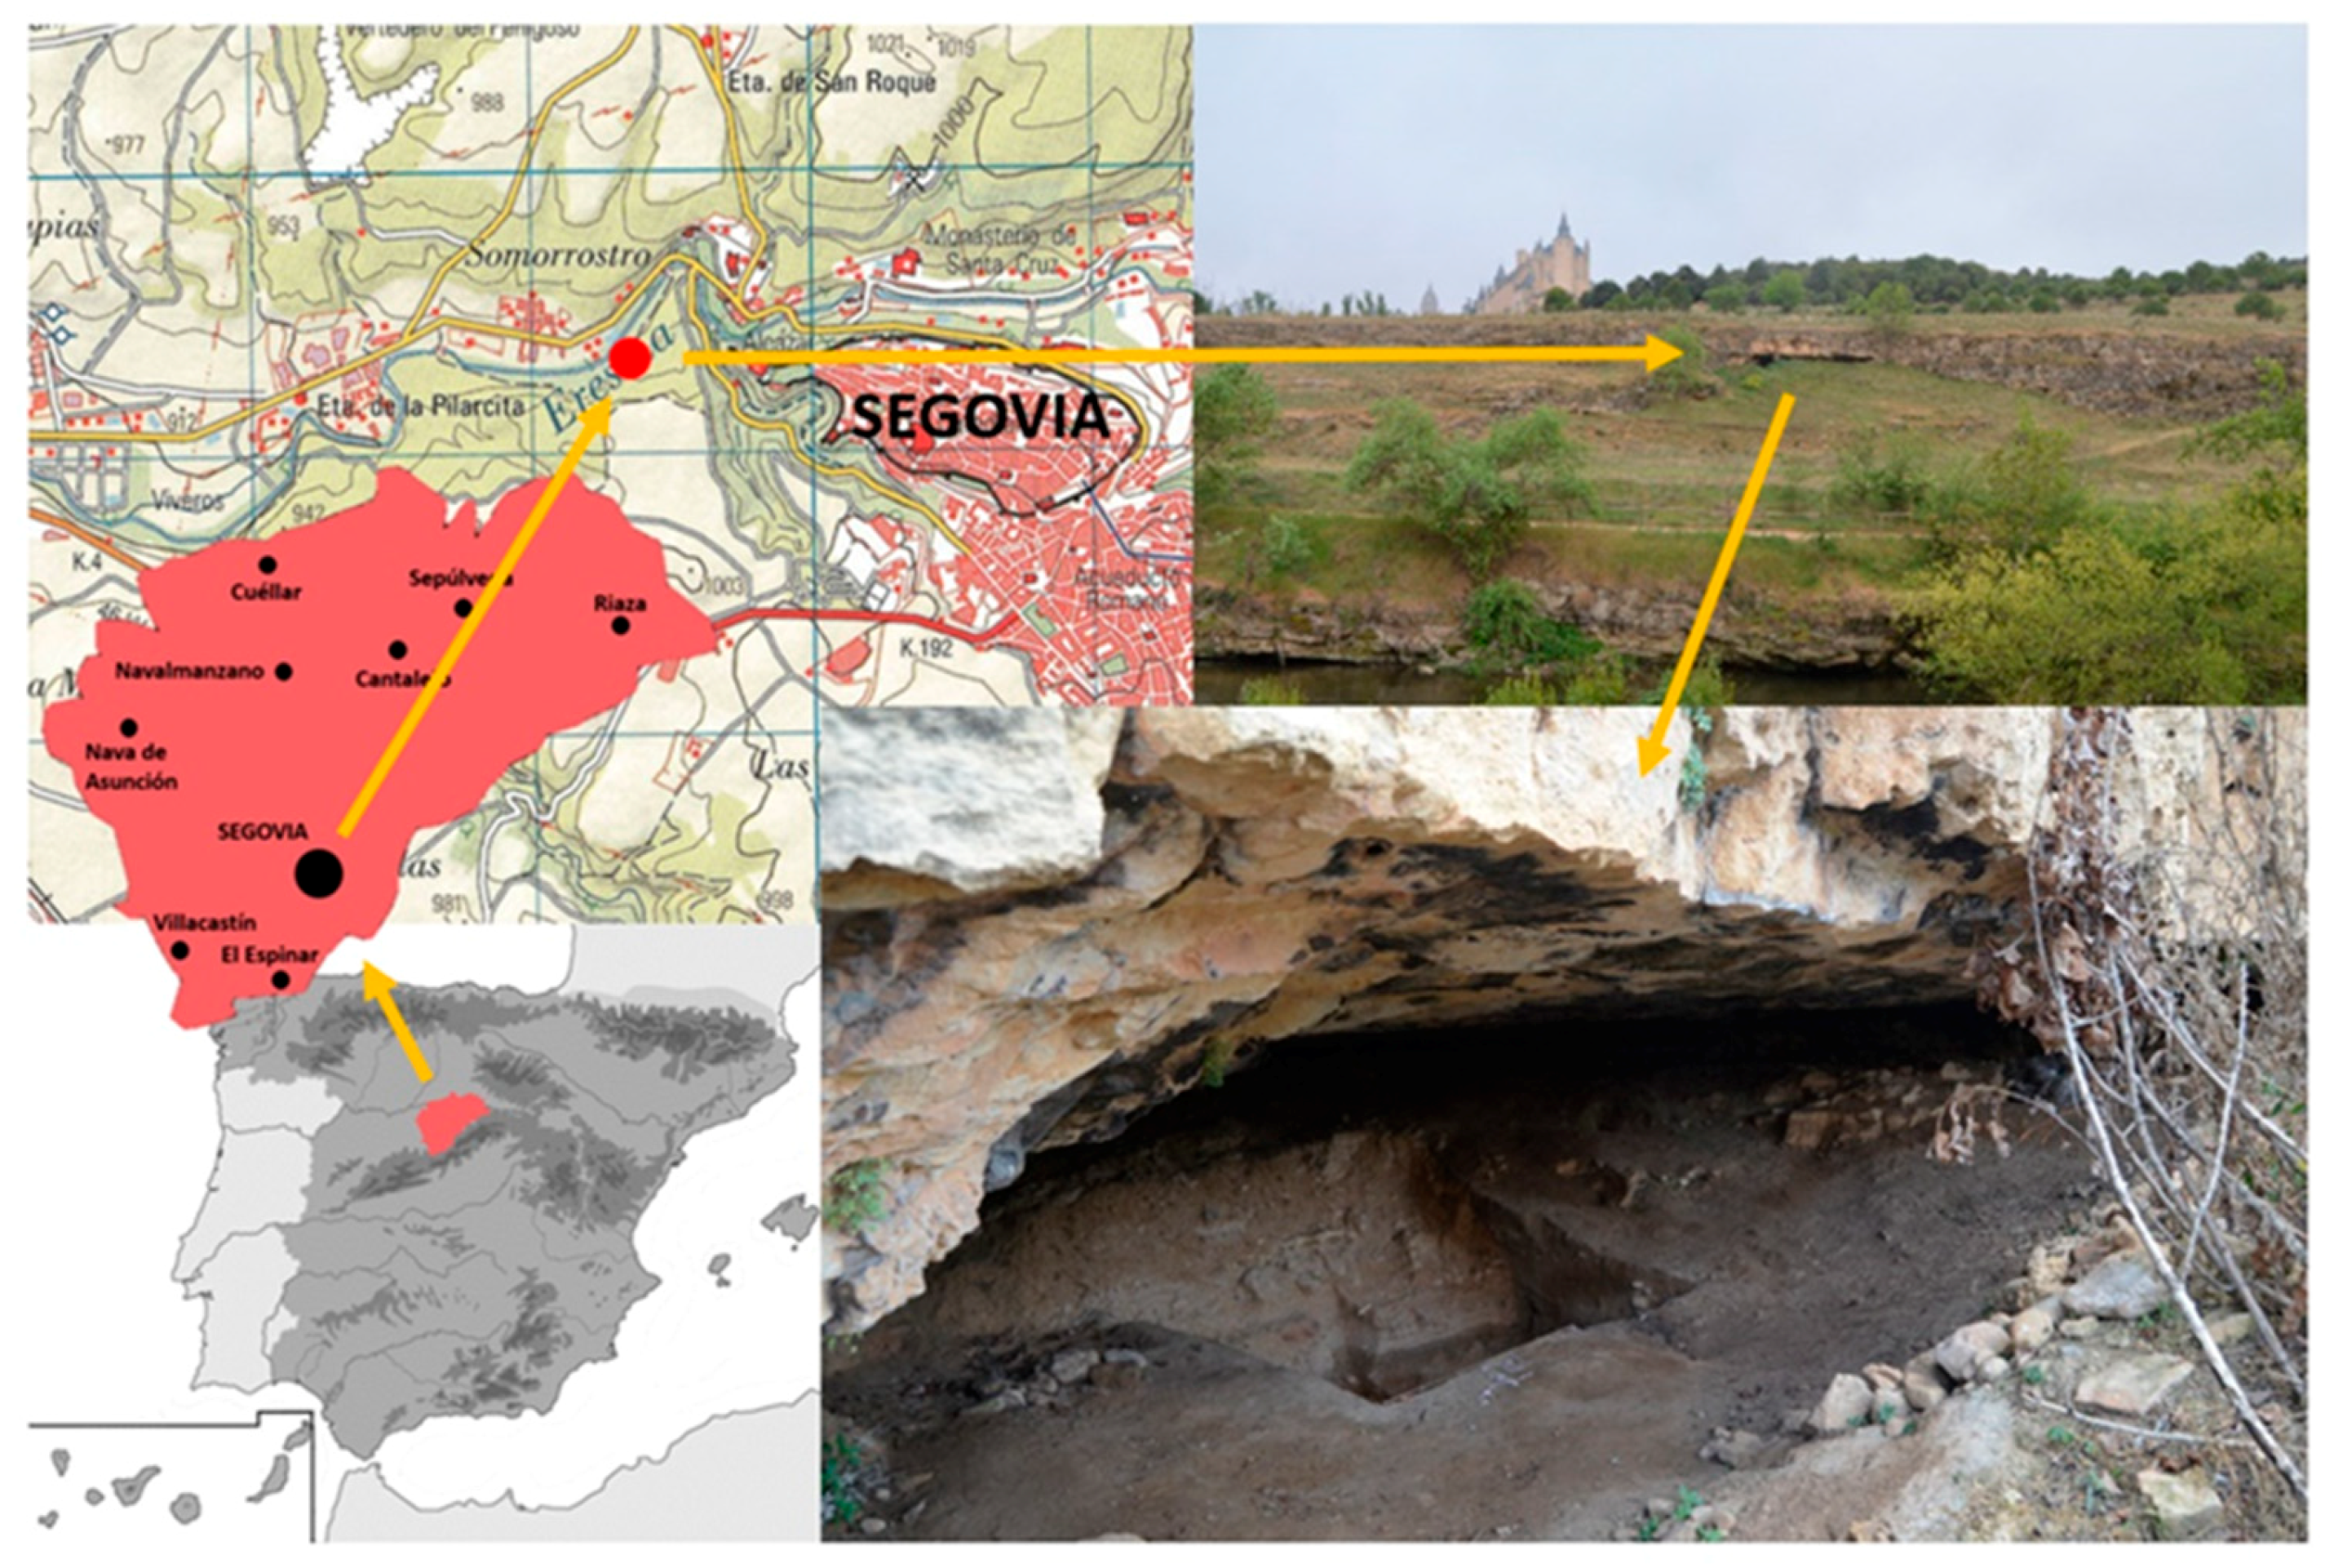
2.1. The San Lázaro Rock Shelter (Segovia, Spain)
2.1.1. Geographical and Geological Context
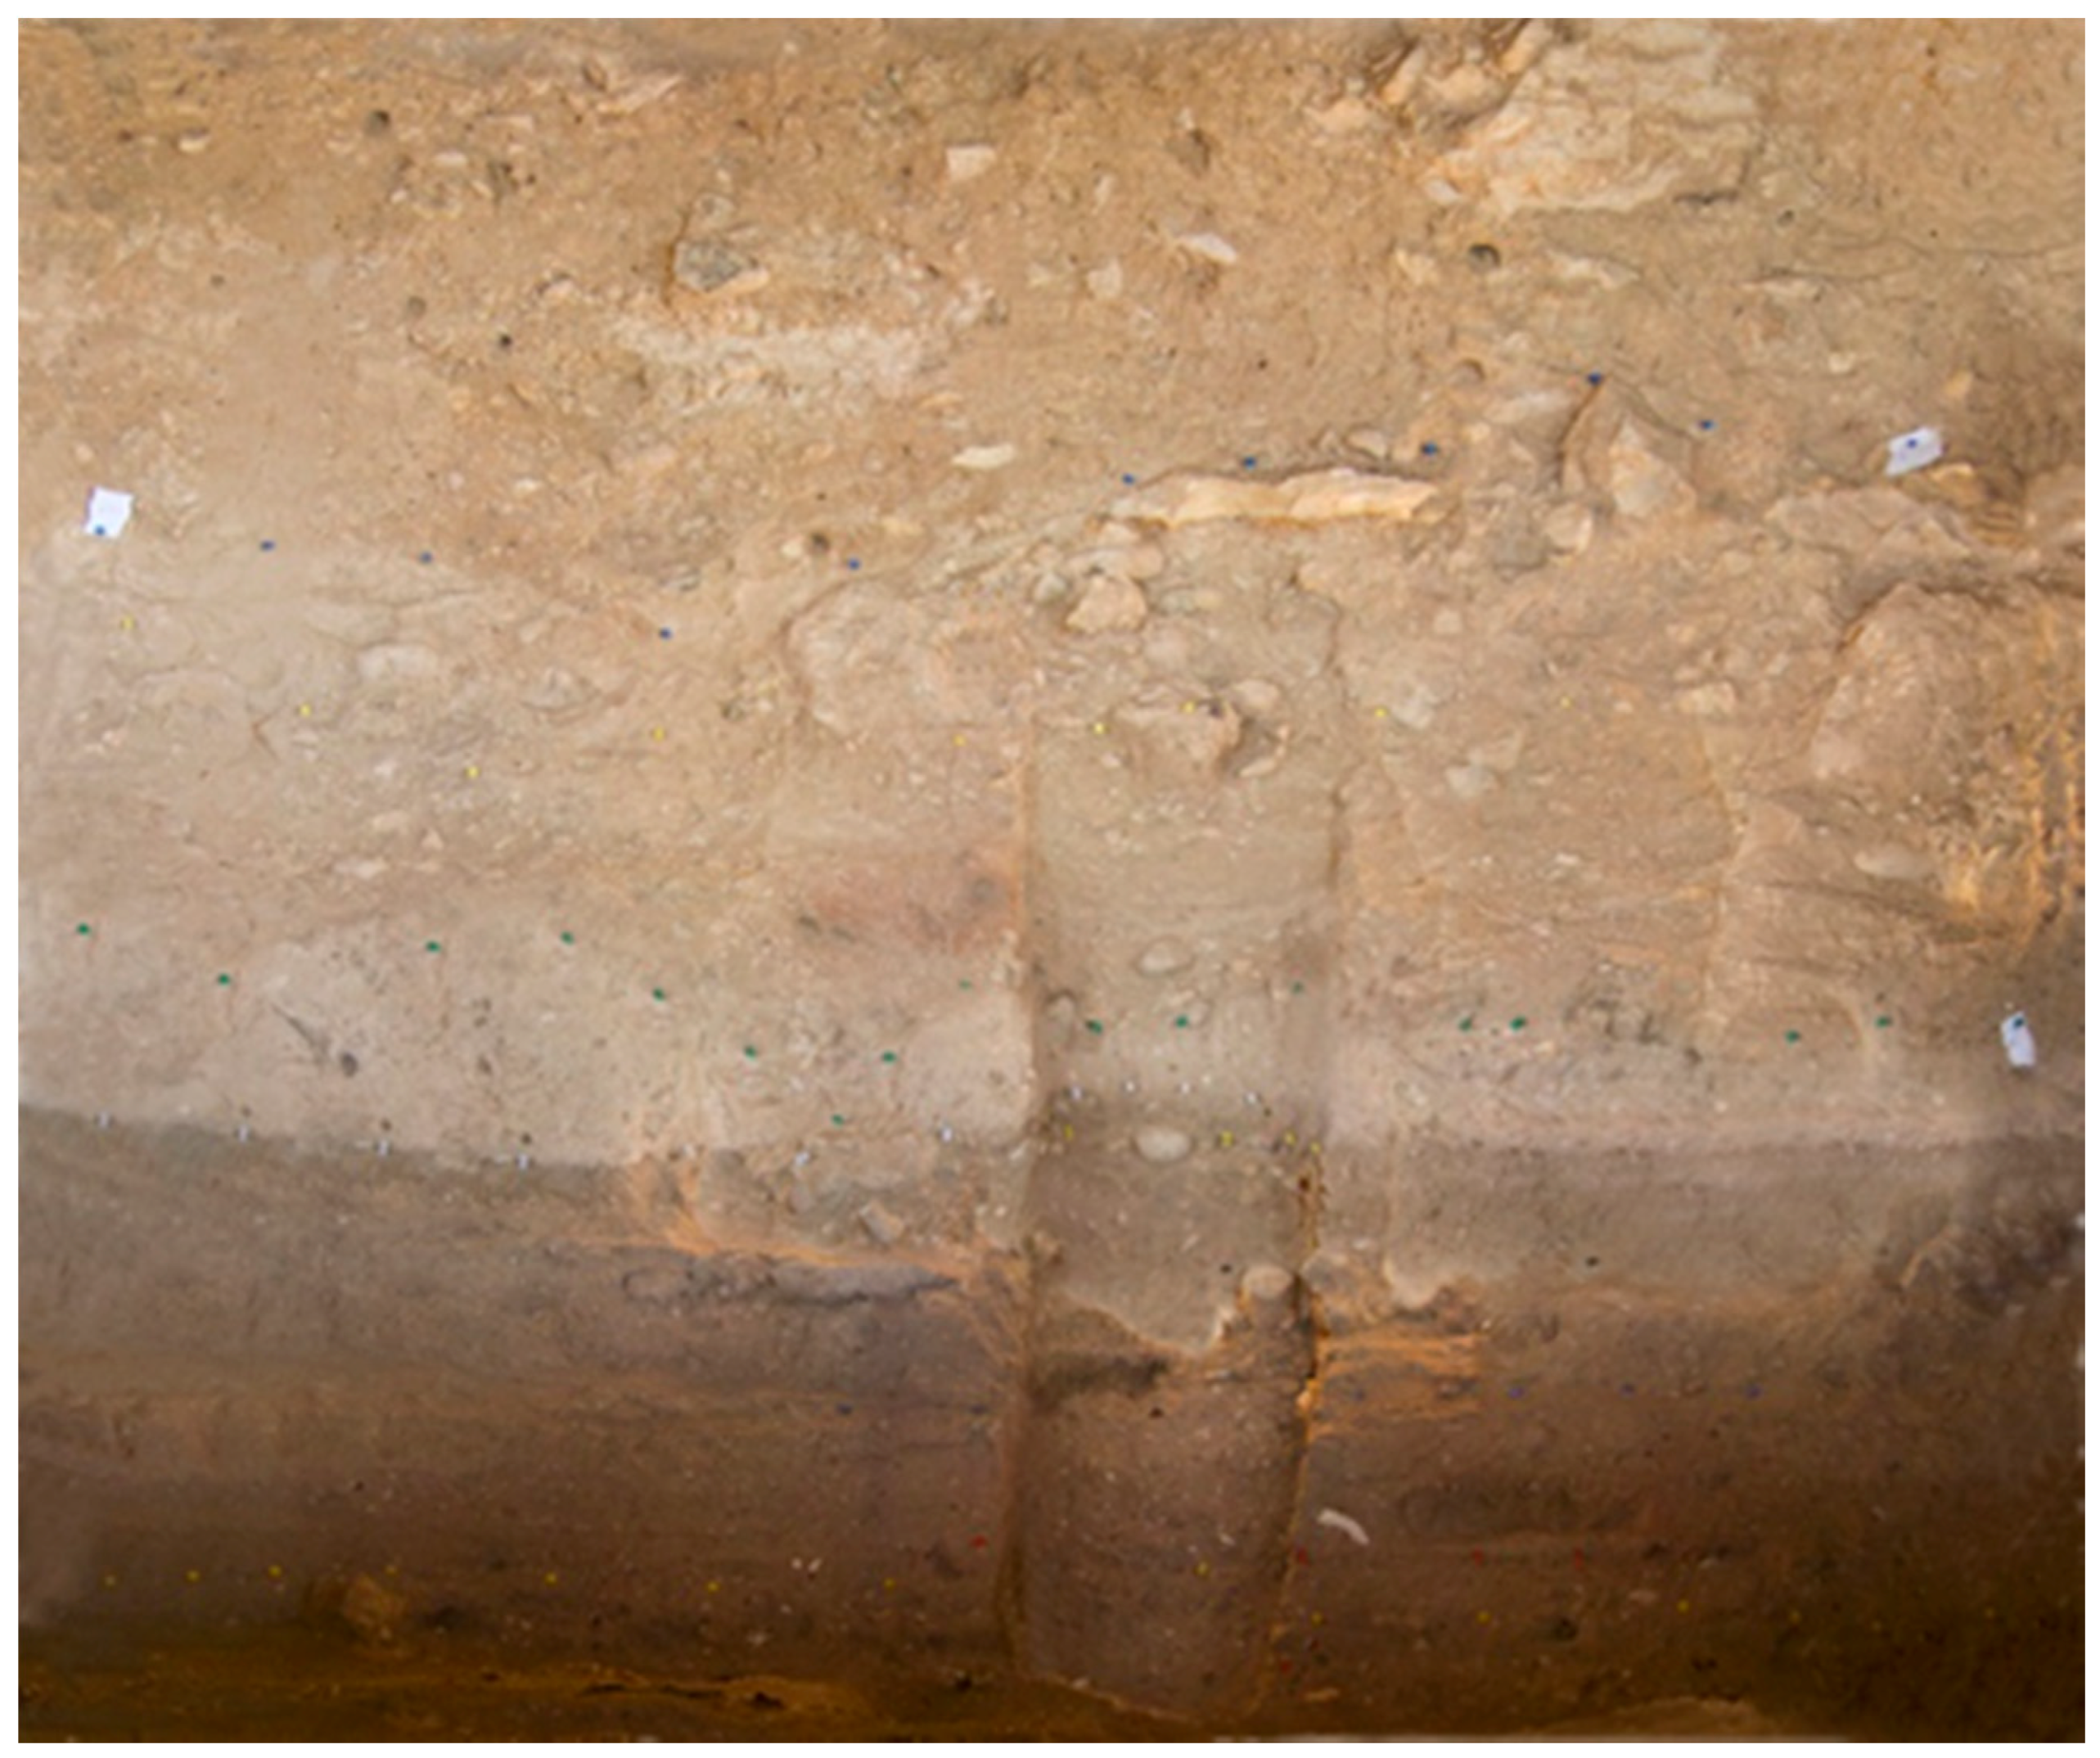
2.1.2. Site Description
2.2. Integral Digitalization of the Rock Shelter by Means of Remote Sensing and Geophysical Approaches
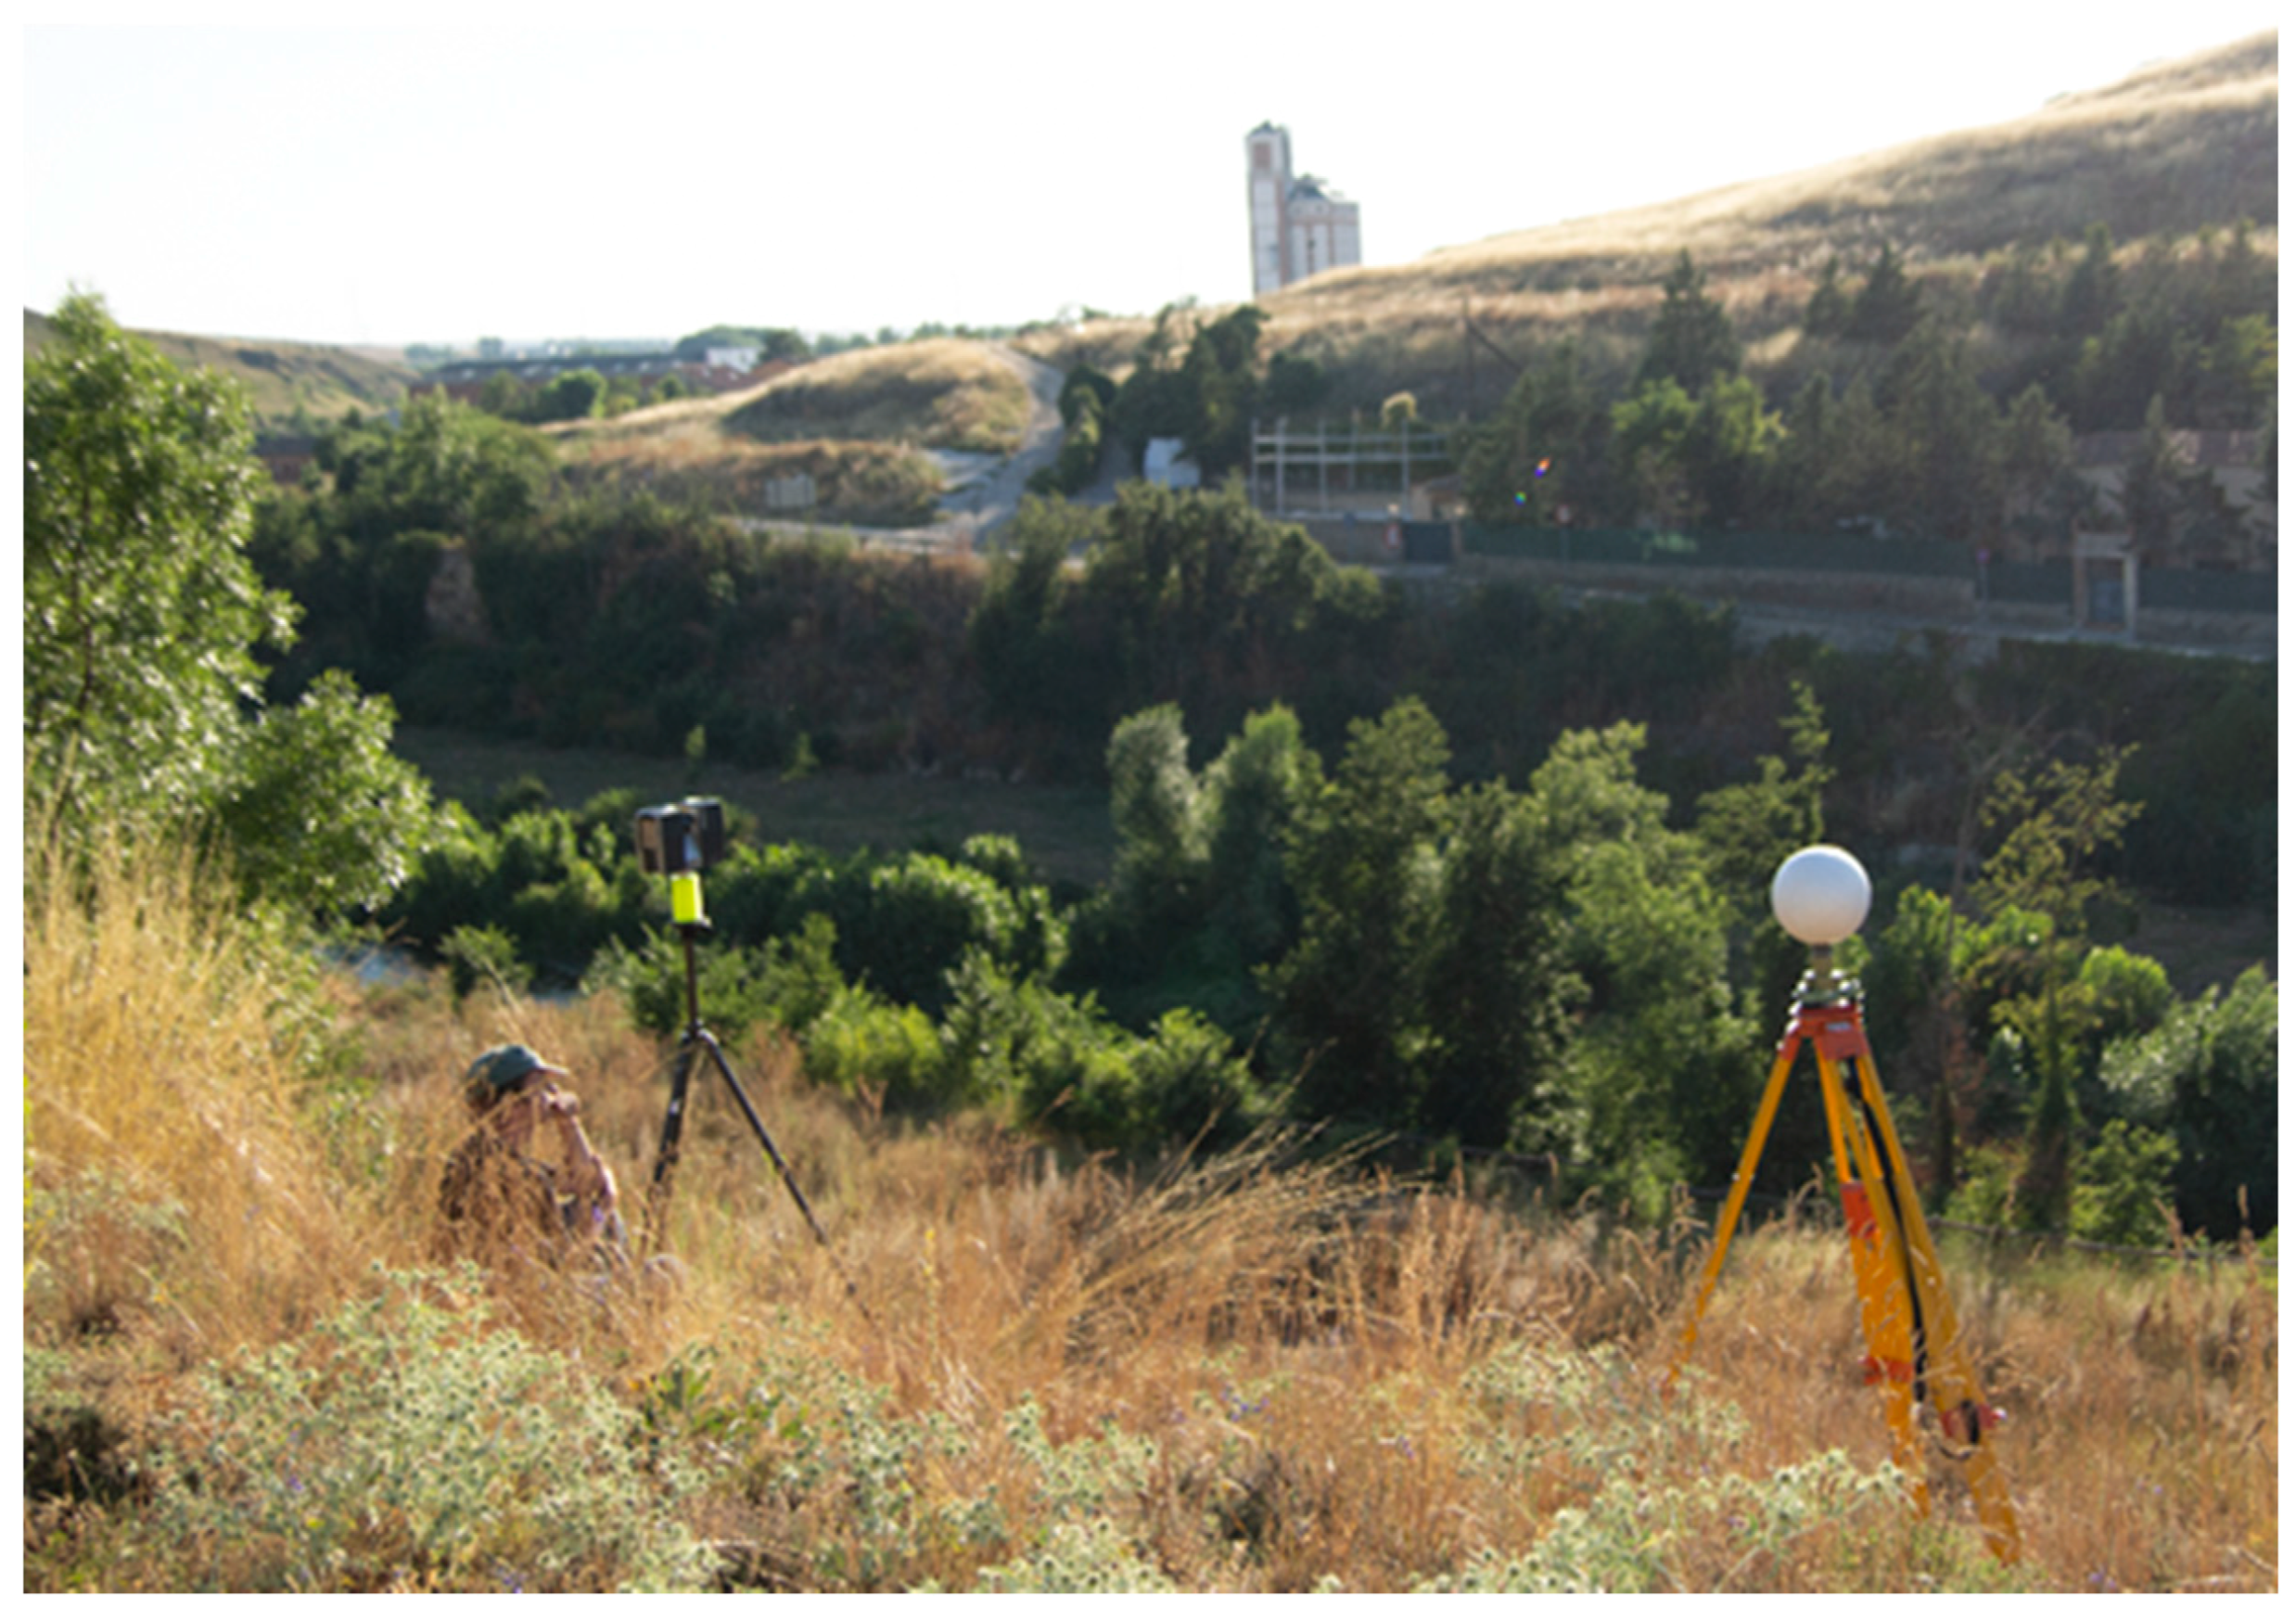
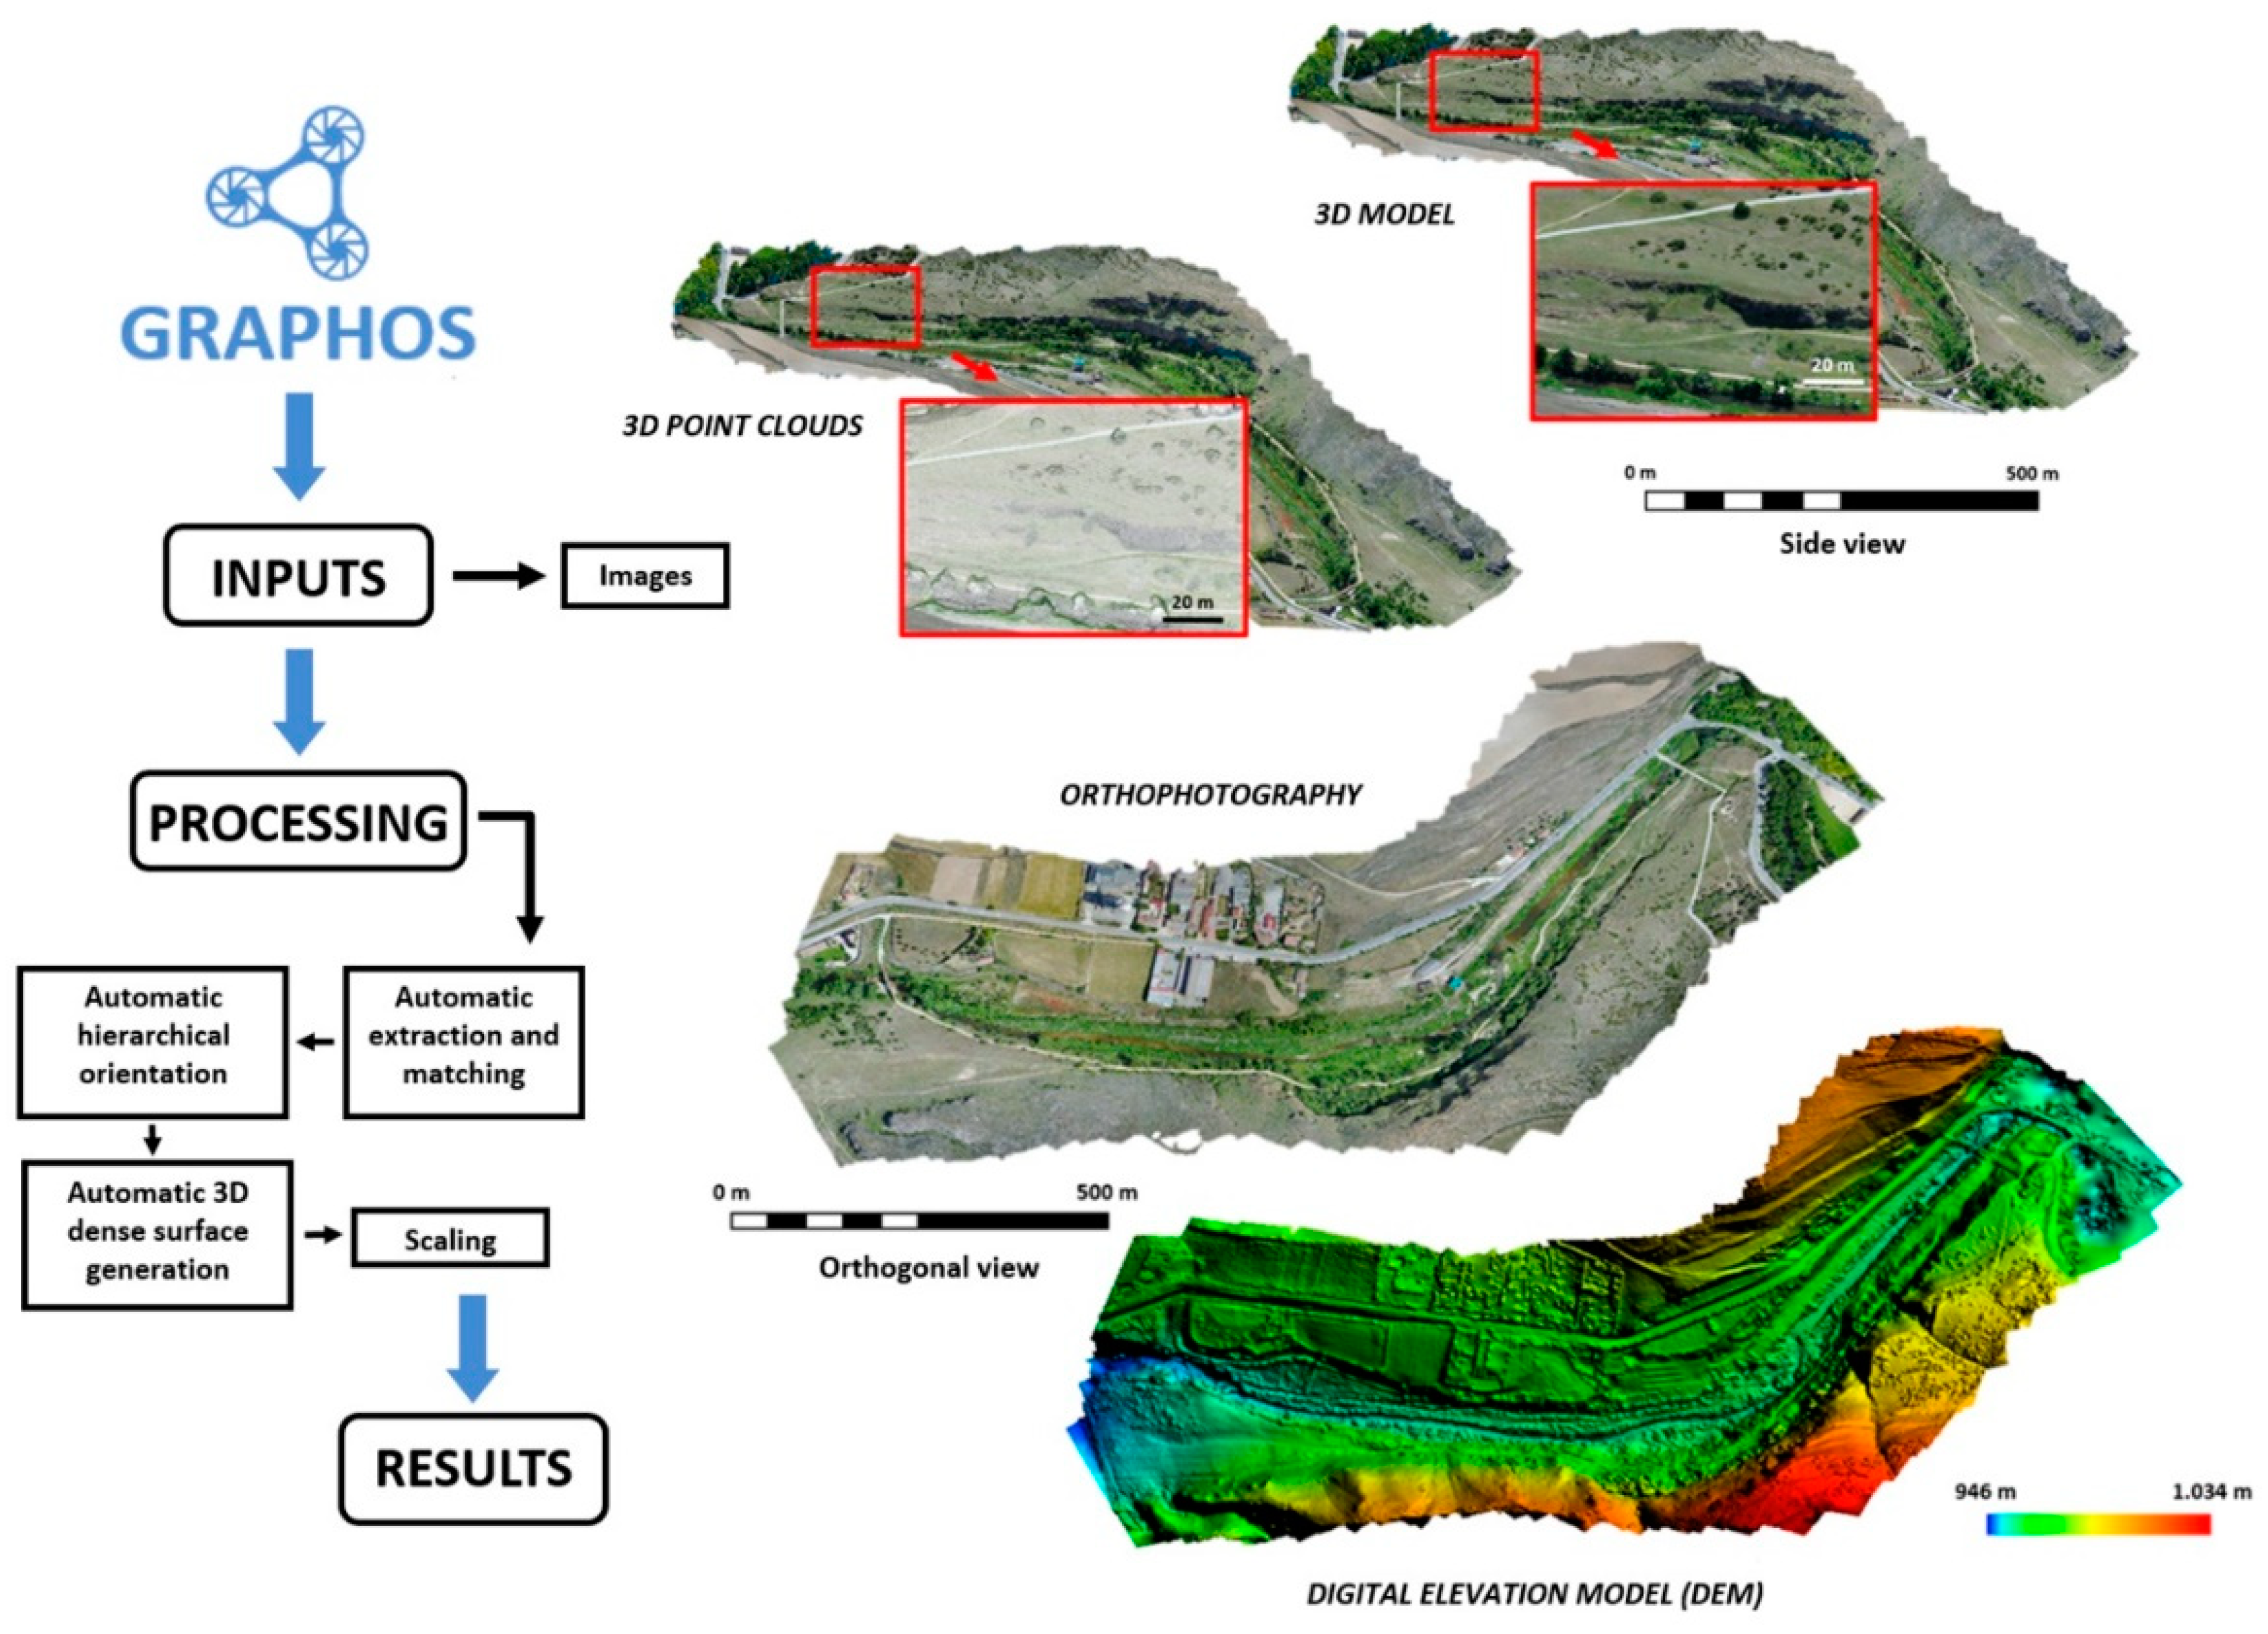
2.2.1. Aerial Photogrammetry
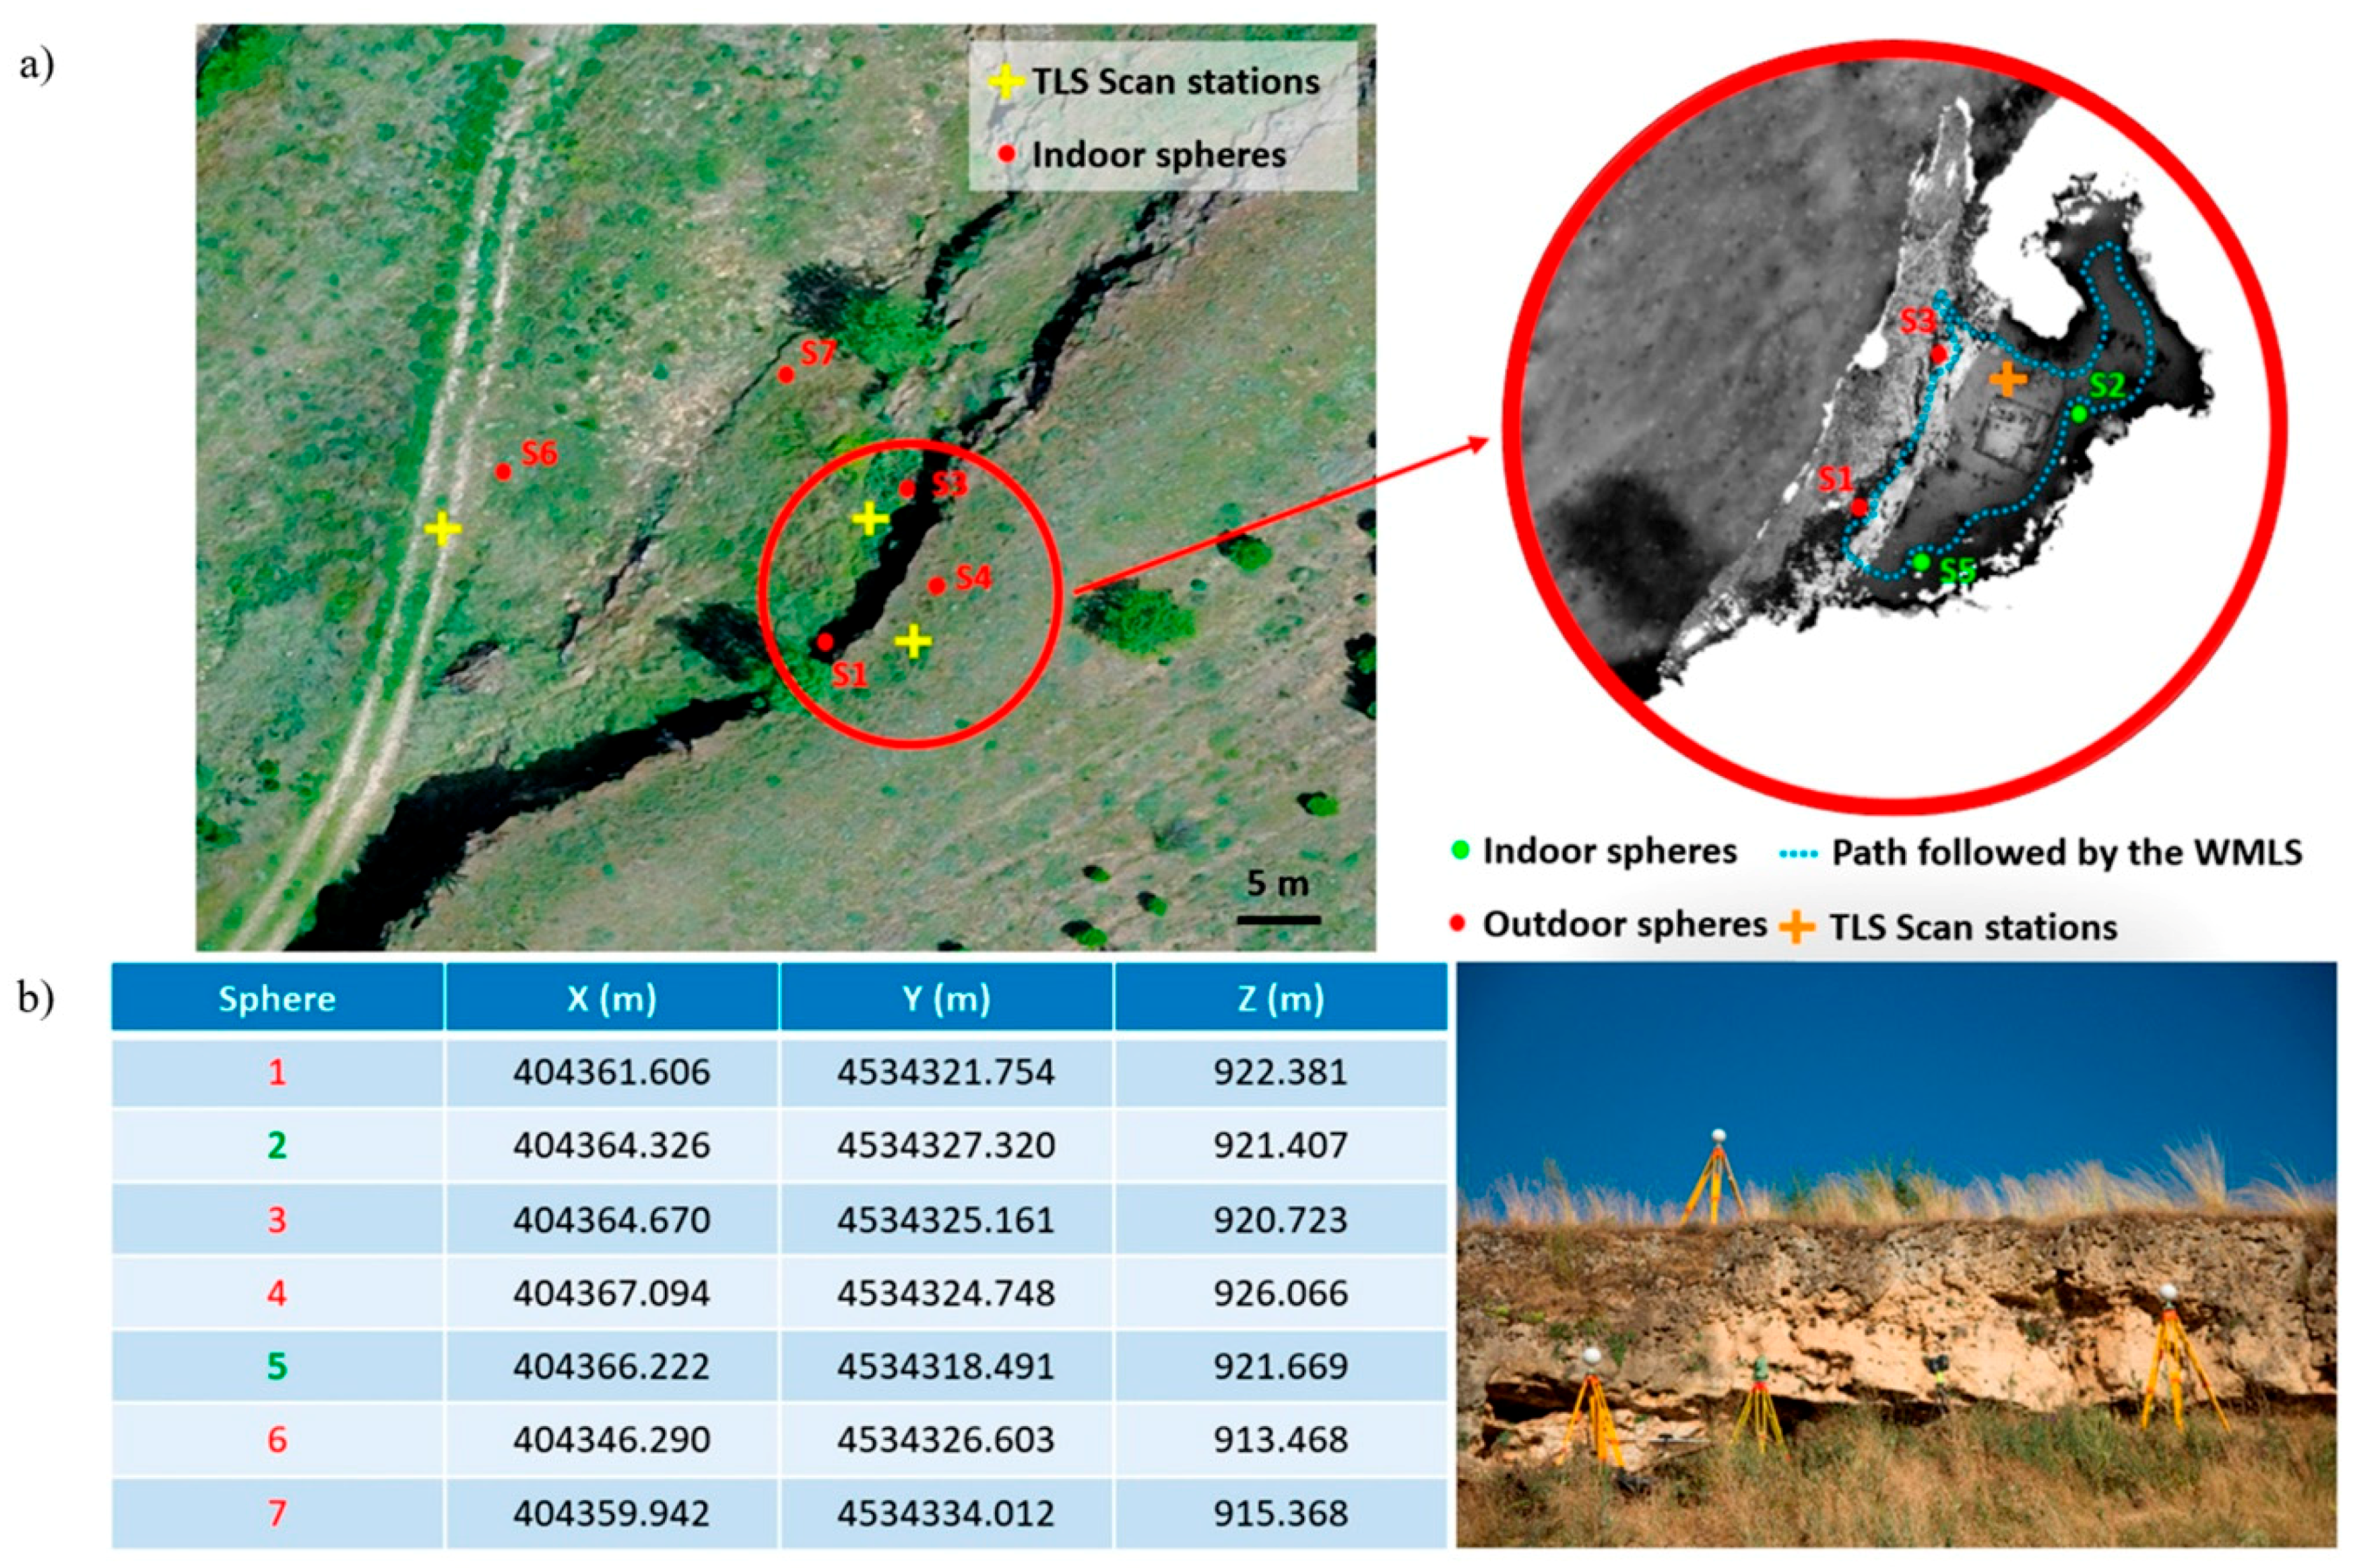
2.2.2. Terrestrial Laser Scanner
2.2.3. Wearable Mobile Mapping System
2.3. Geophysical Methods
2.3.1. Electrical Resistivity Tomography (ETR)
- Pore volume proportion versus total rock volume. Initially, the greater the porosity, the lower the resistivity if the porosity is filled (water, clay, etc.). In the case of empty pores (air filling), a resistivity increase will be produced due to the dielectric air nature.
- Pores geometric disposition (formation factor). The greater the pore connection, the lower the resistivity, since the fluid and ion mobility is easier.
- Proportion of pores filled with water versus empty pores. The greater the proportion of water-filled pores, the resistivity decreases as water allows the circulation of electric current, as opposed to air (dielectric).
- Resistivity or conductivity of the water or fluid that is filling the pores. The higher the water conductivity, as in the case of seawater, the lower the resistivity of the formation containing it.
- It allows the obtaining of precise two-dimensional resistivity subsoil sections that enable the determination of the position of the limits and materials structure.
- It is a non-invasive technique that allows the realization of work in any kind of grounds, environment or installation.
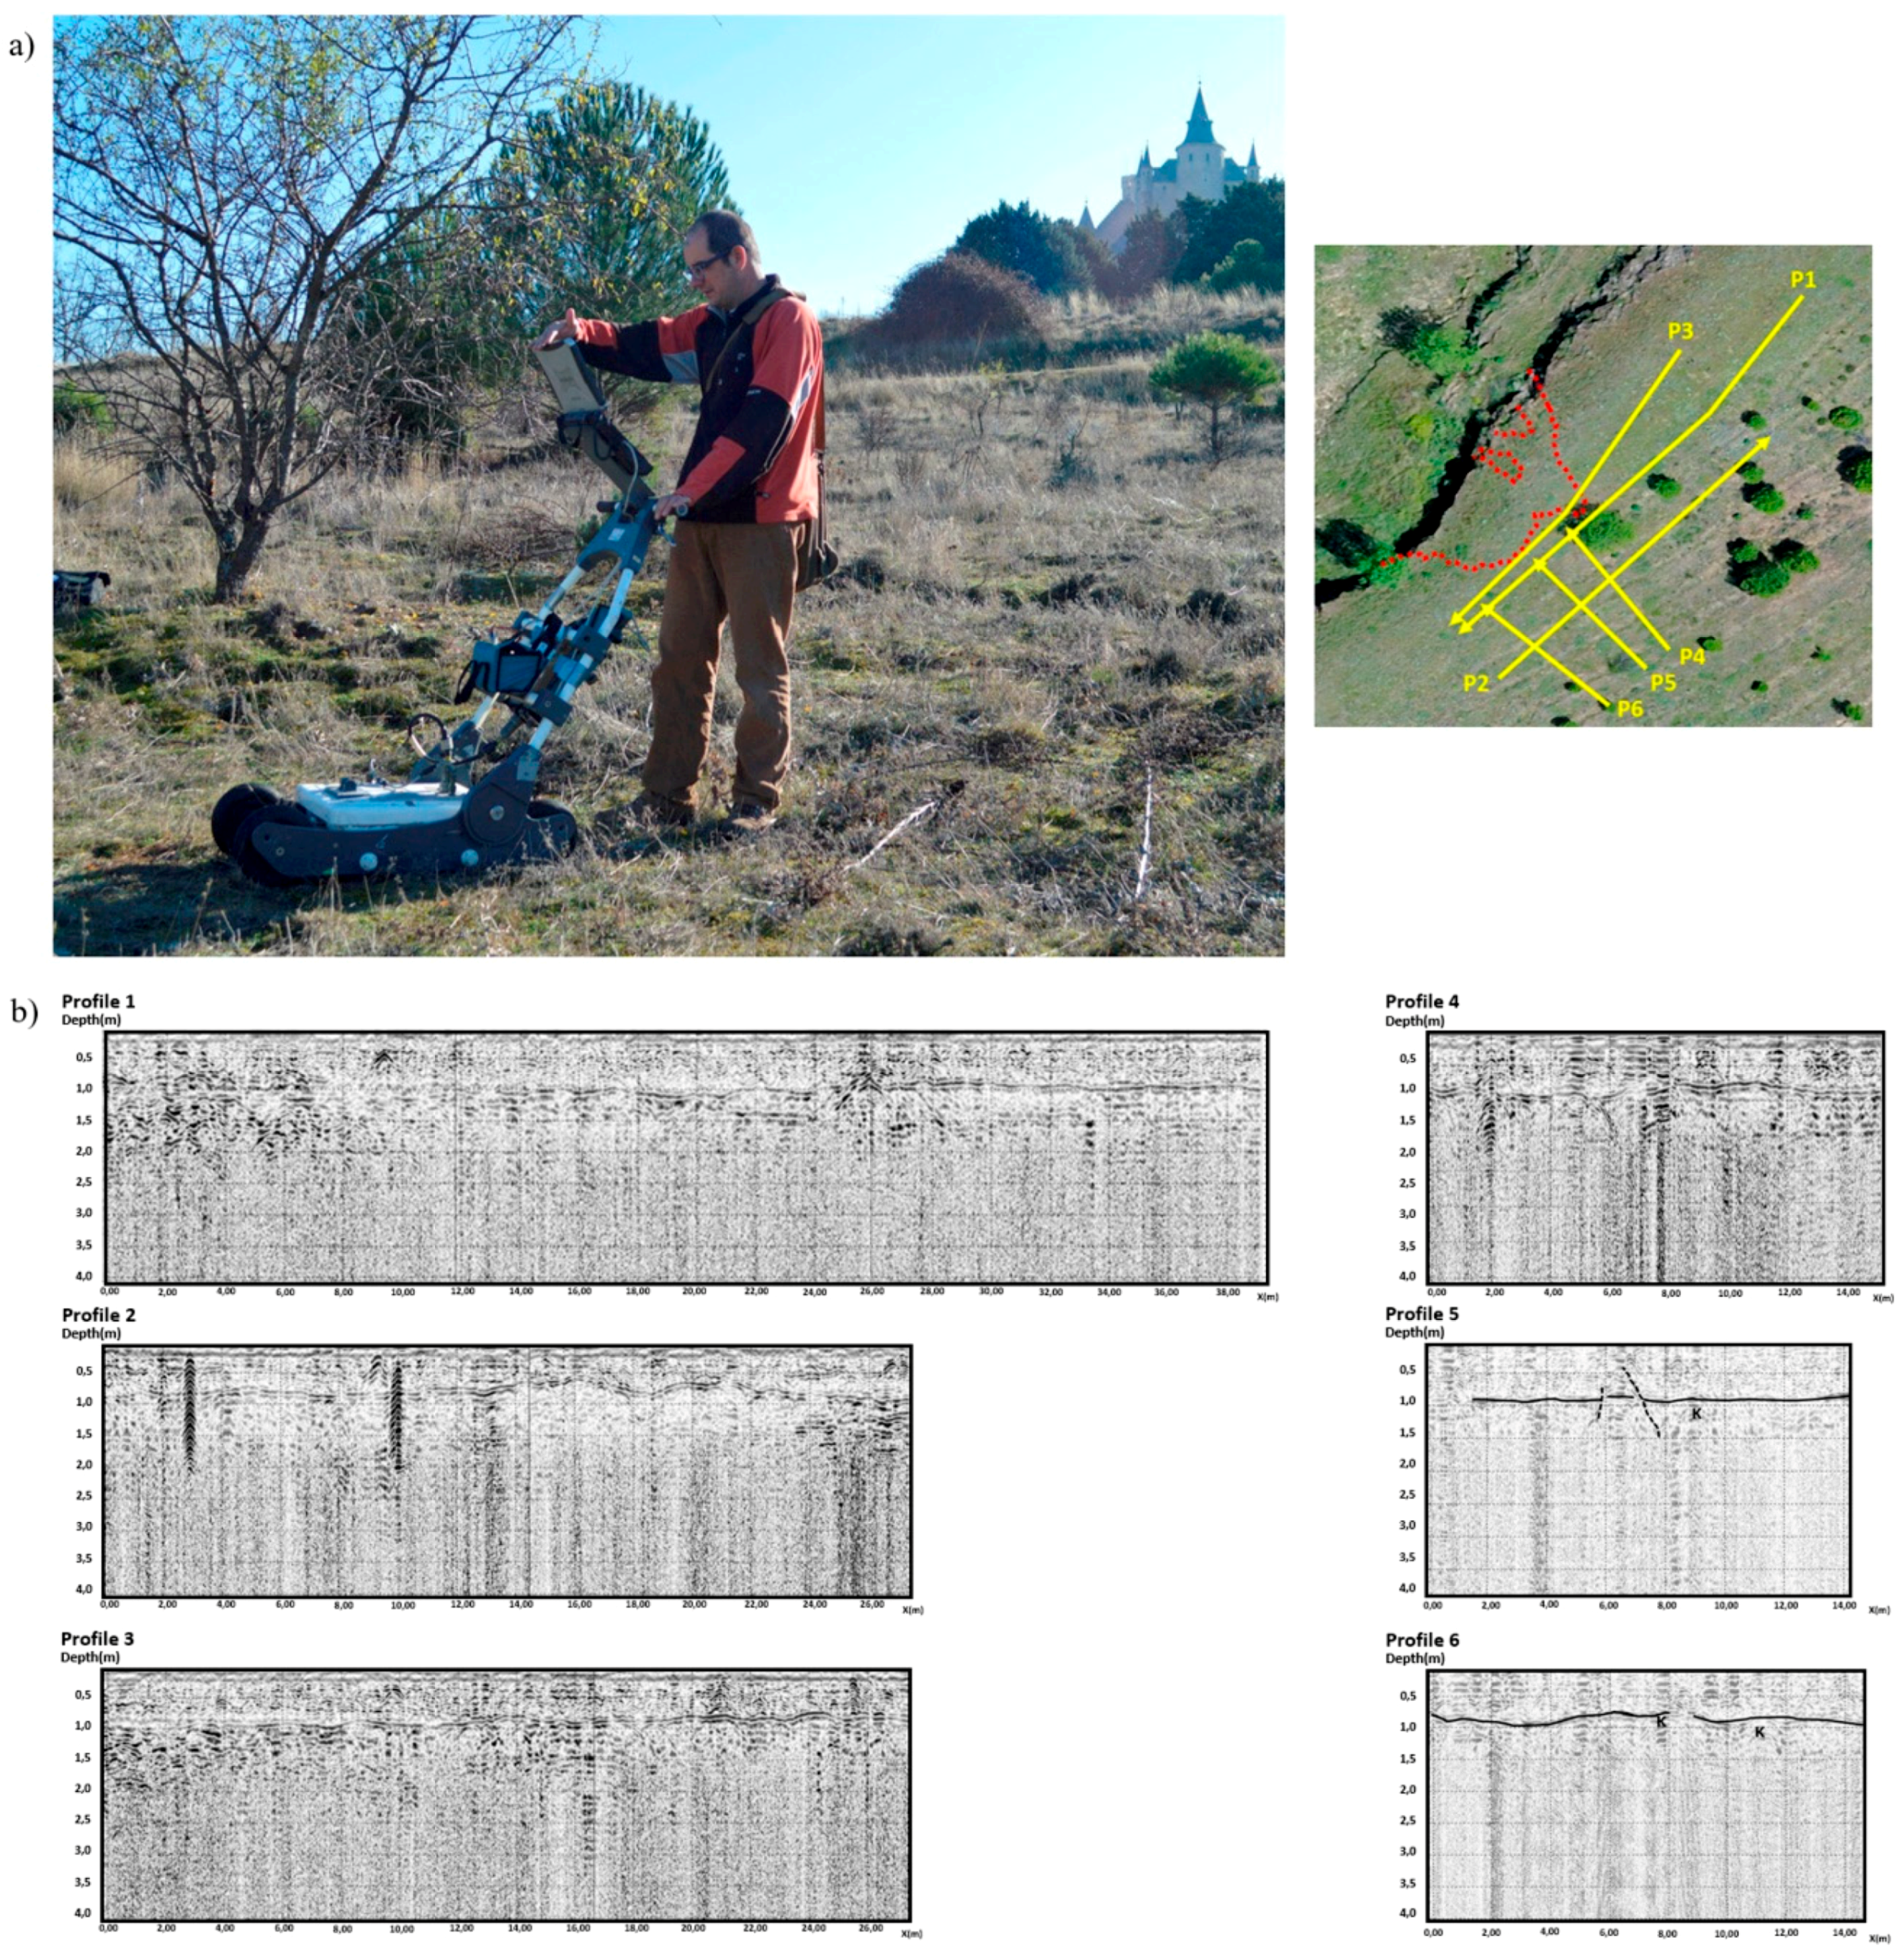
2.3.2. Ground Penetration Radar (GPR)
3. Results
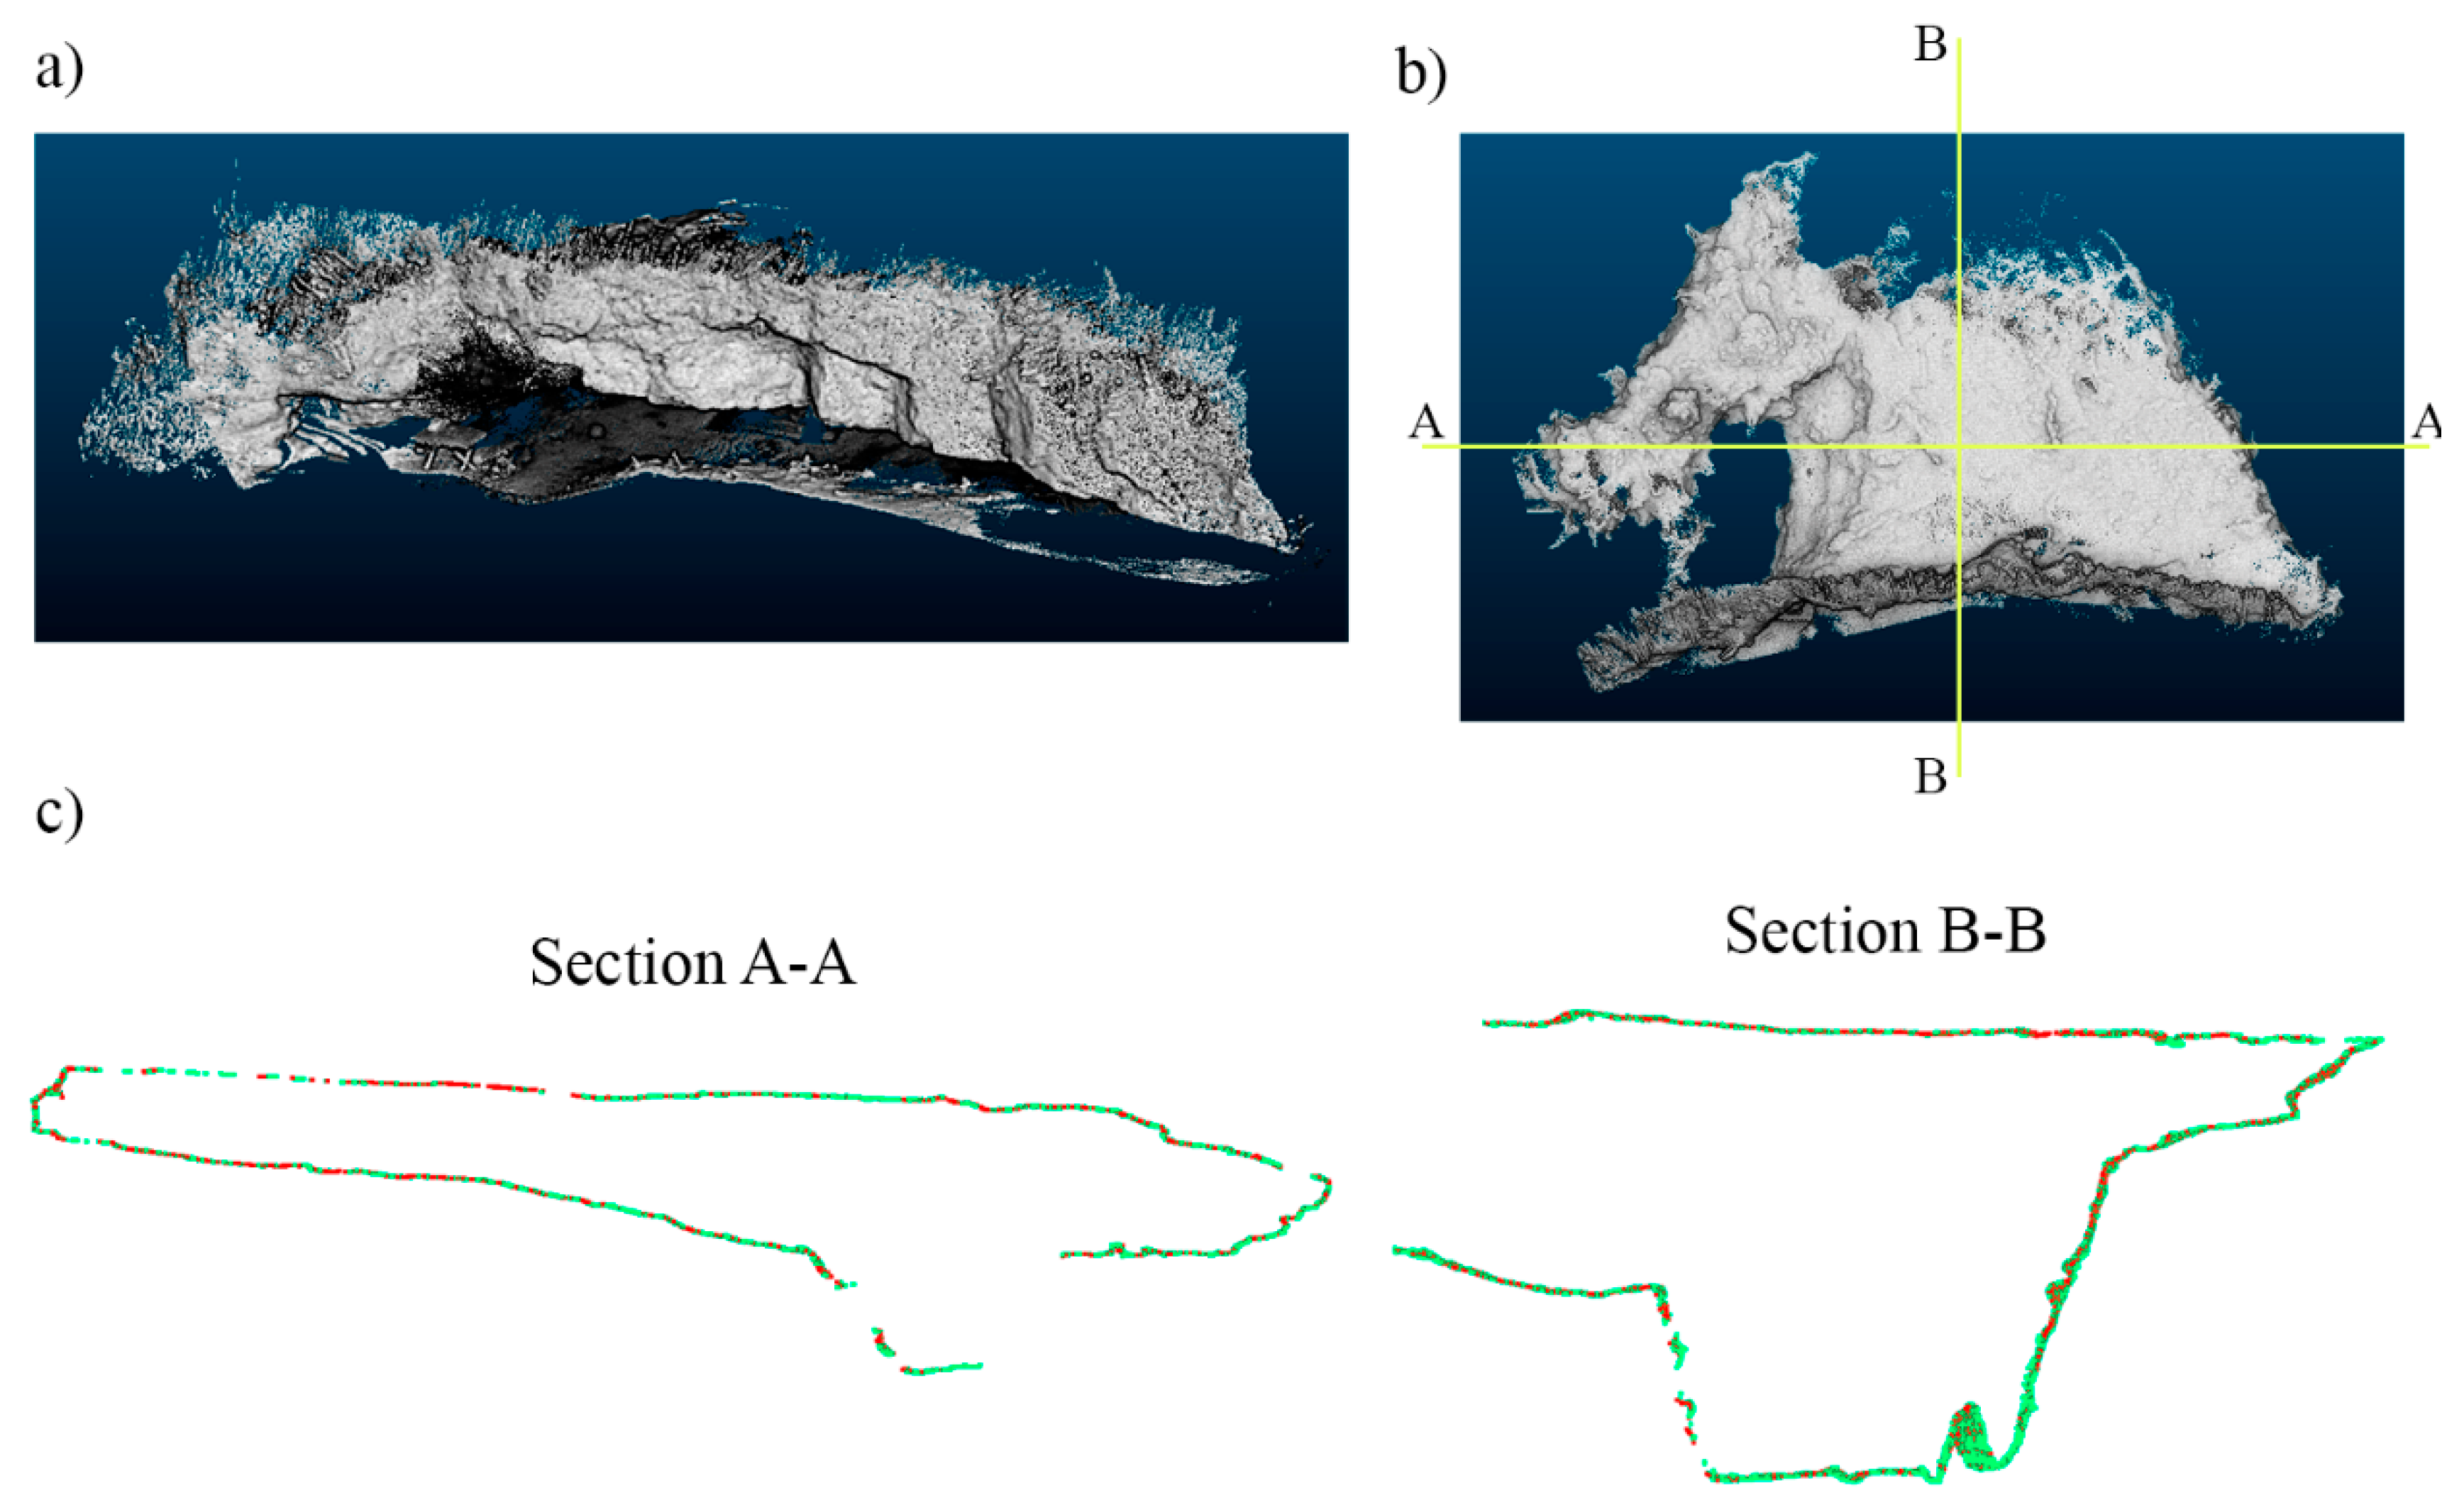
3.1. Definition of the External Geometry by Means of the Combination SfM-SLAM
3.1.1. Digitalization at a Global Scale
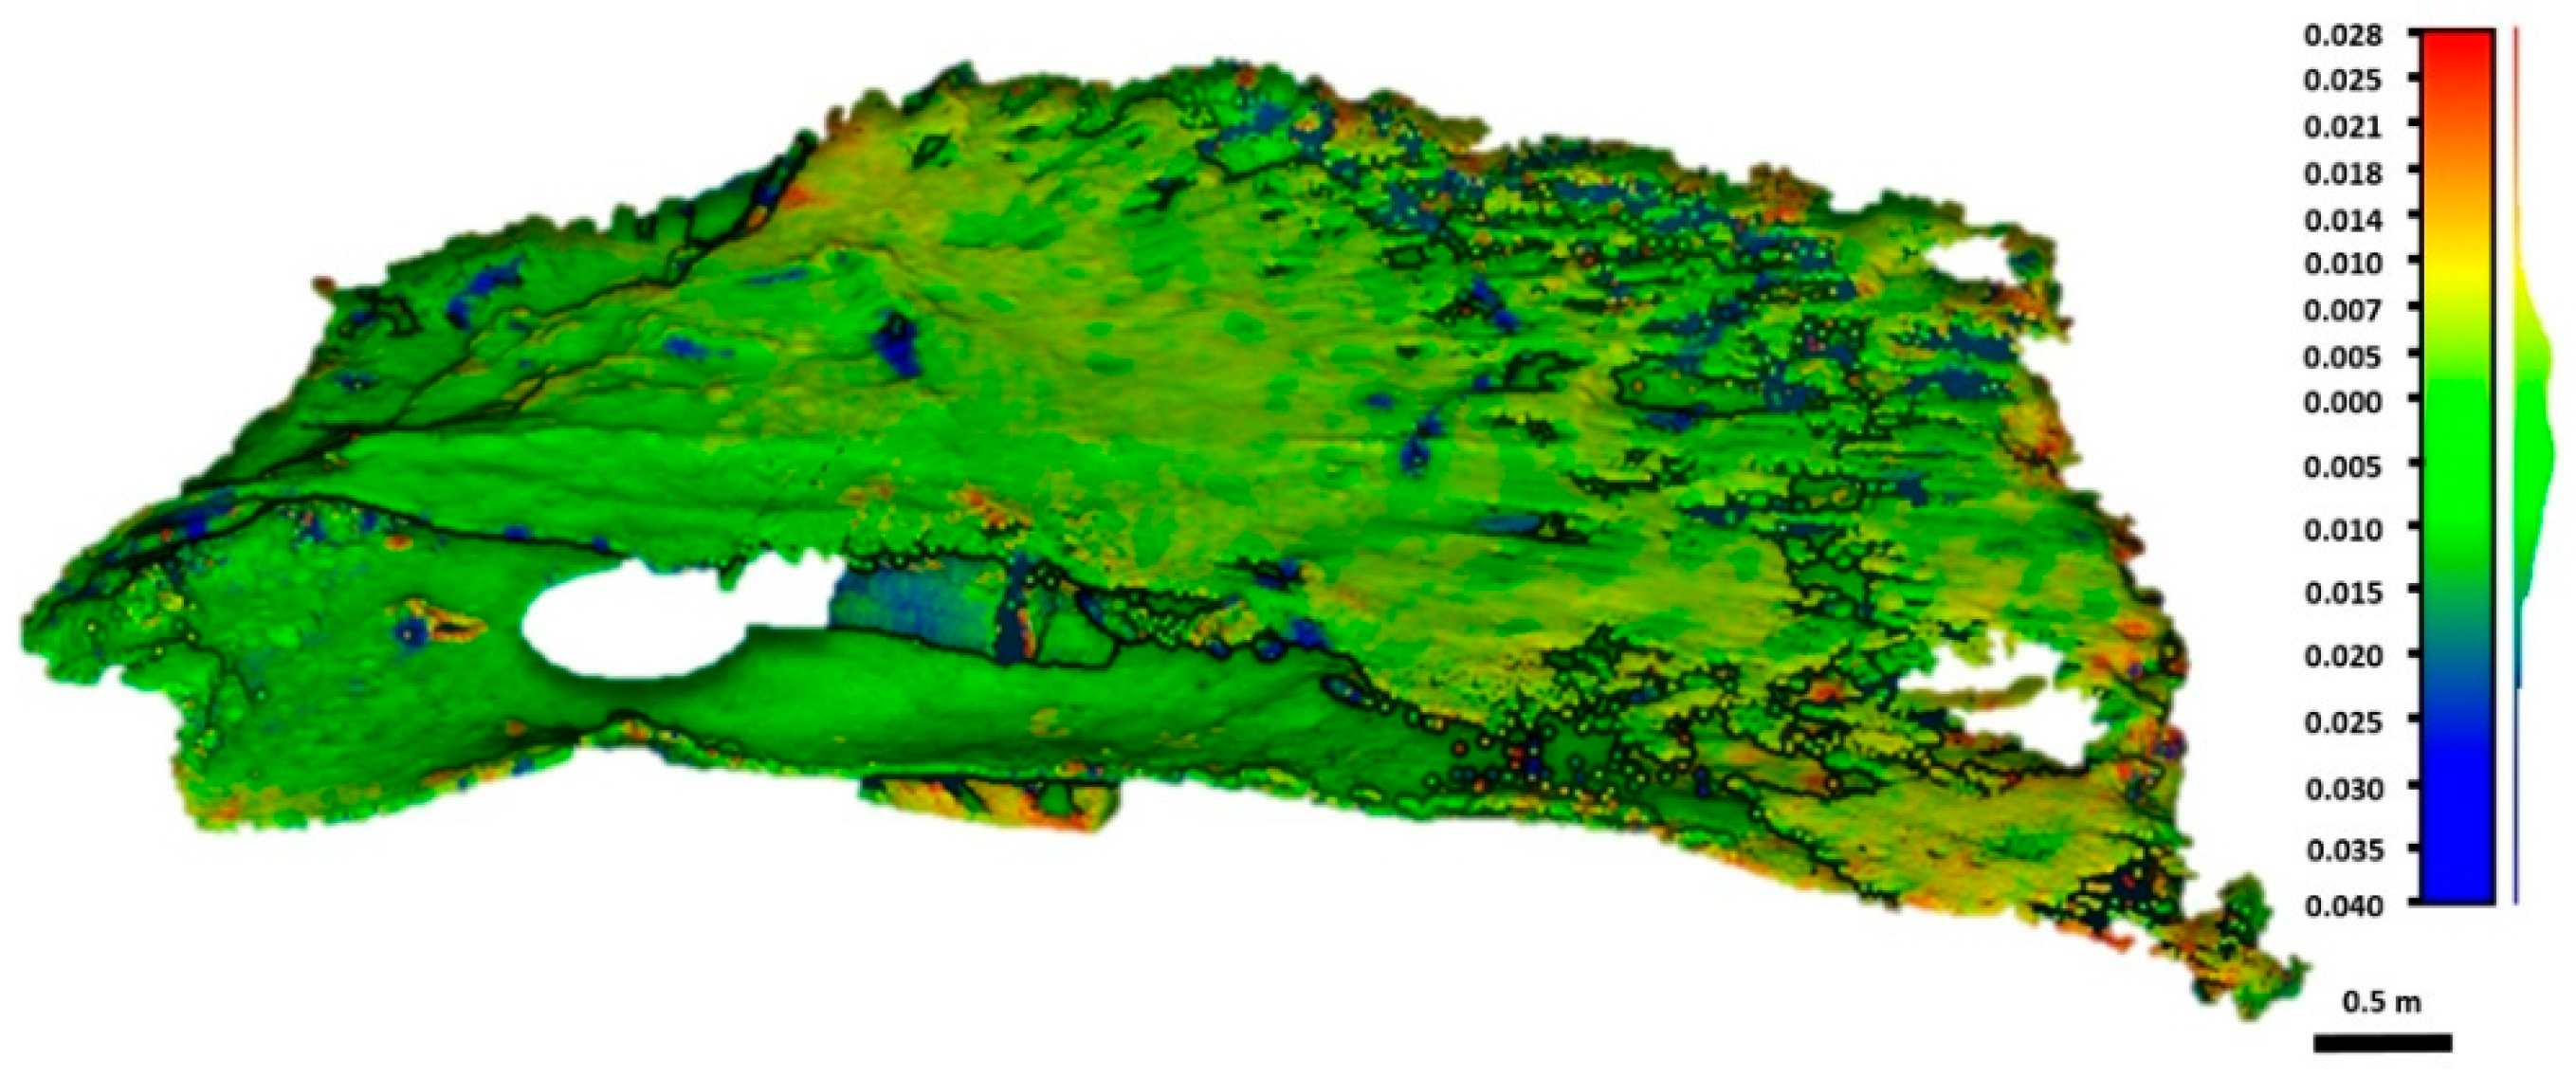
3.1.2. Digitalization at Local Scale (Detailed Model)
3.2. Inner Characterization of the Rock Shelter through Geophysical Methods
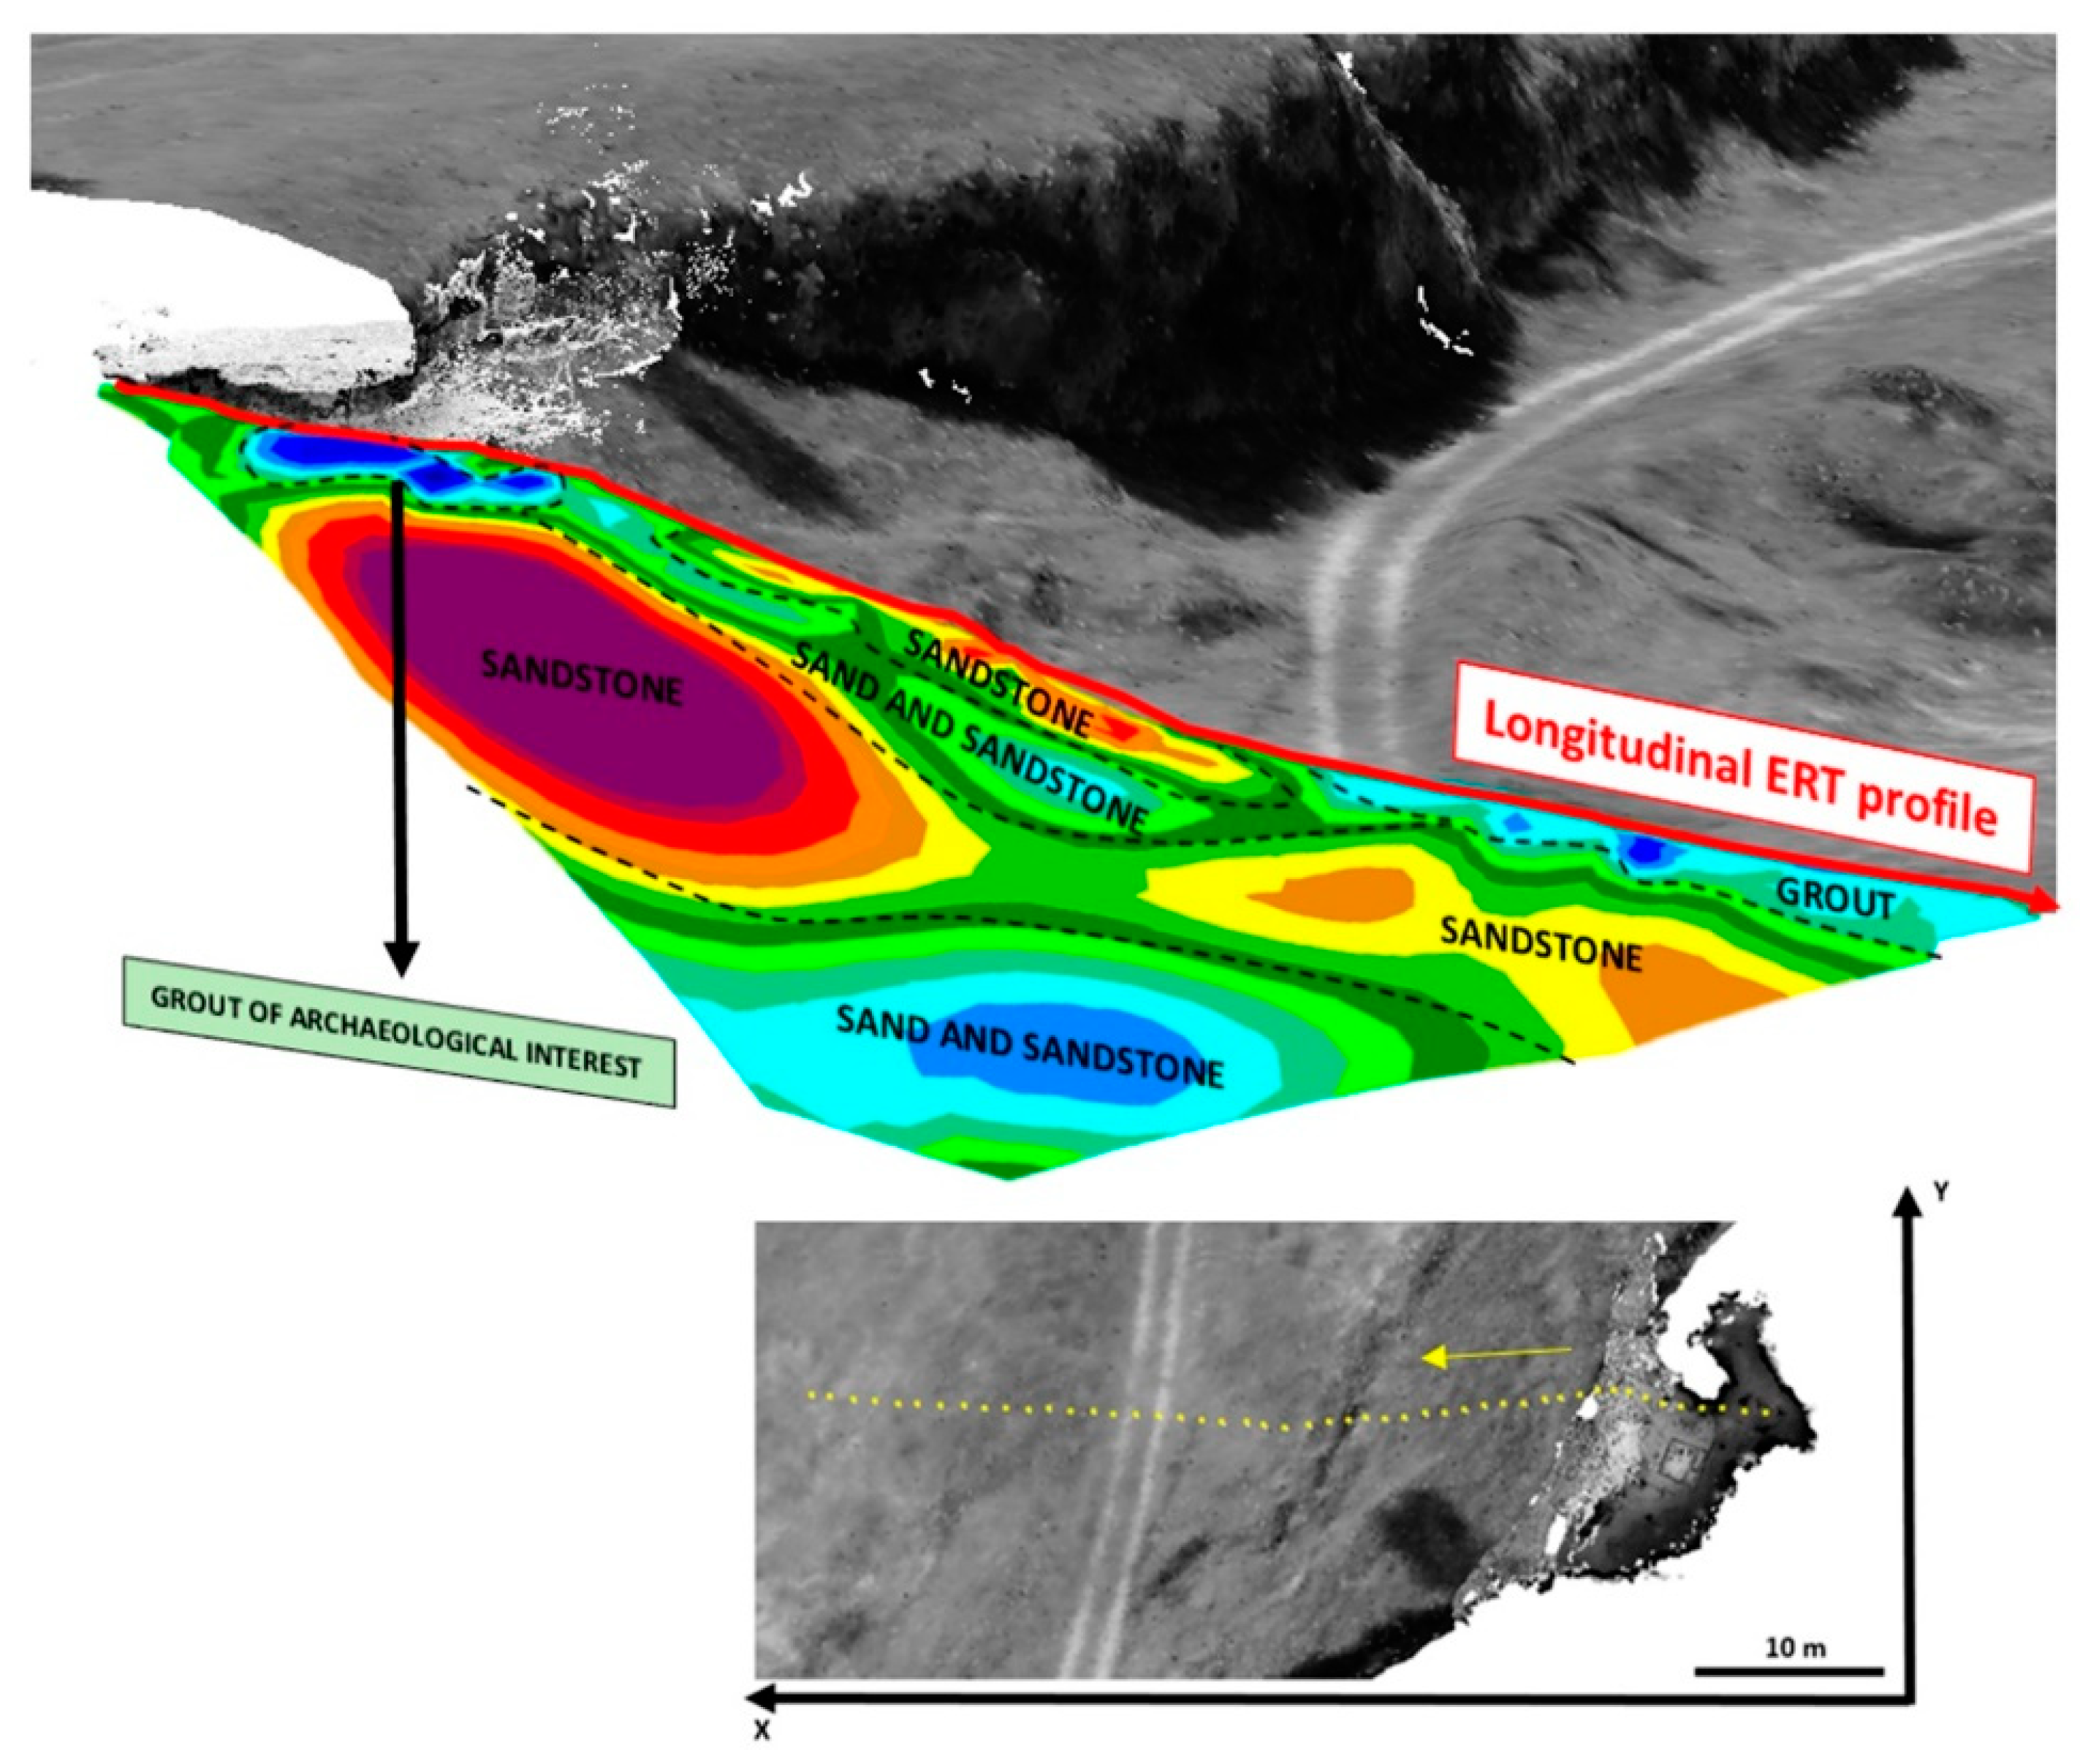
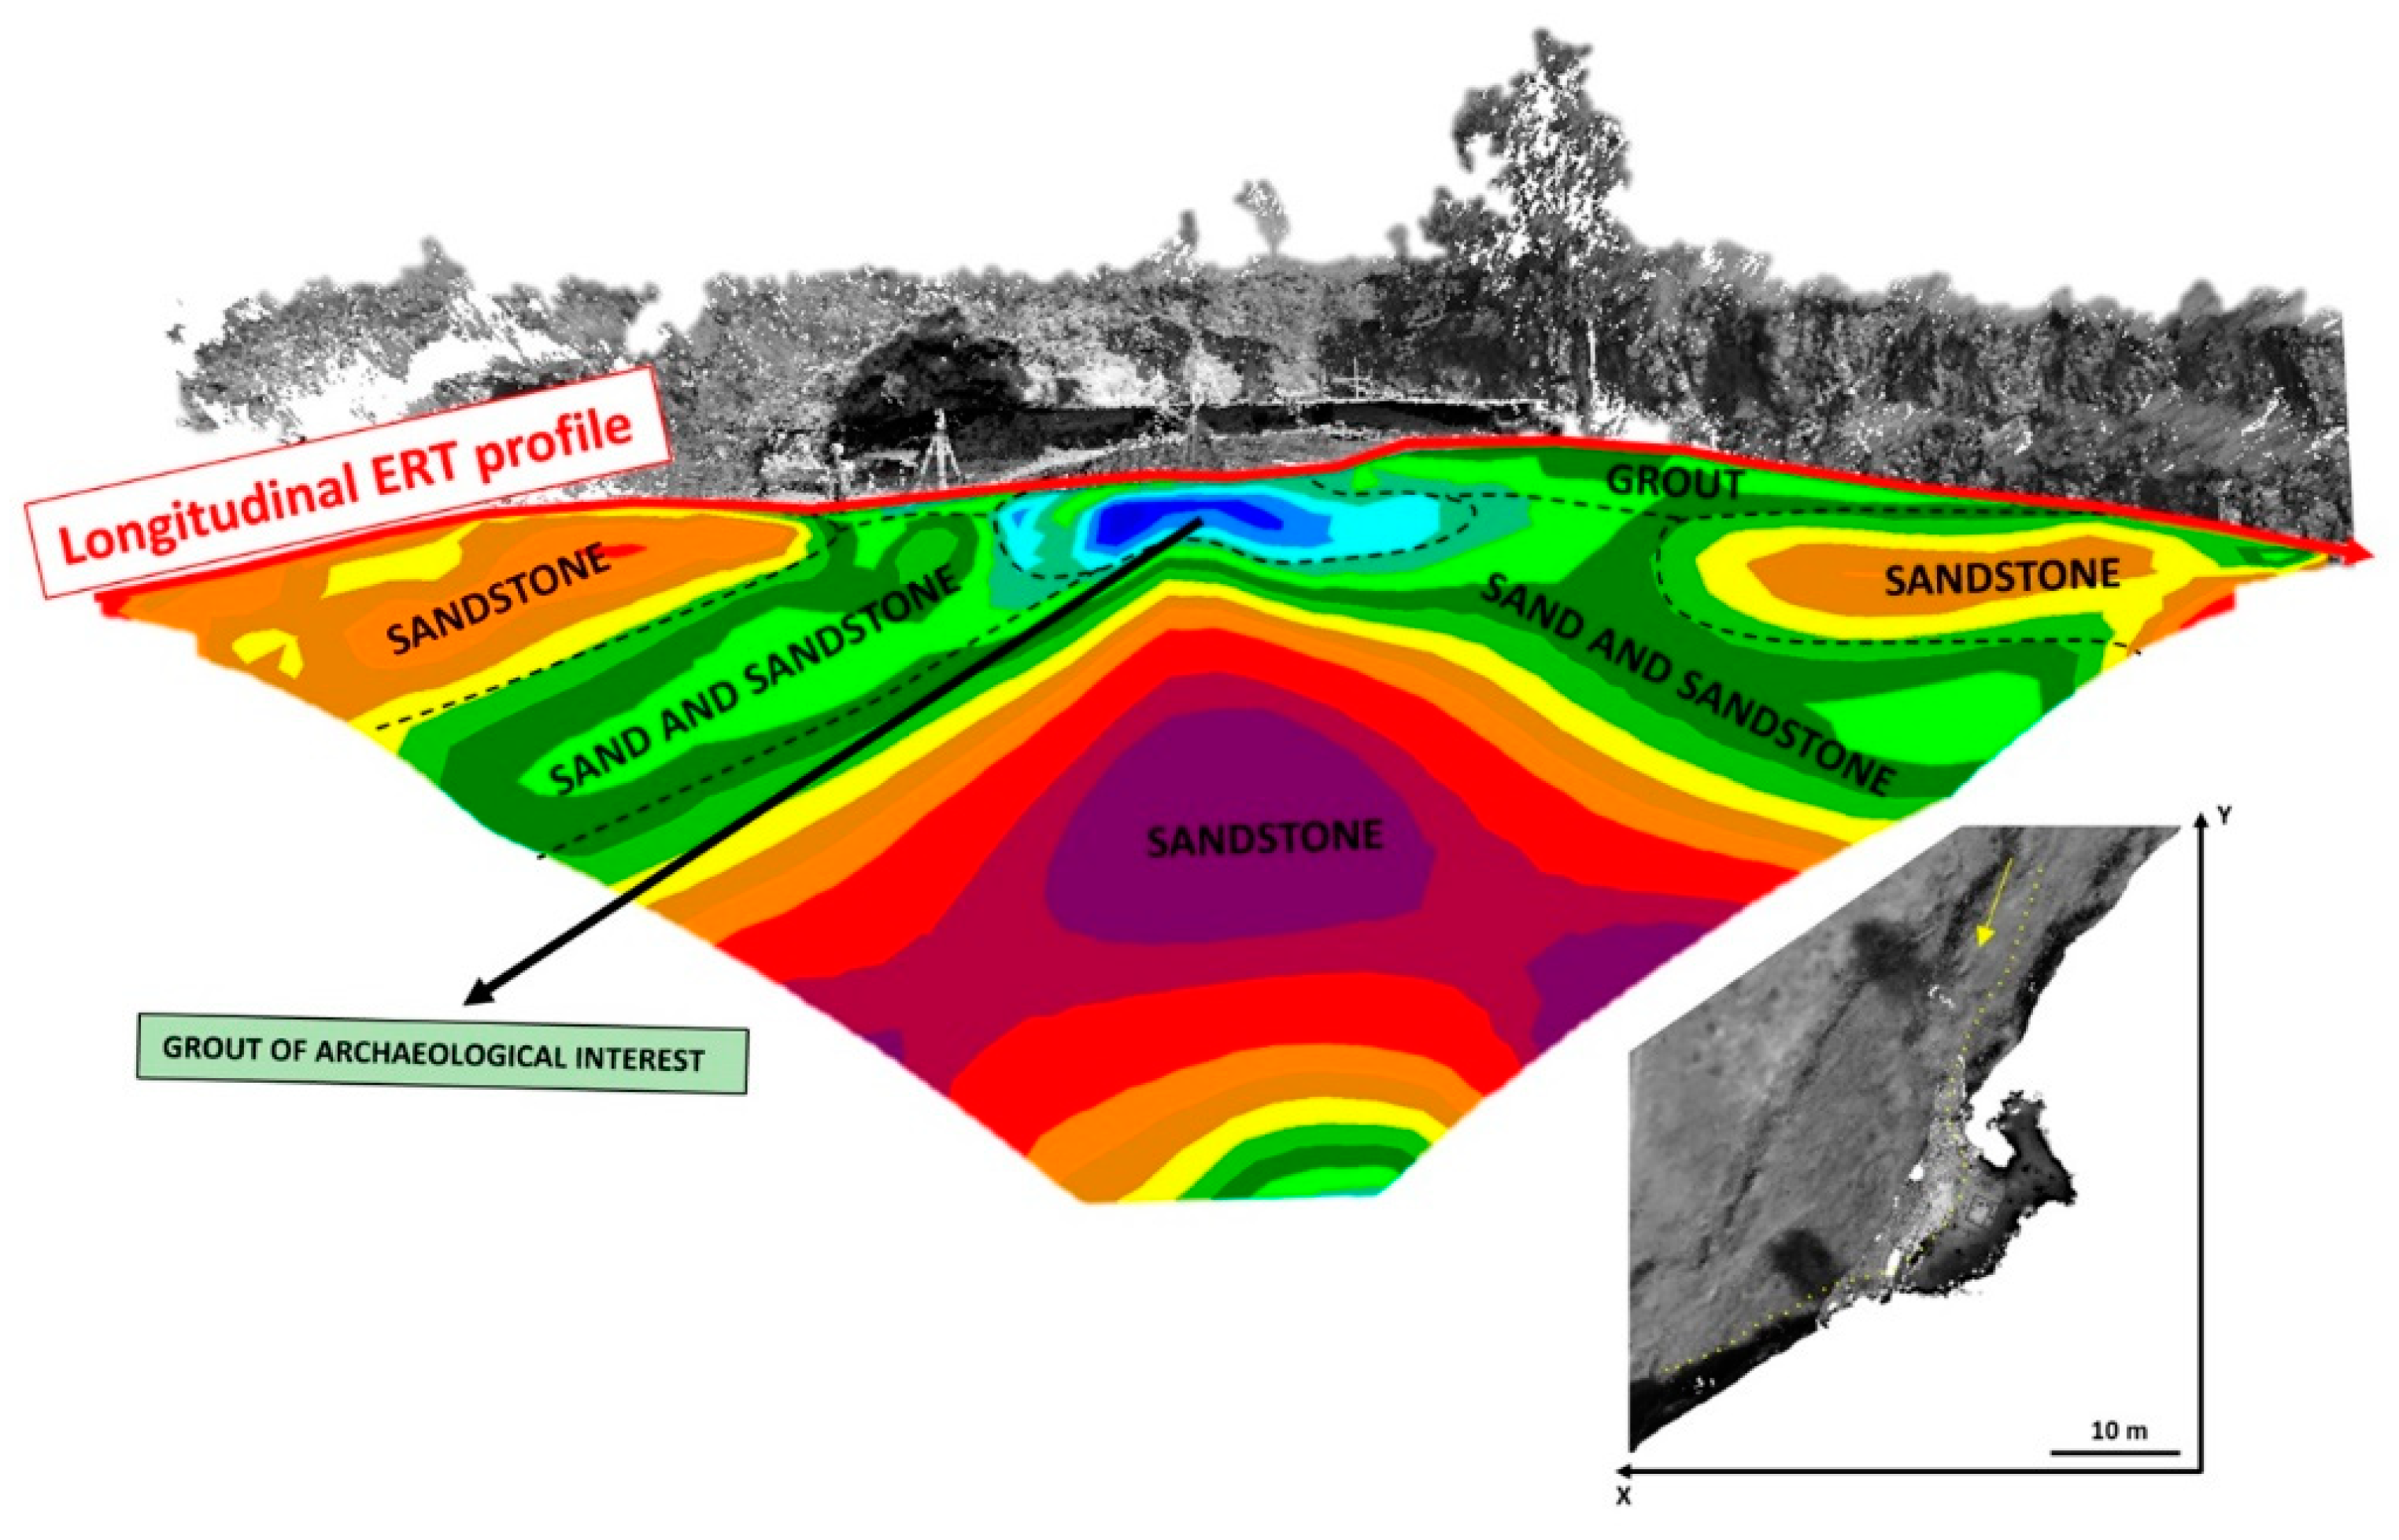
3.2.1. Electrical Resistivity Tomography
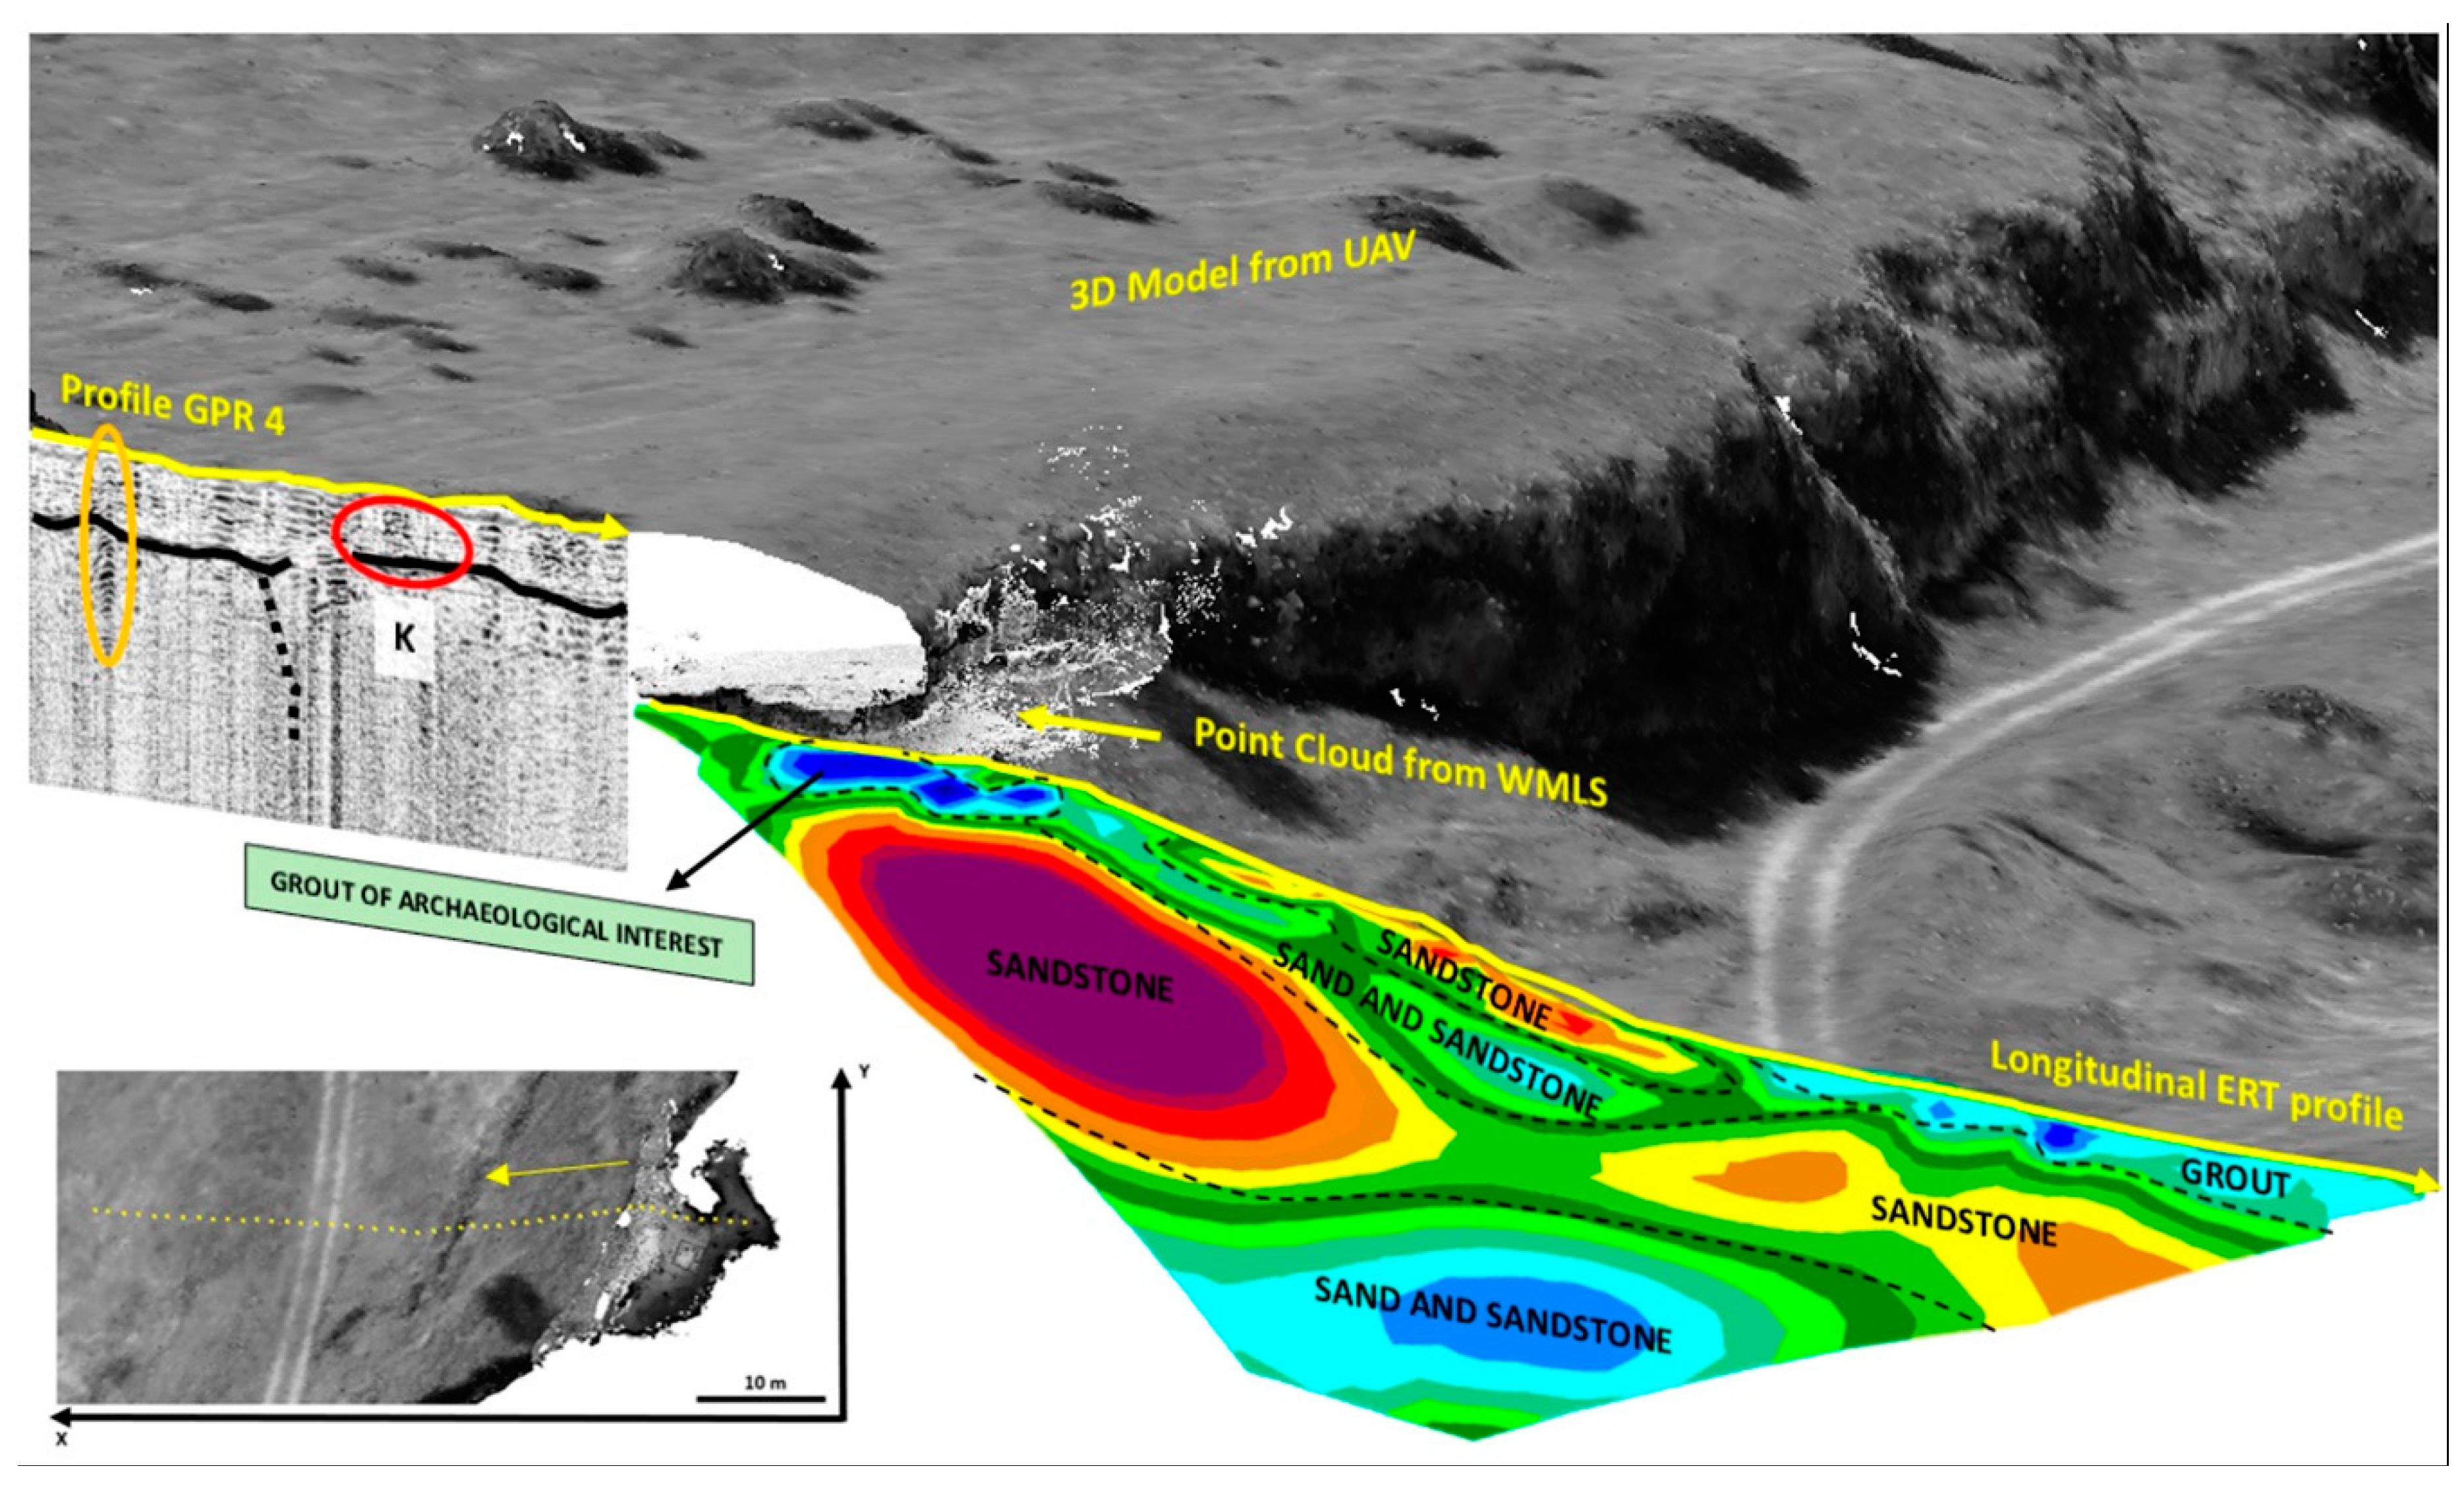
- Profiles show a similar structural style allowing defining the position of the materials of interest (conductive fillers). Profile-2 cuts profile-1 in an orthogonal way, clearly defining the morphology of the area occupied by filling conductive materials.
- In these profiles, the presence of fillers above ground is clearly visible. In more detail, an alternation of sandstones-sands-sandstones is found. It can be differentiated by their resistivity contrast, being higher in the sandstones than in the sandy stratum.
- Conductive materials consisting of fillings with possible archaeological interest can be perfectly characterized by their low resistivity value. They are presented only in the central part of profile-1 (Figure 11) and at the beginning of profile-2 (Figure 12). The thickness of the conductive fillers of interest is not constant and is around 2–3 m deep.
3.2.2. Ground Penetrating Radar
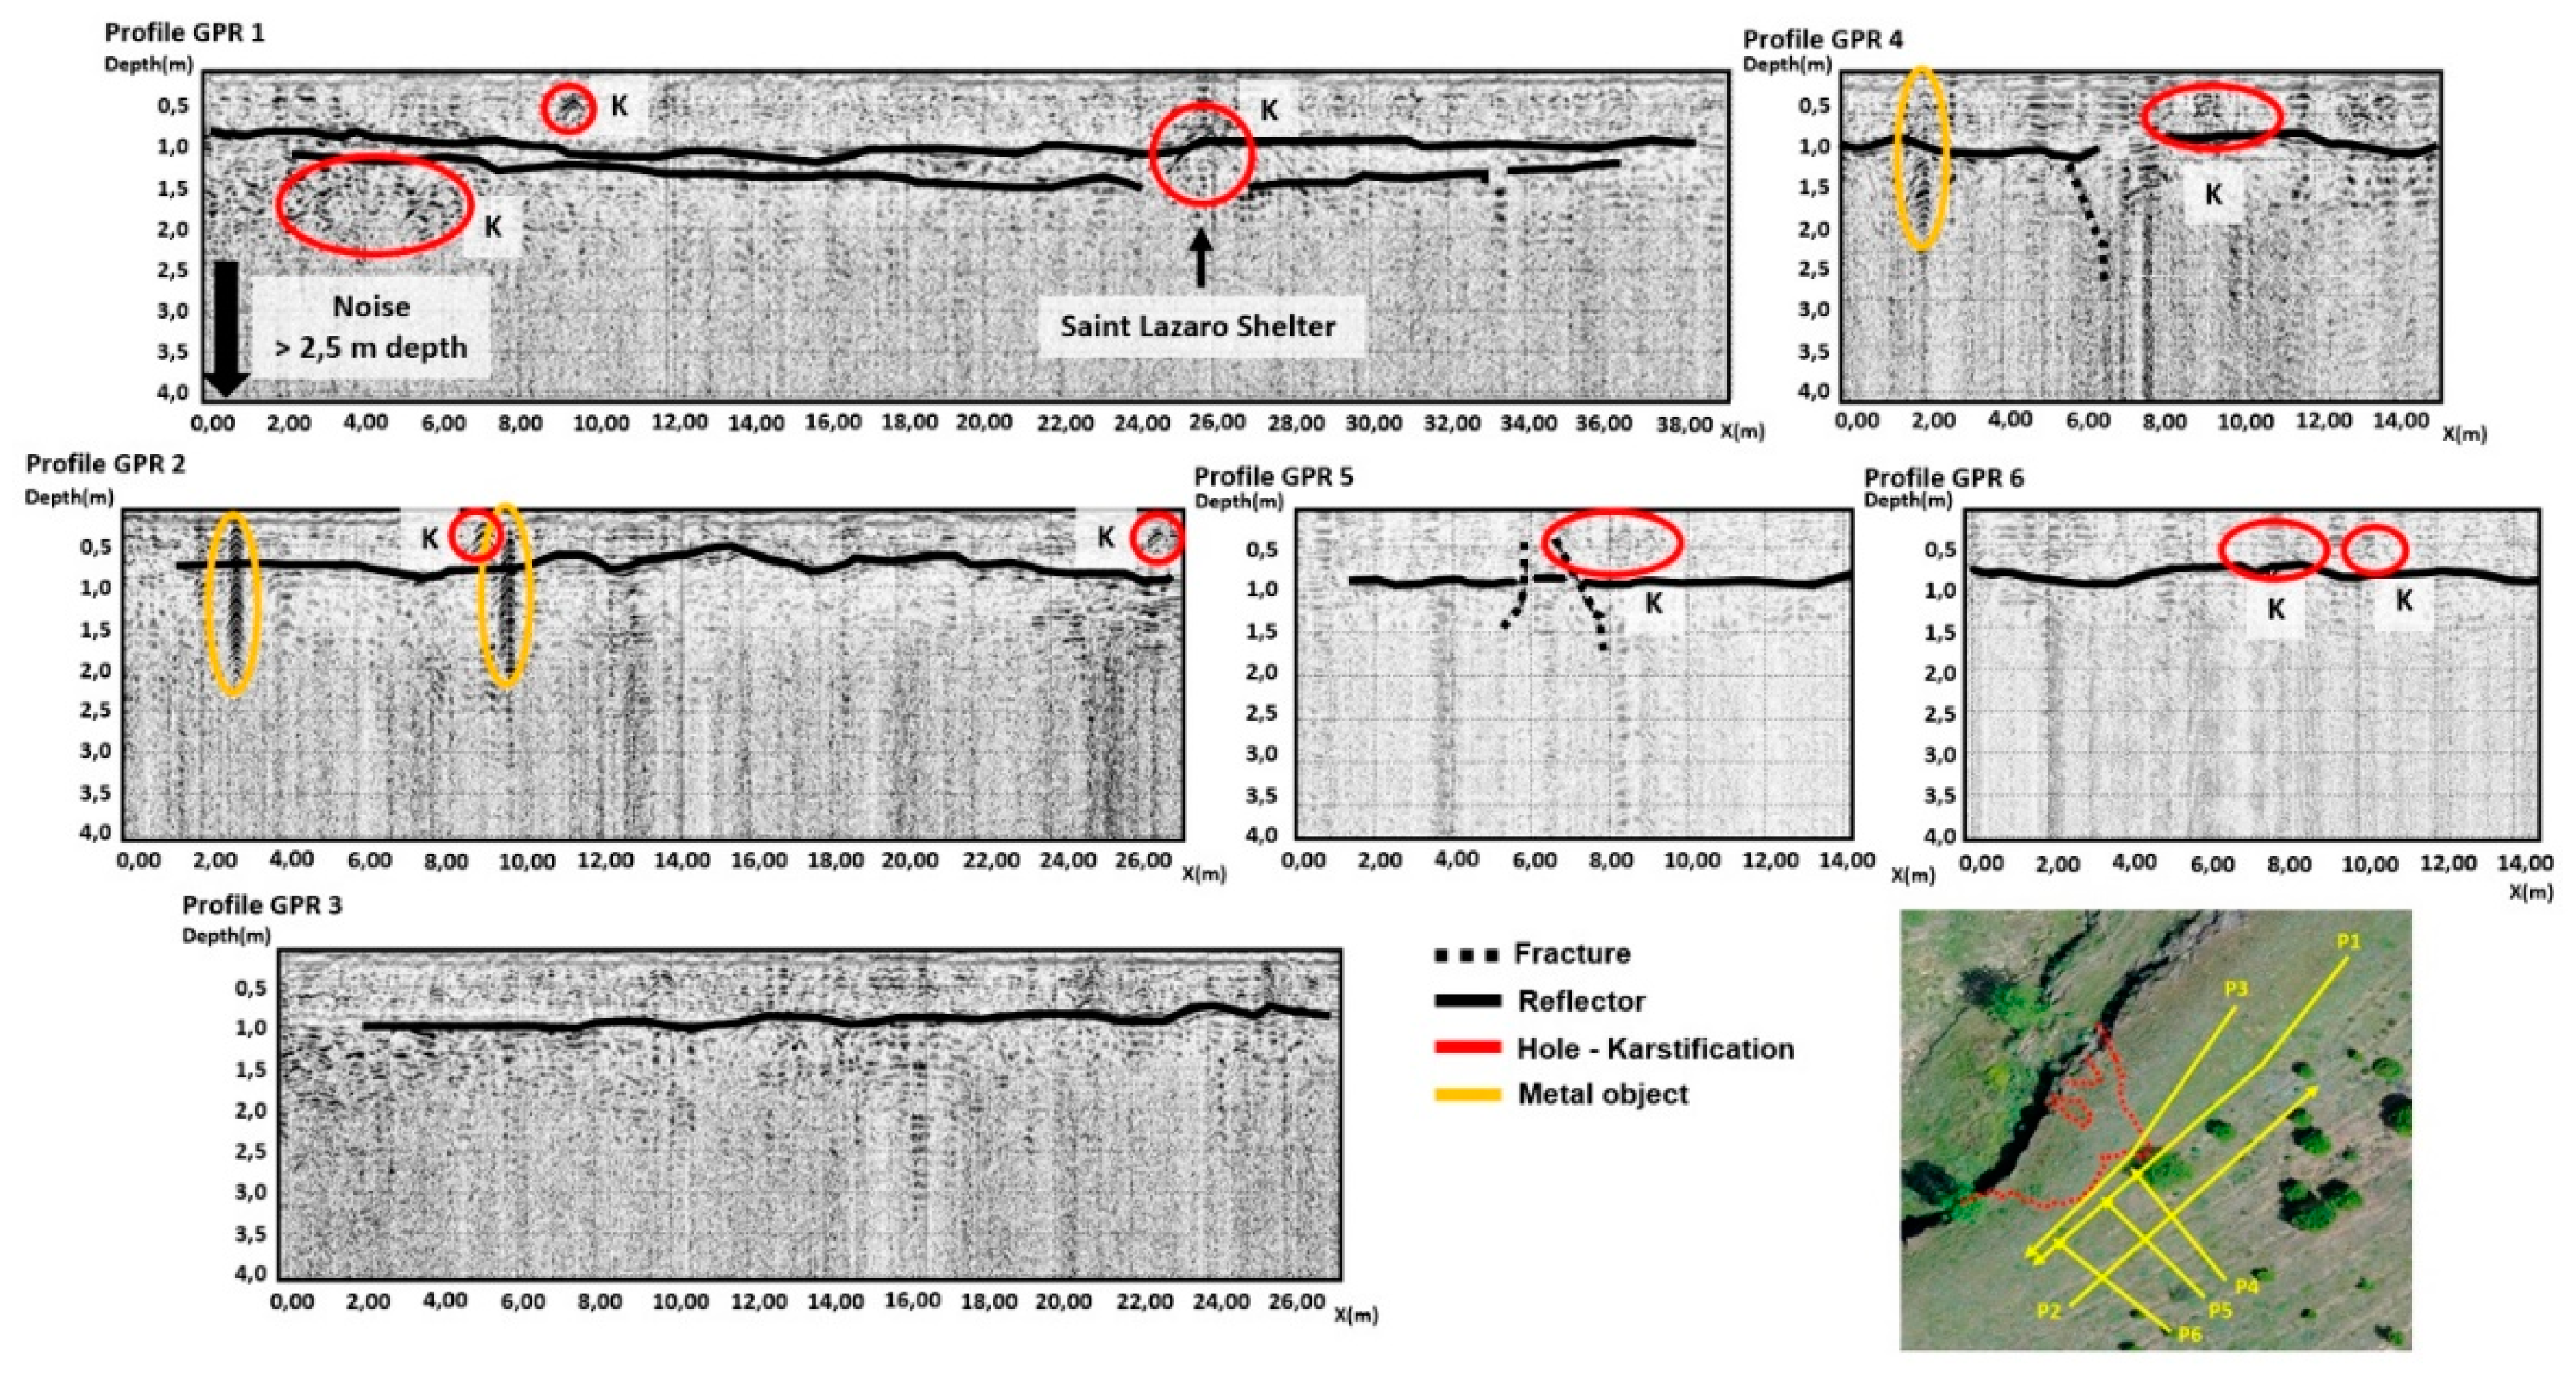
- P 1: this profile shows two clear reflectors that can correspond to the stratification level, the first of them is the contact between a more altered ground and a more compact rock mass underlying. These two reflectors (lines) are at a depth of 1 to 1.5 m. Abnormalities of amplitude in the signal that can represent small karstic cavities of 10 to 20 cm are detected. The ceiling of the cave could be placed in the last part of the profile at a depth of 1 m.
- P 2: the profile shows a very marked line that probably indicates the transition between a more altered ground and healthy rock at about 0.80 m depth. Some karstic areas and buried metallic objects are detected (without necessarily having relevance). These features showed the typical multi-reflector signal with high amplitude rebounds. In the middle of the profile, the cave is crossed, special anomalies are not identified on it, perhaps the ceiling of the cave coincides with the stratification and the reflector is not marked.
- P 3: a line between 1.0 and 0.8 m deep is recognized, indicating the transition between the ground and the rock.
- P 4: as in all profiles, a reflector is detected indicating the horizon between the ground and the rock or upper more altered zone. A fracture or failure seems to be detected 5 m away from the beginning point.
- P 5: In the middle of the profile, a low signal area is identified, surrounded by very markedly inclined reflectors that could indicate a karstic chimney.
- P 6: A karstic area with an anomalous zone in the ceiling is detected. It could be a karst filling area.
4. Discussion
- Static laser scanning: this method is able to digitalize narrow spaces on which it is not possible to place a static laser scanner, requiring also a small number of stations as stated di-Fillipo et al. [17]. Additionally, this method is able to general a 3D product, in form of a point cloud, around 10 times faster than the static laser scanner, being also in line with what the studied previously showed. Regarding the resolution, this method is able to provide a dense point cloud to perform dimensional analysis on a product whose expected accuracy is near 1 cm. This value could be considered enough for archaeological purposes.
- Image-based modelling method: the geometrical characteristics of the shelter, with narrow spaces, hindering the use of standard SfM protocols. In this situation the only feasible solution was the use of the approaches proposed by Perfetti et al. [70,71], on which a 3D reconstruction is carried out by means of the combination of a SfM approach with a fish-eye lens. In this situation, the proposed approach would have a better performance due to the nature of the system (active sensor) not requiring artificial illumination. Regarding the data acquisition, the proposed approach only requires following a simple protocol, which could be considered simpler than the SfM one. With respect to the data processing, the SfM requires external measurements, by means of a topographic equipment or metric tapes, to scale the model. This issue is not necessary in the case of using the WMLS.
5. Conclusions
Author Contributions
Funding
Acknowledgments
Conflicts of Interest
References
- Escarcena, J.C.; de Castro, E.M.; García, J.L.P.; Calvache, A.M.; del Castillo, T.F.; García, J.D.; Cámara, M.U.; Castillo, J.C. Integration of photogrammetric and terrestrial laser scanning techniques for heritage documentation. Virtual Archaeol. Rev. 2011, 2, 53–57. [Google Scholar] [CrossRef]
- El-Hakim, S.F.; Beraldin, J.A.; Picard, M.; Godin, G. Detailed 3D reconstruction of large-scale heritage sites with integrated techniques. IEEE Comput. Graph. Appl. 2004, 24, 21–29. [Google Scholar] [CrossRef] [PubMed]
- García, J.L.P.; Calvache, A.T.M.; Escarcena, F.J.C.; Arenas, A.L. Fotogrametría de bajo coste para la modelización de edificios históricos. Virtual Archaeol. Rev. 2011, 2, 121–125. [Google Scholar] [CrossRef]
- García-Morales, R.M.; Cortina, M.L.; Pintado, J.A.; Novella, L.R. Princeps Resurgens: Archaeological research and photogrammetric documentation in the study of a Roman thoracata statue of Los Bañales (Uncastillo, Zaragoza). Virtual Archaeol. Rev. 2015, 6, 65–71. [Google Scholar] [CrossRef][Green Version]
- Sabina, J.Á.R.; Valle, D.G.; Ruiz, C.P.; García, J.M.M.; Laguna, A.G. Aerial Photogrammetry by drone in archaeological sites with large structures. Methodological approach and practical application in the medieval castles of Campo de Montiel. Virtual Archaeol. Rev. 2015, 6, 5–19. [Google Scholar] [CrossRef]
- Cano, P.; Lamolda, F.; Torres, J.C.; del Mar Villafranca, M. Uso de escáner láser 3D para el registro del estado previo a la intervención de la Fuente de los Leones de La Alhambra. Virtual Archaeol. Rev. 2010, 1, 89–94. [Google Scholar] [CrossRef]
- Cobo, E.P.; Vaz, P.M.; Labrado, E.O.; Zamora, Á.I.; Granero, A.B.M. Proyecto de musealización de los restos hallados en la estación de Ópera (Metro de Madrid). Reconstrucciones infográficas, escaneo laser 3D y digitalización del patrimonio arqueológico. Virtual Archaeol. Rev. 2012, 3, 88–92. [Google Scholar] [CrossRef][Green Version]
- Fernández, F.L. Rescate documental de petroglifos y reconstrucción 3d del corredor Dolménico de Cubillejo de Lara, Burgos. Virtual Archaeol. Rev. 2016, 7, 43–52. [Google Scholar] [CrossRef]
- Koutsoudis, A.; Vidmar, B.; Ioannakis, G.; Arnaoutoglou, F.; Pavlidis, G.; Chamzas, C. Multi-image 3D reconstruction data evaluation. J. Cult. Herit. 2014, 15, 73–79. [Google Scholar] [CrossRef]
- Dhonju, H.; Xiao, W.; Sarhosis, V.; Mills, J.P.; Wilkinson, S.; Wang, Z.; Thapa, L.; Panday, U.S. Feasibility Study of Low-Cost Image-Based Heritage Documentation in Nepal. In International Archives of the Photogrammetry; Remote Sensing and Spatial Information Sciences: Göttingen, Germany, 2017; pp. 237–242. [Google Scholar]
- Blais, F.; Rioux, M.; Beraldin, J.A. Practical considerations for a design of a high precision 3D laser scanner system. In Optomechanical and Electro-Optical Design of Industrial Systems; International Society for Optics and Photonics: Bellingham, DC, USA, 1988; pp. 225–246. [Google Scholar]
- Cowley, D.C.; Moriarty, C.; Geddes, G.; Brown, G.L.; Wade, T.; Nichol, C.J. UAVs in Context: Archaeological Airborne Recording in a National Body of Survey and Record. Drones 2018, 2, 2. [Google Scholar] [CrossRef]
- O’Driscoll, J. Landscape applications of photogrammetry using unmanned aerial vehicles. J. Archaeol. Sci. Rep. 2018, 22, 32–44. [Google Scholar] [CrossRef]
- Campos, M.B.; Tommaselli, A.M.G.; Honkavaara, E.; Prol, F.D.S.; Kaartinen, H.; El Issaoui, A.; Hakala, T. A Backpack-Mounted Omnidirectional Camera with Off-the-Shelf Navigation Sensors for Mobile Terrestrial Mapping: Development and Forest Application. Sensors 2018, 18, 827. [Google Scholar] [CrossRef]
- Lagüela, S.; Dorado, I.; Gesto, M.; Arias, P.; González-Aguilera, D.; Lorenzo, H. Behavior Analysis of Novel Wearable Indoor Mapping System Based on 3D-SLAM. Sensors 2018, 18, 766. [Google Scholar] [CrossRef]
- Masiero, A.; Fissore, F.; Guarnieri, A.; Pirotti, F.; Visintini, D.; Vettore, A. Performance Eval-uation of Two Indoor Mapping Systems: Low-Cost UWB-Aided Photogrammetry and Backpack Laser Scanning. Appl. Sci. 2018, 8, 416. [Google Scholar] [CrossRef]
- Di Filippo, A.; Sánchez-Aparicio, L.; Barba, S.; Martín-Jiménez, J.; Mora, R.; González-Aguilera, D. Use of a Wearable Mobile Laser System in Seamless Indoor 3D Mapping of a Complex Historical Site. Remote Sens. 2018, 10, 1897. [Google Scholar] [CrossRef]
- Cabo, C.; Del Pozo, S.; Rodríguez-Gonzálvez, P.; Ordóñez, C.; González-Aguilera, D. Comparing Terrestrial Laser Scanning (TLS) and Wearable Laser Scanning (WLS) for Individual Tree Modeling at Plot Level. Remote Sens. 2018, 10, 540. [Google Scholar] [CrossRef]
- Nocerino, E.; Menna, F.; Remondino, F.; Toschi, I.; Rodríguez-Gonzálvez, P. Investigation of indoor and outdoor performance of two portable mobile mapping systems. In Videometrics, Range Imaging, and Applications XIV; International Society for Optics and Photonics: Bellingham, DC, USA, 2017; p. 1033201. [Google Scholar]
- González-Aguilera, D.; Muñoz-Nieto, A.; Gómez-Lahoz, J.; Herrero-Pascual, J.; Gutierrez-Alonso, G. 3D digital surveying and modelling of cave geometry: Application to paleolithic rock art. Sensors 2009, 9, 1108–1127. [Google Scholar] [CrossRef]
- González-Aguilera, D.; Muñoz, A.L.; Lahoz, J.G.; Herrero, J.S.; Corchón, M.S.; García, E. Recording and modeling Paleolithic caves through laser scanning. In Proceedings of the 2009 International Conference on Advanced Geographic Information Systems & Web Services, Cancun, Mexico, 1–7 February 2009; pp. 19–26. [Google Scholar]
- Torres-Martínez, J.A.; Seddaiu, M.; Rodríguez-Gonzálvez, P.; Hernández-López, D.; González-Aguilera, D. A multi-data source and multi-sensor approach for the 3D reconstruction and web visualization of a complex archaelogical site: The case study of “Tolmo De Minateda”. Remote Sens. 2016, 8, 550. [Google Scholar] [CrossRef]
- Carrero-Pazos, M.; Vilas-Estévez, B.; Vázquez-Martínez, A. Digital imaging techniques for recording and analysing prehistoric rock art panels in Galicia (NW Iberia). Digit. Appl. Archaeol. Cult. Herit. 2018, 8, 35–45. [Google Scholar] [CrossRef]
- Jalandoni, A.; Domingo, I.; Taçon, P.S. Testing the value of low-cost structure-from-motion (SfM) photogrammetry for metric and visual analysis of rock art. J. Archaeol. Sci. Rep. 2018, 17, 605–616. [Google Scholar] [CrossRef]
- Naranjo, J.M.; Parrilla, Á.; de Sanjosé, J.J. Geometric characterization and interactive 3D visualization of historical and cultural heritage in the province of Cáceres (Spain). Virtual Archaeol. Rev. 2018, 9, 1–11. [Google Scholar] [CrossRef]
- Organista, E.; Domínguez-Rodrigo, M.; Yravedra, J.; Uribelarrea, D.; Arriaza, M.C.; Ortega, M.C.; Mabulla, A.; Gidna, A.; Baquedano, E. Biotic and abiotic processes affecting the formation of BK Level 4c (Bed II, Olduvai Gorge) and their bearing on hominin behavior at the site. Palaeogeogr. Palaeoclimatol. Palaeoecol. 2017, 488, 59–75. [Google Scholar] [CrossRef]
- Siebke, I.; Campana, L.; Ramstein, M.; Furtwängler, A.; Hafner, A.; Lösch, S. The application of different 3D-scan-systems and photogrammetry at an excavation—A Neolithic dolmen from Switzerland. Digit. Appl. Archaeol. Cult. Herit. 2018, 10, e00078. [Google Scholar] [CrossRef]
- Del Pozo, S.; Sánchez-Aparicio, L.; Rodríguez-Gonzálvez, P.; Herrero-Pascual, J.; Muñoz-Nieto, A.; González-Aguilera, D.; Hernández-López, D. Multispectral Imaging: Fundamentals, Principles and Methods of Damage Assessment in Constructions. In Non-Destructive Techniques for the Evaluation of Structures and Infrastructure; CRC Press: Boca Raton, FL, USA, 2016; p. 139. [Google Scholar]
- Sánchez-Aparicio, L.J.; Del Pozo, S.; Ramos, L.F.; Arce, A.; Fernandes, F.M. Heritage site preservation with combined radiometric and geometric analysis of TLS data. Autom. Constr. 2018, 85, 24–39. [Google Scholar] [CrossRef]
- Bautista-De Castro, Á.; Sánchez-Aparicio, L.J.; Ramos, L.F.; Sena-Cruz, J.; González-Aguilera, D. Integrating geomatic approaches, Operational Modal Analysis, advanced numerical and updating methods to evaluate the current safety conditions of the historical Bôco Bridge. Constr. Build. Mater. 2018, 158, 961–984. [Google Scholar] [CrossRef]
- Sánchez-Aparicio, L.J.; Bautista-De Castro, Á.; Conde, B.; Carrasco, P.; Ramos, L.F. Non-destructive means and methods for structural diagnosis of masonry arch bridges. Autom. Constr. 2019, 104, 360–382. [Google Scholar] [CrossRef]
- Yravedra, J.; Diez-Martin, F.; Egeland, C.P.; Maté-González, M.Á.; Palomeque-González, J.F.; Arriaza, M.C.; Aramendi, J.; García Vargas, E.; Estaca-Gómez, V.; Sanchez, P.; et al. FLK West (Lower Bed II, Olduvai Gorge, Tanzania): A new early Acheulean site with evidence for human exploitation of fauna. Boreas 2017, 46, 816–830. [Google Scholar] [CrossRef]
- Yravedra, J.; Maté-González, M.Á.; Palomeque-González, J.F.; Aramendi, J.; Estaca-Gómez, V.; San Juan Blazquez, M.; García Vargas, E.; Organista, E.; González-Aguilera, D.; Arriaza, M.C.; et al. A new approach to raw material use in the exploitation of animal carcasses at BK (Upper Bed II, Olduvai Gorge, Tanzania): A micro-photogrammetric and geometric morphometric analysis of fossil cut marks. Boreas 2017, 46, 860–873. [Google Scholar] [CrossRef]
- Hermon, S.; Polig, M.; Driessen, J.; Jans, G.; Bretschneider, J. An integrated 3D shape analysis and scientific visualization approach to the study of a Late Bronze Age unique stone object from Pyla-Kokkinokremos, Cyprus. Digit. Appl. Archaeol. Cult. Herit. 2018, 10, e00075. [Google Scholar] [CrossRef]
- Esteve, J.; Zhao, Y.L.; Maté-González, M.Á.; Gómez-Heras, M.; Peng, J. A new high-resolution 3-D quantitative method for analysing small morphological features: An example using a Cambrian trilobite. Sci. Rep. 2018, 8, 2868. [Google Scholar] [CrossRef]
- Aramendi, J.; Arriaza, M.C.; Yravedra, J.; Maté-González, M.Á.; Ortega, M.C.; Courtenay, L.A.; González-Aguilera, D.; Gidna, A.; Mabulla, A.; Baquedano, E.; et al. Who ate OH80 (Olduvai Gorge, Tanzania)? A geometric-morphometric analysis of surface bone modifications of a Paranthropus boisei skeleton. Quat. Int. 2019, 517, 118–130. [Google Scholar] [CrossRef]
- López-Cisneros, P.; Linares-Matás, G.; Yravedra, J.; Maté-González, M.Á.; Estaca-Gómez, V.; Mora, R.; Aramendi, J.; Rodríguez Asensio, J.A.; Barrera-Logares, J.M.; González-Aguilera, D. Applying new technologies to the taphonomic study of La Lluera (Asturias, Spain). Geometric morphometrics and the study of bone surface modifications (BSM). Quat. Int. 2019, 517, 107–117. [Google Scholar] [CrossRef]
- Yravedra, J.; Maté-González, M.Á.; Courtenay, L.A.; López-Cisneros, P.; Estaca-Gómez, V.; Aramendi, J.; de Andrés-Herrero, M.; Linares-Matas, G.; González-Aguilera, D.; Álvarez-Alonso, D. Approaching raw material functionality in the Upper Magdalenian of Coímbre cave (Asturias, Spain) through geometric morphometrics. Quat. Int. 2019, 517, 97–106. [Google Scholar] [CrossRef]
- García-Morales, R.M.; Cortina, M.L. Paleocatálogo 3D: Photogrammetry for the realization of a high quality, accessible and free 3D Virtual Catalog. Virtual Archaeol. Rev. 2015, 6, 35–40. [Google Scholar] [CrossRef][Green Version]
- Pierdicca, R.; Malinverni, E.S.; Frontoni, E.; Colosi, F.; Orazi, R. 3D visualization tools to explore ancient architectures in South America. Virtual Archaeol. Rev. 2016, 7, 44–53. [Google Scholar] [CrossRef]
- El-Qady, G.; Metwaly, M.; Drahor, M.G. Geophysical Techniques Applied in Archaeology. In Archaeogeophysics; Springer: Cham, Switzerland, 2019; pp. 1–25. [Google Scholar]
- Teixidó, M.T.; Peña, J.A. The Utility of Geophysical Models in Archaeology: Illustrative Case Studies. In Archaeogeophysics; Springer: Cham, Switzerland, 2019; pp. 169–181. [Google Scholar]
- Conyers, L.B.; Goodman, D. Ground-Penetrating Radar: An Introduction for Archaeologist; AltaMira Press: Lanham, MD, USA, 1997; pp. 149–194. [Google Scholar]
- Conyers, L.B. Analysis and interpretation of GPR datasets for integrated archaeological mapping. Near Surf. Geophys. 2015, 13, 645–651. [Google Scholar] [CrossRef]
- Martín Nieto, I.; Farfan Martín, A.; Sáez Blázquez, C.; González-Aguilera, D.; Carrasco, P.; Vasco, E.F.; García, J.C. Use of 3D electrical resistivity tomography to improve the design of low enthalpy geothermal systems. Geothermics 2019, 79, 1–13. [Google Scholar] [CrossRef]
- Teixidó, T.; Peña, J.A.; Moya, L.; Alemán, B.; Claros, J. Archaeologic Superficial Prospection and GPR Exploration in the Roman Site of Ciavieja (Elejido, Spain); Internal Document, Ref. AGA/2014-104; Andalusian Institute of Geophysics (Granada University): Granada, Spain, 2014. [Google Scholar]
- Teixidó, T.; Peña, J.A.; Ruso, J.A.; Alcalá, S. Assessment of Experimental Device and the GPR Resolution Suitable to Characterize the Cork Oak Root System. Case of Study la Alcaidesa Natural Park, Cádiz (SPAIN); Internal Document, Ref. AGA-ID/2013-19; Andalusian Institute of Geophysics (Granada University): Granada, Spain, 2013. [Google Scholar]
- Papadimitrios, K.S.; Bank, C.G.; Walker, S.J.; Chazan, M. Palaeotopography of a Palaeolithic landscape at Bestwood 1, South Africa, from ground-penetrating radar and magnetometry. S. Afr. J. Sci. 2019, 115, 1–7. [Google Scholar] [CrossRef]
- Papadopoulos, N.G.; Tsourlos, P.; Tsokas, G.N.; Sarris, A. Efficient ERT measuring and inversion strategies for 3D imaging of buried antiquities. Near Surf. Geophys. 2007, 5, 349–361. [Google Scholar] [CrossRef]
- Fernández, G.; Teixidó, T.; Peña, J.A.; Burillo, F.; Claros, J. Using shallow geophysical methods to characterise the monumental building at the Segeda I site (Spain). J. Archaeol. Sci. Rep. 2015, 2, 427–436. [Google Scholar] [CrossRef]
- Berge, M.A.; Drahor, M.G. Electrical resistivity tomography investigations of multi-layered archaeological settlements: Part I—Modelling. Archaeol. Prospect. 2011, 18, 159–171. [Google Scholar]
- Martínez-Moreno, F.J.; Galindo-Zaldívar, J.; Pedrera, A.; Teixido, T.; Ruano, P.; Peña, J.A.; González-Castillo, L.; Ruiz-Constán, A.; López-Chicano, M.; Martín-Rosales, W. Integrated geophysical methods for studying the karst system of Gruta de las Maravillas (Aracena, Southwest Spain). J. Appl. Geophys. 2014, 107, 149–162. [Google Scholar] [CrossRef]
- Álvarez-Alonso, D.; de Andrés Herrero, M.; Herrero, A.D.; Hernández, J.A.R. Análisis geoarqueológico de las ocupaciones musterienses en el valle alto del río Eresma: El Abrigo del Molino (Segovia, España). Bol. Geol. Min. 2018, 129, 153–182. [Google Scholar] [CrossRef]
- Álvarez-Alonso, D.; de Andrés-Herrero, M.; Díez-Herrero, A.; Rojo Hernández, J. El abrigo del Molino (Segovia, España). Ocupaciones neandertales en el norte del Sistema Central. In VIII Reunión de Cuaternario Ibérico. Sevilla-La Rinconada; El Cuaternario Ibérico. Investigación en el siglo XXI; AEQUA: Avila, Spain, 2013; pp. 91–94. [Google Scholar]
- Álvarez-Alonso, D.; de Andrés Herrero, M.; Herrero, A.D.; Hernández, J.A.R. El Abrigo del Molino (Segovia, España). Un nuevo yacimiento musteriense en el interior de la Península Ibérica. In Proceedings of the Investigaciones Arqueológicas en el valle del Duero, del Paleolítico a la Antigüedad Tardía: Actas de las III Hornadas de Jóvenes Investigadores del Valle del Duero, Salamanca, Spain, 20–22 November 2013. [Google Scholar]
- Álvarez-Alonso, D.; de Andrés Herrero, M.; Herrero, A.D.; Rojo, J.; Medialdea, A.; Benito, G.; Vegas, J. Geoarqueología del yacimiento musteriense del Abrigo del Molino (Segovia). In Proceedings of the XIII Reunión Nacional de Geomorfología on Avances de la Geomorfología en España, Cáceres, Spain, 9–12 September 2014; pp. 446–449. [Google Scholar]
- Álvarez-Alonso, D.; de Andrés-Herrero, M.; Díez-Herrero, A.; Medialdea, A.; Rojo-Hernández, J. Neanderthal settlement in central Iberia: Geo-archaeological research in the Abrigo del Molino site, MIS 3 (Segovia, Iberian Peninsula). Quat. Int. 2018, 474, 85–97. [Google Scholar] [CrossRef]
- Fernández García, P. Geomorfología del Sector Comprendido Entre el Sistema Central y el Macizo de Santa María La Real de Nieva (Segovia). Ph.D. Thesis, Universidad Complutense de Madrid, Madrid, Spain, 1987; p. 336. [Google Scholar]
- Díez-Herrero, A.; Martín-Duque, J.F. Las raíces del paisaje. Condicionantes geológicos del territorio de Segovia. In Colección Hombre y Naturaleza, VII; Abella Mardones, J.A., Salinas, B., Yoldi, L., Eds.; Junta de Castilla y León: Salamanca, Spain, 2005; p. 464. [Google Scholar]
- Fernández, P. Evolución cuaternaria y sistemas de terrazas en la subfosa terciaria de Valverde del Majano y el Macizo de Santa María la Real de Nieva (Segovia). Bol. Real Soc. Esp. Hist. Nat. (Secc. Geol.) 1988, 84, 69–83. [Google Scholar]
- Kehl, M.; Álvarez-Alonso, D.; de Andrés-Herrero, M.; Díez-Herrero, A.; Klasen, N.; Rethemeyer, J.; Weniger, G.C. The rock shelter Abrigo del Molino (Segovia, Spain) and the timing of the late Middle Paleolithic in Central Iberia. Quat. Res. 2018, 90, 180–200. [Google Scholar] [CrossRef]
- Geo-SLAM Zeb-Revo. Available online: http://geoslam.com/hardware-products/zeb-revo/ (accessed on 17 January 2018).
- Quigley, M.; Conley, K.; Gerkey, B.; Faust, J.; Foote, T.; Leibs, J.; Berger, E.; Wheeler, R.; Ng, A.Y. ROS: An open-source Robot Operating System. In Proceedings of the ICRA Workshop on Open Source Software, Kobe, Japan, 12-17 May 2009. [Google Scholar]
- González-Aguilera, D.; López-Fernández, L.; Rodríguez-González, P.; Guerrero-Sevilla, D.; Hernández-López, D.; Menna, F.; Nocerino, E.; Toschi, I.; Remondino, F.; Ballabeni, A.; et al. Development of an All-Purpose Free Photogrammetric Tool; ISPRS International Archives: Prague, Czech Republic, 2016. [Google Scholar]
- González-Aguilera, D.; López-Fernández, L.; Rodríguez-González, P.; Guerrero-Sevilla, D.; Hernández-López, D.; Menna, F.; Nocerino, E.; Toschi, I.; Remondino, F.; Ballabeni, A.; et al. InteGRAted Photogrammetric Suite, GRAPHOS. In Proceedings of the Congress: CATCON7-ISPRS, Prague, Czech Republic, 12–19 July 2016. [Google Scholar]
- Schnabel, R.; Wahl, R.; Klein, R. Efficient RANSAC for point-cloud shape detection. Comput. Graph. Forum 2007, 26, 214–226. [Google Scholar] [CrossRef]
- Thrun, S. Simultaneous Localization and Mapping. In Robotics and Cognitive Approaches to Spatial Mapping; Springer: Berlin/Heidelberg, Germany, 2007; pp. 13–41. [Google Scholar]
- Lague, D.; Brodu, N.; Leroux, J. Accurate 3D comparison of complex topography with terrestrial laser scanner: Application to the Rangitikei canyon (NZ). ISPRS J. Photogramm. Remote Sens. 2013, 82, 10–26. [Google Scholar] [CrossRef]
- Cloud Compare Project. Available online: https://www.danielgm.net/cc/ (accessed on 30 June 2019).
- Perfetti, L.; Polari, C.; Fassi, F. Fisheye photogrammetry: Tests and methodologies for the survey of narrow spaces. Int. Arch. Photogramm. Remote Sens. Spat. Inf. Sci. 2017, 42, 573–580. [Google Scholar] [CrossRef]
- Perfetti, L.; Polari, C.; Fassi, F.; Troisi, S.; Baiocchi, V.; Del Pizzo, S.; Giannone, F.; Barazzetti, L.; Previtali, M.; Roncoroni, F. Fisheye Photogrammetry to Survey Narrow Spaces in Architecture and a Hypogea Environment. In Latest Developments in Reality-Based 3D Surveying and Modelling; MDPI: Basel, Switzerland, 2018; pp. 3–28. [Google Scholar]


| 3D Digitalization Techniques | Image-Based Methods | Photogrammetry/Image Based Modelling |
|
| Range-based methods | Static laser scanner |
| |
| Dynamic laser scanner |
|
| Archaeological surveys: phase characterised by the search of archaeological evidence and site location [12,13]. | Orthophotography: (Present and historical) in order to find signs of anthropic activity (e.g., wall alignments, differential growth in crops that reveal geometric figures, etc.) Digital Elevation Model: used with the aim of detecting characteristic elements on the “z” axis (e.g., elevations, rocks alignments, that in view of a human eye are not perceptible in the terrain) |
| Site contextualization and documentation: phase of data collection of the site for its understanding [20,21,22,23,24,25]. | Point cloud: geometric characterization of the heritage resource. Orthophotography: Location of characteristic elements of the studied resource. |
| Excavation processes: documentation of the elements appearing during the excavation process (it is an irreversible process, being impossible to recover the original state of the site) [26,27]. | Points cloud: re-visualize what there was in each of the intervention processes of that resource, having georeferenced all the archaeological material extracted from it. Obtaining longitudinal and transversal profiles and surface and volumetric calculations. Orthophotography: obtaining a detailed planimetry of the excavation. |
| Preservation and analysis of the archaeological findings: processes in which different techniques are applied in order to check the deterioration suffered by the resource and preserve its conservation [28,29,30,31]. | Points cloud: documentation of archaeological sites and objects with the aim of monitoring it and verifying its deterioration over time. Orthophotography: verification of the resource deterioration. |
| Taphonomical analyses of the archaeological findings: a process in which the materials unearthed in the site are studied to know the processes they suffered [32,33,34,35,36,37,38]. | Points cloud: performing a morphometric and geometric analysis of the materials (or details of them) found in a given archaeological site (cutting marks, engravings in stone, coins, ceramics) for a better understanding of the activities and processes that affected the archaeological findings. |
| Dissemination: a process in which the resources (archaeological site, archaeological evidence) or what happened in them are put in value at the service of the public [1,3,4,5,6,7,8,22,25]. | 3D model: visualization of 3D models on web, applications in a graphic, visual and didactical way. Recreation of the site and the activities that were carried out in it. 3D models can also be used for the analysis of archaeological materials since they are reliable copies of the pieces. Orthophotos: diffusion of images from the site.Panoramic photographs: Generation of virtual visits. |
| Flight Planning | |
|---|---|
| Ascent speed | 0.5 m/s |
| Horizontal speed | 3 m/s |
| Flight height | 67 m |
| Rotation degree (respect to the north) | 30° s |
| Horizontal-longitudinal overlap | 70% |
| Overlap between strips | 30% |
| Positioning system accuracy | 50 cm |
| Surface | 34 ha |
| Number of images | 519 |
| DJI Mavic Pro’s Camera | |
|---|---|
| Autonomy | 27 min |
| Total weight | 734 gr |
| Maximum flight speed | 65 km/h |
| Accuracy of the on-board GPS | ±1.5 m (x,y) and ±0.5 m (z) |
| Maximum allowable height | 5000 m over the sea |
| DJI Mavic Pro’s Camera | |
|---|---|
| Sensor size | 1/2.3″ |
| Sensor resolution | 12 MPix |
| Field Of View | 78.8° |
| Focal length | 5 |
| Max. ISO | 3200 |
| Aperture | f/2.2 fixed |
| Shutter | Electronic |
| WMLS Zeb REVO | |
|---|---|
| Measuring principle | Time of flight |
| Wavelength (nm) | 905 |
| Scanner resolution (°) | 0.625 H × 1.8 V |
| Orientations system | MEMS IMU |
| Scanner dimensions (mm) | 86 × 113 × 287 |
| Total weight (kg) | 4.10 |
| Scanner weight (kg) | 1.00 |
| Dimensions (mm) | 220 × 180 × 470 |
| Working range (m) | 0.60–30 m indoors |
| 0.60–15 m outdoors | |
| Measurement rate | 40,000 points per second |
| GRESWIN 2D Configuration |
|---|
| Xmin: −0.18 |
| Xmax: 15.18 |
| Move start time |
| Background removal |
| Vertical bandpass filter (td) |
| Linear gain |
| Smoothed gainTime-depth transformation: velocity = 110 mm/ns |
© 2019 by the authors. Licensee MDPI, Basel, Switzerland. This article is an open access article distributed under the terms and conditions of the Creative Commons Attribution (CC BY) license (http://creativecommons.org/licenses/by/4.0/).
Share and Cite
Maté-González, M.Á.; Sánchez-Aparicio, L.J.; Sáez Blázquez, C.; Carrasco García, P.; Álvarez-Alonso, D.; de Andrés-Herrero, M.; García-Davalillo, J.C.; González-Aguilera, D.; Hernández Ruiz, M.; Jordá Bordehore, L.; et al. On the Combination of Remote Sensing and Geophysical Methods for the Digitalization of the San Lázaro Middle Paleolithic Rock Shelter (Segovia, Central Iberia, Spain). Remote Sens. 2019, 11, 2035. https://doi.org/10.3390/rs11172035
Maté-González MÁ, Sánchez-Aparicio LJ, Sáez Blázquez C, Carrasco García P, Álvarez-Alonso D, de Andrés-Herrero M, García-Davalillo JC, González-Aguilera D, Hernández Ruiz M, Jordá Bordehore L, et al. On the Combination of Remote Sensing and Geophysical Methods for the Digitalization of the San Lázaro Middle Paleolithic Rock Shelter (Segovia, Central Iberia, Spain). Remote Sensing. 2019; 11(17):2035. https://doi.org/10.3390/rs11172035
Chicago/Turabian StyleMaté-González, Miguel Ángel, Luis Javier Sánchez-Aparicio, Cristina Sáez Blázquez, Pedro Carrasco García, David Álvarez-Alonso, María de Andrés-Herrero, Juan Carlos García-Davalillo, Diego González-Aguilera, Mario Hernández Ruiz, Luis Jordá Bordehore, and et al. 2019. "On the Combination of Remote Sensing and Geophysical Methods for the Digitalization of the San Lázaro Middle Paleolithic Rock Shelter (Segovia, Central Iberia, Spain)" Remote Sensing 11, no. 17: 2035. https://doi.org/10.3390/rs11172035
APA StyleMaté-González, M. Á., Sánchez-Aparicio, L. J., Sáez Blázquez, C., Carrasco García, P., Álvarez-Alonso, D., de Andrés-Herrero, M., García-Davalillo, J. C., González-Aguilera, D., Hernández Ruiz, M., Jordá Bordehore, L., López Carnicero, C., & Mora, R. (2019). On the Combination of Remote Sensing and Geophysical Methods for the Digitalization of the San Lázaro Middle Paleolithic Rock Shelter (Segovia, Central Iberia, Spain). Remote Sensing, 11(17), 2035. https://doi.org/10.3390/rs11172035