Rapid Assessment of Flood Inundation and Damaged Rice Area in Red River Delta from Sentinel 1A Imagery

 ,
,
Abstract
1. Introduction
1.1. Rice and Flood in the Red River Delta
1.2. Monitoring Rice and Flooding Using Satellite Images
1.3. Contribution and Structure of the Article
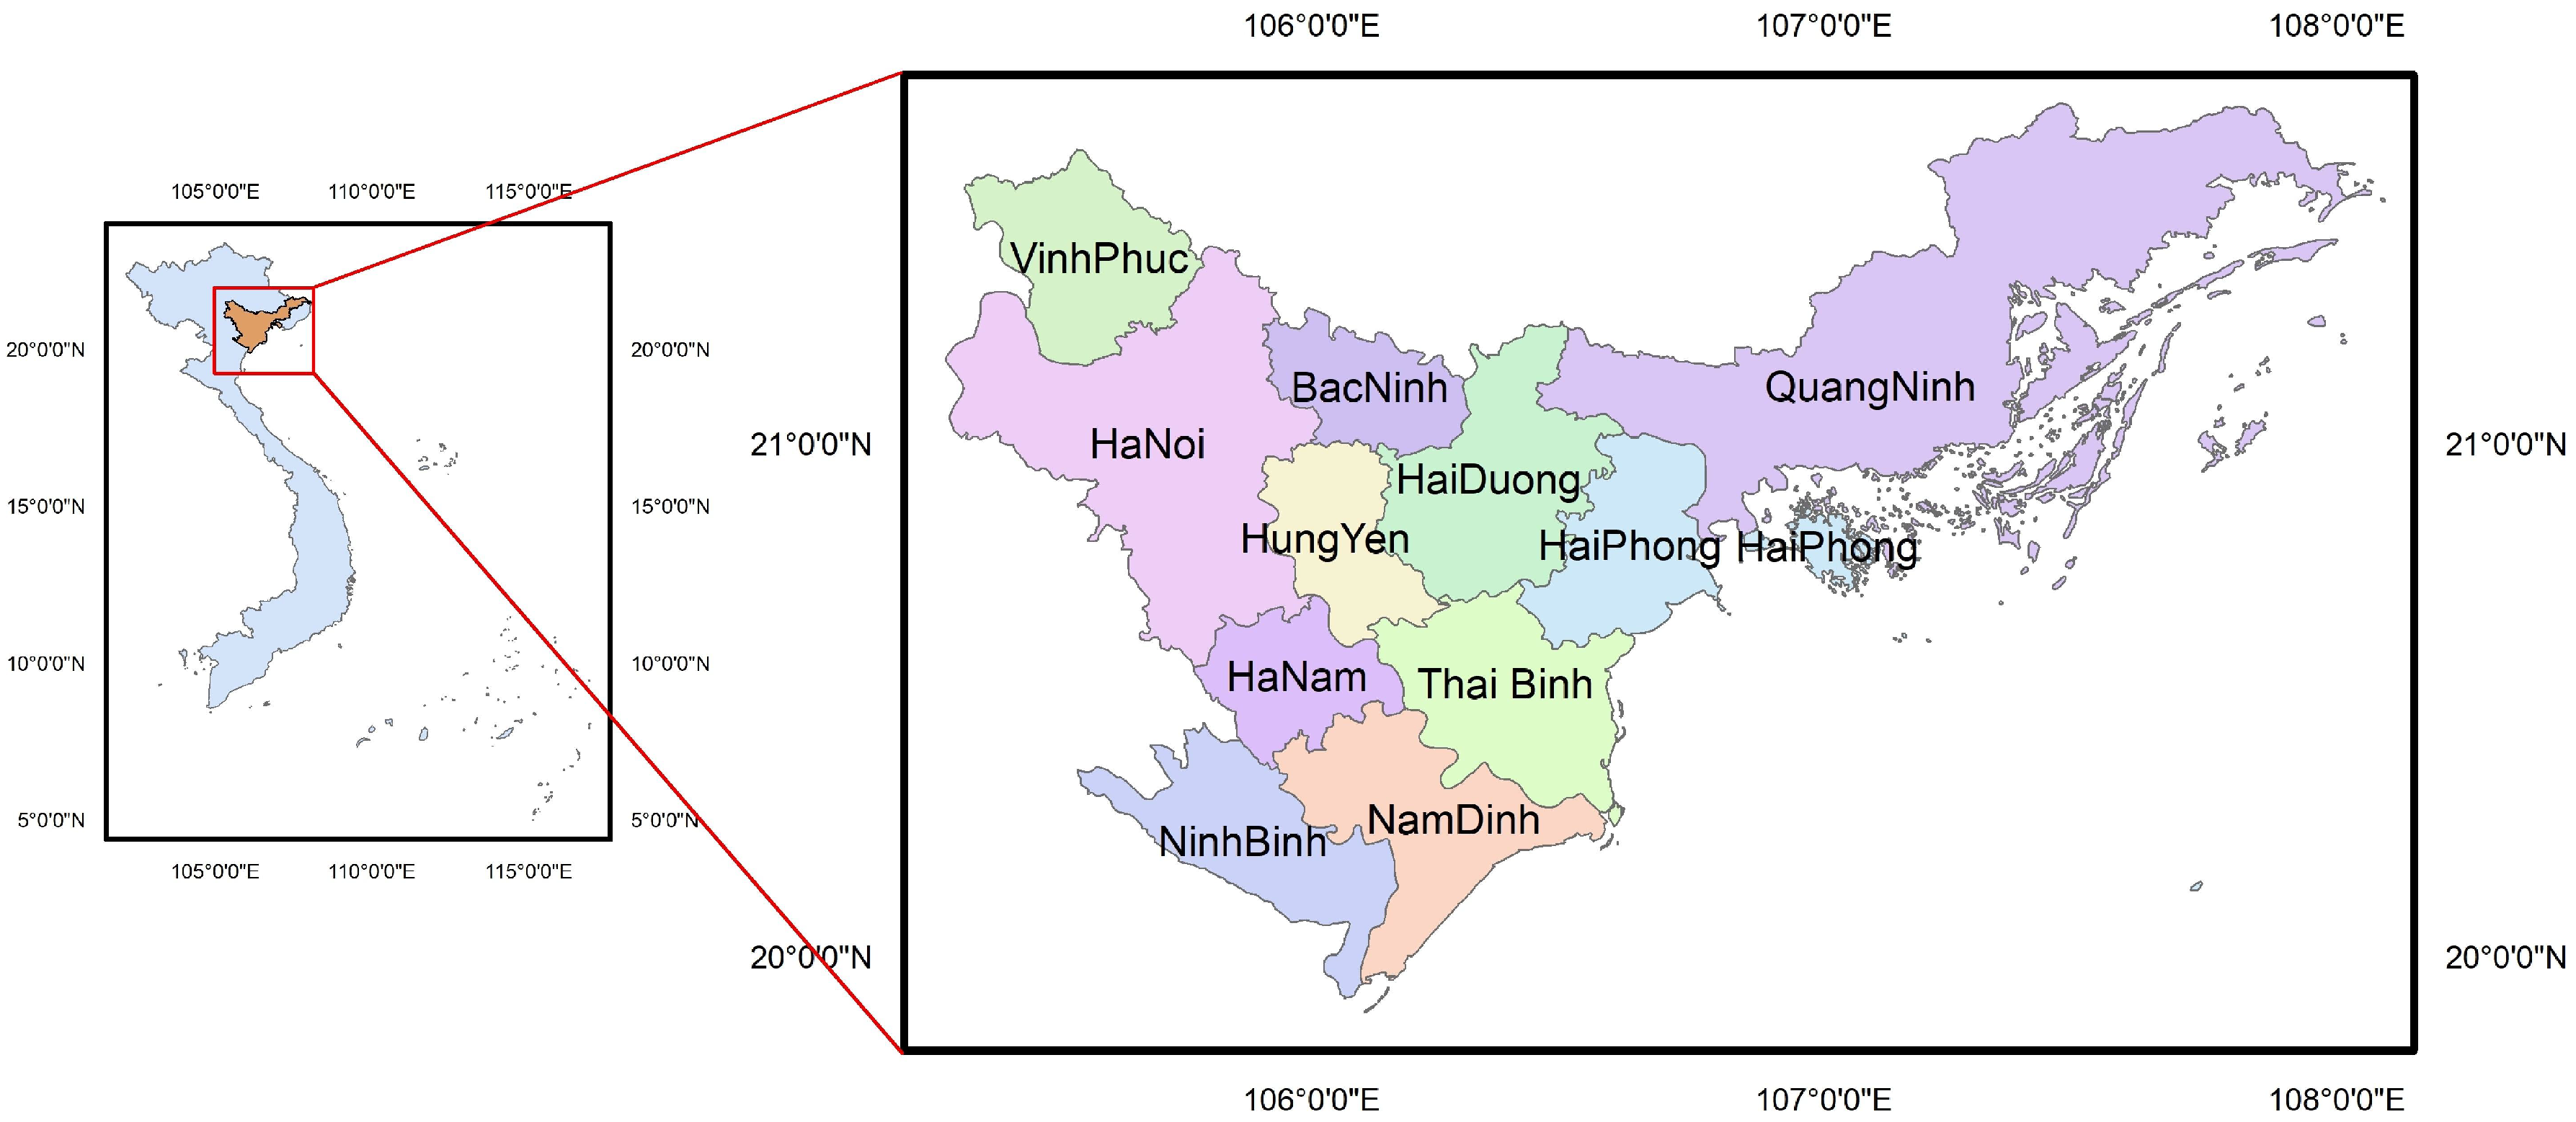
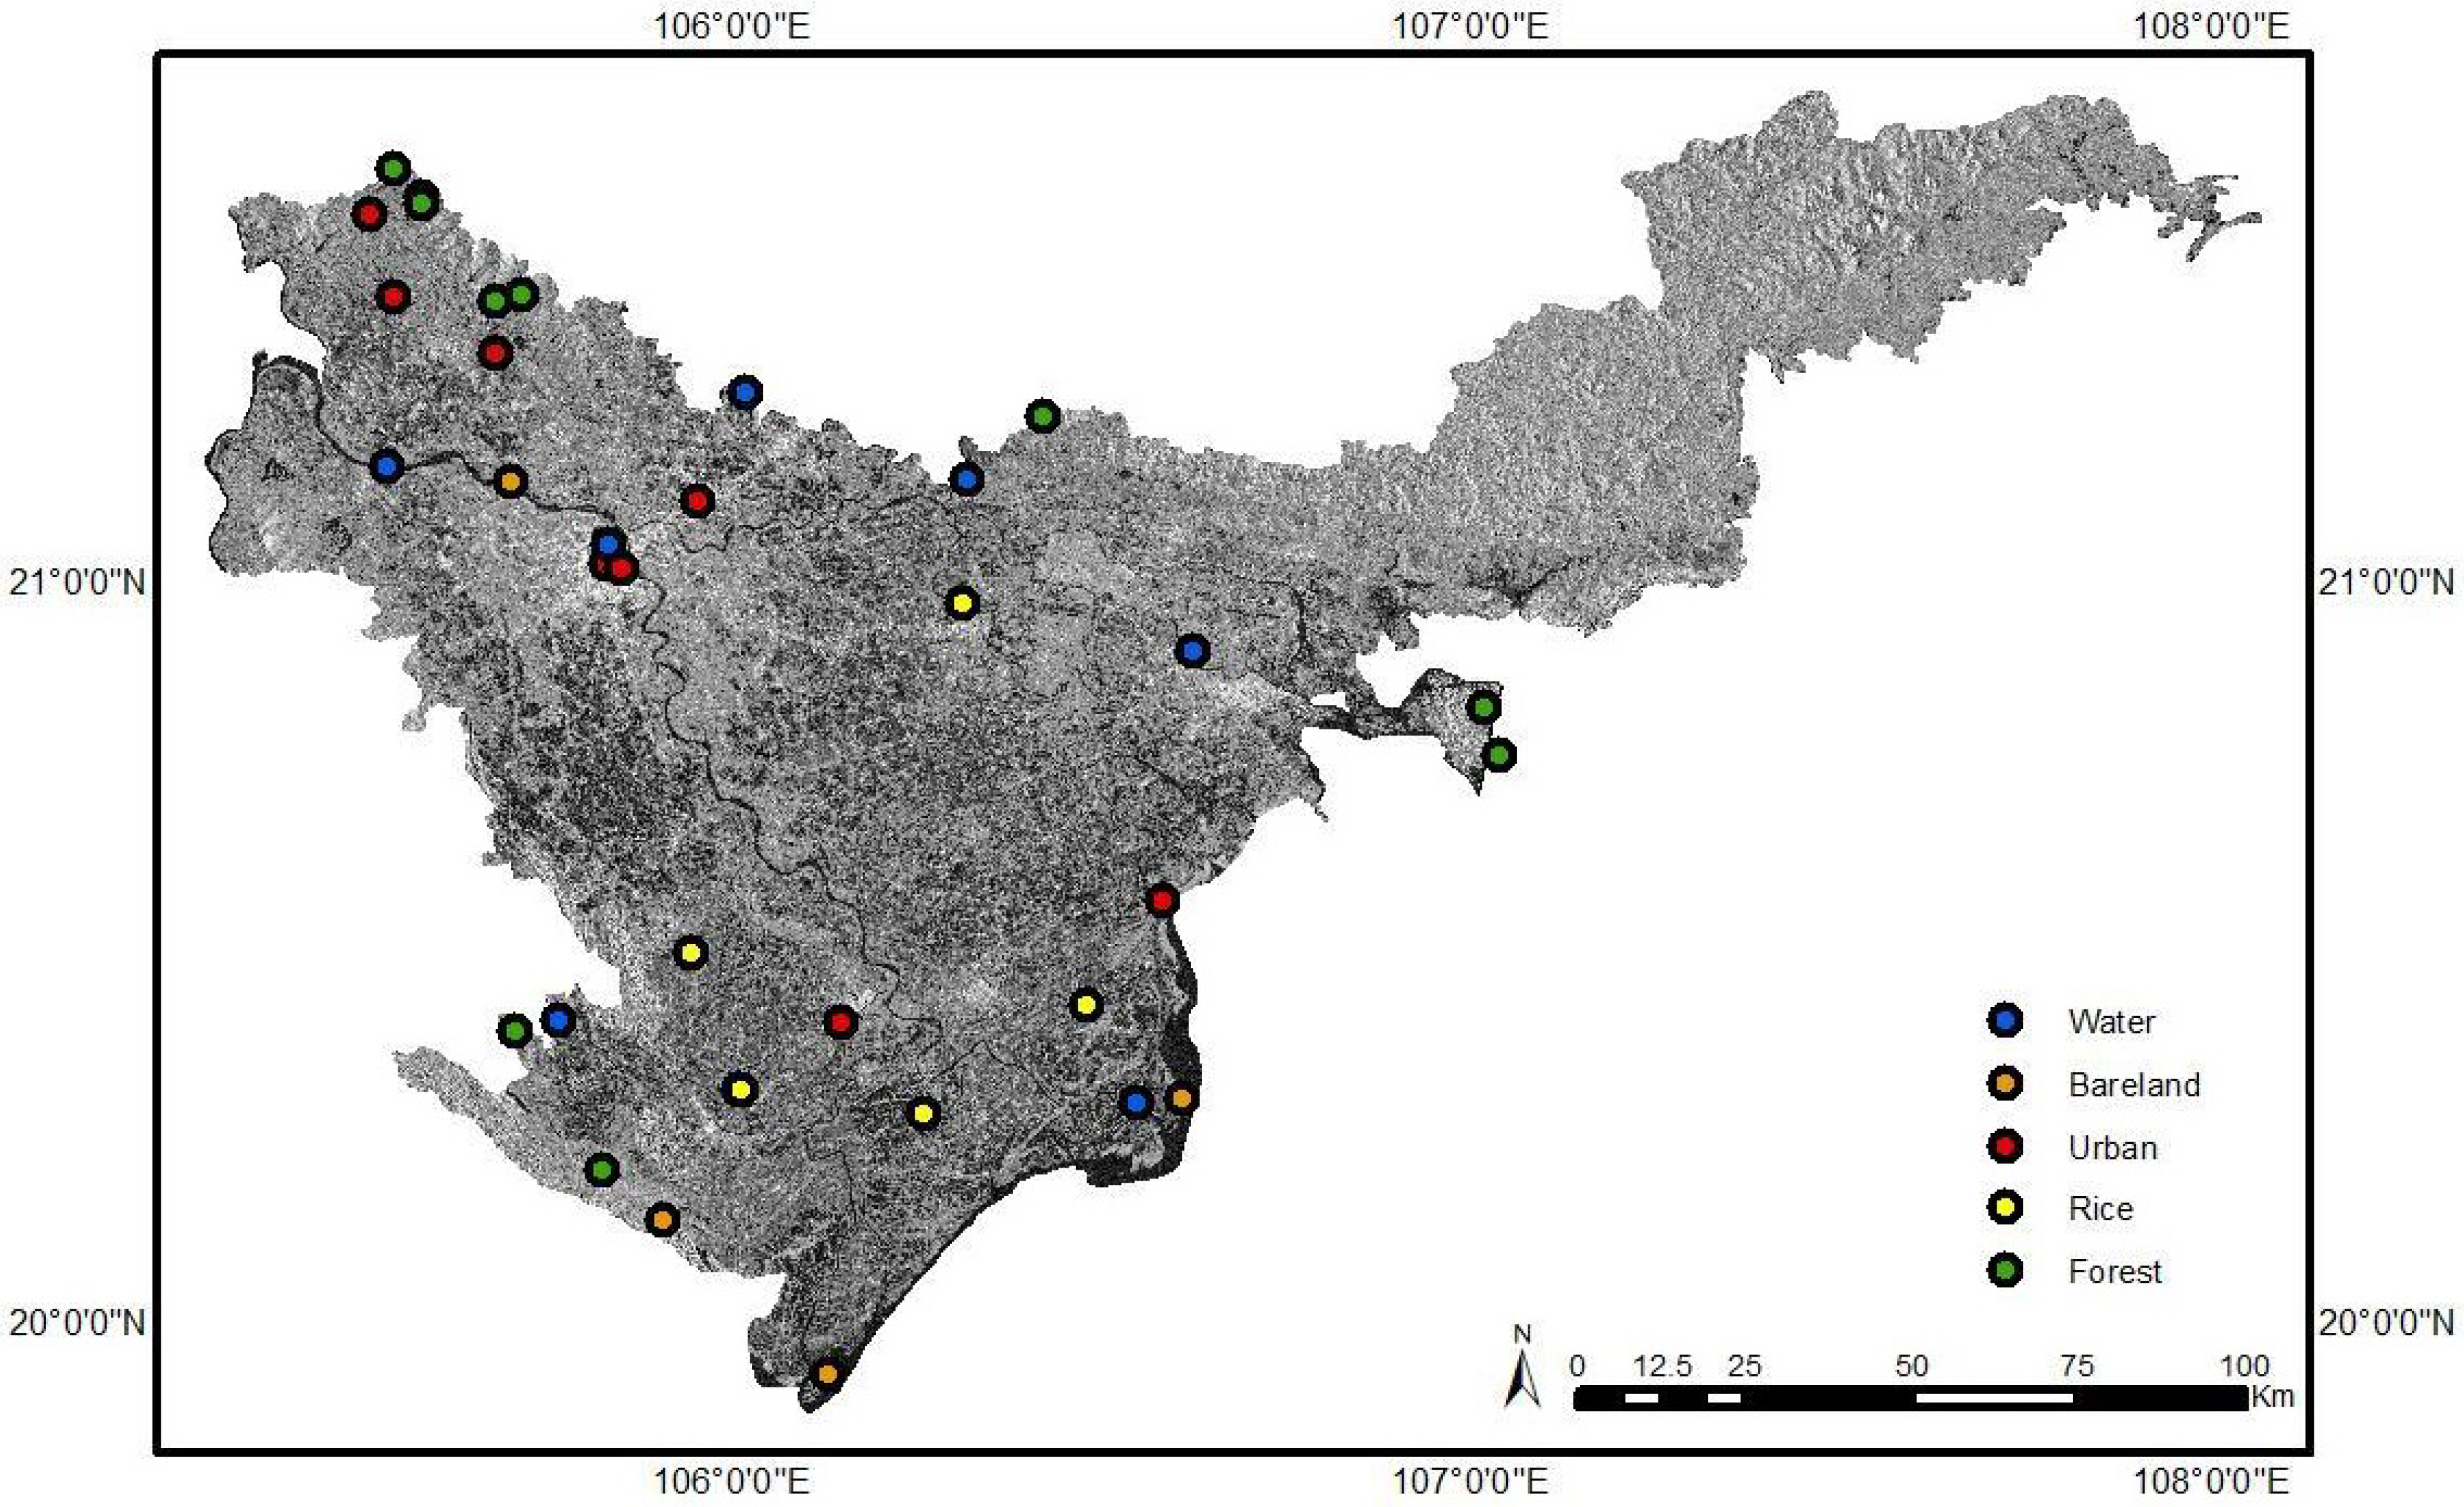
2. Study Area and Dataset
2.1. The Red River Delta
2.2. Sentinel 1A
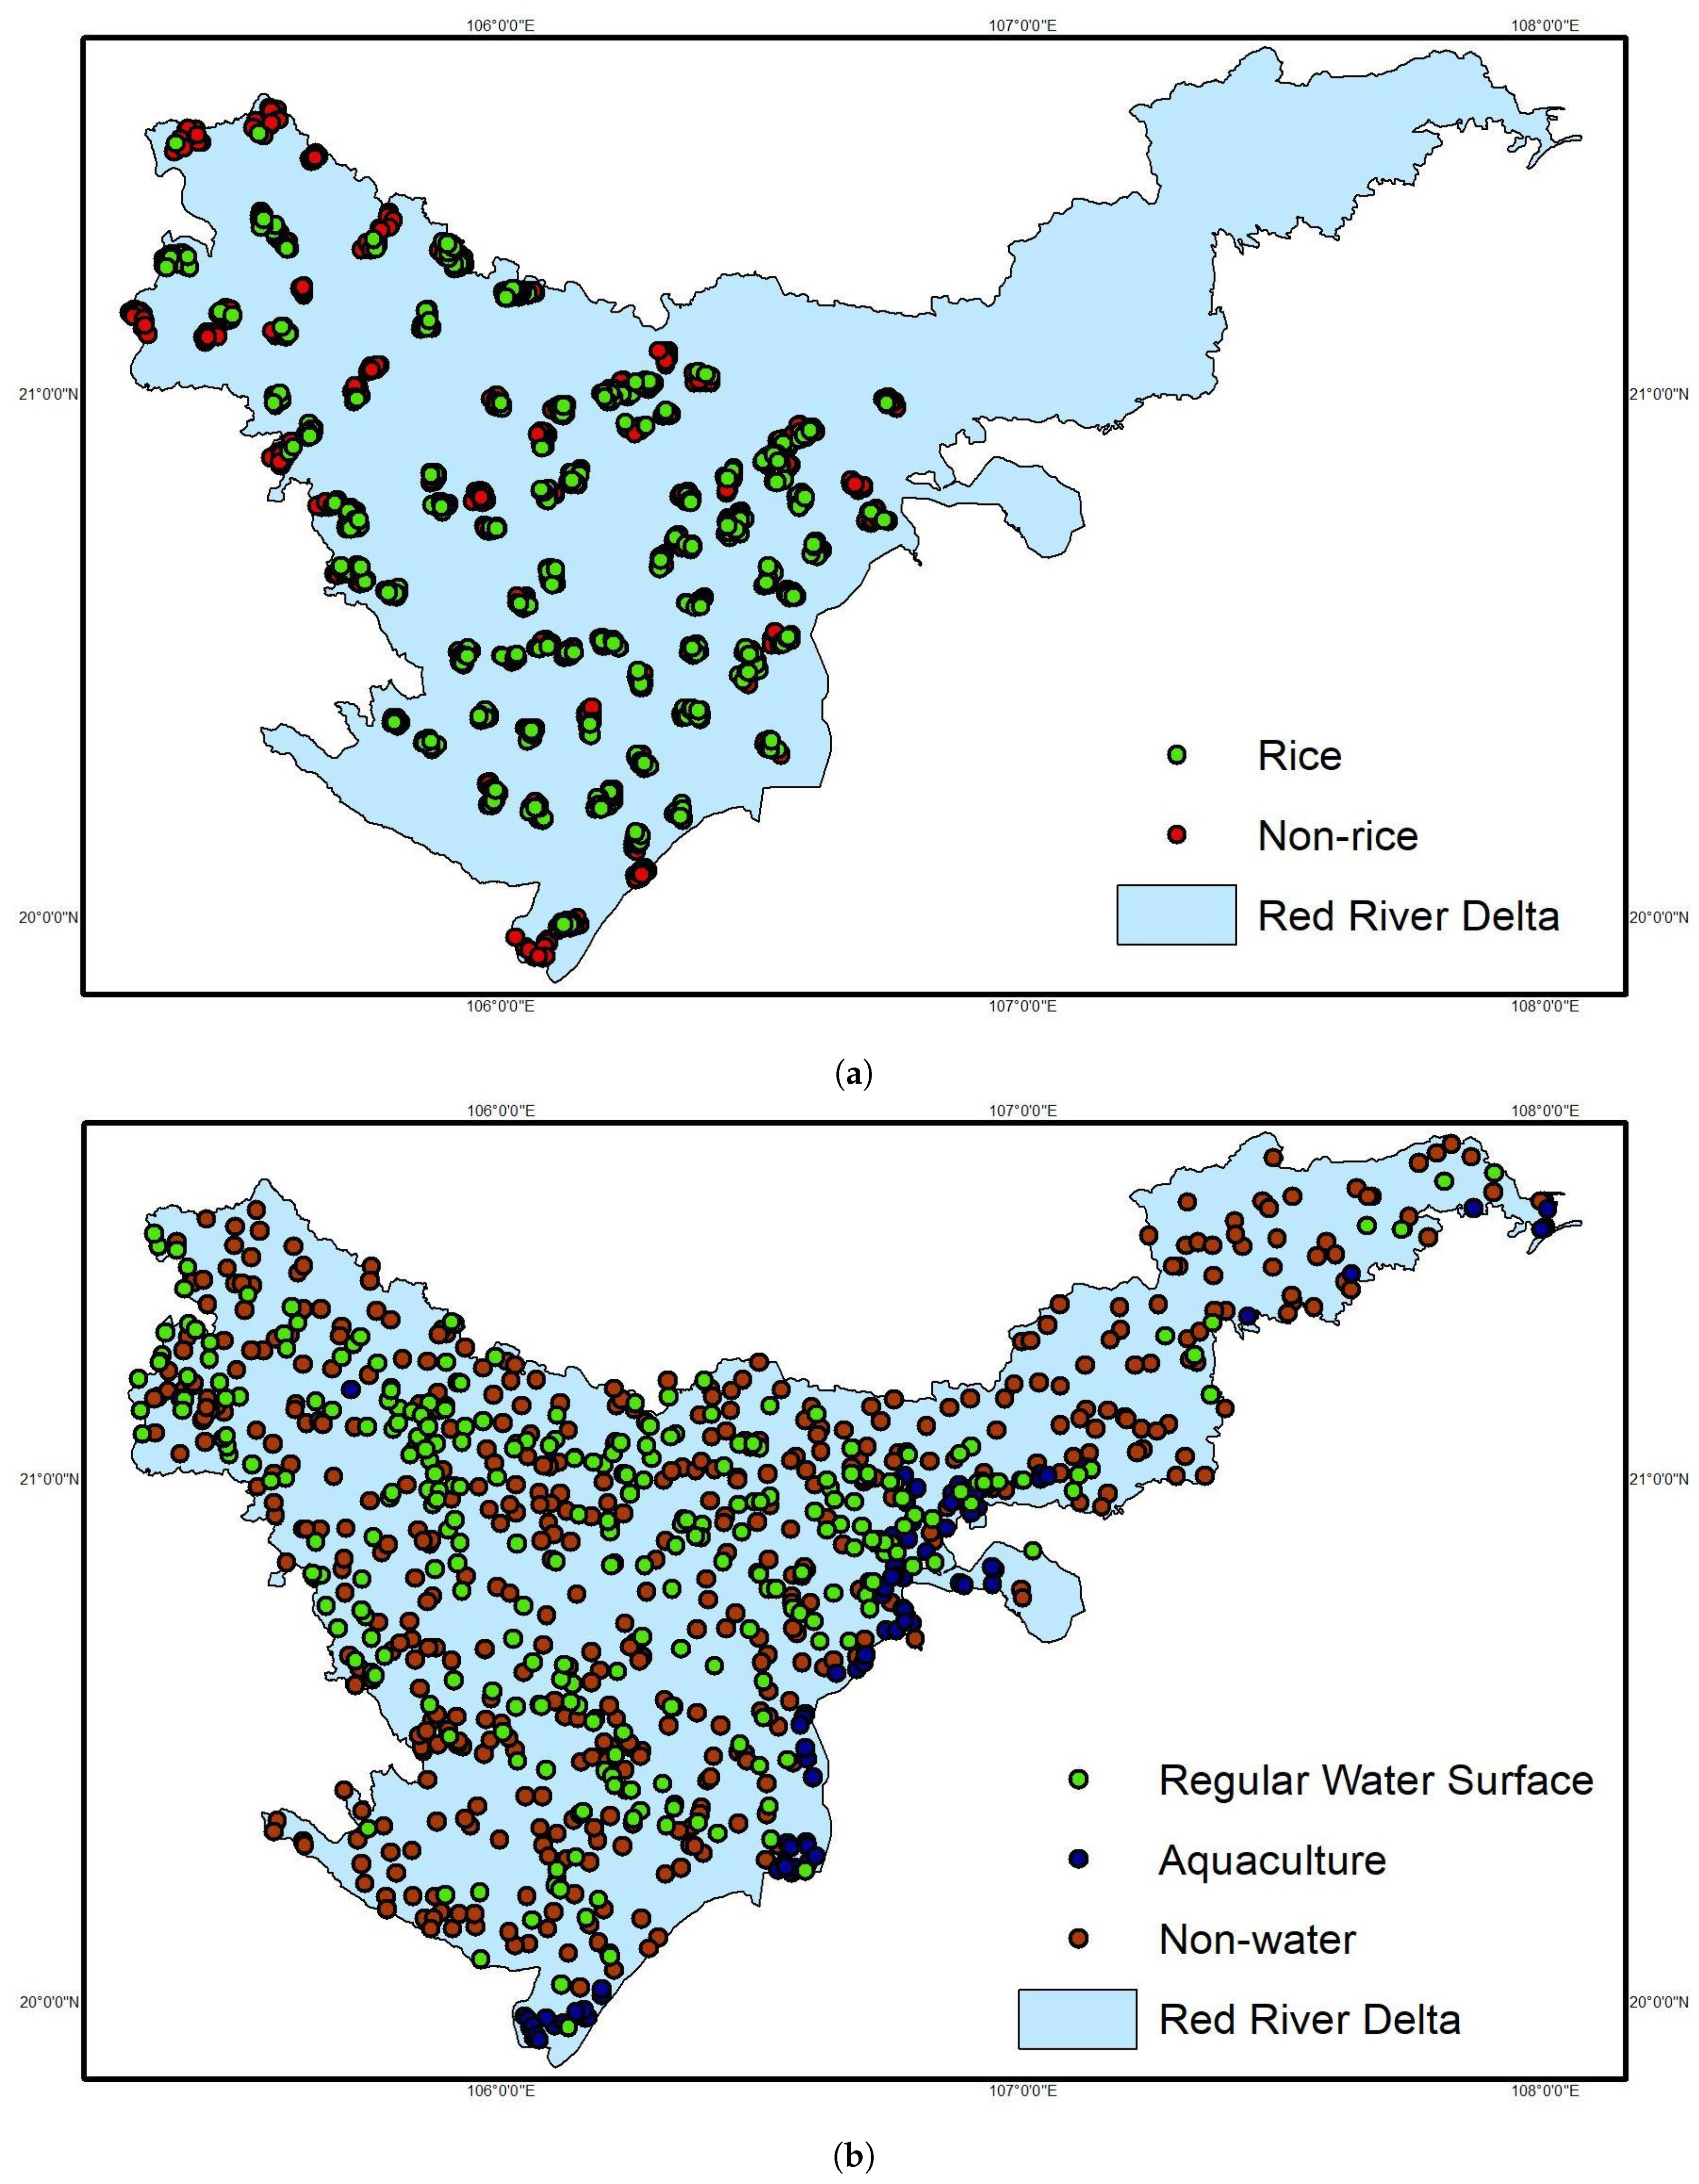
2.3. Reference Data
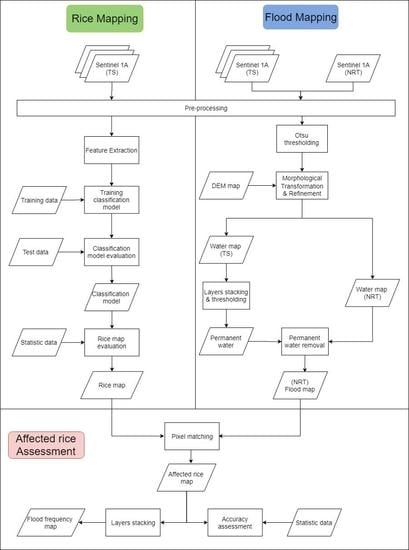
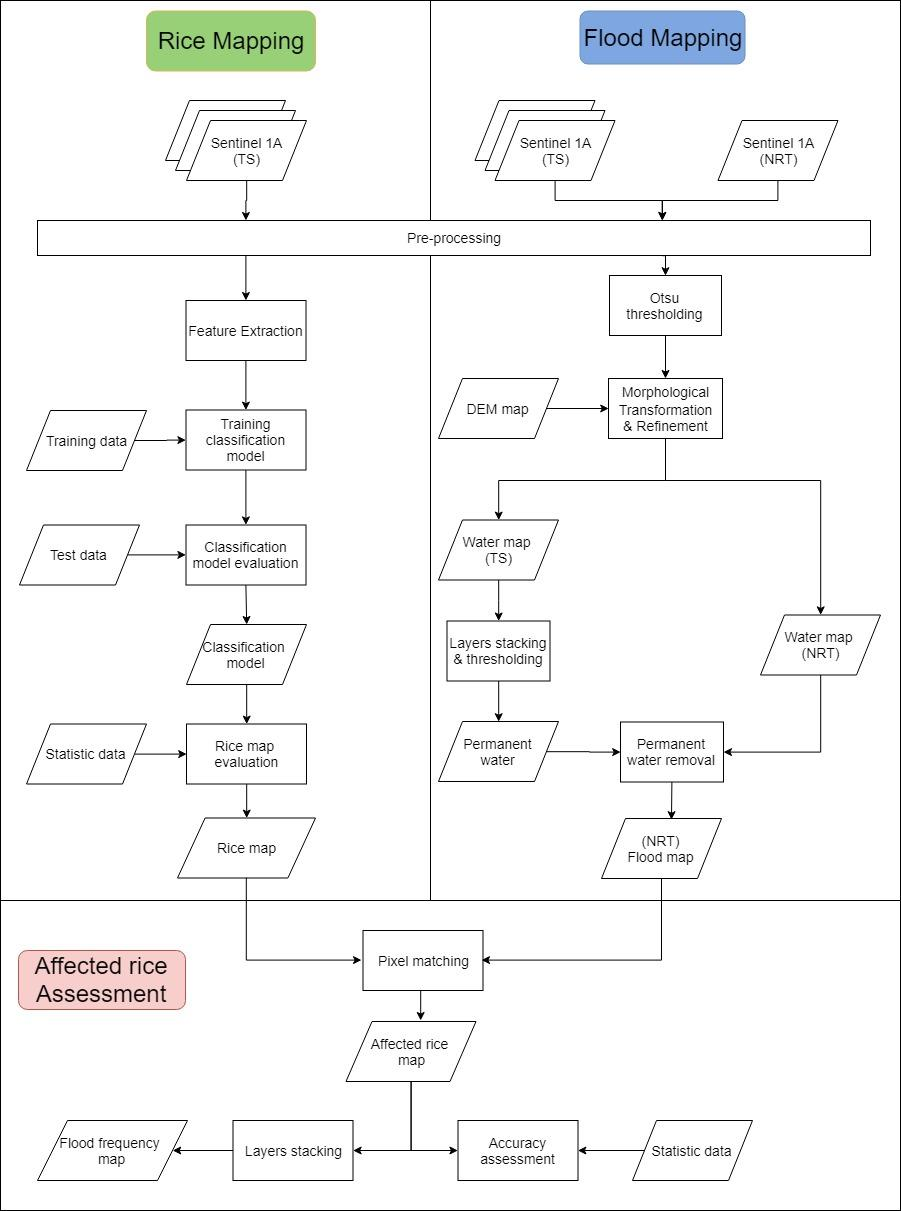
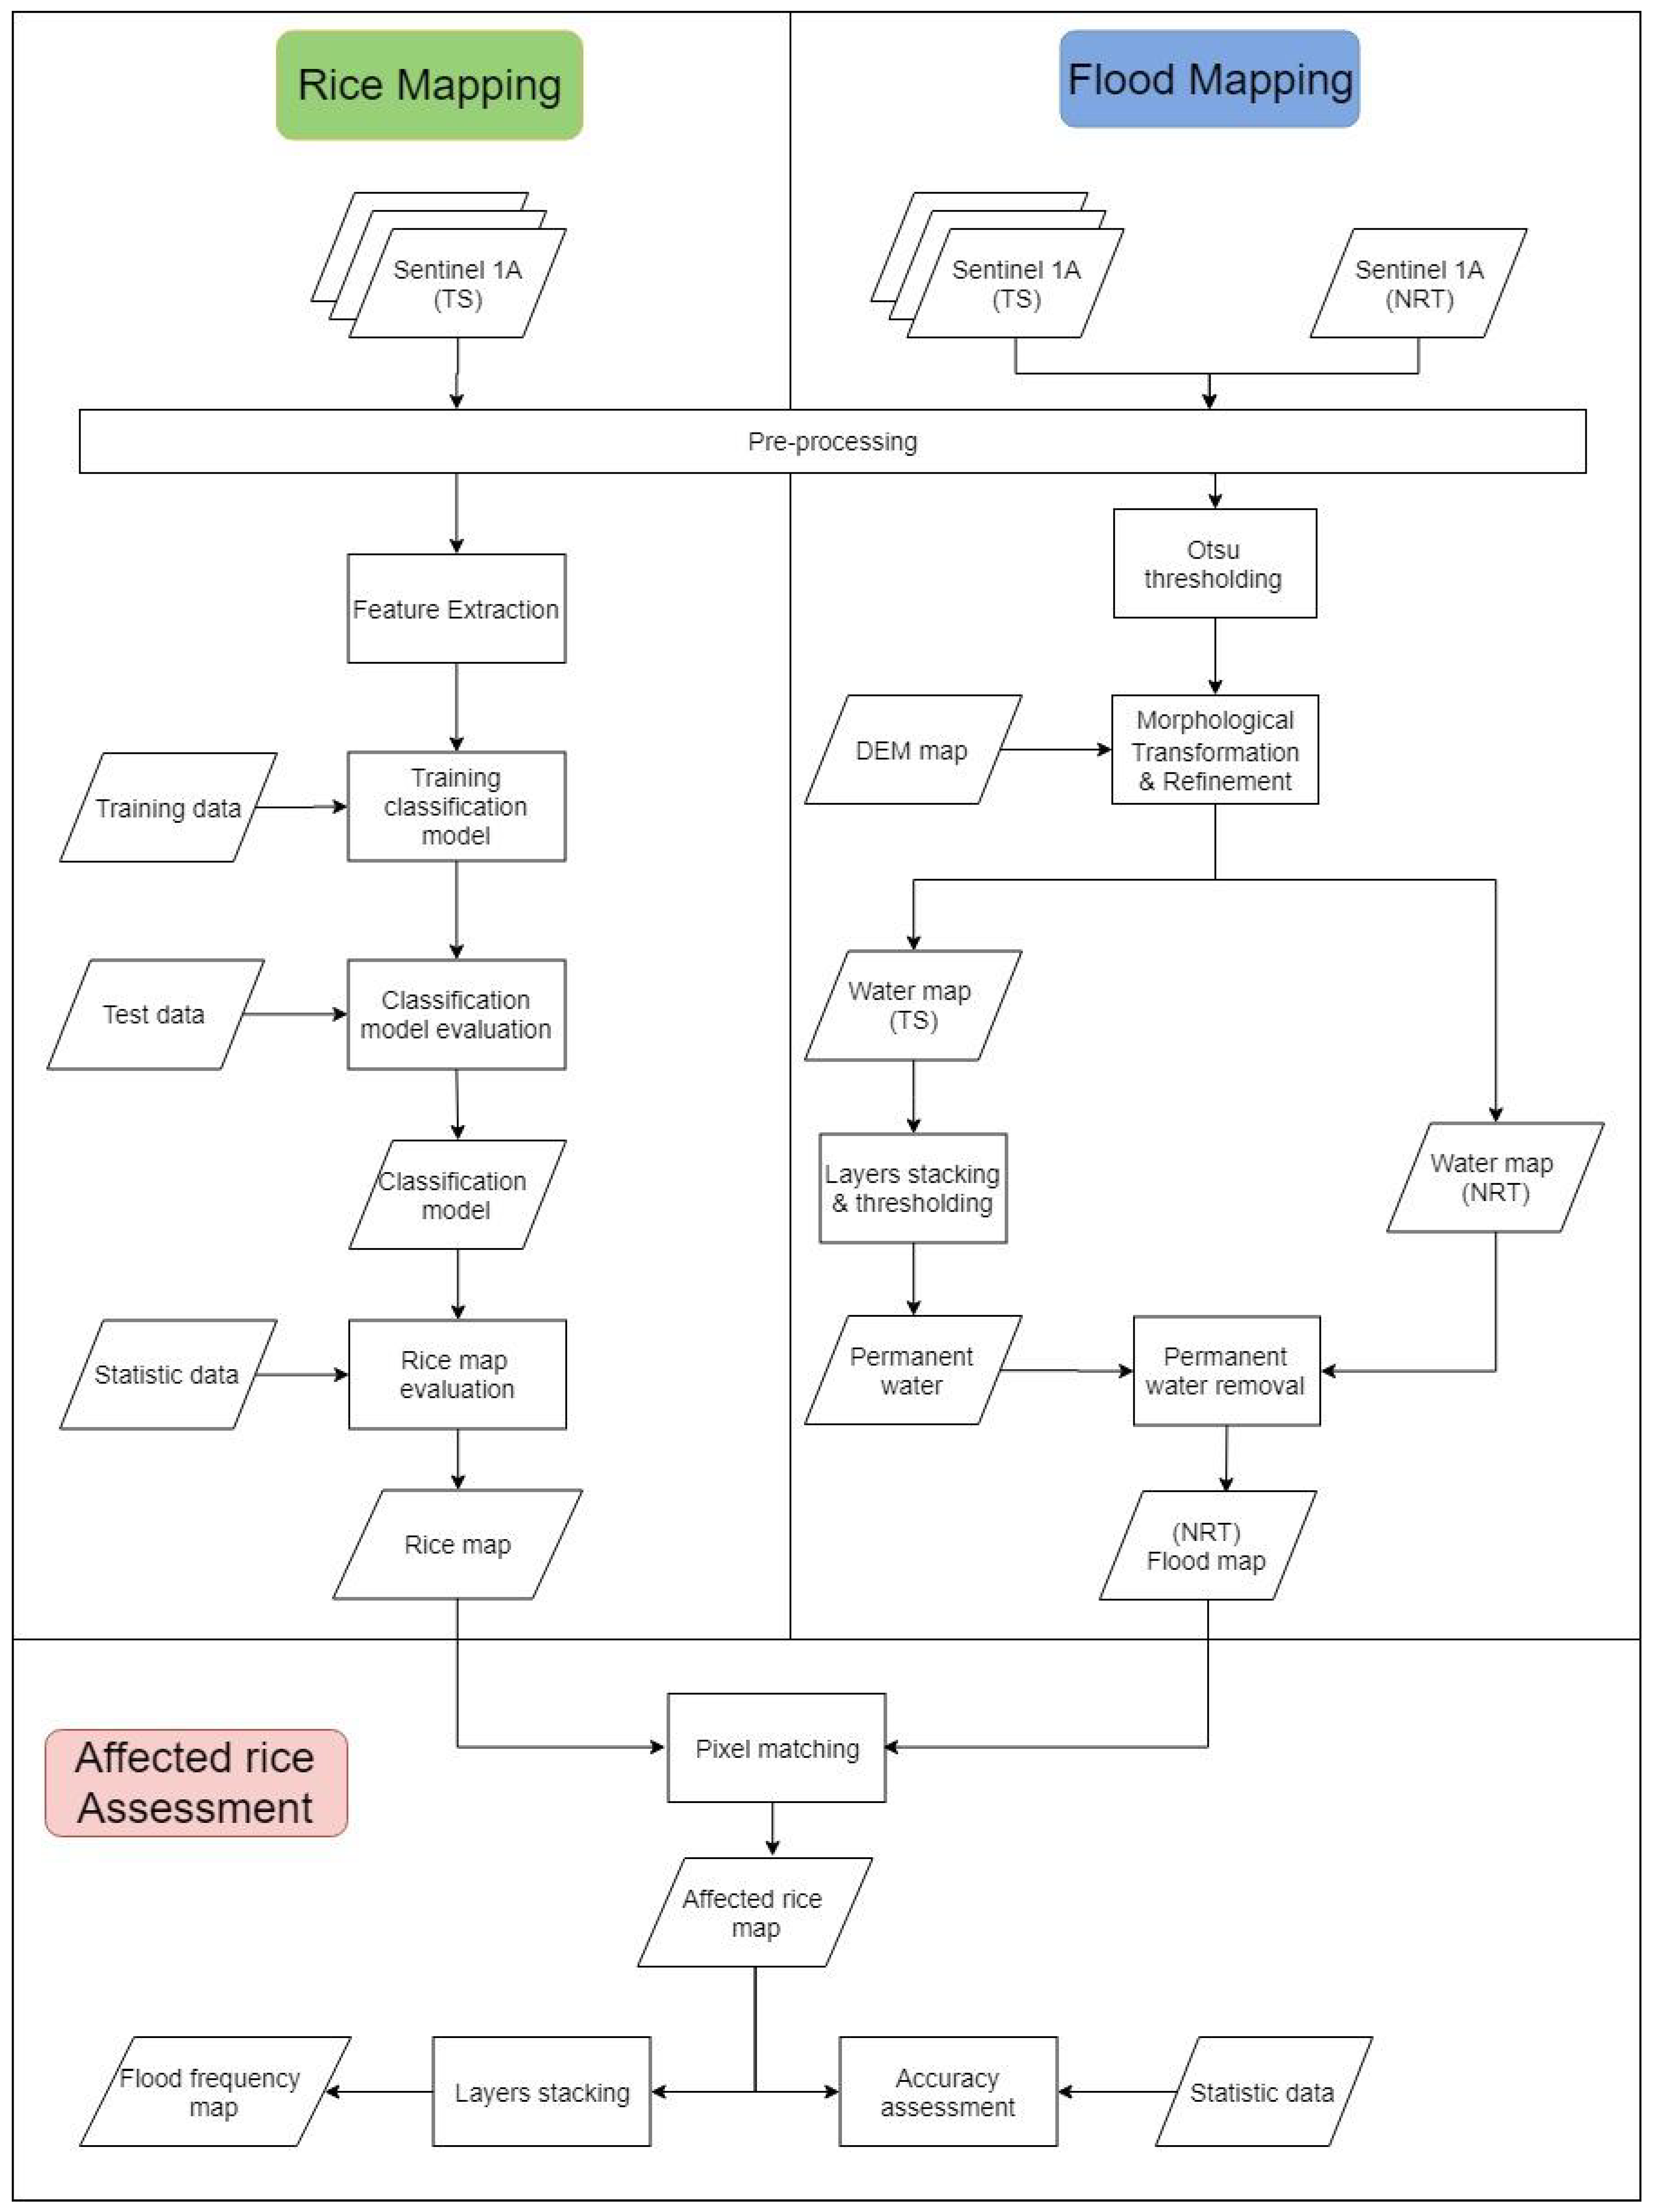
3. Methodology
3.1. Rice Mapping
3.2. Flood and Permanent Water Mapping
3.3. Affected Rice Area Assessment
4. Experimental Result and Discussion
4.1. Phenology Analysis Based on Backscatter Coefficients
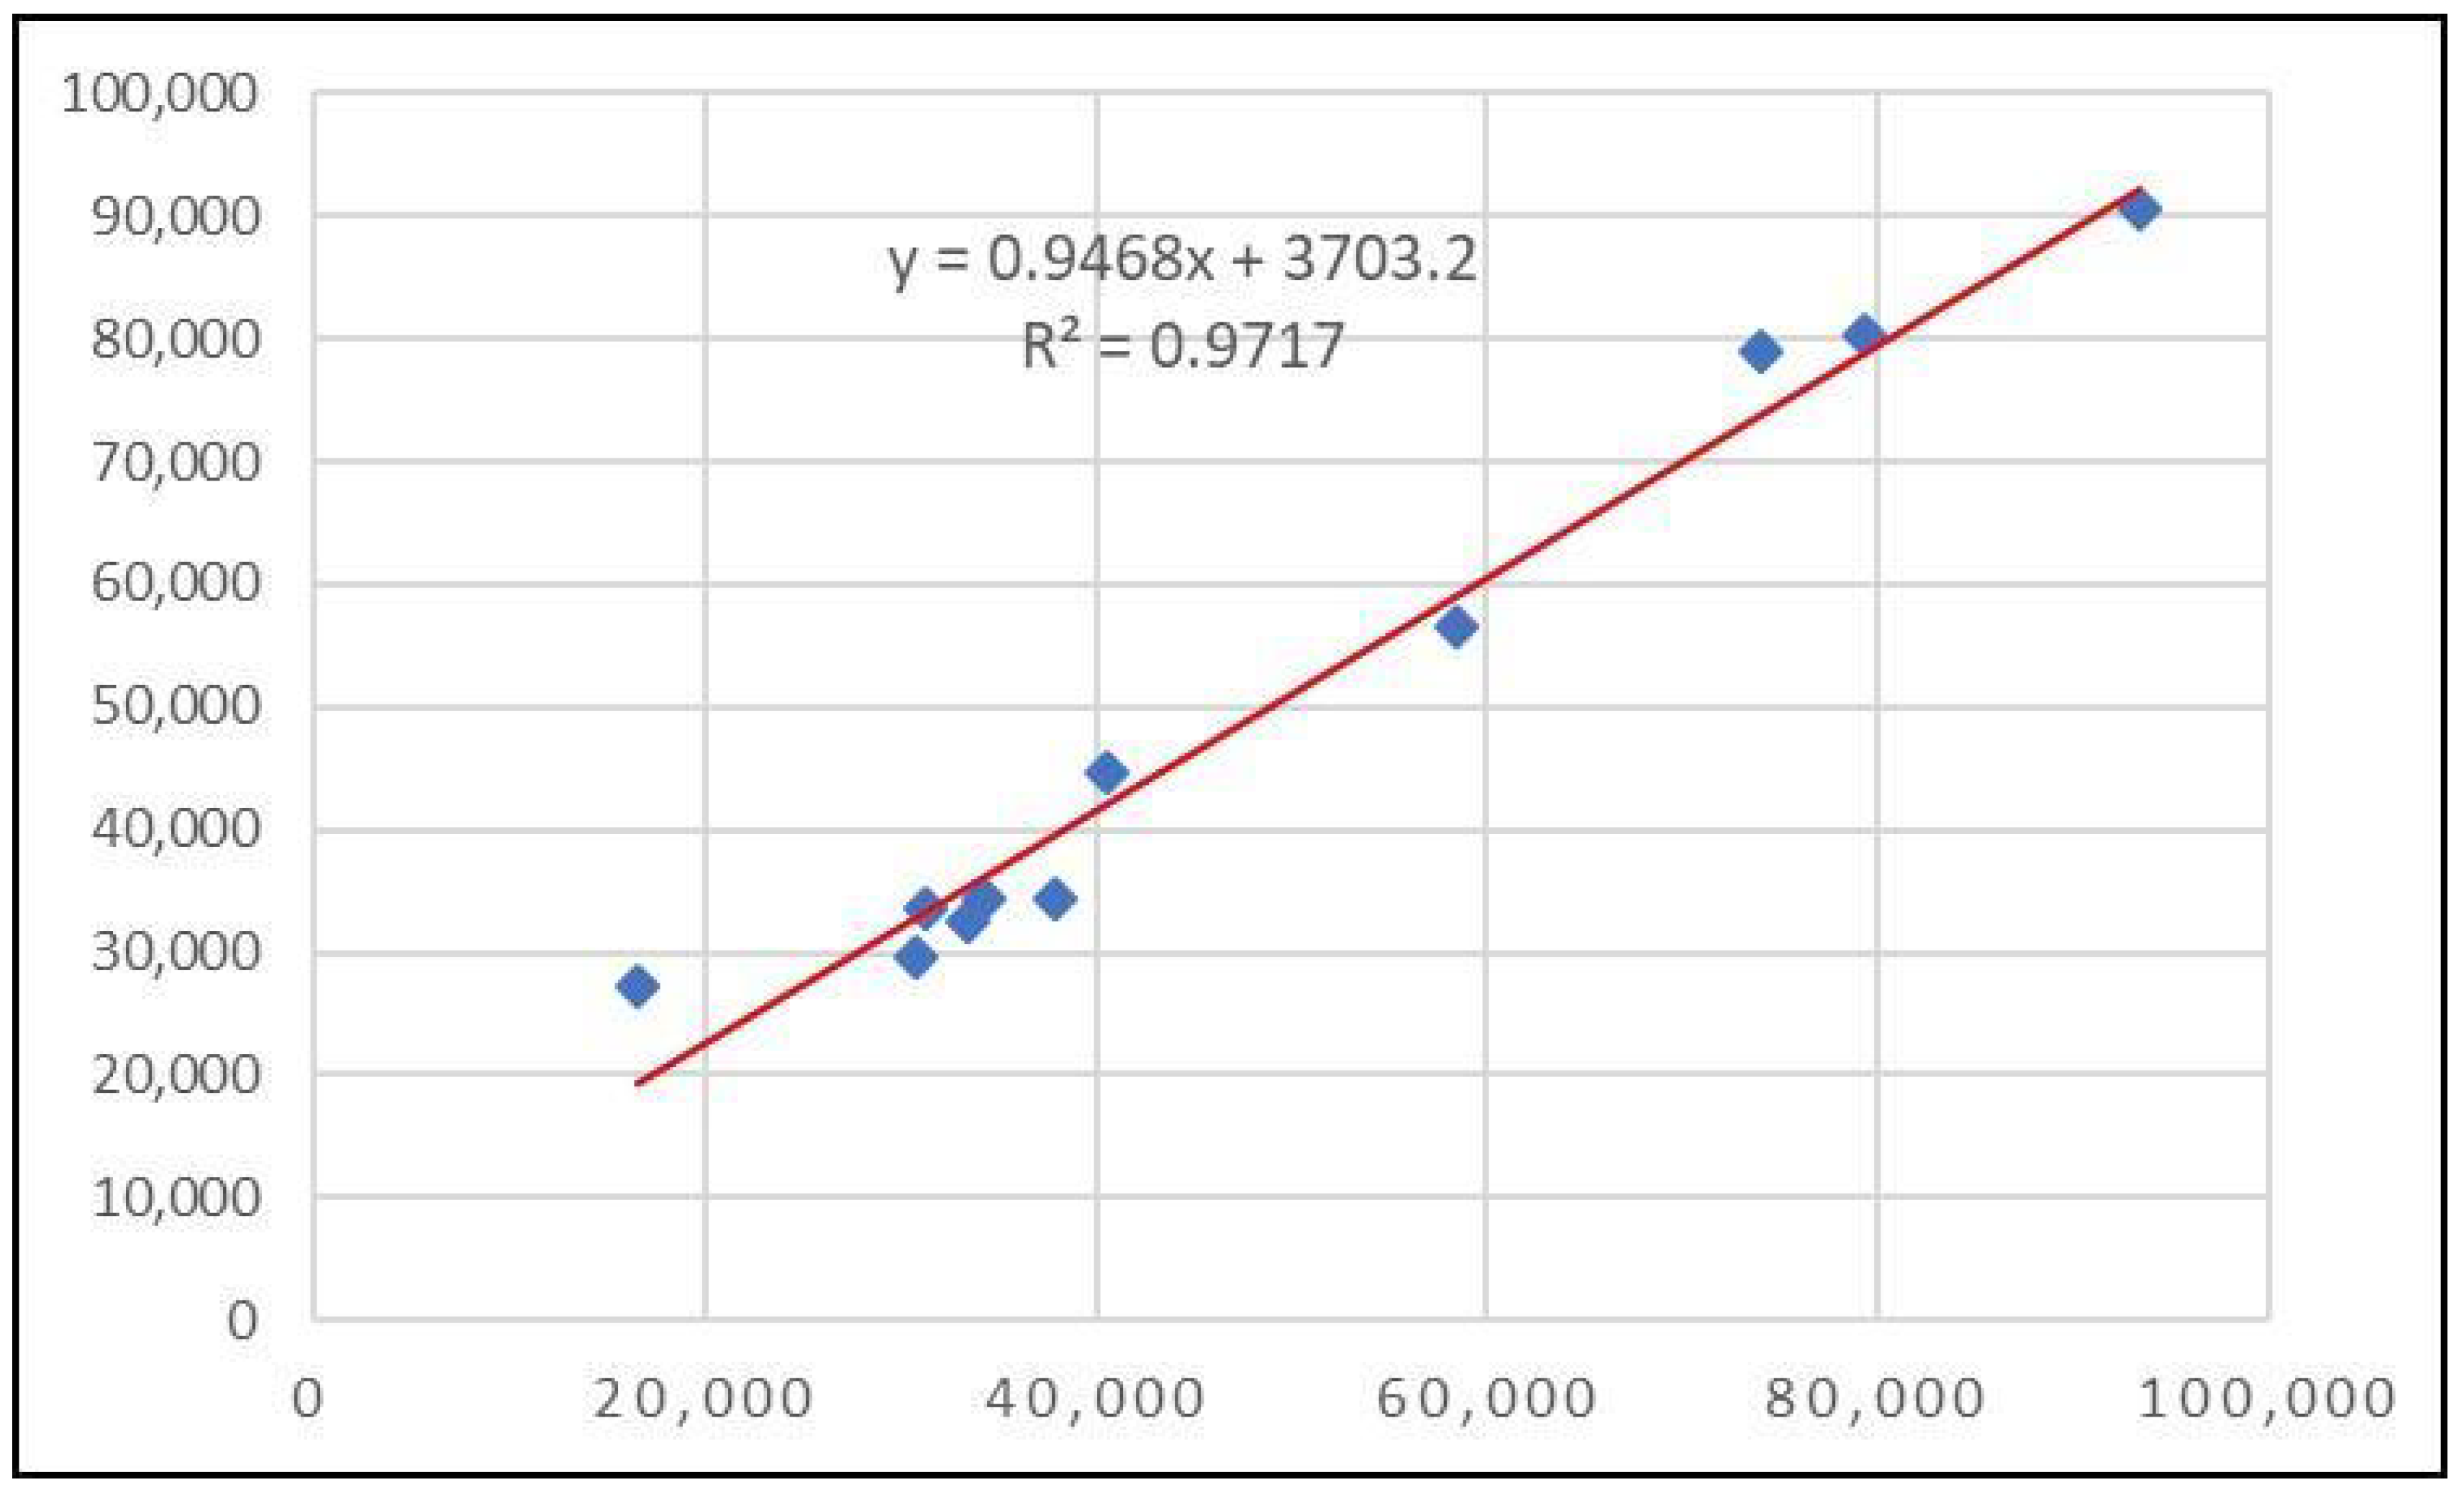
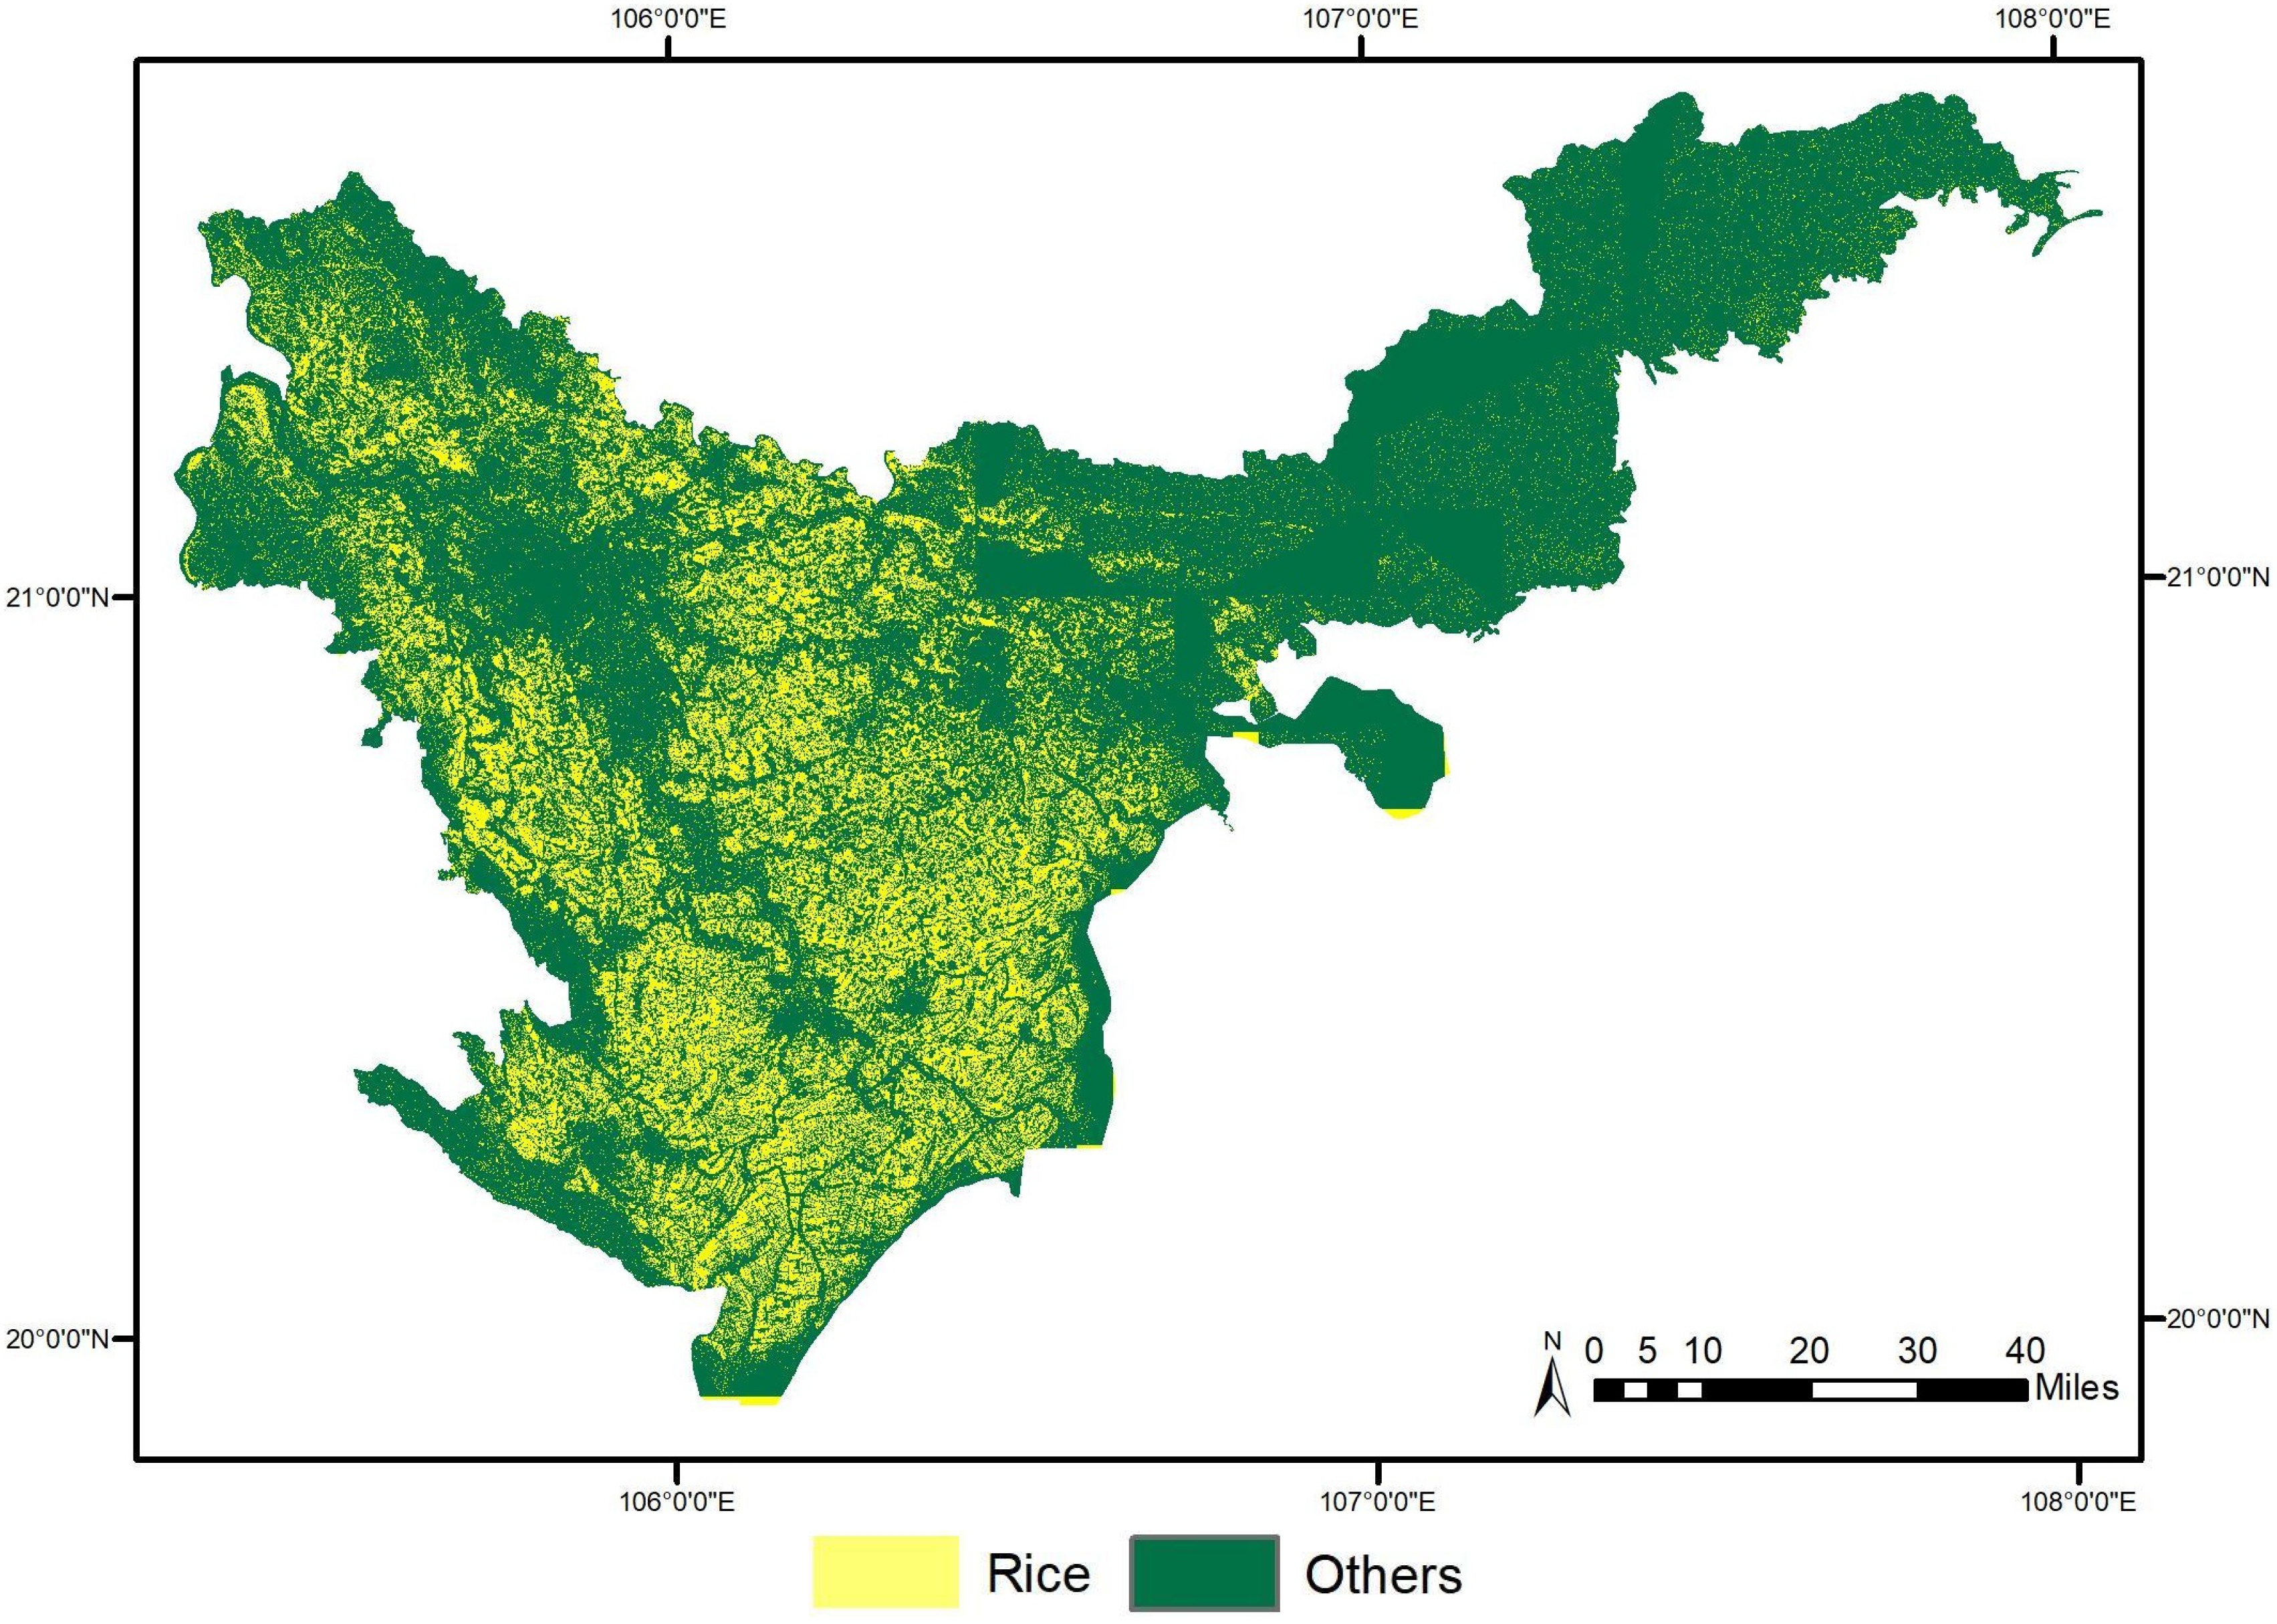
4.2. Rice Mapping
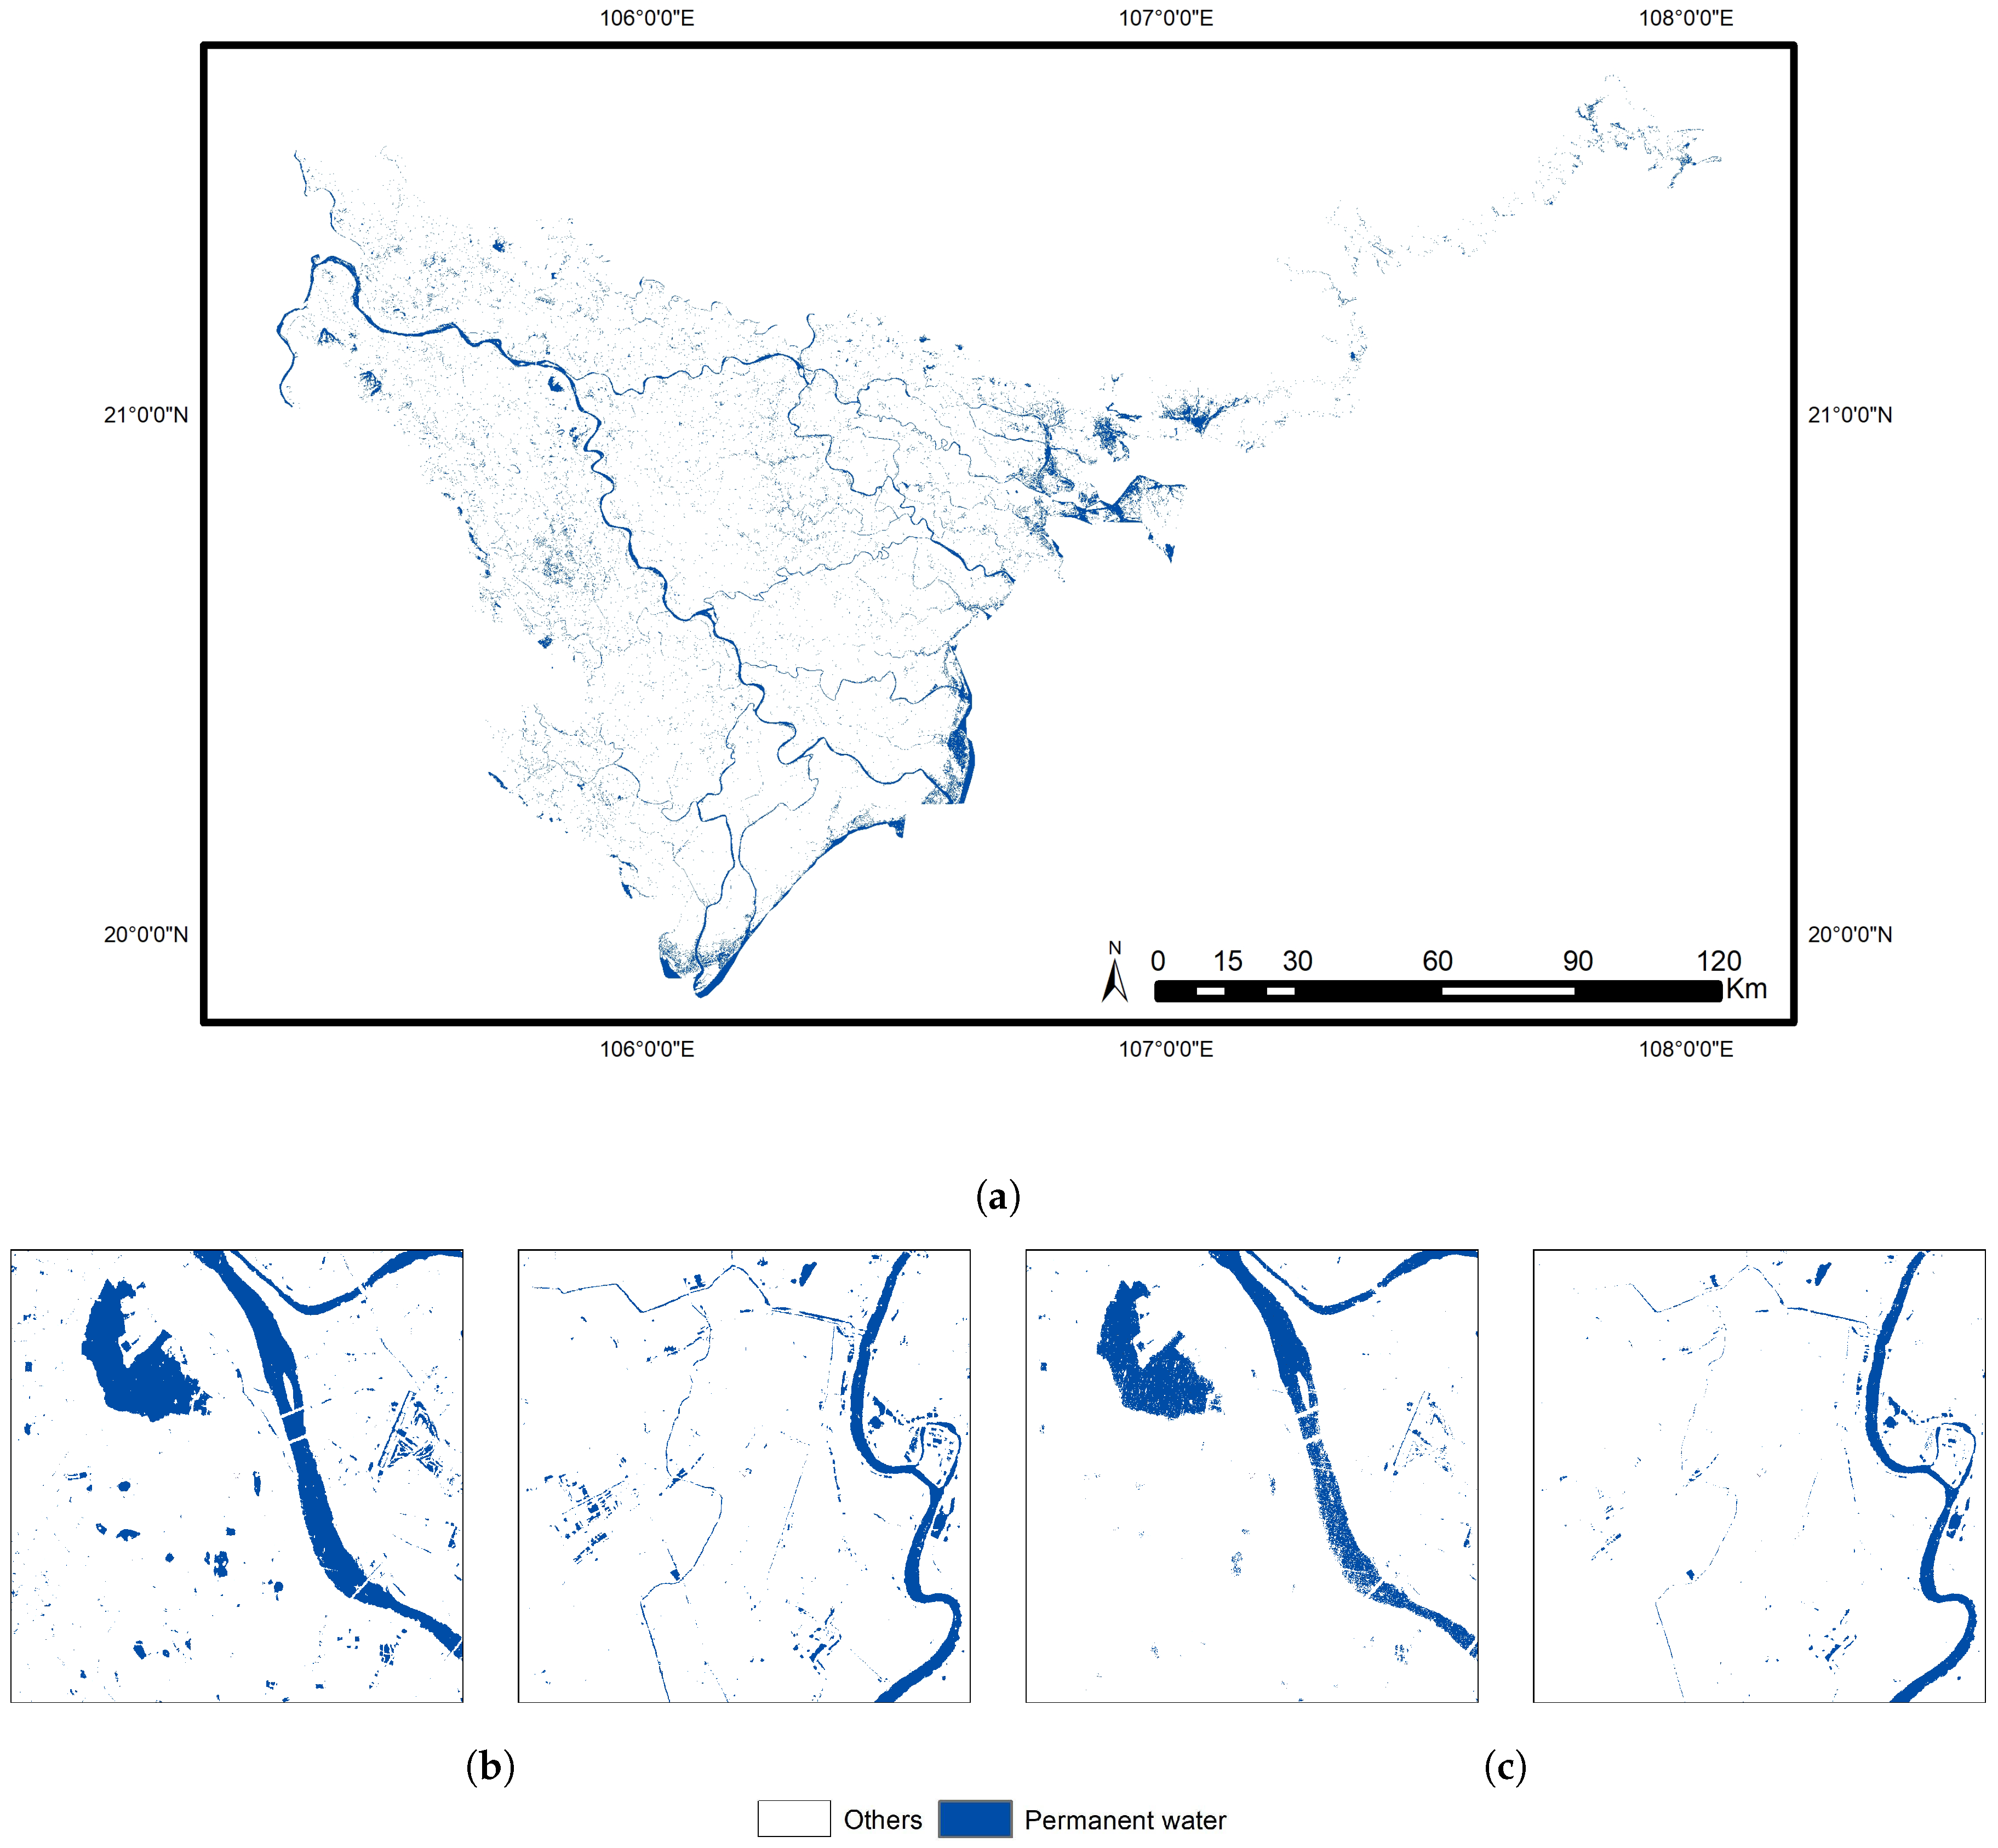
4.3. Permanent Water Mapping
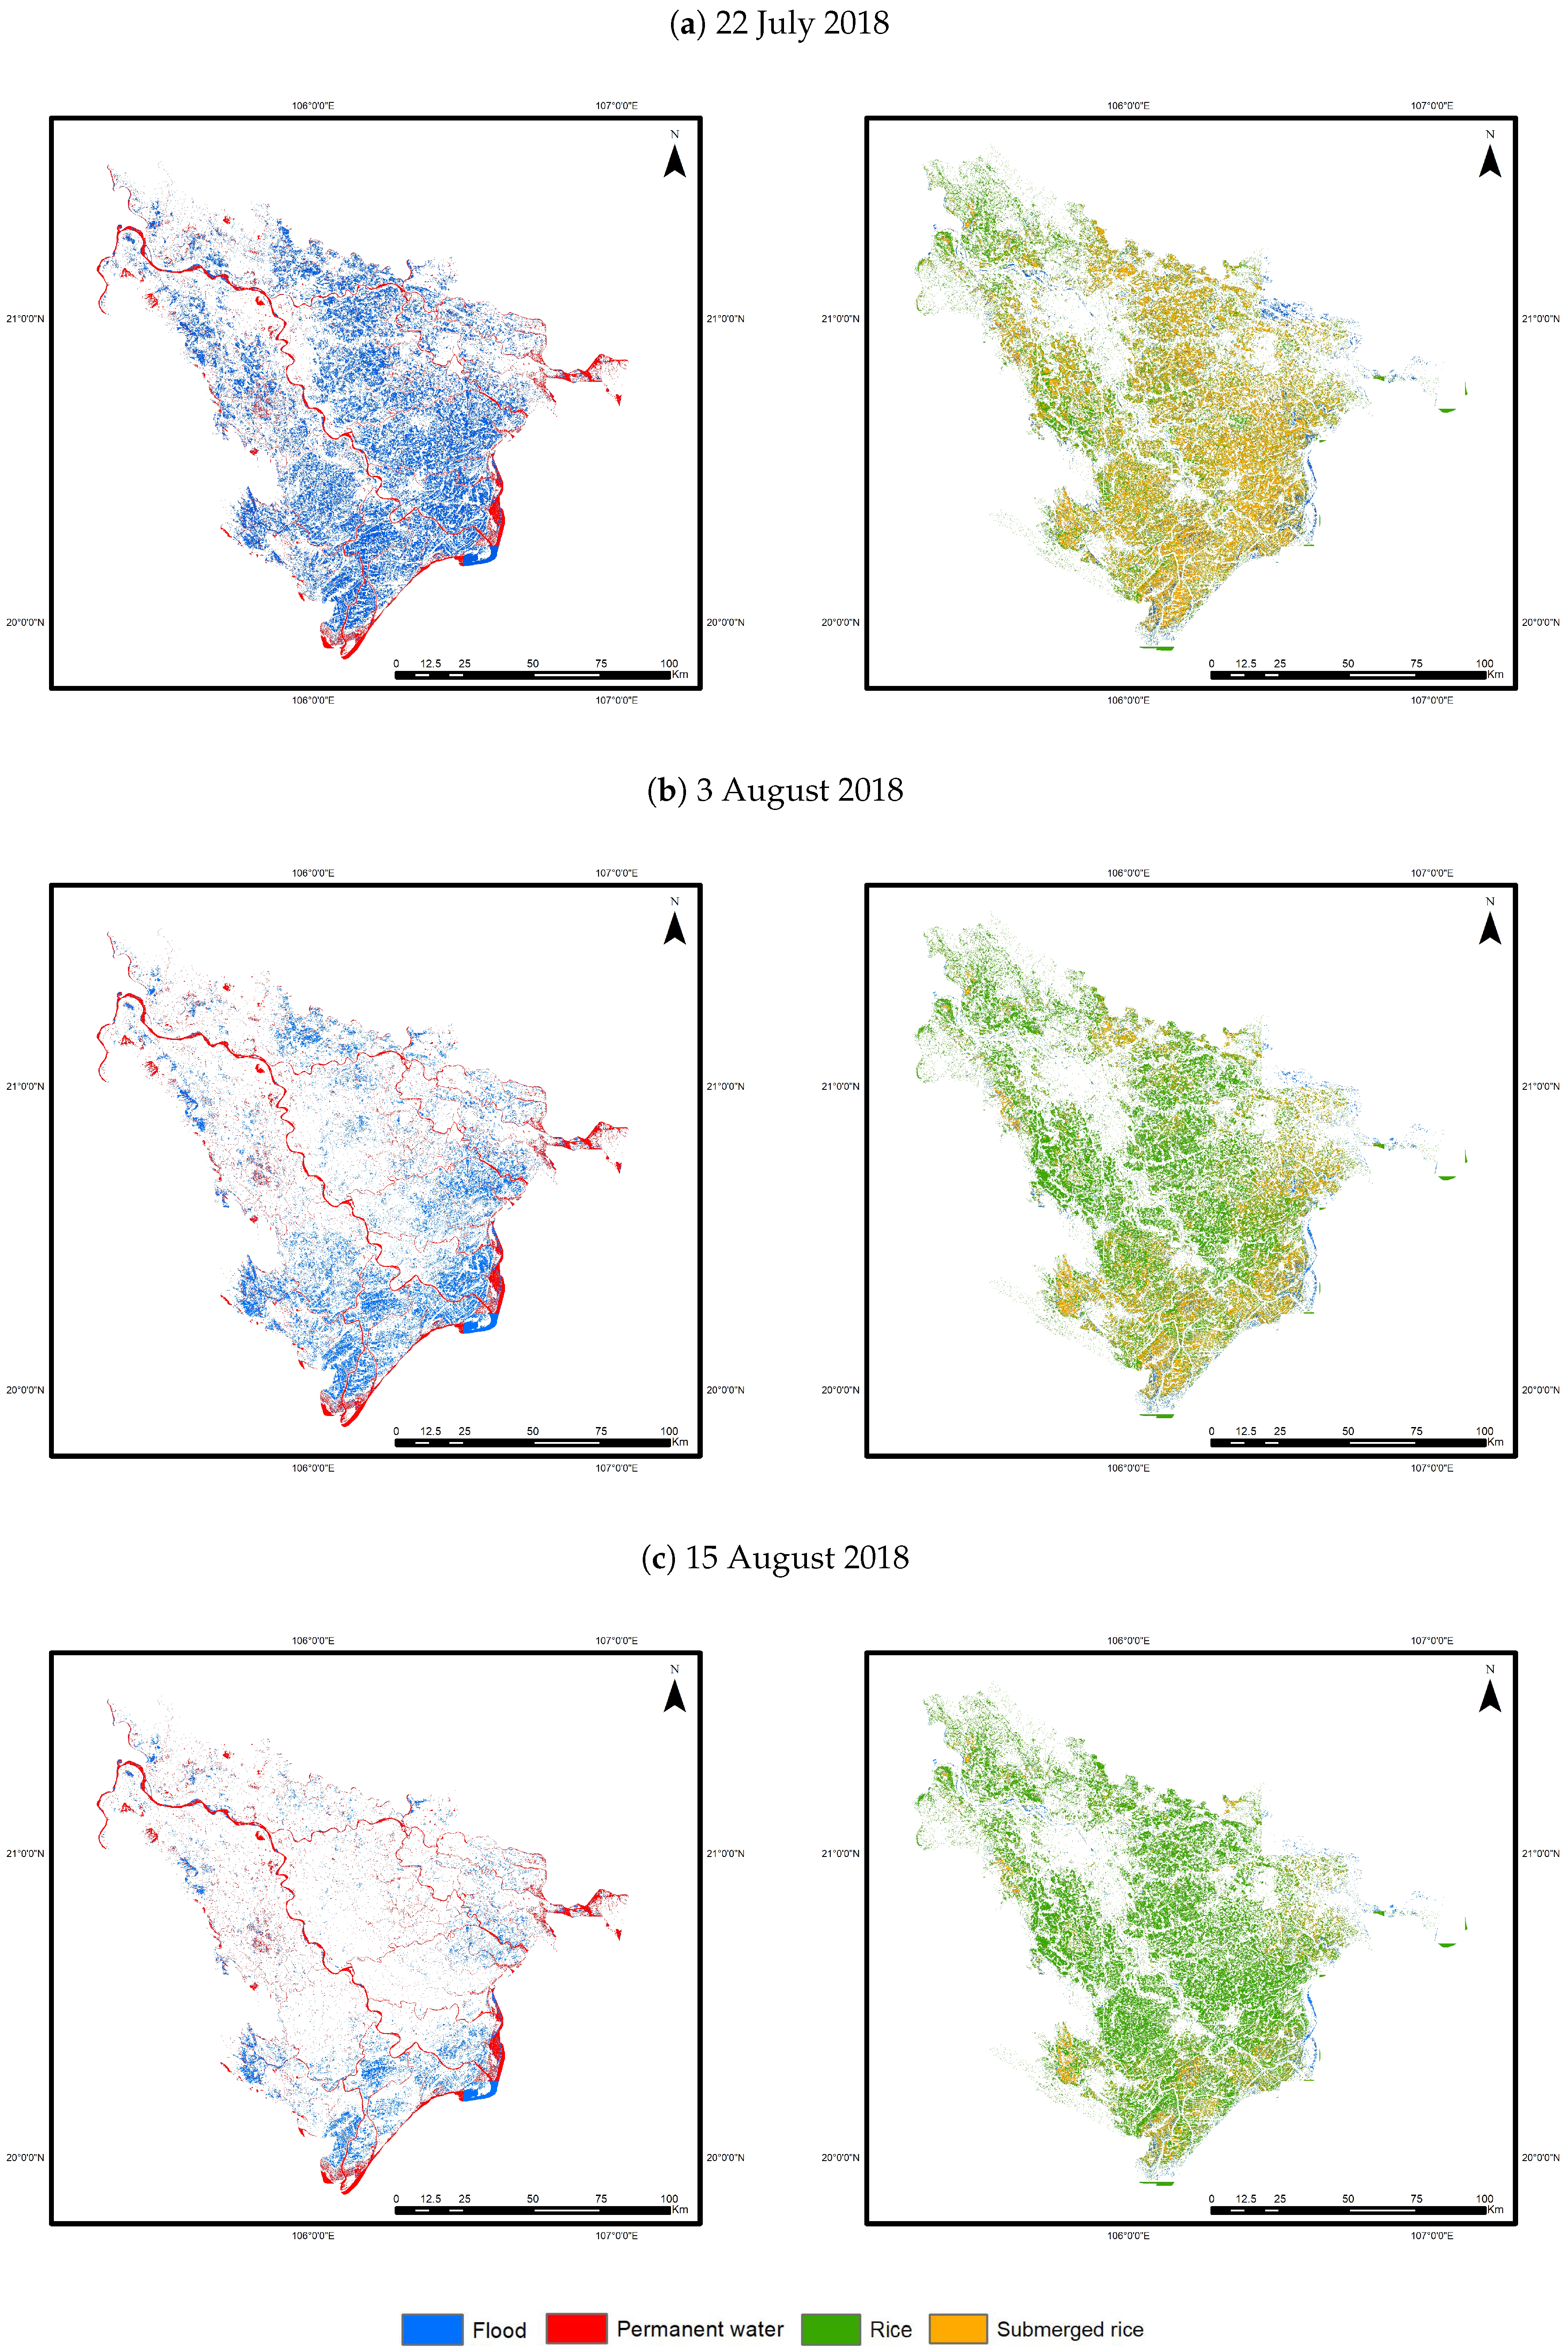
4.4. Submerged Rice Area Estimation
5. Conclusions
Author Contributions
Funding
Acknowledgments
Conflicts of Interest
References
- Vietnamese Rice Successfully Conquers 150 Markets and Eyes More—Web Portal Ministry of Industry and Trade. Available online: http://moit.gov.vn/web/web-portal-ministry-of-industry-and-trade/tin-chi-tiet/-/chi-tiet/vietnamese-rice-successfully-conquers-150-markets-and-eyes-more-13535-1305.html (accessed on 29 May 2019).
- FAOSTAT. Top Countries, Export Quantity of Rice 2016. Available online: http://www.fao.org/faostat/en/#rankings/countries_by_commodity_exports (accessed on 29 May 2019).
- Luu, C.; Von Meding, J.; Kanjanabootra, S. Analysing flood fatalities in Vietnam using national disaster database and tree-based methods. Nat. Hazards Earth Syst. Sci. 2017, 115. [Google Scholar] [CrossRef]
- Wang, J.; Hiroshi, I.; Ning, S.; Khujanazarov, T.; Yin, G.; Guo, L. Attribution analyses of impacts of environmental changes on streamflow and sediment load in a mountainous basin, Vietnam. Forests 2016, 7, 30. [Google Scholar] [CrossRef]
- Fontenelle, J.P. Water management decentralisation in the Red River Delta, Vietnam: An uncompleted transition process towards local governance. Int. J. Water 2001, 1, 380–396. [Google Scholar] [CrossRef]
- Nong, D.H.; Lepczyk, C.A.; Miura, T.; Fox, J.M. Quantifying urban growth patterns in Hanoi using landscape expansion modes and time series spatial metrics. PLoS ONE 2018, 13, e0196940. [Google Scholar] [CrossRef] [PubMed]
- NASA Satellite Shows Son-Tinh’s Swan Song. Available online: https://www.nasa.gov/feature/goddard/2018/son-tinh-northwestern-pacific-ocean (accessed on 29 May 2019).
- General Statistics Office of Vietnam. Agriculture, Forestry and Fishing. Available online: https://www.gso.gov.vn/default_en.aspx?tabid=778 (accessed on 29 May 2019).
- Okamoto, K. Estimation of rice-planted area in the tropical zone using a combination of optical and microwave satellite sensor data. Int. J. Remote Sens. 1999, 20, 1045–1048. [Google Scholar] [CrossRef]
- Le Toan, T.; Ribbes, F.; Wang, L.F.; Floury, N.; Ding, K.H.; Kong, J.A.; Fujita, M.; Kurosu, T. Rice crop mapping and monitoring using ERS-1 data based on experiment and modeling results. IEEE Trans. Geosci. Remote Sens. 1997, 35, 41–56. [Google Scholar] [CrossRef]
- Zhou, Y.; Xiao, X.; Qin, Y.; Dong, J.; Zhang, G.; Kou, W.; Jin, C.; Wang, J.; Li, X. Mapping paddy rice planting area in rice-wetland coexistent areas through analysis of Landsat 8 OLI and MODIS images. Int. J. Appl. Earth Obs. Geoinf. 2016, 46, 1–12. [Google Scholar] [CrossRef]
- Nuarsa, I.W.; Nishio, F.; Hongo, C.; Mahardika, I.G. Using variance analysis of multitemporal MODIS images for rice field mapping in Bali Province, Indonesia. Int. J. Remote Sens. 2012, 33, 5402–5417. [Google Scholar] [CrossRef]
- Xiao, X.; Boles, S.; Liu, J.; Zhuang, D.; Frolking, S.; Li, C.; Salas, W.; Moore, B., III. Mapping paddy rice agriculture in southern China using multi-temporal MODIS images. Remote Sens. Environ. 2005, 95, 480–492. [Google Scholar] [CrossRef]
- Xiao, X.; Boles, S.; Frolking, S.; Li, C.; Babu, J.Y.; Salas, W.; Moore, B., III. Mapping paddy rice agriculture in South and Southeast Asia using multi-temporal MODIS images. Remote Sens. Environ. 2006, 100, 95–113. [Google Scholar] [CrossRef]
- Manfron, G.; Crema, A.; Boschetti, M.; Confalonieri, R. Testing automatic procedures to map rice area and detect phenological crop information exploiting time series analysis of remote sensed MODIS data. In Proceedings of the SPIE Remote Sensing for Agriculture, Ecosystems, and Hydrology XIV, Edinburgh, UK, 24–27 September 2012; Volume 8531, p. 85311E. [Google Scholar]
- Hoang, H.K.; Bernier, M.; Duchesne, S.; Tran, Y.M. Rice mapping using RADARSAT-2 dual-and quad-pol data in a complex land-use Watershed: Cau River Basin (Vietnam). IEEE J. Sel. Top. Appl. Earth Obs. Remote Sens. 2016, 9, 3082–3096. [Google Scholar] [CrossRef]
- Li, Q.; Zhang, H.; Du, X.; Wen, N.; Tao, Q. County-level rice area estimation in southern China using remote sensing data. J. Appl. Remote Sens. 2014, 8, 083657. [Google Scholar] [CrossRef]
- Park, S.; Im, J.; Park, S.; Yoo, C.; Han, H.; Rhee, J. Classification and mapping of paddy rice by combining Landsat and SAR time series data. Remote Sens. 2018, 10, 447. [Google Scholar] [CrossRef]
- Tian, H.; Wu, M.; Wang, L.; Niu, Z. Mapping early, middle and late rice extent using sentinel-1A and Landsat-8 data in the poyang lake plain, China. Sensors 2018, 18, 185. [Google Scholar] [CrossRef] [PubMed]
- Mandal, D.; Kumar, V.; Bhattacharya, A.; Rao, Y.S.; Siqueira, P.; Bera, S. Sen4rice: A processing chain for differentiating early and late transplanted rice using time-series Sentinel-1 SAR data with Google Earth Engine. IEEE Geosci. Remote Sens. Lett. 2018, 12, 1947–1951. [Google Scholar] [CrossRef]
- Clauss, K.; Yan, H.; Kuenzer, C. Mapping paddy rice in China in 2002, 2005, 2010 2014 MODIS Time Ser. Remote Sens. 2016, 8, 434. [Google Scholar] [CrossRef]
- Torbick, N.; Chowdhury, D.; Salas, W.; Qi, J. Monitoring rice agriculture across myanmar using time series Sentinel-1 assisted by Landsat-8 and PALSAR-2. Remote Sens. 2017, 9, 119. [Google Scholar] [CrossRef]
- Sakamoto, T.; Van Phung, C.; Kotera, A.; Nguyen, K.D.; Yokozawa, M. Analysis of rapid expansion of inland aquaculture and triple rice-cropping areas in a coastal area of the Vietnamese Mekong Delta using MODIS time-series imagery. Landsc. Urban Plan. 2009, 92, 34–46. [Google Scholar] [CrossRef]
- Son, N.T.; Chen, C.F.; Chen, C.R.; Duc, H.N.; Chang, L.Y. A phenology-based classification of time-series MODIS data for rice crop monitoring in Mekong Delta, Vietnam. Remote Sens. 2014, 6, 135–156. [Google Scholar] [CrossRef]
- Kontgis, C.; Schneider, A.; Ozdogan, M. Mapping rice paddy extent and intensification in the Vietnamese Mekong River Delta with dense time stacks of Landsat data. Remote Sens. Environ. 2015, 169, 255–269. [Google Scholar] [CrossRef]
- Bouvet, A.; Le Toan, T. Use of ENVISAT/ASAR wide-swath data for timely rice fields mapping in the Mekong River Delta. Remote Sens. Environ. 2011, 115, 1090–1101. [Google Scholar] [CrossRef]
- Nguyen, D.; Clauss, K.; Cao, S.; Naeimi, V.; Kuenzer, C.; Wagner, W. Mapping rice seasonality in the Mekong Delta with multi-year Envisat ASAR WSM data. Remote Sens. 2015, 7, 15868–15893. [Google Scholar] [CrossRef]
- Torbick, N.; Salas, W.; Chowdhury, D.; Ingraham, P.; Trinh, M. Mapping rice greenhouse gas emissions in the Red River Delta, Vietnam. Carbon Manag. 2017, 8, 99–108. [Google Scholar] [CrossRef]
- Chuc, M.D.; Anh, N.H.; Thuy, N.T.; Hung, B.Q.; Thanh, N.T.N. Paddy rice mapping in red river delta region using landsat 8 images: Preliminary results. In Proceedings of the 2017 9th International Conference on Knowledge and Systems Engineering (KSE), Hue, Vietnam, 19–21 October 2017; pp. 209–214. [Google Scholar]
- Lasko, K.; Vadrevu, K.P.; Tran, V.T.; Justice, C. Mapping double and single crop paddy rice with Sentinel-1A at varying spatial scales and polarizations in Hanoi, Vietnam. IEEE J. Sel. Top. Appl. Earth Obs. Remote Sens. 2018, 11, 498–512. [Google Scholar] [CrossRef] [PubMed]
- Hoang, K.H.; Bernier, M.; Duchesne, S.; Tran, M.Y. Classification of rice fields in a complex land-use watershed in Northern Vietnam using RADARSAT-2 data. In Proceedings of the 2014 IEEE Geoscience and Remote Sensing Symposium, Quebec City, QC, Canada, 13–18 July 2014; pp. 1501–1503. [Google Scholar]
- Clauss, K.; Ottinger, M.; Kuenzer, C. Mapping rice areas with Sentinel-1 time series and superpixel segmentation. Int. J. Remote Sens. 2018, 39, 1399–1420. [Google Scholar] [CrossRef]
- Nguyen, D.; Wagner, W.; Naeimi, V.; Cao, S. Rice-planted area extraction by time series analysis of ENVISAT ASAR WS data using a phenology-based classification approach: A case study for Red River Delta, Vietnam. Int. Arch. Photogramm. Remote Sens. Spat. Inf. Sci. 2015, 40, 77. [Google Scholar] [CrossRef]
- Policelli, F.; Slayback, D.; Brakenridge, B.; Nigro, J.; Hubbard, A.; Zaitchik, B.; Carroll, M.; Jung, H. The NASA global flood mapping system. In Remote Sensing of Hydrological Extremes; Springer: Berlin, Germany, 2017; pp. 47–63. [Google Scholar]
- De Groeve, T.; Kugler, Z.; Brakenridge, G.R. Near real time flood alerting for the global disaster alert and coordination system. In Proceedings ISCRAM2007; VUBPRESS Brussels University Press: Brussel, Belgium, 2006; pp. 33–39. [Google Scholar]
- Martinis, S.; Twele, A.; Voigt, S. Towards operational near real-time flood detection using a split-based automatic thresholding procedure on high resolution TerraSAR-X data. Nat. Hazards Earth Syst. Sci. 2009, 9, 303–314. [Google Scholar] [CrossRef]
- Mason, D.C.; Davenport, I.J.; Neal, J.C.; Schumann, G.J.P.; Bates, P.D. Near real-time flood detection in urban and rural areas using high-resolution synthetic aperture radar images. IEEE Trans. Geosci. Remote Sens. 2012, 50, 3041–3052. [Google Scholar] [CrossRef]
- Kuenzer, C.; Guo, H.; Huth, J.; Leinenkugel, P.; Li, X.; Dech, S. Flood mapping and flood dynamics of the Mekong Delta: ENVISAT-ASAR-WSM based time series analyses. Remote Sens. 2013, 5, 687–715. [Google Scholar] [CrossRef]
- Chini, M.; Hostache, R.; Giustarini, L.; Matgen, P. A hierarchical split-based approach for parametric thresholding of SAR images: Flood inundation as a test case. IEEE Trans. Geosci. Remote Sens. 2017, 55, 6975–6988. [Google Scholar] [CrossRef]
- Kotera, A.; Nagano, T.; Hanittinan, P.; Koontanakulvong, S. Assessing the degree of flood damage to rice crops in the Chao Phraya delta, Thailand, using MODIS satellite imaging. Paddy Water Environ. 2016, 14, 271–280. [Google Scholar] [CrossRef]
- Kwak, Y.; Shrestha, B.B.; Yorozuya, A.; Sawano, H. Rapid damage assessment of rice crop after large-scale flood in the cambodian floodplain using temporal spatial data. IEEE J. Sel. Top. Appl. Earth Obs. Remote Sens. 2015, 8, 3700–3709. [Google Scholar] [CrossRef]
- Basha, E.A.; Ravela, S.; Rus, D. Model-based monitoring for early warning flood detection. In Proceedings of the 6th ACM Conference on Embedded Network Sensor Systems, Raleigh, NC, USA, 4–7 November 2008; ACM: New York, NY, USA, 2008; pp. 295–308. [Google Scholar]
- Rennó, C.D.; Nobre, A.D.; Cuartas, L.A.; Soares, J.V.; Hodnett, M.G.; Tomasella, J.; Waterloo, M.J. HAND, a new terrain descriptor using SRTM-DEM: Mapping terra-firme rainforest environments in Amazonia. Remote Sens. Environ. 2008, 112, 3469–3481. [Google Scholar] [CrossRef]
- Nobre, A.D.; Cuartas, L.A.; Hodnett, M.; Rennó, C.D.; Rodrigues, G.; Silveira, A.; Waterloo, M.; Saleska, S. Height Above the Nearest Drainage–a hydrologically relevant new terrain model. J. Hydrol. 2011, 404, 13–29. [Google Scholar] [CrossRef]
- Tehrany, M.S.; Pradhan, B.; Jebur, M.N. Flood susceptibility mapping using a novel ensemble weights-of-evidence and support vector machine models in GIS. J. Hydrol. 2014, 512, 332–343. [Google Scholar] [CrossRef]
- Mojaddadi, H.; Pradhan, B.; Nampak, H.; Ahmad, N.; Ghazali, A.H.B. Ensemble machine-learning-based geospatial approach for flood risk assessment using multi-sensor remote-sensing data and GIS. Geomat. Nat. Hazards Risk 2017, 8, 1080–1102. [Google Scholar] [CrossRef]
- Tehrany, M.S.; Pradhan, B.; Mansor, S.; Ahmad, N. Flood susceptibility assessment using GIS-based support vector machine model with different kernel types. Catena 2015, 125, 91–101. [Google Scholar] [CrossRef]
- Ireland, G.; Volpi, M.; Petropoulos, G. Examining the capability of supervised machine learning classifiers in extracting flooded areas from Landsat TM imagery: A case study from a Mediterranean flood. Remote Sens. 2015, 7, 3372–3399. [Google Scholar] [CrossRef]
- Rokni, K.; Ahmad, A.; Selamat, A.; Hazini, S. Water feature extraction and change detection using multitemporal Landsat imagery. Remote Sens. 2014, 6, 4173–4189. [Google Scholar] [CrossRef]
- Huang, X.; Wang, C.; Li, Z. A near real-time flood-mapping approach by integrating social media and post-event satellite imagery. Ann. GIS 2018, 24, 113–123. [Google Scholar] [CrossRef]
- Rosser, J.F.; Leibovici, D.; Jackson, M. Rapid flood inundation mapping using social media, remote sensing and topographic data. Nat. Hazards 2017, 87, 103–120. [Google Scholar] [CrossRef]
- Amitrano, D.; Di Martino, G.; Iodice, A.; Riccio, D.; Ruello, G. Unsupervised rapid flood mapping using Sentinel-1 GRD SAR images. IEEE Trans. Geosci. Remote Sens. 2018, 56, 3290–3299. [Google Scholar] [CrossRef]
- Notti, D.; Giordan, D.; Caló, F.; Pepe, A.; Zucca, F.; Galve, J. Potential and limitations of open satellite data for flood mapping. Remote Sens. 2018, 10, 1673. [Google Scholar] [CrossRef]
- Dao, P.; Liou, Y.A. Object-based flood mapping and affected rice field estimation with Landsat 8 OLI and MODIS data. Remote Sens. 2015, 7, 5077–5097. [Google Scholar] [CrossRef]
- Emergency Management Service—Mapping. Available online: https://floodmap.modaps.eosdis.nasa.gov/ (accessed on 30 July 2019).
- NRT Global Flood Mapping. Available online: https://emergency.copernicus.eu/mapping/list-of-activations-rapid (accessed on 30 July 2019).
- Mountrakis, G.; Im, J.; Ogole, C. Support vector machines in remote sensing: A review. ISPRS J. Photogramm. Remote Sens. 2011, 66, 247–259. [Google Scholar] [CrossRef]
- Cortes, C.; Vapnik, V. Support-vector networks. Mach. Learn. 1995, 20, 273–297. [Google Scholar] [CrossRef]
- Schumann, G.; Di Baldassarre, G.; Alsdorf, D.; Bates, P. Near real-time flood wave approximation on large rivers from space: Application to the River Po, Italy. Water Resour. Res. 2010, 46. [Google Scholar] [CrossRef]
- Man, C.D.; Nguyen, T.T.; Bui, H.Q.; Lasko, K.; Nguyen, T.N.T. Improvement of land-cover classification over frequently cloud-covered areas using Landsat 8 time-series composites and an ensemble of supervised classifiers. Int. J. Remote Sens. 2018, 39, 1243–1255. [Google Scholar] [CrossRef]
- Liu, C. Analysis of Sentinel-1 SAR Data for Mapping Standing Water in the Twente Region. Master’s Thesis, University of Twente, Twente, The Netherlands, February 2016. Available online: http://www.itc.nl/library/papers_2016/msc/wrem/cliu.pdf (accessed on 27 August 2019).
- Baghdadi, N.; El Hajj, M.; Zribi, M.; Bousbih, S. Calibration of the water cloud model at C-band for winter crop fields and grasslands. Remote Sens. 2017, 9, 969. [Google Scholar] [CrossRef]
- Otsu, N. A threshold selection method from gray-level histograms. IEEE Trans. Syst. Man, Cybern. 1979, 9, 62–66. [Google Scholar] [CrossRef]
- Vincent, L. Morphological Grayscale Reconstruction in Image Analysis: Applications and E cient Algorithms. IEEE Trans. Image Process. 1993, 2, 176–201. [Google Scholar] [CrossRef] [PubMed]
- Shuttle Radar Topography Mission 1 Arc-Second Global: SRTM1N22W016V3. Available online: https://earthexplorer.usgs.gov/fgdc/8360/SRTM1N22W016V3/ (accessed on 29 May 2019).
- Flooding Situation in Chuong My. Available online: http://www.antv.gov.vn/tin-tuc/xa-hoi/tinh-hinh-ngap-lut-tai-chuong-my-244134.html (accessed on 29 May 2019).
- Nho Quan Concentrates Forces to Respond to Heavy Rain and Flood. Available online: http://ninhbinh.gov.vn/ubnd-ninhbinh/4/469/39067/96803/Tin-noi-bat/Nho-Quan-tap-trung-luc-luong-ung-pho-voi-mua–lu.aspx (accessed on 29 May 2019).
- Wang, Y.; Hess, L.L.; Filoso, S.; Melack, J.M. Understanding the radar backscattering from flooded and nonflooded Amazonian forests: Results from canopy backscatter modeling. Remote Sens. Environ. 1995, 54, 324–332. [Google Scholar] [CrossRef]
- Manavalan, R.; Rao, Y.; Krishna Mohan, B. Comparative flood area analysis of C-band VH, VV, and L-band HH polarizations SAR data. Int. J. Remote Sens. 2017, 38, 4645–4654. [Google Scholar] [CrossRef]
- Solbø, S.; Solheim, I. Towards operational flood mapping with satellite SAR. In Proceedings of the 2004 Envisat & ERS Symposium, Salzburg, Austria, 6–10 September 2004. ESA SP-572, April 2005. [Google Scholar]
- Twele, A.; Cao, W.; Plank, S.; Martinis, S. Sentinel-1-based flood mapping: A fully automated processing chain. Int. J. Remote Sens. 2016, 37, 2990–3004. [Google Scholar] [CrossRef]
- Xing, L.; Tang, X.; Wang, H.; Fan, W.; Wang, G. Monitoring monthly surface water dynamics of Dongting Lake using Sentinel-1 data at 10 m. PeerJ 2018, 6, e4992. [Google Scholar] [CrossRef] [PubMed]
- Duy, N.B. Automatic detection of surface water bodies from Sentinel-1 SAR images using Valley-Emphasis method. Vietnam J. Earth Sci. 2015, 37, 328–343. [Google Scholar] [CrossRef]
- Vala, H.J.; Baxi, A. A review on Otsu image segmentation algorithm. Int. J. Adv. Res. Comput. Eng. Technol. (IJARCET) 2013, 2, 387–389. [Google Scholar]


| Area | Production (Thousands of Tons) | ||||
|---|---|---|---|---|---|
| 2013 | 2014 | 2015 | 2016 | 2017 | |
| Red River Delta | 6655 | 6759 | 6729 | 6545 | 6083 |
| Northern Midlands and Mountainous | 3265 | 3341 | 3336 | 3405 | 3336 |
| North Central Coast | 6599 | 7034 | 6855 | 6842 | 6997 |
| Mekong River Delta | 25,021 | 25,245 | 25,583 | 23,831 | 23,633 |
| Duration | RoN | Number of Images | Channel | Product Type | Tasks |
|---|---|---|---|---|---|
| 1 February 2018–31 May 2018 | 91 and 55 | 10 | VV, VH | GRD | Rice mapping for winter-spring season |
| 1 January 2018–31 December 2018 | 91 and 55 | 31 | VV | GRD | Permanent water map |
| 1 July 2018–30 October 2018 | 91 and 55 | 9 | VH | GRD | Flood map and flood frequency map |
| Class | Mean | STD | Max | Min | Diff | |||||
|---|---|---|---|---|---|---|---|---|---|---|
| VV | VH | VV | VH | VV | VH | VV | VH | VV | VH | |
| Forest | −7.89 | −13.97 | 0.33 | 0.41 | −7.24 | −13.29 | −8.67 | −14.77 | −1.43 | −1.47 |
| Rice | −10.73 | −18.21 | 2.60 | 3.67 | −7.11 | −13.89 | −17.16 | −26.46 | −10.06 | −12.57 |
| Urban | −4.20 | −12.02 | 0.40 | 0.25 | −3.32 | −11.45 | −4.92 | −12.47 | −1.60 | −1.02 |
| Bare land | −10.09 | −16.34 | 0.78 | 0.82 | −9.00 | −15.02 | −12.65 | −19.28 | −3.65 | −4.27 |
| Water | −18.95 | −27.43 | 0.96 | 1.01 | −16.97 | −24.76 | −21.37 | −28.56 | −4.40 | −3.80 |
| Data | OA(%) | F1—Rice | F1—Non-Rice | F1—Average | Kappa |
|---|---|---|---|---|---|
| VV Time-series | 82.90 | 0.77 | 0.86 | 0.83 | 0.64 |
| VH Time-series | 88.48 | 0.85 | 0.91 | 0.88 | 0.76 |
| Time-series | 78.40 | 0.73 | 0.82 | 0.78 | 0.55 |
| VVVH Time-series | 90.50 | 0.87 | 0.92 | 0.90 | 0.80 |
| Data | Measures | Rice | Non-Rice |
|---|---|---|---|
| VV Time-series | Precision | 0.81 | 0.74 |
| Recall | 0.84 | 0.89 | |
| VH Time-series | Precision | 0.86 | 0.90 |
| Recall | 0.85 | 0.91 | |
| Time-series | Precision | 0.71 | 0.83 |
| Recall | 0.75 | 0.81 | |
| VVVH Time-series | Precision | 0.91 | 0.90 |
| Recall | 0.84 | 0.94 |
| Province/City | Statistical Area (ha) | Predicted Area (ha) | Diff(ha) | Diff(%) |
|---|---|---|---|---|
| Thai Binh | 79,319 | 80,320 | 1001 | 1.26 |
| Quang Ninh | 16,500 | 27,165 | 10,665 | 64.64 |
| Vinh Phuc | 30,837 | 29,574 | −1263 | −4.09 |
| Bac Ninh | 37,890 | 34,306 | −3584 | −9.40 |
| Ha Noi | 93,314 | 90,675 | −2639 | −2.82 |
| Nam Đinh | 73,936 | 78,868 | 4932 | 6.67 |
| Ninh Binh | 40,600 | 44,615 | 4015 | 9.88 |
| Hai Phong | 34,163 | 34,355 | 192 | 0.56 |
| Hung Yen | 33,374 | 32,433 | −941 | −2.81 |
| Hai Duong | 58,464 | 56,449 | −2015 | −3.44 |
| Ha Nam | 31,270 | 33,451 | 2181 | 6.97 |
| Total | 529,667 | 542,211 | 12,544 | −2.37 |
| Source | Year | Study Area | Data Type | Mapped Data (ha) | Statistical Data (ha) | Diff(ha) | Method | OA(%) |
|---|---|---|---|---|---|---|---|---|
| [29] | 2013 | RRD excludes QN | Optical | 550,100 | 594,524 | 44,424 | XGBoost | 91.53 |
| 2014 | 546,600 | 593,706 | 47,106 | 90.74 | ||||
| 2015 | 542,100 | 580,361 | 38,216 | 90.48 | ||||
| 2016 | 522,496 | 603,050 | 80,554 | 89.42 | ||||
| [30] | 2016 | VP. HY. BN. HN1. HN2 | SAR | 216,784 | 235,700 | 18,916 | RF | 93.50 |
| [33] | 2007–2011 | RRD excludes QN | SAR | 1,182,600 | 1,115,100 | 67,500 | Threshold-based | 83.90 |
| Ours | 2018 | RRD | SAR | 542,211 | 529,667 | 12,544 | SVM | 90.50 |
| OA(%) | F1—Water | F1—Non-Water | Kappa |
|---|---|---|---|
| 90.94 | 0.88 | 0.93 | 0.81 |
| Measures | Water | Non-Water |
|---|---|---|
| Precision | 0.80 | 0.99 |
| Recall | 0.98 | 0.87 |
| Location | Mapped Data (ha) | Affected Rice Map Date | Statistical Data (ha) | Reported Date | Diff (ha) |
|---|---|---|---|---|---|
| Tien Du | 3019 | 22 July 2018 | 1500 | 21 July 2018 | 1519 |
| Thuan Thanh | 4014 | 2900 | 1114 | ||
| Luong Tai | 3375 | 2000 | 1375 | ||
| Tien Hai | 2379 | 15 August 2018 | >2000 | 29 August 2018 | <2676 |
| Thai Thuy | 411 | ||||
| Kien Xuong | 1886 | ||||
| Ha Noi | 12,069 | 3 August 2018 | 7983 | 23 August 2018 | 4086 |
| Nam Dinh | 38,373 | 3 August 2018 | 31,762 | Before 8 August 2018 | 6611 |
| Ninh Binh | 26,797 | 22 July 2018 | 6931 | 3 August 2018 | 19,866 |
| Affected Rice Area by Flooding Caused by the Son-Tinh Storm Landing in RRD Region | |||||||
|---|---|---|---|---|---|---|---|
| Province | Rice Area | 22 July 2018 | 3 August 2018 | 15 August 2018 | |||
| Ha | % | Ha | % | Ha | % | ||
| Bac Ninh | 34,306 | 23,103 | 67.3 | 10,070 | 29.3 | 1728 | 5 |
| Hai Duong | 56,449 | 3220 | 5.7 | 9031 | 16 | 2709 | 4.8 |
| Hai Phong | 34,355 | 20,087 | 58.4 | 16,832 | 49 | 7773 | 22.6 |
| Ha Nam | 33,451 | 15,912 | 47.5 | 4454 | 13.3 | 515 | 1.5 |
| Ha Noi | 90,675 | 37,961 | 41.8 | 12,069 | 13.3 | 6411 | 7 |
| Hung Yen | 32,433 | 17,385 | 53.6 | 2227 | 6.9 | 404 | 1.2 |
| Nam Dinh | 78,868 | 55,786 | 70.7 | 38,373 | 48.6 | 17,514 | 22.2 |
| Ninh Binh | 44,615 | 26,797 | 60.1 | 23,408 | 52.5 | 12,578 | 28.1 |
| Thai Binh | 80,320 | 55,730 | 69.4 | 23,110 | 28.7 | 5315 | 6.6 |
| Vinh Phuc | 29,574 | 4990 | 16.9 | 2480 | 8.4 | 2396 | 8.1 |
| Quang Ninh | 27,165 | - | - | - | - | - | - |
| Total | 542,211 | 260,971 | 48 | 142,054 | 26 | 57,343 | 10.6 |
© 2019 by the authors. Licensee MDPI, Basel, Switzerland. This article is an open access article distributed under the terms and conditions of the Creative Commons Attribution (CC BY) license (http://creativecommons.org/licenses/by/4.0/).
Share and Cite
Phan, A.; N. Ha, D.; D. Man, C.; T. Nguyen, T.; Q. Bui, H.; T. N. Nguyen, T. Rapid Assessment of Flood Inundation and Damaged Rice Area in Red River Delta from Sentinel 1A Imagery. Remote Sens. 2019, 11, 2034. https://doi.org/10.3390/rs11172034
Phan A, N. Ha D, D. Man C, T. Nguyen T, Q. Bui H, T. N. Nguyen T. Rapid Assessment of Flood Inundation and Damaged Rice Area in Red River Delta from Sentinel 1A Imagery. Remote Sensing. 2019; 11(17):2034. https://doi.org/10.3390/rs11172034
Chicago/Turabian StylePhan, Anh, Duong N. Ha, Chuc D. Man, Thuy T. Nguyen, Hung Q. Bui, and Thanh T. N. Nguyen. 2019. "Rapid Assessment of Flood Inundation and Damaged Rice Area in Red River Delta from Sentinel 1A Imagery" Remote Sensing 11, no. 17: 2034. https://doi.org/10.3390/rs11172034
APA StylePhan, A., N. Ha, D., D. Man, C., T. Nguyen, T., Q. Bui, H., & T. N. Nguyen, T. (2019). Rapid Assessment of Flood Inundation and Damaged Rice Area in Red River Delta from Sentinel 1A Imagery. Remote Sensing, 11(17), 2034. https://doi.org/10.3390/rs11172034