Article

Study of a High Spectral Resolution Hyperspectral LiDAR in Vegetation Red Edge Parameters Extraction

1
Center of Excellence of Laser Scanning Research, Finnish Geospatial Research Institute, Masala FI-02430, Finland
2
Key Laboratory of Quantitative Remote Sensing Information Technology, Chinese Academy of Sciences, Beijing 100094, China
3
Electronic Information School, Wuhan University, Wuhan 430079, China
4
School of Automation, Nanjing University of Science and Technology, Nanjing 210094, China
5
Department of Electronics Engineering, Anhui Jianzhu University, Hefei 230601, China
6
Department of Communication and Information Engineering, Shanghai Polytechnic University, Shanghai 200216, China
*
Author to whom correspondence should be addressed.
Remote Sens. 2019, 11(17), 2007; https://doi.org/10.3390/rs11172007
Submission received: 3 July 2019 / Revised: 18 August 2019 / Accepted: 22 August 2019 / Published: 26 August 2019
(This article belongs to the Special Issue Hyperspectral Remote Sensing of Agriculture and Vegetation)

Abstract

:
Non-contact and active vegetation or plant parameters extraction using hyperspectral information is a prospective research direction among the remote sensing community. Hyperspectral LiDAR (HSL) is an instrument capable of acquiring spectral and spatial information actively, which could mitigate the environmental illumination influence on the spectral information collection. However, HSL usually has limited spectral resolution and coverage, which is vital for vegetation parameter extraction. In this paper, to broaden the HSL spectral range and increase the spectral resolution, an Acousto-optical Tunable Filter based Hyperspectral LiDAR (AOTF-HSL) with 10 nm spectral resolution, consecutively covering from 500–1000 nm, was designed. The AOTF-HSL was employed and evaluated for vegetation parameters extraction. “Red Edge” parameters of four different plants with green and yellow leaves were extracted in the lab experiments for evaluating the HSL vegetation parameter extraction capacity. The experiments were composed of two parts. Firstly, the first-order derivative of the spectral reflectance was employed to extract the “Red Edge” position (REP), “Red Edge” slope (RES) and “Red Edge” area (REA) of these green and yellow leaves. The results were compared with the referenced value from a standard SVC© HR-1024 spectrometer for validation. Green leaf parameter differences between HSL and SVC results were minor, which supported that notion the HSL was practical for extracting the employed parameter as an active method. Secondly, another two different REP extraction methods, Linear Four-point Interpolation technology (LFPIT) and Linear Extrapolation technology (LET), were utilized for further evaluation of using the AOTF-HSL spectral profile to determine the REP value. The differences between the plant green leaves’ REP results extracted using the three methods were all below 10%, and the some of them were below 1%, which further demonstrated that the spectral data collected from HSL with this spectral range and resolution settings was applicable for “Red Edge” parameters extraction.

1. Introduction

The remote sensing community has demonstrated the effectiveness of hyperspectral imagers and LiDAR to obtain spectral and spatial information [1,2,3,4,5]. The hyperspectral imager is capable of obtaining consecutive and abundant spectral profiles of targets, which has been employed in vegetation parameter extraction, food production prediction, target classification, etc. [1,2,3,4,5]. However, the hyperspectral imager relies on environmental illumination conditions, so poor lighting will affect the hyperspectral information acquisition. LiDAR is an active sensor invented to acquire spatial information. In LiDAR a laser source emits monochromatic laser beams to a target, and thus, the ranging information is obtained through measuring the travel time of the laser beam [6,7]. With a scanning operation, LiDAR is able to obtain spatial information from the environment. Besides this, the power of the reflected signal from the target in LiDAR can be obtained with ranging operation. With careful calibration, the power of the reflected signal is measured and termed as intensity. Researchers have carried out some investigations using the intensity of a single wavelength to obtain some textures of the targets, for instance, rock analysis in outcrop models, landcover classification, etc. [1,2,3,4,5,6,7,8].
Restricted by the monochromatic laser source, intensity information of the back-scattered laser pulse or the spectral information from a traditional single wavelength LiDAR is much less efficient than a passive spectrometer [9,10,11]. Recently, two approaches were investigated for the fusion of spatial and spectral data. The first approach ias to combine spectral and spatial data from two standalone instruments into the same framework, and this method was employed in forest area classification, urban species classification, automatic building extraction, and outcrop analysis [12,13,14,15,16,17,18]. The disadvantage is that the data registration is complicated and time-consuming, and the coordinate transformation between the two instruments will probably introduce additional errors [12,13,14,15,16,17,18].
The second approach refers to the integration of ranging with spectral measuring functions into a single sensor or instrument. Hyperspectral LiDAR (HSL) or Multispectral LiDAR (MSL) were developed as active sensors to obtain spectral and spatial information simultaneously. Basically, there are two solutions to develop an HSL or MSL. The first solution is to combine several monochromatic laser sources of different wavelengths together. Since more channels mean more laser sources at different spectral wavelengths, it was hard to combine tens or hundreds of monochromatic laser sources together in this framework [19,20,21]. The second solution is to develop the HSL through employing a super-continuum (SC) laser source replacing the above monochromatic laser sources of different wavelengths, and the SC laser source is able to emit ultra-wideband coherent laser transmissions with spectral ranging from approximately 400 nm to 2500 nm [19,20,21]. Scientists from the Finnish Geospatial Research Institute (FGI) proposed the SC laser source-based spectral measurement concept in 2007 [22]. The first results with the prototype instrument were presented with a discussion of improvements and applications in laser-based hyperspectral remote sensing [22]. Further, in 2010, a two-channel multispectral LiDAR with 600 nm and 800 nm spectral wavelengths was developed and demonstrated, which was capable of distinguishing between a vegetation target (Norway spruce) and inorganic material using the Normalized Difference Vegetation Index (NDVI) parameter [23]. In 2012, the first full-waveform HSL with eight spectral channels was constructed by FGI. The novel instrument produced 3D point clouds with spectral back-scattered reflectance data [24]. Then, HSL was investigated in vegetation content estimation, leaf level chlorophyll estimation, leaf biochemical content estimation, landcover classification, and artificial object classification [25,26,27,28,29,30]. However, compared with the hyperspectral imager, these HSLs had restricted and discrete spectral bands and channels. For broadening the applications of HSL, attention should be paid to develop a HSL enabling continuous spectral band collection with higher spectral resolution [31,32,33].
As an active instrument to acquire abundant spectral profiles, HSL usually has limited spectral bands and coverage, and a more universal and practical HSL with fine spectral resolution and coverage is of great significance for non-contact and active vegetation parameter extraction. Motivated by this, in this paper, an Acousto-optical Tunable Filter HSL (AOTF-HSL) with 10 nm spectral resolution covering 500–1000 nm was developed, and the HSL was evaluated by comparing the selected “Red Edge” (RE) vegetation parameter-related results from AOTF-HSL with those obtained using an SVC HR-1024 spectrometer.
In this research, leaves from four different plants were measured to evaluate the capacity of using the spectral from the AOTF-HSL for vegetation RE-related parameter extraction. In the vegetation research community, the important “Red Edge” position (REP) parameter is closely related to various physical and chemical parameters of vegetation, and it is commonly employed to indicate the growing states of the vegetation and monitor the plant activity [34,35]. Thus, the RE related parameters were selected as the representative for evaluating the HSL in vegetation applications. As shown in Figure 1, REP refers to the position of an inflection point of the first derivative of reflectance values, and it usually locates in the red spectrum band [33,34,35,36]. REP result comparison between the HSL and SVC spectrometer could provide a preliminary evaluation of the utility of HSL in vegetation parameter extraction.
In addition, three most common used methods (First-order Reflectance Slope (FRS), Linear Four-point Interpolation technology (LFPIT) and Linear Extrapolation technology (LET)) were investigated in this research for fully and furtherly evaluating the HSL capacity in spectral profiles acquirement and vegetation parameters extraction.
The contribution of this paper was summarized as follows:
  • This paper presents a more universal and applicable HSL with high spectral resolution to obtain vegetation spectral profiles, and three different RE position extraction methods were firstly employed for addressing the acquired HSL spectral profiles;
  • This paper is just the beginning of using the high spectral resolution HSL for vegetation index detection, which might inspire estimation of other vegetation parameters or biochemical content using this advanced HSL.
The remainder of this paper is organized as follows: Section 2 presents the system design of the AOTF-HSL and the REP determination methods in detail; Section 3 presents the results and analysis of the laboratory experiments concerning the RE-related parameters measurements, result comparisons between different methods and the analysis; and then the conclusions are drawn in Section 4.

2. Materials and Methods

This section is divided into two subsections, the first subsection is the AOTF-HSL design, components and description; and the second subsection presents the REP determination methods, including the calculation equations.

2.1. AOTF-HSL Design and Components

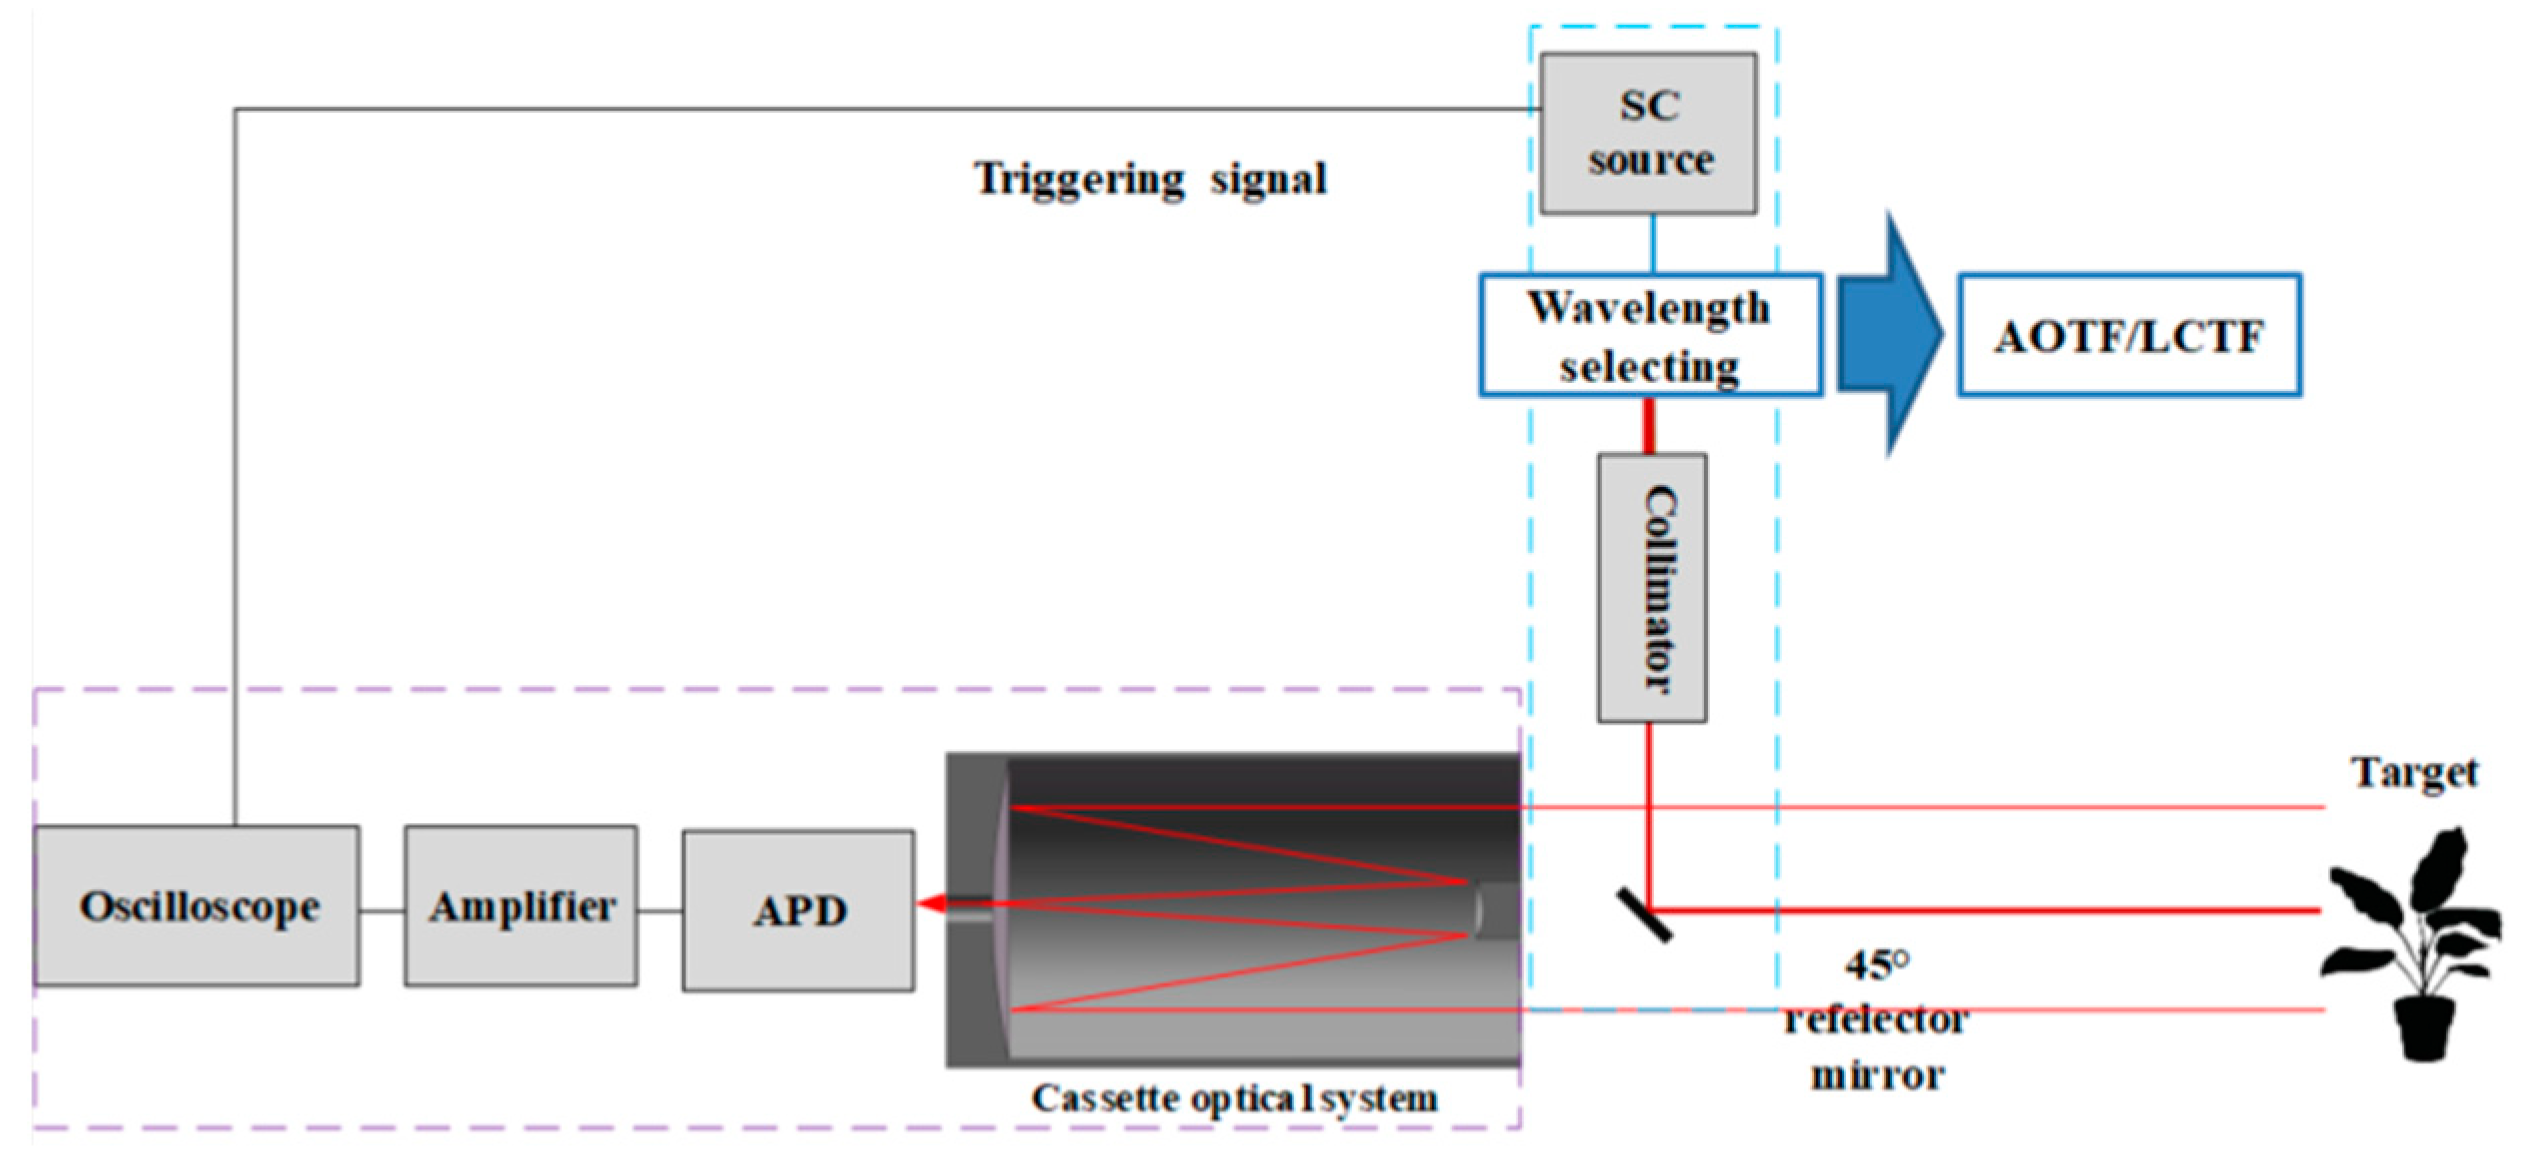
Figure 1 presents the design and diagram of the AOTF-HSL, which employs a super-continuum (SC) laser source covering 450–2350 nm. Figure 2 presents the relationship between the wavelength and power density of the employed SC laser source. An AOTF is installed in front of the SC source. AOTF is capable of consciously selecting and filtering laser beam with 10 nm spectral resolutions from 430–1450 nm. After the laser beam passing through AOTF, the emitted broadband laser beam is collimated and then reflected towards the target by a reflecting mirror. A Cassegrain telescope optical system is employed to collect the energy of the reflected laser pulses from the targets. An APD sensor module with an integrated amplifier is placed on the focal point of the Cassegrain telescope to collect the back-scattered laser echoes and transform them to electronic signals, which are sampled and recorded by a linked high-speed oscilloscope (20 GHz sampling rate, which equals 7.5 mm range resolution). Spectral information can be extracted from the recorded raw waveform. Meanwhile, the triggering signal indicating the emission of SC source is collected by the linked high-speed oscilloscope. Distance information is obtained by measuring the time difference between the triggering signal and reflected signal from the target. More details on the spectral and ranging information acquiring capacity could be found in our recent paper [32]. The remainder of this section will present the specifications of different parts of the AOTF-HSL.

2.1.1. SC Source

In order to increase the spectral range of the AOTF-HSL, SC source (Figure 2) employed in this paper is with a large single pulse energy (>19 uJ) and the pulse width is two nanoseconds with power density distribution shown in Figure 3. The total power of the selected SC model is more than 8W, and the M2 factor of SC source is better than 1.1 with a 200 MHz maximum repeating rates. With such a powerful laser source, the effective range of AOTF-HSL is improved to several tens meters based on the previous experiments [32].

2.1.2. AOTF vs. LCTF

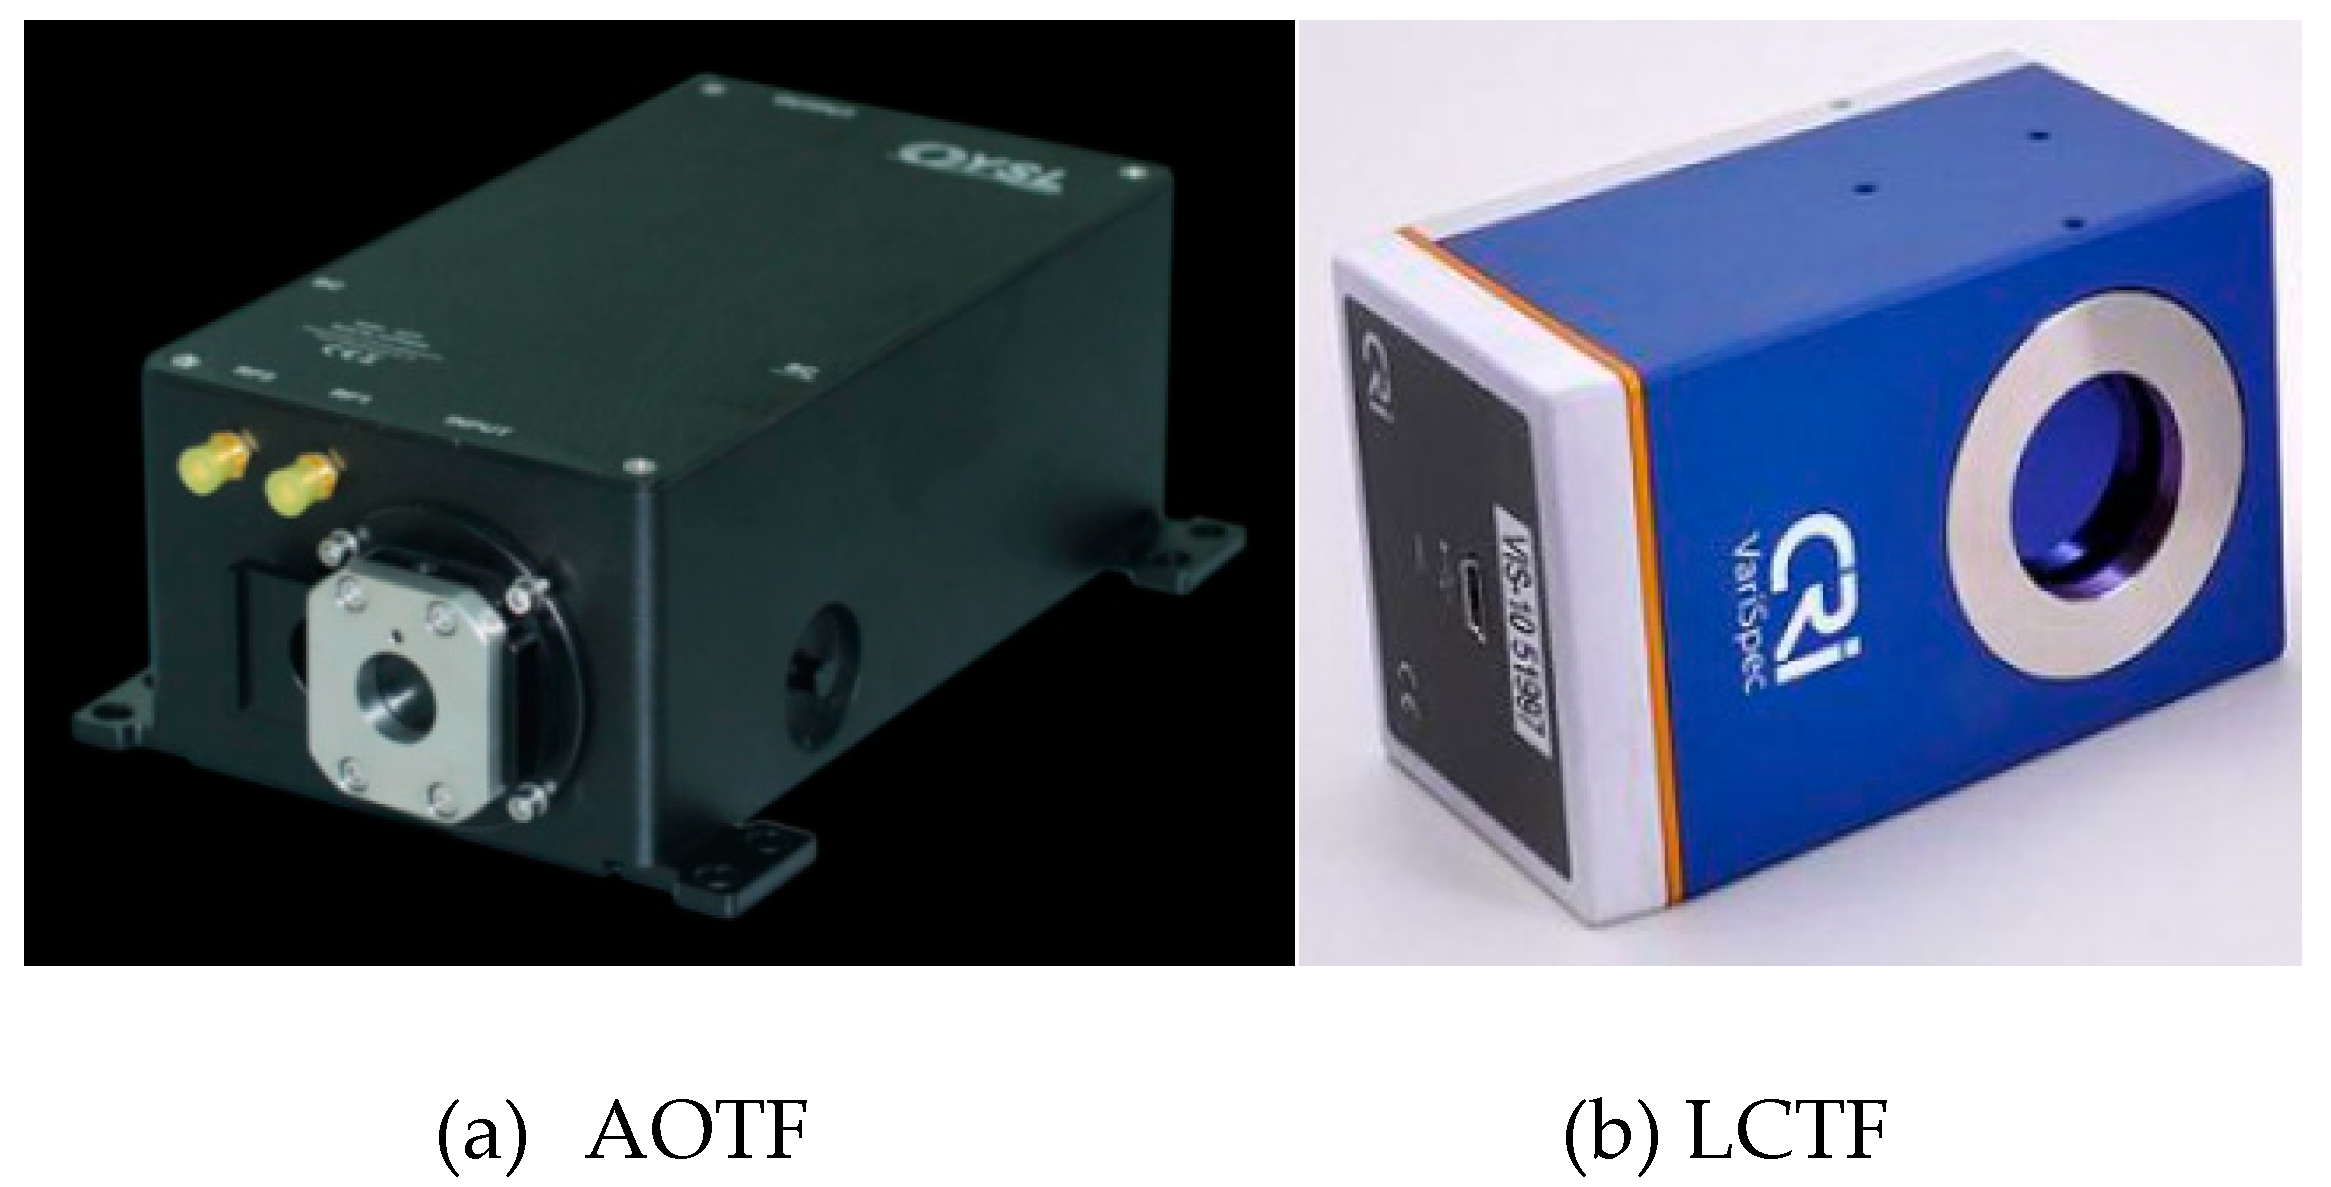
An AOTF (Figure 3) is an electro-optical device that functions as an electronically tunable excitation filter to simultaneously modulate the intensity and wavelength of the laser beam. The AOTF relies on a specialized birefringent crystal whose optical properties vary upon interaction with an acoustic wave. Changes in the acoustic frequency alter the diffraction properties of the crystal, enabling very rapid (in microsecond level) wavelength tuning, limited only by the acoustic transit time across the crystal. The selected wavelength is determined by Equation (1):
λ = Δ n V f [ sin 2 2 θ i + sin 4 θ i ] 1 / 2 ,
where the selected wavelength (λ) is a function of the difference of the refractive indexes due to birefringent Δ n , the frequency of the applied RF signal f , the incident angle θ i and the variable speed of acoustic waves in the crystal material V .
Previously, a feasibility study for detecting REP values was also carried out with a Liquid Crystal Tunable Filter (LCTF)-based HSL (LCTF-HSL) [31]. The major parameter specifications of LCTF and AOTF are shown in Table 1. The AOTF has a wider spectrum, covering from 430 nm to 1450 nm, while the LCTF just covers 400 nm to 720 nm. The AOTF is capable of continuously selecting or tuning the spectral resolution from 2 nm to 10 nm, and the LCTF just has three independent selections of 7, 10 and 20 nm. Moreover, the response time of AOTF is 10 μs, which is at least three orders of magnitudes quicker than the LCTF (the typical response time is 50 ms). Obviously, AOTF is much more preferable while selecting a filter in HSL. Figure 3 presents the AOTF and LCTF devices employed in this research.

2.1.3. Collimator

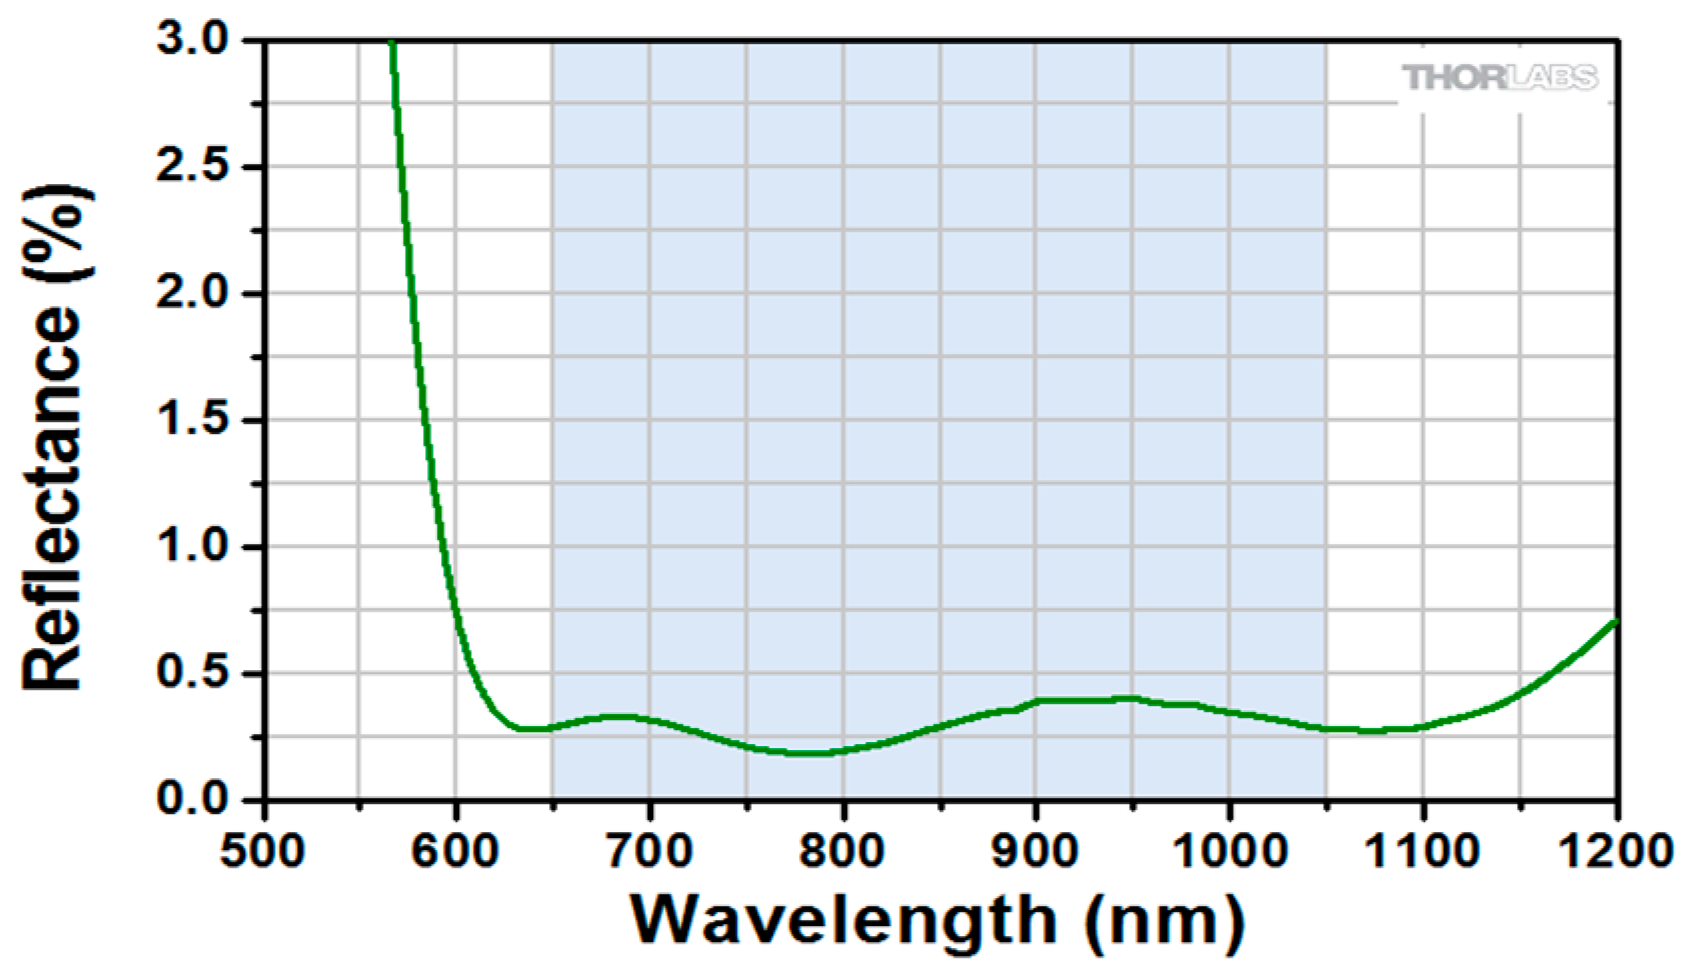
After the transmission of the laser beam from the laser source, a collimator is necessary to collimate the beam. In a traditional monochromatic LiDAR, the collimator design is comparatively simple, since only a single wavelength is considered in the laser beam collimation. However, in HSL, the wider spectral range of the laser beams should be taken into consideration in the laser beam collimation operation. An achromatic Galileo-type collimator is utilized for HSL system development with a beam expansion ratio of 1:5. Figure 4 shows the changing reflectance rate over the spectral wavelengths of the employed collimator. It can be observed that the collimator has a stable and low reflectance rate with the spectral wavelength ranging from approximately 650nm to 1050nm with broadband anti-reflection coating technique.

2.1.4. Reflector

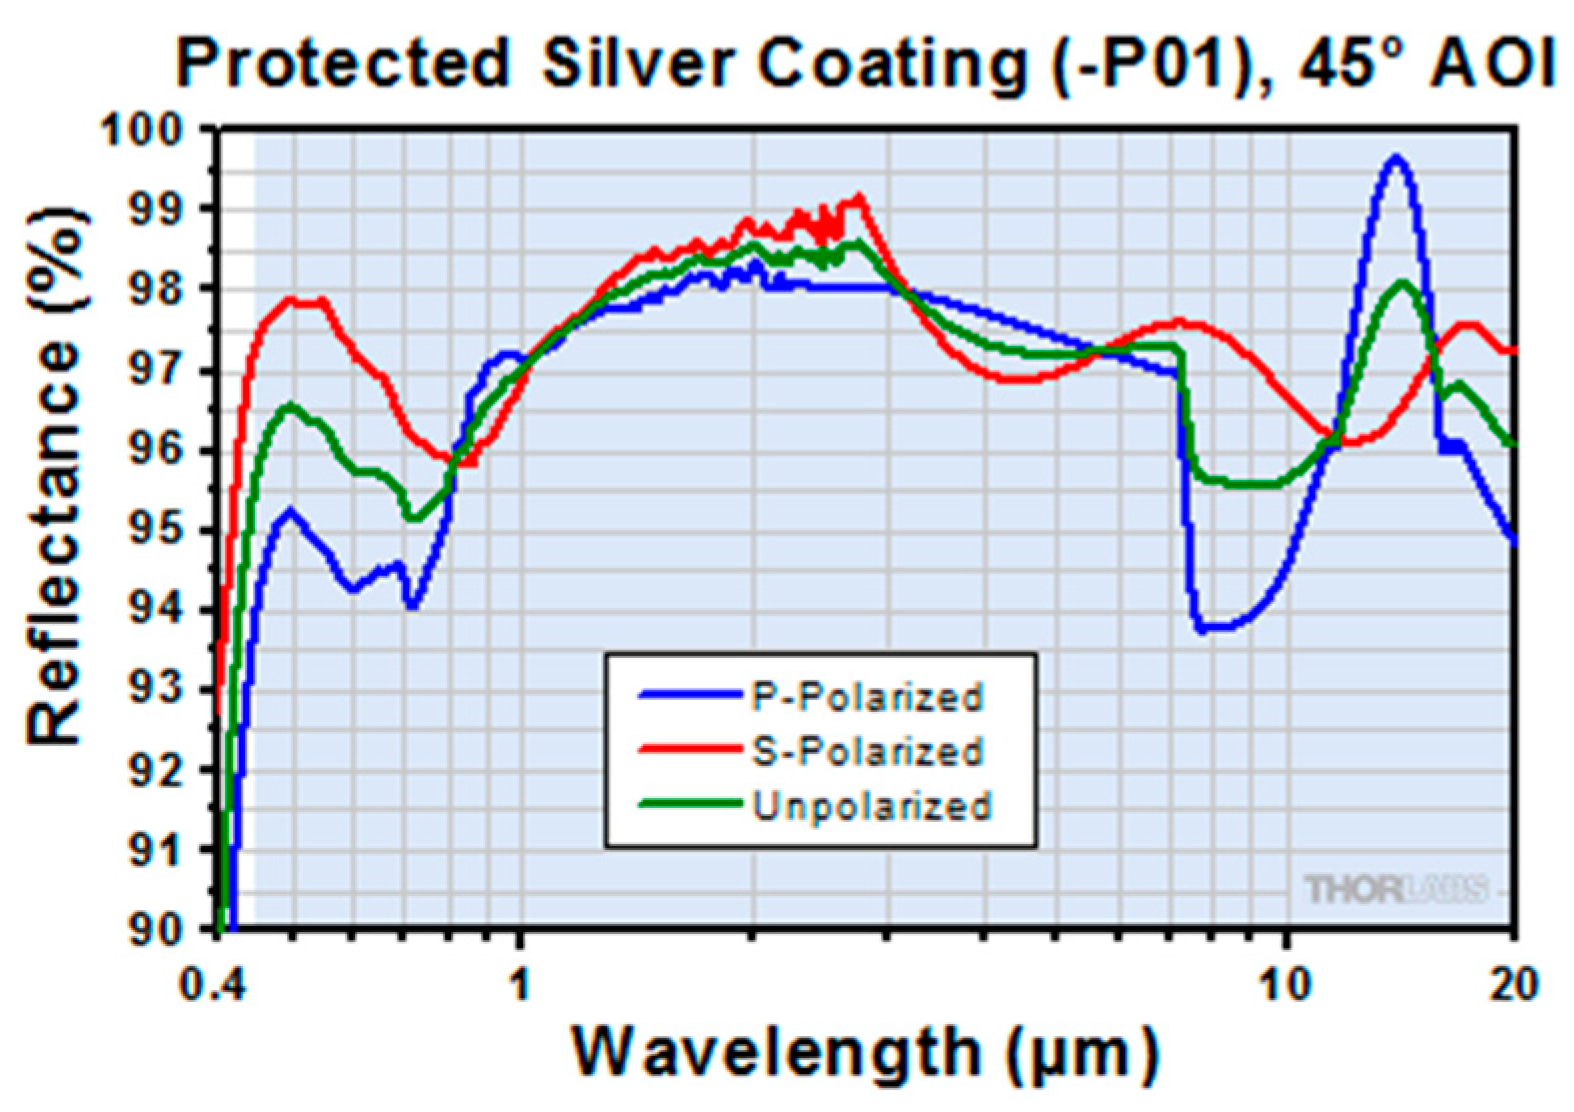
The main function of the reflector installed on the optical axis of the receiving Cassette telescope is employed to steer the spectrally tuned laser beam toward the target. In order to mitigate the loss of laser energy, this paper takes full consideration of the devices with high reflection efficiency in the range from visible band (VIS) to near infrared spectrum band (NIS) during the selection of reflector. As shown in Figure 5, the reflectivity of the selected reflector is over 94% in the spectrum range of 500 nm to 1000 nm.

2.2. REP Extraction Methods

The first-order differential of the spectral reflectance is the most commonly used method to extract the REP values. Since the spectral profiles are sampled with Δ λ , Equation (2) is employed for calculating the first differential of the spectral reflectance. The equation is given in detail as:
ρ ' ( λ i ) = [ ρ ( λ i + 1 ) - ρ ( λ i 1 ) ] / 2 Δ λ ,
where, λ i is the corresponding spectral wavelength, ρ ' ( λ i ) is the first-order differential of the spectral reflectance, ρ ( λ i + 1 ) and ρ ( λ i - 1 ) are reflectance values at spectral wavelength of λ i + 1 and λ i - 1 respectively, 2 × Δ λ is the spectral increment between λ i + 1 and λ i - 1 . In this AOTF-HSL system, 10 nm spectral resolution is selected, thereby λ i is sampled as 670, 680, 690, 700, 710, 720, 730, 740 and 750 nm in the spectral band.
Apart from this, another two RE parameters, RE slope and RE area, are also included. REP refers to the position of the RE in spectral wavelength, and REP slope is the spectral reflectance slope of the REP. REA refers to the area surrounded by the first derivative of the spectral reflectance, and it is calculated by the accumulating the reflectance slope with the spectral range from 680 nm to 750 nm [32,33,34,35,36,37]. Illustrative figures of these RE related parameters can be found in [32,33,34,35,36,37].
In addition, another two methods, Linear Four-point Interpolation Technology (LFPIT) and Linear Extrapolation Technology (LET), are employed for REP determination. Firstly, LFPIT is based on Equations (3) and (4). In this experiment, the method employs four wavelength data for calculating the REP. As illustrated, the 670 nm and 780 nm spectral information is used to calculate the reflectance at the REP, and the 700 nm and 740 nm spectral data are for determining the REP. In Equations (3) and (4), R 670 and R 780 are the corresponding reflectance values at 670 nm and 780 nm respectively. R 700 and R 740 are the corresponding reflectance values at 700 nm and 740 nm respectively:
R R E P = ( R 670 + R 780 ) 2 ,
λ R E P = 700 + 40 ( R R E P R 700 ) R 740 R 700 ,
Secondly, the LET method can be represented by Equations (5)–(7), and the REP is determined using the two extrapolation equations. Equation (5) is the extrapolation of the reflectance for spectral wavelengths ranging from 680 nm to 700 nm. Equation (6) is the extrapolation of the reflectance for spectral wavelengths ranging from 725 nm to 760 nm. Then, the REP is determined using the parameters ( m 1 , m 2 , c 1 and c 2 ) from Equations (5) and (6). In the following equations, the F D R 1 and F D R 2 are the spectral reflectance slope of the spectral ranging 680 nm and 700 nm and 725 nm and 760 nm. m 1 , m 2 , c 1 and c 2 are the parameters for describing the spectral reflectance slope and determining the REP. The REP determination using this method is as Equation (7):
F D R 1 = m 1 λ + c 1 ,
F D R 2 = m 2 λ + c 2 ,
λ R E P = ( c 1 c 2 ) m 1 m 2 ,

3. Results

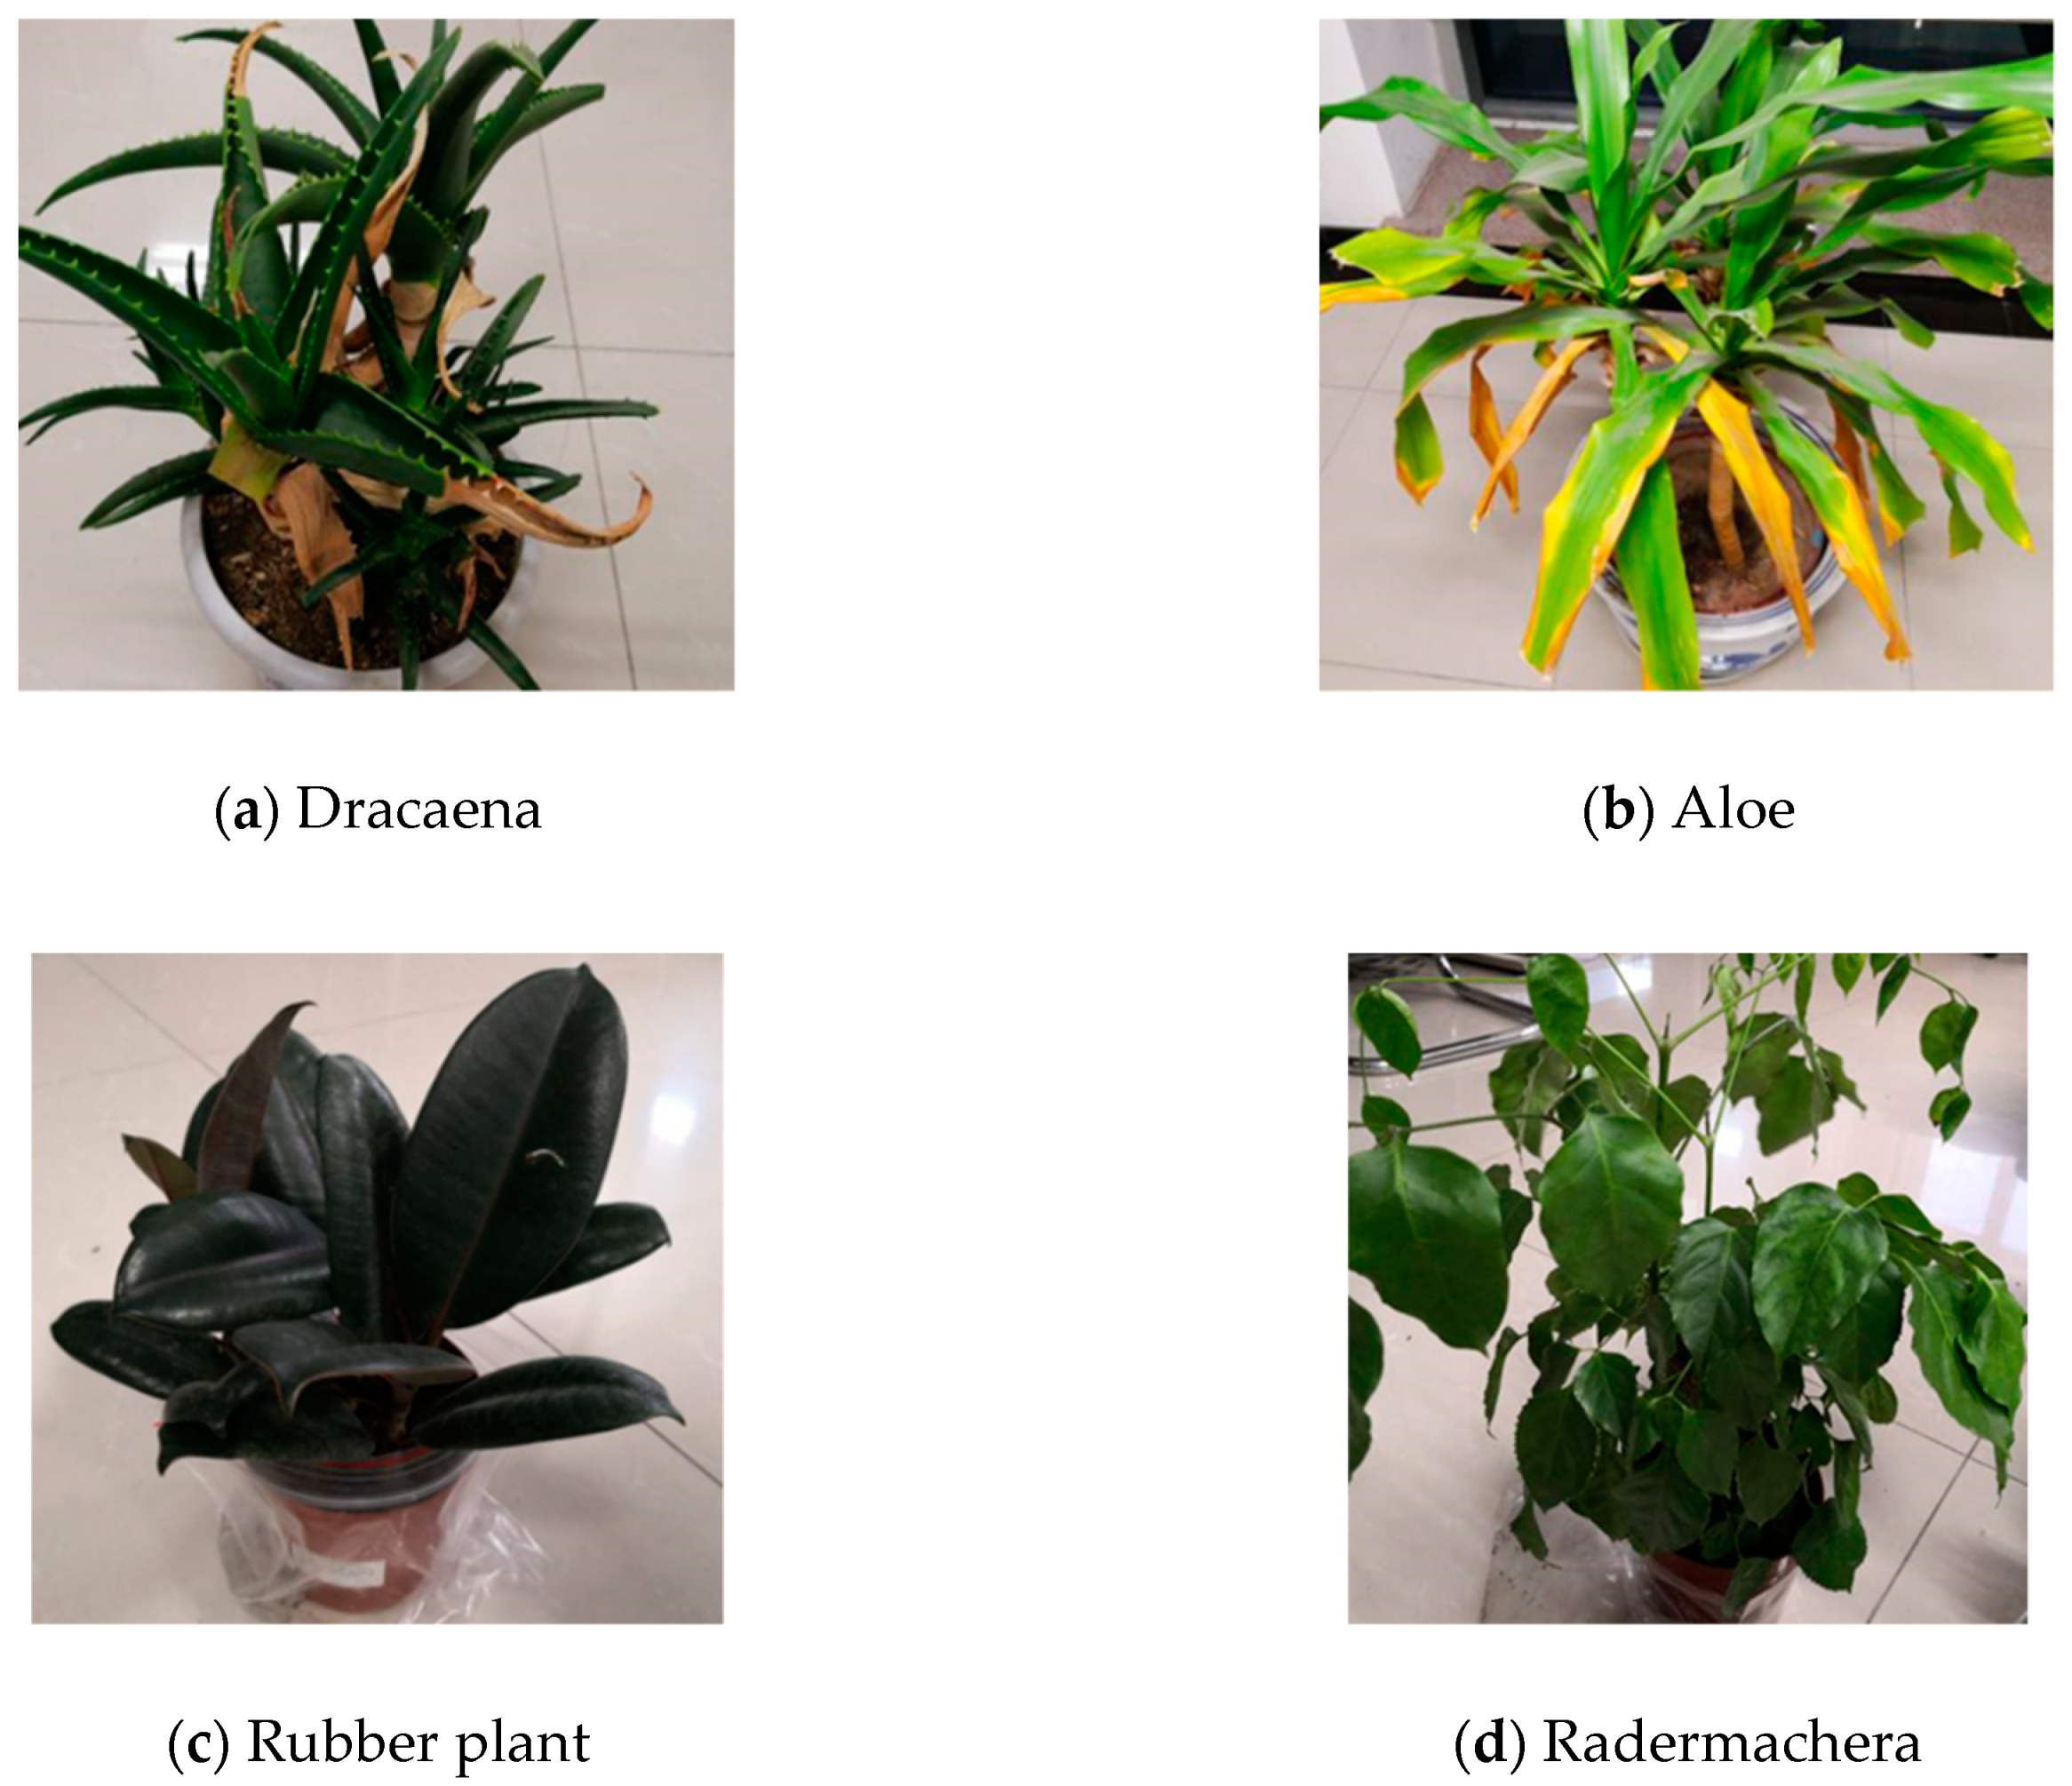
As aforementioned, four different plants with green or yellow leaves were used in the laboratory experiments for the AOTF-HSL testing. Figure 6 shows these measured plants, namely dracaena (Figure 6a), aloe (Figure 6b), rubber plant (Figure 6c) and radermachera (Figure 6d). The AOTF-HSL and the SVC spectrometer are employed to measure the REP, the corresponding reflectance REP slope and REA. As aforementioned in Section 2, the LCTF-HSL is not sufficient for determining the REA parameters according to the LCTF parameters.

3.1. REP, RE Slope and REA Measurement Results and Analysis

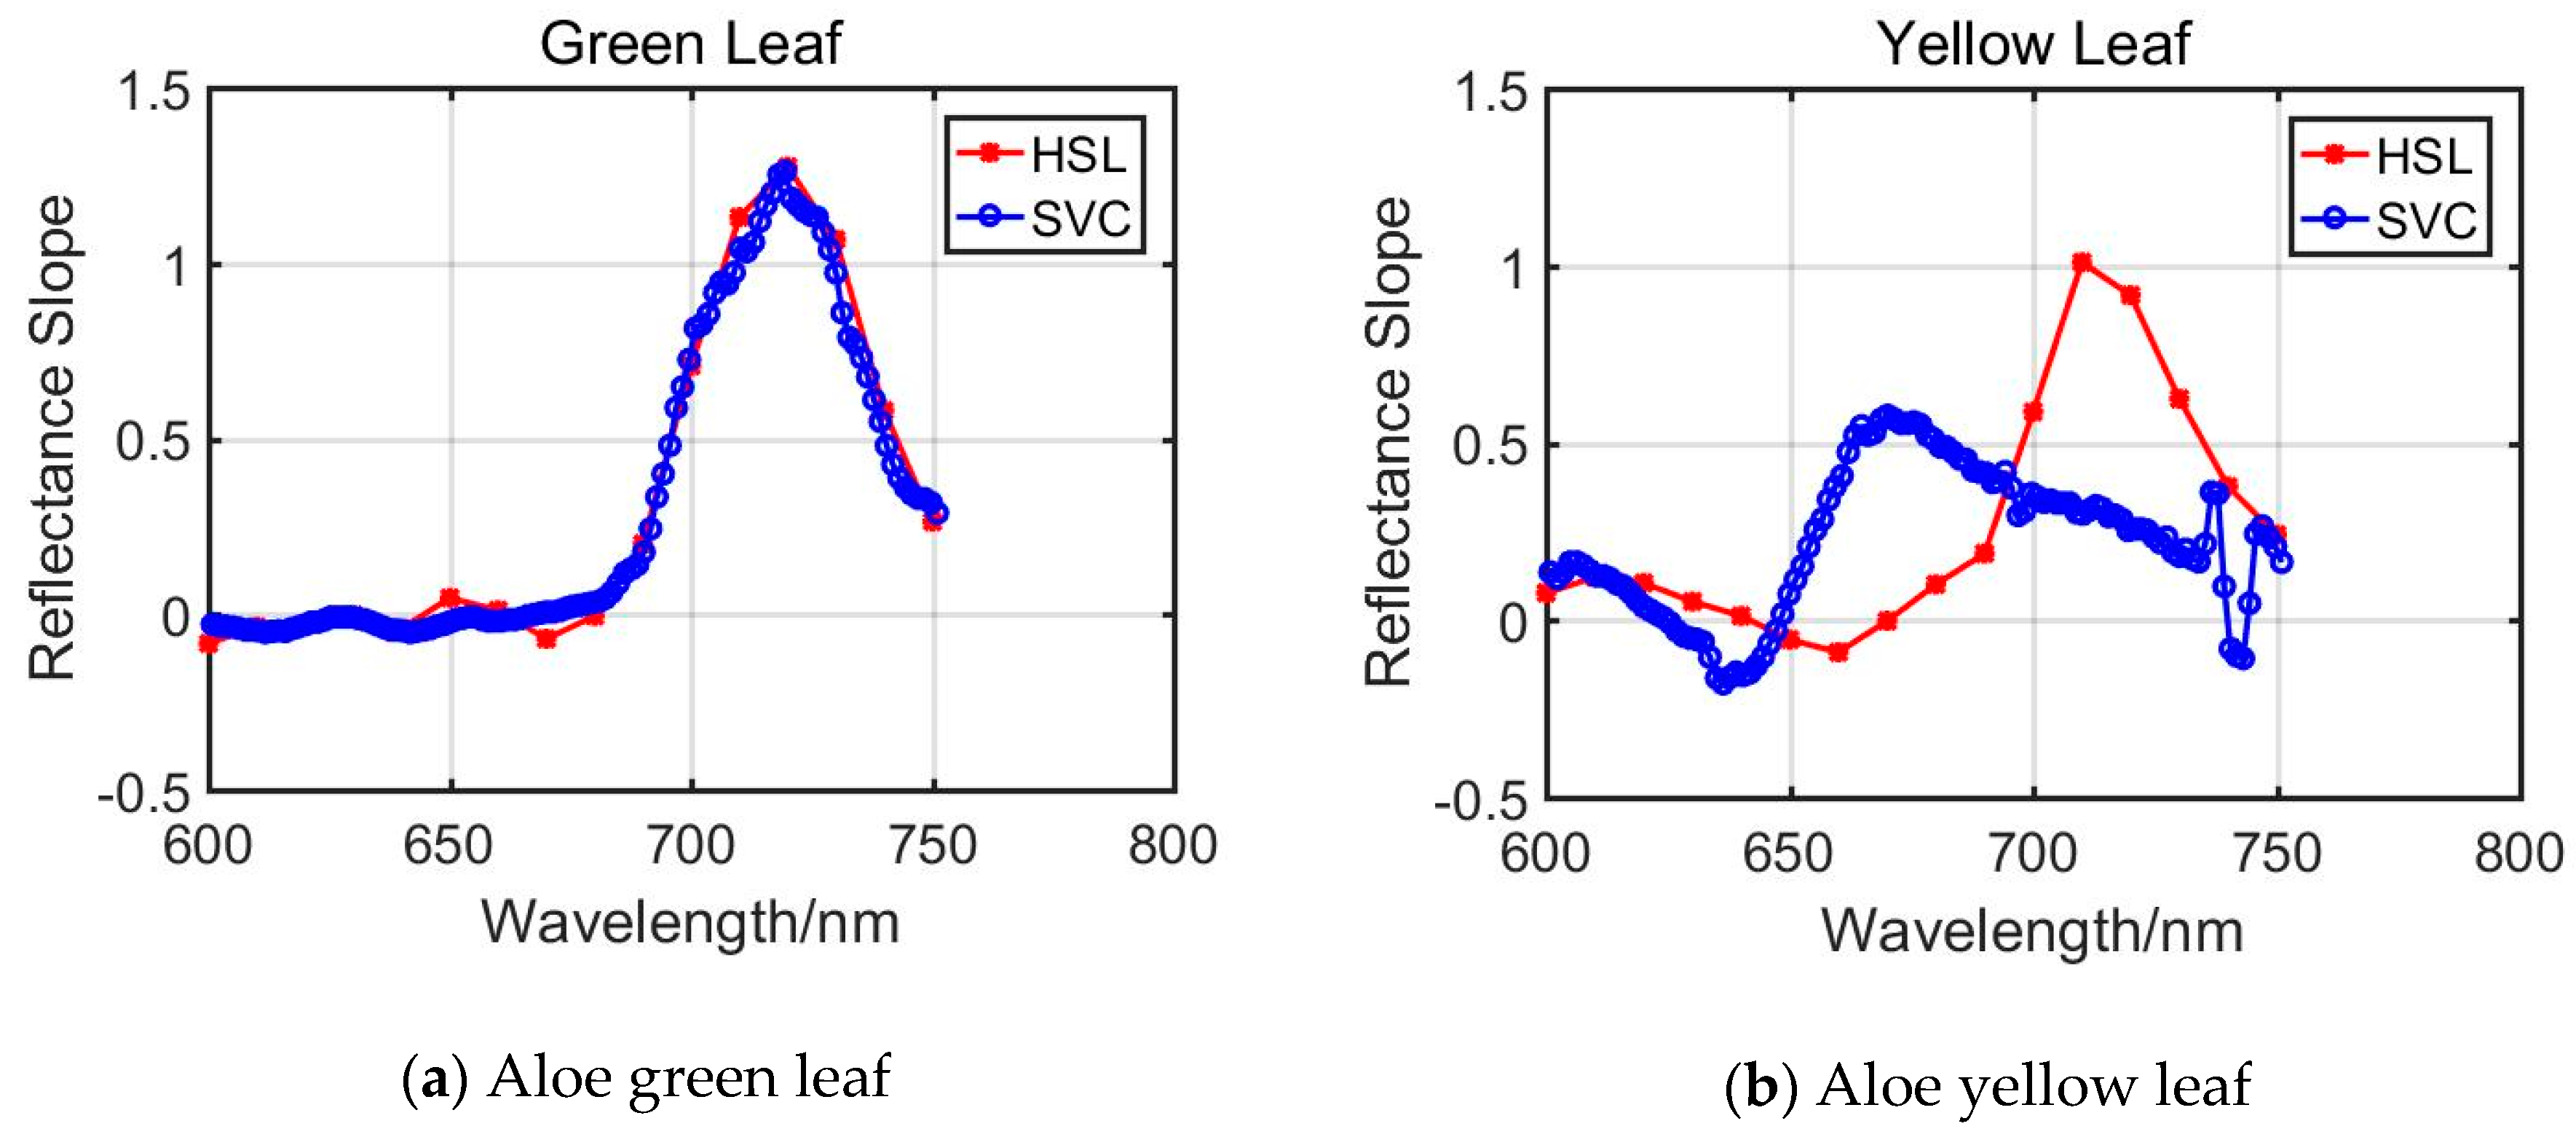
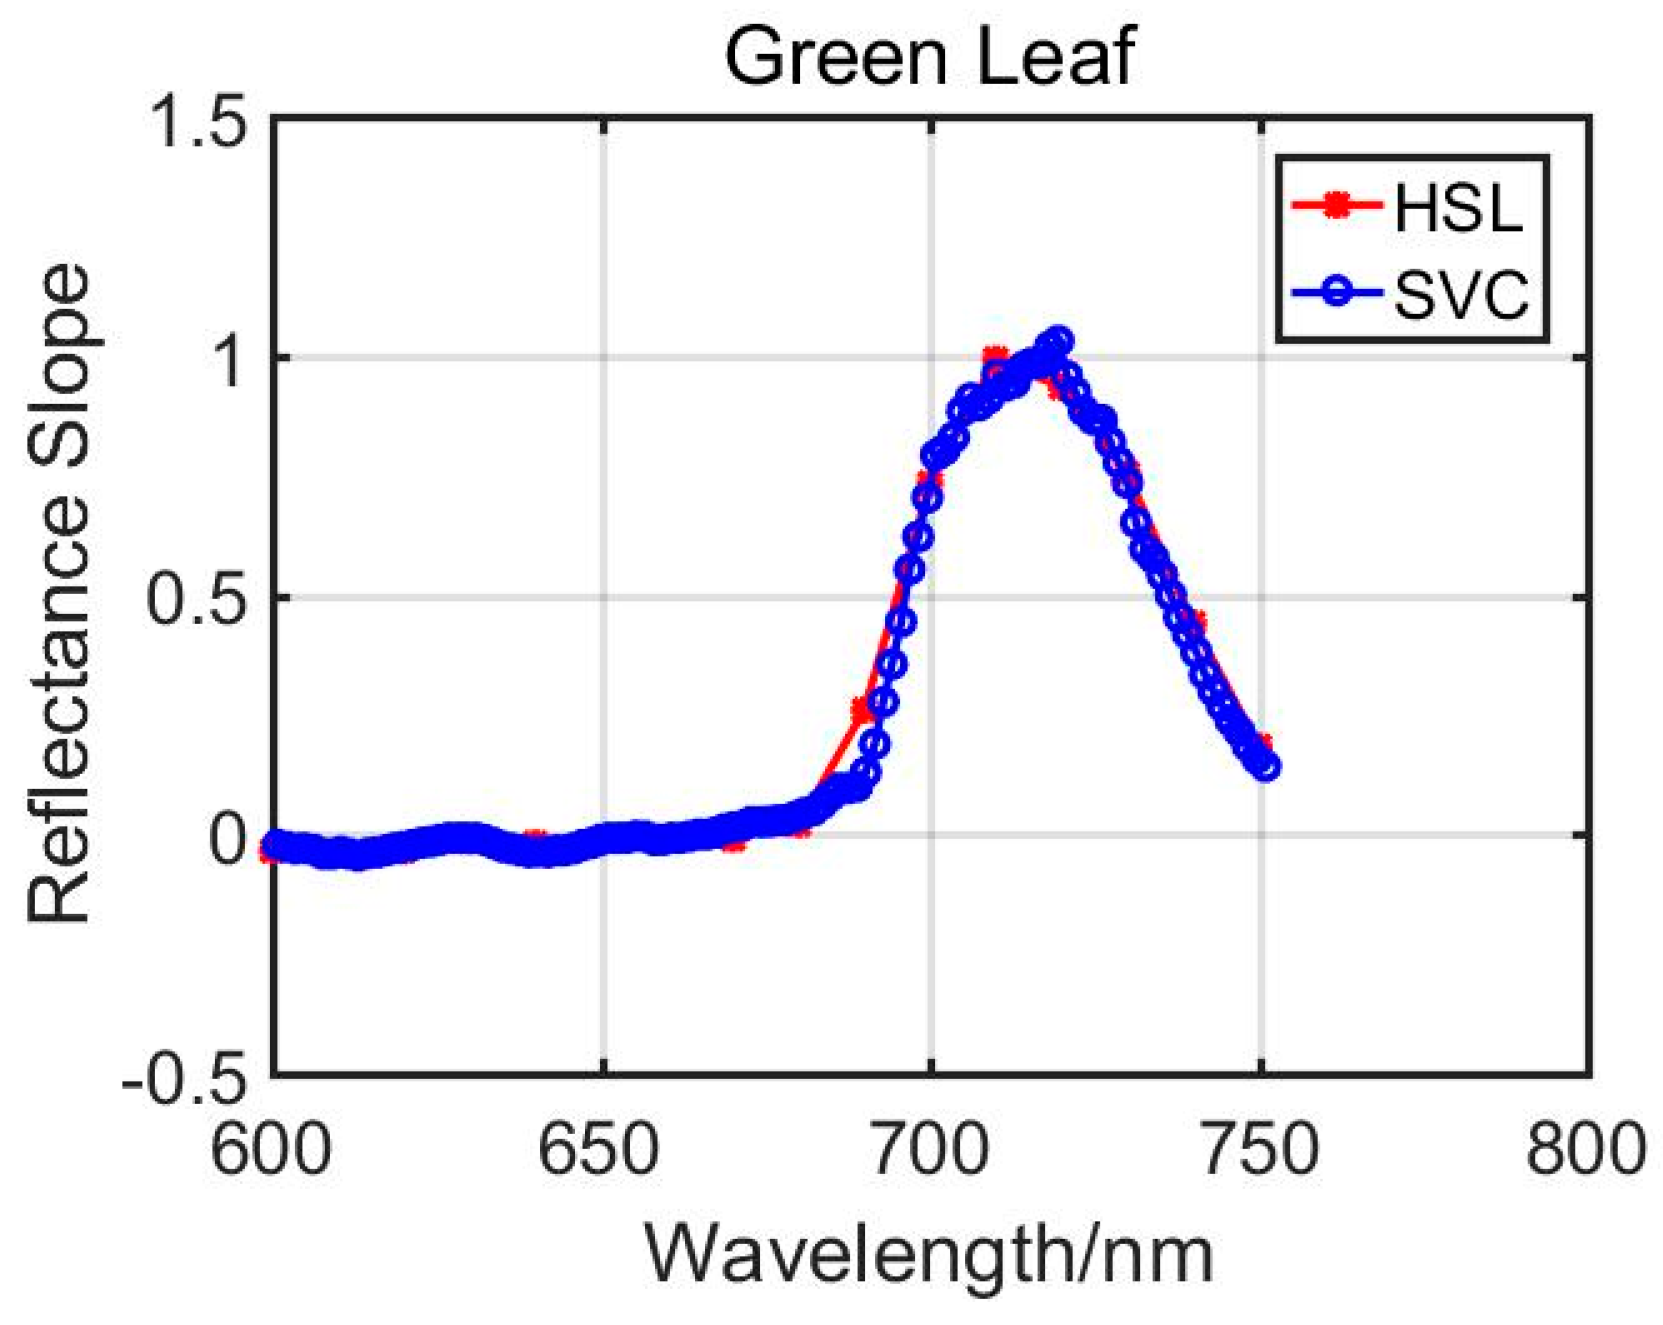
The Dracaena leaves spectral measurement results are shown in Figure 7, Figure 8, Figure 9 and Figure 10. In Figure 7, the first-order derivative spectral profiles of green leaf and yellow leaf from AOTF-HSL and SVC are presented. Figure 8 shows the results of aloe green and yellow leaf, and the remaining Figure 9 and Figure 10 are the spectral slope curves for rubber plant and radermachera green leaf, respectively.
Among these figures, it can be seen from Figure 7a, Figure 8a, Figure 9 and Figure 10 that spectral slope curves of green leaves of the selected plants extracted from AOTF-HSL coincide with its corresponding referenced measurements from the SVC spectrometer. Table 2, Table 3 and Table 4 list the quantitative results of the corresponding vegetation parameter results and the differences between the active and passive methods; the percentages are calculated using difference values dividing the corresponding referenced results from SVC. The differences of REP of all green leaf test cases are below 1%, however, for the REP slope, only the aloe green leaf REP slope difference percentage is below 1%. Specifically, the REP slope of the dracaena green leaf is large than 10%. For green leaf REA results, dracaena green leaf difference is also the largest, and it is more than 5%.
Figure 7b and Figure 8b present the spectral slope curves representing Dracaena yellow leaf and aloe yellow leaf, respectively. Compared with green leaf curves, both the yellow leaf curves from AOTF-HSL measurements are distinctive from that of SVC. Further analysis is also given in Table 2, Table 3 and Table 4, where the REP differences are 9.45 nm and 24.1 nm, respectively, and the corresponding difference is considerably higher than in the green leaf cases.
In addition, from comparing the REP between green and yellow leaves from the same plant, it can be seen by comparing the curves of Figure 7a, Figure 7b, Figure 8a and Figure 8b that REP has an obvious shift towards a shorter wavelength, named “blue shift”, since the yellow leaves have lower chlorophyll content and this tendency or REP behavior is consistent with previous research results.

3.2. Comparison of REP Results from Differnent Calculating Methods

In Section 3.1, the REP is calculated using the FRS technique. Actually, there are other methodologies for interpolating the reflectance REP, for instance, Linear Four-point Interpolation Technology (LFPIT), and Linear Extrapolation Technology (LET) [37,38]. For further validating and evaluating the proposed active remote sensing method, the AOTF-HSL spectral information is employed to calculate the REP based on LFPIT and LET.
With the parameters listed in Table 1, the selected wavelength spectral reflectance in LFPIT and LET beyond the wavelength scope of the LCTF-HSL, AOTF-HSL is more applicable than LCTF-HSL. In this section, only the spectral profiles collected by AOTF-HSL are used for extraction of these parameters. Table 5, Table 6, Table 7, Table 8, Table 9 and Table 10 give the results of the four REP determination methods. Among them, four tables (Table 5, Table 7, Table 9 and Table 10) are the REP results from the green leaves, and the other two (Table 6 and Table 8) are the REP results from yellow leaves of dracaena and dloe.
Firstly, in the aspect of the green leaves results, the AOTF-HSL and SVC give a similar REP using the four different results, with differences all below 1% except for the rubber plant REP using the LFPIT method. The lower spectral resolution of HSL may account for the minor differences between AOTF-HSL and SVC. In this paper, the AOTF-HSL spectral resolution is 10 nm, and the SVC spectral resolution is better than 2 nm.
Secondly, in aspect of the yellow leaves (Table 6 and Table 8), the differences of the results between AOTF-HSL and SVC calculated by the LFPIT and LET methods are all more than 5%, and the figures are slightly higher than the FPS-derived REP results. Compared with the green leaves, the differences between AOTF-HSL and SVC are larger in the yellow leaf cases. In addition, the three REP-derived methods give similar results in the green leaf cases, including AOTF-HSL and SVC, however, there is an obvious difference in the yellow leaves results. Especially, in the AOTF-HSL REP of the dracaena yellow leaf case, the LEPIT and LET methods afford similar results, but they are different from the FRS results. As aforementioned, the spectral resolution has an influence on the operation of LET and LEPIT, and in this experiment, the spectral resolution of AOTF-HSL is selected as 10 nm, which might affect the calculation of the results.

4. Discussion

The development of active measuring methods to obtain spectral information is of great significance. The AOTF-HSL technique presented in this paper has the unique characteristic of collecting a continuous spectrum in the visible and near infrared (VNIR) regions with 10 nm spectral resolution, which is the best spectral resolution in any published paper. However, limited by the HSL hardware configuration and the data processing capacity, compared with SVC spectrometer, the spectral resolution is still slightly restricted. We presume this is the major reason contributing to the slight differences between AOTF-HSL and SVC in green leaves measuring results. In addition, for REP slope and REA, these results are quite distinctive and the percentages are all larger than 30%. We think that these following reasons might account for this phenomenon:
  • Green leaves have more uniform spectral reflectivity over their surface, since the contents affecting “Red Edge” related parameters are distributed evenly on them; in contrast to this, yellow leaves have uneven distributions of these contents as Figure 7a,b present and the reflectivity varies for different parts of the yellow leaf;
  • As aforementioned in Section 2, the hardware design, optics system, and the measurement distance determine the diameter of the laser pulse footprint for sampling, which is approximately 1 cm in this experiment with a field of view (FOV) of 0.2 mill radian. The sampled area of the spectrometer is larger (resulting in a 5.5 cm radius footprint with a 25◦ field of view). Area coverage by the laser pulse has different reflectivity due to the non-uniformity of the yellow leaves.
For the FRS method, the spectral resolution affects the calculation results. Due to the higher spectral resolution of the SVC, the spectral profile collected by SVC could contribute to more detailed descriptions of the reflectance slope changes. In the LET and LPFIT methods, the parameters are calculated using the selected reflectance at several specific spectral wavelengths, and some of them are not consistent with the selected wavelength of the AOTF-HSL. Some spectral reflectance values are calculated using the average values of the intensities from the nearby spectral wavelength. For instance, in the LET method, the 725 nm reflectance is calculated through averaging that of 720 nm and 730 nm, which might slightly affect the results. Moreover, in the LET method, only three spectral reflectance values from AOTF-HSL are employed to fit the FDR1 (680, 690 and 700 nm), which might bias the final results. Thus, we think following future works are necessary for extending the HSL enabling vegetation index estimation and determination:
  • HSL with finer spectral resolution is anticipated to improve the performance in vegetation index or parameter extraction, and the ultimate HSL will have similar spectral resolution with the referenced SVC spectrometer. With better spectral resolution, it is of great significance to estimate the vegetation content and produce more comparable measurements. HSL spectral profiles covering the 500–1000 nm wavelength band with 2 nm resolution is anticipated for future work, whose resolution is more feasible to produce reliable results for vegetation-related applications.
  • In this paper, the influence of the spectral resolution on the REP or further vegetation resolution is not investigated, limited by the hardware design. A 10 nm spectral resolution is employed in this paper, which is determined by the LiDAR raw measurement processing capacity; actually, the spectral resolution of the AOTF-HSL can be adjusted from 2 nm to 10 nm, it is of great significance for exploring the influence of the spectral resolution on the performance of the above REP extraction method.
  • REP is one of the most important indicators for vegetation health monitoring, but there are still some other vegetation indexes for presenting vegetation growth or content; more work would be carried out on using HSL to extract these vegetation indexes.
5. Conclusions

This paper investigated an AOTF-based 10 nm spectral resolution HSL, and for which the consecutive spectral bands were tunable covering 500–1000 nm. An AOTF was installed after the super-continuum laser source and consecutively selecting the wavelength of the passing laser beam. 51-channel spectral information was acquired. Then, four different plants with four green leaves and two yellow leaves were measured by the AOTF-HSL and with corresponding referenced spectral profiles collected by an SVC spectrometer. For green leaves, the “Red Edge”-related parameters extracted using the first-order reflectance slope (FRS) from the AOTF-HSL and SVC spectrometer were trivial, and this demonstrated the AOTF-HSL was capable of measuring vegetation “Red Edge”-related parameters. Moreover, the observed shift behaviours were consistent with previous research results, which also supported the fact that measurement results from the AOTF-HSL are reliable. In addition, another two methods, LFPIT and LET, were employed for calculating the REP for further comparing the results between HSL and SVC. The results were similar to those from the FRS method, which further demonstrated the effectiveness of the HSL in this vegetation index detection and measurement.

Author Contributions

C.J. wrote this paper and processed the data; Y.C. proposed the idea, revised the paper designed this HSL and offered the funding; W.L. set up the HSL, the idea, collected the data, revised the paper and offered the funding; H.Z. discussed the idea and revised the paper; H.J. offer the funding, revised the paper and the guided the HSL design. Y.B., H.S., S.S. and E.P. reviewed the paper and provided valuable advice for paper writing and revision.

Funding

This research was financially supported by the Academy of Finland projects “Centre of Excellence in Laser Scanning Research (CoE-LaSR) (307362)” and “New laser and spectral field methods for in situ mining and raw material investigations (project 292648). Additionally, the Chinese Academy of Science (181811KYSB20160113), by the Chinese Ministry of Science and Technology (2015DFA70930) and Shanghai Science and Technology Foundations (18590712600) are acknowledged.

Conflicts of Interest

The authors declare no conflict of interest.

References

  1. Plaza, A. Recent advances in techniques for hyperspectral image processing. Remote Sens. Environ. 2009, 113, S110–S122. [Google Scholar] [CrossRef]
  2. Dalponte, M.; Bruzzone, L.; Gianelle, D. Fusion of hyperspectral and lidar remote sensing data for classification of complex forest areas. IEEE Trans. Geosci. Remote Sens. 2008, 46, 1416–1427. [Google Scholar] [CrossRef]
  3. Ravikanth, L.; Jayas, D.S.; White, N.D.; Fields, P.G.; Sun, D.W. Extraction of spectral information from hyperspectral data and application of hyperspectral imaging for food and agricultural products. Food Bioprocess Technol. 2017, 10, 1–33. [Google Scholar] [CrossRef]
  4. Camps-Valls, G.; Bruzzone, L. Kernel-based methods for hyperspectral image classification. IEEE Trans. Geosci. Remote Sens. 2005, 43, 1351–1362. [Google Scholar] [CrossRef]
  5. Fernandez-Diaz, J.; Carter, W.; Glennie, C.; Shrestha, R.; Pan, Z.; Ekhtari, N.; Singhania, A.; Hauser, D.; Sartori, M. Capability assessment and performance metrics for the Titan multispectral mapping LiDAR. Remote Sens. 2016, 8, 936. [Google Scholar] [CrossRef]
  6. Burton, D.; Dunlap, D.B.; Wood, L.J.; Flaig, P.P. Lidar intensity as a remote sensor of rock properties. J. Sediment. Res. 2011, 81, 339–347. [Google Scholar] [CrossRef]
  7. Chen, Y.; Jiang, C.; Hyyppä, J.; Qiu, S.; Wang, Z.; Tian, M.; Bo, Y. Feasibility Study of Ore Classification Using Active Hyperspectral LiDAR. IEEE Geosci. Remote Sens. Lett. 2018, 99, 1–5. [Google Scholar] [CrossRef]
  8. Song, J.-H. Assessing the possibility of land-cover classification using lidar intensity data. Int. Arch. Photogramm. Remote Sens. Spat. Inf. Sci. 2002, 34, 259–262. [Google Scholar]
  9. Chust, G.; Galparsoro, I.; Borja, A.; Franco, J.; Uriarte, A. Coastal and estuarine habitat mapping, using LIDAR height and intensity and multi-spectral imagery. Estuar. Coast. Shelf Sci. 2008, 78, 633–643. [Google Scholar] [CrossRef]
  10. Kaasalainen, S.; Hyyppa, H.; Kukko, A.; Litkey, P.; Ahokas, E.; Hyyppa, J.; Kaasalainen, M. Radiometric calibration of LiDAR intensity with commercially available reference targets. IEEE Trans. Geosci. Remote Sens. 2009, 47, 588–598. [Google Scholar] [CrossRef]
  11. Hata, A.; Wolf, D. Road marking detection using LIDAR reflective intensity data and its application to vehicle localization. In Proceedings of the IEEE 17th International Conference on Intelligent Transportation Systems (ITSC), Qingdao, China, 8–11 October 2014; pp. 584–589. [Google Scholar]
  12. Eitel, J.U.; Magney, T.S.; Vierling, L.A.; Dittmar, G. Assessment of crop foliar nitrogen using a novel dual-wavelength laser system and implications for conducting laser-based plant physiology. ISPRS J. Photogramm. Remote Sens. 2014, 97, 229–240. [Google Scholar] [CrossRef]
  13. Gaulton, R.; Danson, F.M.; Ramirez, F.A.; Gunawan, O. The potential of dual-wavelength laser scanning for estimating vegetation moisture content. Remote Sens. Environ. 2013, 132, 32–39. [Google Scholar] [CrossRef]
  14. Zimble, D.A. Characterizing vertical forest structure using small-footprint airborne LiDAR. Remote Sens. Environ. 2003, 87, 171–182. [Google Scholar] [CrossRef] [Green Version]
  15. Douglas, E.S.; Strahler, A.; Martel, J.; Cook, T.; Mendillo, C.; Marshall, R.; Chakrabarti, S.; Schaaf, C.; Woodcock, C.; Li, Z.; et al. DWEL: A dual-wavelength echidna lidar for ground-based forest scanning. In Proceedings of the 2012 IEEE International Geoscience and Remote Sensing Symposium, Munich, Germany, 22–27 July 2012; pp. 4998–5001. [Google Scholar]
  16. Asner, G.P.; Knapp, D.E.; Kennedy-Bowdoin, T.; Jones, M.O.; Martin, R.E.; Boardman, J.W.; Field, C.B. Carnegie airborne observatory: In-flight fusion of hyperspectral imaging and waveform light detection and ranging for three-dimensional studies of ecosystems. J. Appl. Remote Sens. 2007, 1, 013536. [Google Scholar] [CrossRef]
  17. Alonzo, M.; Bookhagen, B.; Roberts, D.A. Urban tree species mapping using hyperspectral and lidar data fusion. Remote Sens. Environ. 2014, 148, 70–83. [Google Scholar] [CrossRef]
  18. Sohn, G.; Dowman, I. Data fusion of high-resolution satellite imagery and LiDAR data for automatic building extraction. ISPRS J. Photogramm. Remote Sens. 2007, 62, 43–63. [Google Scholar] [CrossRef]
  19. Du, L.; Gong, W.; Shi, S.; Yang, J.; Sun, J.; Zhu, B.; Song, S. Estimation of rice leaf nitrogen contents based on hyperspectral LIDAR. Int. J. Appl. Earth Obs. Geoinf. 2016, 44, 136–143. [Google Scholar] [CrossRef]
  20. Wang, Z.; Chen, Y.; Li, C. A Hyperspectral LiDAR with Eight Channels Covering from VIS to SWIR[C]. IEEE Int. Geosci. Remote Sens. Symp. 2018, 4293–4296. [Google Scholar]
  21. Shi, S.; Song, S.; Gong, W.; Du, L.; Zhu, B.; Huang, X. Improving backscatter intensity calibration for multispectral LiDAR. IEEE Geosci. Remote Sens. Lett. 2015, 12, 1421–1425. [Google Scholar] [CrossRef]
  22. Kaasalainen, S.; Lindroos, T.; Hyyppa, J. Toward hyperspectral lidar: Measurement of spectral backscatter intensity with a supercontinuum laser source. IEEE Geosci. Remote Sens. Lett. 2007, 4, 211–215. [Google Scholar] [CrossRef]
  23. Chen, Y.; Räikkönen, E.; Kaasalainen, S.; Suomalainen, J.; Hakala, T.; Hyyppä, J.; Chen, R. Two-channel hyperspectral LiDAR with a supercontinuum laser source. Sensors 2010, 10, 7057–7066. [Google Scholar] [CrossRef] [PubMed]
  24. Hakala, T.; Suomalainen, J.; Kaasalainen, S.; Chen, Y. Full waveform hyperspectral LiDAR for terrestrial laser scanning. Opt. Express 2012, 20, 7119–7127. [Google Scholar] [CrossRef] [PubMed]
  25. Nevalainen, O.; Hakala, T.; Suomalainen, J.; Mäkipää, R.; Peltoniemi, M.; Krooks, A.; Kaasalainen, S. Fast and nondestructive method for leaf level chlorophyll estimation using hyperspectral LiDAR. Agric. For. Meteorol. 2014, 198, 250–258. [Google Scholar] [CrossRef]
  26. Nevalainen, O.; Hakala, T.; Suomalainen, J.; Kaasalainen, S. Nitrogen concentration estimation with hyperspectral LiDAR[J]. ISPRS Ann. Photogramm. Remote Sens. Spat. Inf. Sci. 2013, 2, 205–210. [Google Scholar] [CrossRef]
  27. Matikainen, L.; Karila, K.; Hyyppä, J.; Litkey, P.; Puttonen, E.; Ahokas, E. Object-based analysis of multispectral airborne laser scanner data for land cover classification and map updating. ISPRS J. Photogramm. Remote Sens. 2017, 128, 298–313. [Google Scholar] [CrossRef]
  28. Puttonen, E.; Hakala, T.; Nevalainen, O.; Kaasalainen, S.; Krooks, A.; Karjalainen, M.; Anttila, K. Artificial target detection with a hyperspectral LiDAR over 26-h measurement. Opt. Eng. 2015, 54, 013105. [Google Scholar] [CrossRef]
  29. Niu, Z.; Xu, Z.; Sun, G.; Huang, W.; Wang, L.; Feng, M.; Gao, S. Design of a new multispectral waveform LiDAR instrument to monitor vegetation. IEEE Geosci. Remote Sens. Lett. 2015, 12, 1506–1510. [Google Scholar]
  30. Wang, L.; Sun, G.; Niu, Z.; Gao, S.; Qiao, H. Estimation of leaf biochemical content using a novel hyperspectral full-waveform LiDAR system. Remote Sens. Lett. 2014, 5, 693–702. [Google Scholar]
  31. Li, W.; Jiang, C.; Chen, Y.; Hyyppä, J.; Tang, L.; Li, C.; Wang, S.W. A Liquid Crystal Tunable Filter-Based Hyperspectral LiDAR System and Its Application on Vegetation Red Edge Detection. IEEE Geosci. Remote Sens. Lett. 2018, 16, 291–295. [Google Scholar] [CrossRef]
  32. Chen, Y.; Li, W.; Hyyppä, J.; Wang, N.; Jiang, C.; Meng, F.; Li, C. A 10-nm Spectral Resolution Hyperspectral LiDAR System Based on an Acousto-Optic Tunable Filter. Sensors 2019, 19, 1620. [Google Scholar] [CrossRef]
  33. Malkamäki, T.; Kaasalainen, S.; Ilinca, J. Portable hyperspectral lidar utilizing 5 GHz multichannel full waveform digitization. Opt. Express 2019, 27, A468–A480. [Google Scholar] [CrossRef] [PubMed]
  34. Pu, R. Extraction of red edge optical parameters from Hyperion data for estimation of forest leaf area index. IEEE Trans. Geosci. Remote. Sens. 2003, 41, 916–921. [Google Scholar]
  35. Yao, F. Hyperspectral models for estimating vegetation chlorophyll content based on red edge parameter. Trans. Chin. Soc. Agric. Eng. 2009, 25, 123–129. [Google Scholar]
  36. Zarco-Tajeda, P.J. Detection of chlorophyll fluorescence in vegetation from airborne hyperspectral CASI imagery in the red edge spectral region. IEEE Int. Geosci. Remote Sens. Symp. 2004, 1, 598–600. [Google Scholar]
  37. Miller, J.R.; Hare, E.W.; Wu, J. Quantitative characterization of the vegetation red edge reflectance. An inverted-Gaussian reflectance model. Remote Sens. 1990, 11, 1755–1773. [Google Scholar] [CrossRef]
  38. Shafri, H.Z.; Hamdan, N. Hyperspectral imagery for mapping disease infection in oil palm plantationusing vegetation indices and red edge techniques. Am. J. Appl. Sci. 2009, 6, 10. [Google Scholar]
Figure 1. Schematic diagram of a tunable Hyperspectral LiDAR system based on AOTF.
Remotesensing 11 02007 g001
Figure 2. The supercontinuum laser source and the power density against the wavelength.
Remotesensing 11 02007 g002
Figure 3. Employed filter device. (a) AOTF, (b) LCTF.
Remotesensing 11 02007 g003
Figure 4. Transmittance of laser beam expander.
Remotesensing 11 02007 g004
Figure 5. Reflectivity of the reflector.
Remotesensing 11 02007 g005
Figure 6. Four different plants employed in lab experiment. (a) Dracaena, (b) Aloe, (c) Rubber plant, (d) Radermachera.
Remotesensing 11 02007 g006
Figure 7. First derivative of the spectral reflectance versus spectral values of dracaena green and yellow leaf measured by the AOTF-HSL and the SVC spectrometer. (a) Dracaena green leaf, (b) Dracaena yellow leaf.
Remotesensing 11 02007 g007
Figure 8. First derivative of the spectral reflectance versus spectral values of Aloe green and yellow leaf measured by AOTF-HSL and SVC. (a) Aloe green leaf, (b) Aloe yellow leaf.
Remotesensing 11 02007 g008
Figure 9. Rubber plant green leaf.
Remotesensing 11 02007 g009
Figure 10. Radermachera green leaf.
Remotesensing 11 02007 g010
Table 1. The AOTF vs LCTF Major Parameters Specifications.
ParameterAOTFLCTF (VariSpec VIS)
spectral range430–1450 nm400–720 nm
Response tine10 μs50 ms
spectral resolution2–10 nm7/10 or 20 nm
Table 2. “Red edge” position measuring results based on FRS.
REP (nm)
AOTF-HSLSVCDifference
Dracaena Green Leaf725718.856.15 (0.85%)
Dracaena Yellow Leaf695685.559.45 (1.3%)
Aloe Green Leaf725718.856.15 (0.85%)
Aloe Yellow Leaf715690.924.1 (3.4%)
Rubber Green Leaf725725.450.45 (0.06%)
Radermachera Green Leaf715718.853.85 (0.53%)
Table 3. “Red edge” slope measuring results.
REP slope
AOTF-HSLSVCDifference
Dracaena Green Leaf0.951.070.12 (11.2%)
Dracaena Yellow Leaf1.441.030.41 (39.8%)
Aloe Green Leaf1.291.30.01 (0.08%)
Aloe Yellow Leaf1.10.590.51 (86%)
Rubber Green Leaf1.091.170.08 (6.8%)
Radermachera Green Leaf11.070.07 (6.5%)
Table 4. “Red edge” area measuring results.
REA
AOTF-HSLSVCDifference
Dracaena Green Leaf47.9451.363.42 (6.7%)
Dracaena Yellow Leaf36.6726.3410.33 (39.2%)
Aloe Green Leaf52.5451.11.43 (2.8%)
Aloe Yellow Leaf41.6331.5310.1 (32.0%)
Rubber Green Leaf4443.680.32 (0.7%)
Radermachera Green Leaf43.3942.011.38 (3.2%)
Table 5. The three different methods’ “Red edge” position results for dracaena green leaf.
REP (nm)
AOTF-HSLSVCDifference
LFPIT717.80722.324.52 (0.63%)
LET709.42712.242.82 (0.40%)
FRS725718.856.15 (0.85%)
Table 6. The three different methods’ “Red edge” position results for dracaena yellow leaf.
REP
AOTF-HSLSVCDifference
LFPIT636.79692.4355.64 (8.7%)
LET628.65679.9151.26 (8.2%)
FRS695685.559.45 (1.3%)
Table 7. The three different methods’ “Red edge” position results for aloe green leaf.
REP
AOTF-HSLSVCDifference
LFPIT718.68715.13−3.55 (0.49%)
LET720.32719.95−0.37 (0.05%)
FRS725718.856.15 (0.85%)
Table 8. The three different methods’ “Red edge” position results for aloe yellow leaf.
REP
AOTF-HSLSVCDifference
LFPIT715.61674.27−41.34 (5.8%)
LET721.12669.01−52.11 (7.2%)
FRS715690.924.1 (3.4%)
Table 9. The three different methods’ “Red edge” position results for rubber plant.
REP
AOTF-HSLSVCDifference
LFPIT712.63748.7936.16 (5.1%)
LET722.60726.103.5 (0.5%)
FRS725725.450.45 (0.06%)
Table 10. The three different methods’ “Red edge” position results for radermachera green leaf.
REP
AOTF-HSLSVCDifference
LFPIT712.14709.25−2.89 (0.4%)
LET717.91718.670.76 (0.1%)
FRS715718.853.85 (0.53%)