The 2017 Noneruptive Unrest at the Caldera of Cerro Azul Volcano (Galápagos Islands) Revealed by InSAR Observations and Geodetic Modelling


Abstract
:1. Introduction
2. Background
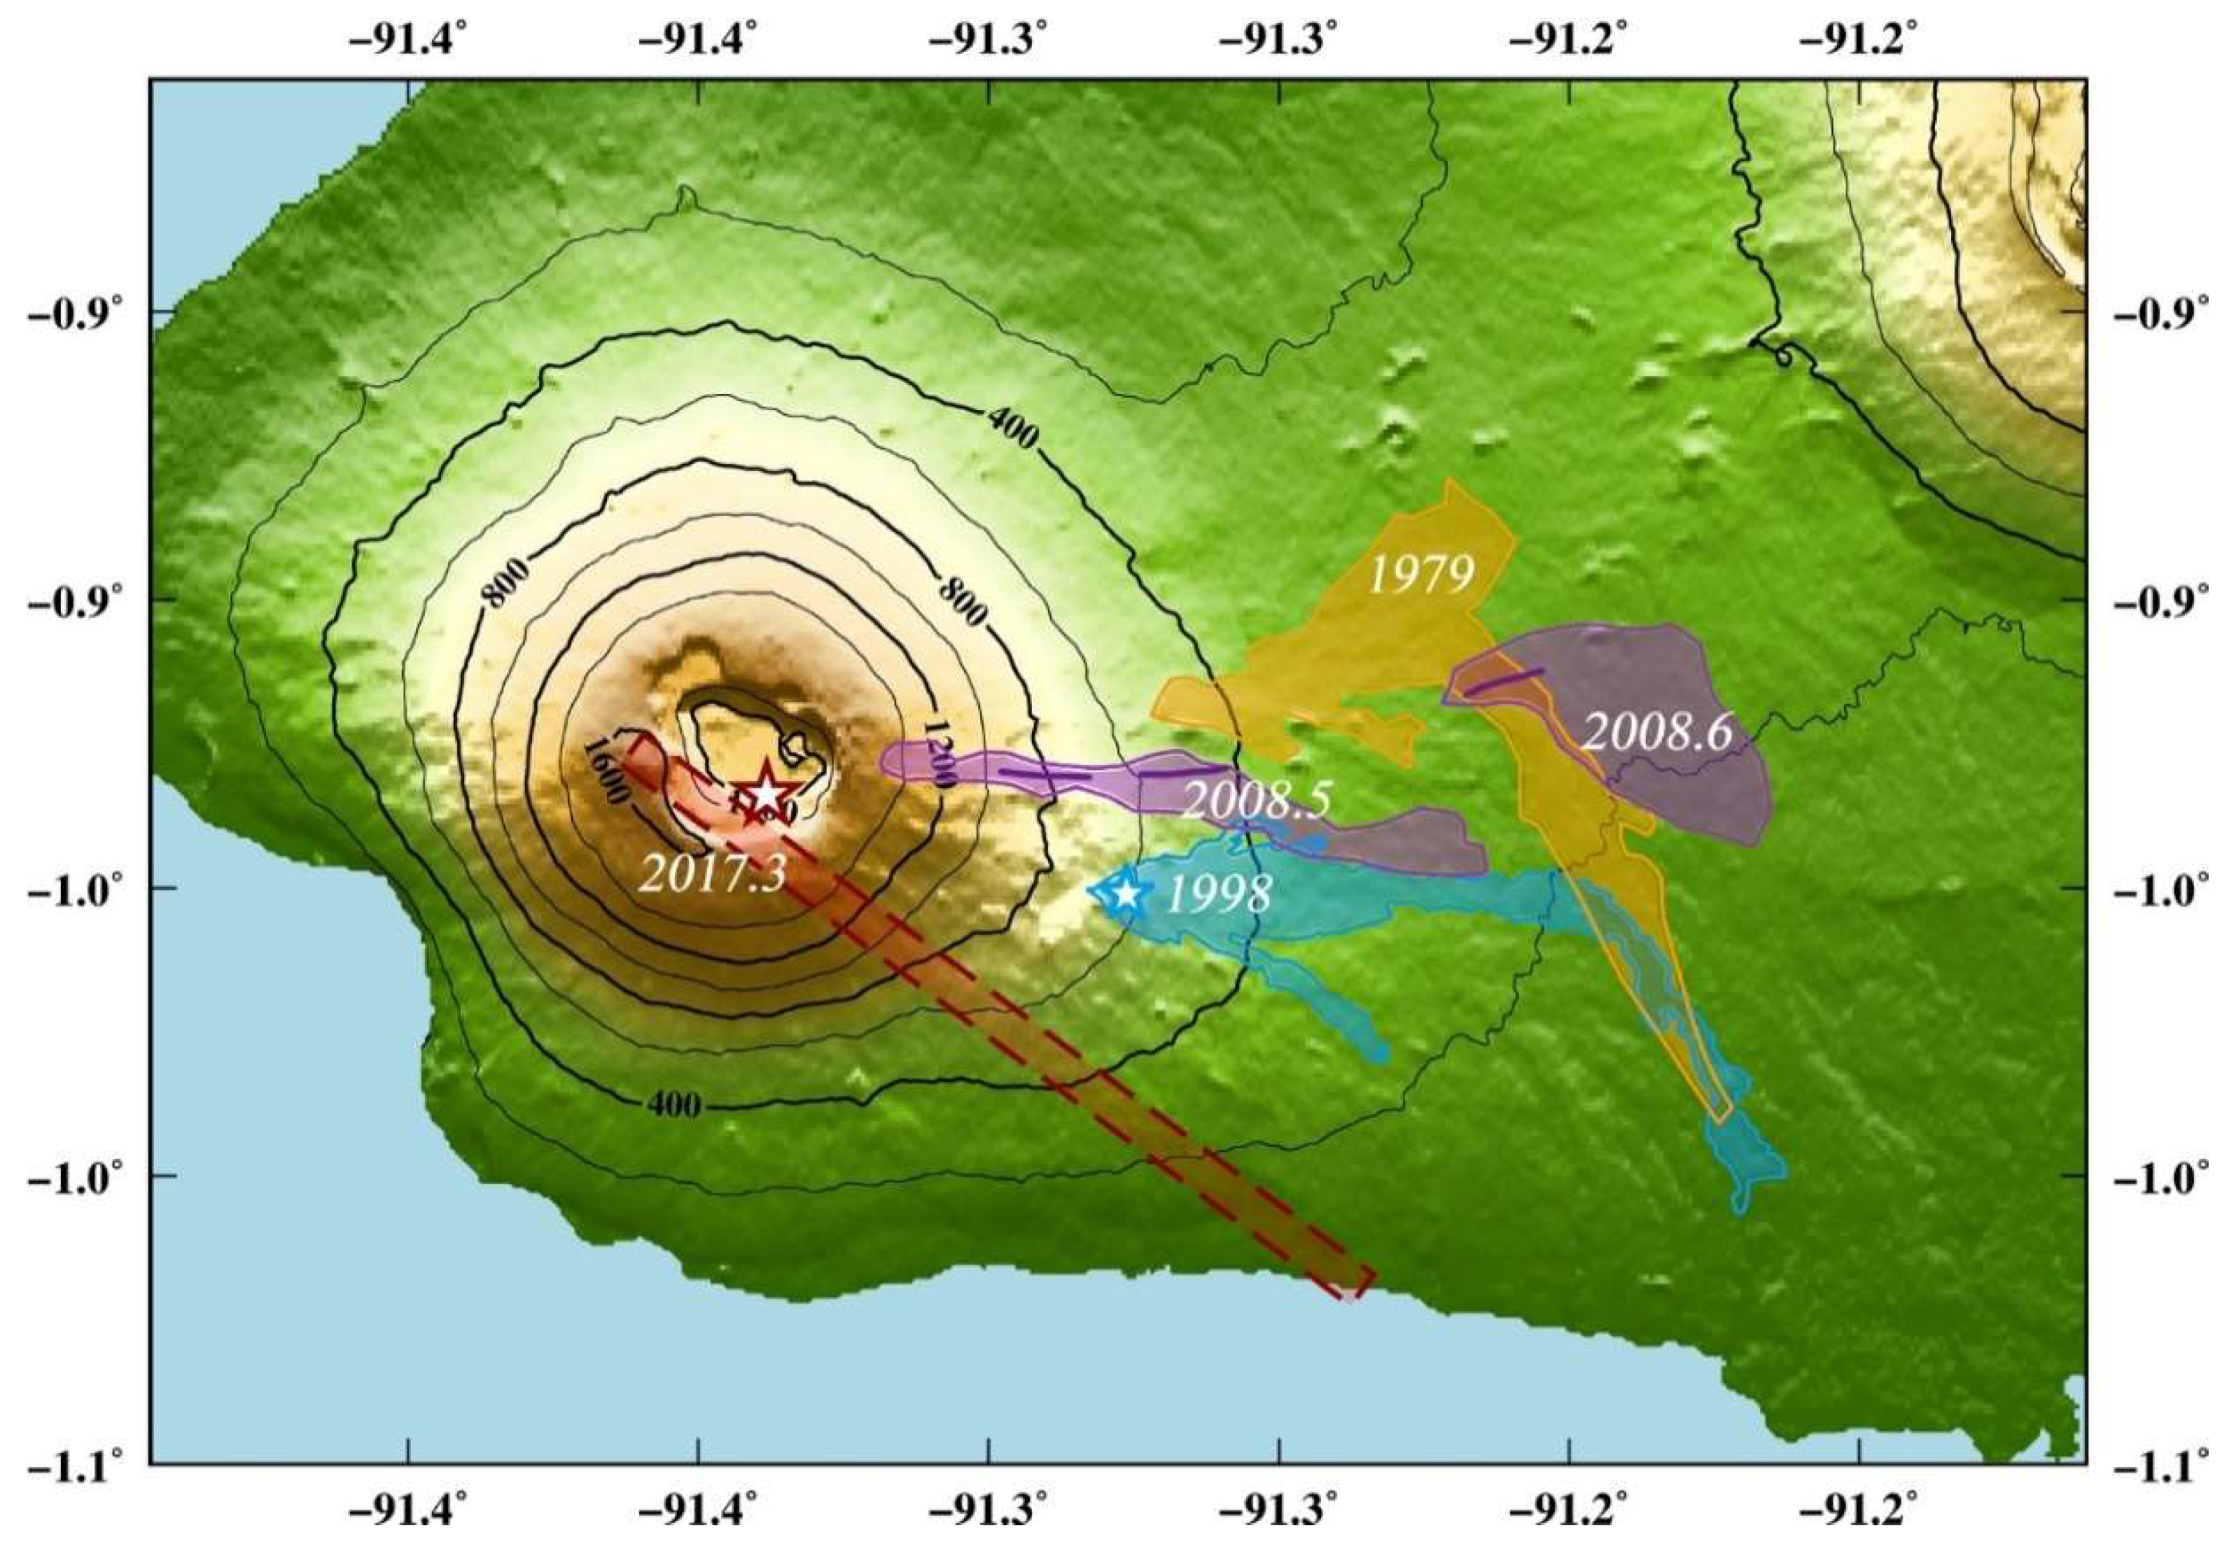
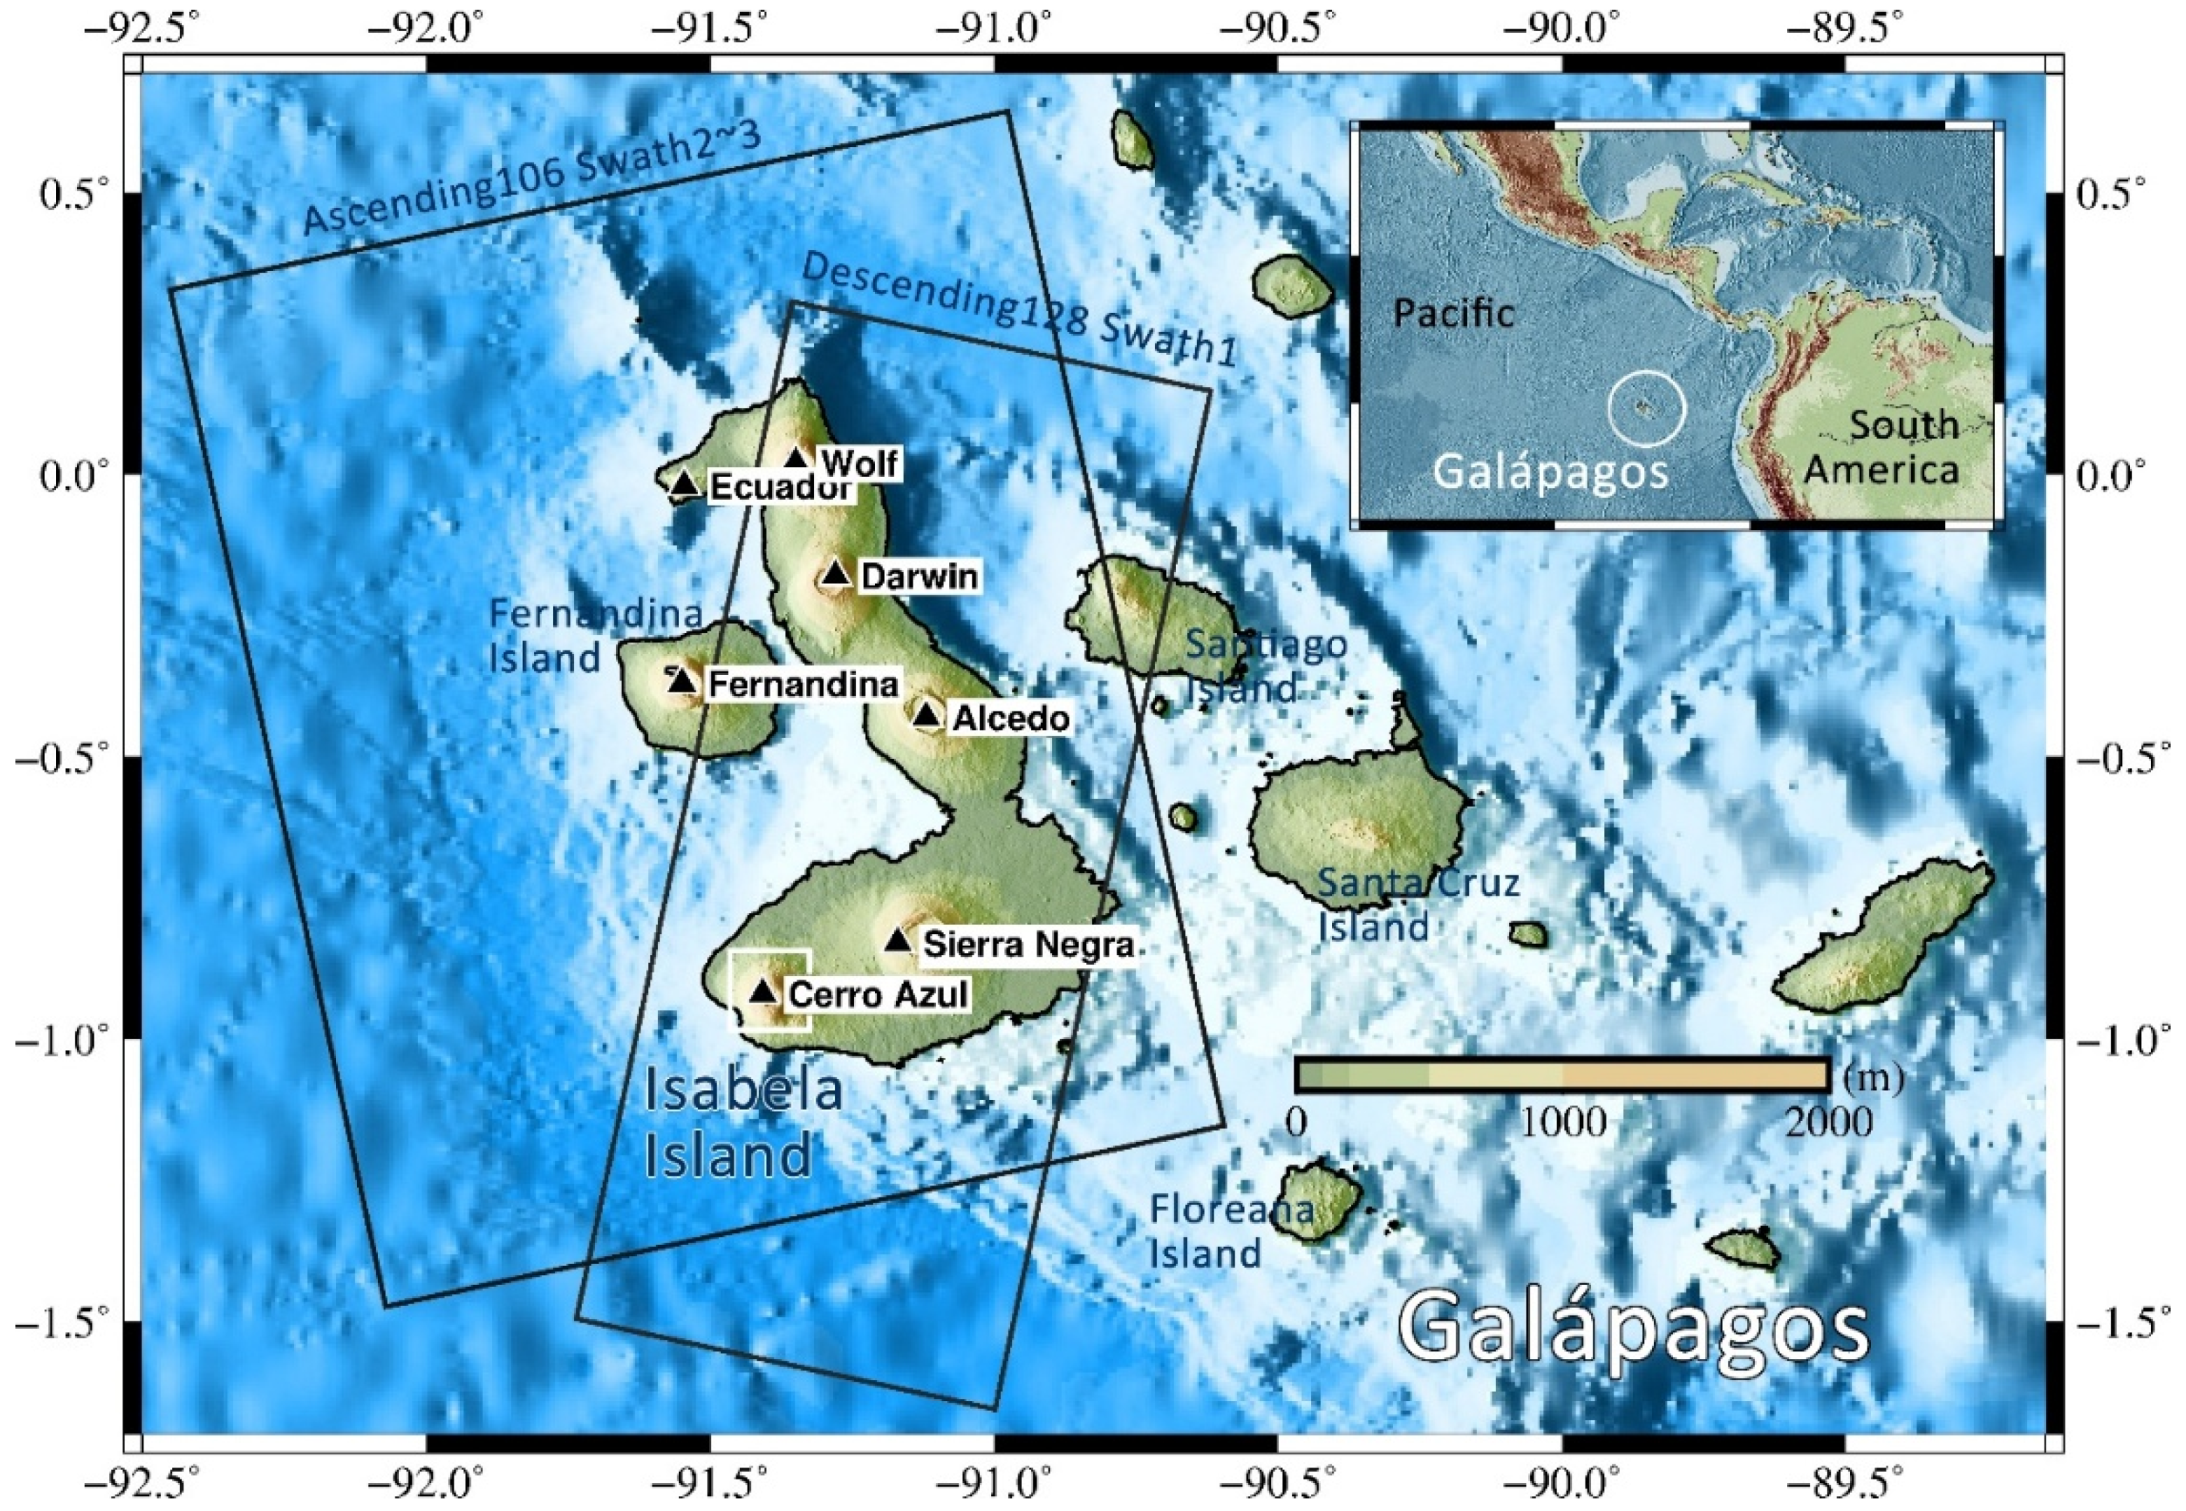
2.1. Geological Setting
2.2. Recent Eruption
3. Data and Methods
4. Results
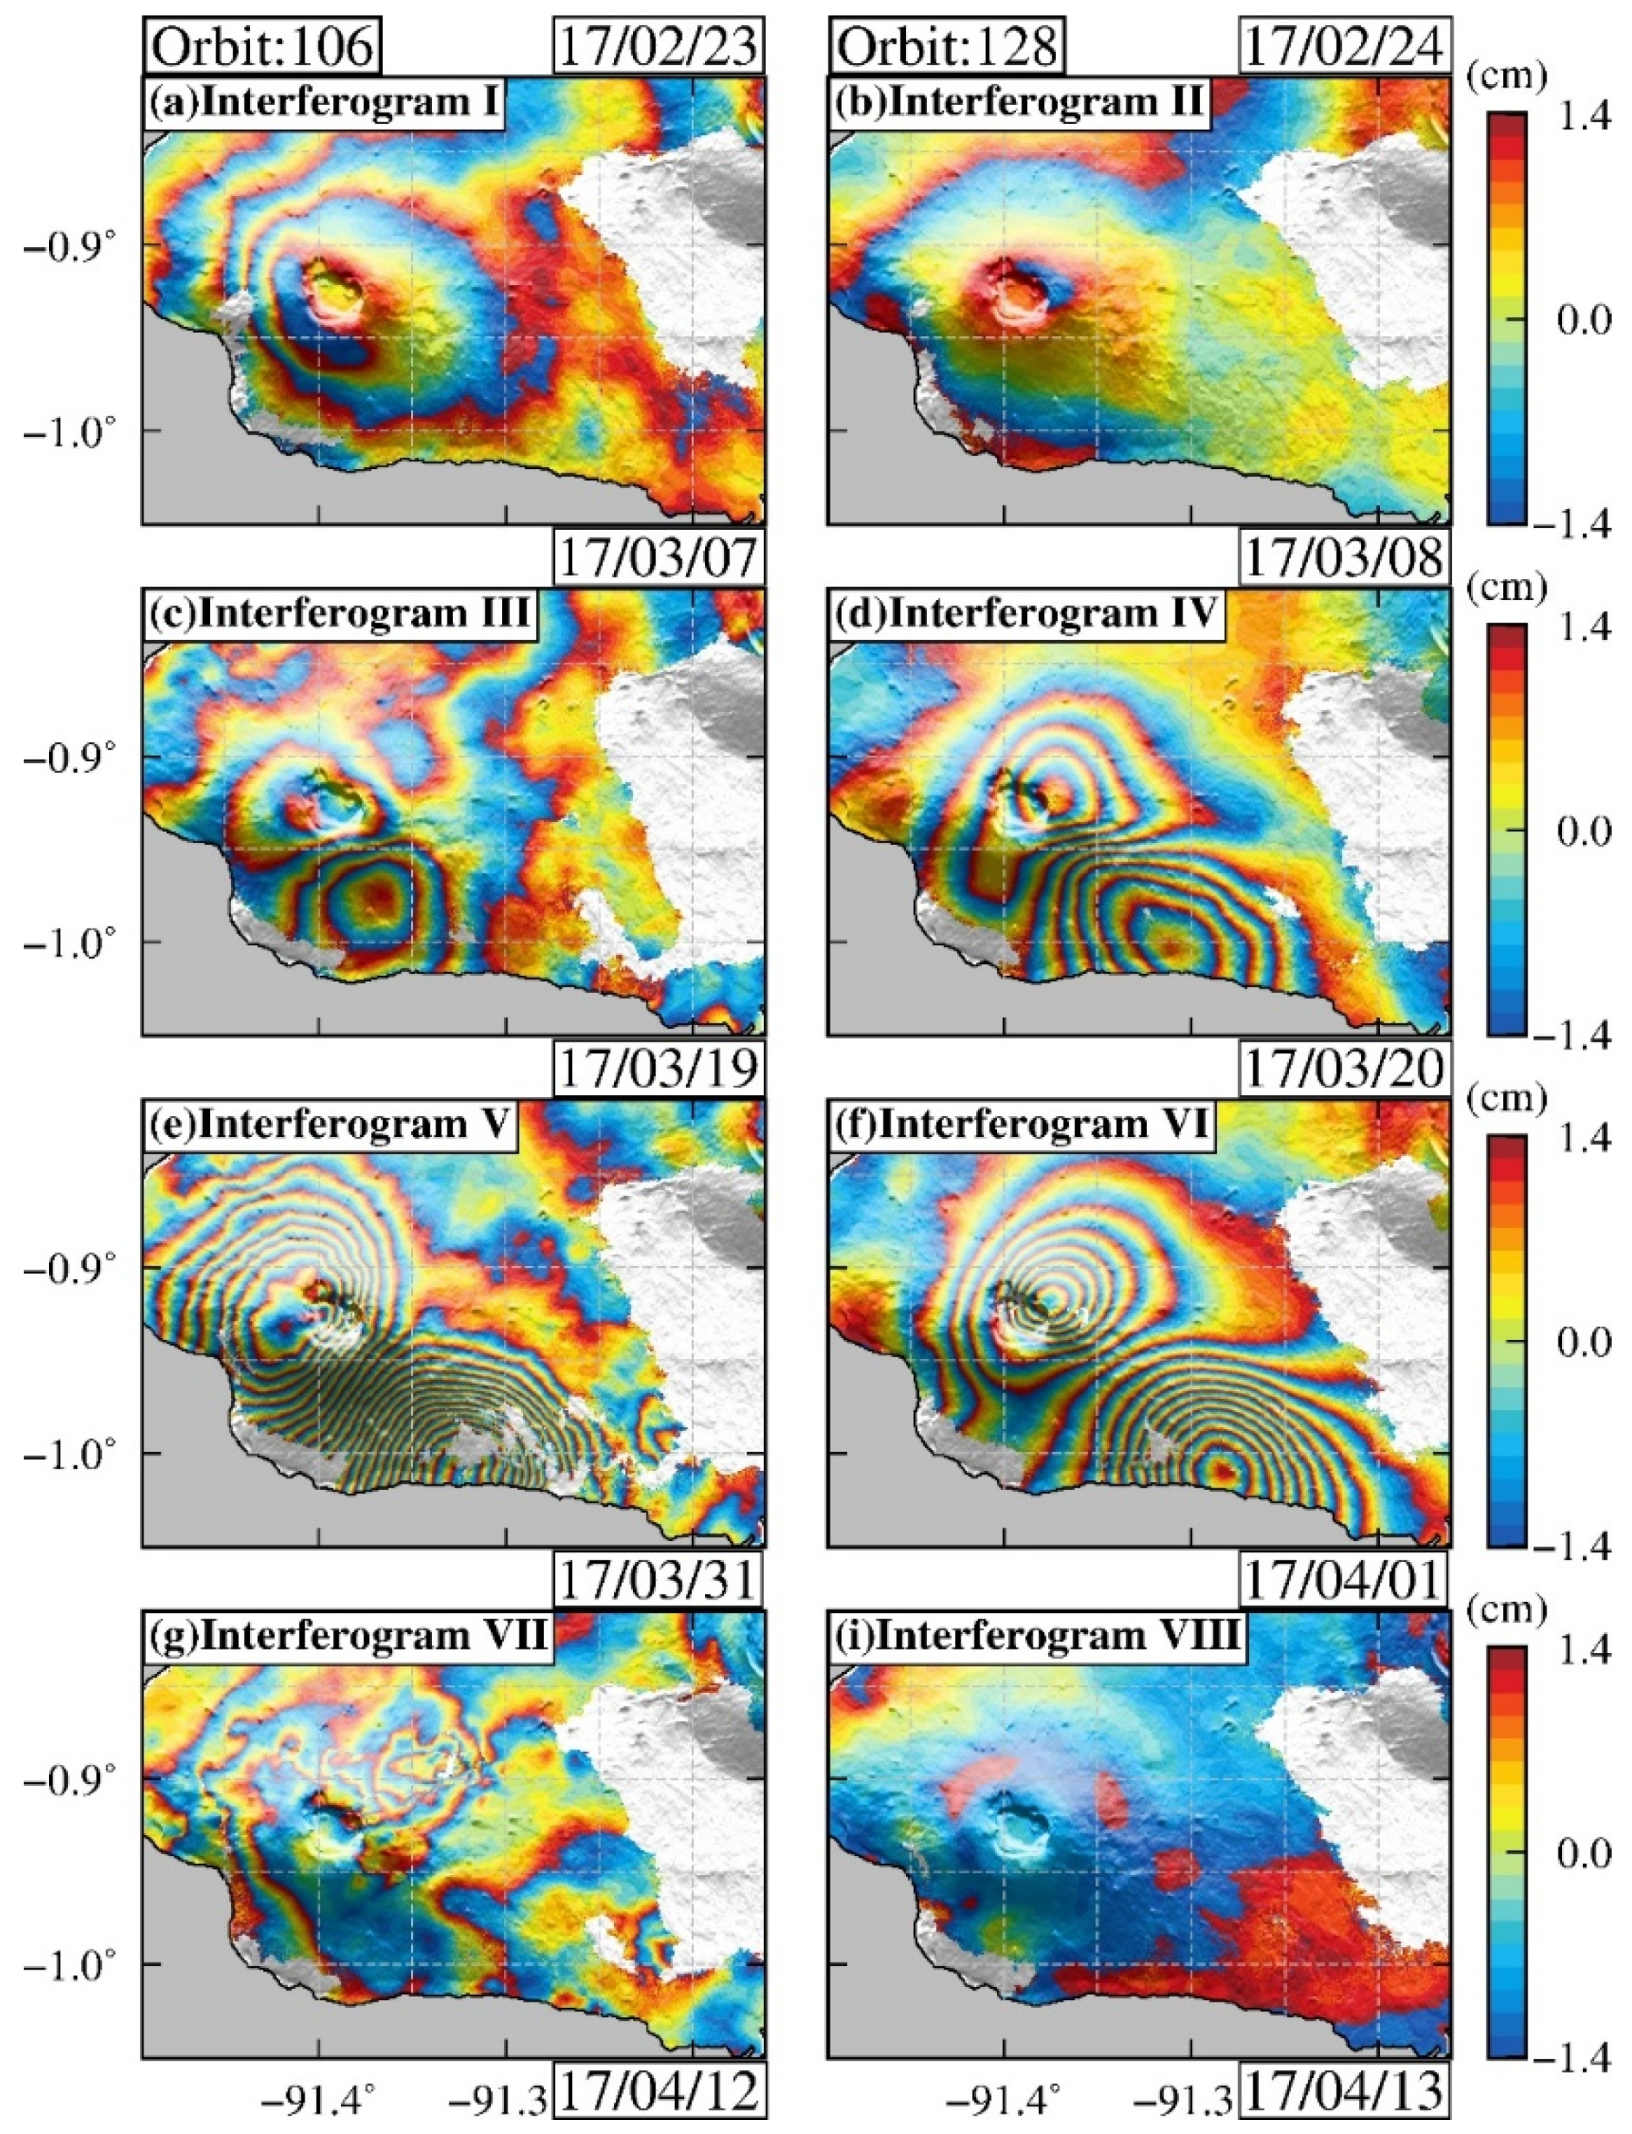
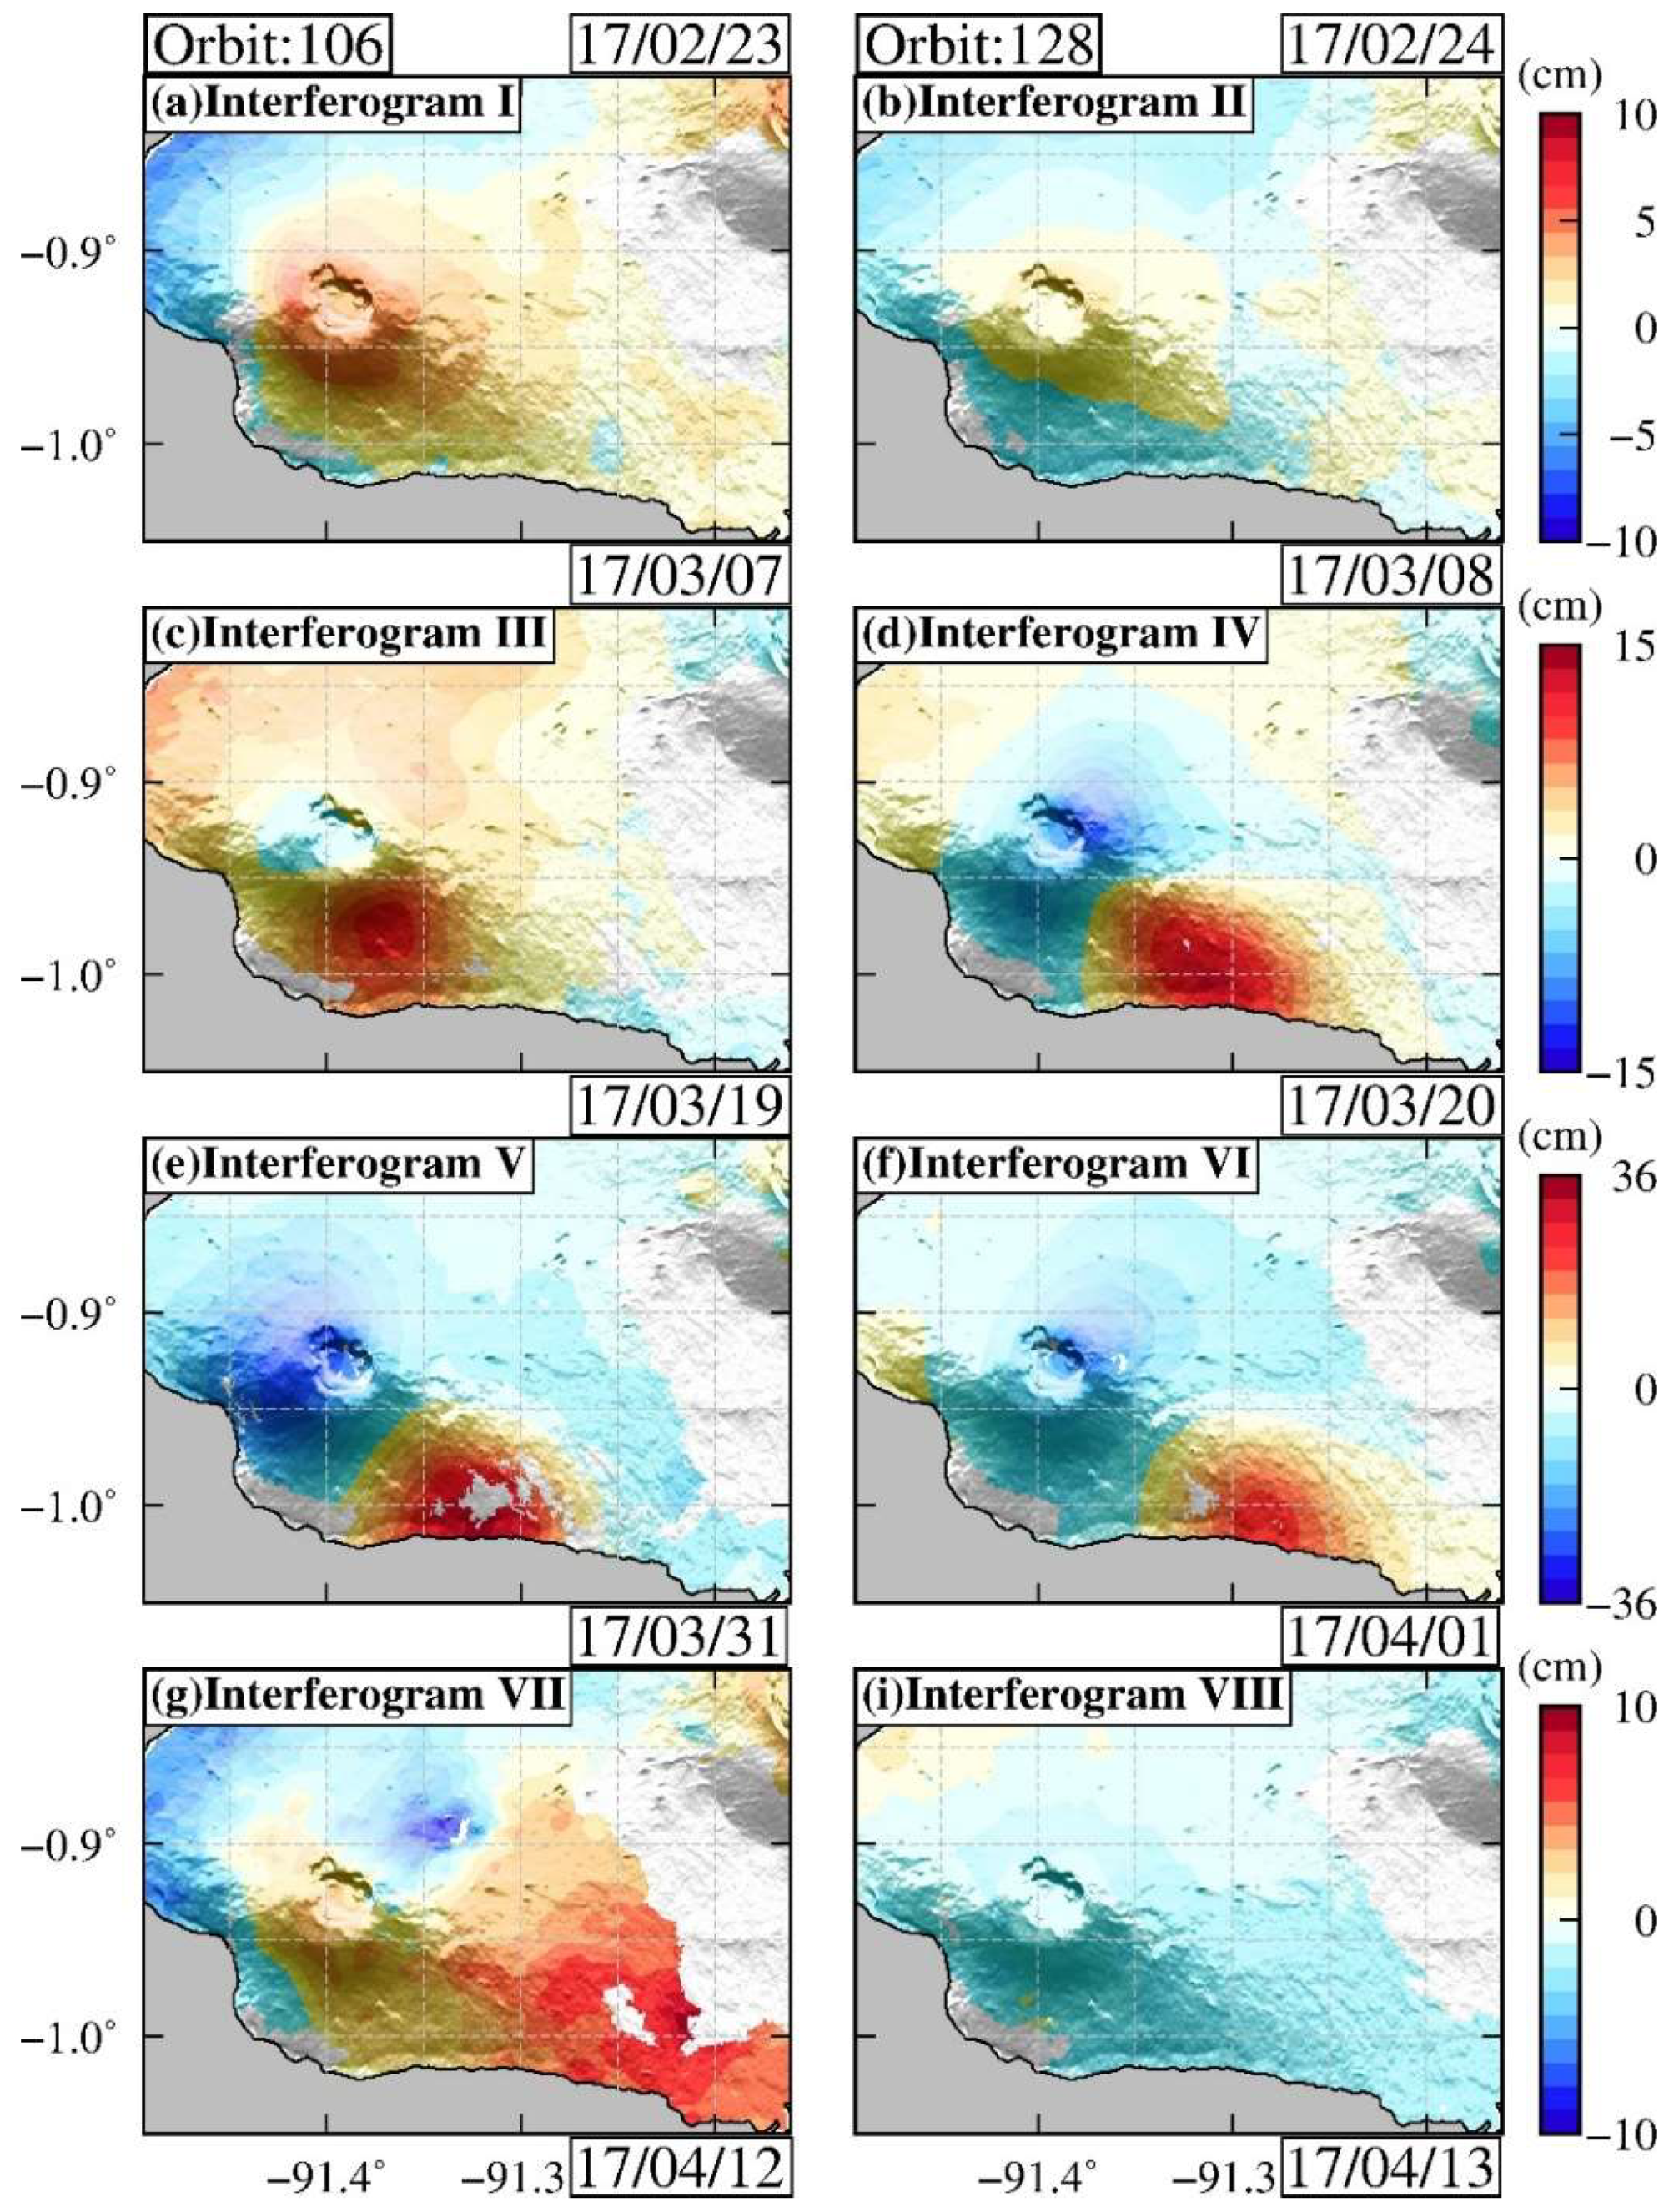
4.1. Surface Deformation
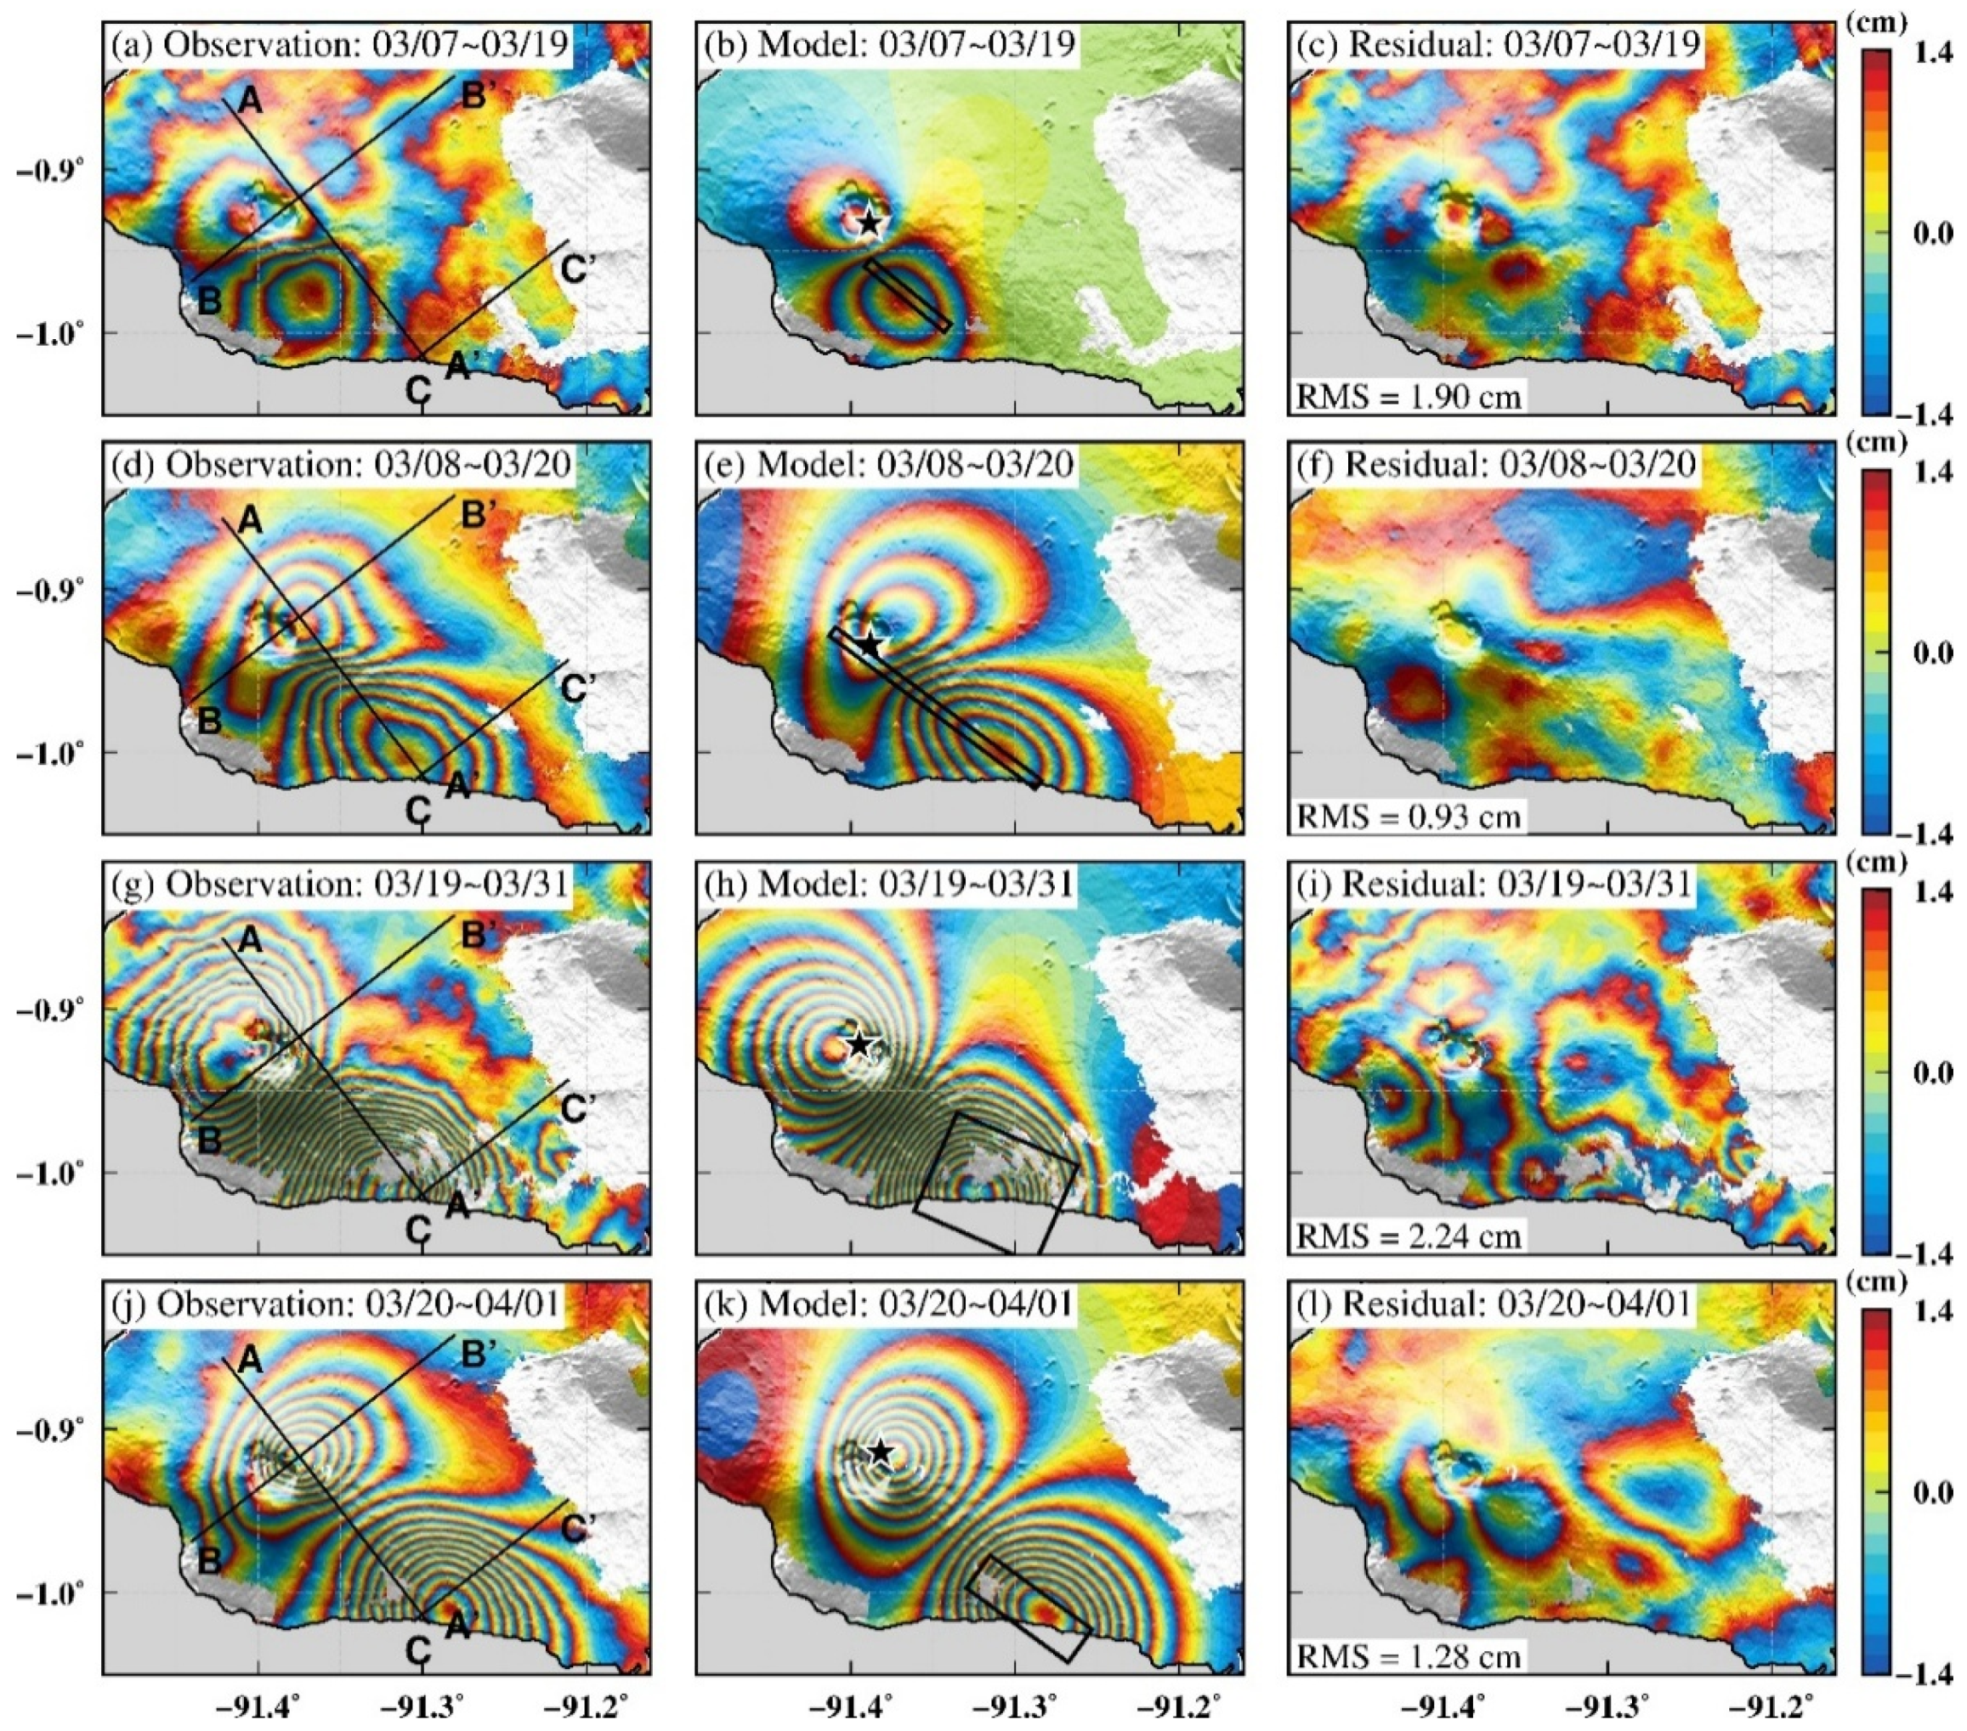
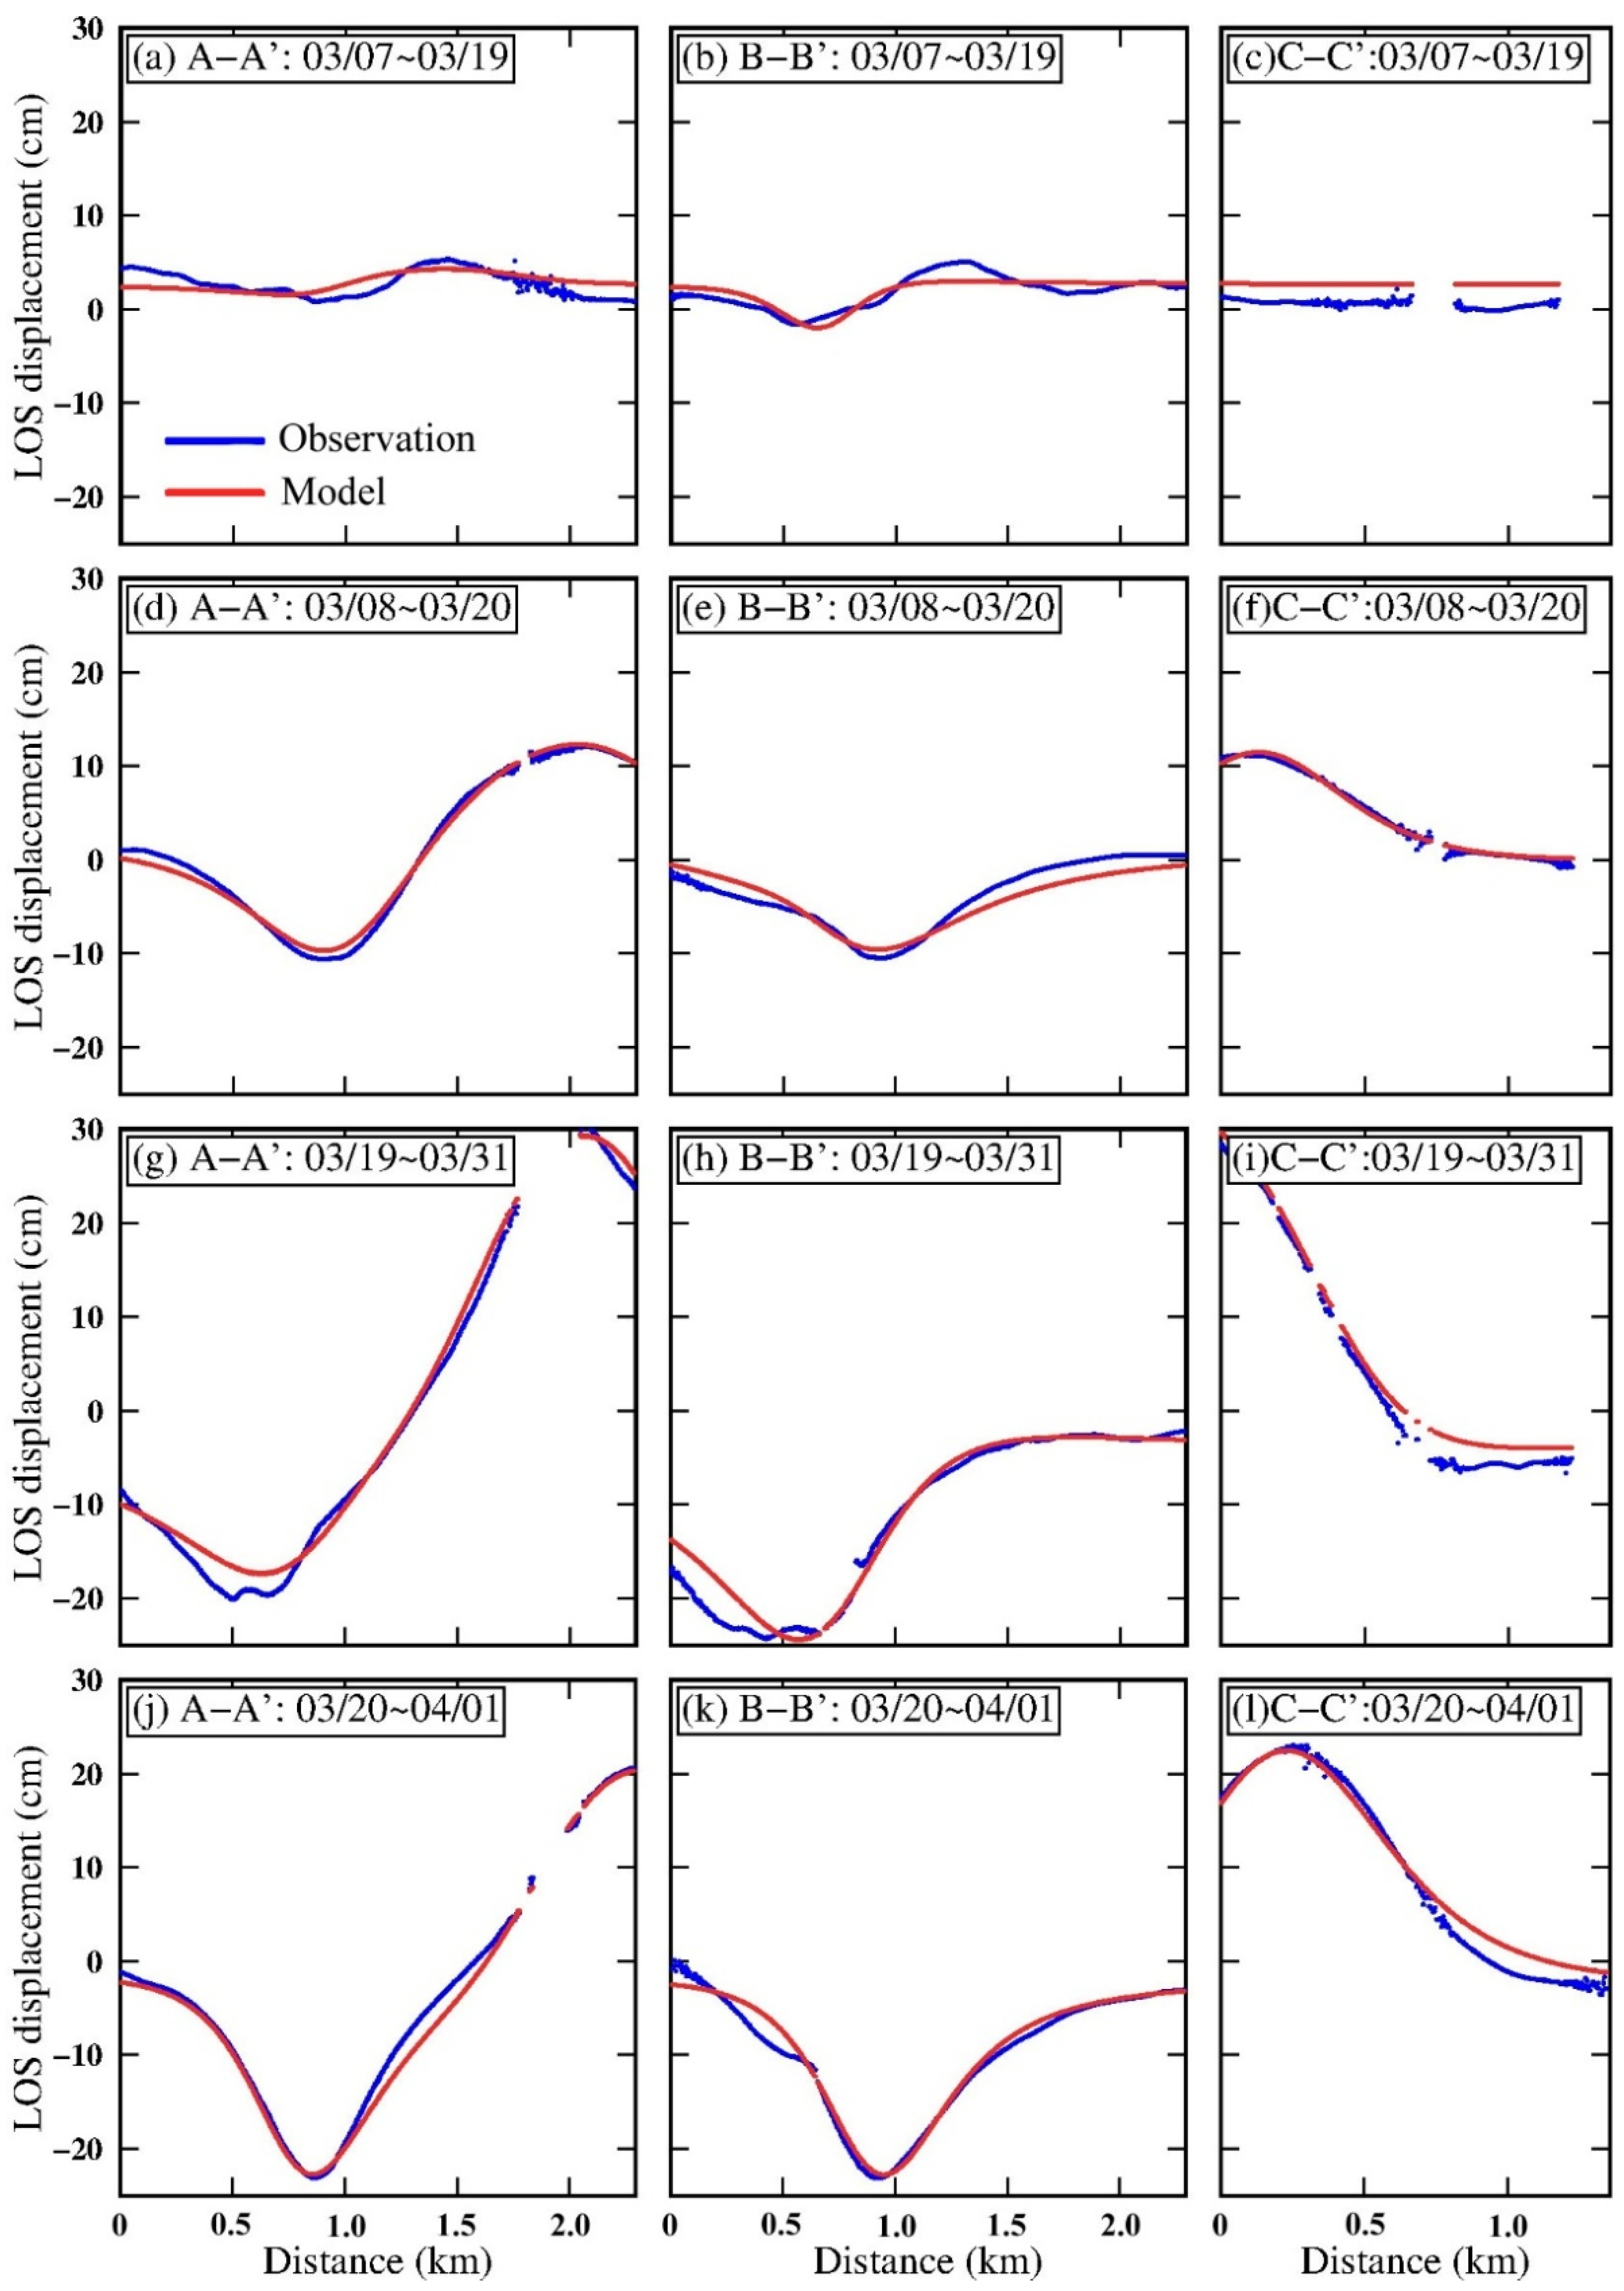
4.2. Geodetic Modelling
5. Discussion
5.1. Interpretation of Four Interferograms in Co-Unrest Period
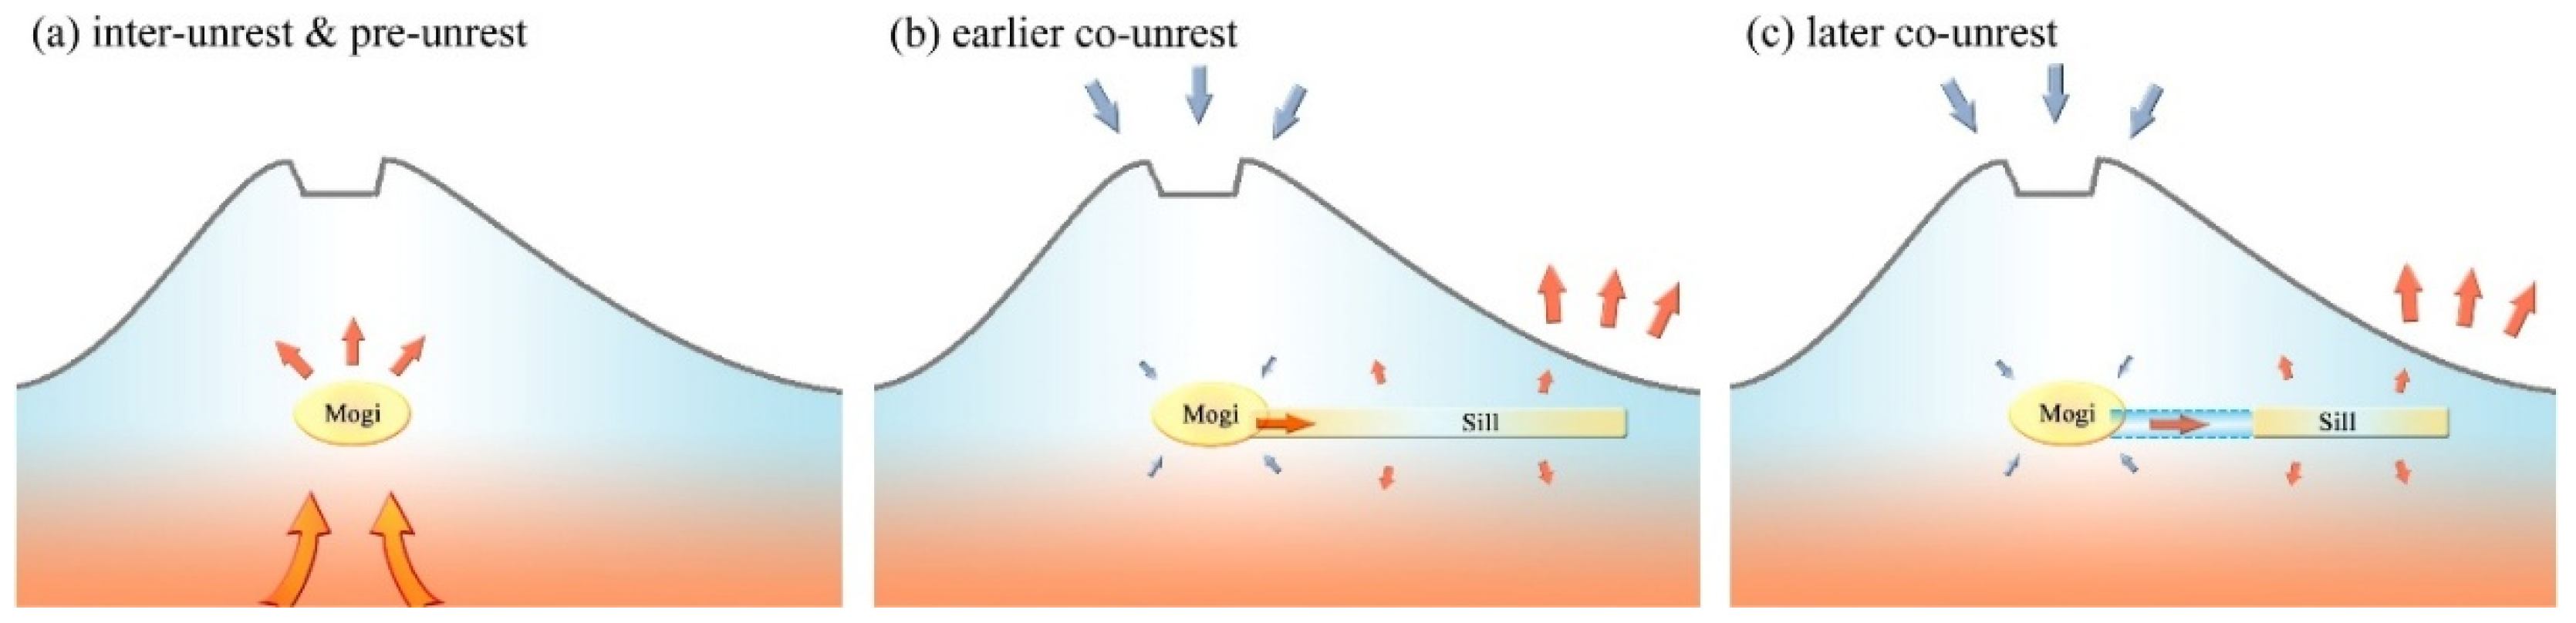
5.2. Conceptual Model for Unrest Event
5.3. Volcanic Hazard
6. Conclusions
Author Contributions
Funding
Acknowledgments
Conflicts of Interest
Appendix A


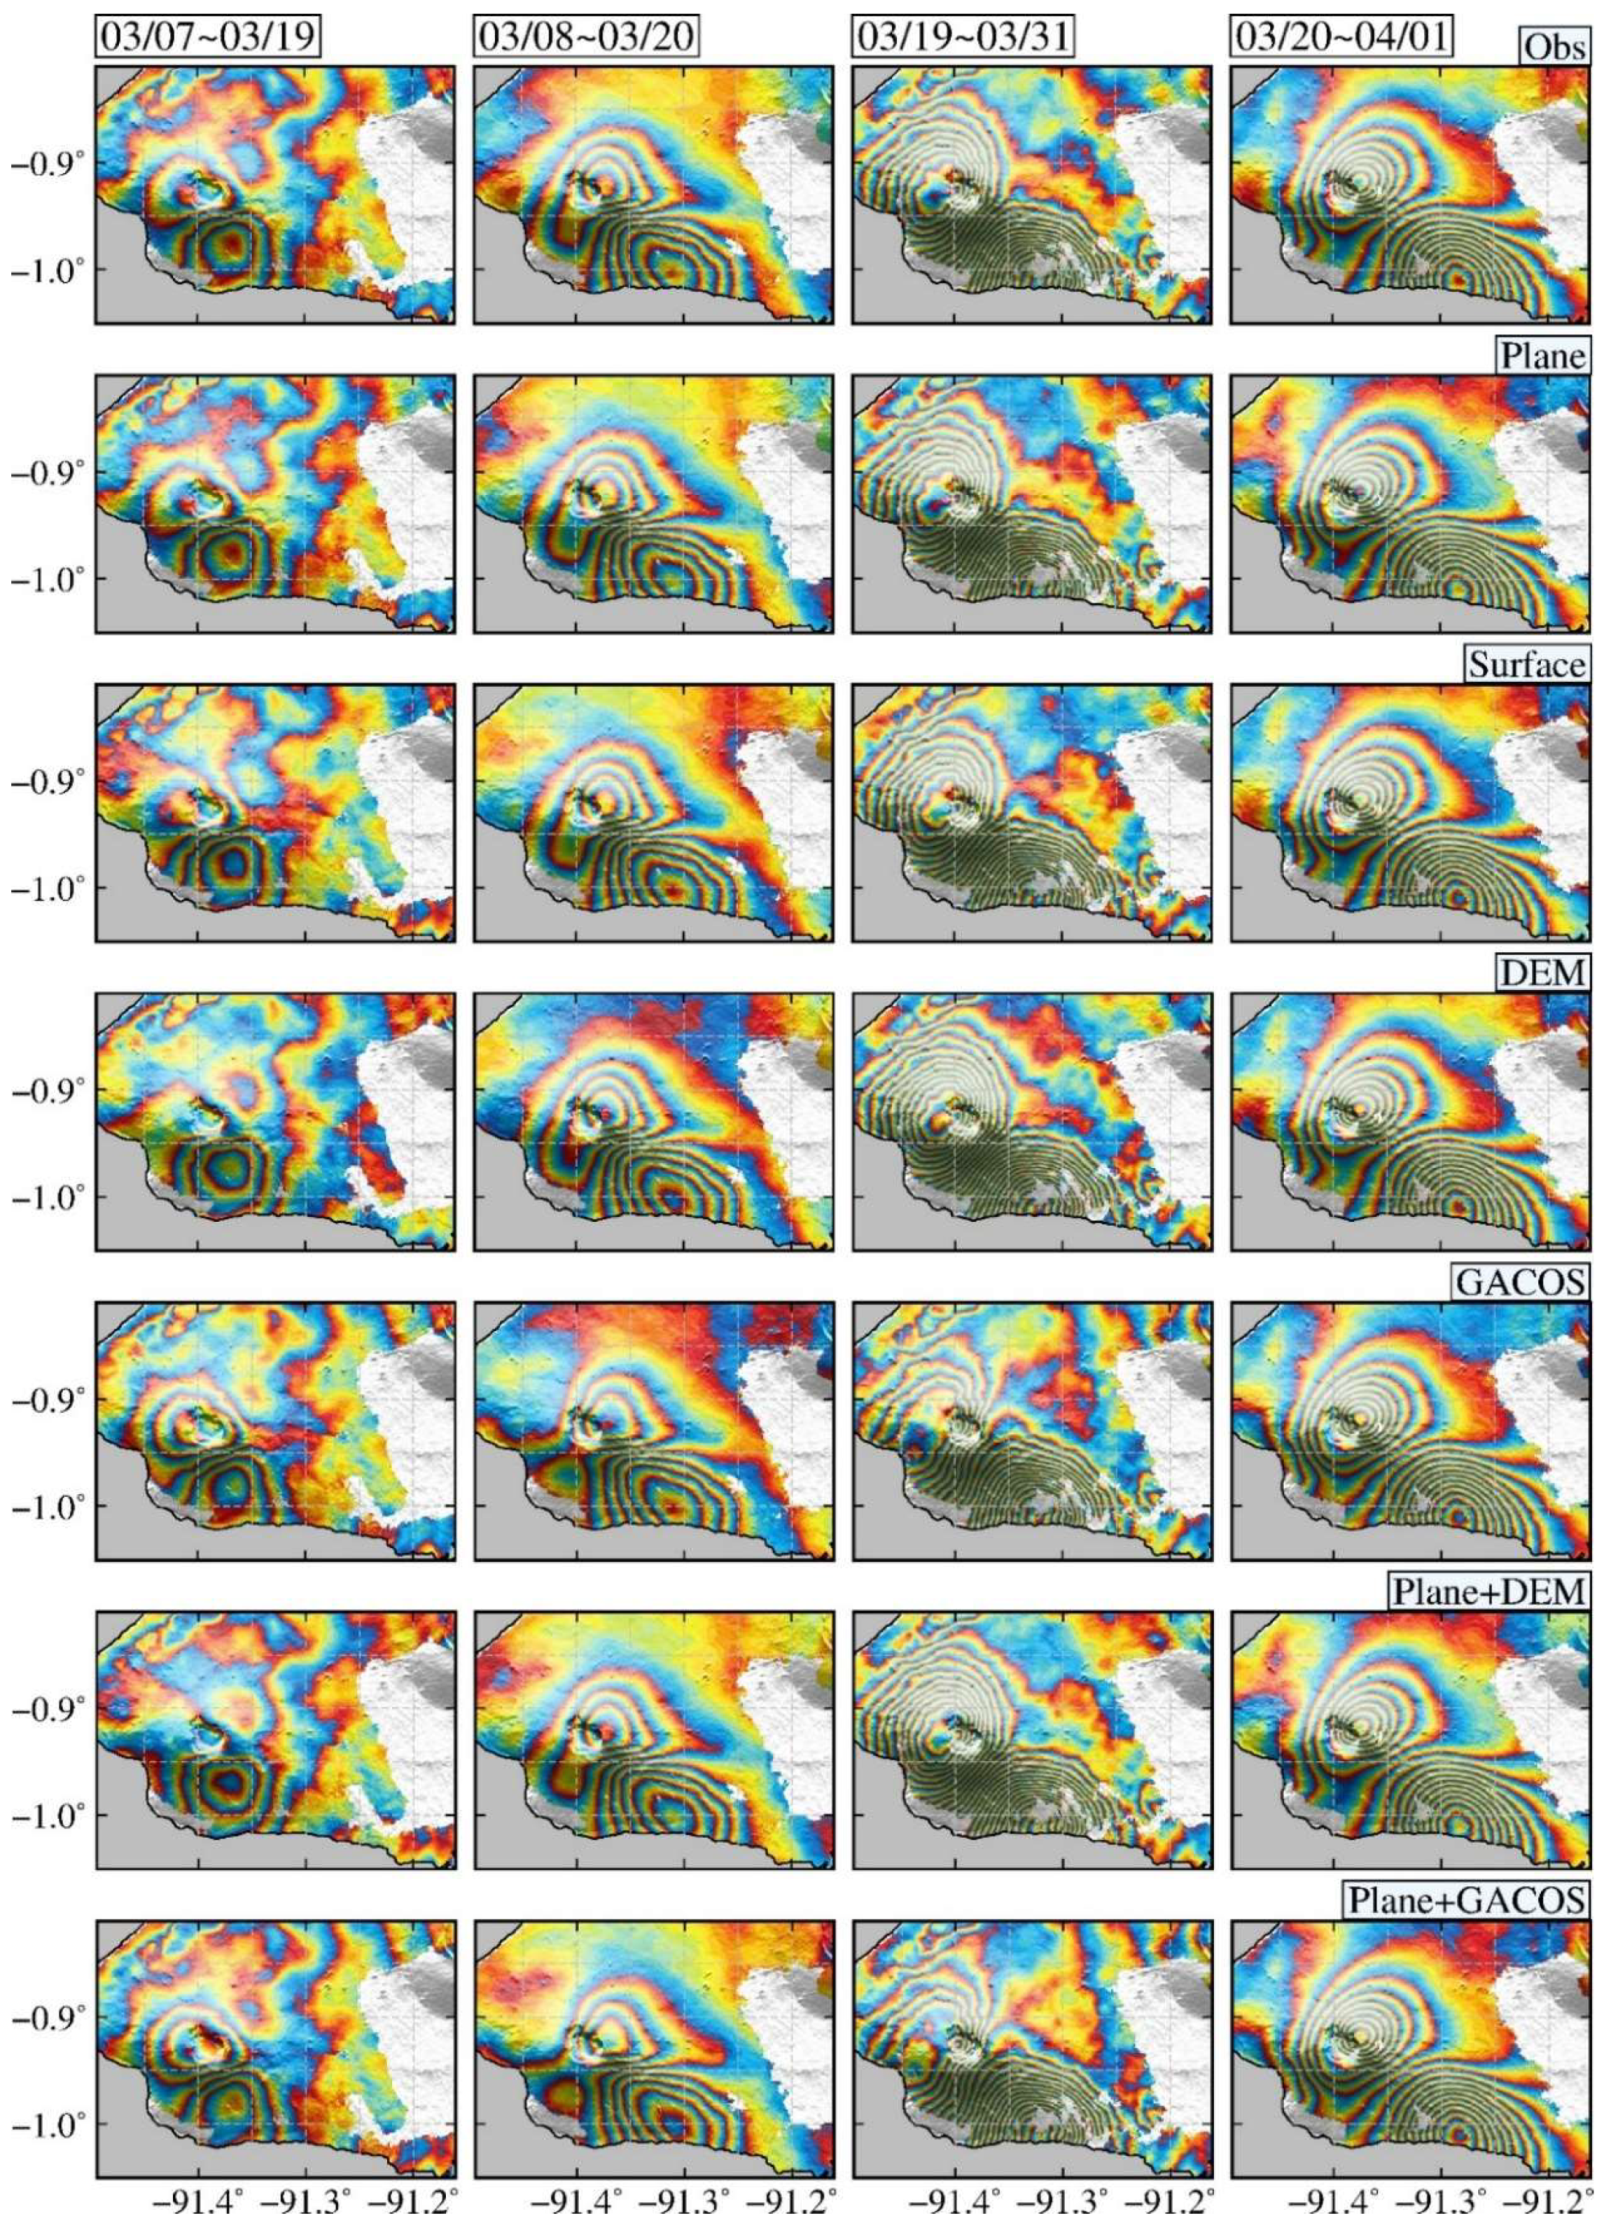
| Interferogram | Observation | Plane † | Quadric Surface ‡ | DEM § | GACOS * | Plane +DEM †† | Plane +GACOS ‡‡ |
|---|---|---|---|---|---|---|---|
| III | 3.93 | 3.95 | 2.85 | 3.87 | 3.72 | 3.91 | 3.75 |
| IV | 0.81 | 0.84 | 0.74 | 0.83 | 0.97 | 0.82 | 0.99 |
| V | 3.12 | 3.07 | 2.41 | 2.77 | 3.68 | 2.89 | 3.87 |
| VI | 0.86 | 0.88 | 0.84 | 0.87 | 1.29 | 0.90 | 1.16 |
References
- Biggs, J.; Ebmeier, S.K.; Aspinall, W.P.; Lu, Z.; Pritchard, M.E.; Sparks, R.S.J.; Mather, T.A. Global link between deformation and volcanic eruption quantified by satellite imagery. Nat. Commun. 2014, 5, 3471. [Google Scholar] [CrossRef] [PubMed]
- Acocella, V.; Di Lorenzo, R.; Newhall, C.; Scandone, R. An overview of recent (1988 to 2014) caldera unrest: Knowledge and perspectives. Rev. Geophys. 2015, 53, 896–955. [Google Scholar] [CrossRef]
- Biggs, J.; Pritchard, M.E. Global volcano monitoring: What does it mean when volcanoes deform? Elements 2017, 13, 17–22. [Google Scholar] [CrossRef]
- Fernández, J.; Pepe, A.; Poland, M.P.; Sigmundsson, F. Volcano Geodesy: Recent developments and future challenges. J. Volcanol. Geotherm. Res. 2017, 344, 1–12. [Google Scholar] [CrossRef]
- Sparks, R.S.J.; Biggs, J.; Neuberg, J.W. Monitoring volcanoes. Science 2012, 335, 1310–1311. [Google Scholar] [CrossRef] [PubMed]
- Galetto, F.; Bagnardi, M.; Acocella, V.; Hooper, A. Noneruptive unrest at the caldera of Alcedo volcano (Galápagos Islands) revealed by InSAR data and geodetic modeling. J. Geophys. Res. Solid Earth 2019, 124, 3365–3381. [Google Scholar] [CrossRef]
- Giudicepietro, F.; Macedonio, G.; Martini, M. A physical model of sill expansion to explain the dynamics of unrest at calderas with application to Campi Flegrei. Front. Earth Sci. 2017, 5, 54. [Google Scholar] [CrossRef]
- Segall, P. Magma chambers: What we can, and cannot, learn from volcano geodesy. Philos. Trans. R. Soc. London A 2019, 377. [Google Scholar] [CrossRef] [PubMed]
- Tizzani, P.; Castaldo, R.; Zeni, G.; Lanari, R.; Battaglia, M.; Pepe, A. Magma and fluid migration at Yellowstone Caldera in the last three decades inferred from InSAR, leveling, and gravity measurements. J. Geophys. Res.-Solid Earth 2015, 120, 2627–2647. [Google Scholar] [CrossRef] [Green Version]
- Traglia, F.D.; Battaglia, M.; Nolesini, T.; Lagomarsino, D.; Casagli, N. Shifts in the eruptive styles at Stromboli in 2010–2014 revealed by ground-based InSAR data. Sci. Rep. 2015, 5, 13569. [Google Scholar] [CrossRef] [PubMed]
- Cannavò, F.; Camacho, A.G.; Gonzalez, P.J.; Mattia, M.; Puglisi, G.; Fernández, J. Real time tracking of magmatic intrusions by means of ground deformation modeling during volcanic crises. Sci. Rep. 2015, 5, 10970. [Google Scholar] [CrossRef] [PubMed]
- Sigmundsson, F.; Hreinsdóttir, S.; Hooper, A.; Árnadóttir, T.; Pedersen, R.; Roberts, M.J.; Óskarsson, N.; Auriac, A.; Decriem, J.; Einarsson, P.; et al. Intrusion triggering of the 2010 Eyjafjallajökull explosive eruption. Nature 2010, 468, 426–430. [Google Scholar] [CrossRef] [PubMed]
- Zhou, S.; Wu, Y. Earthquake geodesy for fifty years—Thinking on subject development. Geod. Geomat. Chn. 2013, 33, 22. [Google Scholar]
- Xu, W.; Jónsson, S.; Ruch, J.; Aoki, Y. The 2015 Wolf volcano (Galápagos) eruption studied using Sentinel-1 and ALOS-2 data. Geophys. Res. Lett. 2016, 43, 9573–9580. [Google Scholar] [CrossRef]
- Schaefer, L.N.; Di Traglia, F.; Chaussard, E.; Lu, Z.; Nolesini, T.; Casagli, N. Monitoring volcano slope instability with Synthetic Aperture Radar: A review and new data from Pacaya (Guatemala) and Stromboli (Italy) volcanoes. Earth-Sci. Rev. 2019, 192, 236–257. [Google Scholar] [CrossRef]
- Bagnardi, M.; Amelung, F. Space-geodetic evidence for multiple magma reservoirs and subvolcanic lateral intrusions at Fernandina Volcano, Galápagos Islands. J. Geophys. Res. 2012, 117. [Google Scholar] [CrossRef]
- Bagnardi, M.; Hooper, A. Inversion of surface deformation data for rapid estimates of source parameters and uncertainties: A Bayesian approach. Geochem. Geophys. Geosyst. 2018, 19, 2194–2211. [Google Scholar] [CrossRef]
- Xu, C.; Gong, Z.; Niu, J. Recent developments in seismological geodesy. Geod. Geodyn. 2016, 7, 157–164. [Google Scholar] [CrossRef]
- Di Traglia, F.; Ciampalini, A.; Pezzo, G.; Battaglia, M. Synthetic Aperture Radar and natural hazards: Applications and outlooks. Front. Earth Sci. 2019, 7, 191. [Google Scholar] [CrossRef]
- Harpp, K.S.; Mittelstaedt, E.; D’Ozouville, N.; Graham, D.W. The Galápagos: A Natural Laboratory for the Earth Sciences; American Geophysical Union: Washington, DC, USA, 2014. [Google Scholar]
- Elliott, J.R.; Nissen, E.K.; England, P.C.; Jackson, J.A.; Lamb, S.; Li, Z.; Parsons, B.; Oehlers, M. Slip in the 2010–2011 Canterbury earthquakes, NewZealand. J. Geophys. Res. 2012, 117. [Google Scholar] [CrossRef]
- Global Volcanism Program (GVP), Report on Cerro Azul (Ecuador)—22 March-28 March 2017. Available online: https://volcano.si.edu/showreport.cfm?doi=GVP.WVAR20170322-353060 (accessed on 26 June 2019).
- Informe Especial Cerro Azul, No. 2–2017—Instituto Geofísico—EPN. Available online: https://www.igepn.edu.ec/servicios/noticias/1473-informe-especial-cerro-azul-no-2-2017 (accessed on 26 June 2019).
- Informe Especial Cerro Azul, No. 3–2017—Instituto Geofísico—EPN. Available online: https://www.igepn.edu.ec/servicios/noticias/1477-informe-especial-cerro-azul-n-3-2017 (accessed on 26 June 2019).
- McBirney, A.R.; Williams, H. Geology and Petrology of the Galapagos Islands; Geological Society of America: Boulder, CO, USA, 1969. [Google Scholar]
- Canales, J.P.; Dañobeitia, J.J.; Detrick, R.S.; Hooft, E.E.E.; Bartolomé, R.; Naar, D.F. Variations in axial morphology along the Galápagos spreading center and the influence of the Galápagos hotspot. J. Geophys. Res. 1997, 102, 27341–27354. [Google Scholar] [CrossRef]
- Canales, J.P.; Ito, G.; Detrick, R.S.; Sinton, J. Crustal thickness along the western Galápagos spreading center and the compensation of the Galápagos hotspot swell. Earth Planet. Sci. Lett. 2002, 203, 311–327. [Google Scholar] [CrossRef]
- Werner, R.; Hoernle, K.; Barckhausen, U.; Hauff, F. Geodynamic evolution of the Galápagos hot spot system (central East Pacific) over the past 20 m. y.: Constraints from morphology, geochemistry, and magnetic anomalies. Geochem. Geophys. Geosyst. 2013, 4. [Google Scholar] [CrossRef]
- Mittelstaedt, E.; Soule, S.; Harpp, K.; Fornari, D.; McKee, C.; Tivey, M.; Geist, D.; Kurz, M.D.; Sinton, C.; Mello, C.; et al. Multiple expressions of plume-ridge interaction in the Galápagos: Volcanic lineaments and ridge jumps. Geochem. Geophys. Geosyst. 2012, 13. [Google Scholar] [CrossRef]
- Geist, D.; Naumann, T.; Larson, P. Evolution of Galápagos magmas: Mantle and crustal fractionation without assimilation. J. Petrol. 1998, 39, 953–971. [Google Scholar] [CrossRef]
- Naumann, T.; Geist, D. Physical volcanology and structural development of Cerro Azul Volcano, Isabela Island, Galápagos: Implications for the development of Galápagos-type shield volcanoes. Bull. Volcanol. 2000, 61, 497–514. [Google Scholar]
- Hooft, E.E.E.; Toomey, D.R.; Solomon, S.C. Anomalously thin transition zone beneath the Galápagos hotspot. Earth Planet. Sci. Lett. 2003, 216, 55–64. [Google Scholar] [CrossRef]
- Gibson, S.A.; Geist, D. Geochemical and geophysical mapping of lithospheric thickness variations beneath Galápagos. Earth Planet. Sci. Lett. 2010, 300, 275–286. [Google Scholar] [CrossRef]
- Villagómez, D.R.; Toomey, D.R.; Geist, D.J.; Hooft, E.E.E.; Solomon, S.C. Mantle flow and multistage melting beneath the Galápagos hotspot revealed by seismic imaging. Nat. Geosci. 2014, 7, 151–156. [Google Scholar] [CrossRef]
- White, W.M.; Mcbirney, A.R.; Duncan, R.A. Petrology and geochemistry of the Galápagos Islands: Portrait of a pathological mantle plume. J. Geophys. Res. Solid Earth 1993, 98, 19533–19563. [Google Scholar] [CrossRef]
- Feighner, M.A.; Richards, M.A. Lithospheric structure and compensation mechanisms of the Galápagos Archipelago. J. Geophys. Res. Solid Earth 1994, 99, 6711–6729. [Google Scholar] [CrossRef]
- Mouginis-Mark, P.J.; Rowland, S.K.; Garbeil, H. Slopes of western Galapagos volcanoes from airborne interferometric radar. Geophys. Res. Lett. 2013, 23, 3767–3770. [Google Scholar] [CrossRef]
- Rowland, S.K.; Munro, D.C. Caldera morphology in the western Galápagos and implications for volcano eruptive behavior and mechanisms of caldera formation. J. Volcanol. Geotherm. Res. 1996, 72, 85–100. [Google Scholar]
- Amelung, F.; Jónsson, S.; Zebker, H.; Segall, P. Widespread uplift and ‘trapdoor’ faulting on Galápagos volcanoes observed with radar interferometry. Nature 2000, 407, 993–996. [Google Scholar] [CrossRef] [PubMed]
- Geist, D.J.; Fornari, D.J.; Kurz, M.D.; Harpp, K.S.; Soule, S.A.; Perfit, M.R.; Koleszar, A.M. Submarine Fernandina: Magmatism at the leading edge of the Galápagos hot spot. Geochem. Geophys. Geosyst. 2013, 7. [Google Scholar] [CrossRef]
- Geist, D.J.; Harpp, K.S.; Naumann, T.R.; Poland, M.P.; Chadwick, W.W.; Hall, M.; Rader, E. The 2005 eruption of Sierra Negra volcano, Galápagos, Ecuador. Bull. Volcanol. 2008, 70, 655–673. [Google Scholar] [CrossRef]
- Chadwick, W.W.; Geist, D.J.; Poland, M.; Jónsson, S.; Johnson, D.J.; Meertens, C.M. A volcano bursting at the seams: Inflation, faulting, and eruption at Sierra Negra volcano, Galapagos. Geology 2006, 34, 1025–1028. [Google Scholar] [CrossRef]
- Chadwick, W.W.; Jonsson, S.; Geist, D.J.; Poland, M.P.; Johnson, D.J.; Batt, S.; Harpp, K.S.; Ruiz, A. The May 2005 eruption of Fernandina volcano, Galápagos: The first circumferential dike intrusion observed by GPS and InSAR. Bull Volcanol. 2011, 73, 679–697. [Google Scholar] [CrossRef]
- Poland, M.P. Contrasting Volcanism in Hawai‘i and the Galápagos. In The Galápagos: A Natural Laboratory for the Earth Sciences; Harpp, K.S., Mittelstaedt, E., d’Ozouville, N., Graham, D.W., Eds.; American Geophysical Union: Washington, DC, USA, 2014; pp. 5–26. [Google Scholar]
- Davidge, L.; Ebinger, C.; Ruiz, M.; Tepp, G.; Amelung, F.; Geist, D.; Coté, D.; Anzieta, J. Seismicity patterns during a period of inflation at Sierra Negra volcano, Galápagos ocean island chain. Earth Planet. Sci. Lett. 2017, 462, 169–179. [Google Scholar] [CrossRef]
- Pepe, S.; Castaldo, R.; De Novellis, V.; De Luca, C.; Casu, F.; Sansosti, E.; Tizzani, P.; D’Auria, L. New insights on the 2012–2013 uplift episode at Fernandina volcano (Galápagos). Geophys. J. Int. 2017, 211, 695–707. [Google Scholar] [CrossRef]
- Global Volcanism Program (GVP). Volcanoes of the World, v. 4.8.0. Venzke, E., Ed.; Smithsonian Institution. Available online: https://doi.org/10.5479/si.GVP.VOTW4-20132013 (accessed on 26 June 2019).
- Farr, T.; Rosen, P.; Caro, E. The shuttle radar topography mission. Rev. Geophys. 2000, 45, 37–55. [Google Scholar] [CrossRef]
- Global Volcanism Program (GVP). Report on Cerro Azul (Ecuador). Bulletin of the Global Volcanism Network; Wunderman, R., Ed.; Smithsonian Institution. Available online: https://doi.org/10.5479/si.GVP.BGVN200805-353060 (accessed on 26 June 2019).
- ESA. Sentinel-1 User Handbooks; ESA: Paris, France, 2013.
- Wegmüller, U.; Werner, C.; Strozzi, T.; Wiesmann, A.; Frey, O.; Santoro, M. Sentinel-1 support in the GAMMA Software. In Proceedings of the Fringe2015: Advances in the Science and Applications of SAR Interferometry and Sentinel-1 InSAR Workshop, Frascati, Italy, 23–27 March 2015. [Google Scholar]
- Wright, T.J.; Gonzalez, P.J.; Walters, R.J.; Hatton, E.L.; Spaans, K.; Hooper, A.J. LiCSAR: Tools for automated generation of Sentinel-1 frame interferograms. In Proceedings of the AGU Fall Meeting, San Francisco, CA, USA, 12–16 December 2016. [Google Scholar]
- Scheiber, R.; Moreira, A. Coregistration of interferometric SAR images using spectral diversity. IEEE Trans. Geosci. Remote Sens. 2000, 39, 2179–2191. [Google Scholar] [CrossRef]
- Jonsson, S. Fault Slip Distribution of the 1999 Mw 7.1 Hector Mine, California, earthquake, estimated from Satellite Radar and GPS measurements. Bull. Seismol. Soc. Am. 2002, 92, 1377–1389. [Google Scholar] [CrossRef]
- Hastings, W.K. Monte Carlo sampling methods using Markov chains and their applications. Biometrika 1970, 57, 97–109. [Google Scholar] [CrossRef]
- Mosegaard, K.; Tarantola, A. Monte Carlo sampling of solutions to inverse problems. J. Geophys. Res. 1995, 100, 12431–12447. [Google Scholar] [CrossRef]
- Wright, T.J. Toward mapping surface deformation in three dimensions using InSAR. Geophys. Res. Lett. 2004, 31, 169–178. [Google Scholar] [CrossRef]
- Liu, Y.; Xu, C.; Wen, Y.; He, P.; Jiang, G. Fault rupture model of the 2008 Dangxiong (Tibet, China) Mw 6.3 earthquake from Envisat and ALOS data. Adv. Space Res. 2012, 50, 952–962. [Google Scholar] [CrossRef]
- Wen, Y.; Xu, C.; Liu, Y.; Jiang, G. Deformation and source parameters of the 2015 Mw 6.5 earthquake in Pishan, western China, from Sentinel-1A and ALOS-2 data. Remote Sens. 2016, 8, 134. [Google Scholar] [CrossRef]
- Pritchard, M.E.; Simons, M.; Rosen, P.A.; Hensley, S.; Webb, F.H. Co-seismic slip from the 1995 July 30 Mw = 8.1 Antofagasta, Chile, earthquake as constrained by InSAR and GPS observations. Geophys. J. Int. 2002, 150, 362–376. [Google Scholar] [CrossRef]
- Wright, T.J. Constraining the slip distribution and fault geometry of the Mw 7.9, 3 November 2002, Denali fault earthquake with Interferometric Synthetic Aperture Radar and Global Positioning System data. Bull. Seismol. Soc. Am. 2004, 94, S175–S189. [Google Scholar] [CrossRef]
- Hanssen, R.F. High-Resolution water vapor mapping from Interferometric Radar measurements. Science 1999, 283, 1297–1299. [Google Scholar] [CrossRef] [PubMed]
- Kim, J.R.; Lin, S.Y.; Yun, H.W.; Tsai, Y.L.S.; Seo, H.J.; Hong, S.; Choi, Y. Investigation of potential volcanic risk from Mt. Baekdu by DInSAR time series analysis and atmospheric correction. Remote Sens. 2017, 9, 138. [Google Scholar] [CrossRef]
- Yu, C.; Li, Z.; Penna, N.T. Interferometric synthetic aperture radar atmospheric correction using a GPS-based iterative tropospheric decomposition model. Remote Sens. Environ. 2018, 204, 109–121. [Google Scholar] [CrossRef]
- Yu, C.; Li, Z.; Penna, N.T.; Crippa, P. Generic atmospheric correction model for Interferometric Synthetic Aperture Radar observations. J. Geophys. Res. Solid Earth 2018, 123, 9202–9222. [Google Scholar] [CrossRef]
- Yu, C.; Penna, N.T.; Li, Z. Generation of real-time mode high-resolution water vapor fields from GPS observations. J. Geophys. Res. Atmos. 2017, 122, 2008–2025. [Google Scholar] [CrossRef]
- Lisowski, M.; Dzurisin, D.; Denlinger, R.P.; Iwatsubo, E.Y. Analysis of GPS-measured deformation associated with the 2004–2006 dome-building eruption of Mount St. Helens, Washington. In A Volcano Rekindled: The Renewed Eruption of Mount St. Helens, 2004–2006; USGS: Reston, VA, USA, 2008. [Google Scholar]
- Segall, P. Earthquake and Volcano Deformation; Princeton University Press: Princeton, NJ, USA, 2010. [Google Scholar]
- Segall, P. Repressurization following eruption from a magma chamber with a viscoelastic aureole. J. Geophys. Res. Solid Earth 2016, 121, 8501–8522. [Google Scholar] [CrossRef]
- Mogi, K. Relations between the eruption of various volcanoes and the deformations of the ground surfaces around them. Bull. Earthq. Res. Inst. 1958, 36, 99–134. [Google Scholar]
- Okada, Y. Surface deformation due to shear and tensile faults in a half-space. Bull. Seismol. Soc. Am. 1986, 23, 128. [Google Scholar]
- Centre for the Observation and Modelling of Earthquakes, Volcanoes and Tectonics (COMET). Intrusive activity at Cerro Azul volcano, Galápagos Islands (Ecuador). Available online: https://comet.nerc.ac.uk/intrusive-activity-cerro-azul-volcano-galapagos-islands-ecuador/ (accessed on 26 June 2019).
- Naumann, T.; Geist, D. Petrology and geochemistry of volcán Cerro Azul: Petrologic diversity among the western Galápagos volcanoes. J. Petrol. 2002, 43, 859–883. [Google Scholar] [CrossRef]
- Mouginis-Mark, P.J.; Snell, H.; Ellisor, R. GOES satellite and field observations of the 1998 eruption of Volcan Cerro Azul, Galapagos Islands. Bull. Volcanol. 2000, 62, 188–198. [Google Scholar] [CrossRef]
- Rowland, S.K.; Harris, A.J.L.; Wooster, M.J.; Amelung, F.; Garbeil, H.; Wilson, L.; Mouginis-Mark, P.J. Volumetric characteristics of lava flows from interferometric radar and multispectral satellite data: The 1995 Fernandina and 1998 Cerro Azul eruptions in the western Galapagos. Bull. Volcanol. 2003, 65, 311–330. [Google Scholar] [CrossRef]
- Teasdale, R.; Geist, D.; Kurz, M.; Harpp, K. 1998 Eruption at Volcán Cerro Azul, Galápagos Islands: I. Syn-Eruptive Petrogenesis. Bull. Volcano 2005, 67, 170–185. [Google Scholar] [CrossRef]


| Interferogram Pair | Unrest Period | Ascending Track 106 | Descending Track 128 | ||
|---|---|---|---|---|---|
| MMDD-MMDD | † (m) | MMDD-MMDD | (m) | ||
| I–II | Pre-unrest | 0223–0307 | 61.5 | 0224–0308 | –59.8 |
| III–IV | Co-unrest | 0307–0319 | –59.1 | 0308–0320 | 25.6 |
| V–VI | 0319–0331 | –12.8 | 0320–0401 | 32.8 | |
| VII–VIII | Post-unrest | 0331–0412 | –57.2 | 0401–0413 | 43.3 |
| Interferogram Pair | Time | Mogi | Longitude (°) | Latitude (°) | Depth (m) | Volume (m3) | |||
|---|---|---|---|---|---|---|---|---|---|
| Sill | Longitude (°) | Latitude (°) | Depth (m) | Length (m) | Width (m) | Strike (°) | Opening (m) | ||
| III | 3.7~3.19 | –91.3889 [–91.3914/–91.3863] | –0.9332 [–0.9349/–0.9309] | 3203 [2933/3502] | –3.34×10⁶ [–3.78×10⁶/–2.78×106] | ||||
| –91.3675 [–91.3697/–91.3659] | –0.9798 [–0.9832/–0.9790] | 4810 [4500/5062] | 7010 [7002/7191] | 709 [642/1091] | 129 [112.0/140.0] | 1.29 [0.85/11.30] | |||
| IV | 3.8~3.20 | –91.3882 [–91.3909/–91.3784] | –0.9339 [–0.9366/–0.9287] | 5952 [5687/7042] | –3.58×10⁷ [–4.11×10⁷/–2.51×107] | ||||
| –91.3504 [–91.3527/–91.3341] | –0.9755 [–0.9877/–0.9741] | 5772 [5366/6387] | 17419 [12900/18131] | 733 [405/876] | 127 [122.8/130.2] | 2.46 [1.93/4.11] | |||
| V | 3.19~3.31 | –91.3949 [–91.4028/–91.3903] | –0.9221 [–0.9308/–0.9160] | 5976 [5186/7497] | –4.37×10⁷ [–6.54×10⁷/–3.29×107] | ||||
| –91.3246 [–91.3551/–91.3033] | –1.0400 [–1.0725/–1.0374] | 5363 [5128/7831] | 8932 [3794/9092] | 7287 [2728/10121] | 114 [147.0/177.6] | 0.88 [0.80/3.52] | |||
| VI | 3.20~4.1 | –91.3823 [–91.3836/–91.3809] | –0.9135 [–0.9153/–0.9124] | 4450 [4221/4778] | –1.92×10⁷ [–2.18×10⁷/–1.72×107] | ||||
| –91.2951 [–91.2950/–91.2891] | –1.0134 [–1.0181/–1.0103] | 6623 [6491/7084] | 8985 [7904/8966] | 1184 [985/1380] | 124 [119.8/133.8] | 3.62 [3.20/4.65] | |||
| Interferogram Pair | † | ‡ | § |
|---|---|---|---|
| (m3) | (m3) | - | |
| III | 3.34 × 10⁶ | 6.39 × 10⁶ | 0.478 |
| IV | 3.58 × 10⁷ | 3.15 × 10⁷ | 0.137 |
| V | 4.37 × 10⁷ | 5.71 × 10⁷ | 0.235 |
| VI | 1.92 × 10⁷ | 3.84 × 10⁷ | 0.500 |
© 2019 by the authors. Licensee MDPI, Basel, Switzerland. This article is an open access article distributed under the terms and conditions of the Creative Commons Attribution (CC BY) license (http://creativecommons.org/licenses/by/4.0/).
Share and Cite
Guo, Q.; Xu, C.; Wen, Y.; Liu, Y.; Xu, G. The 2017 Noneruptive Unrest at the Caldera of Cerro Azul Volcano (Galápagos Islands) Revealed by InSAR Observations and Geodetic Modelling. Remote Sens. 2019, 11, 1992. https://doi.org/10.3390/rs11171992
Guo Q, Xu C, Wen Y, Liu Y, Xu G. The 2017 Noneruptive Unrest at the Caldera of Cerro Azul Volcano (Galápagos Islands) Revealed by InSAR Observations and Geodetic Modelling. Remote Sensing. 2019; 11(17):1992. https://doi.org/10.3390/rs11171992
Chicago/Turabian StyleGuo, Qian, Caijun Xu, Yangmao Wen, Yang Liu, and Guangyu Xu. 2019. "The 2017 Noneruptive Unrest at the Caldera of Cerro Azul Volcano (Galápagos Islands) Revealed by InSAR Observations and Geodetic Modelling" Remote Sensing 11, no. 17: 1992. https://doi.org/10.3390/rs11171992
APA StyleGuo, Q., Xu, C., Wen, Y., Liu, Y., & Xu, G. (2019). The 2017 Noneruptive Unrest at the Caldera of Cerro Azul Volcano (Galápagos Islands) Revealed by InSAR Observations and Geodetic Modelling. Remote Sensing, 11(17), 1992. https://doi.org/10.3390/rs11171992