Abstract
How to efficiently utilize vast amounts of easily accessed aerial imageries is a critical challenge for researchers with the proliferation of high-resolution remote sensing sensors and platforms. Recently, the rapid development of deep neural networks (DNN) has been a focus in remote sensing, and the networks have achieved remarkable progress in image classification and segmentation tasks. However, the current DNN models inevitably lose the local cues during the downsampling operation. Additionally, even with skip connections, the upsampling methods cannot properly recover the structural information, such as the edge intersections, parallelism, and symmetry. In this paper, we propose the Web-Net, which is a nested network architecture with hierarchical dense connections, to handle these issues. We design the Ultra-Hierarchical Sampling (UHS) block to absorb and fuse the inter-level feature maps to propagate the feature maps among different levels. The position-wise downsampling/upsampling methods in the UHS iteratively change the shape of the inputs while preserving the number of their parameters, so that the low-level local cues and high-level semantic cues are properly preserved. We verify the effectiveness of the proposed Web-Net in the Inria Aerial Dataset and WHU Dataset. The results of the proposed Web-Net achieve an overall accuracy of 96.97% and an IoU (Intersection over Union) of 80.10% on the Inria Aerial Dataset, which surpasses the state-of-the-art SegNet 1.8% and 9.96%, respectively; the results on the WHU Dataset also support the effectiveness of the proposed Web-Net. Additionally, benefitting from the nested network architecture and the UHS block, the extracted buildings on the prediction maps are obviously sharper and more accurately identified, and even the building areas that are covered by shadows can also be correctly extracted. The verified results indicate that the proposed Web-Net is both effective and efficient for building extraction from high-resolution remote sensing images.
1. Introduction
Large numbers of satellites and drones have been launched alongside the rapid development of aerospace technology. Hence, high-resolution remote sensing images are getting easier to acquire. An important use for remote sensing images is extracting and mapping artificial objects, such as buildings [1], roads [2], and vehicles [3] at the pixel-level. Among them, building extraction is the most critical task, and it is commonly applied to monitor the subtle changes in urban areas, urban planning, and estimating the population. However, different from roads and vehicles, building areas always contain complex scenic backgrounds. Meanwhile, in some areas, the visual features (shapes and colours) of buildings and that of other natural objects (hills and lakes) are highly similar, which makes the building extraction task greatly challenging, not only for designing auto-detection models, but also for the artificial labelling tasks in the remote sensing field. In general, a high-quality image provides more cues for identifying the building areas, whereas the abundant local information that is provided by the remote sensing images with higher resolution also raises higher requirements for the models’ denoising and feature extraction abilities.
1.1. Building Extraction with Machine Learning
The building extraction task has drawn the attention of researchers over recent years. Before the common application of deep learning, there were massive machine learning models that tried to handle this task. In general, the pixel-wise labelling model consists of two sub-modules: the feature descriptor for extracting the semantic features from the original images and the pixel-wise classifier for determining the classes of the pixels. Some carefully designed feature descriptors were widely used in early approaches. Tuermer et al. [4] firstly used the histogram of gradient (HOG) feature descriptor in remote sensing for detecting vehicles. The Haar feature is applied in [5] for detecting buildings’ outlines and determining the location of buildings’ corners. Additionally, Yang et al. [6] applied the Scale-invariant feature transform [7] (SIFT) for classifying objects in remote sensing images. Unlike the artificially designed feature descriptors, the trainable models are the mainstream for the choices of classifiers. In [8], Mountrakis et al. reviewed the early applications of Support Vector Machines (SVMs) on remote sensing images. They stated that there are hundreds of relevant papers that apply SVMs to remote sensing images for various tasks. Except for SVMs, [9] researched the Bayes classifier and demonstrated that the naive Bayes can achieve comparable performance under most conditions. In [10], an assembly model, called the Fuzzy Stacked Generalization (FSG), which combined the detection results of multiple classifiers under a hierarchical architecture, was designed such that the building extraction performance can be further boosted. Although models that were based on classical machine learning methods achieved remarkable results in building extraction, how to properly and automatically extract the building areas are still challenging and expensive due to the time consuming artificial feature selections and the poor generalization abilities of the aforementioned classifiers.
1.2. Building Extraction with Deep Learning
Recently, with the rapid improvement of GPU computing, deep convolutional neural networks have become cornerstone in computer vision and remote sensing areas due to their great capability of extracting hierarchical features in an end-to-end fashion. Fully Convolutional Networks (FCNs) [11] are the common choice for most current deep learning models for the pixel-level labelling task. Within the framework of FCN, there are two keypoints affecting the performance with respect to the segmentation accuracy. The first one is the feature extraction backbone network, and the other is the upsampling design that preserves the features’ structural consistency. VGG [12], ResNet [13], Inception [14], and their mutation models [15,16] are the most popular backbones because of their high structural flexibilities and great generalization abilities. Recently, DenseNet [17] and its dense connection patterns have become the mainstream backbones due to the efficiency of their feature reuse. By extending the FCN architectures, U-Net [18] and SegNet [19] propose an encoder-decoder structure to compensate the semantic features with local cues and enhance the structural consistency of the prediction map. In addition, Deeplab [20] proposed Atrous Spatial Pyramid Pooling (ASPP) to encode the context and scene information via a pyramid scene parsing (PSP) [21] structure and atrous convolution [22]. Deeplab made great progress on semantic segmentation tasks by embedding the ASPP into the encoder-decoder architectures. In the remote sensing area, according to the mentioned properties of high-resolution remote sensing images, some carefully designed models have been proposed and optimized for building extraction tasks that are based on these above semantic segmentation approaches. In early research, [23,24] used naive FCN architectures with deconvolutional layers to extract buildings or roads, and these works demonstrated the effectiveness and efficiency of the FCN architecture. [25,26] trained FCNs to extract the buildings using the patch-wise method. In [27], Wu et al. built a multi-constraint network to sharpen the boundaries of artificial object predictions. A trainable block, called the field-of-view (FoV), is proposed in [28] to boost the performance of the FCN. With the successful applications of U-Net in the pixel-wise area labellings, most current models [28,29,30,31,32,33] use encoder-decoder architectures. The mutation models enhance the buildings’ semantic boundaries by introducing a new loss or fusing features in more effective ways. Moreover, Yang et al. [29] proposed an encoder-decoder network that was based on DenseNet and an attention mechanism, which is called the dense-attention network (DAN), which achieves remarkable improvements in building extraction. Meanwhile, Mou et al. analyzed and encoded the long-range relationships in remote sensing images over sequences of time. Furthermore, [30,31] applied the recurrent neural networks to fuse the hierarchical features from the different levels of the FCN. Audebert et al. [32] proposed an efficient multi-scale approach to leverage both a large spatial context and the high-resolution data and investigated the early and late fusion of Lidar and multispectral data to cover the scale variance of buildings from different areas. In [33,34], the extra geographical information (DSM, DEM, and Lidar images) are fed into a carefully designed FCN, together with high-resolution RGB images, and the results indicate that abundant features always lead to sharper predicted building boundaries. Moreover, post-processing methods, such as Guider Filter [1] and Conditional Random Field (CRF) methods [35,36], have been heavily researched and attempted to preserve the structure consistency between the building predictions and the original images.
1.3. The Motivation and Our Contribution
As mentioned in 1.2, the models that are based on the encoder-decoder framework have achieved the best performance on building extraction tasks; however, there are three main dilemmas that remain for the current building extraction tasks. (1) Early approaches easily classify non-buildings as buildings. This is caused by the semantic feature maps that still contain noises and the long-range reliabilities not being properly extracted. Generally, it is an inevitable problem for Convolutional Neural Network (CNN)-based models, since its denoising operation, such as Max-pooling and Average-pooling, is always accompanied by local cue losses. (2) The contours of the extracted building maps are blurred and irregular. (3) The generalization abilities of the current building extraction models are weak, as described in [37], since FCN-based networks only get high-quality predictions for areas where the landforms are highly similar to that of the training areas; meanwhile, we found that the building areas that are covered by shadows are likely to be labelled as non-buildings. To some extent, these three dilemmas are partly conflictive. (1) requires less noises in the feature maps, while (2) needs more local information to obtain the regular contours and retain the structural consistency. Although (3) could be relieved by applying deeper networks, the deeper network that apparently needs many more parameters also faces training difficulties and overfitting issues. In this paper, we propose a novel nested encoder-decoder deep network, named Web-Net, to simultaneously overcome the above conflicting obstacles that exist in the building extraction task. The main contributions of this paper can be listed, as follows.
1. We first propose a cobweb-like fully nested and symmetric network architecture, named Web-Net. Following the dense connection patterns, the output of every node layer is fed into all the subsequent node layers in both the horizontal and vertical directions. The harmony nested and dense-connected fashion leads to better features reuse abilities and generalization abilities.
2. We build a novel feature sampling and feature fusing block, named Ultra-Hierarchical Sampling (UHS), which is applied to every node layer in the proposed Web-Net. The UHS block consists of a pair of position-wise downsampling and upsampling sub-layers: an Ultra-Hierarchical Downsampling (UHDS) sub-layer and an Ultra-Hierarchical Upsampling (UHUS) sub-layer. By iteratively feeding the feature maps from different levels into the UHDS and the UHUS, they can be reshaped to a fixed size and then embedded together. Benefitting from the fully position-wise operation in the down/upsampling, the number of the feature map parameters and their spatial structure are preserved. Therefore, UHS achieves a better balance between the preservation of local cues, the structural consistency, and feature denoising as compared with normal downsampling and upsampling methods, which results in more accurate building extraction contours and better classification accuracies.
3. We analyze the effects of the deep supervision methods on the nested Web-Net. Based on the pruning of Web-Net, we propose the efficient mode, the balance mode, and the high-performance mode for the proposed Web-Net to make it more flexible and easier to adopt in either time-sensitive tasks or accuracy sensitive tasks.
This paper is organized, as follows. After Section 1 introduced the building segmentation in remote sensing image processing, Section 2 details the semantic segmentation frameworks that are related to our work. Subsequently, Section 3 gives the proposed method, describes the architecture of Web-Net, and lists the implementation details of the UHS block and the deep supervision method. The experimental results and discussions are illustrated in Section 4. Finally, we provide a conclusion in Section 5.
2. Related Work
In this part, we review the early classical network architectures and the state-of-the-art models for object segmentation tasks. These architectures are widely applied to remote sensing object extraction and other similar binary semantic segmentation tasks.
2.1. Fully Convolution Methods
In early research, the patch-based CNN was commonly used and it was the mainstream method in the remote sensing building extraction field. In it, the images are firstly divided into several mini patches and then fed into CNN networks to extract the semantic features. Afterwards, fully connected (FC) layers are used to classify each pixel. The patch-based CNN is strictly restrained by the number of parameters, and the extremely small patches (always less than 25 pixels) would consume a large amount of memory. Therefore, the final prediction usually lacks structural integrity, especially in the large scale building areas. The FCN [11] replaces all of the FC layers with convolution layers, and this procedure is mainly based on the assumption that every patch in an image follows the same probability distribution; hence, applying convolutional layers whose parameters are locally shared can achieve comparable performance with FC layers with several orders of magnitude fewer parameters. Therefore, when encountering fixed GPU memory, an FCN can achieve a larger image patch as its input and better long-range reliabilities can be obtained, which significantly improves the prediction quality with fewer structural errors. Meanwhile, fewer parameters also benefit the model’s robustness and ease the difficulties of training.
2.2. Encoder-Decoder Architectures
The encoder-decoder structure is widely applied on pixelwise labelling tasks, such as semantic segmentation, object segmentation, etc. [18], first built a highly symmetric architecture, called U-Net, in which the structures and dimensions of the decoders mirror the encoders. The outputs of each level from the encoder are directly linked to the corresponding level of the decoder as inputs through the jump connection. When compared with FCN-based networks, U-Net built a more sophisticated decoder to gradually upsample the semantic feature maps to the original image size, and the local cues from the encoder are compensated at the corresponding decoder level, which enhances the predicted contours. SegNet [19], which was further extended from U-Net, implemented a memorized Max-pooling operation in the encoder model that stores the indices of the maximum pixel, and the decoders in SegNet upsample its input feature maps while using the memorized max-pooling indices. Rather than ordinary max-pooling, the memorized max-pooling preserves the location information of the maximum pixel in an adjacent area, which allows for the upsampling in the decoder blocks to better recover the lost local cues.
2.3. Nested Connected Architectures
Motivated by the idea of densely connected networks, the nested connected architectures are designed to reuse more features. Nested architectures always have sophisticated and carefully designed adjacent/jump connections, and different bundles of the inner layer can be explicitly assigned to corresponding sub-networks architectures. To the best of our knowledge, GridNet [38] is the first approach towards implementing a nested connected architecture in the semantic segmentation area. The feature propagation paths in GridNet can be separately divided into the U-Net, the FCN, the Fully Resolution residual Network [39], and other symmetric or asymmetric encoder-decoder architectures, which allow for the model to contain more complicated feature paths and extract deeper semantic features. Furthermore, Unet++ [40] introduces the idea of nested architecture into U-Net; there are various levels of U-Nets that are stacked in Unet++, and hence the entire structure of Unet++ looks similar to an equilateral triangle (the same number of layers on every edge). One of the most critical contributions of Unet++ is introducing the Deep Supervision [41] method (DS) into the nested architecture networks. Unet++ applies the DS method on every sub-U-Net. Benefitting from the DS method, Unet++ can be easily trained and it achieves better performance on the segmentation task, rather than early nested networks.
3. Proposed Method
3.1. Overview of the Proposed Networks
Figure 1 shows the high-level structure of the proposed Web-Net and its skip connection patterns. Different from the encoder-decoder architectures, such as U-Net [18] and SegNet [19], the proposed network consists of a backbone encoder and nests of node layers (decoders). These node layers absorb the feature maps from the adjacent node layers (Figure 1a) and the long-range node layers (Figure 1b) in the horizontal direction (red dotted line) and the vertical direction (green and blue dotted lines). Benefitting from the nested connection pattern, the node layers can simultaneously work as parts of the encoder and decoder in the proposed framework. Apparently, in the vertical direction, the input hierarchical features from different levels of Web-Net need to be resized to the same size for further processing for every node layer; therefore, we propose the carefully designed Ultra-Hierarchical Sampling (UHS) block to accomplish this. Web-Net can be seen as the densest version of the nested encoder-decoder networks by applying the UHS block in every node layer. The implementation of the UHS blocks and then the abundance of message paths and the deep supervision method for Web-Net will be described in Section 3.2 and Section 3.3, respectively.
Figure 1.
Architecture of the proposed Web-Nets. (a) shows the structure of Web-Net with adjacent connections. The five blocks in the grey areas represent the encoder backbone. The compression blocks are linked behind each level of encoder blocks to reduce the dimensions, and the solid arrow shows the normal downsampling (Max Pooling) operation. The light blue area is the decoder part of Web-Net, and the outputs of every node layers in the decoder are only fed into the node layers of upper levels in the vertical direction. The purple triangular area located at the corner of the Web-Net architecture is the node layers, which work as both encoders and decoders. The node layers obtain the features from their neighbouring layers, and then we simultaneously fuse the features and feed them into the adjacent node layers. The green, blue and red dotted lines indicate the feature transfers in the top-bottom, bottom-top and horizontal directions, respectively. (b) details the skip connections in Web-Net. The red dotted line represents the horizontal skip connections among the same levels, the green dotted lines denote the hierarchical top-bottom skip connections, and the blue dotted lines show the hierarchical bottom-top jump connections. Apparently, each regular triangle with different coloured edges constructs a mini encoder-decoder architecture.
3.2. Node Layer and Ultra-Hierarchical Sampling Block
As the corner components of the proposed network structure, Figure 2 details the workflow of Ultra Hierarchical Sampling (UHS) block in the node layer, which down-samples/up-samples the dimensions of inputs by iteratively applying the position-wise reshape operation. At first, as shown in Figure 1, the input features from both adjacent and long-range node layers are fed into the Feature Gather block. Depending on which levels the inputs coming from, the inputs are divided into three groups, which are top-bottom, bottom-top, and horizontal groups, and they are represented by green, blue, and red dotted lines, respectively. Subsequently, these hierarchical features with the different shapes are fed into Ultra-Hierarchical Sample (UHS) block to reshape them into the same size and concatenate them together for further processing. Finally, the outputs of the UHS block are delivered into the Feature Fusing sub-block, which contains two convolution layers with an Relu Activation function and Batch Normalization Layer and a Squeeze and Excitation (SE) Block [42]. Here, the SE block adaptively recalibrates features with channel dimensions through a simple gate mechanism. For further convenient analysis, we define the necessary symbolic representations for the node layer in priority. Assuming that the scale factor between two neighbored levels in Web-Net is , in general is set to 2. The specified node layer is represented as , where , indicates which level the node layer belongs to and is the index of the node layers in the ith level. After the compression block, the shapes of the feature maps in level are . Moreover, the relationship of the feature map shapes between the level and the level can be computed as in Equation (1):
Figure 2.
The workflow of Node Layer for . represent channel numbers, heights, and widths, respectively, of the feature maps in level 1. For clear visualization, the intermediate feature maps coming from intra-level and inter-level node layers are summarized with the dimension channels.
As mentioned above, the hierarchical input features need to be reshaped to the same shape. The early methods usually apply the classical down-sampling methods (Max Pool, Mean Pool, et.al), which simply select the maximum value or the averaged value from each pooling grid and the classical up-sampling methods (Bilinear, Nearest, et.al), which complement the missing values in each pooling grid through the Bilinear or Nearest interpolation methods. As analyzed in Section 1.3, the local cues lose during pooling operation cannot be recovered in the up-sampling processing. There are two keypoints in order to preserve the local cues: one is that every value in the feature map cannot be directly dropped out, in another word, the total amount of the feature map parameters needs to be unchanged. Another is that the structural consistency of the feature map must be kept. For this, we design the position-wise operations to change the shape of the feature maps in the UHS block. As shown in Figure 3, the position-wise here means the operation just acts on the positions of each pixel in the feature map, the parameter amount and their corresponding values are unchanged. Assuming that the feature maps of three dimensions (channel, height, width) of A (B) is the result of applying the position-wise downsample (position-wise upsample) on B (A), , , and are the indices of the produced feature maps, the output of the position-wise downsample (position-wise upsample) can be calculated as Equations (2) and (3), where and indicate the exact division and remainder operations.
Figure 3.
Diagram of the position-wise operations where the red, blue, green, and yellow cubes indicate pixels of different positions in the feature map respectively. The position-wise Downsample operation halves the size of the original feature map while the dimensions are stretched for four times. In contrast, the position-wise Upsample operation doubles the size of the feature map and reduces the dimension channel according to the position of every pixel.
As shown in Figure 4, the proposed UHS block involves a position-wise Downsample (PW-DS) flow and a position-wise Upsample (PW-US) flow. In the PW-DS flow, we simultaneously use four ordinary pooling layers with different hyperparameter initializations on the input features to simulate the position-wise down-sampling operation. For the kernel size , when , every pixel in the feature map would be properly preserved. With the increasing of , the larger pooling kernel size can filter out noises but blur the local cues. The pooling stride is set to 2, while the padding is , , , and individually, and each pooling layer would reduce the size of the feature maps by half, the results of four pooling layers would be concatenated together as the final output. The PW-DS operation is iteratively applied on the input feature map until the output is reshaped to the target size. Assuming that the scale factor between the input feature map and the output target is , the number of iterations is equal to . In simple terms, the PW-DS squeezes the input feature maps into the target size, the local cues and structural information are encoded into the dimension channels. In the PW-US flow, similar to Dense Upsampling Convolution (DUC) [43], the position-wise up-sampling operation doubles the size of the input feature map and it reduces the input channel number to a quarter in each iteration, the PW-US operation is looped on the input feature map until the size of output is enlarged to the target. For example, if the input shape and the target shape are and , respectively, the PW-US would be applied twice. In the first iteration, every feature strip with the shape is reshaped to , therefore the feature map after the first iteration of PW-US has a shape of . Similarly, the output shape of the second iteration of PW-US is changed to . Corresponding to the PW-DS stream, the PW-US stream can be seen as flattening the squeezed feature map back to a specific shape, it decodes the local cues and structural information into the high-resolution feature maps.
Figure 4.
The workflow of the Ultra-Hierarchical Sampling (UHS) blocks. Similar to Figure 1, the green, red, and blue cubes indicate the feature maps from the top, horizontal, and bottom levels respectively. represent the dimensions of the input for the position-wise Downsample (PW-DS) and the position-wise Upsample (PW-US). The downsample and upsample rates for position-wise downsample and position-wise upsample are initialized to 2. In the PW-DS flow, the yellow, dark green, bright red, and purple cubes indicate the results of four individual pooling layers with different padding initializations.
3.3. Dense Hierarchical Pathways and Deep Supervision
As described in Section 3.1, the proposed Web-Net contains the dense skip pathways, both in the horizontal and in the vertical directions. The horizontal connections just work like DenseNets, where all the preceding feature maps in the same level would pass directly to the layers behind them as part of the input feature maps. In the vertical direction, profiting by the proposed UHS block, the encoder and decoder node layers can also gather the preceding hierarchical feature maps as the inputs, the dense connection patterns can greatly shorten the message paths in both directions. Suppose that the feature fuse function and outputs of the node layer are and , respectively, the transform functions for the up stream and the down stream are defined as and , respectively, and are the indexs of feature maps from corresponding levels, the transform of is shown as Equation (4).
It can be seen that the Web-Net is a densest connected, symmetric, and elegant architecture, where the features can efficiently propagate to each node in every level within the shortest path. Additionally, the nested architecture makes the Web-Net contain numbers of Web-Nets with smaller levels in it. In Figure 5, there are eight different encoder-decoder feature propagation paths in a basic 3 level Web-Net, and each graph describes a special encoder-decoder structure. Specifically, the input features of every node layer are coming from other small Web-Net architecture, therefore, the semantic feature can be not only extracted in the nested pattern, but also compensated with the local cues by jump connections, this results in a sharper and more accurate prediction. Moreover, in Web-Net, there are just a few extra parameters when compared with the U-Nets architecture with the same encoder backbone, because we share and reuse the feature maps rather than create new ones. Hence, as compared with other complicated network structures, the proposed Web-Net can partly avoid the over-fittings that are caused by the large parameter amounts of deeper encoder or wider decoder benefitting from the elegant feature reuse manners.
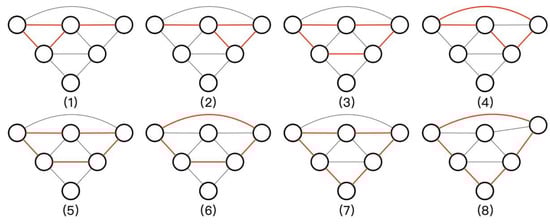
Figure 5.
The 8 encoder-decoder structures in a basic 3-level Web-Net. The red lines in each graph constitute an independent encoder-decoder structure.
Profiting from the nested design of Web-Net, all of the outputs of the node layers in level 0 have full resolutions as Ground Truths; therefore, we can apply the deep supervision method on them. For the prediction layer , we use to represent its loss function. is the fusion loss, which is a linear weighted summary of the binary cross-entropy (BCE) and the Dice coefficient. The final loss is simply a combination of , as shown in Equations (5) and (6):
where and denote the ground truth and prediction probabilities, respectively, and is set as 0.01 to prevent the value of the denominator from being 0. and are the coefficients that balance the Binary Cross-Entropy and Dice loss. As depicted in [13], the identity mapping that is constructed by residual connections in the UHS blocks ensures that the optimization loss is equal to the optimizing series of encoder-decoder sub-networks; this indicates that the performance of Web-Net would not be worse than anyone of sub-networks even in the worst case. Section 4,discusses pruning and ablation studies that are applied to exploit the benefits of deep supervision methods.
4. Experiments and Discussions
In this section, to demonstrate the efficiency and effectiveness of the proposed Web-net, we have evaluated it for the building extraction task on very high-resolution remote-sensing images among different areas.
4.1. Training Details
4.1.1. Datasets
We conduct all experimental evaluations on the challenging Inria Aerial Image Labelling Dataset [37] and WHU Dataset [44]. The Inria dataset mainly contains five open-access land-cover types from Austin, Chicago, Kitsap County, Vienna, and West Tyrol. There are 36 ortho-rectified images that cover 81 km2 for each region. Additionally, the five areas cover abundant landscapes ranging from highly dense metropolitan financial districts to alpine resorts, as shown in Figure 6.
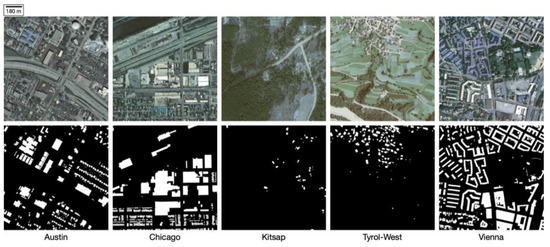
Figure 6.
Visual close-ups of the Inria dataset images from five different regions and their corresponding reference data.
The images in this dataset contain three bands (RGB) with very high spatial resolution (0.3 m). There are just two semantic labels of building and nonbuilding, and the target area in the dataset is the footprint of the roof. Therefore, it is completely suitable for our research purposes and convenient for validating model performances. In our experiments, we split each image into 100 sub-images, with a resolution of 500 × 500. In total, there are 18000 split images. Because the test set reference data is not publicly released, we choose the first five unsplit images from each area as the test set (images 1–5 for the testing and images 6–36 for the training) following the official validation suggestions [37] to achieve fair results and comparisons.
The WHU Dataset contains 8189 tiles of 512 × 512 pixels with more than 187,000 well-labelled buildings in New Zealand as compared to the Inria Dataset. The dataset covers approximately 450 km2 and it has the same spatial resolution of 0.3 m as that of the Inria Dataset. This dataset was officially divided into a train set, a validation set, and a test set, consisting of 4736 images, 1036 images, and 2416 images respectively.
4.1.2. Metrics
The intersection over union (IoU) of the positive class (building) and the overall accuracy are applied as the evaluation criteria to evaluate the performance of the different building extraction methods on the remote sensing images, which are also following the official guidance of the Inria Dataset [37]. The Overall Accuracy can actually evaluate the percent of the correctly predicted pixels. For the balanced dataset, the overall accuracy can objectively represent the model’s classification ability. However, the buildings always cover small areas on the aerial imageries and they are easy to be ignored. In the extreme situation, only one small building is located in a large area. Regardless of whether the model can correctly extract the building or not, there are few differences in the overall accuracy metric. The Intersection over Union (IoU), which is a widely used non-linear measure that robustly evaluates how close two distributions are, is introduced in the segmentation task to overcome the effect of the unbalanced phenomenon.
4.1.3. Implement Details
We build the proposed Web-Net based on the PyTorch library [45]. We train the models both from scratch and fine-tune the encoder backbones using the pretrained parameters from ImageNet [46]. We apply the Adam algorithm [47] with the default settings (, and the weight decay is 0) to optimize the model parameters during training. We follow the popular polylearning rate schedule that is computed as Equation (7) to adjust the learning rate:
where the initial learning rate is 0.001, , and the max iterations is set to 30. In addition, in each iteration, the whole training set is sequentially fed into the model. It takes approximately 27 hours to train our model with the Inria dataset on one NVIDIA GTX1080Ti.
4.2. Ablation Evaluation
In this section, we aim to study how the proposed Web-Net works with the different backbones and the sampling methods. For convenient analysis, we build all the ablation experiments on the Inria Aerial Dataset.
4.2.1. Backbone Encoder Evaluation
In this section, we evaluate the performance of the proposed Web-Net with different backbone encoders that are trained from scratch. VGG [12], ResNet [13], [17], ResNext [15], Xception [16], and DenseNet [17] are applied as the encoders; in addition, the pooling size in the UHS is set to 2 and the batch size is fixed as 4 in each model in order to obtain fair comparisons. The other hyperparameter settings follow the description of Section 4.1.3. Table 1 lists the results.

Table 1.
The Intersection over Union (IoU) and Acc.. of various backbone encoders for the validation set.
From Table 1, it can be seen that even the encoder with a very basic VGG-16 can acquire a quite good result on the validation dataset, which proves the effectiveness of the proposed Web-Net architecture. Furthermore, ResNet achieves comparable metric scores as the VGG network, but it requires considerably fewer parameters, since it benefits from the residual learning method. A significant performance boost comes from the ResNxet network that replaces the convolution layers in it with aggregated sets of sub-convolution layers, which is also known as group convolution. Similar to ResNext, Xception also applies group convolution operations, but it obtains lower metrics than ResNext due to the lake of residual transform. Unexpectedly, there is little improvement when we apply the widely used DenseNet as the encoder backbone in Web-Net. We believe that it is because the proposed nested hierarchical structure has applied the dense connection patterns among the node layers, and so the dense connections in the encoder backbone blocks are not as critical and necessary. The original DenseNet that is implemented in deep learning platforms is computationally expensive, since the high frequency concatenating operations exponentially expand the memory costs, and the Efficient-DenseNet [48] may save memory, but it decreases the training efficiency. Therefore, we do not test their training time and memory costs in Table 1. Furthermore, we apply deeper backbones to evaluate time and memory consumptions. The deeper networks, such as Xception, Dense-161, and ResNext-101 obtain less than a 1% improvement with respect to the IoU, while they take much more training time and consume more GPU memories. Therefore, we choose ResNext-50 as the backbone in further experiments to retain the best balance between the model’s performance, time and memory costs. At the same time, an oracle model (best performance) is proposed in Section 4.3.
4.2.2. Ultra-Hierarchical Samplings Evaluation
As mentioned in Section 3.2, the size of the pooling kernels in the PWDS flow is vital to the performance of the UHS block, since the pooling size determines the capability to balance the denoising and information preservation. Meanwhile, we create four comparable down-up sampling blocks by replacing the PWDS and the PWUS with max pooling/average pooling and a bilinear interpolation/Deconv layer, respectively, in order to evaluate the effectiveness of the proposed UHS block. These four blocks are named the Max-Bilinear, Avg-Bilinear, Max-Deconv, and Avg-Deconv. The best results for each model are given in Table 2, and Figure 7 shows how the IoU scores vary with the kernel sizes of the downsampling operations.
Table 2.
Evaluation of Web-Net for the validation set.
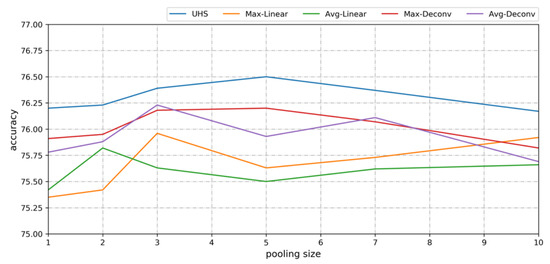
Figure 7.
IoU line chart of Web-Net with the UHS block, Max-Linear, Avg-Linear, Max-Deconv, and Avg-Deconv operations.
From Table 2, the proposed Web-Net with the UHS blocks achieves the best results with an IoU of 76.50% and an Acc. of 96.33%, which are observably higher than those the other four comparable models. Additionally, the learnable upsampling method deconvolution reaches nearly 76.20% with respect to the IoU. The Web-Nets with the naive Max-Bilinear and Avg-Bilinear acquire the worst performance with respect to both the IoU and Acc. These results in Table 2 verify that the structure of the UHS block, as well as the position-wise down/upsample operations in Web-Net, play pivotal roles on boosting the model’s performance. In Figure 7, it can be seen that the IoU of the UHS increases as the kernel size increases from 1 to 5 and then slowly decreases as the kernel size further increases. In addition, with the increase of the pooling size, the IoU curves of the other four models fluctuate more and are more chaotic. Meanwhile, the optimal kernel size of the UHS is 5, which is nearly twice as large as those of other models. These observations support the assumptions that the highly symmetric structures of the down/upsampling methods in the UHS blocks generate better and more stable denoising and local cue preservation abilities. Figure 8 lists some representative predictions from the Bilinear, Deconv, and the UHS-based Web-Net. It can be seen that the Web-Net with the UHS acquires sharper boundaries for larger buildings, and buildings with surrounding vegetation, which are easy to misclassify, are correctly extracted. All of these observations prove that the UHS block has better denoising and feature preservation abilities.
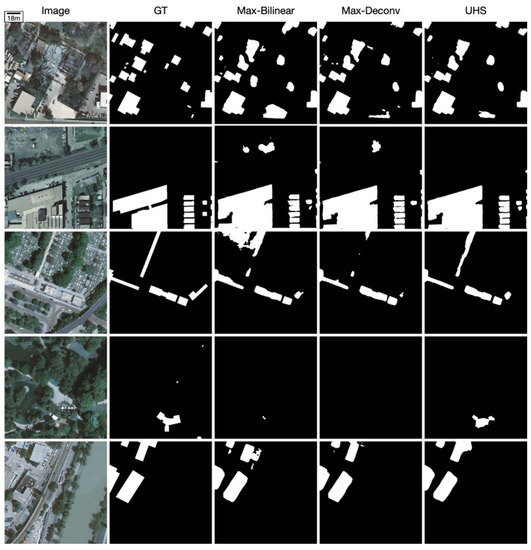
Figure 8.
Examples (500 × 500 patches) of Web-Net with UHS, Max-Bilinear, and Max-Deconv blocks.
4.2.3. Pruning and Deep Supervision Evaluation
In this section, we prune the Web-Net into four scales according to the depth level to prove the efficiency and adaptability of the proposed Web-Net for both time-sensitive task and performance-sensitive task.
Due to the highly symmetric structure of Web-Net, we can partly supervise the outputs of , , , and to individually simulate the Web-Net with different depths, which are represented as Web-Net-, where is the depth.
Table 3 reports the metric scores of each sub-Web-Net on the Inria Dataset. Web-Net- is much worse than the others due to the different numbers of parameters and network depth. Web-Net- achieves a 6.18% higher IoU than Web-Net-, and the further improvements of the depth gradually increase the IoU to 76.50%. From Figure 9, it can be seen that the feature map of Web-Net- obtains significant low-level information, and the object maps are incomplete while lots of non-building areas are detected. The deeper and more complicated structures of Web-Net can efficiently extract the semantic information and involve fewer local features and details. It should be noted that the contours of the feature map from Web-Net- are not blurred, which proves that the proposed Ultra-Hierarchical Upsampling sub-block is effective for completely eliminating the local cues from the features that are encoded in the channel dimension. Meanwhile, Table 3 lists the time costs of each pruned model. Apparently, except for , every five extra seconds of inference time can increase the IoU by at least 1.2%. Therefore, there are three modes that are involved in Web-Net to make inferences balanced with different accuracies and time costs, which are efficient (), balanced (), and effective () modes.
Table 3.
Model Pruning.
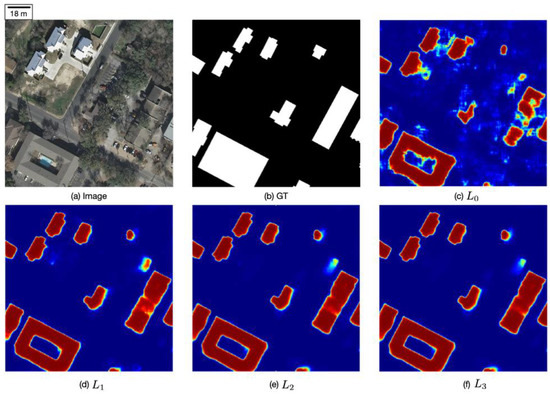
Figure 9.
Comparison of the heat maps from different nodes in level 0. (a) is the original image, (b) is the ground truth, and (c–f) are the heat maps from different output nodes.
4.3. Best Performance and Comparisons with Related Networks
In this part, we investigate the best performance of the proposed Web-Net using four NVIDIA GTX1080Tis, and we then compare the Web-Net and the related state-of-the-art models to verify the effectiveness and efficiency of the proposed Web-Net.
4.3.1. Best Performance Model
A series of ablation experiments are built to determine the best performance of the proposed model. We just start with the basic encoder-decoder model (ResNext-50) and iteratively improve the performance by applying the proposed UHS blocks, nested structures, and learning strategies. Moreover, we apply the parameters that are pretrained on ImageNet to initiate the model. Bigger training sample sizes and deeper basic encoder structures are also used to obtain a better performing model with respect to the metrics. Table 4 shows the results.
Table 4.
Various Design Results.
Rather than the basic U-Net architectures, the Web-Net architecture improves the IoU by 3.54% and the Acc. by 0.58%. The pretrained encoder backbone (ResNext-50) also results in a 1.87% improvement compared with training from scratch. The deep supervision method obtains small but consistent improvements of 0.32% and 0.07% for the IoU and Acc., respectively. Applying the deeper ResNext-101 as the encoder backbone could further obtain additional 0.83% and 0.14% improvements in the IoU and Acc, respectively, over ResNext-101. Finally, a large batch size (16) results in the best performance of the proposed Web-Net with an IoU of 80.10% and an Acc. of 96.97%.
4.3.2. Comparison Experiments on the Inria Aerial Dataset
Next, we provide the performance comparisons of the proposed Web-Net and other aforementioned state-of-the-art models on the Inria Aerial Dataset, and the results are listed in Table 5. Compared with the FCN-based baselines in [37], Web-Net outperforms the FCN and multi-layer perceptron (MLP) by 26.28% and 15.43%, respectively, for the IoU. Moreover, the result of Web-Net is 6.10% higher than that of the recurrent network in fully convolutional network (RiFCN), which applies a time consuming recurrent backward stream to fuse the hierarchical features in the time sequence. Web-Net achieves a 20.57% higher IoU when comparing the proposed Web-Net with the Mask R-CNN, which is a popular framework that simultaneously conducts instance detection and semantic segmentation tasks. The naive SegNet acquire a 70.14% IoU and a 95.17% overall accuracy, which indicates that the mainstream encoder-decoder architecture can work well on the extracted building areas. Including the latest nested Unet++, we can observe an improvement of at least 7.1% among all Unet and SegNet models with respect to the IoU. By combining the encoder-decoder architecture with dense connection patterns into the Dual-Resolution U-Net, the two-level U-Net acquires remarkable performance for the building extraction task. When compared with them, Web-Net acquires 5.88% and 5.55% higher IoUs, respectively. The recent GAN [49]-based approaches, Building-A-Net, acquire the state-of-the-art results on the Inria Aerial Dataset. Benefiting from the great generalization abilities of the GAN, the original Building-A-Net with 52 layers achieves a 74.75% IoU, and the deeper version further acquires an impressive IoU and Acc. of 78.73% and 96.71%, respectively. Although it is not fair to compare Web-Net with Building-A-Net, the Web-Net architecture can be easily embedded into the GAN framework. Thus, we build the corresponding Web-Net-ResNext50 and Web-Net-ResNext101, where the numbers of parameters are similar to the generated Building-A-Net with 52 and 152 dense layers, respectively, to verify the effectiveness of Web-Net. Compared with the Building-A-Net-52, The 50-layer Web-Net obtains 1.75% better performance, while the 101-layer Web-Net with the pretrained parameter initialization achieves an 80.10% IoU, which is 1.37% higher than the performance of the 152-layer pretrained Building-A-Net. Figure 10 lists some randomly chosen prediction maps from the MLP, SegNet, Unet++, and Web-Net, in order to provide a more intuitive view. It can be seen that there is a vital performance improvement from Web-Net on the large-sized building areas. The MLP and SegNet frequently misclassify the building pixels that are located in shadows into non-buildings, and therefore there are many “holes” in their prediction maps due to their weak abilities for extracting long-range correlations. Although the nested connections in Unet++ can partly relieve this phenomenon, the shadows in the building areas still have negative effects on the accuracy of the building extraction. The proposed Web-Net achieves a surprising prediction quality for large-sized building areas and shadow areas (red circle areas). Additionally, the false extractions and missed extractions of Web-Net are significantly reduced (yellow circle areas), and the boundaries of the extracted building maps are sharper than those of the other models. In Table 5, we also compare the efficiency of Web-Net with the other models.
Table 5.
Numerical Results of the State-of-the-art models on the Inria Dataset.
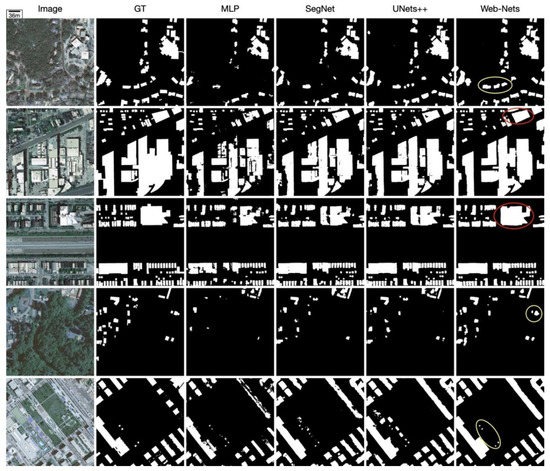
Figure 10.
The images in each row are randomly chosen from Austin, Chicago, Kitsap, Tyrol, and Vienna, and the patch size is 1000 × 1000. Columns 2–6 are the ground truth and prediction maps from MLP, SegNet, Unet++, and Web-Net, respectively. The areas in red circles are correct predictions in shadowed areas, and the yellow circles are correct classifications where other models fail.
Although we apply the overlapping-tile strategy [18], the proposed Web-Net only takes 56.5 s to process one 5000 × 5000 image, which is three times faster than the state-of-the-art building-A-Net method. Meanwhile, the lighter version of Web-Net that applies ResNext50 as the encoder just takes 28.8 s and it also achieves a satisfactory extraction result. The efficiency of Web-Net mainly arises from the efficient backbone encoders (ResNext) structure and a smaller number of layers in the decoder that are built by the parameter-efficient UHS block. The run time of Web-Net is even similar to the FCN with the same encoder structure.
We test the performance of the Web-Net and other models [30,37,40,52] on five areas with the different landforms from the Inria Dataset to verify the performance of the Web-Net for buildings of various styles. Table 6 shows the results.
Table 6.
Numerical Results among Cities.
When compared with the basic SegNet, the proposed Web-Net gains +7.68%, +21.07%, +2.65%, +18.04%, and +10.59% better IoUs for Austin, Chicago, Kitsap Country, Western Tyrol, and Vienna, respectively. Additionally, Web-Net outperforms Unet++ by +7.8%, +6.73%, +6.61%, +8.66%, and +5.45% with respect to the IoU, respectively. From Figure 10, we can observe that the performance boost of Web-Net mostly comes from the sharper building contours and the areas that are covered by vegetation and shadows. Furthermore, we find some inaccurate labels in Chicago and Vienna according to the abnormally low IoUs and Accs., and some examples are shown in Figure 11.
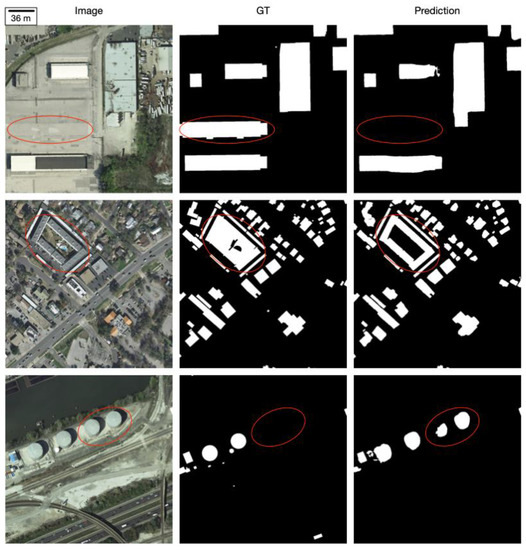
Figure 11.
Examples of some mismatched ground truth labels on Inria Aerial Image Labelling Dataset, mislabelled areas are annotated by the red circles.
4.3.3. Comparison Experiments on WHU Dataset
We construct a comparison between the Web-Nets and a number of state-of-the-art encoder-decoder architectures on the WHU Dataset, where the distribution is different from that of the Inria Aerial Dataset, in order to test the generalization abilities and robustness of the proposed Web-Net, which has shown great performance on the Inria Aerial Dataset. All the models are trained from scratch and Table 7 lists the results.
Table 7.
Numerical Results of the State-of-the-art models on WHU Dataset
It can be seen from Table 7 that the very simple encoder-decoder architecture such as SegNet, can achieve a satisfying result (98.12% and 84.47% on Acc and IoU, respectively) on WHU Dataset. With the more complicated encoder-decoder architecture, Unet achieves 2.33% higher scores than SegNet on the IoU metric. The naive nested encoder-decoder architecture Unet++ also works well on the WHU Dataset and gains an improvement of 2.83% on the IoU against SegNet. When compared with the aforementioned architectures, the proposed Web-Net shows great building extraction ability where the Acc. and IoU of the Web-Net is 98.54% and 88.76%, respectively, which is even 0.06% and 1.46% higher than the Acc. and IoU of the state-of-the-art Unet++. In addition to the quantitative analysis, we also perform a visual analysis on WHU Dataset, illustrating some randomly chosen prediction maps that are listed in Figure 12.
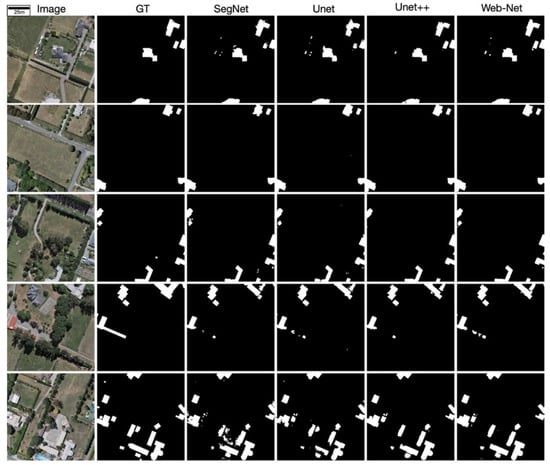
Figure 12.
Samples of binary predictions of SegNet, Unet, Unet++, and Web-Nets with corresponding aerial imageries and ground truths employing the WHU Dataset.
Apparently, the prediction maps of naive encoder-decoder architectures such as SegNet and Unet, implemented on the WHU Dataset achieves better performance than that employing the Inria Labelling Dataset benefitting from the lower image complexities and higher labelling accuracies. However, the nested encoder-decoder architecture Unet++ still outperforms the naive encoder-decoder architecture on the visual effect such that the consistency of the prediction maps of Unet++ is much better than that of SegNet and Unet; in other words, there are fewer holes and discrete small misclassified areas on the prediction maps. When compared with Unet++, the proposed Web-Net obviously enhances the visual result of building extraction with much sharper and more accurate contours and higher accuracy in extracting the small scale buildings. The quality and visual analysis both prove the generalization abilities of the proposed Web-Net, which can robustly achieve state-of-the-art building extraction results on imageries from different areas.
5. Conclusions
In this paper, we proposed a novel fully convolutional network, called the Web-Net, which uses the UHS block to perform the building extraction on high-resolution remote sensing images. In particular, the architecture of the proposed model looks similar to a spider web, and except for the encoder nodes, every node is connected to its neighbours, highlighting our reason for naming it Web-Net. Inspired by DenseNet, we designed the dense jump connections in both the vertical direction and in the horizontal direction to efficiently extract and utilize more abundant features. To fuse the hierarchical features from the different levels, we also designed the UHS block to iteratively change the shape of the feature maps while using position-wise upsampling/downsampling operations, and the UHS block is applied on every node of the Web-Net. The key benefit of the UHS block is that the local cues can be preserved and encoded into the channel dimension during the downsampling, while no extra parameters are added during upsampling. This is helpful for retaining the consistency of the semantic cues and the structural information. Within the highly symmetric and harmonious architecture of Web-Net and the UHS block, the proposed method can extract and propagate the low-level and high-level features throughout the network in an efficient way. With the benefits that are outlined above, the proposed Web-Net can significantly improve the ability to fuse the high-level semantic features and the boundary-aware low-level features and achieve a higher quality building extraction result. Moreover, by replacing the encoder with other backbones, further improvements of the deep neural networks can be easily embedded into the proposed Web-Net architecture to further boost the performance. The experiments that were executed on the Inria Aerial Image Labelling Dataset have demonstrated that the proposed Web-Net outperforms other encoder-decoder-based models on both the IoU and Acc metrics and it extracts sharper and more accurate building predictions. In addition, the time costs of the proposed Web-Net are significantly shorter than those of other state-of-the-art models. Moreover, the proposed Web-Net performed well in the extraction of buildings that were mixed with vegetation or shadows. Nevertheless, the buildings in high-resolution aerial imageries have extremely complex morphological characteristics, such as straight lines, curves, and orientations. These characteristics cannot be directly extracted by the FCN-based networks, and determining how to embed morphological characteristics into CNN structure is an open and urgent problem.
Author Contributions
Conceptualization, Y.Z.; Formal analysis, Y.Z. and J.S.; Funding acquisition, W.G. and W.L.; Methodology, Y.Z.; Project administration, W.G.; Software, Y.Z.; Supervision, W.G. and W.L.; Validation, J.S.; Writing – original draft, Y.Z. and J.S.; Writing – review & editing, W.G. and W.L.
Funding
This work was funded by the Key Projects of Science and Technology Agency of Guangxi province, China (Guike AA 17129002); National Science and Technology Key Program of China (2013GS500303); and the Municipal Science and Technology Project of CQMMC, China (2017030502).
Acknowledgments
We thank Inria for providing the Inria Aerial Image Labelling Dataset in their website (https://project.inria.fr/aerialimagelabelling/). We are also very grateful for the valuable suggestions and comments of peer reviewers.
Conflicts of Interest
The authors declare no conflict of interest.
References
- Xu, Y.; Wu, L.; Xie, Z.; Chen, Z. Building Extraction in Very High Resolution Remote Sensing Imagery Using Deep Learning and Guided Filters. Remote Sens. 2018, 10, 144. [Google Scholar] [CrossRef]
- Gao, L.; Shi, W.; Miao, Z.; Lv, Z. Method based on edge constraint and fast marching for road centerline extraction from very high-resolution remote sensing images. Remote Sens. 2018, 10, 900. [Google Scholar] [CrossRef]
- Audebert, N.; Le Saux, B.; Lefèvre, S. Segment-before-detect: Vehicle detection and classification through semantic segmentation of aerial images. Remote Sens. 2017, 9, 368. [Google Scholar] [CrossRef]
- Tuermer, S.; Kurz, F.; Reinartz, P.; Stilla, U. Airborne vehicle detection in dense urban areas using HoG features and disparity maps. IEEE J. Sel. Top. Appl. Earth Observ. Remote Sens. 2013, 6, 2327–2337. [Google Scholar] [CrossRef]
- Cote, M.; Saeedi, P. Automatic rooftop extraction in nadir aerial imagery of suburban regions using corners and variational level set evolution. IEEE Trans. Geosci. Remote Sens. 2013, 51, 313–328. [Google Scholar] [CrossRef]
- Yang, Y.; Newsam, S. Comparing SIFT descriptors and Gabor texture features for classification of remote sensed imagery. In Proceedings of the 2008 15th IEEE International Conference on Image Processing, San Diego, CA, USA, 12–15 October 2008; pp. 1852–1855. [Google Scholar]
- Lowe, D.G. Object recognition from local scale-invariant features. In Proceedings of the 7th IEEE International Conference on Computer Vision, Kerkyra, Greece, 20–27 September 1999; pp. 1150–1157. [Google Scholar]
- Mountrakis, G.; Im, J.; Ogole, C. Support vector machines in remote sensing: A review. ISPRS J. Photogramm. 2011, 66, 247–259. [Google Scholar] [CrossRef]
- Maloof, M.A.; Langley, P.; Binford, T.O.; Nevatia, R.; Sage, S. Improved rooftop detection in aerial images with machine learning. Mach. Learn. 2003, 53, 157–191. [Google Scholar] [CrossRef]
- Senaras, C.; Ozay, M.; Vural, F.T.Y. Building detection with decision fusion. IEEE J. Sel. Top. Appl. Earth Observ. Remote Sens. 2013, 6, 1295–1304. [Google Scholar] [CrossRef]
- Long, J.; Shelhamer, E.; Darrell, T. Fully convolutional networks for semantic segmentation. In Proceedings of the IEEE Conference on Computer Vision and Pattern Recognition, Boston, MA, USA, 8–10 June 2015; pp. 3431–3440. [Google Scholar]
- Simonyan, K.; Zisserman, A. Very deep convolutional networks for large-scale image recognition. arXiv 2014, arXiv:1409.1556. [Google Scholar]
- He, K.; Zhang, X.; Ren, S.; Sun, J. Deep residual learning for image recognition. In Proceedings of the IEEE Conference on Computer Vision and Pattern Recognition, Las Vegas, NV, USA, 27–30 June 2016; pp. 770–778. [Google Scholar]
- Szegedy, C.; Ioffe, S.; Vanhoucke, V.; Alemi, A.A. Inception-v4, inception-resnet and the impact of residual connections on learning. In Proceedings of the Thirty-First AAAI Conference on Artificial Intelligence, San Francisco, CA, USA, 4–9 February 2017. [Google Scholar]
- Xie, S.; Girshick, R.; Dollár, P.; Tu, Z.; He, K. Aggregated residual transformations for deep neural networks. In Proceedings of the IEEE Conference on Computer Vision and Pattern Recognition, Honolulu, HI, USA, 22–25 July 2017; pp. 1492–1500. [Google Scholar]
- Chollet, F. Xception: Deep learning with depthwise separable convolutions. In Proceedings of the IEEE Conference on Computer Vision and Pattern Recognition, Honolulu, HI, USA, 22–25 July 2017; pp. 1251–1258. [Google Scholar]
- Huang, G.; Liu, Z.; Van Der Maaten, L.; Weinberger, K.Q. Densely connected convolutional networks. In Proceedings of the IEEE conference on computer vision and pattern recognition, Honolulu, HI, USA, 22–25 July 2017; pp. 4700–4708. [Google Scholar]
- Ronneberger, O.; Fischer, P.; Brox, T. U-net: Convolutional networks for biomedical image segmentation. In Proceedings of the International Conference on Medical Image Computing and Computer-Assisted Intervention, Munich, Germany, 5–9 October 2015; pp. 234–241. [Google Scholar]
- Badrinarayanan, V.; Kendall, A.; Cipolla, R. Segnet: A deep convolutional encoder-decoder architecture for image segmentation. IEEE Trans. Pattern Anal. Mach. Intell. 2017, 39, 2481–2495. [Google Scholar] [CrossRef]
- Chen, L.-C.; Papandreou, G.; Kokkinos, I.; Murphy, K.; Yuille, A.L. Deeplab: Semantic image segmentation with deep convolutional nets, atrous convolution, and fully connected crfs. IEEE Trans. Pattern Anal. Mach. Intell. 2018, 40, 834–848. [Google Scholar] [CrossRef] [PubMed]
- Zhao, H.; Shi, J.; Qi, X.; Wang, X.; Jia, J. Pyramid scene parsing network. In Proceedings of the IEEE conference on computer vision and pattern recognition, Honolulu, HI, USA, 22–25 July 2017; pp. 2881–2890. [Google Scholar]
- Chen, L.-C.; Zhu, Y.; Papandreou, G.; Schroff, F.; Adam, H. Encoder-decoder with atrous separable convolution for semantic image segmentation. In Proceedings of the European Conference on Computer Vision (ECCV), Munich, Germany, 8–14 September 2018; pp. 801–818. [Google Scholar]
- Huang, Z.; Cheng, G.; Wang, H.; Li, H.; Shi, L.; Pan, C. Building extraction from multi-source remote sensing images via deep deconvolution neural networks. In Proceedings of the 2016 IEEE International Geoscience and Remote Sensing Symposium (IGARSS), Beijing, China, 10–15 July 2016; pp. 1835–1838. [Google Scholar]
- Zhong, Z.; Li, J.; Cui, W.; Jiang, H. Fully convolutional networks for building and road extraction: Preliminary results. In Proceedings of the 2016 IEEE International Geoscience and Remote Sensing Symposium (IGARSS), Beijing, China, 10–15 July 2016; pp. 1591–1594. [Google Scholar]
- Bittner, K.; Cui, S.; Reinartz, P. Building Extraction from Remote Sensing Data Using fully Convolutional networks. In Proceedings of the International Archives of the Photogrammetry, Remote Sensing & Spatial Information Sciences, Hannover, Germany, 6–9 June 2017. [Google Scholar]
- Alshehhi, R.; Marpu, P.R.; Woon, W.L.; Dalla Mura, M. Simultaneous extraction of roads and buildings in remote sensing imagery with convolutional neural networks. ISPRS J. Photogramm. 2017, 130, 139–149. [Google Scholar] [CrossRef]
- Wu, G.; Shao, X.; Guo, Z.; Chen, Q.; Yuan, W.; Shi, X.; Xu, Y.; Shibasaki, R. Automatic building segmentation of aerial imagery using multi-constraint fully convolutional networks. Remote Sens. 2018, 10, 407. [Google Scholar] [CrossRef]
- Chen, K.; Fu, K.; Yan, M.; Gao, X.; Sun, X.; Wei, X. Semantic segmentation of aerial images with shuffling convolutional neural networks. IEEE Geosci. Remote Sens. Lett. 2018, 15, 173–177. [Google Scholar] [CrossRef]
- Yang, H.; Wu, P.; Yao, X.; Wu, Y.; Wang, B.; Xu, Y. Building Extraction in Very High Resolution Imagery by Dense-Attention Networks. Remote Sens. 2018, 10, 1768. [Google Scholar] [CrossRef]
- Mou, L.; Zhu, X.X. RiFCN: Recurrent network in fully convolutional network for semantic segmentation of high resolution remote sensing images. arXiv 2018, arXiv:1805.02091. [Google Scholar]
- Mou, L.; Ghamisi, P.; Zhu, X.X. Deep recurrent neural networks for hyperspectral image classification. IEEE Trans. Geosci. Remote Sens. 2017, 55, 3639–3655. [Google Scholar] [CrossRef]
- Audebert, N.; Le Saux, B.; Lefèvre, S. Beyond RGB: Very high resolution urban remote sensing with multimodal deep networks. ISPRS J. Photogramm. 2018, 140, 20–32. [Google Scholar] [CrossRef]
- Pan, B.; Shi, Z.; Xu, X. MugNet: Deep learning for hyperspectral image classification using limited samples. ISPRS J. Photogramm. 2018, 145, 108–119. [Google Scholar] [CrossRef]
- Bittner, K.; Adam, F.; Cui, S.; Körner, M.; Reinartz, P. Building Footprint Extraction From VHR Remote Sensing Images Combined with Normalized DSMs Using Fused Fully Convolutional Networks. IEEE J. Sel. Top. Appl. Earth Observ. Remote Sens. 2018, 11, 2615–2629. [Google Scholar] [CrossRef]
- Shrestha, S.; Vanneschi, L. Improved Fully Convolutional Network with Conditional Random Fields for Building Extraction. Remote Sens. 2018, 10, 1135. [Google Scholar] [CrossRef]
- Wang, Y.; Liang, B.; Ding, M.; Li, J. Dense Semantic Labelling with Atrous Spatial Pyramid Pooling and Decoder for High-Resolution Remote Sensing Imagery. Remote Sens. 2019, 11, 20. [Google Scholar] [CrossRef]
- Maggiori, E.; Tarabalka, Y.; Charpiat, G.; Alliez, P. Can semantic labelling methods generalize to any city? the inria aerial image labelling benchmark. In Proceedings of the 2017 IEEE International Geoscience and Remote Sensing Symposium (IGARSS), Fort Worth, TX, USA, 23–28 July 2017; pp. 3226–3229. [Google Scholar]
- Fourure, D.; Emonet, R.; Fromont, E.; Muselet, D.; Tremeau, A.; Wolf, C. Residual conv-deconv grid network for semantic segmentation. arXiv 2017, arXiv:1707.07958. [Google Scholar]
- Pohlen, T.; Hermans, A.; Mathias, M.; Leibe, B. Full-resolution residual networks for semantic segmentation in street scenes. In Proceedings of the IEEE Conference on Computer Vision and Pattern Recognition, Honolulu, HI, USA, 22–25 July 2017; pp. 4151–4160. [Google Scholar]
- Zhou, Z.; Siddiquee, M.M.R.; Tajbakhsh, N.; Liang, J. Unet++: A nested u-net architecture for medical image segmentation. In Deep Learning in Medical Image Analysis and Multimodal Learning for Clinical Decision Support; Springer: Berlin/Heidelberg, Germany, 2018; pp. 3–11. [Google Scholar]
- Wang, L.; Lee, C.-Y.; Tu, Z.; Lazebnik, S. Training deeper convolutional networks with deep supervision. arXiv 2015, arXiv:1505.02496. [Google Scholar]
- Hu, J.; Shen, L.; Sun, G. Squeeze-and-excitation networks. In Proceedings of the IEEE Conference on Computer Vision and Pattern Recognition, Salt Lake City, UT, USA, 18–22 June 2018; pp. 7132–7141. [Google Scholar]
- Wang, P.; Chen, P.; Yuan, Y.; Liu, D.; Huang, Z.; Hou, X.; Cottrell, G. Understanding convolution for semantic segmentation. In Proceedings of the 2018 IEEE Winter Conference on Applications of Computer Vision (WACV), Lake Tahoe, CA, USA, 12–15 March 2018; pp. 1451–1460. [Google Scholar]
- Ji, S.; Wei, S.; Lu, M. Fully Convolutional Networks for Multisource Building Extraction From an Open Aerial and Satellite Imagery Data Set. IEEE Trans. Geosci. Remote Sens. 2018, 574, 574–586. [Google Scholar] [CrossRef]
- Paszke, A.; Gross, S.; Chintala, S.; Chanan, G.; Yang, E.; DeVito, Z.; Lin, Z.; Desmaison, A.; Antiga, L.; Lerer, A. Automatic differentiation in pytorch. In Proceedings of the NIPS 2017 Autodiff Workshop: The Future of Gradient-basedMachine Learning Software and Techniques, Long Beach, CA, USA, 9 December 2017. [Google Scholar]
- Deng, J.; Dong, W.; Socher, R.; Li, L.-J.; Li, K.; Li, F.-F. Imagenet: A large-scale hierarchical image database. In Proceedings of the IEEE Conference on Computer Vision and Pattern Recognition, Miami, FL, USA, 20–25 June 2009. [Google Scholar]
- Kingma, D.P.; Ba, J. Adam: A method for stochastic optimization. arXiv 2014, arXiv:1412.6980. [Google Scholar]
- Pleiss, G.; Chen, D.; Huang, G.; Li, T.; van der Maaten, L.; Weinberger, K.Q. Memory-efficient implementation of densenets. arXiv 2017, arXiv:1707.06990. [Google Scholar]
- Goodfellow, I.; Pouget-Abadie, J.; Mirza, M.; Xu, B.; Warde-Farley, D.; Ozair, S.; Courville, A.; Bengio, Y. Generative adversarial nets. In Proceedings of the Advances in Neural Information Processing Systems, Montréal, Canada, 8–13 December 2014; pp. 2672–2680. [Google Scholar]
- Chen, Q.; Wang, L.; Wu, Y.F.; Wu, G.M.; Guo, Z.L.; Waslander, S.L. Aerial imagery for roof segmentation: A large-scale dataset towards automatic mapping of buildings. ISPRS J. Photogramm. 2019, 147, 42–55. [Google Scholar] [CrossRef]
- He, K.; Gkioxari, G.; Dollár, P.; Girshick, R. Mask R-CNN. In Proceedings of the IEEE International Conference on Computer Vision, Honolulu, HI, USA, 22–25 July 2017; pp. 2961–2969. [Google Scholar]
- Bischke, B.; Helber, P.; Folz, J.; Borth, D.; Dengel, A. Multi-task learning for segmentation of building footprints with deep neural networks. arXiv 2017, arXiv:1709.05932. [Google Scholar]
- Lu, K.; Sun, Y.; Ong, S.-H. Dual-Resolution U-Net: Building Extraction from Aerial Images. In Proceedings of the 2018 24th International Conference on Pattern Recognition (ICPR), Beijing, China, 20–24 August 2018; pp. 489–494. [Google Scholar]
- Khalel, A.; El-Saban, M. Automatic pixelwise object labelling for aerial imagery using stacked u-nets. arXiv 2018, arXiv:1803.04953. [Google Scholar]
- Li, X.; Yao, X.; Fang, Y. Building-A-Nets: Robust Building Extraction From High-Resolution Remote Sensing Images With Adversarial Networks. IEEE J. Sel. Top. Appl. Earth Observ. Remote Sens. 2018, 11, 3680–3687. [Google Scholar] [CrossRef]
© 2019 by the authors. Licensee MDPI, Basel, Switzerland. This article is an open access article distributed under the terms and conditions of the Creative Commons Attribution (CC BY) license (http://creativecommons.org/licenses/by/4.0/).