Article

Seasonal Progression of Ground Displacement Identified with Satellite Radar Interferometry and the Impact of Unusually Warm Conditions on Permafrost at the Yamal Peninsula in 2016

1
Zentralanstalt für Meteorologie und Geodynamik, 1190 Vienna, Austria
2
b.geos, 2100 Korneuburg, Austria
3
Earth Cryosphere Institute, Tyumen Scientific Centre SB RAS, 625000 Tyumen, Russia
4
Tyumen State University, International Institute of Cryology and Cryosophy, 625003 Tyumen, Russia
5
Gamma Remote Sensing, 3073 Gümligen, Switzerland
6
A.N. Severtsov Institute of Ecology and Evolution RAS, 119071 Moscow, Russia
7
Department of Geoinformatics - Z_GIS, University of Salzburg, 5020 Salzburg, Austria
*
Author to whom correspondence should be addressed.
Remote Sens. 2019, 11(16), 1865; https://doi.org/10.3390/rs11161865
Submission received: 24 June 2019 / Revised: 1 August 2019 / Accepted: 6 August 2019 / Published: 9 August 2019
(This article belongs to the Special Issue Remote Sensing of Permafrost Environment Dynamics)

Abstract

:
Ground subsidence monitoring by Synthetic Aperture Radar interferometry (InSAR) over Arctic permafrost areas is largely limited by long revisit intervals, which can lead to signal decorrelation. Recent satellite missions such as COSMO-Skymed (X-band) and Sentinel-1 (C-band) have comparably short time intervals of a few days. We analyze dense records of COSMO-Skymed from 2013 and 2016 and of Sentinel-1 from 2016, 2017, and 2018 for the unfrozen period over central Yamal (Russia). These years were distinct in environmental conditions and 2016 in particular was unusually warm. We evaluate the InSAR-derived displacement with in situ subsidence records, active-layer thickness measurements, borehole temperature records, meteorological data, C-band scatterometer records, and a land-cover classification based on Sentinel-1 and -2 data. Our results indicate that a comparison of seasonal thaw evolution between years is feasible after accounting for the early thaw data gap in InSAR time series (as a result of snow cover) through an assessment with respect to degree-days of thawing. Average rates of subsidence agree between in situ and Sentinel-1 (corrected for viewing geometry), with 3.9 mm and 4.3 mm per 100 degree-days of thaw at the test site. X-band and C-band records agree well with each other, including seasonal evolution of subsidence. The average displacement is more than twice in magnitude at the active-layer monitoring test site in 2016 compared to the other years. We further demonstrate that InSAR displacement can not only provide information on the magnitude of ground thaw but also on soil properties through analyses of seasonal evolution in extreme years.

Graphical Abstract

1. Introduction

Increasing ground temperatures are expected to have serious consequences for ecosystems, hydrological systems, and infrastructure integrity in the Arctic [1]. A network of in situ monitoring sites exists but many regions are underrepresented [2]. Satellite measurements can only indirectly support permafrost monitoring [3]. Apart from ground temperature, the variation of the seasonal thaw depth on top of permafrost has been addressed with various remote sensing methods including land cover as proxy and displacement monitoring. The latter relies on Synthetic Aperture Radar interferometry (InSAR). Displacement in line of sight can capture the subtle changes (millimeter to centimeter) of ground subsidence and heave, (e.g., [4,5,6]). These seasonal variations in ground displacements are expected to reflect changes in thaw depth and active-layer thickness (ALT) respectively in permafrost areas [5]. The surface changes result from melt of pore ice or ice lenses. Drainage may also lead to secular subsidence. The water/ice content of a soil therefore determines the amount of displacement. If the soil profile is uniform and is fully saturated, ALT can be directly inferred [7]. Models which reflect the varying soil layer properties and variations in wetness (precipitation) need to be used in other cases, (e.g., [8]). An example for an account of different soil layers is described in Wang et al. [8] and Zhao et al. [9] (also includes the impact of precipitation). This does, however, require detailed knowledge of the soil stratigraphy, which is rarely available across the Arctic. A further shortcoming is the lack of in situ measurements of active-layer thickness. Such measurements are often sporadic when related to expeditions and therefore do not allow detailed interpretation of findings from InSAR analyses, (e.g., [10]). Measurement grids of long-term monitoring sites which are part of the Circumpolar Active-Layer Monitoring (CALM) network provide very valuable data in this context. In situ measurements of subsidence itself are also challenging. No in situ monitoring network for ground displacements in permafrost areas exists to date.
Satellite data of all common frequencies (X-, C-, and L-band) have been shown to be applicable to detect line of sight (LOS) displacements related to thaw subsidence. Constraints caused by the wavelength exist for the comparably short X-band (~3.1 cm) due to its sensitivity to changes on the ground between acquisitions [11] (e.g., for high latitude tundra). This is especially the case if acquisitions come from a single satellite constellation only [12], what results in case of TerraSAR-X in 11 day repeat intervals. An alternative provides for example COSMO-Skymed (COnstellation of small Satellites for Mediterranean basin Observation), which currently consists of four satellites and allows for repeat measurements of one day. Such data have been so far not investigated for permafrost related applications. Longer wavelengths (specifically L-band, wavelength 23 cm) are of advantage for connecting the seasonal time series across the years [4]. All so far available long-term application studies make therefore use of L-band data, specifically the Japanese ALOS (Advanced Land Observing Satellite)-missions, (e.g., [5,13]). It has been recently demonstrated that also C-band (wavelength 5.6 cm) can be used to establish long-term records in areas with limited vegetation growth [14,15]. Large parts of Arctic permafrost areas are, however, characterized with tundra shrubs.
Relating observations between seasons allows also to account for data gaps at the beginning of the soil thaw season. Data pairs usually start several days to weeks later due to the disturbance of snowmelt for repeat InSAR retrieval [16] and mission specific repeat intervals. This limits the monitoring based on separate seasons, (e.g., [17]). The majority of ground thaw in areas with unsaturated soils does typically occur right after snowmelt, (e.g., [18]). A solution would be a constellation as available by COSMO-Skymed. Such data are, however, scarce compared to the acquisitions by C-band missions such as Sentinel-1, which only feature repeat intervals of 6 or 12 days. The latter is more common due to global acquisition strategies. A method to adjust for the early season data gap is required to allow the use of Sentinel-1 or similar data in the extensive region of shrub tundra and unsaturated soils. We hypothesize that knowledge gained from a multi-satellite constellation such as COSMO-Skymed, which provides dense time series, could lead to a suitable approach to account for the early thaw data gap in time series from Sentinel-1. This requires comparability of the displacement measurements from the two different wavelengths. So far only a few studies are available for comparisons between X and C-band over permafrost terrain, (e.g., [4,19]). These efforts have been limited to qualitative assessment due to the differences in acquisition timing between the missions. Mostly spatial patterns are assessed visually. A comparison of L-band and X-band demonstrated the impact of vegetation on applicability of TerraSAR-X with comparably long revisit intervals [20].
We have selected a long-term monitoring site on Central Yamal, Russia, to test our hypothesis. This area features a high range of ALT (up to 170 cm and locally more), unsaturated moisture conditions over larger areas and shrub tundra as dominating land cover. Tabular ground ice is known to extensively occur on central Yamal [21]. ALT is measured since 1993 over a CALM grid and several boreholes are in the surrounding area. ALT as well as Mean Annual Air Temperatures (MAAT) have been increasing continuously since the start of the records [21]. Anomalously high temperatures (and thaw indices) have been observed for 2012 as well as 2016 with unprecedented levels at Mare Sale at least since 1947 [22]. In situ measurement of subsidence started within the last decade.
Landslides and resulting thermodenudation cirques are typical features on central Yamal [21] and are also partially represented on the CALM grid. They shape not only terrain but also the distribution of vegetation communities [23]. Landslides are usually initiated episodically in certain years. All known thermodenudation cirques are regularly surveyed and documented [24]. The latest year which triggered abundant thermodenudation was 2012 [21] as it was an exceptionally warm year. Several thermodenudation cirques have been reactivated in 2016 [22]. A further specific feature of central Yamal is ice-rich permafrost at the base of the active layer. It is in general expected that penetration of thaw into such layers is accompanied by loss of volume due to consolidation and the cause of surface subsidence [25]. A further feature on central Yamal are deep craters first suggested to be triggered by the extreme conditions in 2012 [26] and more in 2016. Satellite derived displacement measurements may provide advanced insight into the impact of temperature extremes in combination with in situ measurements.
A range of SAR time series from different missions (including X-, C and L-band) are available for central Yamal, but no acquisitions exist for the year 2012 from for science commonly used missions such as TerraSAR-X, COSMO-Skymed, ALOS (failed in 2011), Sentinel-1 (not yet launched), ENVISAT ASAR (failed in April 2012), Radarsat (ScanSAR only). COSMO-Skymed, Sentinel-1 and ALOS-2 acquisitions are, however, available for 2016 and may allow for assessment of the warmer than average conditions on ground thaw on central Yamal. A constraint is the lack of spatial overlap of COSMO-Skymed and the CALM site what needs to be considered. Furthermore, a regularly year to year connection with C-band is not feasible over this region, as the abundant shrub cover is causing strong decorrelation over one year.
We analyze two years (2013 and 2016) of dense time series of the COSMO-Skymed constellation and all three years so far available from Sentinel-1 (2016, 2017, 2018) over central Yamal. The start of records from COSMO-Skymed coincides with the beginning of soil thaw in both years and for Sentinel-1 in one year what allows both a direct comparison of the X and C-band records and investigation for early season gap filling. We eventually discuss the results obtained in the context of ALT monitoring and implications of temperature extremes as recently recorded on Yamal.

2. Study Area and Datasets

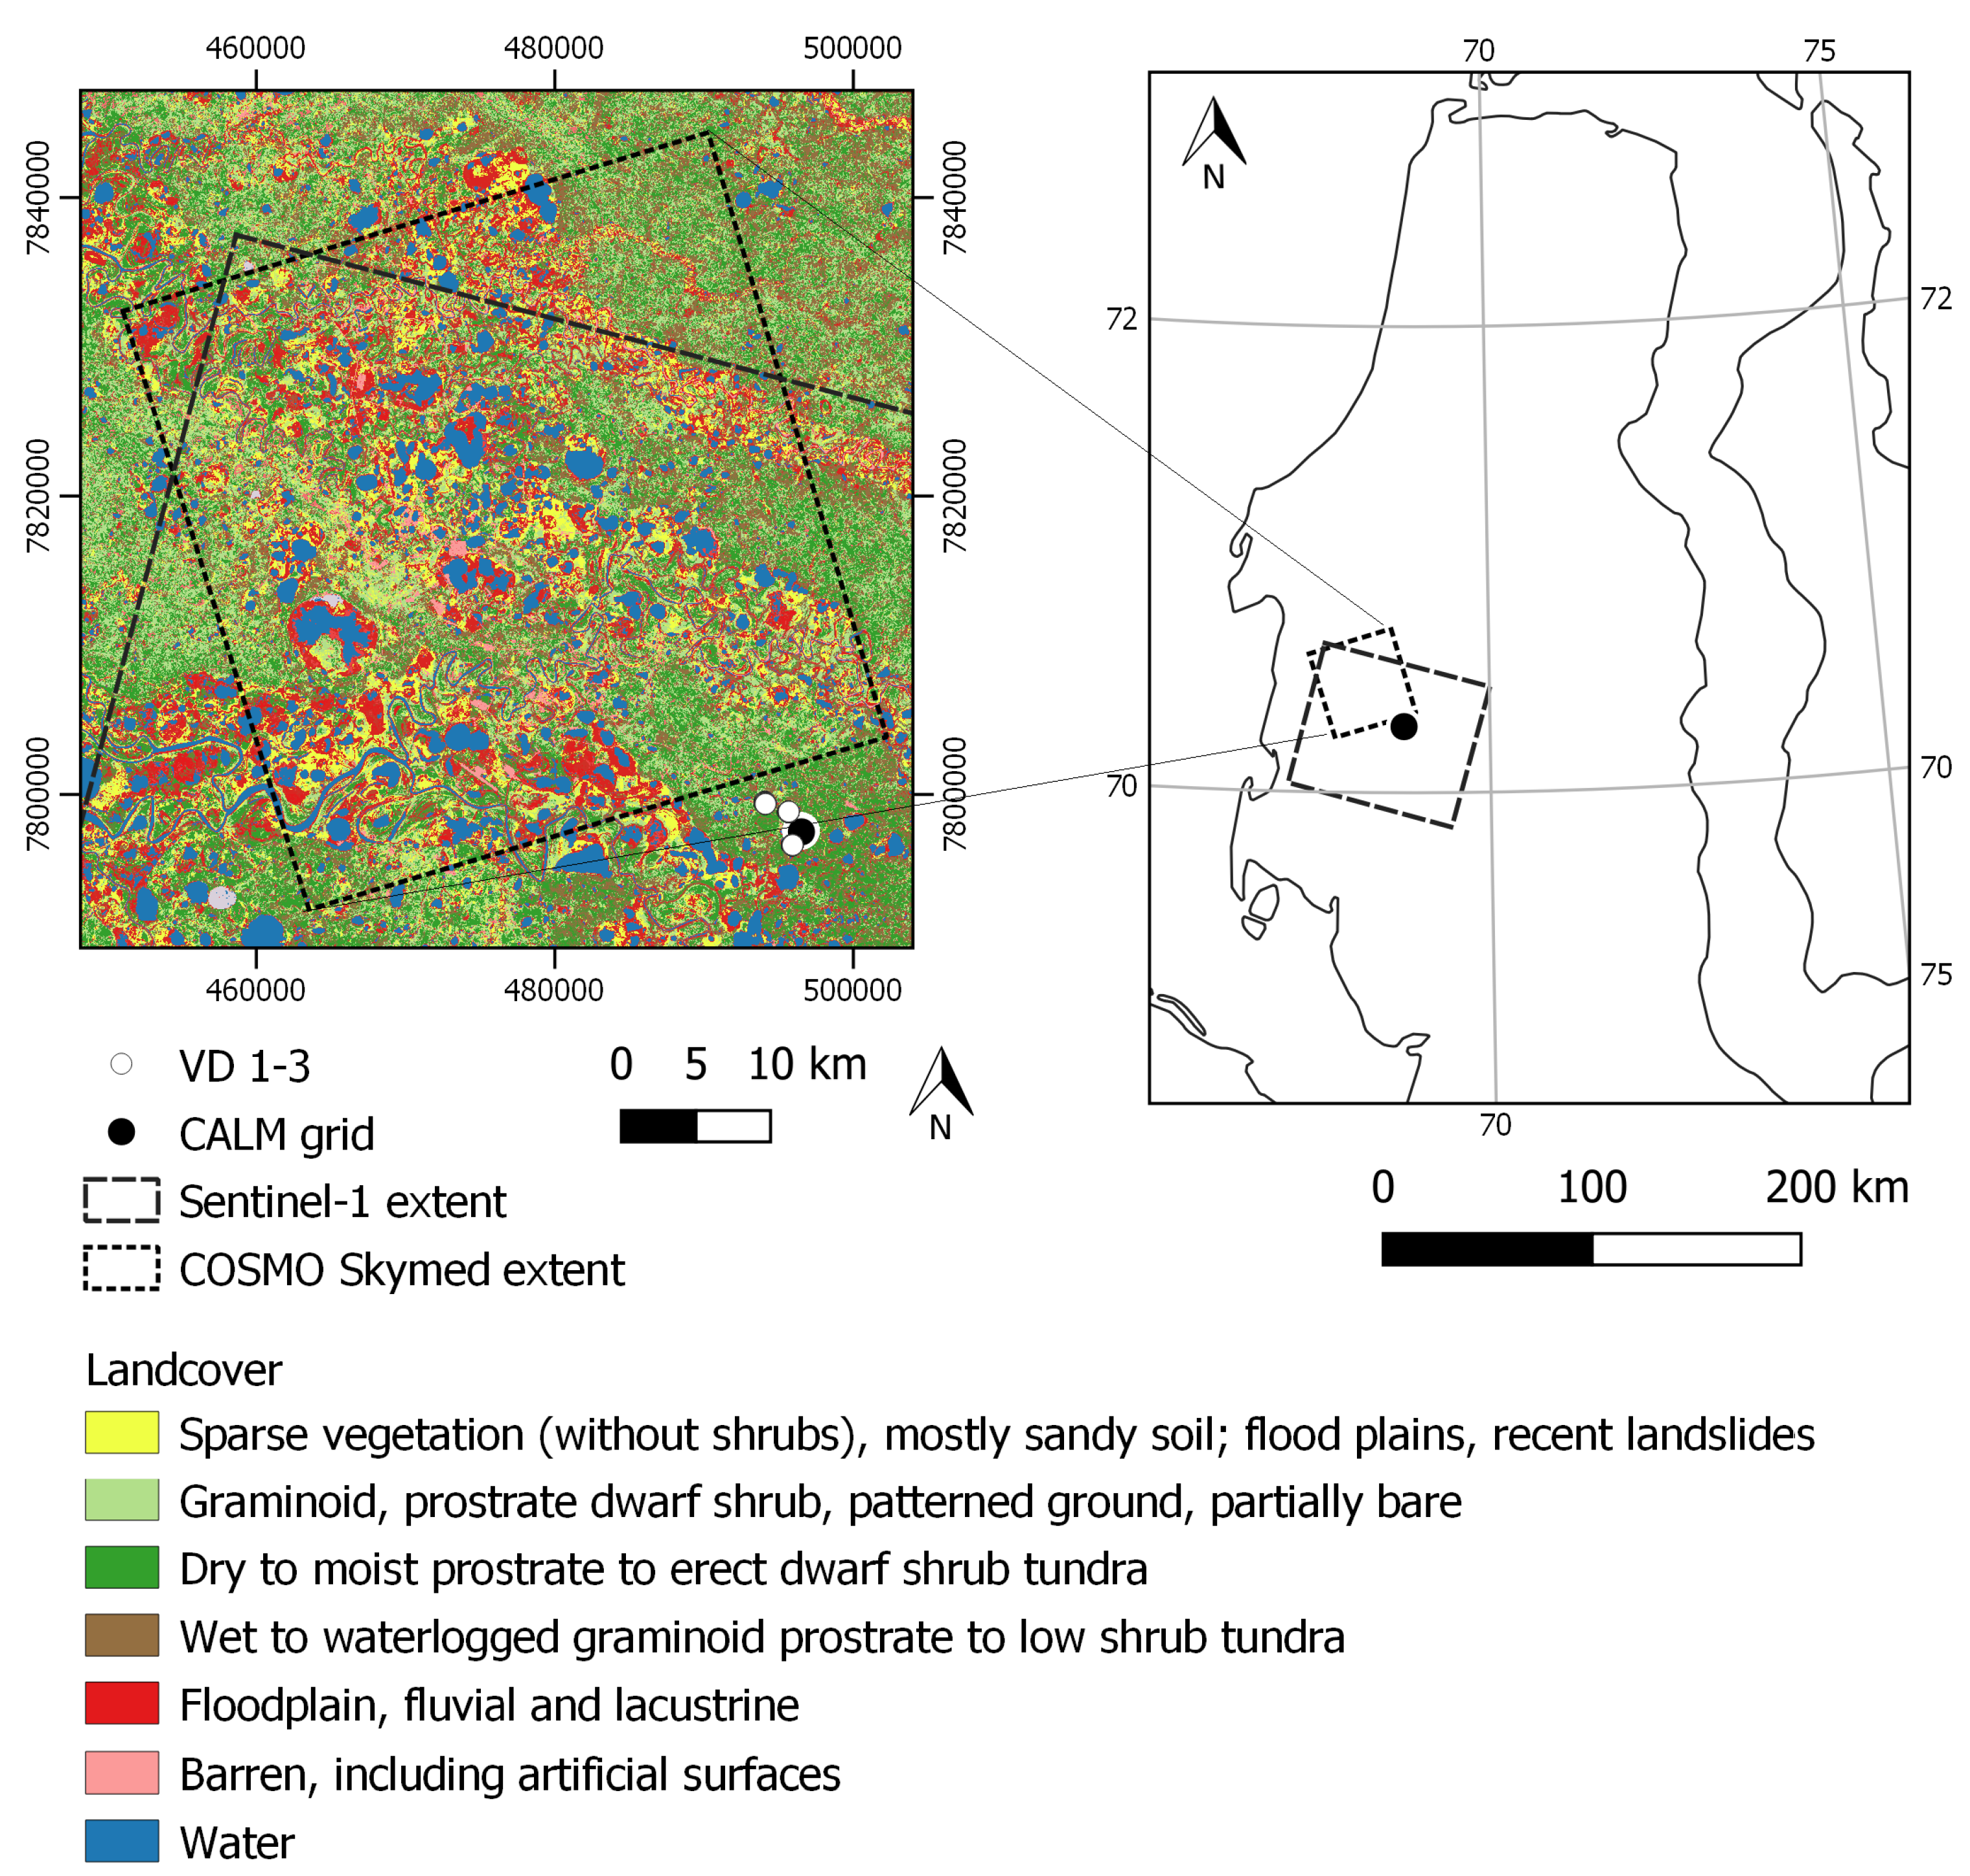
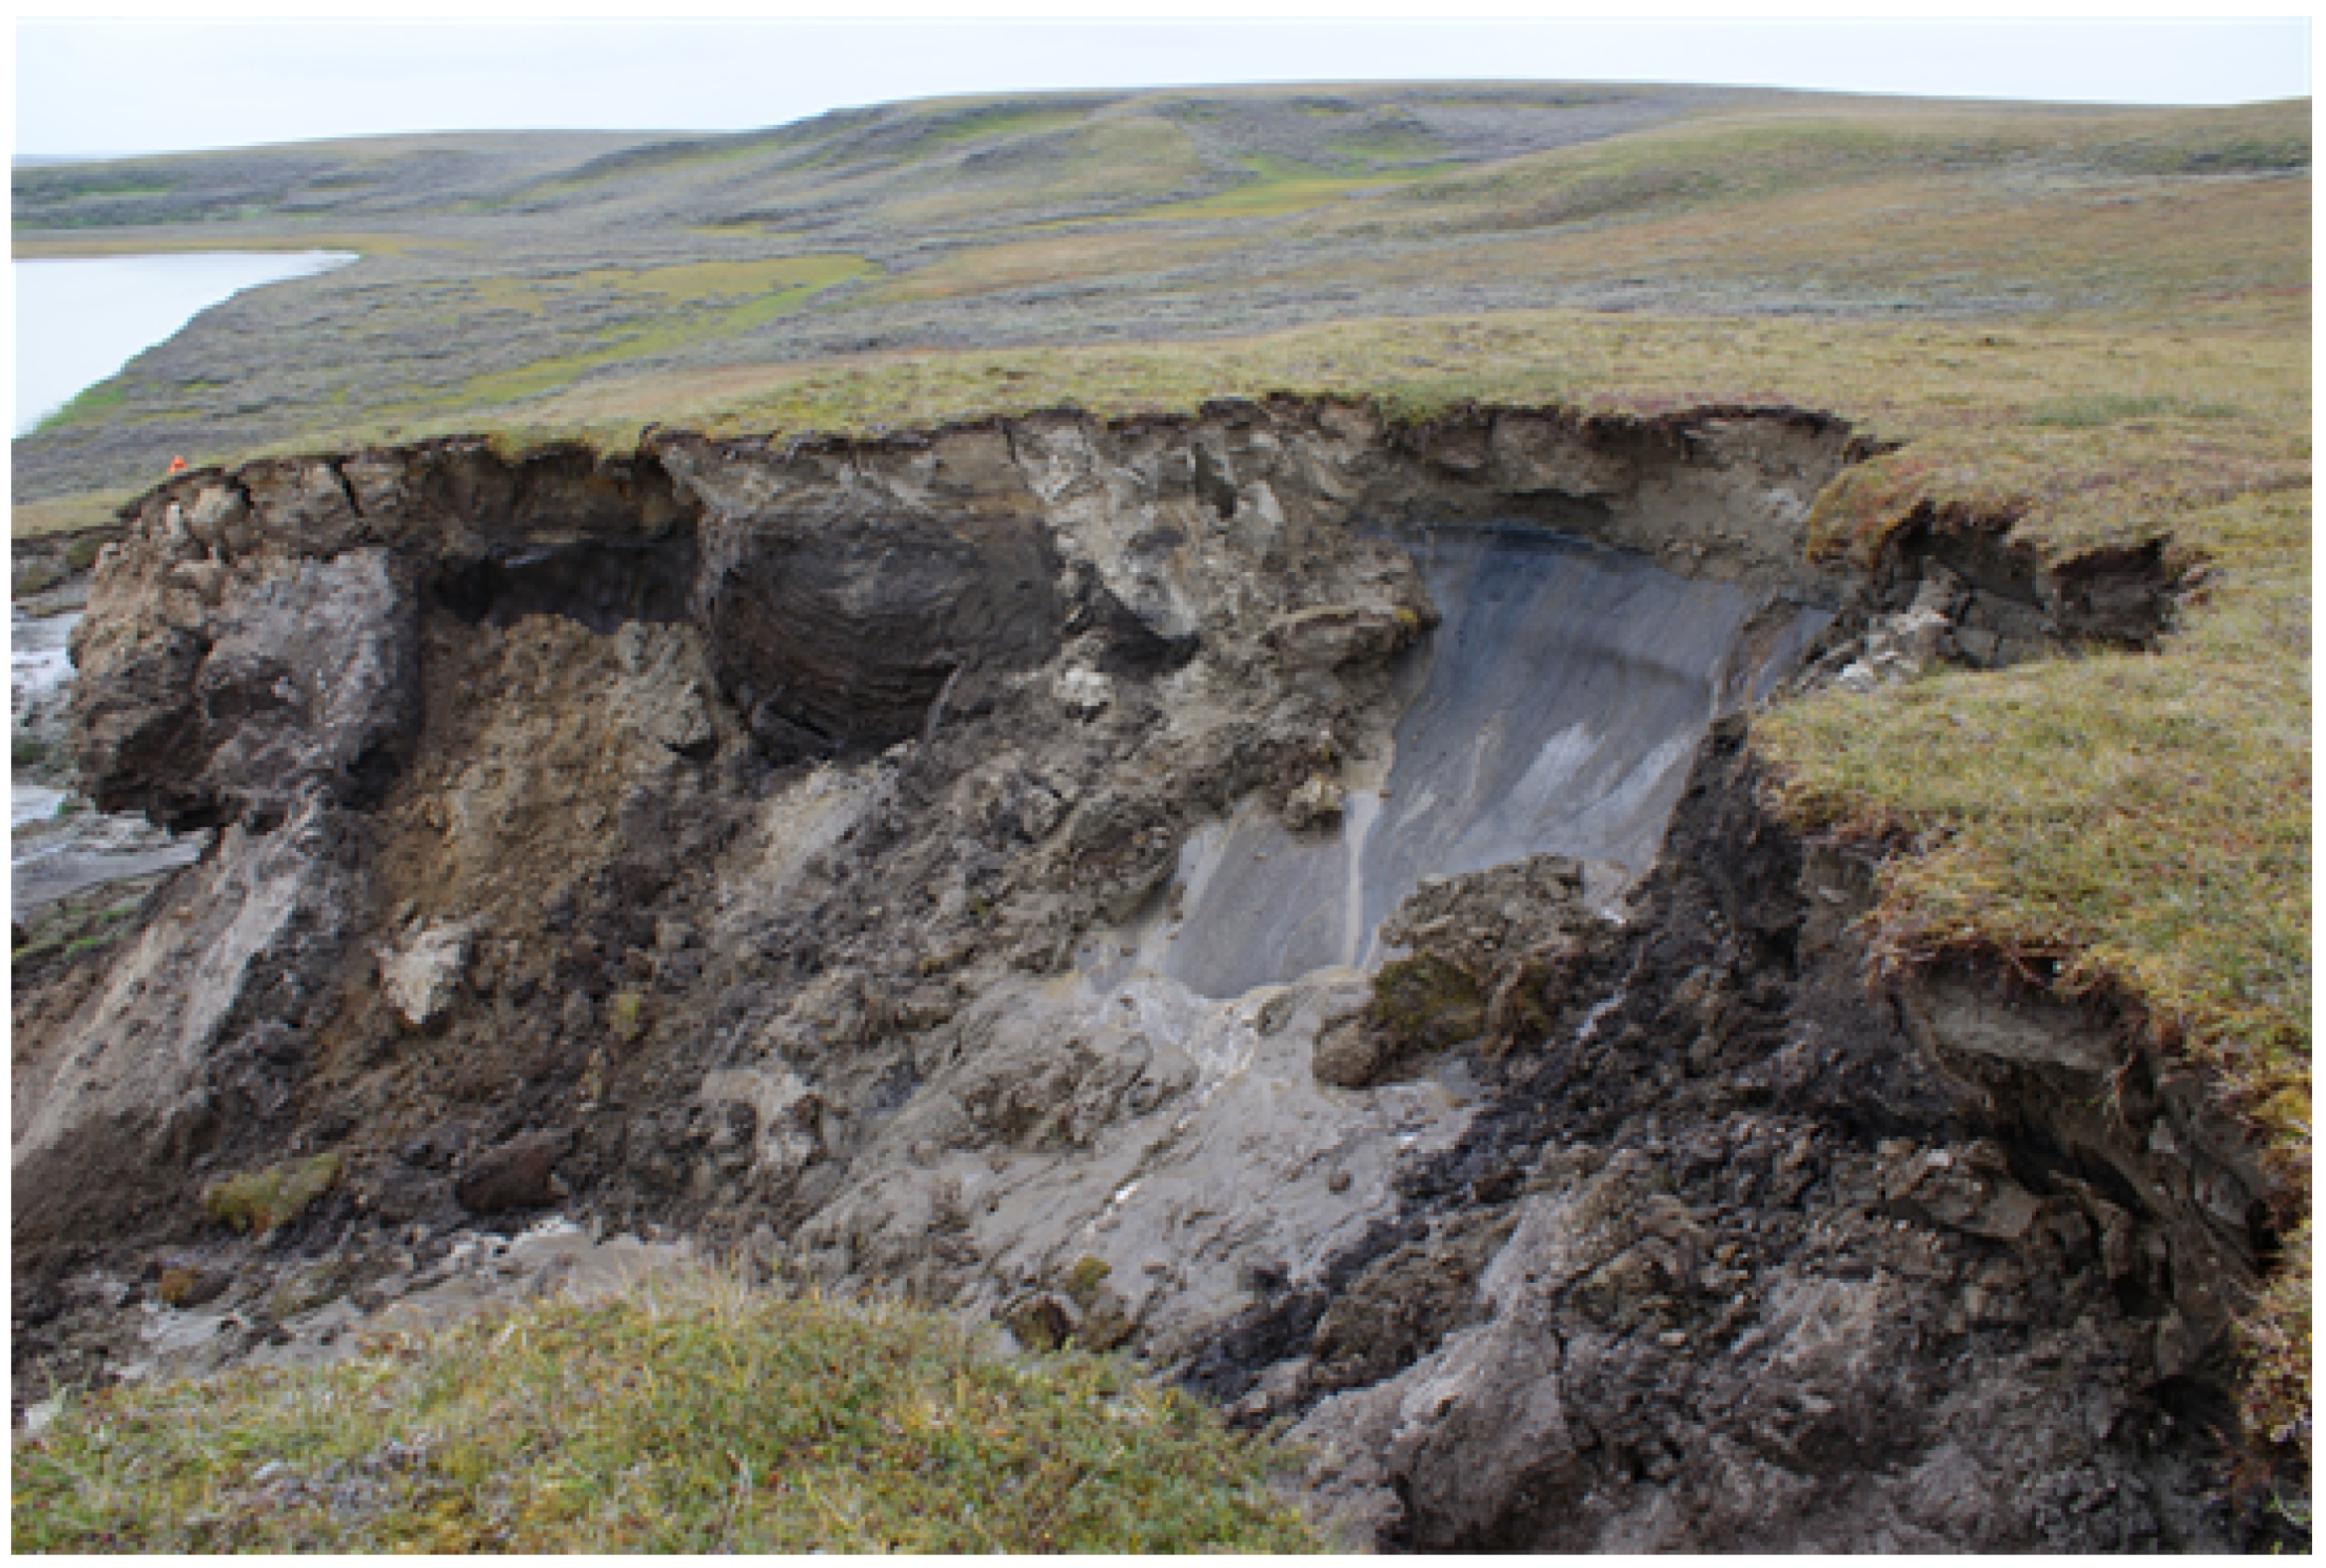
2.1. Environmental Characteristics on Central Yamal

The Vaskiny Dachy (VD) research station (70 ° 20 N, 68 ° 51 E) is situated on the central Yamal Peninsula (Figure 1) in a system of highly dissected alluvial-lacustrine-marine plains and terraces [21]. Dense dwarf shrubs (Betula nana) are common in this region. Well-drained hilltops are occupied by dwarf shrub-moss-lichen communities. On gentle poorly drained slopes, low shrubs and dwarf shrubs are well developed, and mosses predominate. On convex tops and windy hill slopes, shrub-moss-lichen communities with spot-medallions are predominant.
River valleys, thermocirques, and landslide cirques with thick snow cover are characterized by willow thickets. Sedge and sphagnum bogs and flat-topped polygonal peatlands are common on flat and concave (saddles) surfaces of watersheds and terraces, in the river valley bottoms, on low lake terraces and in other depressions [27]. Landslide activity can be associated with different vegetation communities and succession stages with respect to history and morphology [23].

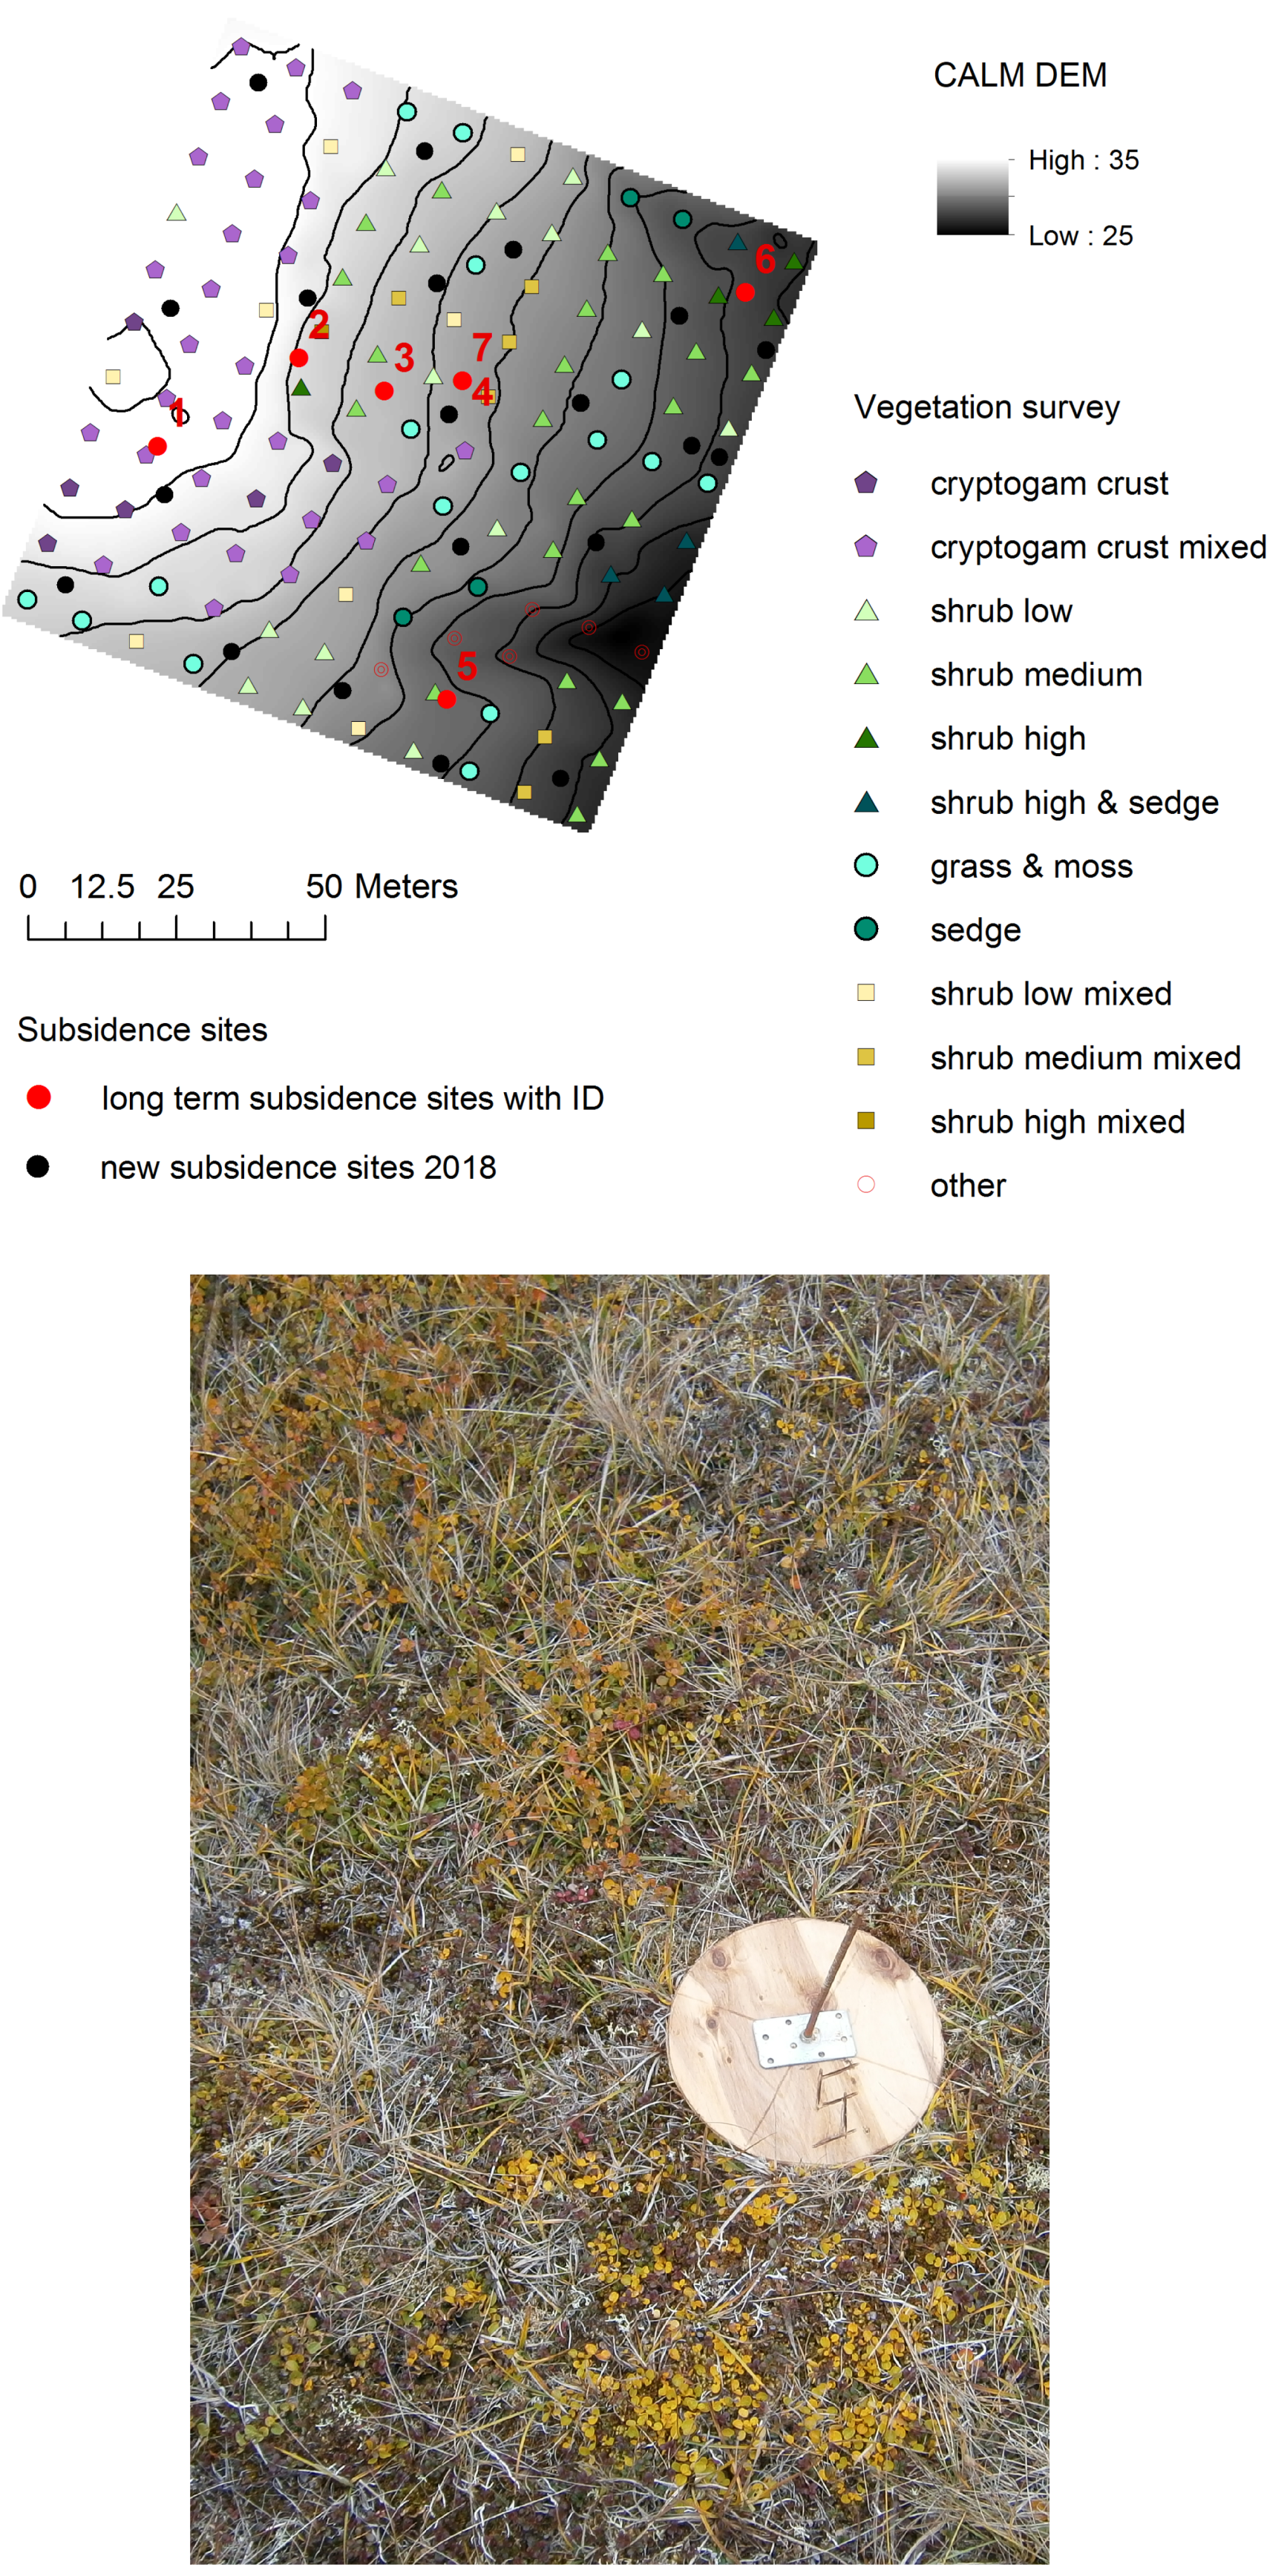
2.2. In Situ Measurements from Long-Term Monitoring

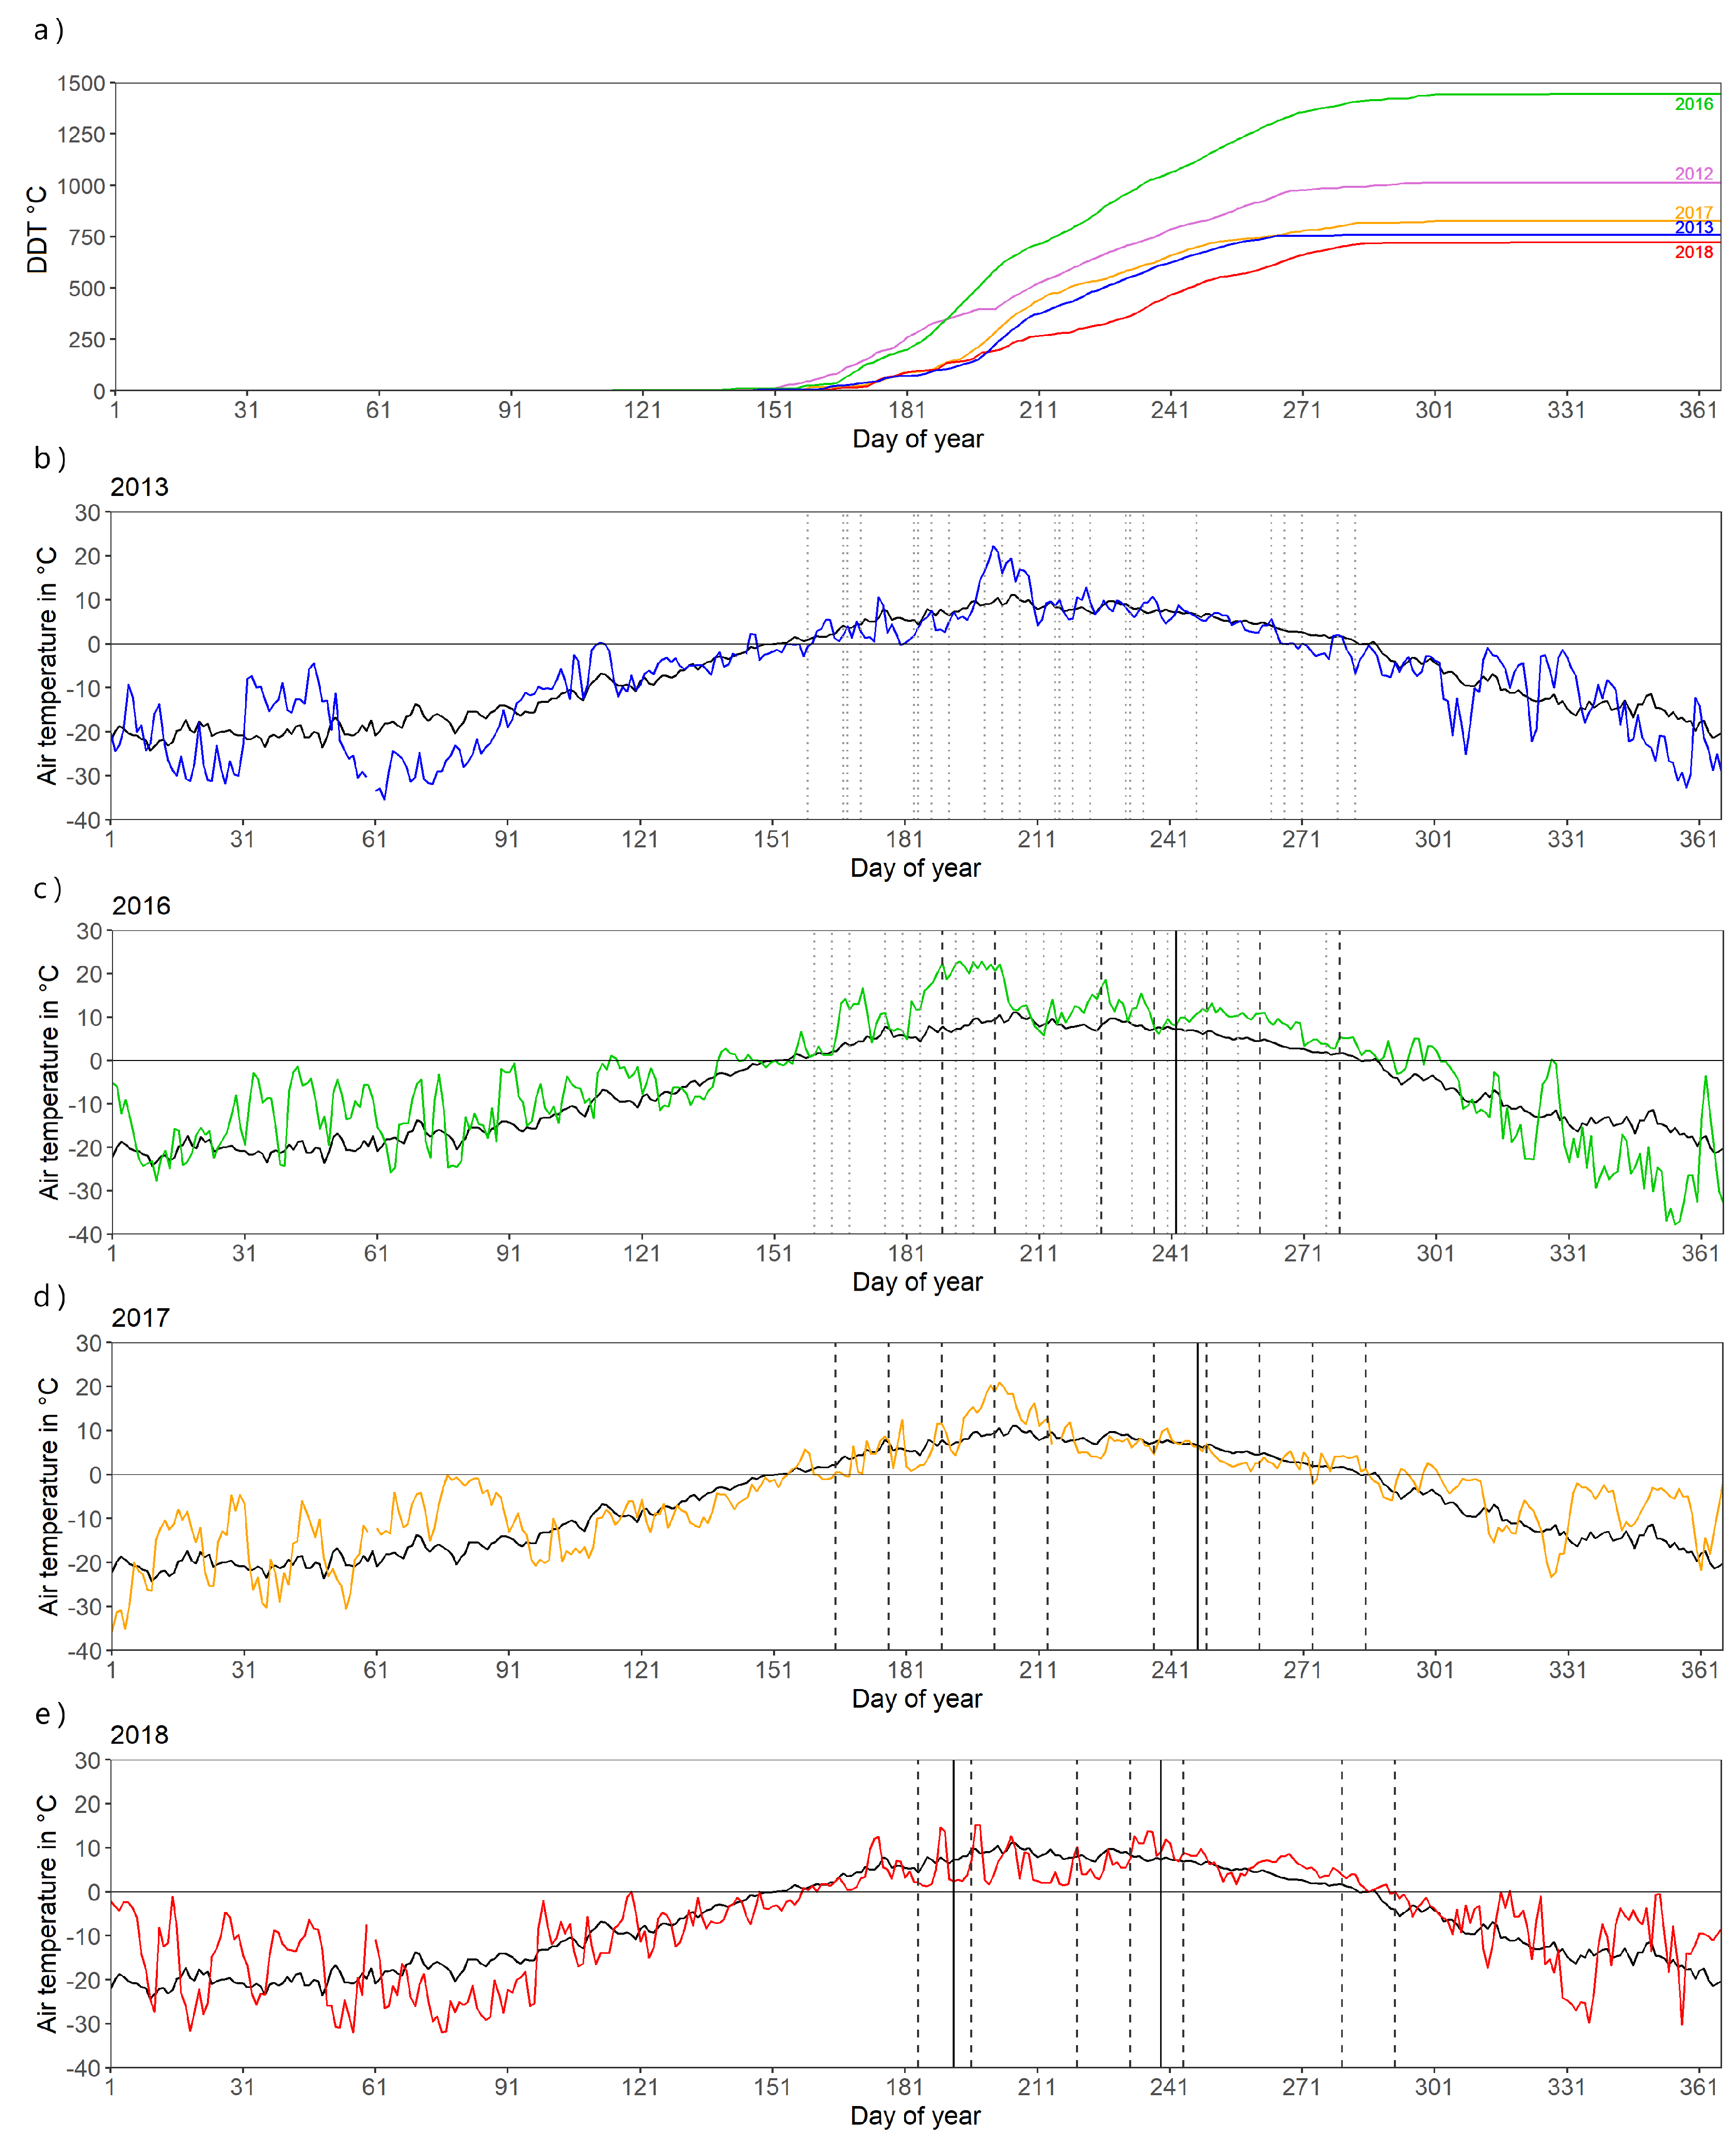
2.2.1. Meteorological Station and Borehole Data

The air temperature and precipitation data were obtained from the station Mare Sale which contributes to WMO (World Meteorological Organization). It is located approximately at 100 km distance, located on the coast but has been shown to be representative for conditions on central Yamal [21]. MAAT is about −8 ° C [26].
Summer 2016 has been distinct regarding air temperature [22]. Mid-July (day of year 190–200) air temperatures have been above average what was followed by a second warm period in August (after day of year 210, Figure 2c). All other analyzed years in this study show lower deviations.
Air temperature records are usually converted to degree-days of thawing (DDT) for purposes of permafrost studies. The daily mean temperatures are summed up for all cases where they exceed 0 ° C. The overall annual sum of a year provides a thaw index. It is commonly used for long-term studies and in the context of ground temperature modelling as well as assessment of subsidence, (e.g., [29]). A continuous increase of DDT since the start of measurements in 1947 has been reported for Mare Sale [22]. The seasonal evolution of DDT (see Figure 2a) is used for the analyses and offset correction of satellite derived displacements in our study.
Ground temperature measurements at VD were initiated in 1993 [21]. Boreholes are equipped with HOBO data loggers and measure ground temperature at different depths. We use borehole 53 (number in the data base of the Global Terrestrial Network on Permafrost—GTN-P) which is located close to the CALM grid. It represents a similar maximum thaw depth as the average of the CALM grid and includes a sensor at 100 cm depth.

2.2.2. Active-Layer Thickness

ALT ranges between 40 cm in peat and up to 120 cm on sandy, poorly vegetated surfaces across the central Yamal site [30,31,32,33]. There are extremes observed on high-center sandy polygons, which can be 1–1.5 m high and up to 10 m in diameter, with active layer exceeding 200 cm. While the spatial distribution of ALT depends on lithology and surface covers, temporal fluctuations are controlled by ground temperature, summer air temperature and summer precipitation [21].
In 1993 a CALM site was established at Vaskiny Dachy, placed on the top and slope of a highly dissected plain, affected by landslides, with sandy to clayey soils. Three additional sites were established within areas with more or less homogeneous vegetation [34]. The site Vaskiny Dachi-1 (VD-1) has clay soils. Soils at Vaskiny Dachi-2 (VD-2) are a mix of sand and clay, and at Vaskiny Dachi-3 (VD-3) sandy [34].
ALT is measured by a metal probe according to CALM protocol. This involves a late season mechanical probing, in our case late August, when ALT is near its end-of-season maximum. A one-centimeter-diameter graduated steel rod is inserted into the soil to the depth of resistance to determine the depth of thaw [35]. ALT is measured at a spacing of 10 m within the 100 × 100 m grid at the CALM site, resulting in 121 measuring points (see Figure 3). The VD sites feature five transects, respectively. At VD-1 and VD-2 these transects form grids of 50 × 50 m. Transects are 12.5 m apart and ALT is measured every 5 m, resulting in 55 measurement points per site. The transects at VD-3 are arranged to areas of homogeneous vegetation [34]. The site of VD-3 features higher ALT values, most likely because of the present sandy soils, which yield a greater conductivity and water permeability (higher convective heat exchange).
The CALM grid site is comparably heterogeneous. It features patches of dry cryptogam crust, grasses and mosses, low and high shrubs as well as some wet sedge spots. Cryptogam crust is encountered at the concave hilltop, while high shrubs are mostly located at the foot of the slope and on landslide bodies. A detailed survey of near surface moisture and vegetation description is provided in Widhalm et al. [36]. ALT is locally higher at this location due to high salinity of clayey deposits which contain no ice under negative temperature and do not resist to probing.
An increase in active-layer thickness since the start of the records has been already observed for Yamal [21]. Approximately 10% of grid nodes can exceed the maximum measurable depth of 170 cm. The average ALT for the CALM grid can be therefore not exactly determined and is expected to be underestimated. It is at least 103 cm.

2.3. Satellite Data

2.3.1. Sentinel-1 C-Band SAR Satellite Data

Sentinel-1 is a C-band radar imaging mission (wavelength λ 5.6 cm) composed of two satellites designed to study land and oceans. Sentinel-1A was launched on 3 April 2014 and Sentinel-1B on 25 April 2016. The Sentinel-1 constellation provides multiple SAR image acquisition strategies, with the TOPS (Terrain Observation by Progressive Scans) Interferometric Wide Swath (IWS) mode supporting wide-area InSAR applications [37]. Ground sampling distances of Sentinel-1 are in the order of 2.3 m in range and 13.6 m in azimuth directions, respectively.
Acquisitions are regularly available over all polar areas every 6 to 12 days [38]. This is, however, modified regionally with respect to general user requirements. Good temporal sampling by the Sentinel-1 mission became available over central Yamal in 2016 after the launch of Sentinel-1B. Table 1 and Figure 2 give an overview of the available data pairs, regularly available every 12 days.
All IWS images for central Yamal include VV polarization which has been shown applicable for InSAR seasonal subsidence in tundra environments [14]. All scenes were acquired between 7 and 8 a.m. local time from descending orbit. As the normal mode is right looking, the area is viewed from the SE. This means that the slope of the CALM grid is facing the sensor (see Figure 3). Due to the limitation to one orbit the incidence angle has been the same at the study site in all cases with approximately 34.5 ° .

2.3.2. COSMO-Skymed X-Band SAR Satellite Data

The Italian COSMO-Skymed program consists of four SAR satellites operating in X-band (wavelength λ = 3.1 cm) [39]. The constellation allows for a revisit time of 12 h. Available data have been acquired in Stripmap mode at HH polarization with a nominal spatial resolution of approximately 2 m.
Data from all four satellites are available for central Yamal for the years 2013 and 2016. Revisit intervals vary with in some cases from 24 h in 2013 to 20 days in late autumn 2016 (see Table 2). The start of the thaw season is therefore well captured in both years. The first acquisition in 2013 is on day one of thaw and in 2016 on day five (see Figure 2b,c).
All acquisitions have been made in ascending orbit between 5 and 6 a.m. local time and with an incidence angle of about 27 ° over central Yamal. As the normal mode is right looking, the region is viewed from SW. The image size is considerably smaller than for Sentinel-1 with 250 km swath width. The images center on the industry settlement of Bovanjenkovo. Its construction started in the 1980s [40]. The images do not extent to the VD long-term monitoring site but cover an area of similar land cover and geomorphology (distance of boundary to VD approximately 4 km). The southern part in direct proximity to VD has been analyzed in comparison with Sentinel-1 (overlap area shown in Figure 1).
Further X-band data have been acquired over VD in 2014 and 2015 by TerraSAR-X (see application in [36]). They have not been considered for this study as there is both no overlap with Sentinel-1 availability and there are no acquisitions in the main year of interest, 2016.

2.3.3. Land Cover from Sentinel-1 and Sentinel-2

A land-cover map of Western Siberia has been derived based on a combination of Sentinel-1 and 2 data [28]. Multi-spectral satellite data have been regionally employed for characterizing typical tundra landscapes reflecting moisture regimes and vegetation physiognomy previously [41]. So far, Landsat with 30 m spatial resolution has been the main data source. Further relevant information can be also derived from C-band SAR data, specifically data acquired under frozen conditions [42,43,44]. Sentinel-1 and Sentinel-2 have been therefore combined. A two-step approach as common for large-scale land-cover mapping has been applied [41]. First an unsupervised classification was made. In situ land-cover information was then applied to assign class names and define ROIs for the final maximum likelihood classification. This is based on a dedicated vegetation survey at VD (for details see [44]), the Yamal database [24], and a survey in the Northern Ural for land-cover types in the tundra taiga transition zone as a full transect was targeted. The classification accuracy ranges between 70 and 83.3% for the VD site with largest values for the dominant land-cover type ’dry to moist prostrate to erect dwarf shrub tundra’ [28]. This class corresponds to the land cover on the CALM grid and the active-layer thickness measurement sites VD-1 and VD-2. VD-3 consists of partially dry cryptogamic crust/sparse vegetation and graminoid prostrate dwarf shrub tundra (including patterned ground). Further common types are wet to waterlogged graminoid dwarf shrub tundra followed by sparse vegetation in relation to dynamical features such as seasonally inundated areas and thaw slumps. Figure 1 shows the land-cover map and the location of in situ points.

2.3.4. Soil Surface Wetness from Scatterometer Data

Precipitation records are only available from Mare Sale at 100 km distance. Soil moisture records have been also only collected occasionally on central Yamal, (e.g., [36]). C-band backscatter can provide an alternative account for near surface wetness [45]. Variations are expected to reflect surface wetness changes under unfrozen conditions. This would allow obtaining of information from moisture conditions before freeze-up what is expected to be of relevance for subsidence in the following spring. There are however no Sentinel-1 acquisitions before 2016. An alternative is scatterometer records. The resolution is in the order of 25 km, but nearly daily records are available. C-band data are available from the ASCAT (Advanced scatterometer) instrument onboard the Metop satellites. The backscatter data used in this study is provided by EUMETSAT (European Organisation for the Exploitation of Meteorological Satellites) in a 12.5 km grid as part of the soil moisture data product (evaluation example in tundra [46]). Data is continuously available since 2007, providing global coverage with a temporal resolution of approximately daily observations. The backscatter records used in this analysis are provided normalized to a 40 ° incidence angle. Comparisons are limited to the original backscatter (rather than derived soil moisture products) due to known deteriorating effects of tundra specific issues on the parameterization of soil moisture retrieval [47,48]. Högström et al. [46], however, demonstrated that ASCAT derived near surface soil moisture correlates comparably well with in situ measurements over tundra in autumn, specifically over the last 20 days before freeze-up.
The selected ASCAT grid cell (center 70.278 ° N, 69.008 ° E) covers all in situ measurement sites. ASCAT data as well as precipitation records from Mare Sale are used for the discussion of soil moisture influence on the results of the subsidence and active-layer thickness analyses.

3. Methodology

3.1. Displacement Retrieval by InSAR

Our InSAR processing sequence follows the procedure by Strozzi et al. [14] and includes the co-registration of the single-look complex Sentinel-1 and COSMO-Skymed images, the computation of interferograms in series with a multi-looking factor of 5 pixels in slant-range and of 1 pixel in azimuth for Sentinel-1 and of 5 × 5 pixels for COSMO-Skymed, the removal of the topographic-related phase with use of an external DEM (TanDEM-X 30 m), adaptive phase filtering [49], phase unwrapping using a minimum cost-flow algorithm [50] as implemented in the Gamma Software [51], low-pass phase filter, computation of summer cumulative displacement maps and time series of movement via short-baseline InSAR [52], and terrain-corrected geocoding. For the precise co-registration of Sentinel-1 SAR data a refinement based on the spectral diversity within bursts and swaths was included [53]. Occasional ionospheric disturbances were mitigated using a low-pass filter but without applying a procedure based on split-beam [54] or split-spectrum [55] interferometry. Phase unwrapping errors could be not completely avoided and were observed in particular at the scale of a few tens of meters. They are also depending on the acquisition time interval and season (i.e., better for very short time intervals and at the end of the season when displacements are smaller). The InSAR reference point was selected on an airstrip at 70.317 ° N 68.324 ° E.
We use multiple interferograms acquired during the summer season, which show very good coherence under snow-free conditions. Yearly interferograms from the end of the summer do not show a sufficient level of coherence (>~0.2) in order to link data from the two years, what does not allow the reconstruction of longer time-series of deformation showing summer thaw subsidence followed by frost heave. We therefore limit our analyses to separate records acquired during the summer season under snow-free conditions for each year. The pixel spacing of the resulting datasets is 26 m × 30 m for Sentinel-1. COSMO-Skymed has been sampled to the same spacing for this study.
Thaw is expected to be initiated as soon as the snow melts [56,57]. Timing of snowmelt can differ by more than a month over central Yamal [58]. In addition, acquisition timing is depending on general mission strategies and therefore differs from year to year. The date of the first data pair therefore differs for each year. For comparability of the years, the date (day of year) is replaced by DDT. It is extracted for each acquisition date from air temperature records (see in situ data section). The new value is assigned to the second date of the data pair (Table 1 and Table 2).
The closest usable Sentinel-1 pair to the start of the thaw season in 2017 starts at about 17 DDT, at 98 in 2018 and 279 in 2016 (Table 1). The year 2017 is therefore used as reference basis for Sentinel-1 in this study. Under the assumption that the subsidence occurs in dependence on cumulative degree-days of thawing, the other years are corrected for the offset. A rate of subsidence per degree is derived from the 2017 time series for each pixel. This rate is applied to the time before the first data pair in 2016 as well as 2018. The cumulative degree-days of thawing from the first acquisition date of each year (see Table 1) is multiplied with the rate and added to the displacement derived from the first data pair. This modification is referred to as ’offset correction’ in the following.
A scaling of the line of sight results is needed for comparison with in situ measurements due to the incidence angle and the slope. The CALM grid is for example facing towards the sensor in case of Sentinel-1 (local incidence angle Θ C A L M = 34.54 ° ). If we assume that the motion in Yamal is vertical, then we need to consider a scale factor of 1.214 (1/cos( Θ C A L M )) for Sentinel-1 over this site. We have applied a conversion to all measurements from Sentinel-1 as well as COSMO-Skymed. We refer to the respective results as ’scaled’ in the following.

3.2. In Situ Measurements of Subsidence

The ALT measurements at the CALM grid are complemented by subsidence observations since 2007 using various installations. Measurements have been made for all three years with Sentinel-1 coverage (29 August 2016), 3 September 2017 and 27 August 2018). The principle used for the measurements is frost-heaving of a plate. This method has been for example used by Antonova et al. [12] (metal or fiberglass rods and fiber glass plates). Thaw tubes are also commonly used in comparison to InSAR observations in permafrost areas, (e.g., [20,59]). Alternatively, Differential Global Positioning Systems (DGPS) measurements have been shown to be applicable for monitoring seasonal subsidence [60,61] as well as long-term isotropic thaw subsidence [29,62].
A metal rod is inserted as deep as the permafrost table through a hollow in a plywood plate (Figure 3). The plate subsides with the surface but the rod, being frozen to the active-layer base till late summer, stays above the subsiding surface. The increment between the plate on the surface and the mark on the rod referring to the initial position on the surface before freezing is accepted equal to subsidence. Measurements are performed annually in late fall along with active-layer measurements at the CALM grid. The seven sites represent different settings including drying parts with cryptogam crust, grasses and mosses as well as low and high shrubs (see Figure 3). They vary in ALT, ranging between 70 and 130 cm. Several of the sites are comparably close to each other (distance less than satellite product pixel spacing). All have been nevertheless included to the assessment to represent heterogeneity and due to data gaps at two of the sites (no data at number 3 for 2016 and 2017 and at number 7 for 2018). The subsidence monitoring program has been extended in 2018. 20 sites have been added and measurements made on 11 July 2018 and 27 August 2018.

3.3. Post-Processing

The in situ as well as the satellite derived values (all pixel values overlapping with the CALM grid, in total 22 pixels) have been averaged for the comparison with in situ measurements for the end of thaw season from multi-annual measurement sites over the CALM grid. This includes subsidence as well as depth of active layer.
Precipitation data as well as ASCAT backscatter have been post-processed for the 20 days preceding the start of near surface freeze-up (as defined in Högström et al. [46]) as determined by borehole data for all years. Precipitation has been summed up and backscatter averaged.

4. Results

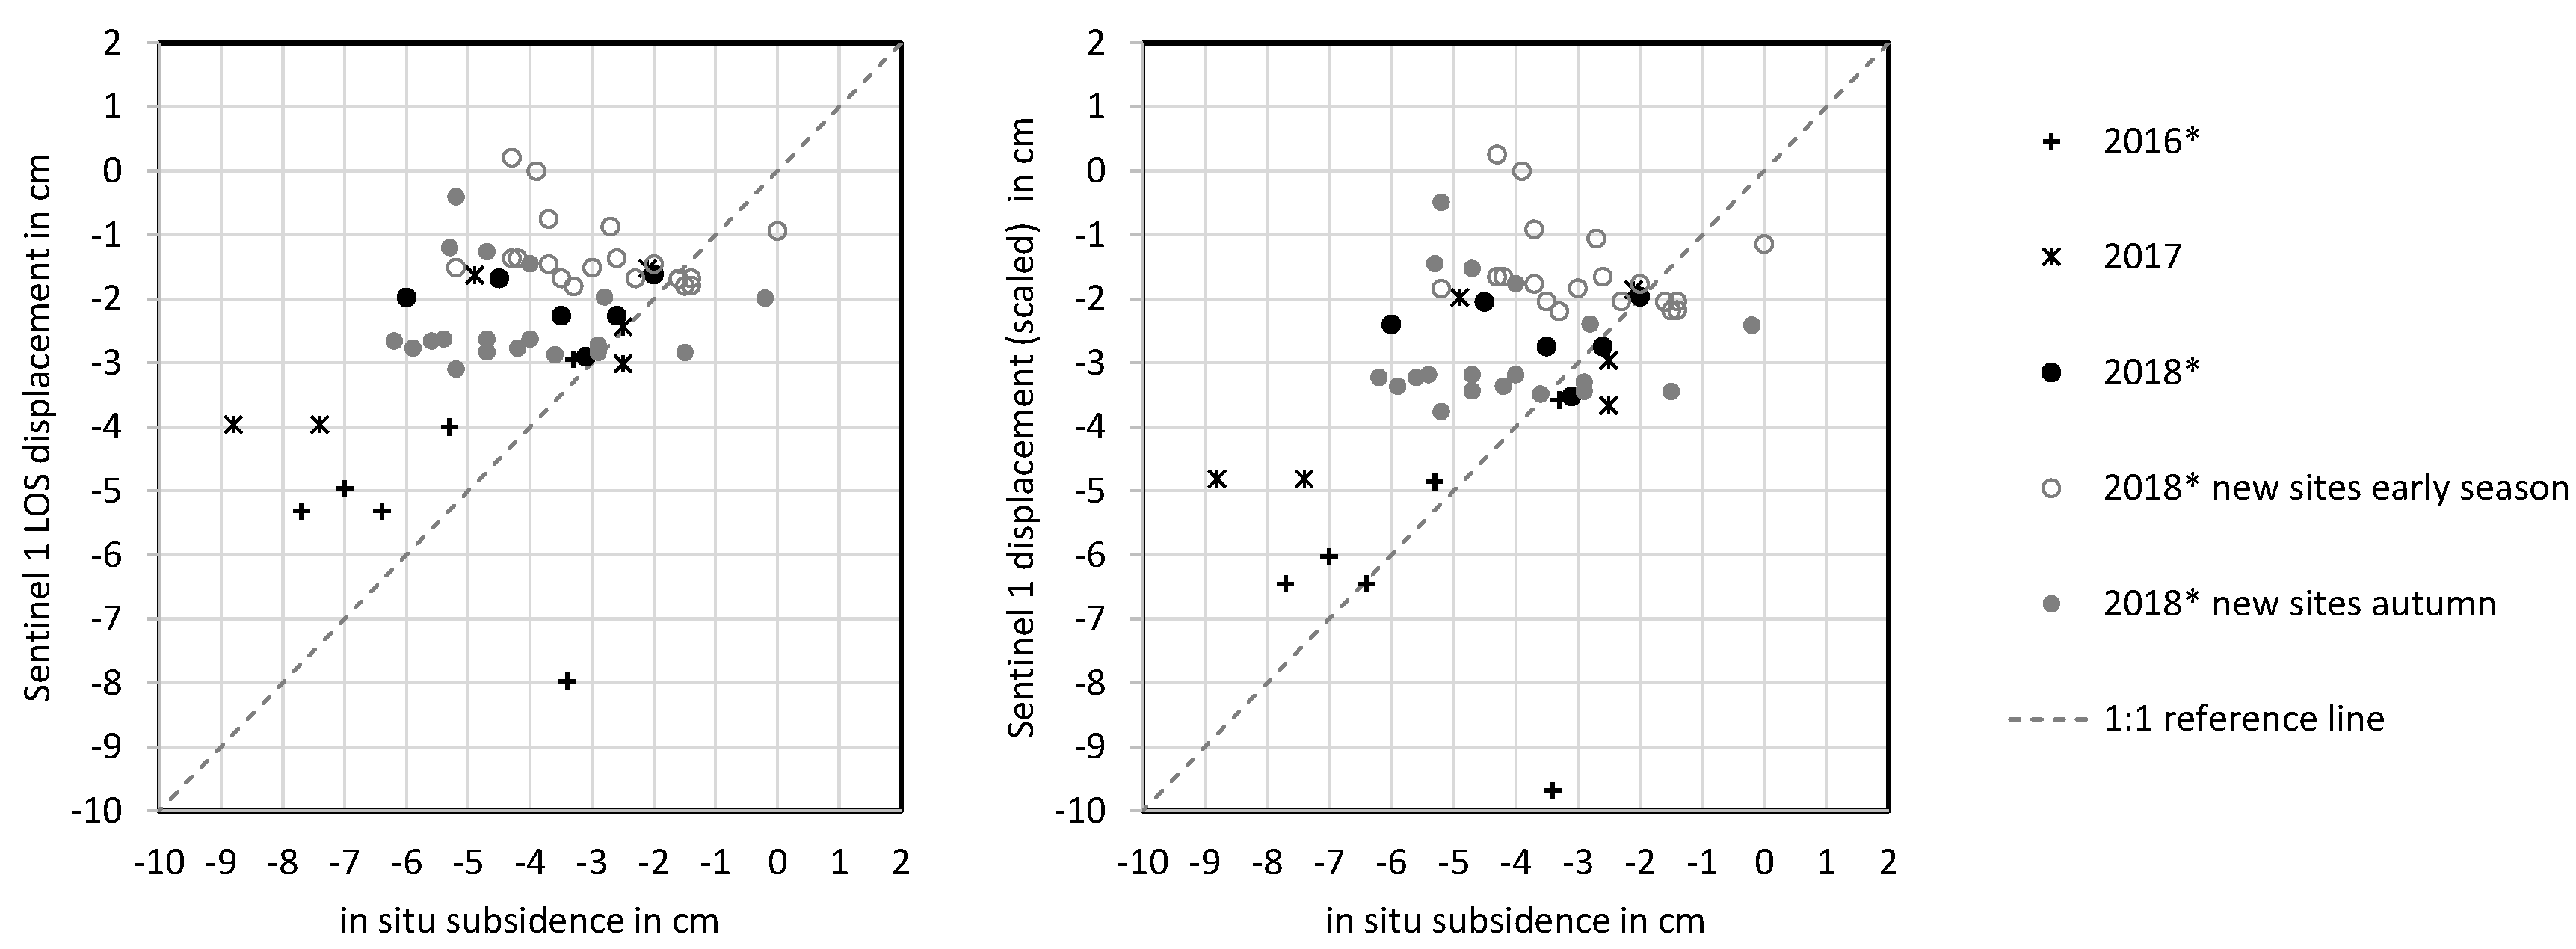
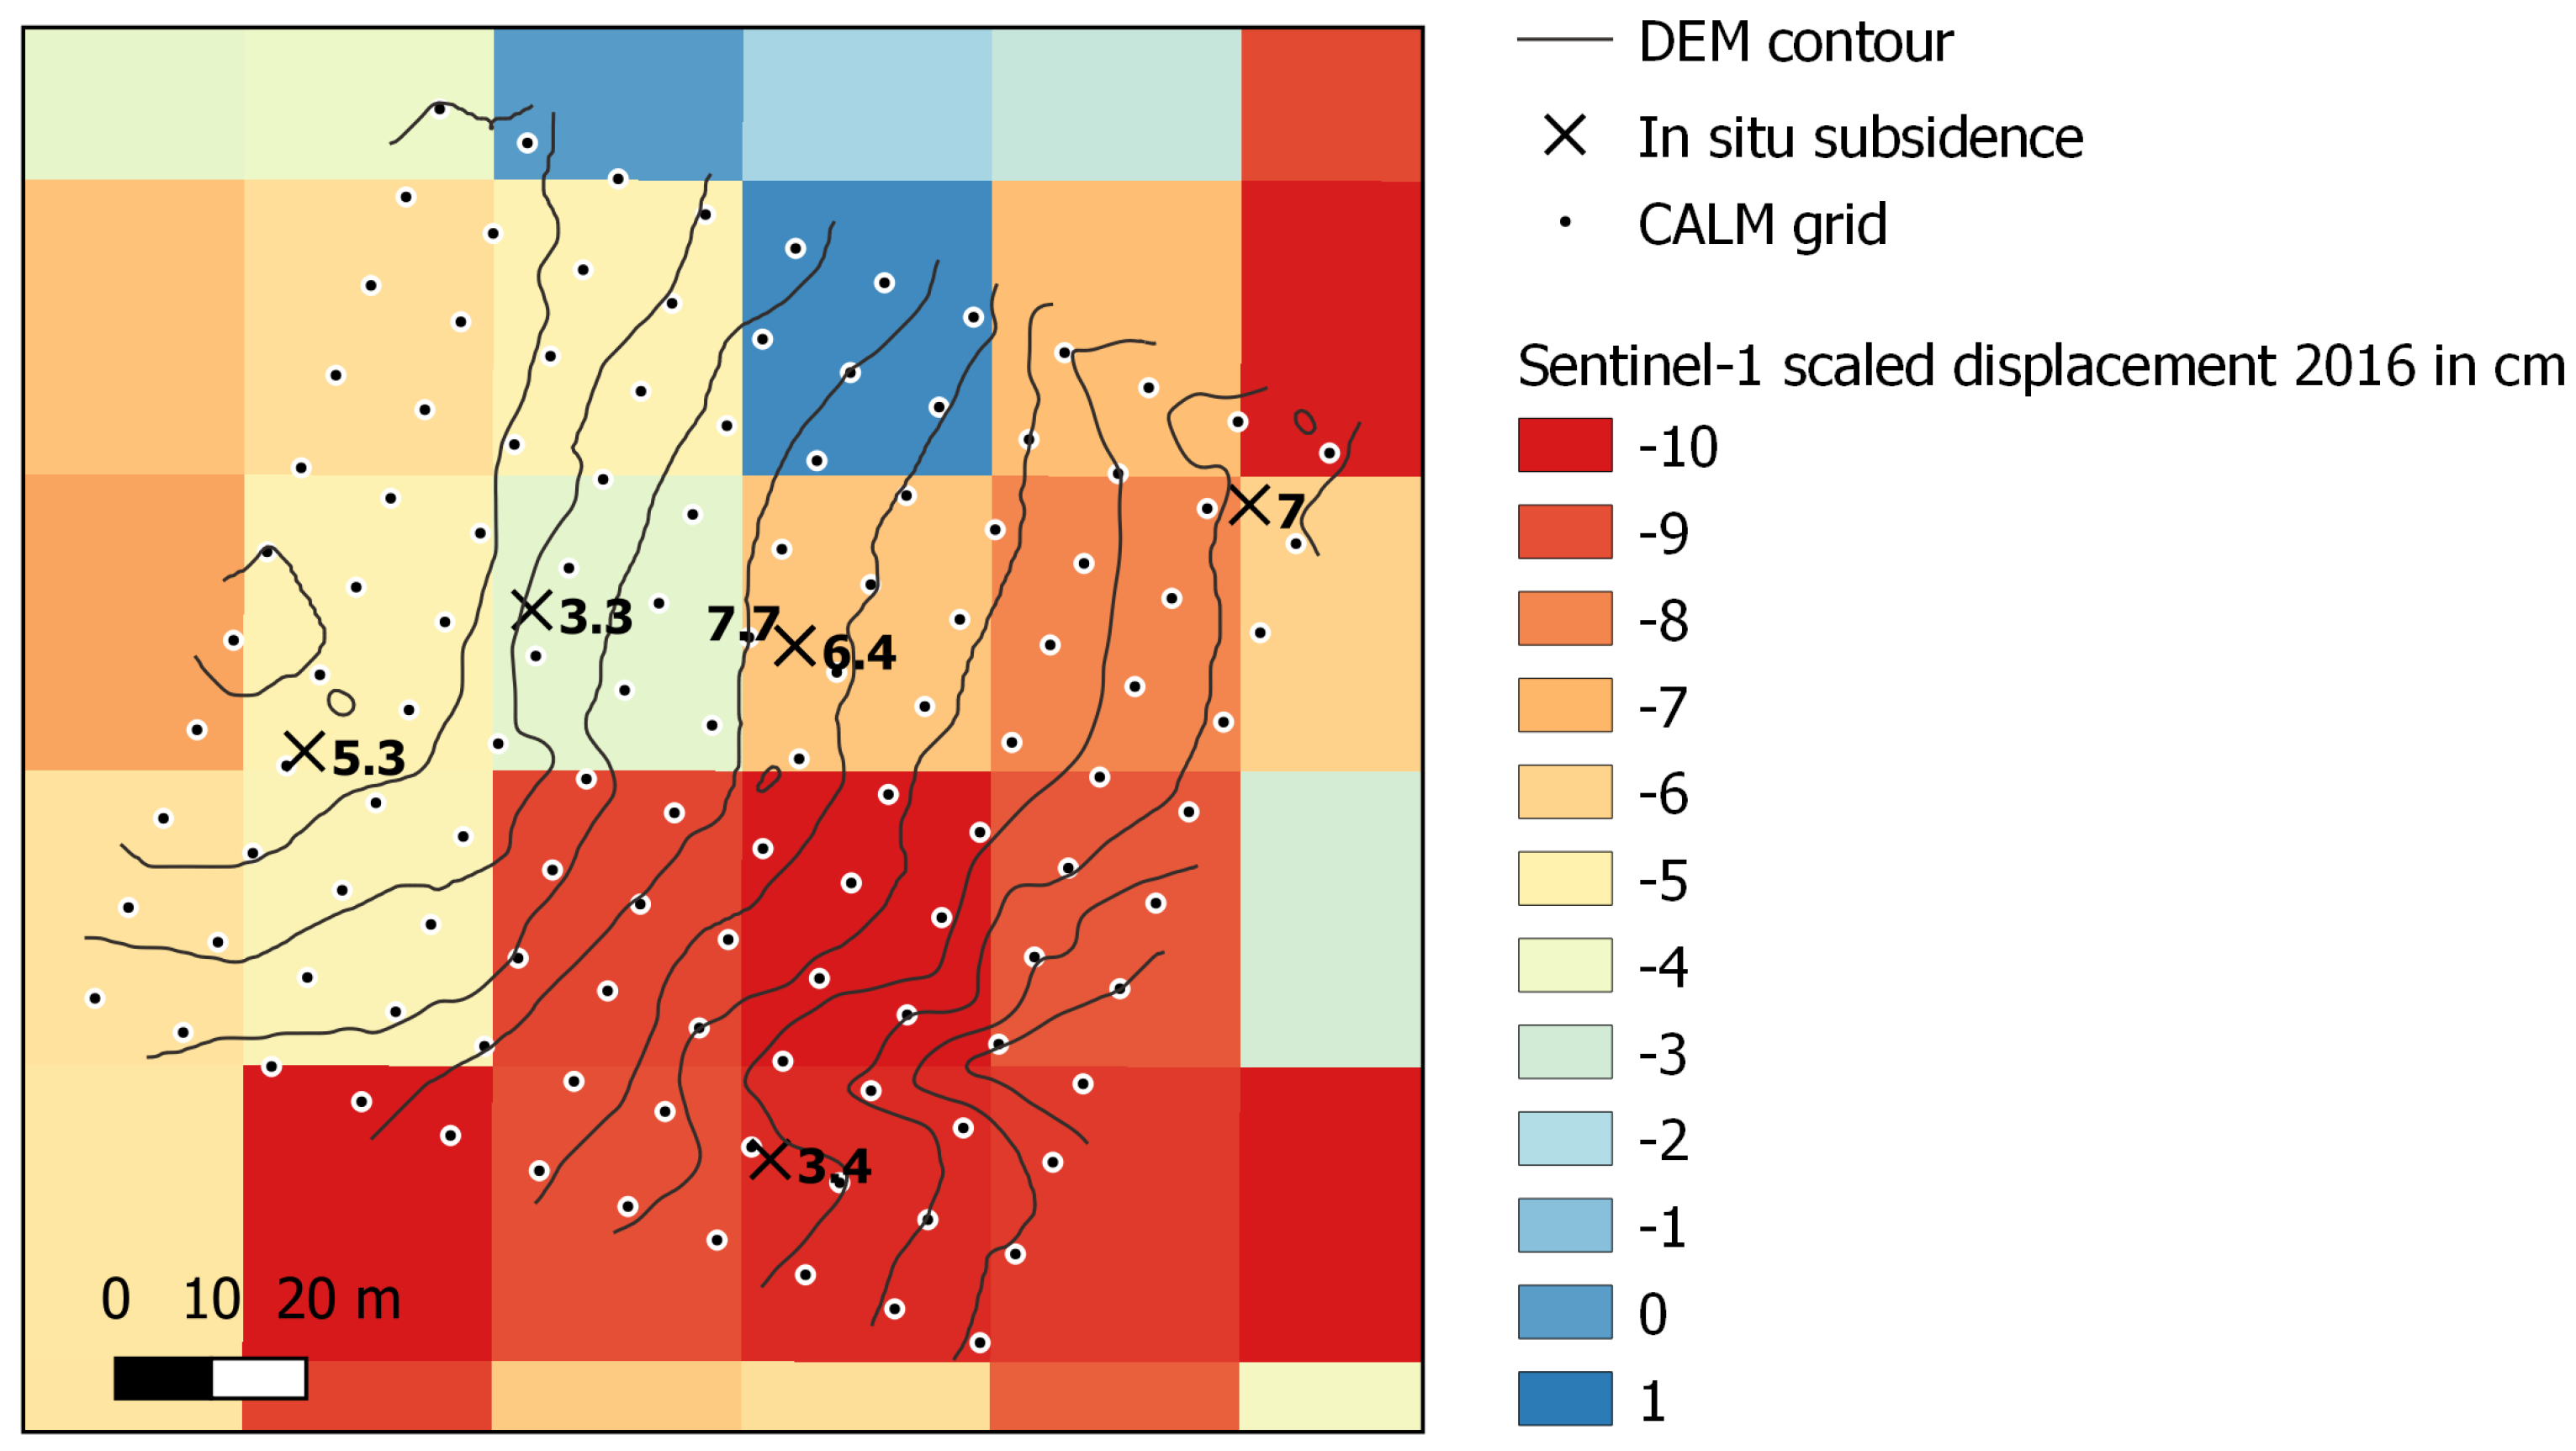
4.1. In Situ Observations in Comparison to C-Band Retrievals at the CALM Grid

Satellite derived displacements in LOS are mostly lower than in situ measurements (Table 3). Sentinel-1 displacements show larger differences between the years. The average over the CALM grid is more than twice in magnitude in 2016 compared to the other years. The comparison with the individual measurements (Figure 4) gives insight into the heterogeneity over the CALM grid. The maximum in situ subsidence in 2016 is similar to 2017, the average is however 0.8 cm lower (larger subsidence) in 2016 (see Table 3). The variations across the CALM grid in 2016 are also visualized in Figure 5. The northwestern part which is located on the ridge shows lower subsidence than the lower part on the slope. The outlier as visible in Figure 4 can be in the lower southern part close to a depression, an area affected by landslides (number 5).
Although that there are differences among the in situ measurements in 2018, Sentinel-1 displacements show little variations between the pixels overlapping with the locations of the in situ measurements. The underestimation in normal years (2017 and 2018) also remains after correction for viewing geometry based on a scale factor (Figure 4, Table 3). Satellite derived displacements are on average 1 cm (about 20%) lower over the CALM grid sites in these years. Differences within the season observed with C-band can be confirmed in case of 2018, when early season in situ measurements are available. Average subsidence was 2.9 cm in July and 4.1 cm at the end of August. This corresponds to a rate of 3.9 mm over 100 DDT. Sentinel-1 LOS displacement rate is similar but lower with approximately 3.6 mm (Figure 4) and higher with 4.3 mm after application of the scale factor.

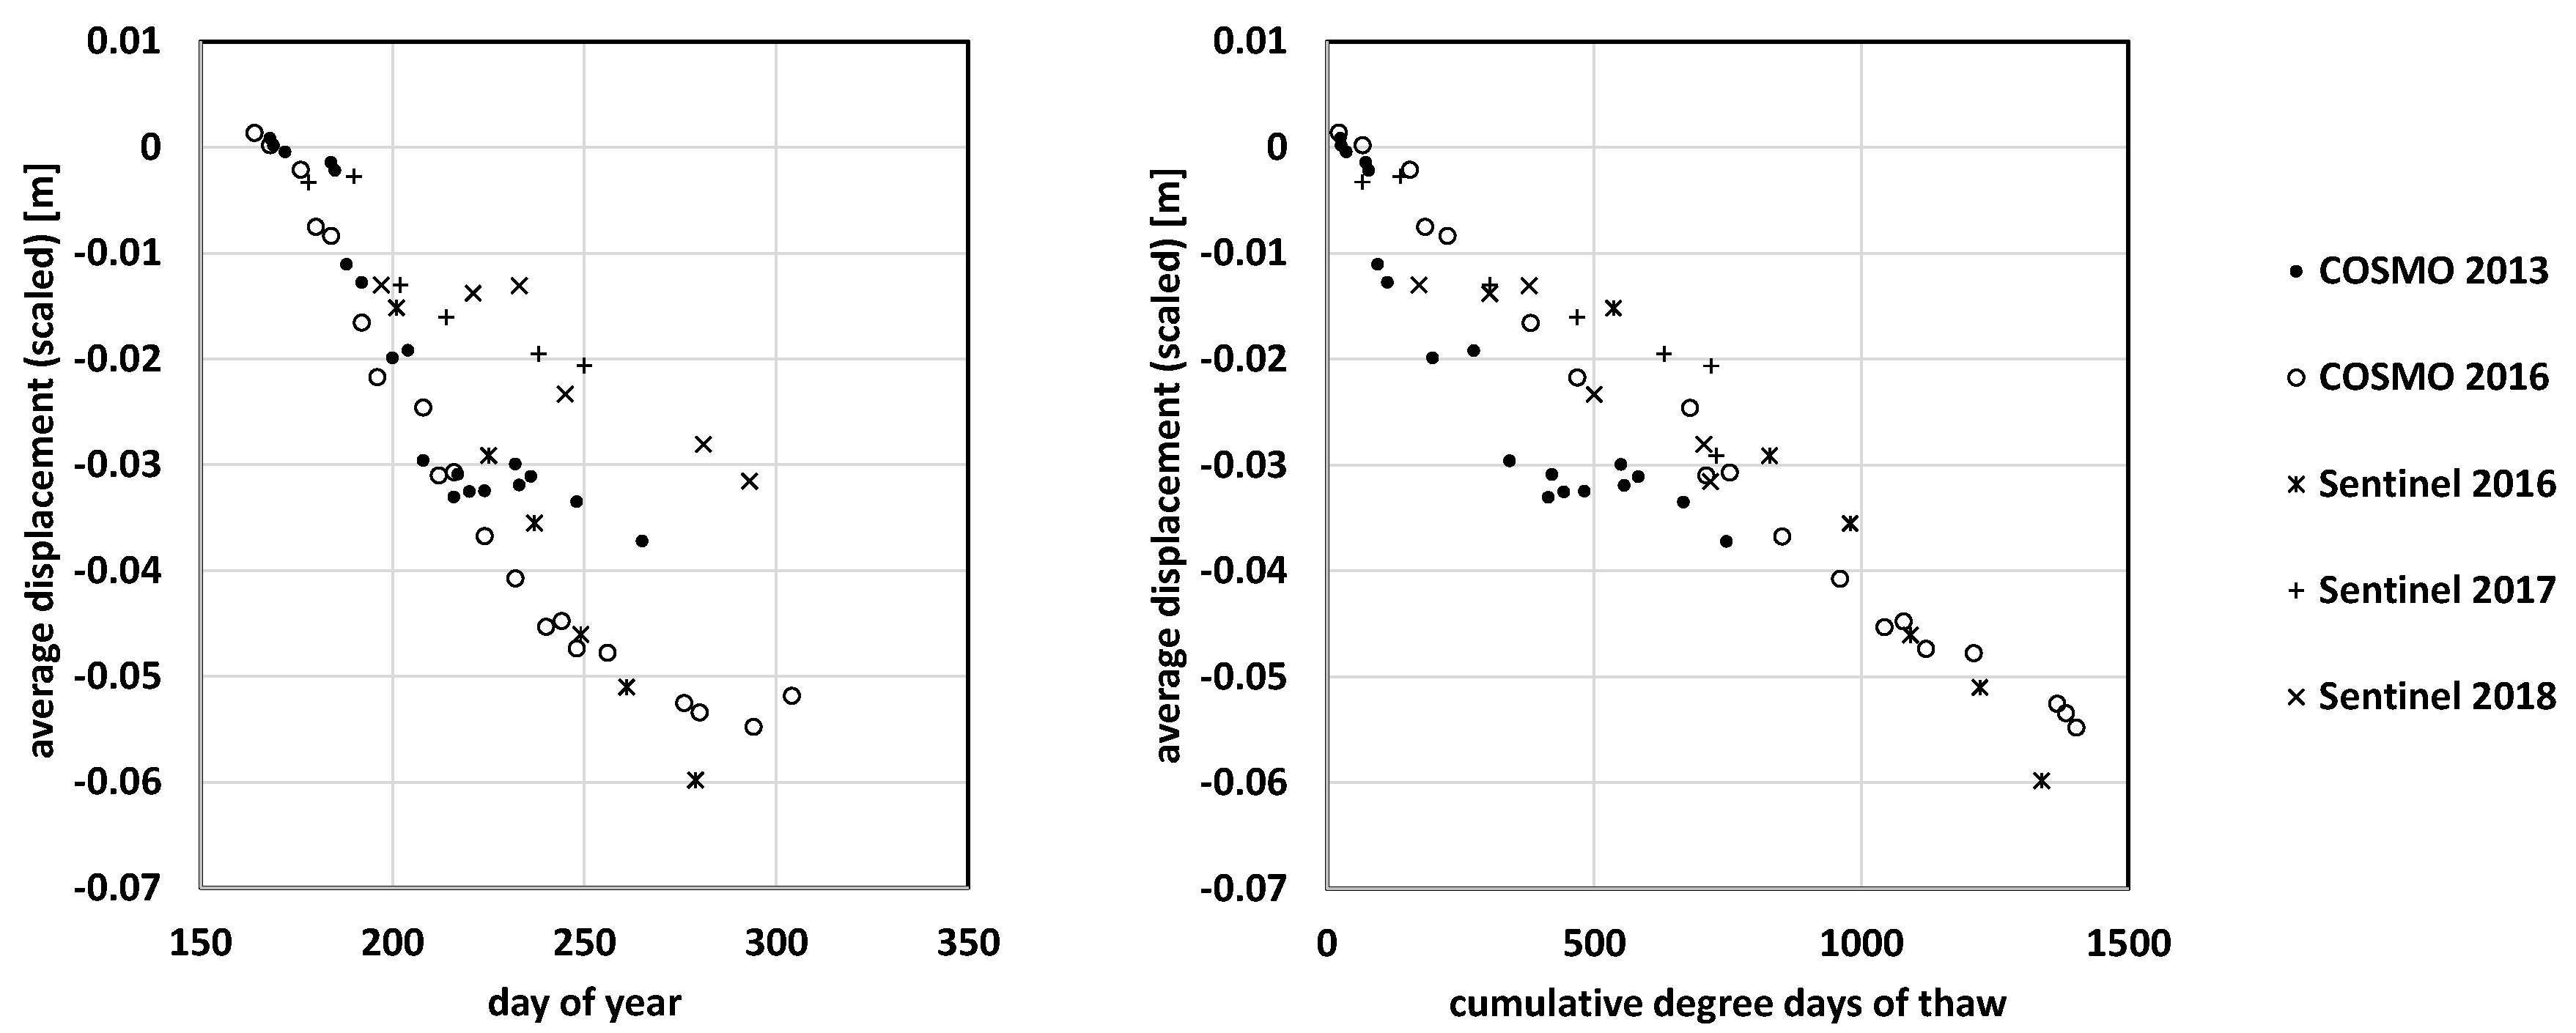
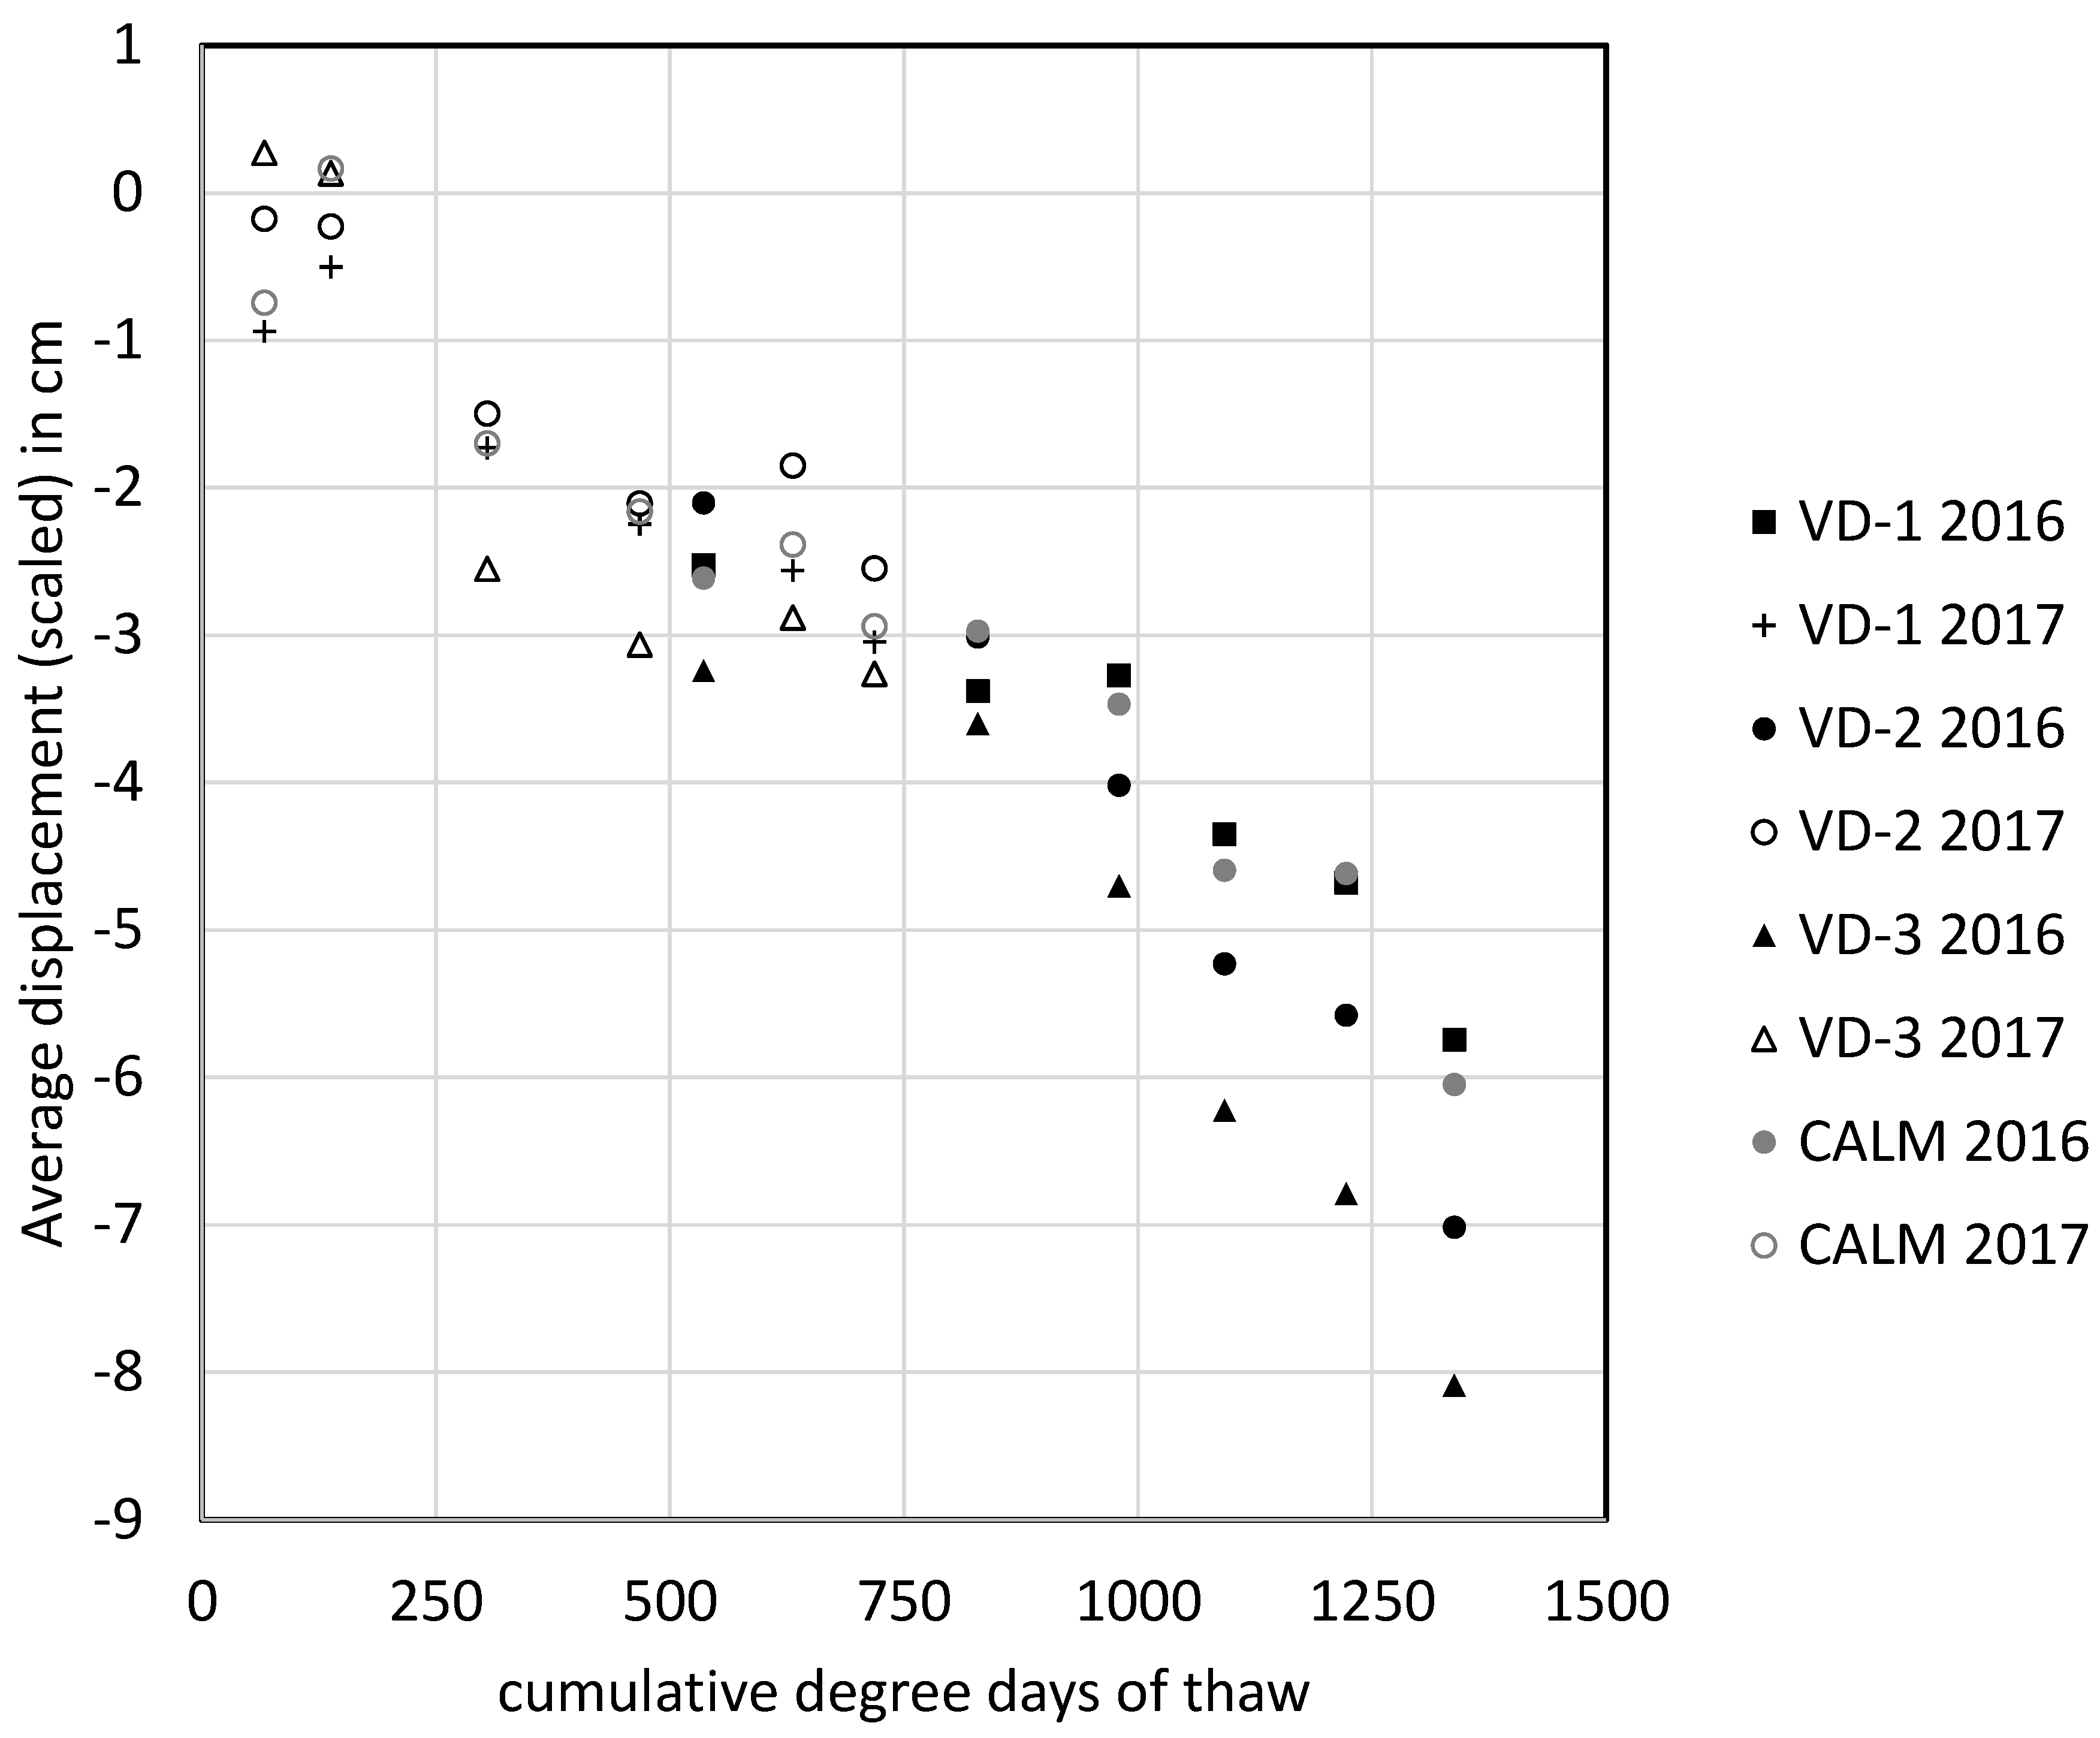
4.2. Displacement: C-Band Versus X-Band

The magnitude of scaled displacements is similar between the sensors although that the viewing direction between Sentinel-1 and COSMO-Skymed differs considerably (SE versus SW). The relationship with cumulative DDT is similar between the years as well as sensors contrary to the day of year relationship (Figure 6) suggesting vertical motion. This is especially exemplified by the results from the different years available from Sentinel-1. The cumulative DDT relationship varies for normal years (with total season thawing cumulative thawing degree-days close to long-term average), but an average displacement of about 3 cm is recorded around the time when the average thaw index (780, see Table 3) is reached in all years. Displacement progressed until the end of thaw season in all cases, but rates deviated after approximately day of year 200 (20 July).
The progression of average displacement with respect to DDT for the overlap area of Sentinel-1 and COSMO-Skymed shows the same behavior as over the CALM grid (which corresponds to the dominant land-cover type) (Figure 6 and Figure 7). The rate of scaled displacement in 2016 is also similar to the in situ observations at the CALM grid in 2018 (3.9 mm) with approximately 3.7 mm for Sentinel-1 and 4.0 mm for COSMO-Skymed (over 100 DDT).

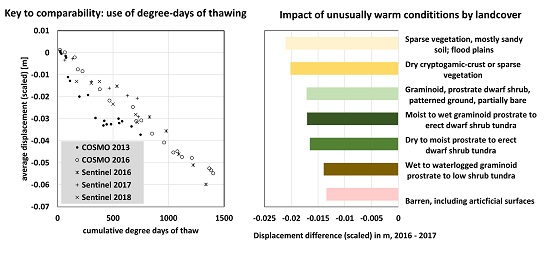
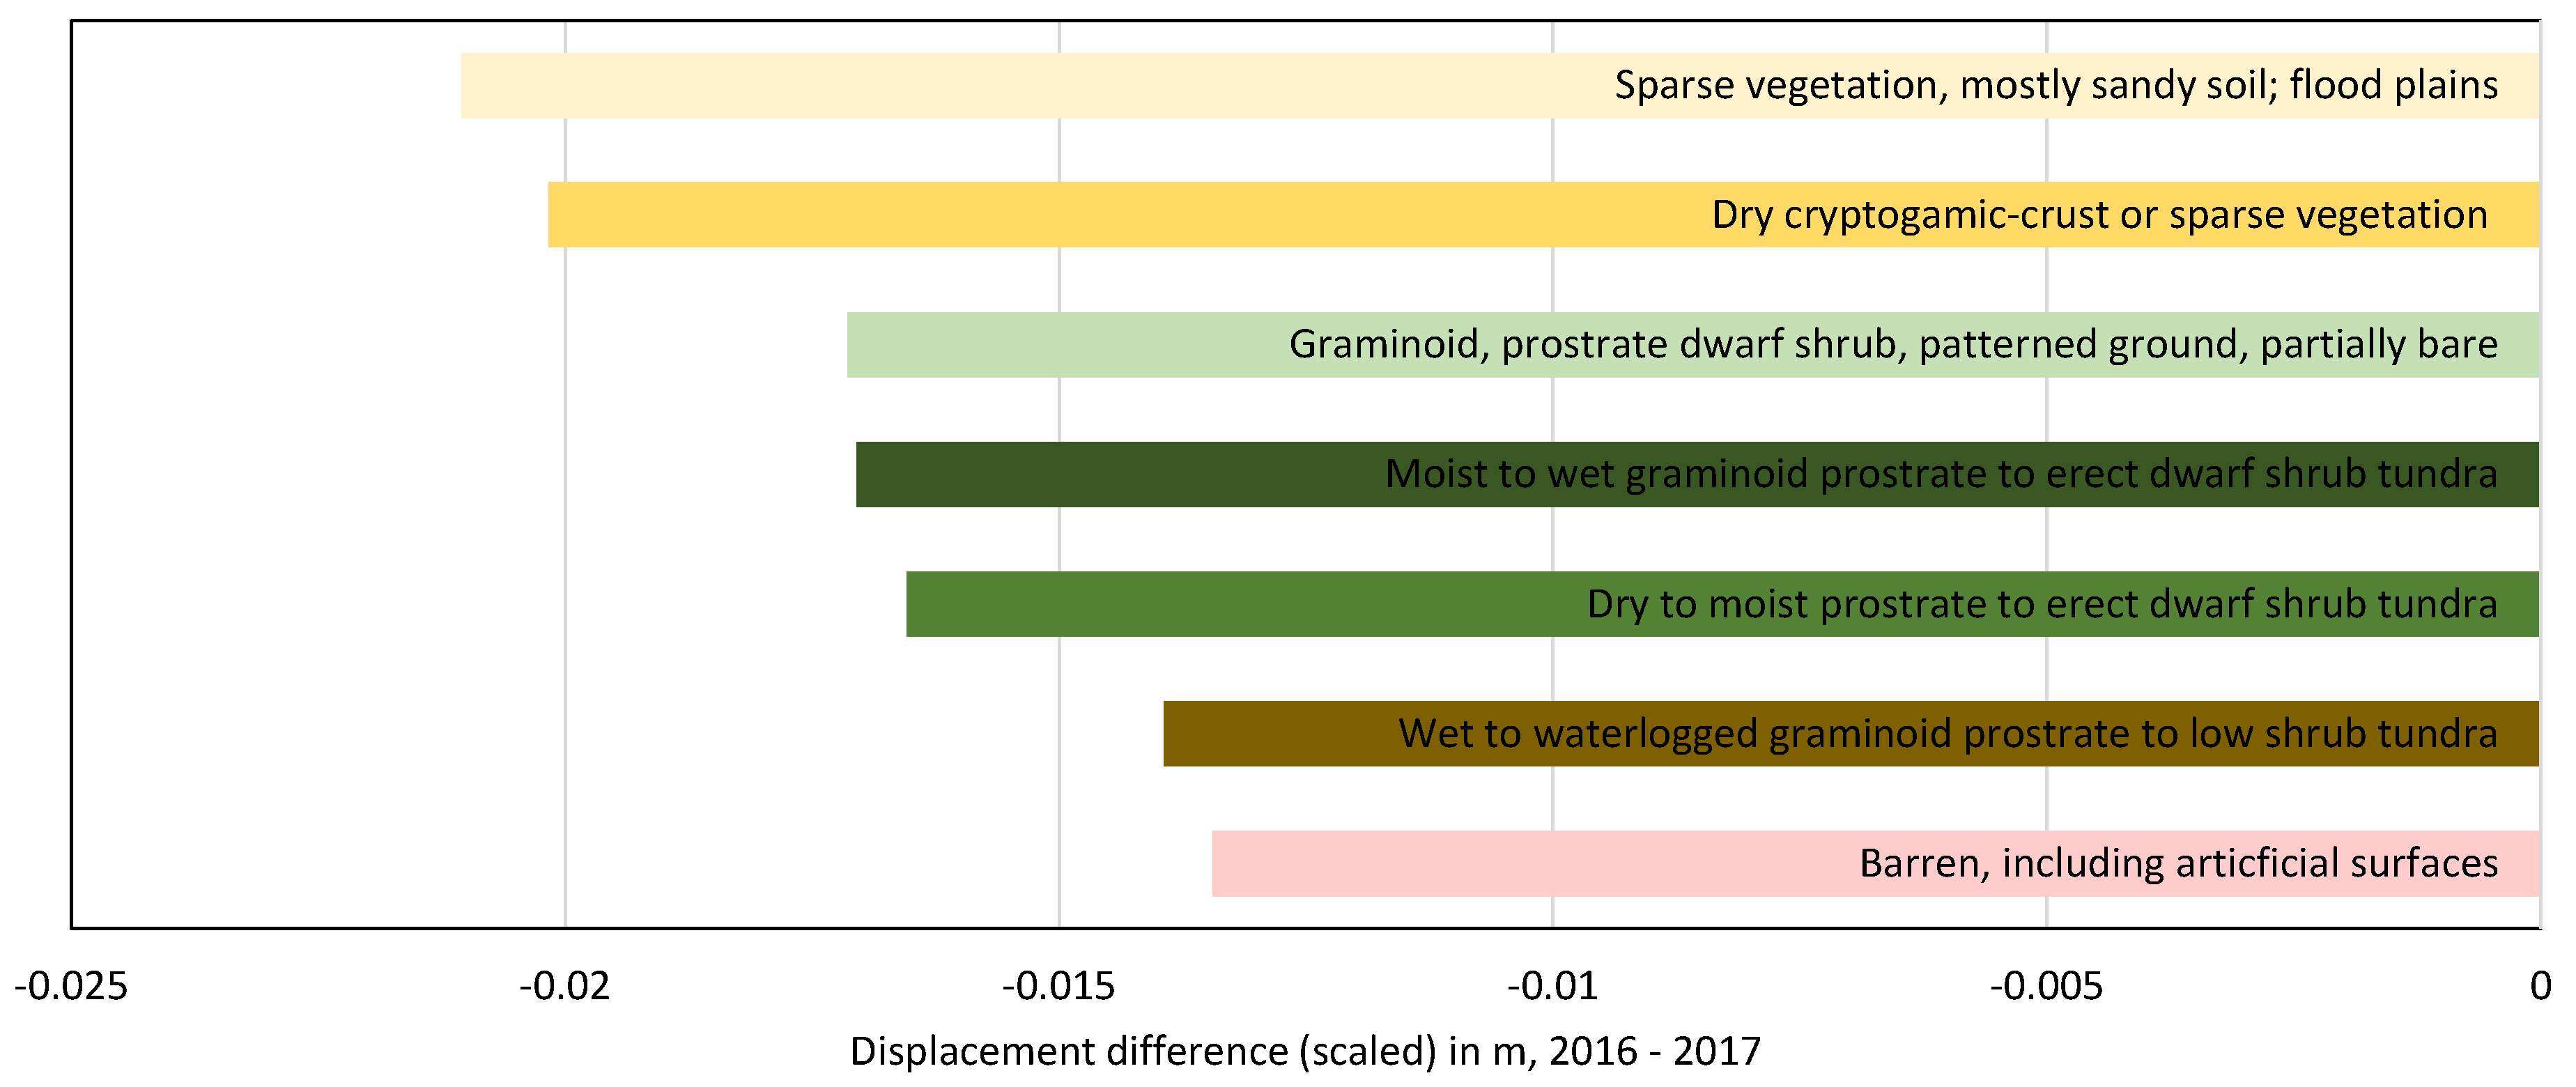
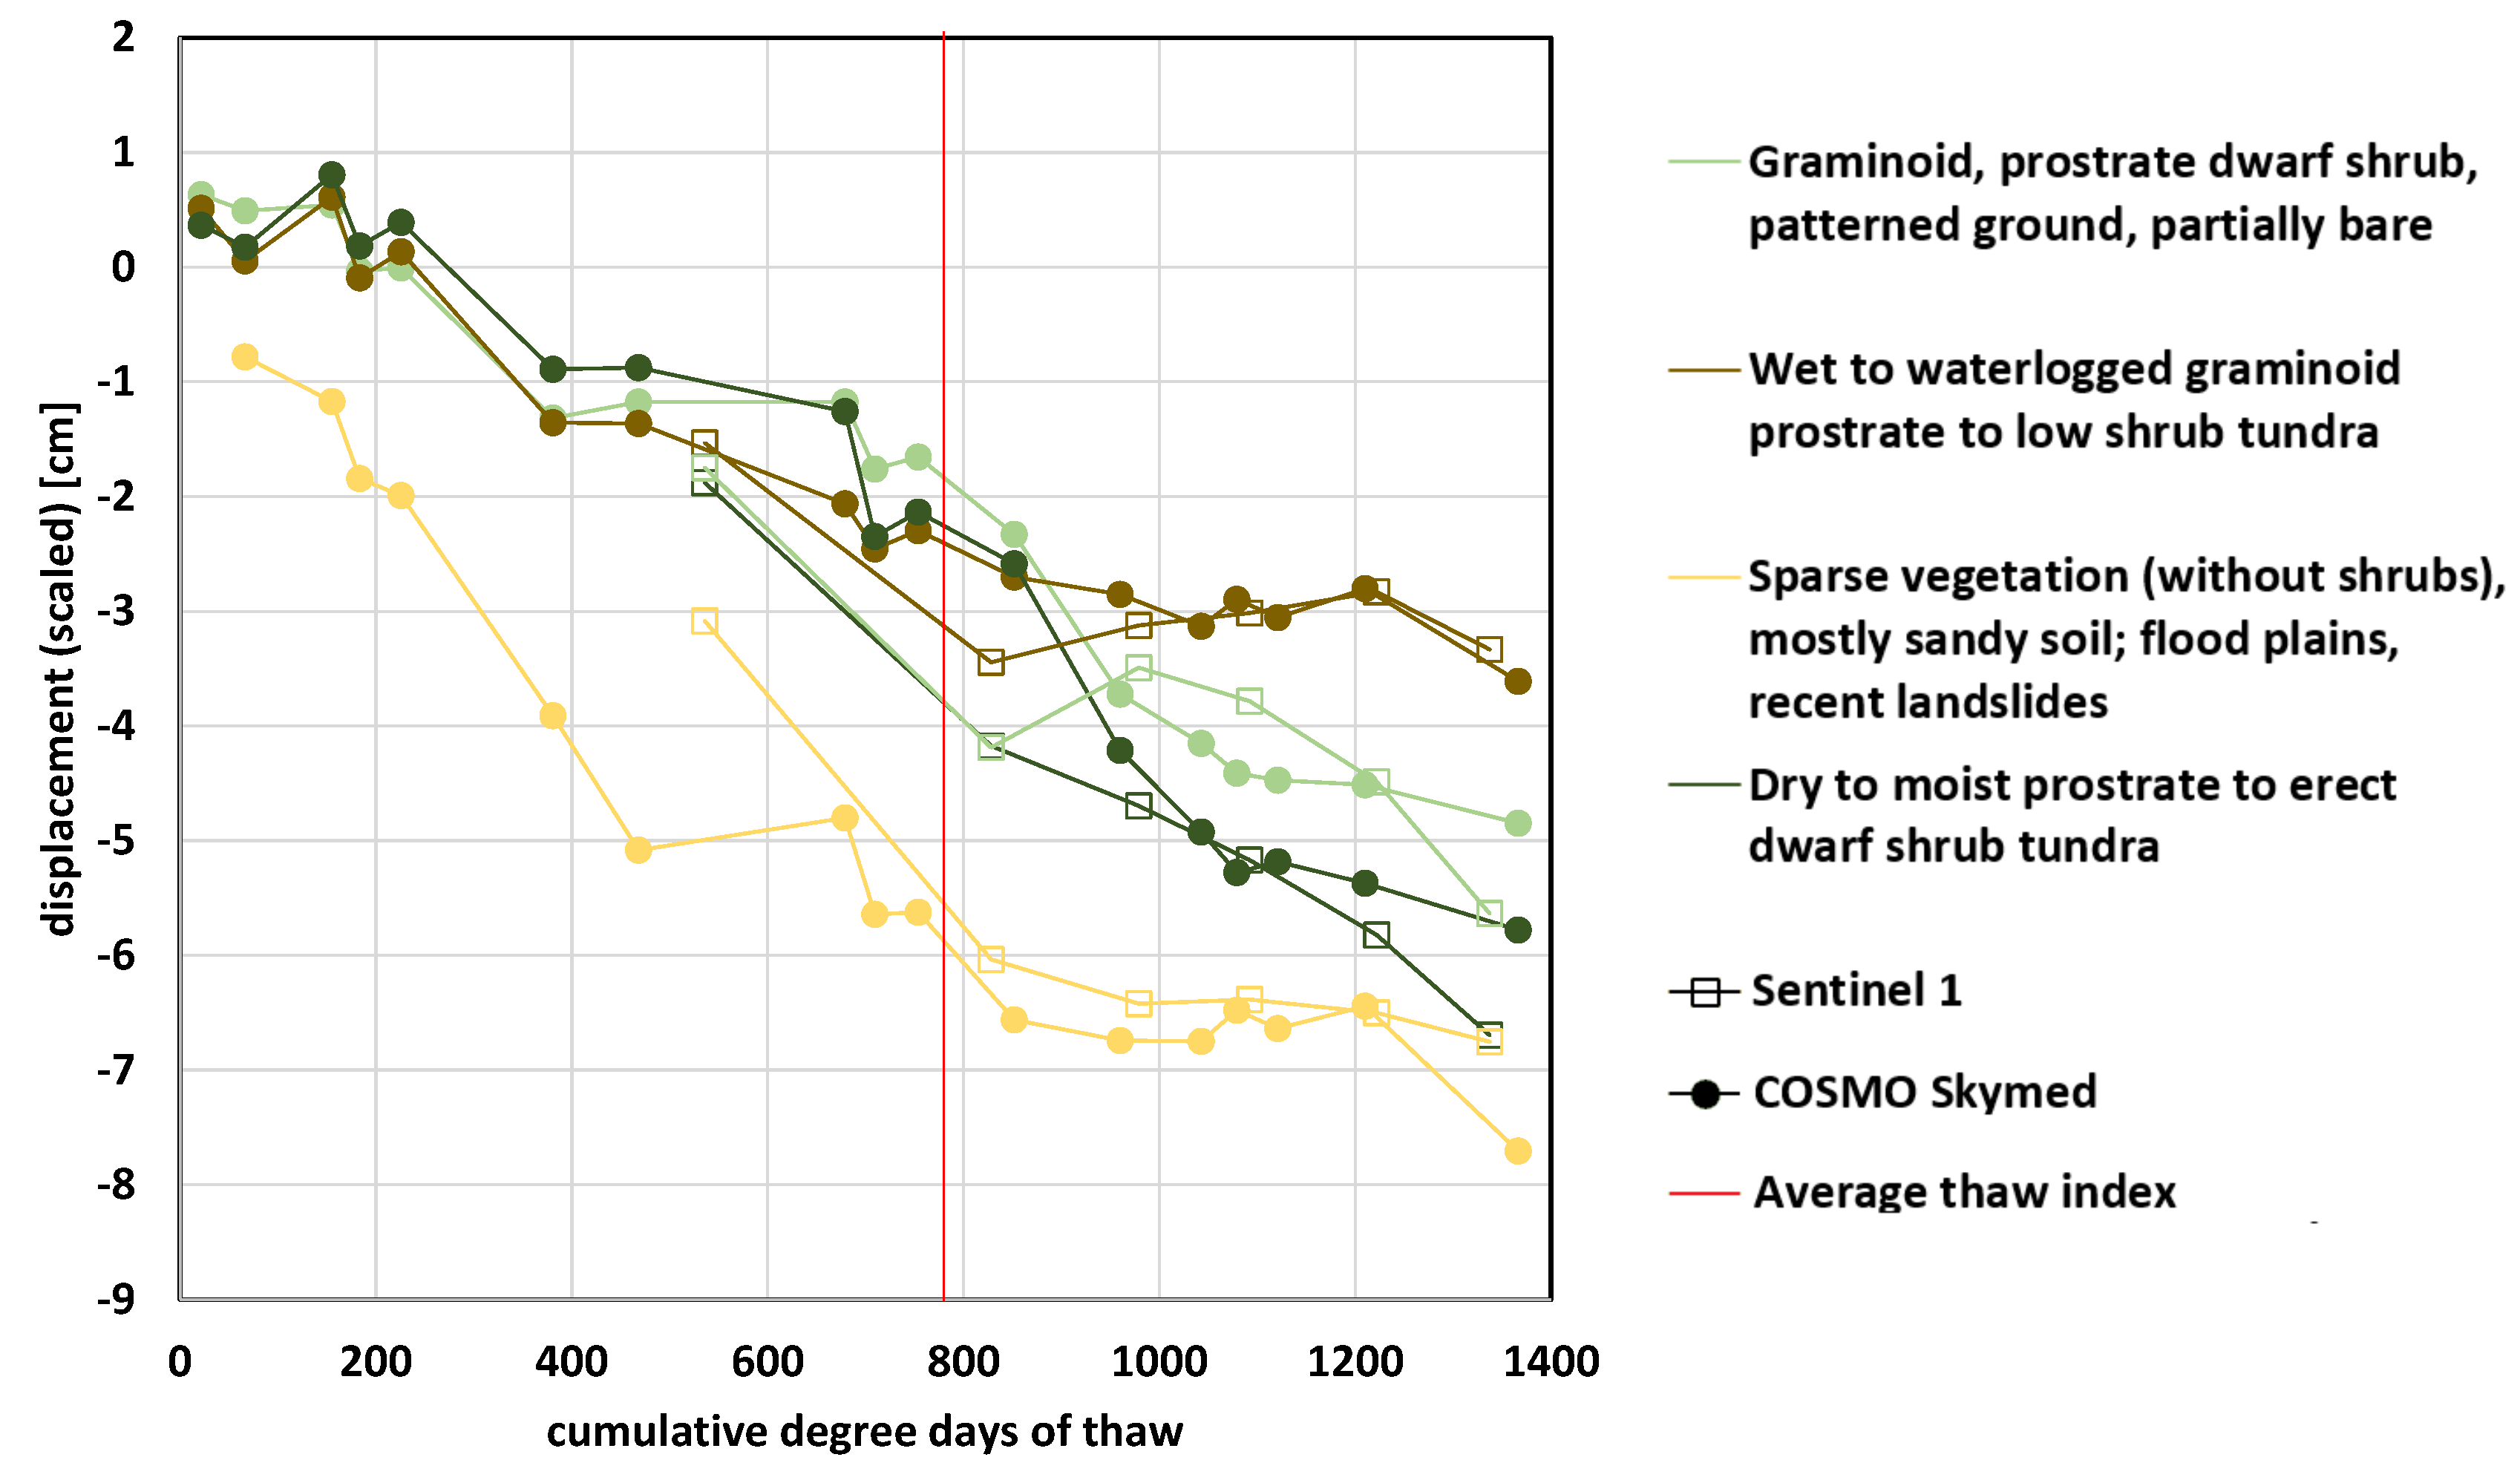
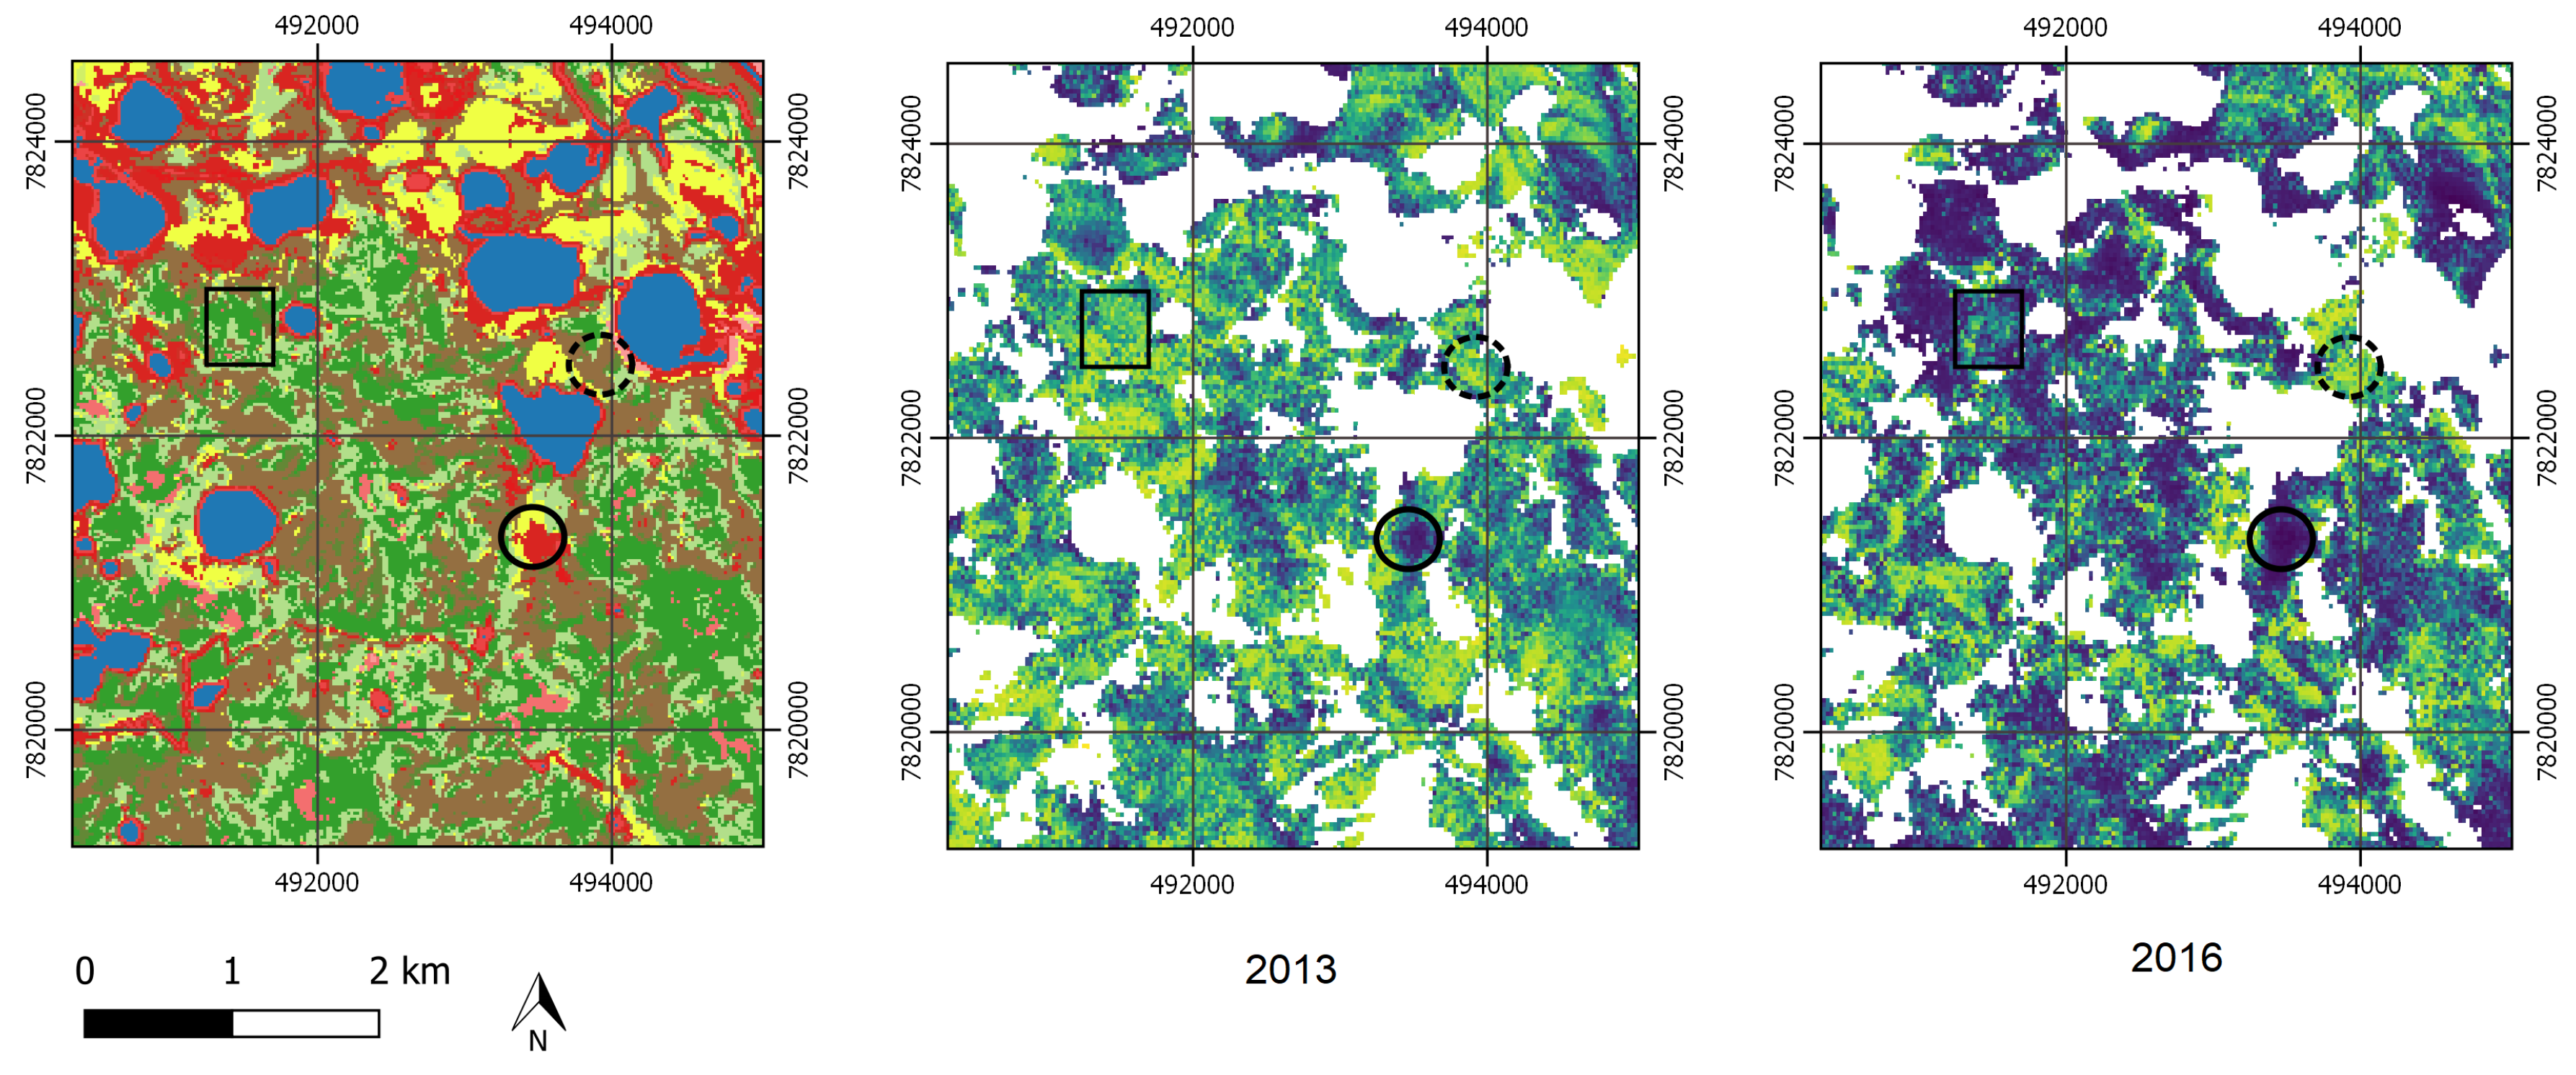
4.3. Land Cover and Displacements

The progression of subsidence differs among the ALT measurement sites. Rates are higher at VD-3 (Figure 7, 5 mm in 100 DDT). This site differs with respect to land cover and soils (sandier and dryer than CALM, VD-1, and VD-2). Such deviations can be confirmed by comparison of year to year differences with the land cover data over the Sentinel-1 scene extent (Figure 8). Sandy soils and dry cryptogamic crust areas showed much larger differences between 2016 and 2017 than all other main land cover types. Lowest differences can be observed for barren (artificial surfaces) and wet to waterlogged tundra.
Thaw progression over the season also differs among the land-cover types. This is exemplified in Figure 9. Displacements over dry to moist and graminoid dwarf shrub tundra show a roughly linear relationship with degree-days of thawing, indicating efficient heat transfer. Displacement occurs until the end of the unfrozen period in all years. This agrees with the average values obtained from the overlap area of COSMO-Skymed and Sentinel-1 (Figure 6) as this is the dominating land cover in the area. Temporal evolution differs for wetter soils (Figure 9), especially in case of organic layers on the top of the soils. The continuous increase of displacement only applies until the DDT reach about 400–800 ° C (up to the long-term average of total DDT, Table 3). Displacement does not increase further for the remaining season in 2016. This results in a lower total subsidence at the end of season and lower overall rate if the non-linear behavior is neglected. The rate before the long-term average is reached, however, is similar to other, dryer land-cover types with 4.3 mm over 100 DDT (COSMO-Skymed). The continuously high rates at dryer sites as indicated by the observation over VD-3 (Figure 7) are also confirmed by the time-series records (Figure 9). Especially the early season data from COSMO-Skymed show that the high rate applies to the full season.
The beginning of the thaw period is characterized by heave in all years (Figure 6 and Figure 9). Negative displacements can be recorded only starting from DDT 95 (DOY 180 & 29 days of thaw) in 2013 and 183 (DOY 188 & 42 days of thaw) in 2016.
The spatial patterns of maximum displacement agree also with the land-cover distribution over the area (examples for COSMO-Skymed in Figure 10 and Figure 11). Increased subsidence in 2016 corresponds to patches of classes such as dry to moist shrub tundra, as characteristic for the CALM grid. Comparably large displacements occur over lacustrine floodplains (including drained lake basins which get inundated in spring) in all years. Wet to waterlogged areas show similarly low displacements in all years.

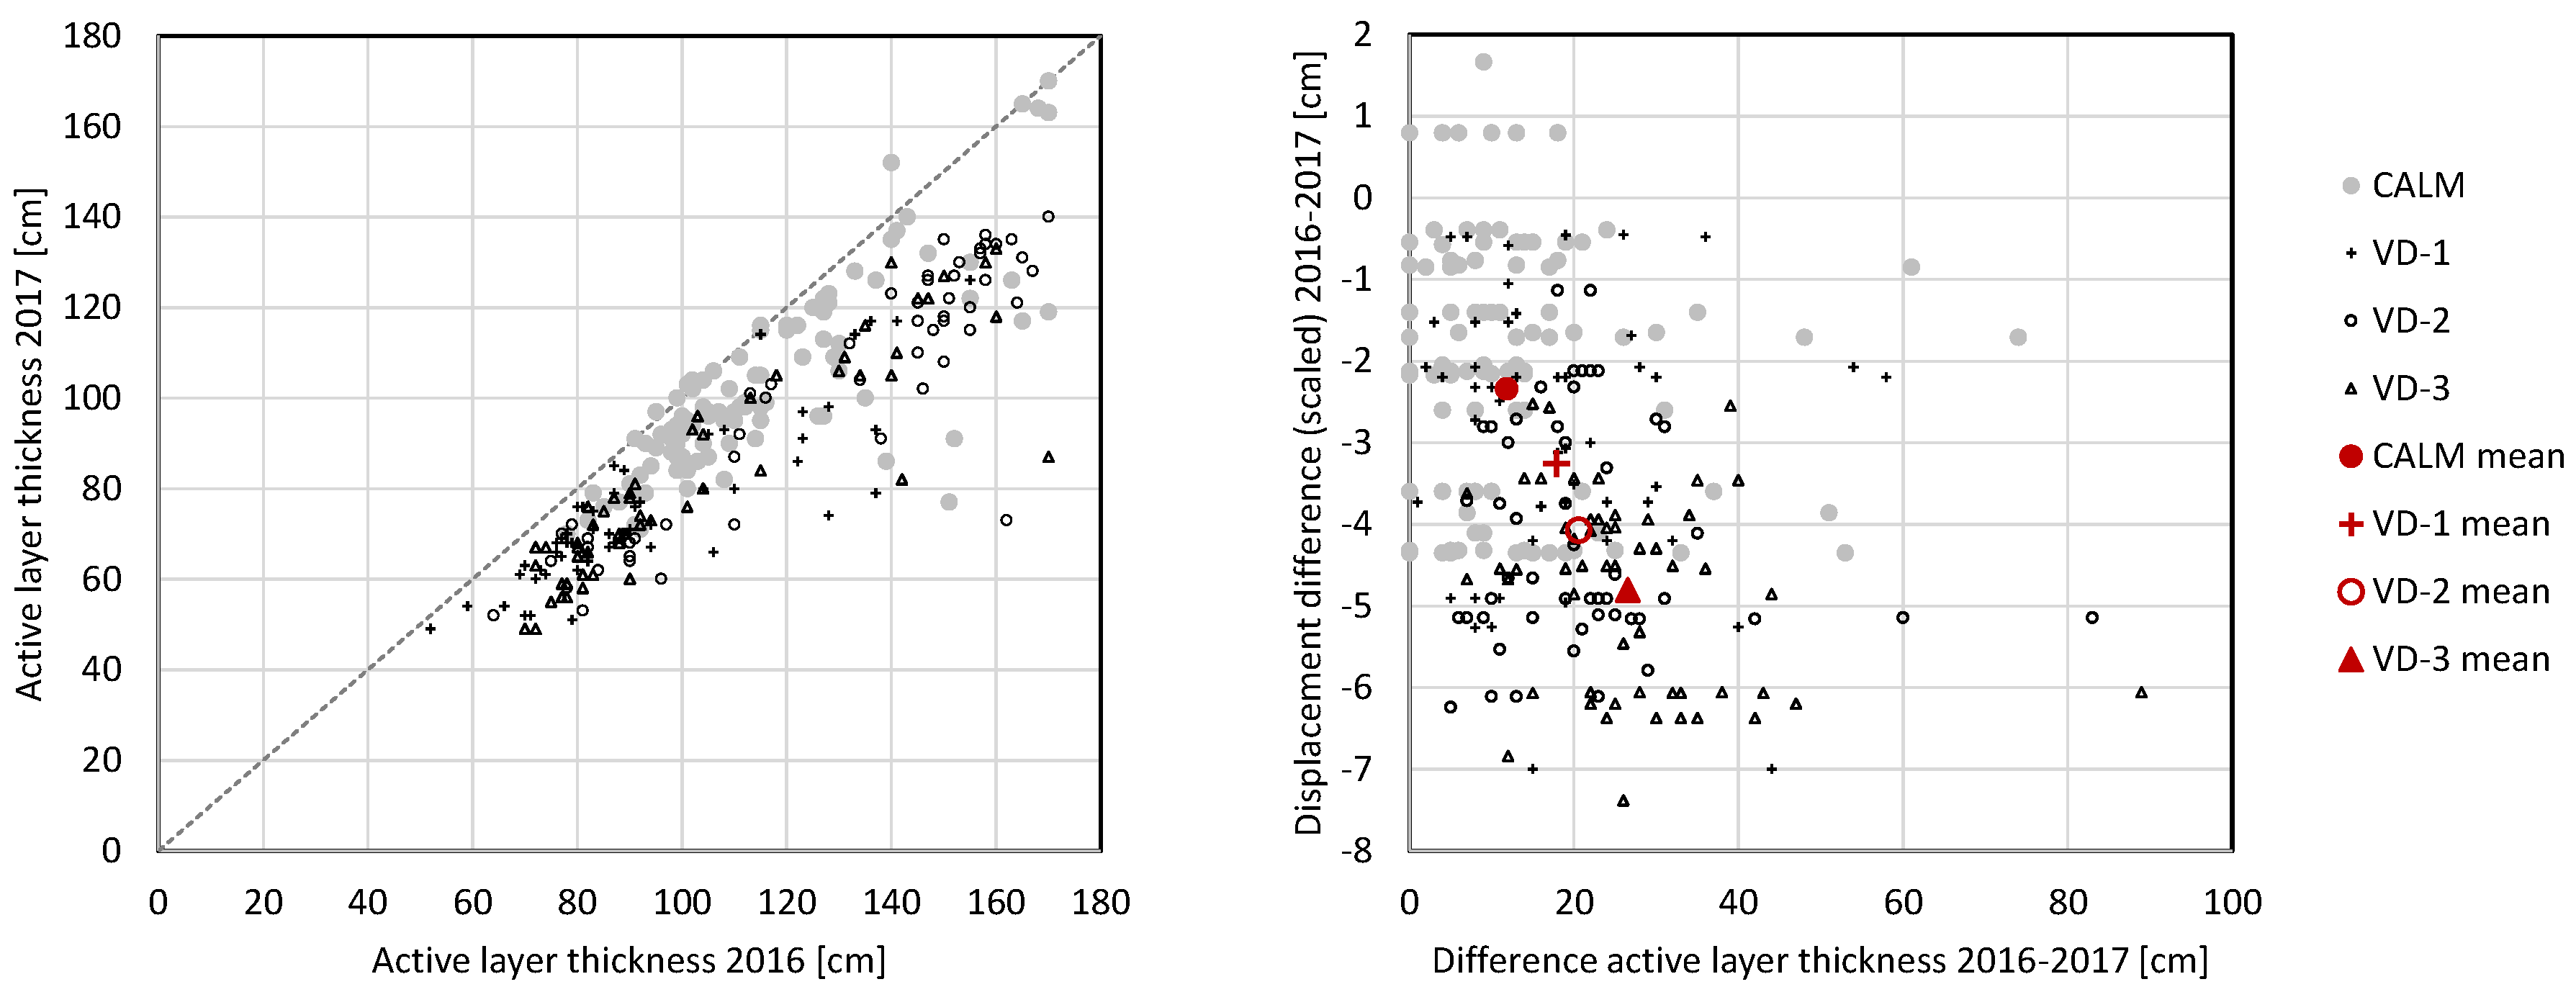
4.4. Active-Layer Thickness Dynamics

The comparison of ALT measurements across all sites between 2016 and 2017 exemplifies the large-scale impact of the unusually warm conditions in 2016 (Figure 12). The impact differed among the sites, with lowest deviations over the CALM grid and highest over VD-3 which is the driest location. There is no clear relationship between corresponding displacement differences between the years when all single measurements are considered. Site averages, however, suggest an increase of ALT above the normal year average at a rate of 5.5 cm thickness per centimeter vertical displacement in an extreme year such as 2016.

5. Discussion

5.1. Impact of 2016 Warm Conditions

The displacement observations from 2016 reveal the impact of unusually warm conditions. The difference of subsidence progression with respect to DDT by landcover agrees with expectations for the associated soil types. Organic material decreases heat transfer. Such locations have in general much lower thaw depths than the ALT measurement sites in central Yamal in the order of 40 cm [21]. The extreme summer of 2016 did not show an impact for these areas. Simulations have shown that increasing temperatures with climate warming have a smaller impact in areas with such soils, (e.g., [63]). Our results demonstrate that this also applies to temperature extremes as encountered in 2016.
Larger displacement than in normal years at certain locations corresponds to higher active-layer thickness (Figure 12). Higher general displacement does, however, not imply a larger active-layer thickness contrary to what has been observed in previous studies at sites with in general shallow active-layer thickness and colder permafrost [7,12]. Largest ALT is measured over the CALM grid (Figure 12) but overall subsidence is lower than for the other sites (Figure 7). The presence of saline clay may play a role at the CALM grid. Probing may result in larger depths than at other sites, as unfrozen soils can occur at below zero degree Celsius. VD-2 also shows comparably large ALT and at the same time lower displacement compared to VD-3 which is the site with the deepest average ALT and highest displacement. There are also little differences in displacement between wet sites (where ALT is expected to be low) and dry to moist tundra (Figure 10 and Figure 11). Long-term in situ observations do only represent ALT of at least approximately 60 cm. Additional measurements at locations with thicker organic layer and higher water content would be needed to clarify the relationship between ALT and observed displacements.
The rate of additional displacement with respect to the active-layer deepening in 2016 indicates that the ALT measurement sites are characterized by ground ice at the base of the active-layer. The rate of displacement until the average ALT is met is much smaller compared to the rate afterwards. Whereas 3 cm are characteristic over the upper 100 cm, further 3.6 cm occur for the additional 15–20 cm. This can be in cases tabular ground ice, where it exists close to the base of the normal active layer. Thermodenudation cirques in the proximity reveal the existence of pure ice relatively close to the surface. An example is shown in Figure 13.
Spatial patterns of soil properties can be only determined under anomalously warm conditions, as occurred in 2016, as no differences in thaw progression can be distinguished in normal years. Subsidence was not only lower for wet to waterlogged sites in 2016, the rate of displacement varied throughout the season (Figure 9). Temporal patterns observed with InSAR in extreme years may therefore support identification of areas with sufficient near surface organic horizon/wet soils to buffer the influence of temperature variations. In combination of ALT measurements and interpretation by degree-days of thawing, such analyses can also give an indication of ground ice at the base of the active layer. Such information is of value for permafrost modelling [64] and subsequent climate change impact assessment.

5.2. Variation of Soil Properties Between Years

Gubarkov et al. [65] suggest that autumn precipitation patterns on central Yamal impact subsidence in the following year based on in situ measurements. Our results indicate that soil water content variations may indeed have an impact on the progression of displacement. The average ALT at the CALM grid is 103 cm (Table 3). On average 242 DDT are required until 100 cm are reached according to borehole records. This reflects the high thermal conductivity and low ice/water content of the upper active layer in this area. The DDT to reach 100 cm was much higher in 2016 compared to the other years with 408, what may reflect variations in soil water content between the years. Year to year differences may also result from varying moisture/ice content conditions (Figure 6). Displacement rates are higher in 2013 and lower in 2017 compared to 2016. Wetness conditions during the last 20 days before freeze-up have been also varying between the years (Table 3). Precipitation data from Mare Sale as well as scatterometer backscatter records from the study area indicate that autumn 2016 and 2017 were dryer than in 2015 and the average. In these years, backscatter was on average 0.7 dB lower. The overall possible range (resembling 0–100% saturation) on central Yamal is −15 to −10 dB. This points to a potentially higher ice content in the upper layer in winter 2015/2016 compared to the following years and may have led to the comparably long duration until 100 cm are reached. The wetness effect is also expected to impact the observed displacement rates at the beginning of the season. The records from the overlap area do not indicate such an influence (Figure 6), but the combined time series over the ALT measurement sites (Figure 7).

5.3. Comparison between X-Band and C-Band

Only one year is available to investigate the comparability of X- and C-band. Similar rates are, however, observed but only after offset correction for the early thaw period. Results agree for different landcover types which are characterized by differences in evolution of subsidence throughout the thaw period (Figure 9). Previous studies which compare different wavelengths over permafrost have been limited to discussion of spatial patterns due to the observation timing differences [4,19]. We demonstrate that the correction with degree-days of thawing allows for a comparison, but at least one year with early season acquisitions is required to determine the correction factor (early season subsidence rate). The applicability is also limited to records with small temporal offsets (relative to the beginning of thaw) as the rate can change throughout the season. This is for example the case when DDT exceed average values for central Yamal.

5.4. General Displacement Patterns and Measurement Errors with Respect to Previous Findings

The ground heave right after thaw has been also observed by Chen et al. [10] for Sentinel-1 and has been attributed to excess snowmelt water percolating into the soil and eventually producing heave of up to 1 cm as observed in situ by Mackay [66].
Antonova et al. [12] also show lower InSAR-derived displacements (from X-band) than in situ observation and attribute this to the shorter observation period, the temporal offset of the satellite acquisitions and undersampling of the SAR data in relationship to large local variations of the rates of movements, which can cause phase unwrapping errors. We have applied an offset correction to the C-band observation to account for the temporal offset and confirmed the approach by comparison to very dense X-band observations (starting at first day of thaw). We have applied a scaling factor to correct the line of sight observations for viewing geometry in addition. The nevertheless remaining underestimation indicates additional factors. This may include the in situ measurement technique. The plates which are used may alter the heat transfer and only represent sites which are not shaded by vegetation. The satellite retrievals also include such sites. This issue may not apply at high Arctic sites as investigated by Antonova et al. [12], where the offset correction might result in better agreement with the in situ measurements. Smaller values than in situ records have been also reported for L-band in comparison to frost tube measurements [20]. The year of the in situ measurements did, however, not coincide with the satellite observations. Further cases of underestimation are also known from other environments and phenomena, e.g., related to mining [67]. The rate of displacement in mid-thaw season is, however, similar between the in situ and satellite observations. This indicates an impact on the InSAR retrievals at the beginning of thaw.
The larger subsidence in lacustrine floodplains (partially drained lakes) agrees with previous findings, (e.g., [12,14,68]). Our results further show that summer temperature differences between the years also have a higher impact in such areas as also over dry to moist tundra what is of relevance in the context of climate change.
Changes in surface moisture are expected to impact the retrieval as the radar signal may penetrate deeper into the soil under dryer conditions, (e.g., [10,11,12]). The found apparent relationship between DDT and subsidence for the dominating landscape type indicates a limited impact on central Yamal.
Stacking a series of Sentinel-1 12-days interferograms over one summer season in a row results in an expected displacement error on the order of 1 cm due to noise and atmospheric artifacts in the troposphere [14]. A similar error is expected for X-band data. For low-land permafrost we should however also take into account possible effects on the interferometric phase of varying ionospheric, soil moisture, snow cover, and vegetation conditions, what may limit the accuracy of the estimated deformation. In addition, on local areas undersampling of the SAR data in relationship to the large rates of movements can cause phase unwrapping errors, leading to an underestimation of the displacement.

6. Conclusions

So far, InSAR studies in permafrost environments have focused on areas with little vegetation, with shallow active-layer thickness in the Arctic or the Tibet plateau where limited amount of organic material is present. The active-layer thickness on central Yamal exceeds 100 cm and different types of land cover occur, largely with tundra shrubs. We demonstrate the applicability and added value of InSAR-derived summer displacements for permafrost monitoring in such environments. An important aspect is the scarcity of specific in situ activities tailored to validate the InSAR results. We demonstrate the utility of a simple, but distributed and multi-year measurement setup.
The impact of warmer years on subsidence has been demonstrated before with in situ measurements in the Lena Delta [12]. Our results confirm increased subsidence also with satellite retrievals. The joint analyses with land cover reveal impact differences with respect to ground properties. Especially the dense time series available from COSMO-Skymed due to its special constellation allows for detailed assessment of thaw progression and impact assessment of extreme years. Results indicate presence and melt of ground ice at the base of the active layer in case of above average air temperature (and subsequent higher degree-days of thawing) conditions. Our results exemplify the impact of higher temperatures and the role of near surface soil properties. Knowledge regarding presence of ground ice is crucial for climate change impact assessment and its mapping one of the present key issues in permafrost research [69].
The comparison of the X-band records with C-band based on degree-days of thawing allows for evaluation of displacement retrievals. The agreement between the two sensors and the results from evaluation with in situ data suggest that InSAR-based seasonal subsidence retrievals in shrub dominated tundra are reasonable. The agreement between the wavelengths also suggests that changes of near surface soil water content and subsequent change of signal penetration depth are only of minor importance in such environments. The typical underestimation of displacement by InSAR may result from retrieval issues at the very beginning of thaw since rates agree later on.
We provide a strategy for comparing subsidence observations between years that allows for enhanced understanding of permafrost thaw. However, only L-band preserves long-time coherence over natural terrain, which is required to study long-term evolution of subsidence. Further assessment over similar monitoring sites as on central Yamal, with dense observations of active-layer thickness, are required to develop a scheme for fully exploiting the capabilities of InSAR-derived seasonal subsidence across the entire Arctic.

Author Contributions

Conceptualization A.B. and M.L.; methodology, A.B., T.S. and M.L.; data curation, A.K., E.B. and D.M.; validation A.B., H.B. and K.E.; formal analyzes A.B., T.S. and B.W.; investigation, A.B.; writing—original draft preparation, A.B., T.S. and M.L.; visualization, C.K. and B.W.

Funding

This work was supported by the European Space Agency project DUE GlobPermafrost (contract number 4000116196/15/I-NB), the Austrian Science Fund under grant [I 1401] and the Russian Foundation for Basic Research grant 13-05-91001-ANF-a (joint Russian-Austrian project COLD-Yamal) and the Russian Foundation for Basic Research Grant 18-04-01010-A for the Westerns Siberian botanical survey and the Austrian Science Fund (Fonds zur Förderung der wissenschaftlichen Forschung, FWF) through the Doctoral College GIScience (DK W1237-N23).

Acknowledgments

TanDEM-X data were made available by DLR through PI agreement HYDR0226 and Cosmo-Skymed data are courtesy of ID 656, copyright ASI. Results are partially based on modified Copernicus data from 2016 to 2018.

Conflicts of Interest

The authors declare no conflict of interest.

References

  1. Biskaborn, B.K.; Smith, S.L.; Noetzli, J.; Matthes, H.; Vieira, G.; Streletskiy, D.A.; Schoeneich, P.; Romanovsky, V.E.; Lewkowicz, A.G.; Abramov, A.; et al. Permafrost is warming at a global scale. Nat. Commun. 2019, 10. [Google Scholar] [CrossRef]
  2. Biskaborn, B.K.; Lanckman, J.P.; Lantuit, H.; Elger, K.; Streletskiy, D.A.; Cable, W.L.; Romanovsky, V.E. The new database of the Global Terrestrial Network for Permafrost (GTN-P). Earth Syst. Sci. Data 2015, 7, 245–259. [Google Scholar] [CrossRef] [Green Version]
  3. Trofaier, A.M.; Westermann, S.; Bartsch, A. Progress in space-borne studies of permafrost for climate science: Towards a multi-ECV approach. Remote Sens. Environ. 2017, 203, 55–70. [Google Scholar] [CrossRef]
  4. Short, N.; Brisco, B.; Couture, N.; Pollard, W.; Murnaghan, K.; Budkewitsch, P. A comparison of TerraSAR-X, RADARSAT-2 and ALOS-PALSAR interferometry for monitoring permafrost environments, case study from Herschel Island, Canada. Remote Sens. Environ. 2011, 115, 3491–3506. [Google Scholar] [CrossRef]
  5. Liu, L.; Schaefer, K.; Zhang, T.; Wahr, J. Estimating 1992–2000 average active layer thickness on the Alaskan North Slope from remotely sensed surface subsidence. J. Geophys. Res. Earth Surf. 2012, 117. [Google Scholar] [CrossRef]
  6. Rouyet, L.; Lauknes, T.R.; Christiansen, H.H.; Strand, S.M.; Larsen, Y. Seasonal dynamics of a permafrost landscape, Adventdalen, Svalbard, investigated by InSAR. Remote Sens. Environ. 2019, 231, 111236. [Google Scholar] [CrossRef]
  7. Schaefer, K.; Liu, L.; Parsekian, A.; Jafarov, E.; Chen, A.; Zhang, T.; Gusmeroli, A.; Panda, S.; Zebker, H.A.; Schaefer, T. Remotely Sensed Active Layer Thickness (ReSALT) at Barrow, Alaska Using Interferometric Synthetic Aperture Radar. Remote Sens. 2015, 7, 3735–3759. [Google Scholar] [CrossRef] [Green Version]
  8. Wang, C.; Zhang, Z.; Zhang, H.; Zhang, B.; Tang, Y.; Wu, Q. Active Layer Thickness Retrieval of Qinghai-Tibet Permafrost Using the TerraSAR-X InSAR Technique. IEEE J. Sel. Top. Appl. Earth Obs. Remote Sens. 2018, 11, 4403–4413. [Google Scholar] [CrossRef]
  9. Zhao, R.; Li, Z.W.; Feng, G.C.; Wang, Q.J.; Hu, J. Monitoring surface deformation over permafrost with an improved SBAS-InSAR algorithm: With emphasis on climatic factors modeling. Remote Sens. Environ. 2016, 184, 276–287. [Google Scholar] [CrossRef]
  10. Chen, J.; Günther, F.; Grosse, G.; Liu, L.; Lin, H. Sentinel-1 InSAR Measurements of Elevation Changes over Yedoma Uplands on Sobo-Sise Island, Lena Delta. Remote Sens. 2018, 10, 1152. [Google Scholar] [CrossRef]
  11. Zwieback, S.; Liu, X.; Antonova, S.; Heim, B.; Bartsch, A.; Boike, J.; Hajnsek, I. A Statistical Test of Phase Closure to Detect Influences on DInSAR Deformation Estimates Besides Displacements and Decorrelation Noise: Two Case Studies in High-Latitude Regions. IEEE Trans. Geosci. Remote Sens. 2016, 54, 5588–5601. [Google Scholar] [CrossRef]
  12. Antonova, S.; Sudhaus, H.; Strozzi, T.; Zwieback, S.; Kääb, A.; Heim, B.; Langer, M.; Bornemann, N.; Boike, J. Thaw Subsidence of a Yedoma Landscape in Northern Siberia, Measured In Situ and Estimated from TerraSAR-X Interferometry. Remote Sens. 2018, 10, 494. [Google Scholar] [CrossRef]
  13. Michaelides, R.J.; Schaefer, K.; Zebker, H.A.; Parsekian, A.; Liu, L.; Chen, J.; Natali, S.; Ludwig, S.; Schaefer, S.R. Inference of the impact of wildfire on permafrost and active layer thickness in a discontinuous permafrost region using the remotely sensed active layer thickness (ReSALT) algorithm. Environ. Res. Lett. 2019, 14, 035007. [Google Scholar] [CrossRef]
  14. Strozzi, T.; Antonova, S.; Günther, F.; Mätzler, E.; Vieira, G.; Wegmüller, U.; Westermann, S.; Bartsch, A. Sentinel-1 SAR Interferometry for Surface Deformation Monitoring in Low-Land Permafrost Areas. Remote Sens. 2018, 10, 1360. [Google Scholar] [CrossRef]
  15. Daout, S.; Doin, M.P.; Peltzer, G.; Socquet, A.; Lasserre, C. Large-scale InSAR monitoring of permafrost freeze-thaw cycles on the Tibetan Plateau. Geophys. Res. Lett. 2017, 44, 901–909. [Google Scholar] [CrossRef]
  16. Strozzi, T.; Wegmuller, U.; Matzler, C. Mapping wet snowcovers with SAR interferometry. Int. J. Remote Sens. 1999, 20, 2395–2403. [Google Scholar] [CrossRef]
  17. Rudy, A.C.; Lamoureux, S.F.; Treitz, P.; Short, N.; Brisco, B. Seasonal and multi-year surface displacements measured by DInSAR in a High Arctic permafrost environment. Int. J. Appl. Earth Obs. Geoinf. 2018, 64, 51–61. [Google Scholar] [CrossRef]
  18. Wright, N.; Hayashi, M.; Quinton, W.L. Spatial and temporal variations in active layer thawing and their implication on runoff generation in peat-covered permafrost terrain. Water Resour. Res. 2009, 45. [Google Scholar] [CrossRef] [Green Version]
  19. Eppler, J.; Kubanski, M.; Sharma, J.; Busler, J. High temporal resolution permafrost monitoring using a multiple stack InSAR technique. ISPRS Int. Arch. Photogramm. Remote. Sens. Spat. Inf. Sci. 2015, XL-7W3, 1171–1176. [Google Scholar] [CrossRef]
  20. Wang, L.; Marzahn, P.; Bernier, M.; Jacome, A.; Poulin, J.; Ludwig, R. Comparison of TerraSAR-X and ALOS PALSAR Differential Interferometry With Multisource DEMs for Monitoring Ground Displacement in a Discontinuous Permafrost Region. IEEE J. Sel. Top. Appl. Earth Obs. Remote Sens. 2017, 10, 4074–4093. [Google Scholar] [CrossRef]
  21. Leibman, M.; Khomutov, A.; Gubarkov, A.; Mullanurov, D.; Dvornikov, Y. The research station “Vaskiny Dachi” Central Yamal, West Siberia, Russia—A review of 25 years of permafrost studies. Fennia 2015, 193, 3–30. [Google Scholar] [CrossRef]
  22. Babkina, E.A.; Leibman, M.O.; Dvornikov, Y.A.; Fakashchuk, N.Y.; Khairullin, R.R.; Khomutov, A.V. Activation of Cryogenic Processes in Central Yamal as a Result of Regional and Local Change in Climate and Thermal State of Permafrost. Russ. Meteorol. Hydrol. 2019, 44, 283–290. [Google Scholar] [CrossRef]
  23. Khitun, O.; Ermokhina, K.; Czernyadjeva, I.; Leibman, M.; Khomutov, A. Floristic complexes on landslides of different age in Central Yamal, West Siberian Low Arctic, Russia. Fenn. Int. J. Geogr. 2015, 193, 31–52. [Google Scholar] [CrossRef]
  24. Dvornikov, Y.; Leibman, M.; Heim, B.; Bartsch, A.; Haas, A.; Khomutov, A.; Gubarkov, A.; Mikhaylova, M.; Mullanurov, D.; Widhalm, B.; et al. Geodatabase and WebGIS project for long-term permafrost monitoring at the Vaskiny Dachi research station, Yamal, Russia. Polarforschung 2016, 85, 107–115. [Google Scholar] [CrossRef]
  25. IPCC. Climate Change 2013: The Physical Science Basis. Contribution of Working Group I to the Fifth Assessment Report of the Intergovernmental Panel on Climate Change; Cambridge University Press: Cambridge, UK; New York, NY, USA, 2013; p. 996. [Google Scholar] [CrossRef]
  26. Leibman, M.; Kizyakov, A.; Plekhanov, A.; Streletskaya, I. New permafrost feature: Deep crater in Central Yamal, West Siberia, Russia as a response to local climate fluctuations. Geogr. Environ. Sustain. 2014, 7, 68–80. [Google Scholar] [CrossRef]
  27. Khomutov, A.; Leibman, M. Assessment of Landslide Hazards in a Typical Tundra of Central Yamal, Russia. In Landslides in Cold Regions in the Context of Climate Change; Shan, W., Guo, Y., Wang, F., Marui, H., Strom, A., Eds.; Springer International Publishing: Cham, Germany, 2014; pp. 271–290. [Google Scholar] [CrossRef]
  28. Bartsch, A.; Widhalm, B.; Pointner, G.; Ermokhina, K.; Leibman, M.; Heim, B. Landcover Derived from Sentinel-1 and Sentinel-2 Satellite Data (2015–2018) for Subarctic and Arctic Environments; Zentralanstalt für Meteorologie und Geodynamik: Vienna, Austria, 2019. [Google Scholar] [CrossRef]
  29. Streletskiy, D.A.; Shiklomanov, N.I.; Little, J.D.; Nelson, F.E.; Brown, J.; Nyland, K.E.; Klene, A.E. Thaw Subsidence in Undisturbed Tundra Landscapes, Barrow, Alaska, 1962–2015. Permafr. Periglac. Process. 2016, 28, 566–572. [Google Scholar] [CrossRef]
  30. Melnikov, E.S.; Leibman, M.O.; Moskalenko, N.G.; Vasiliev, A.A. Active-Layer Monitoring in the Cryolithozone of West Siberia. Polar Geogr. 2004, 28, 267–285. [Google Scholar] [CrossRef]
  31. Vasiliev, A.A.; Leibman, M.O.; Moskalenko, N.G. Active Layer Monitoring in West Siberia under the CALM II Program. In Proceedings of the Ninth International Conference on Permafrost, Fairbanks, AK, USA, 29 June–3 July 2008; Kane, D.L., Hinkel, K.M., Eds.; Institute of Northern Engineering, University of Alaska Fairbanks: Fairbanks, AK, USA, 2008; Volume 2, pp. 1815–1820. [Google Scholar]
  32. Leibman, M.; Moskalenko, N.; Orekhov, P.; Khomutov, A.; Gameev, I.; Khitun, O.; Walker, D.; Epstein, H. Interrelation of cryogenic and biotic components of geosystems in cryolithozone of West Siberia on the Transect ‘Yamal’. In Polar Cryosphere of Water and Land; Kotlyakov, V., Ed.; Paulsen Publisher: Moscow, Russia, 2011; pp. 171–192. [Google Scholar]
  33. Leibman, M.; Khomutov, A.; Orekhov, P.; Khitun, O.; Epstein, H.; Frost, G.; Walker, D. Gradient of seasonal thaw depth along the Yamal transect. In Proceedings of the Tenth International Conference on Permafrost, Salekhard, Russia, 25–29 June 2012; translation of Russian contributions. Melnikov, V., Drozdov, D., Romanovksy, V., Eds.; Volume 10 (Volume 2), pp. 237–242. [Google Scholar]
  34. Walker, D.; Epstein, H.; Leibman, M.; Moskalenko, N.; Orekhov, P.; Kuss, J.; Matyshak, G.; Kaarlejärvi, E.; Forbes, B.; Barbour, E.; et al. Data Report of the 2007 and 2008 Yamal Expeditions; Alaska Geobotany Center, Institute of Arctic Biology, University of Alaska Fairbanks: Fairbanks, AK, USA, 2009; 121p. [Google Scholar]
  35. Brown, J.; Hinkel, K.M.; Nelson, F.E. The circumpolar active layer monitoring (CALM) program: Research designs and initial results. Polar Geogr. 2000, 24. [Google Scholar] [CrossRef]
  36. Widhalm, B.; Bartsch, A.; Leibman, M.; Khomutov, A. Active-layer thickness estimation from X-band SAR backscatter intensity. Cryosphere 2017, 11, 483–496. [Google Scholar] [CrossRef] [Green Version]
  37. Potin, P.; Rosich, B.; Roeder, J.; Bargellini, P. Sentinel-1 Mission operations concept. In Proceedings of the 2014 IEEE Geoscience and Remote Sensing Symposium, Quebec City, QC, Canada, 13–18 July 2014; pp. 1465–1468. [Google Scholar] [CrossRef]
  38. Torres, R.; Snoeij, P.; Geudtner, D.; Bibby, D.; Davidson, M.; Attema, E.; Potin, P.; Rommen, B.; Floury, N.; Brown, M.; et al. GMES Sentinel-1 mission. Remote Sens. Environ. 2012, 120, 9–24. [Google Scholar] [CrossRef]
  39. Virelli, M.; Coletta, A.; Battagliere, M.L. ASI COSMO-SkyMed: Mission Overview and Data Exploitation. IEEE Geosci. Remote Sens. Mag. 2014, 2, 64–66. [Google Scholar] [CrossRef]
  40. Kumpula, T.; Forbes, B.C.; Stammler, F.; Meschtyb, N. Dynamics of a Coupled System: Multi-Resolution Remote Sensing in Assessing Social-Ecological Responses during 25 Years of Gas Field Development in Arctic Russia. Remote Sens. 2012, 4, 1046–1068. [Google Scholar] [CrossRef] [Green Version]
  41. Bartsch, A.; Höfler, A.; Kroisleitner, C.; Trofaier, A.M. Land Cover Mapping in Northern High Latitude Permafrost Regions with Satellite Data: Achievements and Remaining Challenges. Remote Sens. 2016, 8, 979. [Google Scholar] [CrossRef]
  42. Bartsch, A.; Widhalm, B.; Kuhry, P.; Hugelius, G.; Palmtag, J.; Siewert, M. Can C-Band SAR be used to estimate soil organic carbon storage in tundra? Biogeosciences 2016, 13, 5453–5470. [Google Scholar] [CrossRef]
  43. Widhalm, B.; Bartsch, A.; Heim, B. A novel approach for the characterization of tundra wetland regions with C-band SAR satellite data. Int. J. Remote Sens. 2015, 36, 5537–5556. [Google Scholar] [CrossRef] [Green Version]
  44. Widhalm, B.; Bartsch, A.; Goler, R. Simplified Normalization of C-Band Synthetic Aperture Radar Data for Terrestrial Applications in High Latitude Environments. Remote Sens. 2018, 10, 551. [Google Scholar] [CrossRef]
  45. Wagner, W.; Lemoine, G.; Rott, H. A Method for Estimating Soil Moisture from ERS Scatterometer and Soil Data. Remote Sens. Environ. 1999, 70, 191–207. [Google Scholar] [CrossRef]
  46. Högström, E.; Heim, B.; Bartsch, A.; Bergstedt, H.; Pointner, G. Evaluation of a MetOp ASCAT-Derived Surface Soil Moisture Product in Tundra Environments. J. Geophys. Res. Earth Surf. 2018, 123, 3190–3205. [Google Scholar] [CrossRef]
  47. Högström, E.; Trofaier, A.M.; Gouttevin, I.; Bartsch, A. Assessing Seasonal Backscatter Variations with Respect to Uncertainties in Soil Moisture Retrieval in Siberian Tundra Regions. Remote Sens. 2014, 6, 8718–8738. [Google Scholar] [CrossRef] [Green Version]
  48. Högström, E.; Bartsch, A. Impact of Backscatter Variations Over Water Bodies on Coarse-Scale Radar Retrieved Soil Moisture and the Potential of Correcting With Meteorological Data. IEEE Trans. Geosci. Remote Sens. 2017, 55, 3–13. [Google Scholar] [CrossRef]
  49. Goldstein, R.M.; Werner, C.L. Radar interferogram filtering for geophysical applications. Geophys. Res. Lett. 1998, 25, 4035–4038. [Google Scholar] [CrossRef] [Green Version]
  50. Costantini, M. A novel phase unwrapping method based on network programming. IEEE Trans. Geosci. Remote Sens. 1998, 36, 813–821. [Google Scholar] [CrossRef]
  51. Werner, C.; Wegmüller, U.; Strozzi, T.; Wiesmann, A. Processing strategies for phase unwrapping for INSAR applications. In Proceedings of the European Conference on Synthetic Aperture Radar EUSAR 2002, Cologne, Germany, 4–6 June 2002. [Google Scholar]
  52. Berardino, P.; Fornaro, G.; Lanari, R.; Sansosti, E. A new algorithm for surface deformation monitoring based on small baseline differential SAR interferograms. IEEE Trans. Geosci. Remote Sens. 2002, 40, 2375–2383. [Google Scholar] [CrossRef] [Green Version]
  53. Zan, F.D.; Guarnieri, A.M. TOPSAR: Terrain Observation by Progressive Scans. IEEE Trans. Geosci. Remote Sens. 2006, 44, 2352–2360. [Google Scholar] [CrossRef]
  54. Wegmuller, U.; Strozzi, T.; Werner, C. Ionospheric path delay estimation using split-beam interferometry. In Proceedings of the 2012 IEEE International Geoscience and Remote Sensing Symposium, Munich, Germany, 22–27 July 2012. [Google Scholar] [CrossRef]
  55. Gomba, G.; Parizzi, A.; Zan, F.D.; Eineder, M.; Bamler, R. Toward Operational Compensation of Ionospheric Effects in SAR Interferograms: The Split-Spectrum Method. IEEE Trans. Geosci. Remote Sens. 2016, 54, 1446–1461. [Google Scholar] [CrossRef]
  56. Dingman, S.; Barry, R.; Weller, G.; Benson, C.S.; LeDrew, E.; Goodwin, C. Climate, Snow Cover, Microclimate, and Hydrology. In An Arctic Ecosystem: The Coastal Tundra at Barrow; Brown, J., Miller, P., Bunnell, F., Eds.; Hutchinson and Ross: Stroudsburg, PA, USA, 1980; Chapter 2; pp. 30–65. [Google Scholar]
  57. Kroisleitner, C.; Bartsch, A.; Bergstedt, H. Circumpolar patterns of potential mean annual ground temperature based on surface state obtained from microwave satellite data. Cryosphere 2018, 12, 2349–2370. [Google Scholar] [CrossRef] [Green Version]
  58. Bartsch, A. Ten Years of SeaWinds on QuikSCAT for Snow Applications. Remote Sens. 2010, 2, 1142–1156. [Google Scholar] [CrossRef] [Green Version]
  59. Short, N.; LeBlanc, A.M.; Sladen, W.; Oldenborger, G.; Mathon-Dufour, V.; Brisco, B. RADARSAT-2 D-InSAR for ground displacement in permafrost terrain, validation from Iqaluit Airport, Baffin Island, Canada. Remote Sens. Environ. 2014, 141, 40–51. [Google Scholar] [CrossRef]
  60. Little, J.D.; Sandall, H.; Walegur, M.T.; Nelson, F.E. Application of differential global positioning systems to monitor frost heave and thaw settlement in tundra environments. Permafr. Periglac. Process. 2003, 14, 349–357. [Google Scholar] [CrossRef]
  61. Beck, I.; Ludwig, R.; Bernier, M.; Strozzi, T.; Boike, J. Vertical movements of frost mounds in subarctic permafrost regions analyzed using geodetic survey and satellite interferometry. Earth Surf. Dyn. 2015, 3, 409–421. [Google Scholar] [CrossRef]
  62. Shiklomanov, N.I.; Streletskiy, D.A.; Little, J.D.; Nelson, F.E. Isotropic thaw subsidence in undisturbed permafrost landscapes. Geophys. Res. Lett. 2013, 40, 6356–6361. [Google Scholar] [CrossRef]
  63. Zhang, Y.; Chen, W.; Riseborough, D.W. Temporal and spatial changes of permafrost in Canada since the end of the Little Ice Age. J. Geophys. Res. Atmos. 2006, 111. [Google Scholar] [CrossRef] [Green Version]
  64. Westermann, S.; Østby, T.; Gisnås, K.; Schuler, T.; Etzelmüller, B. A ground temperature map of the North Atlantic permafrost region based on remote sensing and reanalysis data. Cryosphere 2015, 9, 1303–1319. [Google Scholar] [CrossRef] [Green Version]
  65. Gubarkov, A.A.; Elantsev, E.V.; Leibman, M.O.; Mullanurov, D.R.; Khomutov, A.V.; Dvornikov, Y.A.; Widhalm, B.; Bartsch, A. Study of seasonal frost heaving in Central Yamal. In Proceedings of the Extended Meeting of the Council on Earth Cryology RAS ’Actual Problems of Geocryology’(in Russian), Moscow, Russia, 15–16 May 2018; Volume 1, pp. 159–163. [Google Scholar]
  66. Mackay, J.R. Downward water movement into frozen ground, western Arctic coast, Canada. Can. J. Earth Sci. 1983, 20, 120–134. [Google Scholar] [CrossRef]
  67. Spreckels, V.; Wegmüller, U.; Strozzi, T.; Musiedlak, J.; Wichlacz, H. Detection and observation of underground coal mining-induced surface deformation with differential SAR interferometry. In Proceedings of the Joint Workshop of ISPRS Working Groups I-2, I-5 and IV-7 High Resolution Mapping from Space, Hannover, Germany, 19–21 September 2001. [Google Scholar]
  68. Liu, L.; Schaefer, K.; Gusmeroli, A.; Grosse, G.; Jones, B.M.; Zhang, T.; Parsekian, A.D.; Zebker, H.A. Seasonal thaw settlement at drained thermokarst lake basins, Arctic Alaska. Cryosphere 2014, 8, 815–826. [Google Scholar] [CrossRef] [Green Version]
  69. Turetsky, M.R.; Abbott, B.W.; Jones, M.C.; Anthony, K.W.; Olefeldt, D.; Schuur, E.A.G.; Koven, C.; McGuire, A.D.; Grosse, G.; Kuhry, P.; et al. Permafrost collapse is accelerating carbon release. Nature 2019, 569, 32–34. [Google Scholar] [CrossRef] [Green Version]
Figure 1. Overview of the study site: Locations of active-layer measurement sites (black and white dots) and of the satellite data coverage (rectangles) over land cover for central Yamal (source: [28], grey—no data, contains modified Copernicus data; projection and grid UTM Zone 42N) and on overview map for the entire peninsula (projection UTM Zone 42N, grid geographic).
Remotesensing 11 01865 g001
Figure 2. Air temperature records from station Mare Sale). (a) Cumulative degree-days of thawing (DDT) for years with satellite records and 2012. (be) Time series of daily mean air temperature (colored lines, color correspond to years in (a); black line—average 1999–2018), dates of satellite acquisitions and in situ data collection (vertical dotted lines—COSMO-Skymed, vertical dashed lines—Sentinel-1, vertical solid lines—dates of in situ subsidence measurements).
Remotesensing 11 01865 g002
Figure 3. Overviewof Circumpolar Active-Layer Monitoring (CALM) grid and location of multi-annual subsidence measurements (red points with IDs) and new sites 2018 (black dots). Digital elevation model (in m) from Dvornikov et al. [24] and detailed land cover at active-layer thickness probing locations from Widhalm et al. [36]. For location of the CALM grid, see Figure 1. The photo shows an example for a plywood plate with rod (Damir Mullanurov, 3 September 2017).
Remotesensing 11 01865 g003
Figure 4. In situ (CALM grid) versus Sentinel-1 derived displacement in cm: left—line of sight (RMSE 2.42 excluding new sites), right—scaled with respect to viewing geometry (RMSE 2.35 excluding new sites). * offset corrected for thaw before start of records based on 2017 records.
Remotesensing 11 01865 g004
Figure 5. Map of Sentinel-1 derived displacement in cm (scaled and offset corrected for thaw before start of records based on 2017 records) and in situ measurements in cm over the Circumpolar Active-Layer Monitoring (CALM) grid for 2016. Elevation contour interval is 1 m (source Dvornikov et al. [24]). For location of the CALM grid, see Figure 1.
Remotesensing 11 01865 g005
Figure 6. Average scaled displacement within the Sentinel-1 and COSMO-Skymed overlap area versus day of year (left) and cumulative degree-days of thawing (right). Sentinel-1 data from 2016 and 2018 are offset corrected for early season thaw with 2017 rates.
Remotesensing 11 01865 g006
Figure 7. Sentinel-1 line of sight displacement time series versus thawing degree-days 2016 and 2017 for all active-layer thickness measurement sites (averages at beginning of September in cm). Sites CALM, VD-1, and VD-2 are characterized by dry to moist prostrate dwarf shrub tundra. VD-3 consists of partially dry cryptogamic crust/sparse vegetation and graminoid prostrate dwarf shrub tundra (patterned ground). Sentinel-1 results for 2016 have been offset corrected based on 2017 records.
Remotesensing 11 01865 g007
Figure 8. Average difference of scaled displacement (2016–2017; at beginning of September) for dominating land-cover types [28] derived from Sentinel-1 (overall extent).
Remotesensing 11 01865 g008
Figure 9. Examples of scaled displacement time series versus degree-days of thawing 2016 for the four dominating land-cover types within the COSMO-Skymed and Sentinel-1 overlap area. Sentinel-1 results for 2016 have been offset corrected based on 2017 records.
Remotesensing 11 01865 g009
Figure 10. Examples of scaled displacement (in m) maps and land cover. Results from all years and sensors for the lower right corner of the overlap area of Sentinel-1 and COSMO-Skymed (boundary dashed line, location in Figure 1) and land cover (source: Bartsch et al. [28], contains modified Copernicus data). Projection and grid UTM Zone 42N.
Remotesensing 11 01865 g010
Figure 11. Examples from northeastern part of COSMO-Skymed area (location in Figure 1) for land cover (left, source: Bartsch et al. [28], contains modified Copernicus data), COSMO-Skymed 2013 displacement (middle) and 2016 displacement (right). Legend as in Figure 10. Further symbols: solid line circle—drained lake basin with high displacement in both years; dashed line circle—wet to waterlogged graminoid prostrate to low dwarf shrub tundra with low subsidence in both years; rectangle—dry to moist prostrate to erect dwarf shrub tundra with higher subsidence in 2016. Projection and grid UTM Zone 42N.
Remotesensing 11 01865 g011
Figure 12. Active-layer thickness differences between 2016 and 2017: left—comparison of in situ records, right in situ difference versus scaled displacement difference from Sentinel-1.
Remotesensing 11 01865 g012
Figure 13. Exposed tabular ground ice at a thermodenudation cirque on central Yamal (Photo: A. Bartsch, August 2015).
Remotesensing 11 01865 g013
Table 1. Sentinel-1 acquisition dates and corresponding air temperature derivatives (station Mare Sale).
DateDay of YearDay Since ThawDegree-Days of Thawing
7 July 201618951279.32
19 July 201620163535.64
12 August 201622587828.40
24 August 201623799979.18
5 September 20162491111092.20
17 September 20162611231221.94
5 October 20162791411337.53
14 June 20171661317.19
26 June 20171782566.60
8 July 201719037137.37
20 July 201720249304.73
1 August 201721461467.37
25 August 201723885630.93
6 September 201725097718.42
18 September 2017262109749.61
30 September 2017274121782.15
12 October 2017286133816.86
3 July 20181852898.30
15 July 201819740172.22
8 August 201822164304.44
20 August 201823376380.00
1 September 201824588501.11
7 October 2018281124704.72
19 October 2018293155717.52
Table 2. COSMO-Skymed acquisition dates and corresponding air temperature derivatives (station Mare Sale).
DateDay of YearDegree-Days of ThawingDateDay of YearDegree-Days of Thawing
8 June 201316008 June 201616014.4
16 June 201316825.412 June 201616421.6
17 June 201316926.816 June 201616866.4
20 June 201317235.924 June 2016176154.8
2 July 201318472.828 June 2016180183.3
3 July 201318578.12 July 2016184225.5
6 July 201318894.810 July 2016192380.7
10 July 2013192112.914 July 2016196468.1
18 July 2013200197.526 July 2016208679.0
22 July 2013204275.130 July 2016212709.6
26 July 2013208342.03 August 2016216754.0
3 August 2013216414.011 August 2016224851.8
4 August 2013217421.119 August 2016232960.0
7 August 2013220443.227 August 20162401043.0
11 August 2013224482.131 August 20162441079.3
19 August 2013232549.94 September 20162481121.2
20 August 2013233556.112 September 20162561210.2
23 August 2013236582.32 October 20162761366.7
4 September 2013248667.1
21 September 2013265747.9
24 September 2013268748.1
28 September 2013272746.8
6 October 2013280739.8
10 October 2013284725.4
Table 3. Characterization of seasonal maximum subsidence by in situ and satellite data analyses. * denotes offset corrected displacements based on 2017 early season rates. The averaging period differs by parameter. Subsidence and line of sight displacement (LOS) values represent the full season and are given in cm. Overlap refers to the common area of Sentinel-1 and COSMO-Skymed acquisitions (Figure 1). Active-layer depth measurements on the CALM (Circumpolar Active-Layer Monitoring) grid exceeded in some cases/years the maximum measurable depth of 170 cm. Degree-days of thawing (DDT) and precipitation is based on measurements at Mare Sale. Autumn is defined as the last 20 days with unfrozen soil surface. nd—no data, na—not applicable.
Parameter2013201620172018Average
In situ subsidence, averagend−5.5−4.7−4.1−4.8
Sentinel-1 LOS average over CALM gridnd−5.4 *−2.6−2.0 *−3.3
Sentinel-1 scaled LOS average over CALM gridnd−5.8 *−3.1−2.5 *−3.8
Sentinel-1 LOS average over overlap areand−5.4 *−2.4−2.5 *−3.4
COSMO Skymap LOS average over overlap area−3.8−5.8ndndna
Active-layer depth in cm over CALM grid (minimum)10311910895103 (1999–2018)
Total DDT (thaw index)7591443827720780 (1999–2018)
Cumulative DDT with early season heave (LOS)951830ndna
Cumulative DDT when 100 cm in borehole are reached119408241191242 (2008–2018)
Precipitation sum [mm] Autumn of preceding year283319.319.326.4 (2012–2018)
Backscatter [dB] from Autumn of preceding year−11.4−11.8−12.5−12.5−11.9 (2012–2018)

