Article

Monitoring of Land Use/Land Cover and Socioeconomic Changes in South China over the Last Three Decades Using Landsat and Nighttime Light Data

Department of Land Surveying and Geo-informatics, The Hong Kong Polytechnic University, Hong Kong 999077, China
*
Author to whom correspondence should be addressed.
Remote Sens. 2019, 11(14), 1658; https://doi.org/10.3390/rs11141658
Submission received: 28 May 2019 / Revised: 24 June 2019 / Accepted: 5 July 2019 / Published: 11 July 2019

Abstract

:
Land use and land cover changes (LULCC) are prime variables that reflect changes in ecological systems. The Guangdong, Hong Kong, and Macau (GHKM) region located in South China has undergone rapid economic development and urbanization over the past three decades (1986–2017). Therefore, this study investigates the changes in LULC of GHKM based on multi-year Landsat and nighttime light (NTL) data. First, a supervised classification technique, i.e., support vector machine (SVM), is used to classify the Landsat images into seven thematic classes: forest, grassland, water, fishponds, built-up, bareland, and farmland. Second, the demographic activities are studied by calculating the light index, using nighttime light data. Third, several socioeconomic factors, derived from statistical yearbooks, are used to determine the impact on the LULCC in the study area. The post-classification change detection shows that the increase in the urban area, from 0.76% (1488.35 km2) in 1986 to 10.31% (20,643.28 km2) in 2017, caused GHKM to become the largest economic segment in South China. This unprecedented urbanization and industrialization resulted in a substantial reduction in both farmland (from 53.54% (105,123.93 km2) to 33.07% (64,932.19 km2)) and fishponds (from 1.25% (2463.35 km2) to 0.85% (1674.61 km2)) during 1986–2017. The most dominant conversion, however, was of farmland to built-up area. The subsequent urban growth is also reflected in the increasing light index trends revealed by NTL data. Of further interest is that the overall forest cover increased from 33.24% (65,257.55 km2) to 45.02% (88,384.19 km2) during the study period, with a significant proportion of farmland transformed into forest as a result of different afforestation programs. An analysis of the socioeconomic indicators shows that the increase in gross domestic product, total investment in real estate, and total sales of consumer goods, combined with the overall industrialization, have led to (1) urbanization on a large scale, (2) an increased light index, and (3) the reduction of farmland. The speed of development suggests that opportunistic development has taken place, which requires a pressing need to improve land policies and regulations for more sustainable urban development and protection of farmland.

Graphical Abstract

1. Introduction

Land use and land cover changes (LULCC) have increasingly become a global challenge. They are the most direct expression of the effects of human activity on the natural ecosystems [1,2,3]. The United Nations ‘Agenda of the Twenty-First Century’ in 1992 officially stimulated research activities related to land use and, therefore, the effects of land cover change (LCC). In 1995, two main international organizations, the International Geosphere-Biosphere Programme (IGBP) and the International Human Dimensions Programme (IHDP), initiated the joint program: the Land Use/Land Cover Change (LUCC) Research Program, as the core of a study related to the global LULC. Thus, since 2000, the monitoring and simulation of LULC change has become a key focus in the field of land change science [2,4,5].
Over the last few decades, land use changes and developments have resulted in population pressure [5]. Both positive and negative health and welfare effects have arisen, as a result of random industrialization, economic development, modernization, and urban planning policies. It has been found that changes in land use have negative impacts on the climate, ecosystems, surface radioactivity (e.g., increased atmospheric greenhouse gasses, depletion of the ozone layer), agricultural activities, and biodiversity on both local and global scales. Such situations are more prevalent in developing countries such as China [4,6,7,8,9].
Since the opening up of economic reform of China in 1978, radical changes in the economy, industrialization, and urbanization have taken place, which in turn have produced a highly noticeable LULCC, well-illustrated by the results of the rapid widespread development, mentioned above. Examples are found in coastal areas such as the Pearl River Delta (PRD) region in Guangdong, Shanghai, Jiangsu, and Zhejiang provinces of southeastern China [10,11]. China’s inherent problem, namely, the availability of land resources per capita being far below the world average, has influenced the current economic development and unprecedented urbanization. Development appears to have been almost uninhibited and characterized by a lack of planning for the betterment of the areas in which it has taken place. A consequence of this lack of planning is what appears to be random development, resulting in a lack of cohesion and subsequent inhibition of the preservation of the land resources of the newly urbanized areas [12]. During the five decades between 1949 and 1996, the total extent of the urban area of the cities of China nearly tripled [13]. During 1980–2011, the urban population increased by 500 million, thus, exceeding the total population of most countries. It is expected to rise by a further 300 million by 2050 [14]. This rapid urbanization, combined with LULCC, reflects a depletion of natural resources and subsequent eco-environmental changes [5].
During the same period, Guangdong, Macao, and Hong Kong (GHKM) have had similar experiences to those mentioned above, and, LULCC are especially notable in the form of urban land expansion and population growth. These areas were once rich in land resources and were a major source of commercial grain production before the opening of economic reform. The speed of urbanization and land use change (LUC) has been most significant in the PRD region, with the urban area increasing by more than 300% between 1988 and 1996 [8,10,11,15]. More than 40% of farmland was converted to a different land type between 1978 and 2013. Between 1978 and 1998, approximately 92 km2 of water sites adjacent to the PRD were transformed to islands, most of which have now been urbanized [8]. Such changes have obviously reduced areas of fishponds and farmland, and consequently the associated resources and crop yield, at an increasing rate. As a result, sustainable development has been constrained [16,17], with such trends expected to continue during the coming decades. Contradictions in the realm of sustainable development and secure land use policy reform [14] leads to further concern regarding food security [8,12,15,18].
Aggravating the above complex land structure and intensive urbanization, industrialization and economic development have, therefore, highlighted the importance of the LULCC of the GHKM over the past 30 years and the “from-to” change in order to determine the socioeconomic factors that will contribute to the necessary changes to ensure future sustainable development.
In the continuing development of remote sensing technology, satellite remote sensing has been widely used to detect LULC change both qualitatively and quantitatively [7,10,19,20,21,22,23,24], as well as urban expansion [25], and to validate the modeling of urban growth [26,27]. Various methods and algorithms, broadly classified into two types, have been developed for use in detecting such changes. They include (1) change detection without classification, and (2) post-classification [7]. Change detection without classification includes the normalized difference vegetation index (NDVI), normalized difference water index (NDWI), normalized difference built-up index (NDBI), tasseled cap transformation, principal component analysis, and change vector analysis (CVA). Post-classification techniques include post-classification comparison, image differentiation, aerial difference calculation, image rationing, and image regression [28]. All change detection techniques provide the basis for an understanding of the relationships and interactions between humans and natural phenomena [7,10,29]. Landsat images collected by Landsat 5 Thematic Mapper (TM), 7 Enhanced Thematic Mapper Plus (ETM+), and 8 Operational Land Imager (OLI) are often used to detect change, because they provide continuous, consistent, and long-term data over the past selected decades [4,28,29,30,31]. They are available in multispectral, multi-resolution, and multi-temporal forms, which make them useful for LULC change monitoring [4]. Extensive studies have been conducted regarding LULCC [2,13,21,30,32,33,34,35] and their driving forces, such as urban expansion, population growth [4,12,14,36], socioeconomic determinants [17,37], transformation of farmland to urban land [14], and policy changes [38,39]. Wu et al. (2016) assessed urban expansion and LULC changes in Guangzhou from 1979 to 2013 using differently dated Landsat images and concluded that urban expansion increased by 1512.24 km2, at an annual rate of 11.25% [5]. Zhang et al. (2015) evaluated the long-term LULC changes, and their results showed that the urbanized area in Dongguan had increased by more than 52% between 1979 to 2013 [40]. Du et al. (2014) revealed further LULC changes and concluded, positively, that changes in land use were closely related to population growth, economic development, and the implementation of policies [14].
For the classification of remote sensing data, both parametric and non-parametric statistical learning techniques have been developed and used in different contexts [41]. Parametric statistical learning techniques such as the maximum likelihood classifier (MLC) fail due to an inability to resolve the interclass confusion. This limitation can be overcome by applying a non-parametric classifier such as a support vector machine (SVM), which does not depend on any assumptions of the class distributions of data [41,42,43]. The SVM is an advanced machine learning algorithm, binary classifier, and a relatively new supervised classification technique [44]. The SVM outperforms the other methods due to its robustness, high classification accuracy, and effective output results, even when using a small training sample [29,41,42,43]. It operates on the principle of structural risk minimization (SRM) [45] and has overcome the problem of overfitting [41,44]. Therefore, the SVM has recently attracted the attention of researchers in the community of remote sensing [46]. Several studies have employed an SVM [47,48,49,50,51,52,53].
GMHK land use has undergone a significant development over the past 30 years, substantially influenced by the changing polices enabling industrialization, urbanization, and socioeconomic activities. This region has become one of the richest regions in China, contributing 14% of the country’s gross domestic product (GDP) [54]. To understand the impacts of LULCC related to changes in policies and socioeconomic dynamics, this study is based on an integrated analysis as follows. First, we estimate the continuous monitoring of LULC changes in GHKM over the past 31 years (1986–2017). Second, we analyze the driving factors and mechanisms of the change. Third, we determine the relationship between light index, urbanization, and socioeconomic determinants. This study also aims to provide reference data regarding the implementation of sustainable socioeconomic and urban development for policy and decisions makers, and to map the relationships between factors that result in the reduction of farmland.

2. Materials and Methods
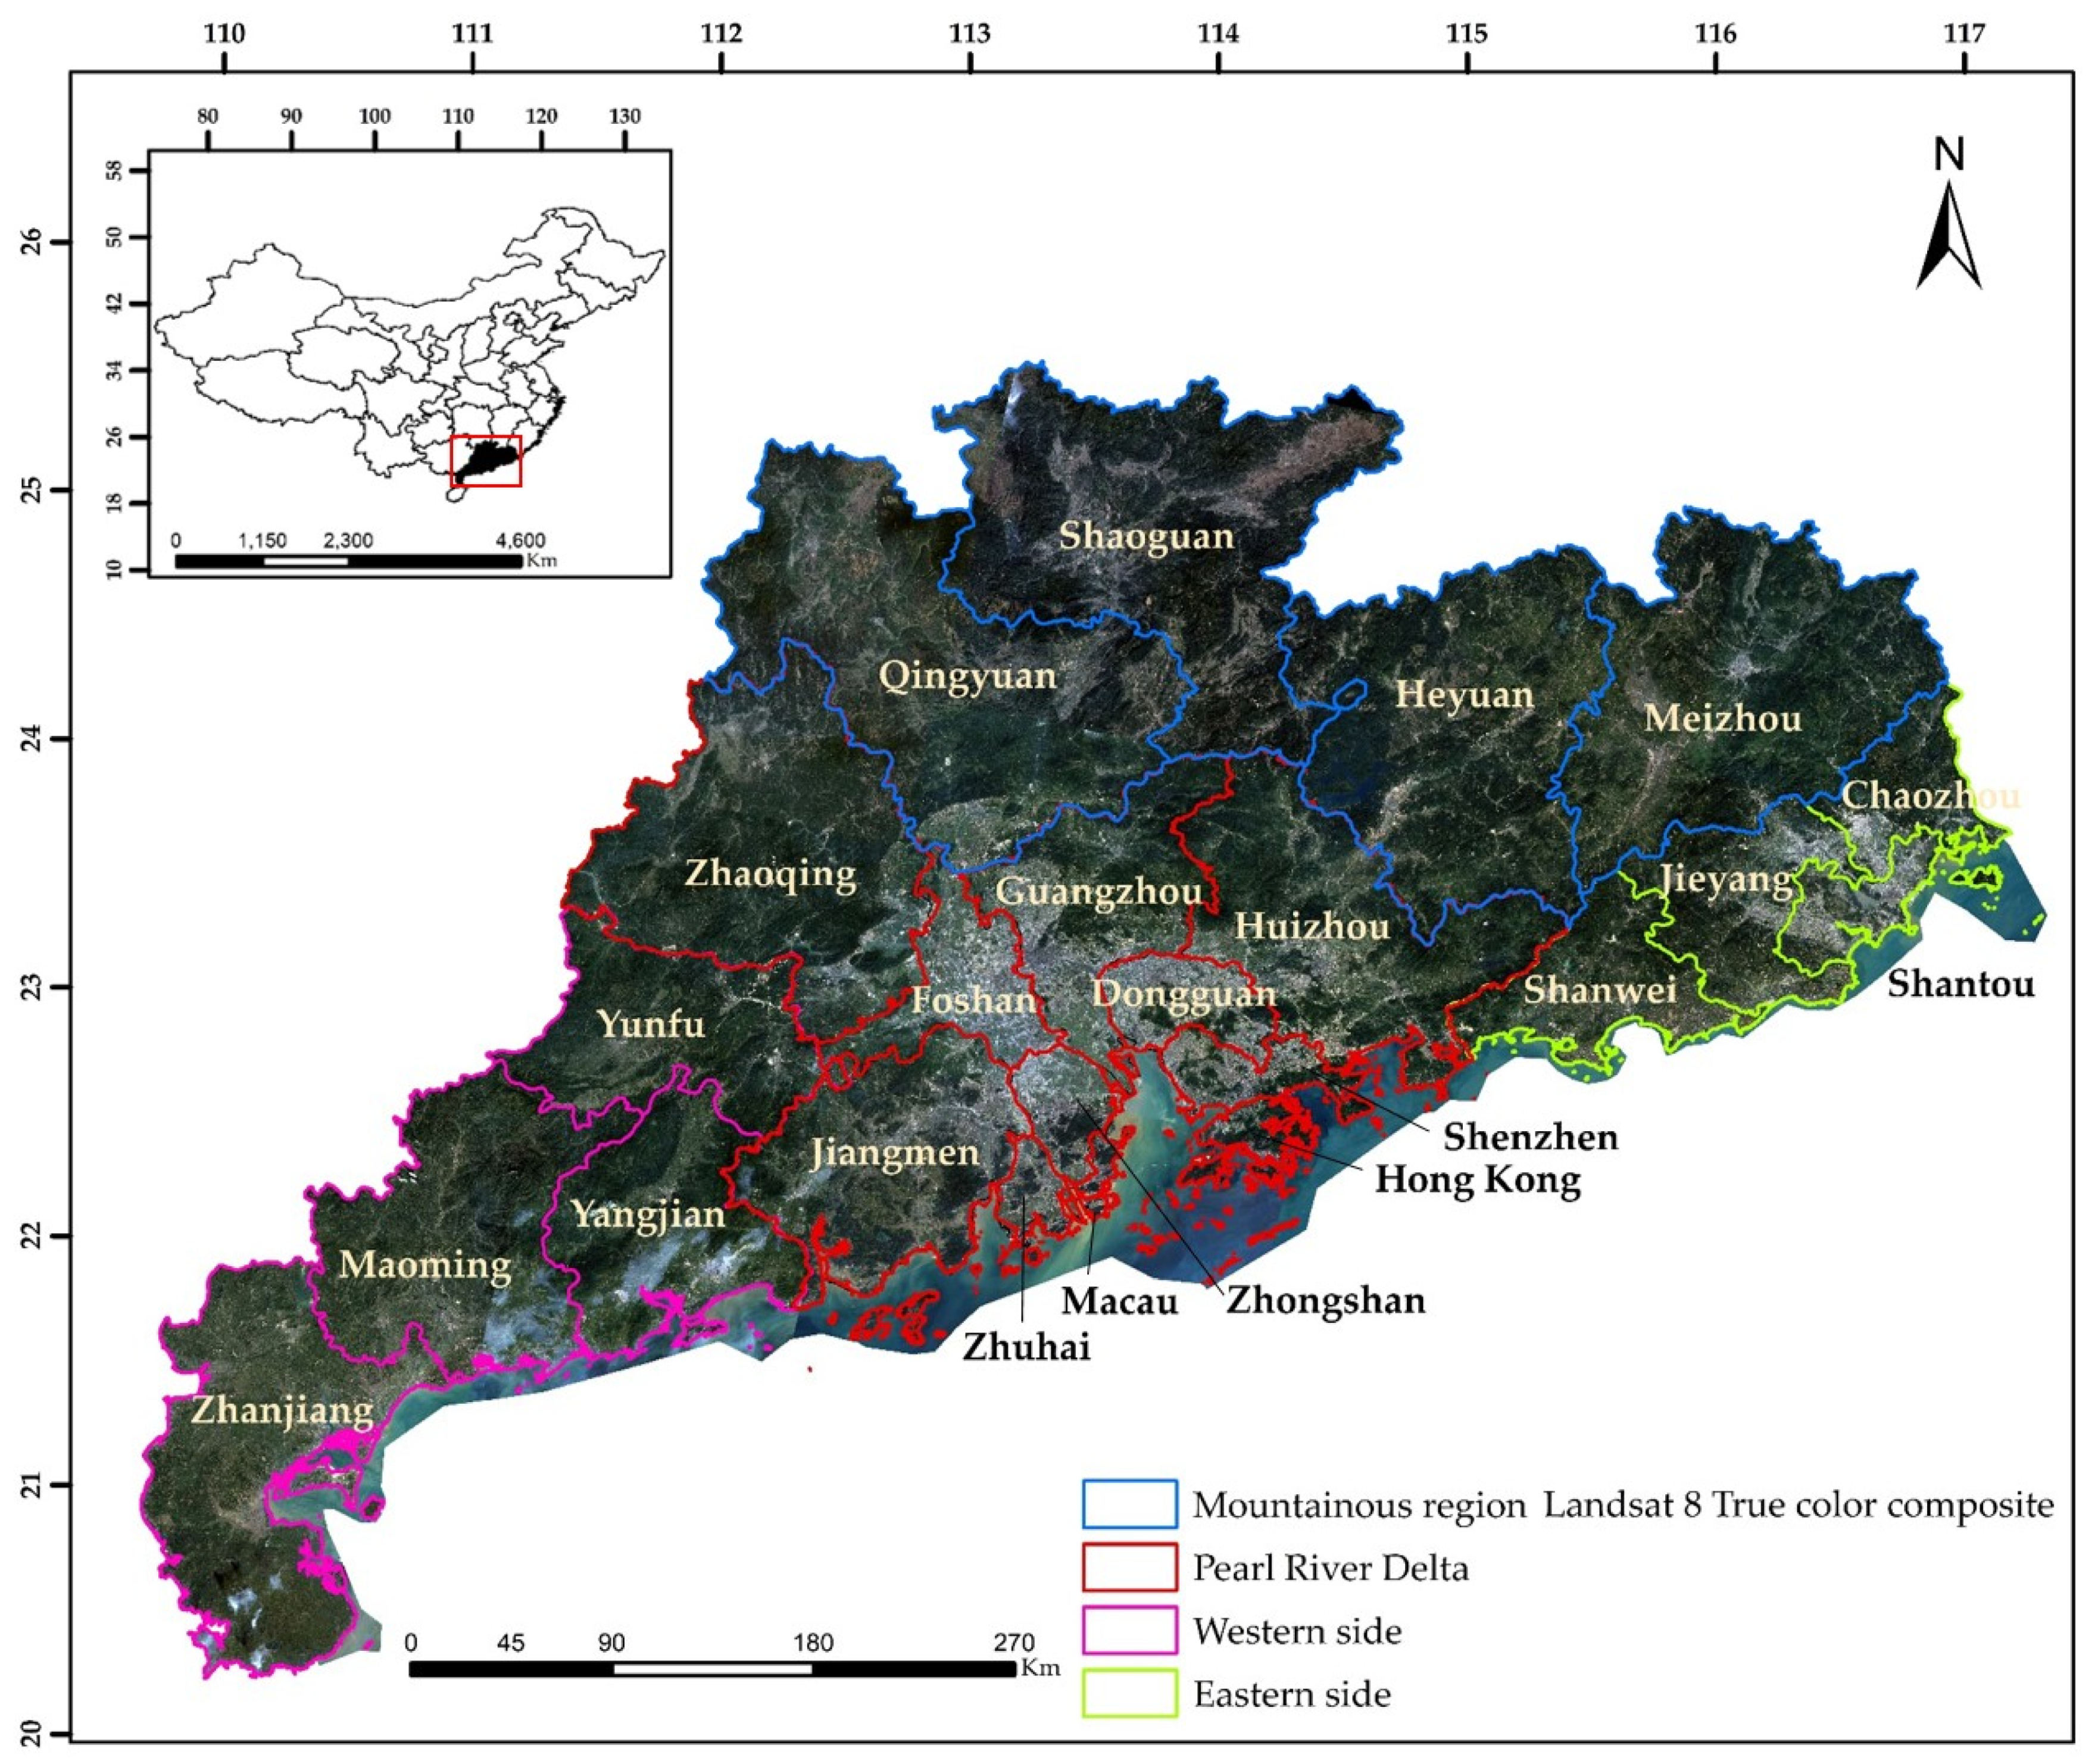
2.1. Study Area

GHKM is located at 20°13′N–25°31′N, 109°39′E–117°19′E in the southernmost part of China (Figure 1) [11,55,56]. It adjoins Fujian province in the east, Jiangxi and Hunan provinces in the north, Guangxi in the west, and the South China Sea in the south [55]. GHKM covers a total area of approximately 196,342 km2. The area consists of 23 cities, divided into four groups in accordance with their geographical location. This includes 11 cities in the Pearl River Delta (PRD), five cities in mountainous regions, four cities on the eastern side, and three cities on the western side [11,55,56]. The whole area is a tropical and subtropical region. It has a humid climate with an annual average temperature of 22 °C. The coldest month is January, with July the hottest. The rainy season begins in April and ends in September, with an annual average precipitation ranging from 1500 to 2000 mm. Forest coverage varies from north to south, in relation to the local climatic conditions. The total population of the GHKM by 2017 was 9164.90 (10,000 persons) [54]. Guangzhou is the capital and the Pearl River, flowing through GHKM, is the largest river in South China. The geography of the area is mixed and includes rivers, mountains, hills, plateaus, and plains [11,17,55]. The area has been highly industrialized and urbanized with its economy currently ranked 14th in the world.

2.2. Data Acquisition and Preprocessing

2.2.1. Landsat Data

Atmospherically corrected Landsat (TM, ETM+, and OLI) level 2 images with 30 m spatial resolution were collected in the dry season (October to March) from 1986 to 2017 from USGS Earth Explorer [57]. The study area was covered with 15 tiles of Landsat images for the corresponding study year. The dry season (winter) is considered the best period to study LULCC, due to minimal cloud and a better capacity to differentiate between grasses and evergreen forest [17]. Mosaics of cloud-free images were produced every five years. However, due to serious cloud contamination during some years, the collected images were based on intervals that were one or two years longer or shorter during the selected five years (Table S1).

2.2.2. DMSP/OLS NTL Data

Defense Meteorological Satellite Program/Operational Linescan System (DMSP/OLS) version 4 data with 1 km spatial resolution and 6-bit radiometric resolution were downloaded from the National Geophysical Data Center (NGDC) website of National Oceanic and Atmospheric Administration (NOAA) [58]. NTL data from 1994 to 2010, used as an annual NTL image composite, were only available for the period from 1992 to 2013. The stable night light product was used with six sensors F10, F12, F14, F15, F16, and F18; all background noise is removed from this product [59], thus it comprises only light emitting from residential areas, cities, town, and persistent lightning areas [60].
DMSP NTL images cannot be used directly because of the absence of onboard intercalibration and sensor, orbit, and magnitude discrepancies, and the digital numbers (DN) values of lit pixels of different satellites even when no changes occur on the ground [59,61,62,63,64,65]. Therefore, intercalibration, inter-annual composition, and inter-annual series correction was performed to calibrate the NTL data [59,61,62,64].

2.2.3. Other Data Sets

Other data used in this study included vector data of the GHKM administrative division boundary and socioeconomic data such as population and GDP data extracted from Guangdong, Hong Kong, and Macao Statistical Yearbooks 1986–2017. All satellite data, including Landsat and NTL images, were clipped by the study area boundary. The projection system used for vector data was WGS-1984-UTM-Zone-49N.

2.3. Land Use Land Cover Classification from Landsat Images

An a priori classification scheme was devised following similar studies in the GHKM [10,14,17]. LULC classes were defined as forest, grassland, water, fishponds, built-up, bareland, and farmland (Table 1). The obtained images were classified by a supervised support vector machine (SVM) [66]. The SVM algorithm has flexible supervised classifier options with high accuracy when classifying the multispectral data, compared to other supervised classification methods (such as a decision tree and maximum likelihood classifier (MLC)). It is an advanced machine learning statistical algorithm that separates the classes by an optimal decision hyperplane surface [67]. High-resolution Google Earth imagery was used to assist with the selection of regions of interest (ROIs) as training samples. In the SVM, a radial bias function (RBF) was used as a kernel function as this kernel yielded higher performance with respect to convergence speed, robustness, and fewer parameter values to predefine [50]. The cost parameter (C) tells the SVM optimization how much we want to avoid misclassifying each training example. For large values of C, the optimization will choose a smaller-margin hyperplane whereas a very small value of C will cause the optimizer to look for a larger margin separating the hyperplane. The gamma parameter defines the influence of a single training example. With a low gamma value, points far away from a plausible separation line are considered in the calculation for the separation line. On the other hand, a high gamma value considers the points close to the separable line [44,50]. Therefore, an RBF with the adjusted parameters C factor = 100, gamma = 0.167, and threshold = 0 were used in this study, as these parameters give the best results and high classification accuracy. The threshold = 0 was set so that it uses the full resolution image. To eliminate the random noise and isolated pixels from a classified map, a majority filter of 8 by 8 was applied [14].
The accuracy of the classified maps was assessed by means of the producer’s accuracy, user’s accuracy, and kappa statistics derived from the confusion matrix [68,69]. The accuracy assessment samples were selected by stratified random sampling of the reference image verified with the high-resolution images of Google Earth and the land use data from the provincial Department of Land and Resources [70].

2.4. Change Detection from Classification Map

Temporal changes in the spatial extent of the landscape thematic classes were determined through post-classification comparison of the classified maps. The maps were paired sequentially, i.e., 1986–1989, 1989–1994, 1994–2000, 2000–2005, 2005–2010, and 2010–2017, and transition matrices were then produced [68,71]. To summarize the transition and for further analysis, gain (Equation (1)), loss (Equation (2)), net change (Equation (3)), swap (Equation (4)), and total change (Equation (5)), of each LULC class, for each of the periods [71] were calculated. Also calculated was the annual rate of change using Equation (6), based on the compound interest law; therefore, there is an insensitivity to different time periods [72,73].
G j =   P + j   P j j
L j =   P j +   P j j
A N c j = | P + j   P j + |
S i = 2 m i n ( P j +   P j j ;   P + j   P j j )
( T c ) j = (   P j +   P j j ) + ( P + j   P j j )
R = ( 1 T 2   T 1 ) × ( l n A 2 A 1 ) × 100
where G represents a gain, L represents loss, ANc represents absolute net change, S represents swap, Tc represents total change, A1 and A2 represent areas corresponding to times T1 and time T2, respectively, and R represents the rate of change in percentage terms per year. Gain (G) is defined as the landscape thematic class percentage at time 2 after subtracting its proportion from the time 1 landscape. Loss (L) is defined as the difference between the percentage of a class of time 1 landscape and its persistent proportion after the transition period. Absolute net change (ANc) is defined as the absolute difference of class landscape amount between the time 1 and time 2 landscapes. Swap (S) represents the amount of a loss of class at one location and the same amount is added to a different class in the landscape. The total change (Tc) characterizes the overall change, calculated by adding gain and loss [68]. In this study, the forest growth, expansion of urban area, and loss of farmland were explained both temporally and spatially through the transition matrix.

2.5. Light Index from DMSP NTL data
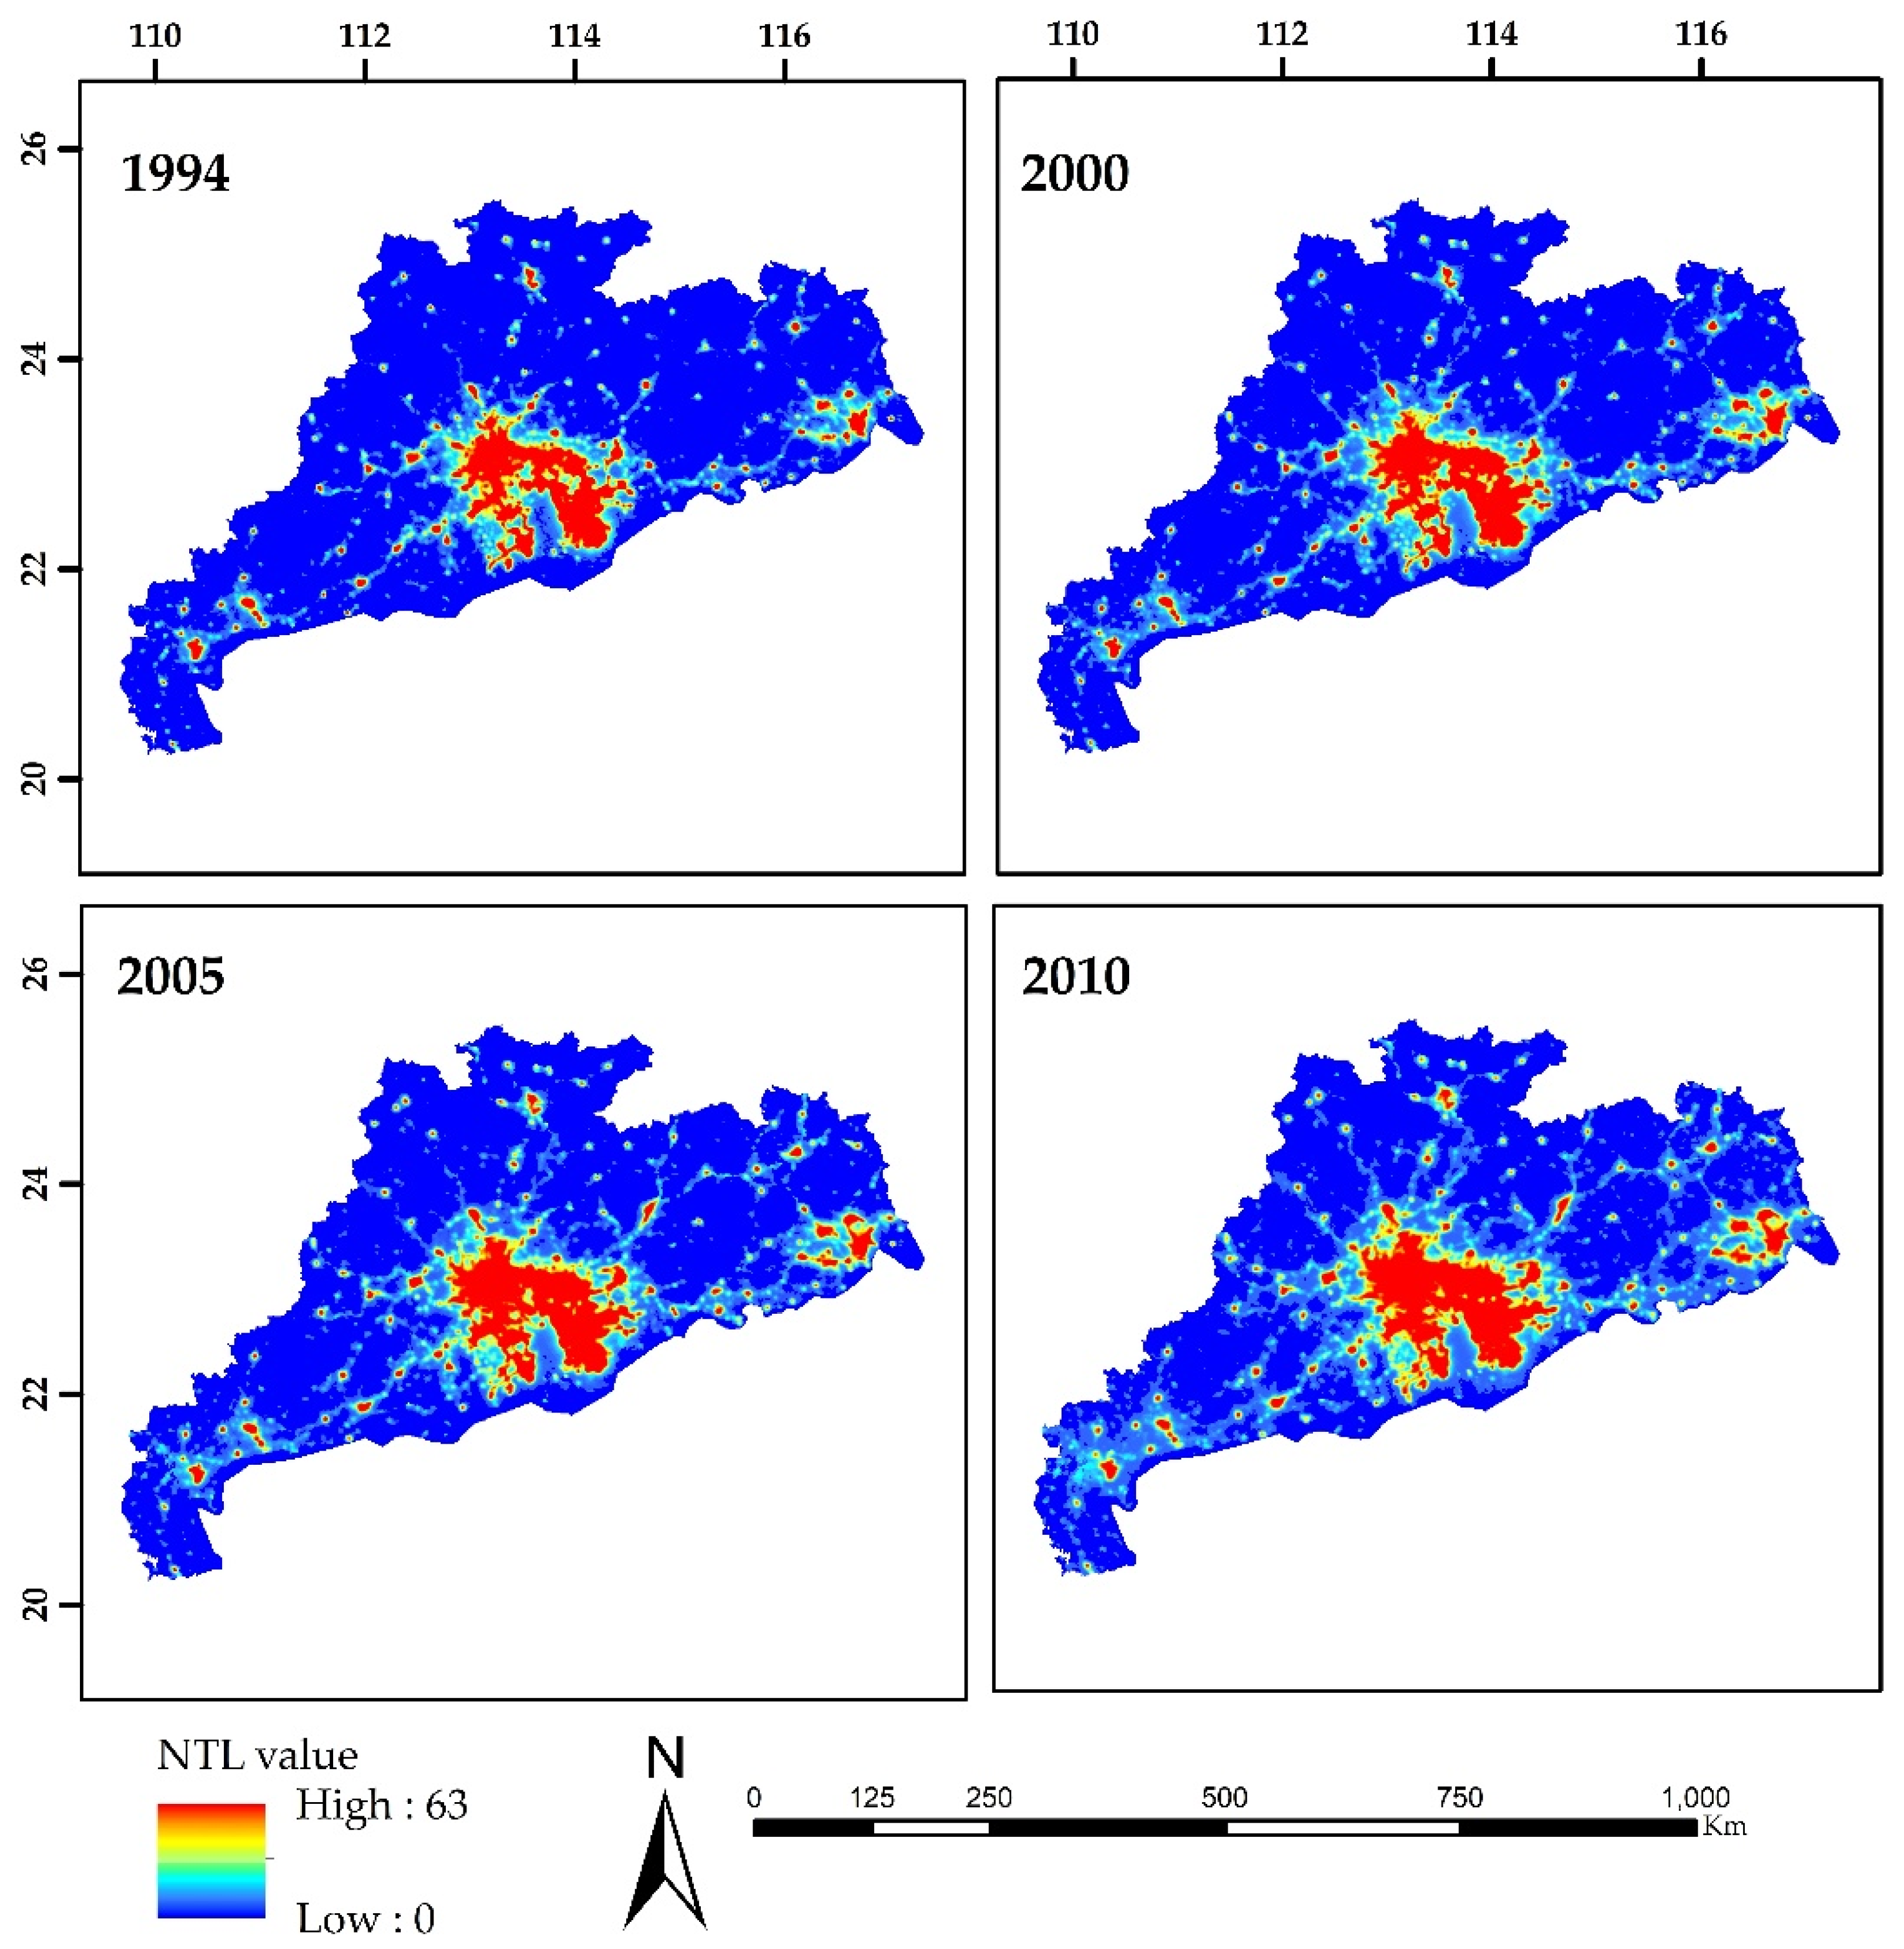
The light index is defined based, simultaneously, on two parameters: (1) the brightness of the night light, and (2) the urban area of lit pixels. The light index shows a close relationship with urban population, urban area, and economic activities [74,75]. Therefore, changes in the light index over time show the trends of population density and economic growth [55]. The light index was calculated using the following formula:
L i g h t   I n d e x = I S
where I is the average night light brightness:
I = 1 N L × D N M × i = P D N M ( D N i × n i )
where D N M is the maximum DN value, D N i is the DN value of the ith gray level, n i is the number of lit pixels belonging to that ith gray level, P is the optimal threshold used to extract the urban area from the NTL images, and N L is the number of lit pixels with a DN value between P and D N M . S is the proportion of lit urban areas to the total area of a study region:
S = A r e a N A r e a
where, A r e a N is the lit urban areas and Area is the total area of the study region [55].

3. Results

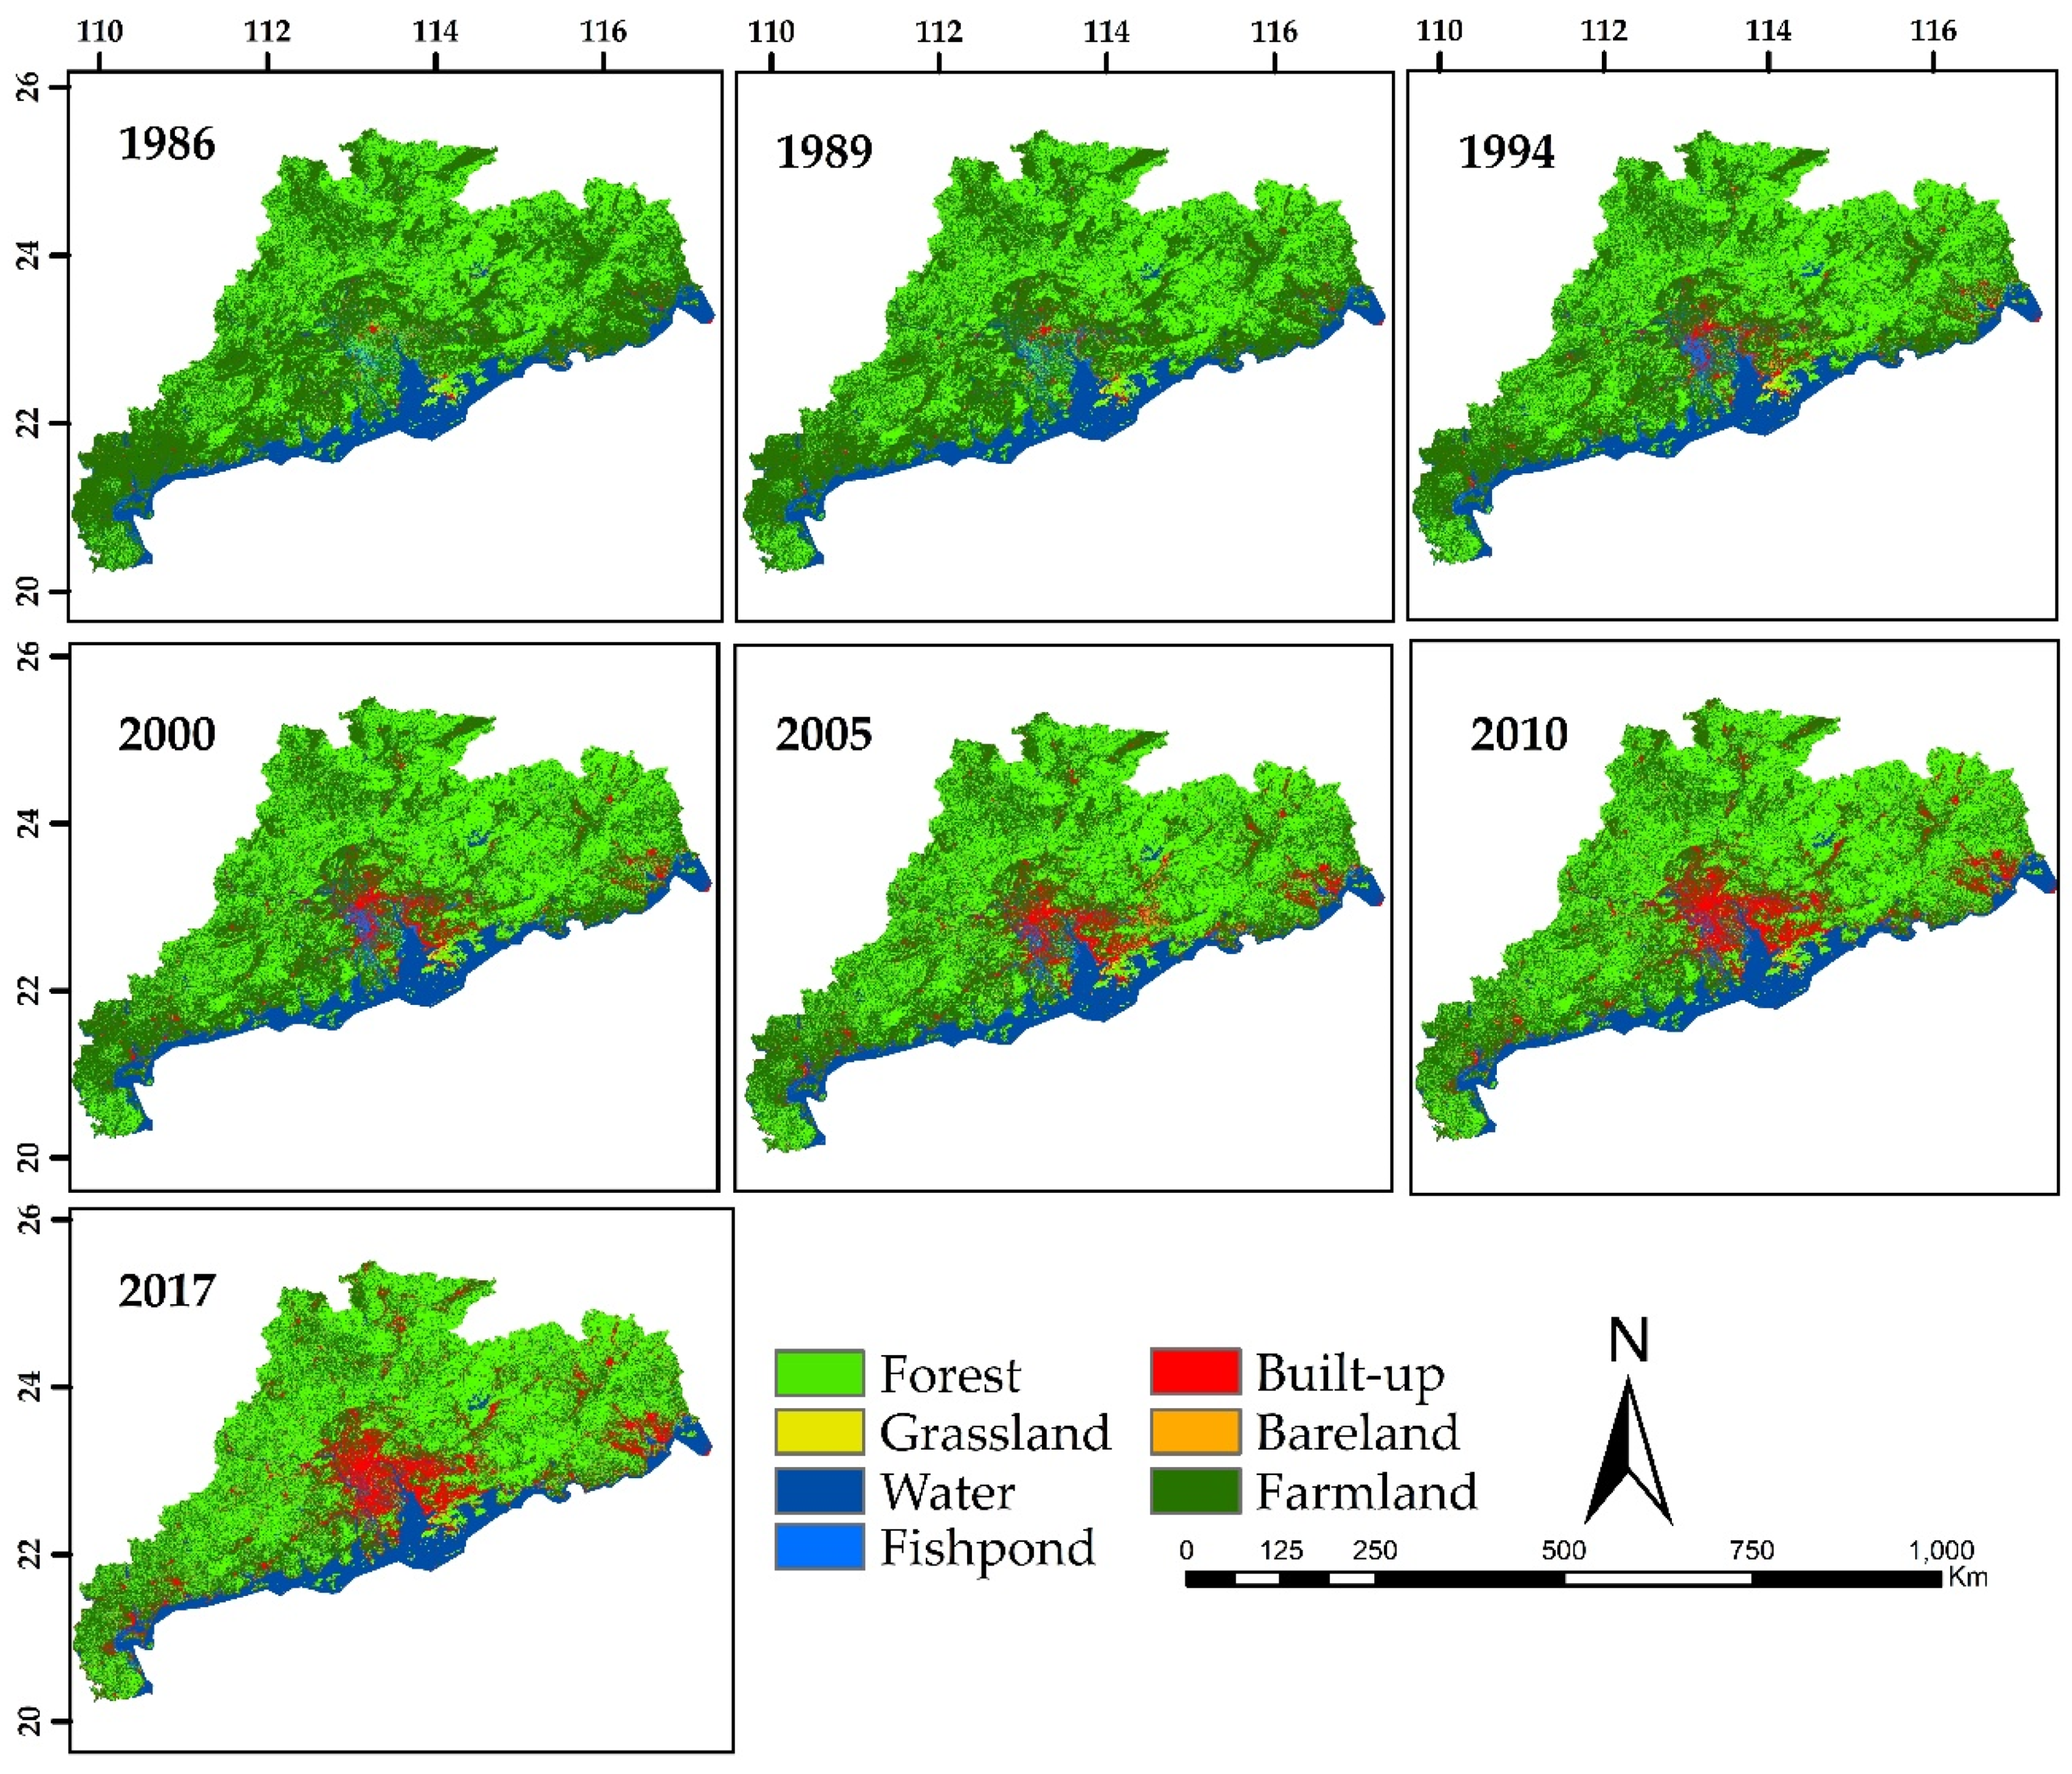
3.1. LULC Changes from 1986 to 2017

The LULC maps for the years 1986, 1989, 1994, 2000, 2005, 2010, and 2017 were produced by supervised image classification (Figure 2), followed by transition and persistence matrices of the LULC classes. The accuracy assessment based on a confusion matrix, having overall accuracy of 91% and kappa of 0.88 (Table S2), suggests each classified LULC map is satisfactory. The transformation between the different LULC maps reflect the direction of change, which can be best explained using a space-time change process. The results (Table S3) reveal that during 1986–2017, the major transition occurred between built-up land, farmland, and forest. The diagonal numbers in Table S3 show a class persistence (i.e., the area remained the same), and the off-diagonal numbers in the matrix represent conversion from one class to another. The main characteristics of the transference are described below.
Figure 2 shows a series of maps, while Figure 3a,c is a bar chart and 3b, d gives LULC trends, showing that the GHKM land cover changed significantly during the study period. The economic reform policies, rapid economic development, and urbanization have changed the history of the study area socially and economically, resulting in LULCC [39,76]. The LULCC over the past 30 years indicates that forest, farmland, and built-up land remain the dominant cover types in the study area. The results reveal that in 1986, built-up land had the least coverage (Figure 2, Table S3) and, over the years, it increased from 0.76% in 1986 to 10.31% in 2017. Compared to other land cover classes, the built-up area increased, with the highest annual rate of change i.e., 8.45%, during 1986–2017 (Table 2). Its highest annual rate of change was observed between 1986 and 1989, i.e., 19.15%. From the late 1980s to the 2000s, the GHKM built-up area grew at an annual rate of around 8–10%, decreasing to 5.19% in 2000–2017 but still maintaining a high rate. The built-up area attained its maximum gain from 0.59% to 2.05% over the entire study period, with the highest being in 2005–2010. Its continuous expansion from an area of scattered downtown (central part or commercial of a town or city) to megacities is due to economic growth and the increasing population.
The most socioeconomic development, industrialization, and urbanization have been observed in the greater bay region, Pearl River Delta (PRD), while other areas such as the eastern flank, western flank, and mountainous region have also grown. The Pearl River Delta (PRD) is characterized by intense human activities. The proportion of built-up areas varies significantly over time in different cities. In Shenzhen, Dongguan, Foshan, Zhongshan, and Macao, the built-up area was less than 5% in 1986. Since then, the urban area in these cities have expanded to a greater degree than that of other cities. The built-up land in these cities rose more than 50% by 2017 (Figure 4). In Guangzhou and Foshan, the built-up areas were significantly higher than in other cities in 1986. They remain higher in built-up area than other cities of the GHKM in 2017. The overall proportions of their built-up areas were significantly lower than those in Shenzhen, Dongguan, Zhongshan, and Macao due to the relatively slower rates of urban growth and the imbalanced internal development. The built-up area in small cities such as Zhuhai is relatively smaller but proportionally close to that of Guangzhou. The built-up area of Jiangmen, Jieyang, Huizhou, and Chaozhou is close to that of Zhuhai but the proportion of their built-up land is smaller than that of the other PRD regions. The proportion of built-up areas in the mountainous regions, on the western side, and in Shanwei city on the eastern flank are much smaller than that of the other 12 cities in this study area. Thus, it is clear that the opening up of reform, and the introduction of the new economic policies, especially in the PRD, have attracted a significant influence of population from the inner provinces of China.
During the 31-year study period, among all the land use types the highest change in cover occurred in farmland. The area covered by farmland decreased by about 21%, i.e., from 53.54% (105,123.39 km2) to 33.07% (64,932.38 km2), with a net loss of 4.26% to 4.73% over the study period (Table S3). This was mainly the result of the expansion of built-up areas, urbanization, and forest growth (at the rate of 0.98% annually) (Figure 2 and Figure 3). From the transition matrix (Table S3), the conversion of farmland to other land types is most noticeable. As previously mentioned, a huge amount of farmland was transformed into built-up area: a probable 615 km2 (0.31%), 1,804 km2 (0.92%), 1690 km2 (0.86%), 1796 km2 (0.91%), 3211 km2 (1.63%), and 2840 km2 (1.44%) in 1986–1989, 1989–1994, 1994–2000, 2000–2005, 2005–2010, and 2010–2017, respectively. The per capita area of farmland decreased to 0.000708 km2 in 2017 from 0.001831 km2 in 1986. The net loss of farmland decreased significantly, whereas its conversion to built-up land accelerated.
Figure 4 shows that the proportion of farmland varied significantly over time in different cities of the study area. The situation was worse in the PRD (coastal) region and on the eastern side of the province, due to a significantly higher population density, higher economic development, and well-established farmland traditions. From 1986 to 2017, the area of farmland loss in these regions was greater than that in other regions of the study area, as officials took full advantage of making a financial profit, regardless of the total effect on society. Other matters such as sustainability were not considered.
The forest areas and built-up land have increased greatly. The gains in forest were 3.81%, 3.27%, 1.93%, 1.85%, 2.17%, and 3.42% during 1986–1989, 1989–1994, 1994–2000, 2000–2005, 2005–2010, and 2010–2017, respectively (Table S3). The forest cover, converted from farmland, increased at rates of 3.58%, 2.96%, 1.61%, 1.48%, 1.80%, and 3.05% during 1986–1989, 1989–1994, 1994–2000, 2000–2005, 2005–2010, and 2010–2017, respectively (Table S3). The highest annual rate of change in forest areas was 2.95% between 1986 and 1989 (Table 2). The changes in the proportion of forest cover over time differed in each prefecture during each of the six periods. In the PRD region, forest decreased, and more noticeably in Shenzhen, Dongguan, Zhuhai, and Zhongshan, but increased in peripheral counties (Figure 4). This is mainly because of conversion to built-up area, agricultural production, and unused land. From 1994 to 2017, forest cover also decreased on the eastern flank of the study area, but increased in some of the surrounding counties. In Foshan and Guangzhou, forest decreased from 1986 to 2000 and then increased between 2000 and 2017 because of an increase in urban forestry within the urbanized area.
The area of fishponds changed slightly, decreasing from 1.25% (2463.37 km2) to 0.85% (20241.77 km2) during the study period. This shows that the net loss in fishponds increased from 0.68% to 0.85% from 1986 to 2017. Therefore, a net loss of fishponds and farmland accelerated the growth of urban area and forest cover. Considerable changes were also observed in both grassland areas and bareland. Grassland was reduced from 0.23% (460.11 km2) in 1986 to 0.10% (189.72 km2) in 2017, whereas bareland was reduced to 0.14% (275.40 km2) in 2017 from 0.38% (752.17 km2) in 1986 (Table S3). Grassland and bareland are located at areas of low elevation such as the PRD, which is the main reason for their shrinkage in areas. However, the change in water bodies was relatively stable (Figure 3).
The intermixing of forest, grassland, and farmland was also observed, mainly because of the nearly identical signature and the phenological difference in the image acquisition. The transition probabilities for forest to grassland are 0.03, 0.07, 0.02, 0.07, 0.02, and 0.03 (Table S3); for grassland to forest they are 0.05, 0.02, 0.08, 0.04, 0.06, and 0.03 (Table S3) and for farmland to forest they are 3.58, 2.96, 1.61, 1.48, 1.80, and 3.05 during 1986–1989, 1989–1994, 1994–2000, 2000–2005, 2005–2010, and 2010–2017, respectively (Table S3). A variation was observed in the trend of grassland and bareland as the acquisition of Landsat images was done in the dry season [17].

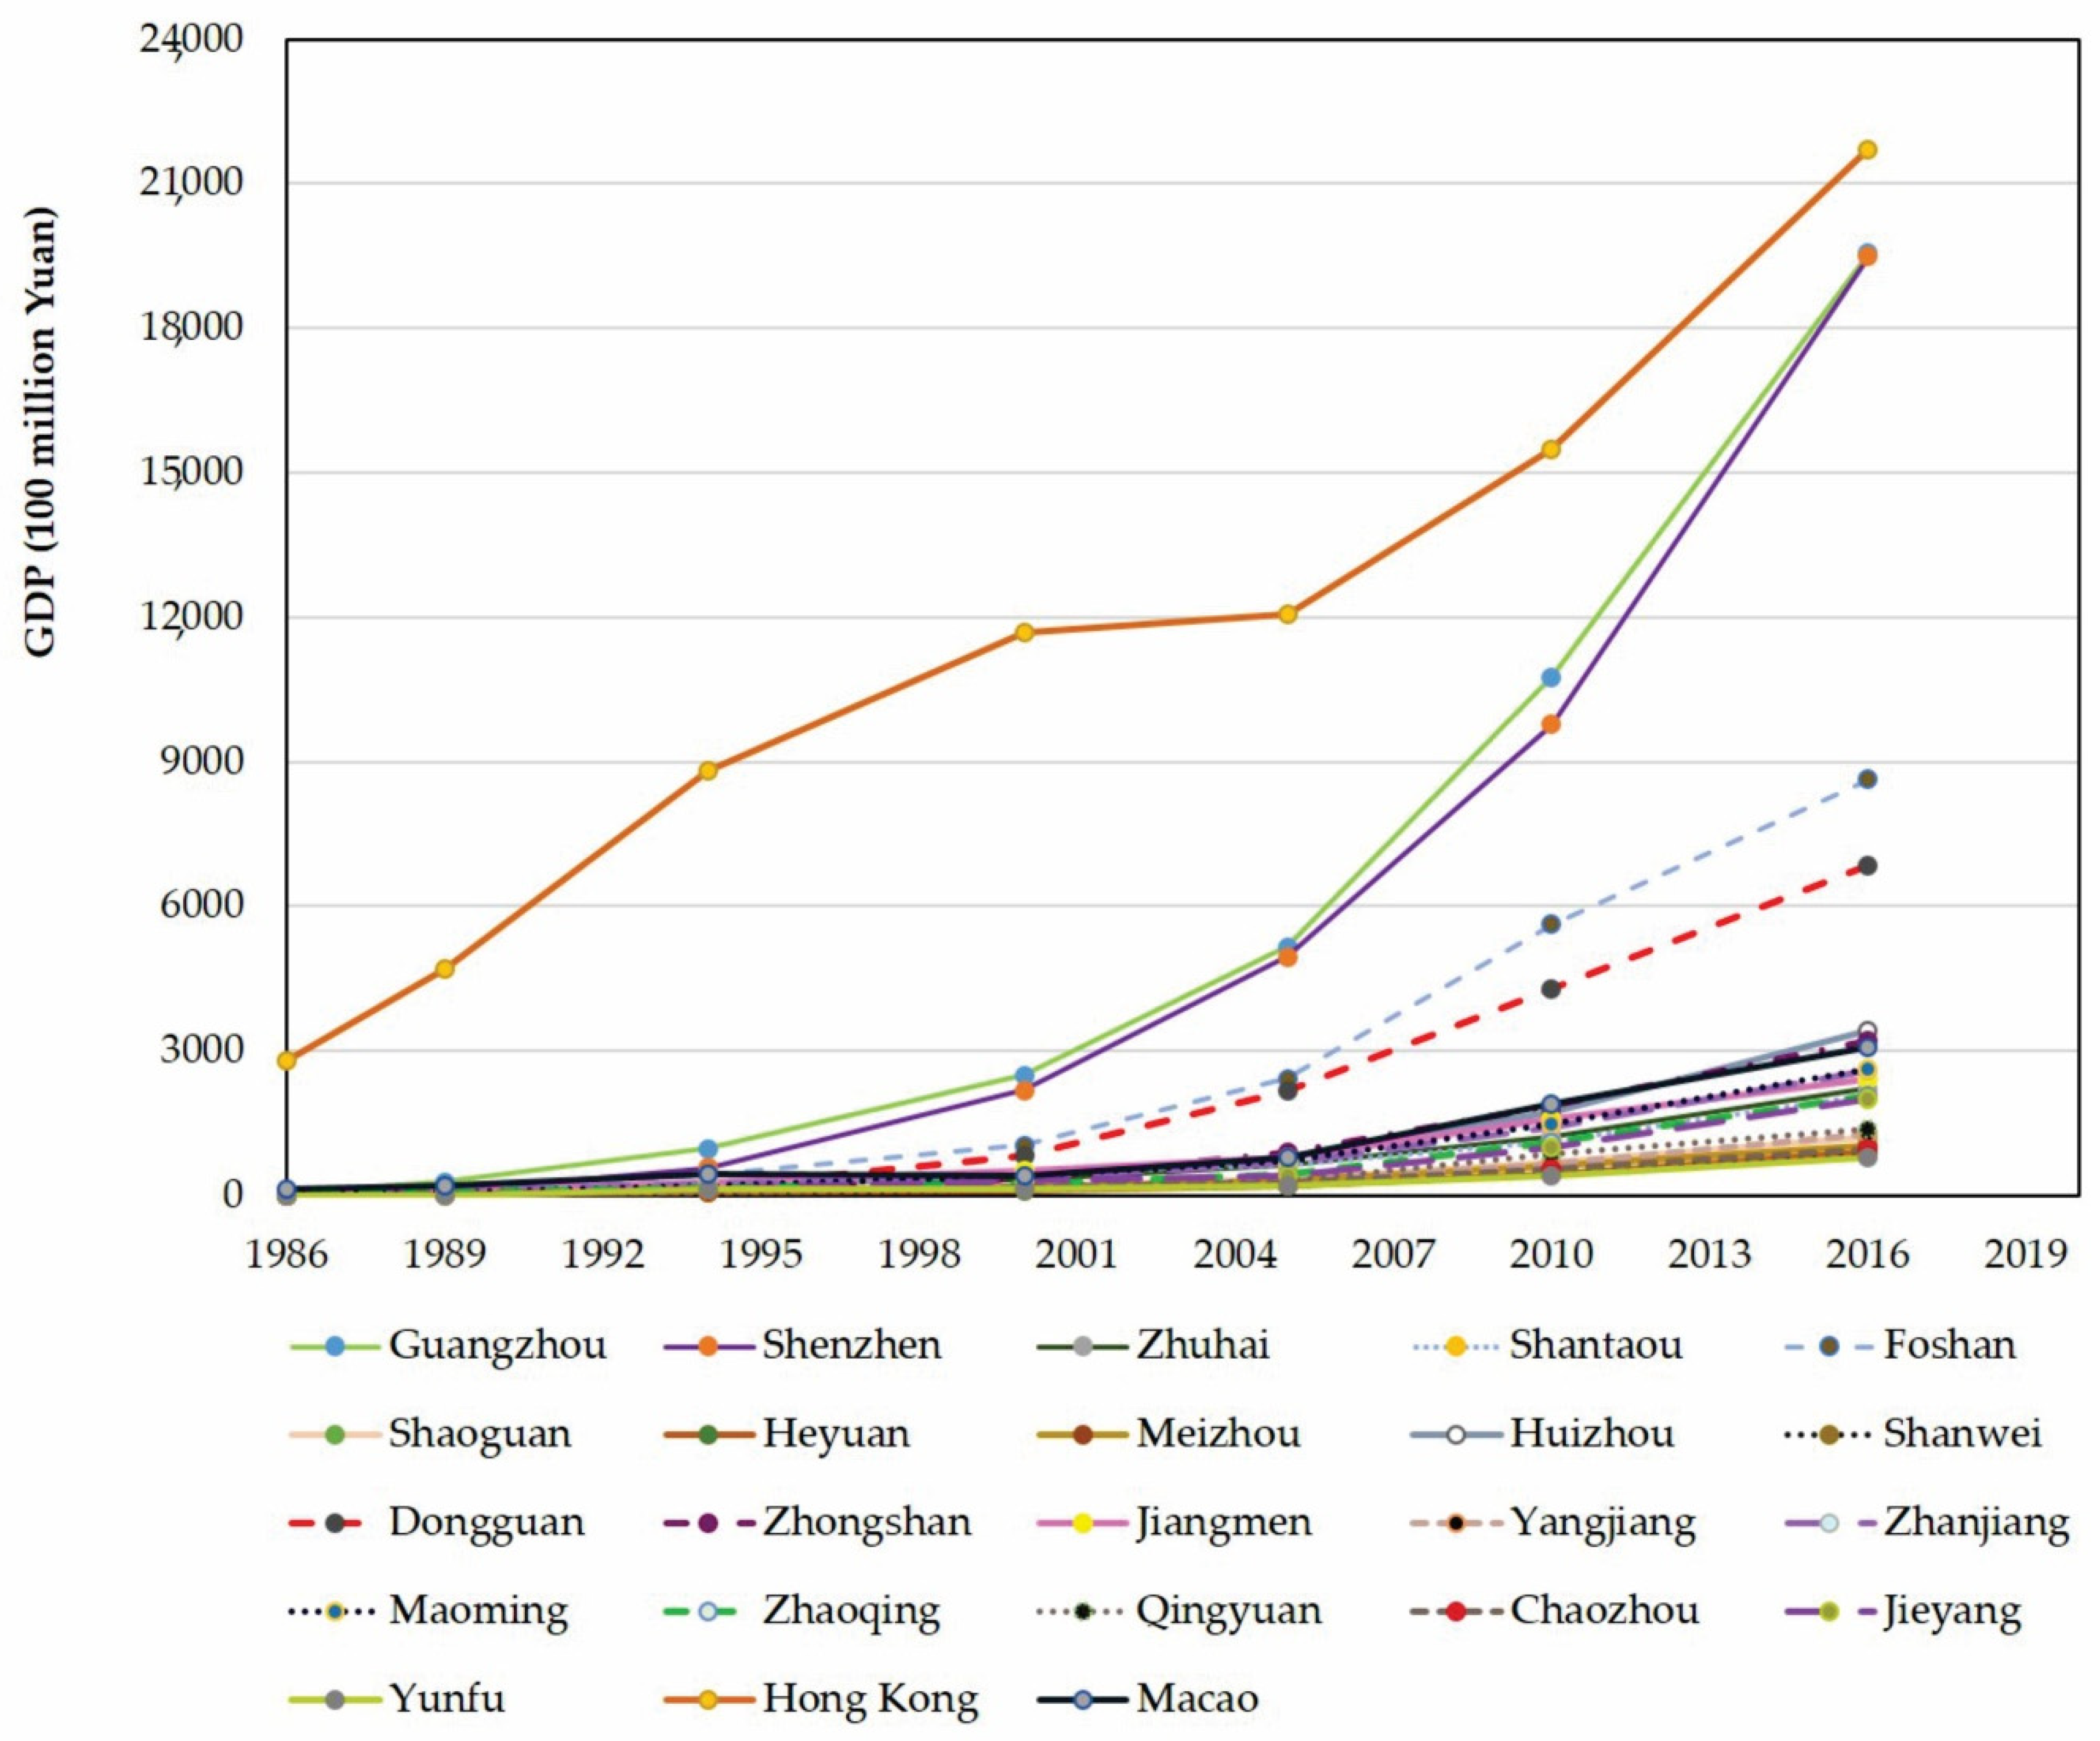
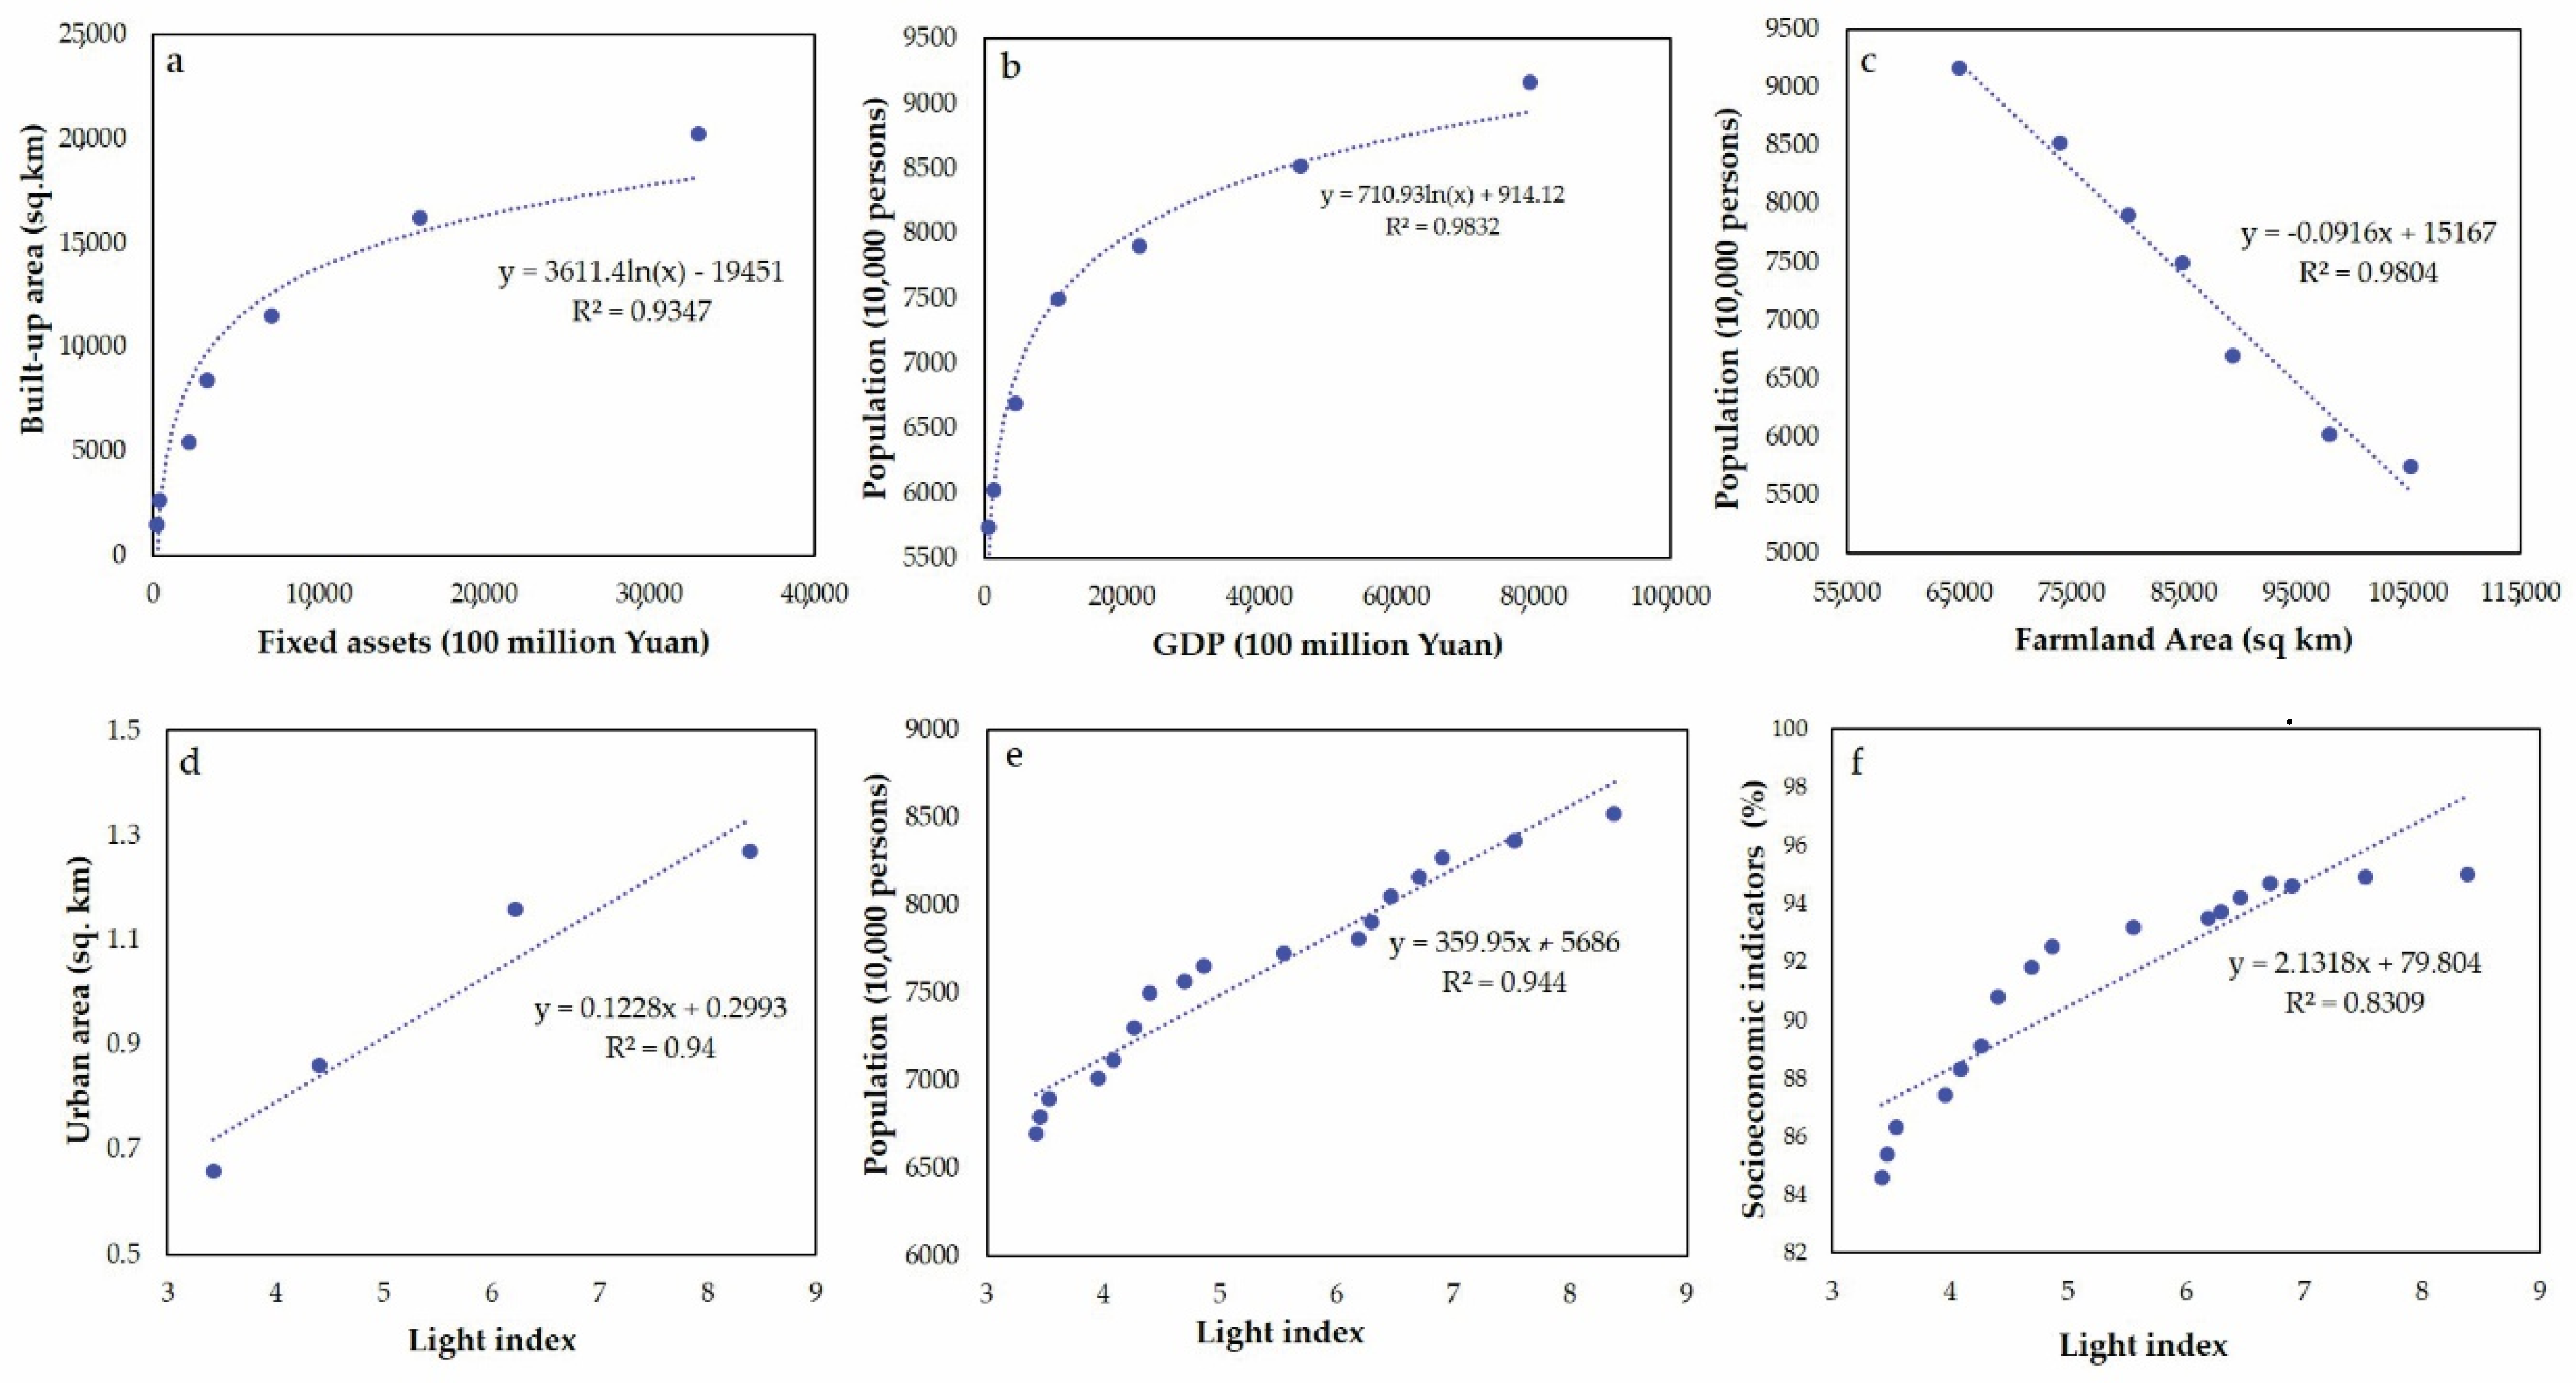
3.2. Socioeconomic Change

Several types of socioeconomic factors collected from Guangdong, Hong Kong, and Macao Statistical Bureaus for 1986 to 2017, as listed in Table 3, are responsible for LULCC in GHKM.
During the past 31 years (1986–2017), the GHKM GDP grew from 667.53 (100 million yuan) to 79,512.05 (100 million yuan) (Table 3), with an annual growth rate above 15%. Economic development and population are closely related. With the increase in economic development, GDP increases. This increase in economic development also resulted in population growth through migration, as delineated in Table 3. This unprecedented increase of migrant population caused gradual expansion of cities, urban sprawl, and loss of farmland. Figure 5 shows the GDP, built-up land, and farmland trends from 1986 to 2017, further confirming the influence of the increasing GDP and population growth on the GHKM land cover. Compared to the GDP, however, the annual population growth is relatively low and varies significantly in different stages (Table 4) and in each city of the GHKM (Figure 6). Shenzhen, Dongguan, Hong Kong, Foshan, Guangzhou, Macao, and Zhuhai (monocentric cities) have experienced the greatest and most rapid increase over the past three decades; their annual GDP and population growth rate is close to the average growth rates of the whole region. The rest of the cities in the study area, however, have significantly lower growth rates than the regional averages and that of the population.
Based on the urban extent dataset from NTL, an increasing trend of light index related to urbanization has been observed (Figure S1, Table 5), which reflects human activities and development (Figure 7). The reason for the increase in the light index is new lighting projects such as at malls, scenic spots, and streets in order to make the cities seem more glamorous. Consequently, after 30 years of development, a new pattern of urban sprawl has been observed in GHKM, especially in the PRD region, now named the “Greater Bay area” (Figure 2). This area accounts for 57% of the GHKM population. The GHKM government revenue has increased to 10,390.35 (100 million Yuan) from 82.41 (100 million Yuan) during the study period (Table 3).
The total investment in fixed GHKM assets has increased from 216.50 (100 million Yuan) to 33,008.86 (100 million Yuan) during 1986–2017. This significant increase in annual investment is the direct result of (a) more infrastructure and construction projects, (b) urbanization from low density to high density, and (c) conversion of farmland to other land types during the study period [17,39,77]. There is a significant logarithmic relationship with a coefficient of determination R2 = 0.93 and R2 = 0.98 between the fixed assets investment and the built-up area (Figure 8a) and between GDP and population (Figure 8b), respectively. Figure 8c indicates that the coefficient of determination between population and farmland is 0.98. The light index has a strong relationship with urban areas extracted from DMSP NTL data, total population, and socioeconomic indicators (i.e., secondary and tertiary industry), with a coefficient of determination of 0.94, 0.94, and 0.83 (during 1994–2010) (Figure 8d–f).
During the study period, the total retail sales of consumer goods surged from 327.02 (100 million Yuan) in 1986 to 34,739.00 (100 million Yuan) in 2017, reflecting the demand for consumer goods such as cars and houses. This increase in spending power has promoted real estate. Due to the above-mentioned factors, GHKM has also experienced significant socioeconomic development, by encouraging industry. A large migrant population and increasing demand for labor have further increased secondary and tertiary industries, rather than the primary industries (Table 3). As a result, the total population increased from 5740.70 (10,000 persons) in 1986 to 9164.90 (10,000 persons) in 2017 (Table 3), with a population density of 612 (persons/km2) in 2017.

4. Discussion

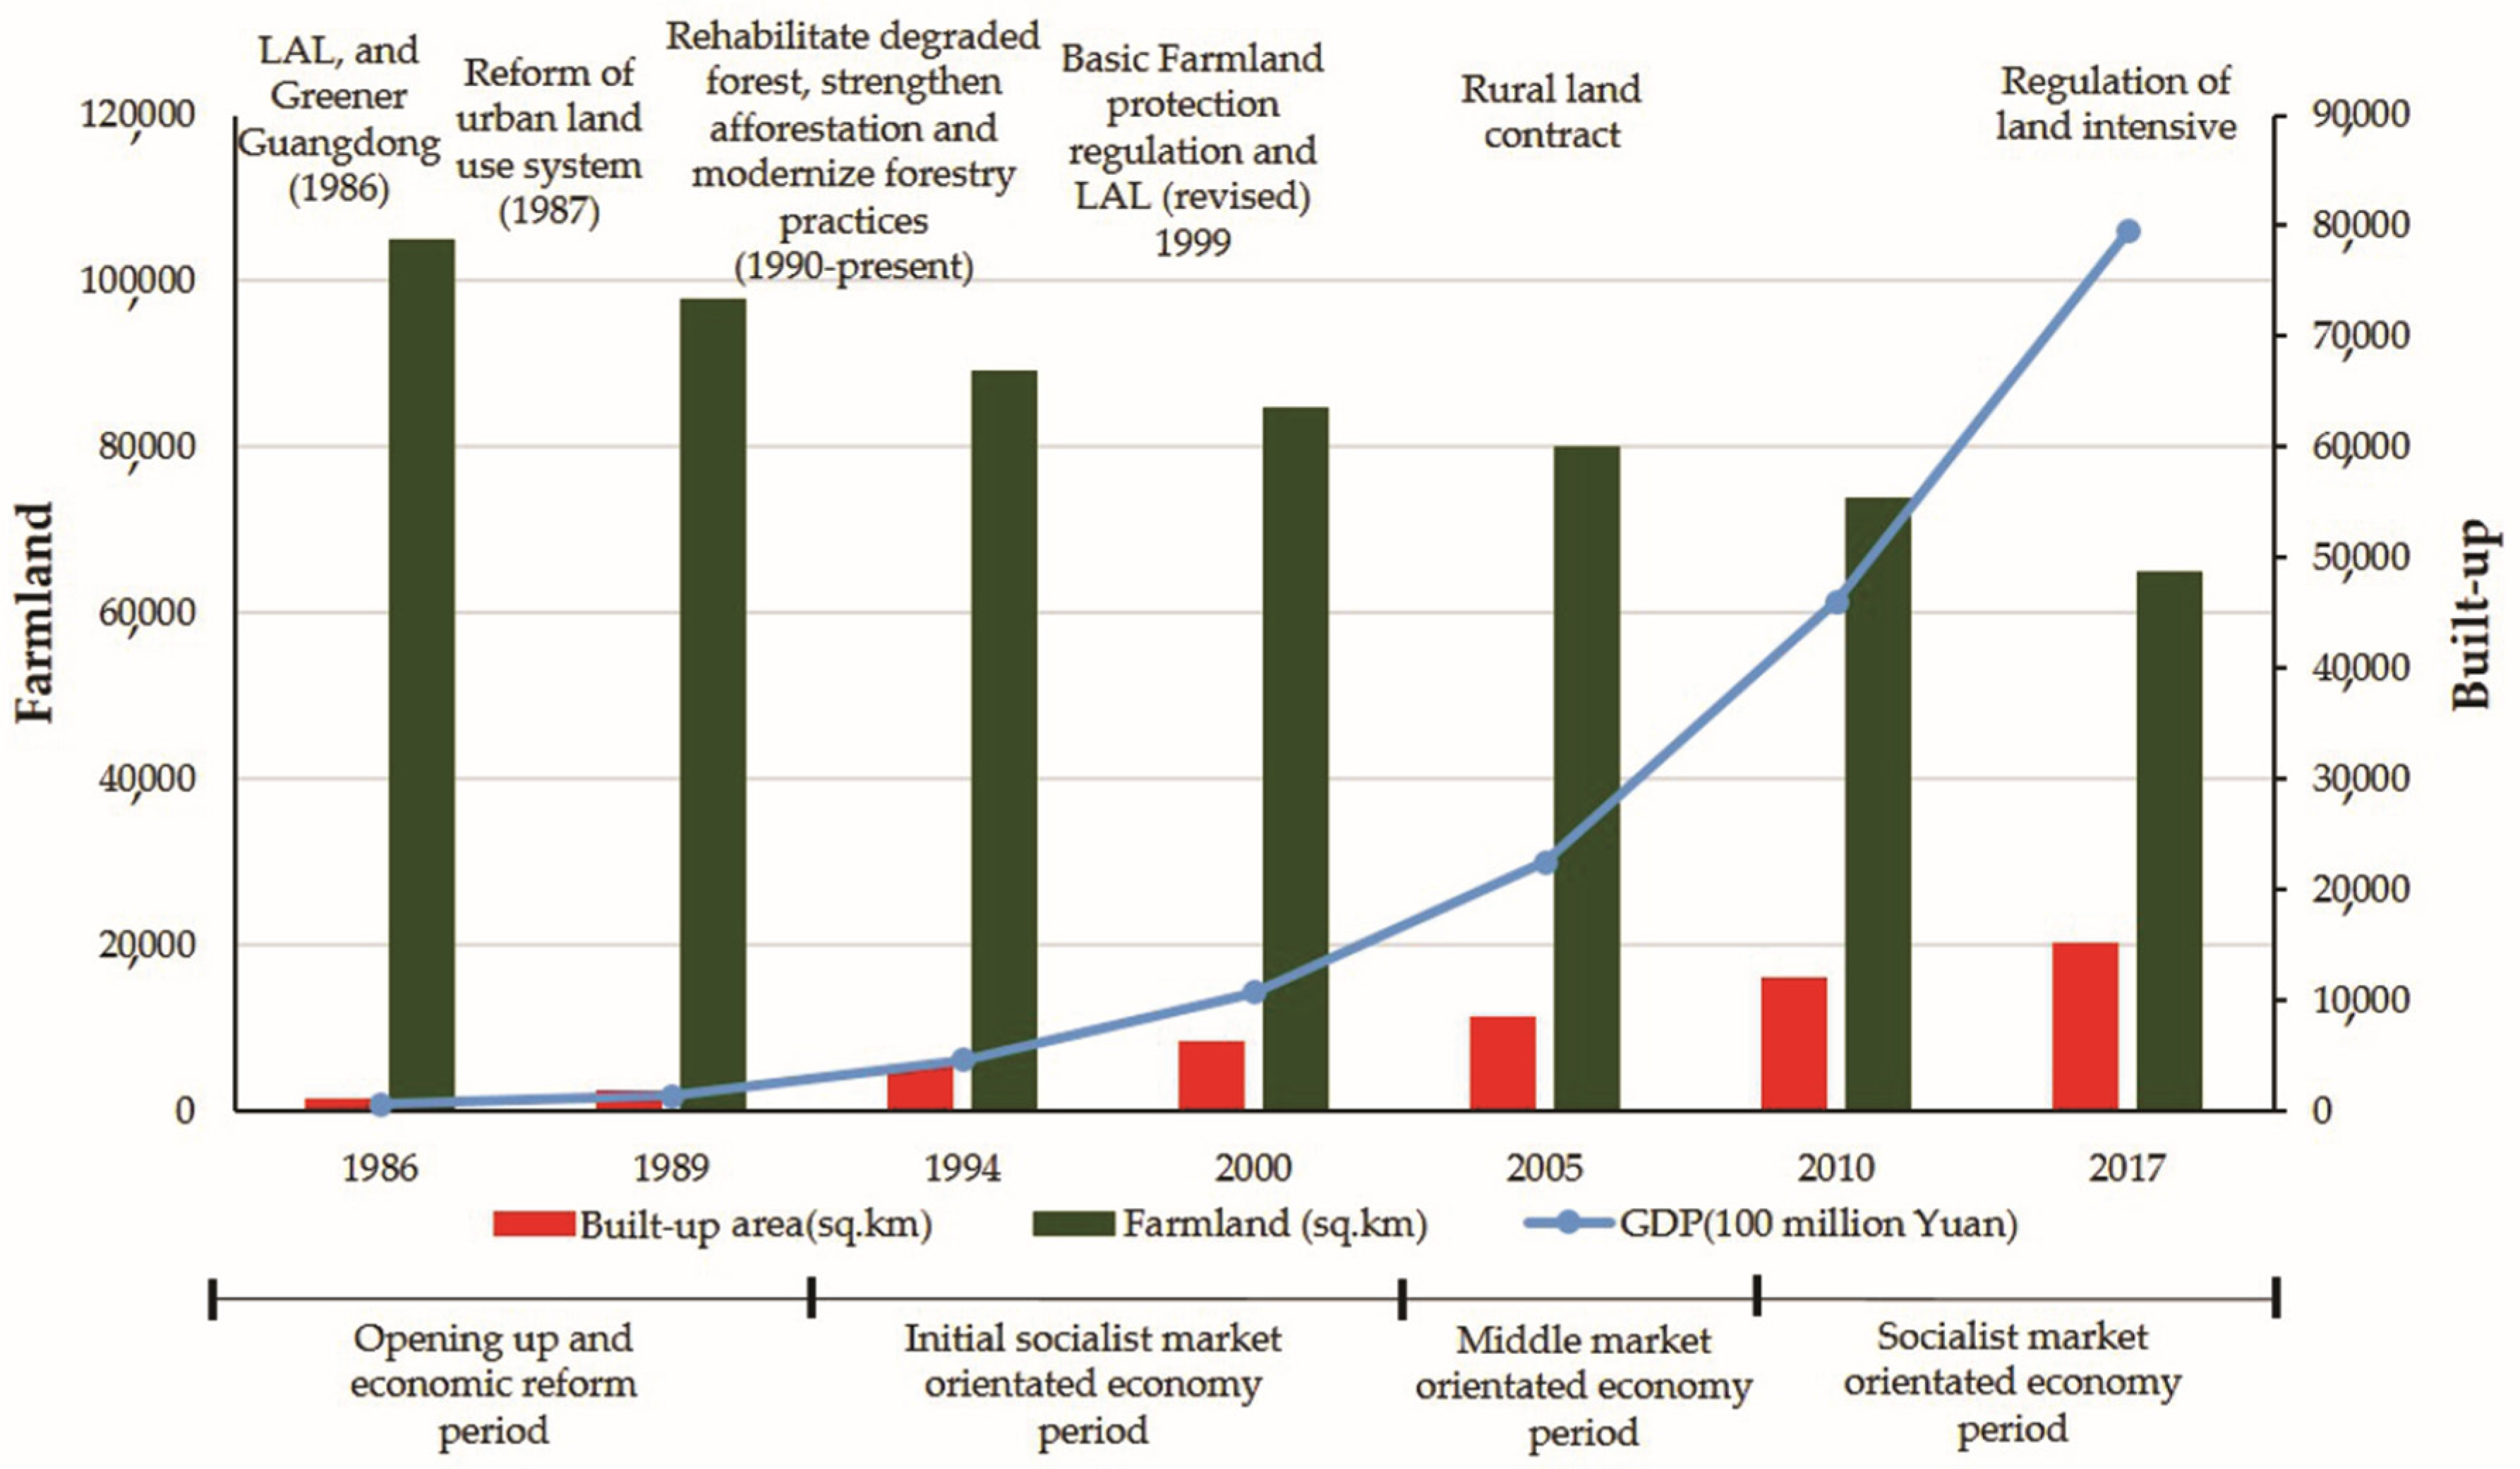
4.1. Driving Forces of LULCC: The Link Between Socioeconomic Factors and LULC

Previous studies have suggested that the processes of industrialization, urbanization, macro-economic policies, and economic fluctuations may be the major driving forces of land use and, therefore, land cover changes [39]. In the current study, the results from LULC maps (Figure 2) and NTL images (Figure 7) shows the increasing trend of built-up area. This increase in built-up area reflects that socioeconomic development and the upgrading of industrial structures affected the land use structure and the provision of land resources. During the study period, fishponds decreased to 0.85% from 1.25% and forest cover increased to 45.02% from 33.24% (Figure 2). GHKM shows the relationship between the different periods of modernization and the relationships with political movements, socioeconomic development, and urbanization (Table 6). The year 1986 marked the beginning of the economic “soft landing” that was intended to control unconstrained growth in the initial reform period. However, the years 1996 and 1997 marked the beginning of administrative changes that required approved integrated land use planning (LUO) at both regional and county levels and a shift to regional urbanization and pro-urbanization [38] in the development policy [38]. The detected LULCC results reveal a close relationship between urbanization and socioeconomic activities.
The primary reason for urbanization is the land price differences between cities and downtown areas. The land prices of rural and backward areas were almost half, or even less than, that of established urban areas. This huge difference in land prices attracted investors to install their industries in commercially backward areas and towns. It also created the mixed land use patterns in which villages were absorbed within cities and cities imposed on villages. In so doing, the expansion of urban areas into the surrounding rural areas created strong pressure on farmland and provided an open space for conversion to other land types [17]. Mixed land use patterns are more pronounced in highly populated regions, further enabled by fast economic development. In circumstances of relatively cheap land, it is difficult to control expansion owing to the interest of industrial investors. This rapid industrial growth further drove the conversion of more farmland and the subsequent rise of built-up areas. Additionally, such developments are encouraged in that they provide a significant contribution to government revenue.
The increase in monthly income has increased the demand for a luxurious lifestyle. This includes beautiful, spacious, and comfortable houses and more convenient transportation. This results in an increase in demand for urban land. Thus, urban sprawl and economic development have moved the GHKM away from an agrarian society. The light index has also delineated the land use policies that have been the product of political, economic, and social conditions in different periods of modernization and development since the opening of reform (Table 6) [38]. Over the last three decades, economic growth is reflected in the marked increase in GDP, total investment in fixed assets, total retail sales of consumer goods, and other socioeconomic determinants.
However, as urban land is more beneficial to the economic output of an area than areas of arable, farming, agricultural land, and bareland in the urban fringes, these land types provided obvious potential for urbanization [17,39,77]. Urban land accounts for 30–70% of government revenue [78]. The latter would probably be invested in industrialization and infrastructure projects to promote GDP growth, and, in so doing, further the corresponding urban sprawl. GHKM leads the country in retail sales and pays the most taxes to central government [76]. This causes an increase in the rate of land cover change and, subsequently, the furthering of urban expansion. This facilitated urban growth, not only in the PRD region but also in the outskirts of that region, which has been a major driving force in the reduction of farmland. The PRD, the central part of the province, became the main urbanization core, replacing the farmland of previous decades [17].
Developments in science and technology in terms of economic development have promoted urbanization. New built-up areas were mainly concentrated in the center (PRD) and on the eastern side of the study area because of their geographical location. For instance, areas of low elevation were considered suitable for urban projects and development. The geography of each area resulted in the expansion of urban areas at decreasing rates. In these two regions, farmland and fishponds were the primary contributors to new built-up areas [14,56]. By comparing the PRD urbanized area with other densely urbanized areas of the world such as the UK (7.5% built-up area), the Netherlands (11.5%), and Belgium (20%), the PRD can be described as the most rapidly urbanized region, with built-up areas rising to 10.31% over the entire study period [14]. However, it has been observed that urbanization has, to a degree, become out of control, due to the inefficiency of land use management and failure of policies. Further reasons are related to the growing industries, foreign direct investment, job opportunities, desire for a better lifestyle, facilities, and road networks, and also the uniqueness of the location, i.e., neighboring Hong Kong and Macao [10,76].

4.2. Consequence of LULCC: Farmland Reduction and Replacement

Before the “open door” policy, Guangdong was an important region, dominated by open space, and farming activities, and was the largest grain-growing region in China. It was an important production base for rice, sugar cane, and tropical fruits [14]. More than 50% of the country’s grain was grown in its southern part [39,76]. After the economic reform process initiated a surge in industry and technology, shifts in local economy, and a massive influx of overseas migrants, pressure was placed on farmland. The pressure became more serious as planning and management functions lagged behind economic development, making farmland unprotected and vulnerable [2,3,4,5,6], with the result that, during the study period, it became a consistent source of new built-up areas, in line with the performance of other similar regions [10,14,17].
The conversion of farmland to another land use type was eventually restrained by additional and different land policies and legislation. The most influential of these were the “Land Administration Law (LAL)”, the “Basic Farmland Protection Regulation (BFPR)”, the “Returning Farmland to Forest Program (RFFP)” and “The Notice on Stabilizing and Improving the Contract of Rural Land issued by central government” [39]. These programs were initiated by the government of China in 1999. These programs aimed (1) to control the expansion of urban areas, and (2) to protect farmland and its conversion. Furthermore, the aim was to promote market development and increase forest cover. According to article no. 33 of LAL, there should be no net loss of farmland. To control the urban sprawl, the stakeholders allowed the development of farmland, only if a substitute area could be developed more efficiently elsewhere in the province. There are two major benefits of these policies: (1) the control of the expansion of built-up areas, and (2) reclamation of farmland by establishing its use in other places or by changing the preference of industry regarding the use of arable areas. The basic hypotheses of the above policies were rejected due to high investment and the implementation of different development policies that led to a significant occupation of land for construction activities. The result was a constant increase in urban and rural area settlements at the cost of a large reduction of the proportion of farmland and a widening of the urban–rural gap [13,14,39,76,79]. Thus, at the above juncture, urbanization was given priority over the protection of farmland in the current stage of economic development [14].
Unfortunately, farmland being displaced to other regions would not necessarily ensure grain production, as the new sites may be less fertile, or dry and require irrigation facilities. Hence, because of a lack of land suitability, a significant decline in grain yields from 4.6 million tons to 2 million tons was seen in the early 2000s, causing adverse effects on the food production capacity. Additionally, a major shift from traditional double-season rice cropping to a single season directly caused the decrease in total grain production, even in more fertile and appropriate areas of farmland, such as in the higher areas of the PRD region. The indication is that farmers in these areas had changed the agricultural structure from food production to market-oriented farming, which included vegetables and animal husbandry. Additionally, this substantial reduction in grain yield was also due to the changes in food demands of high-income urban residents. For instance, larger sections of local communities began to consume less rice and wheat, focusing more on poultry, meat, and fish. Together with the effects of environmental pollution, which led to a serious decline in food quality, GHKM is currently facing the pressure of food security. In addition, the government is facing difficulties in maintaining a constant supply of farmland, due to rapid urbanization as indicated above. Thus, it is possible that food security problems could negatively influence the current economic development process of the whole area. China needs to independently produce grain to meet the demands of the growing population. Urbanization, however, has increased the tension between the need to protect farmland and the demand for land for development. Although it is important to improve agricultural productivity and food security, as indicated above, there is an urgent need to strictly implement the protection policies regarding the quantity and quality of farmland [14,38,39].
Irregularities and a lack of coordination with a market-oriented system have been unavoidable. Prevention tactics regarding the transfer of rural, collectively owned land by means of a market-oriented mechanism, have led to significant inequities between urban and rural activities. The policy “Proper law of 2007” has led to the phenomenon of “financing through land,” and impoverishing farmers by taking their land from them, apparently for the betterment of society, has caused an aggravation of the social divide between the urban and rural populations [38]. Thus, there appears to be a necessity to modify the previously mentioned land policies and address or remove the urban–rural gap, not only to better ensure sustainable economic development, but also to remove social division between them.

4.3. Benefits of LULCC: Forest Cover Increases

GMHK has been ahead of the country in terms of socioeconomic development and urbanization, but also in its contribution to the deterioration of the environment. To solve such problems, the government established the program “Greener Guangdong in 10 years” in 1985. By the end of 1993, 3.33 million hectares of degraded forest lands had been re-planted. To maintain this momentum, urban forestry considerations were given priority by the government. The objective was to introduce tree and shrub planting in cities to enhance the quality of life [80,81]. A focus was placed on obtaining a Greener Guangdong [14,82]. Thus, during the period of this current study (1986–2017), forest cover increased from 33.24% to 45.02%. The government’s encouragement of urban forestry was designed to play a critical role in lessening the urban–rural gap, providing more job opportunities, improving the environment, maintaining the ecological balance, beautifying urban regions [79], and controlling the expansion of cities. The increase in the pattern of urban forestry reveals an increase in the demand for forest resources in the urbanized areas and a willingness to control and preserve natural ecosystems [17].
From 1990 to the present, a wide range of forest programs were launched and implemented in GHKM, thus supporting afforestation achievements and the modernization of forestry practices. The focus was on both forest industry development (ecological forest) and plantations by adjusting tree species and forest structure to support different economic and recreational purposes. These programs also increased people’s incentives and interests regarding forestry development and encouraged the recognition of public ownership. Industrialization and urbanization, therefore, have promoted forestry development and the rehabilitation of degraded forest land in GHKM [81,83]. However, the development of urban forestry is only one strategy for solving the many problems facing cities new to the urbanization process.

4.4. Recommendation for Sustainable Development and Open Space Protection

Hong Kong can be considered reasonably successful in controlling unplanned urbanization and protecting open spaces, despite the population growth, economic development and the resulting urban sprawl to cater for them. The government should impose heavy taxes on the urban development of farmland to prevent further loss of farmland. The government needs to set up a new administrative body for the effective planning of land use. In this process, public contributions and making and executing plans for land use and sustainable development will play a dominant role. Transferring industrial activities from the PRD to lagging regions will help to reduce urban–rural inequality and increase rural household income. This would result in lessoning rural poverty. Furthermore, a detailed study at the city level is required to adapt policies more effectively and to control the negative impacts of land cover changes.

5. Conclusions

The results show that over the past three decades, GHKM, a large tropical and sub-tropical region in China, has undergone dramatic LULCC, mainly dominated by built-up land, farmland, and forest. During the study period, the built-up area has increased from 0.76% to 10.31% and farmland and fishponds decreased from 53.54% to 33.07% and from 1.25% to 0.85%, respectively. On the other hand, at the expense of the reduction of farmland and different afforestation programs, forest cover increased from 33.24% in 1986 to 45.02% in 2017. The primary reasons for such changes in land use and land cover were the development of the socioeconomic corridor, industrialization, job opportunities, urban sprawl, and different land policies. The transition of farmland to built-up area and the increase in light index reveal that urbanization provides more benefits to the government in terms of economic development. To some extent, the decrease in farmland mirrors the irreversible trends of industrialization, urbanization, and marketization. Moreover, a spatial analysis and statistical data revealed that the marked increase in GDP, total investment in fixed assets, and total retail sales of consumer goods have to a large extent led to the expansion of cities. On the other hand, there has been a loss of farmland and an increase in forest cover. Such changes have caused notable land cover changes in GHKM. These trends may also be projected into the future, such that socioeconomic developments and policies may pose a serious threat to food security. These findings revealed in this paper are designed to help policy and decision makers to analyze the relationship between socioeconomic drivers and LULCC. Also, this paper provides a scientific basis for land resource optimization, not only in GHKM but also in other parts of China.

Supplementary Materials

The following are available online at https://www.mdpi.com/2072-4292/11/14/1658/s1, Figure S1: Light index of Guangdong, Hong Kong, and Macao from 1994 to 2010. Table S1: Description of Landsat datasets scene used for land use land cover change detection. Table S2: Accuracy assessment of classified images for the years 1986, 1989, 1994, 2000, 2005, 2010, and 2017 (where, F = Forest, G = Grassland, W = Water, FP = Fishpond, BU = Built-up, BL = Bareland, and FL = Farmland). Table S3: Change detection matrix of land use land cover during different time period (percentage).

Author Contributions

Formal analysis, S.H. and S.A.; Investigation, S.H.; Methodology, S.H.; Resources, S.H.; Supervision, W.S.; Writing—original draft, S.H.; Writing—review & editing, S.H., W.S., X.Z., and S.A.

Funding

This research was supported by Ministry of Science and Technology of the People’s Republic of China, grant number 2017YFB0503604; The Hong Kong Polytechnic University, grant number 4-9A6X, 1-ZVN6 and 1-ZE6Q; and Research Grant Council, HKSAR, grant number B-Q61E.

Acknowledgments

The authors would like to thank USGS Earth Explorer for Landsat data, the National Oceanic and Atmospheric Administration (NOAA), and the Defense Meteorological Satellite Program/Operational Linescan System (DMSP/OLS) for NTL annual composite images. The authors would also like to thank Mr. Pandey Bhartendu and Mr. Usman Ahmed Khan for their valuable help in correcting nighttime light data. The authors would also like to thanks the anonymous reviewers for their insightful comments and substantial help on improving this article.

Conflicts of Interest

The authors declare no conflicts of interest.

References

  1. Mooney, H.A.; Duraiappah, A.; Larigauderie, A. Evolution of natural and social science interactions in global change research programs. Proc. Natl. Acad. Sci. USA 2013, 110, 3665–3672. [Google Scholar] [CrossRef] [PubMed] [Green Version]
  2. Liu, J.; Kuang, W.; Zhang, Z.; Xu, X.; Qin, Y.; Ning, J.; Zhou, W.; Zhang, S.; Li, R.; Yan, C.; et al. Spatiotemporal characteristics, patterns, and causes of land-use changes in China since the late 1980s. J. Geogr. Sci. 2014, 24, 195–210. [Google Scholar] [CrossRef]
  3. Tian, H.; Chen, G.; Zhang, C.; Liu, M.; Sun, G.; Chappelka, A.; Ren, W.; Xu, X.; Lu, C.; Pan, S.; et al. Century-Scale Responses of Ecosystem Carbon Storage and Flux to Multiple Environmental Changes in the Southern United States. Ecosystems 2012, 15, 674–694. [Google Scholar] [CrossRef] [Green Version]
  4. Dou, P.; Chen, Y. Dynamic monitoring of land-use/land-cover change and urban expansion in Shenzhen using Landsat imagery from 1988 to 2015. Int. J. Remote Sens. 2017, 38, 5388–5407. [Google Scholar] [CrossRef]
  5. Wu, Y.; Li, S.; Yu, S. Monitoring urban expansion and its effects on land use and land cover changes in Guangzhou city, China. Environ. Monit. Assess. 2016, 188, 54. [Google Scholar] [CrossRef] [PubMed]
  6. Salih, A.A.M.; Ganawa, E.-T.; Elmahl, A.A. Spectral mixture analysis (SMA) and change vector analysis (CVA) methods for monitoring and mapping land degradation/desertification in arid and semiarid areas (Sudan), using Landsat imagery. Egypt. J. Remote Sens. Sp. Sci. 2017, 20, S21–S29. [Google Scholar] [CrossRef]
  7. Yu, W.; Zhou, W.; Qian, Y.; Yan, J. A new approach for land cover classification and change analysis: Integrating backdating and an object-based method. Remote Sens. Environ. 2016, 177, 37–47. [Google Scholar] [CrossRef]
  8. Zhu, Z.; Fu, Y.; Woodcock, C.E.; Olofsson, P.; Vogelmann, J.E.; Holden, C.; Wang, M.; Dai, S.; Yu, Y. Including land cover change in analysis of greenness trends using all available Landsat 5, 7 and 8 images: A case study from Guangzhou, China (2000–2014). Remote Sens. Environ. 2016, 185, 243–257. [Google Scholar] [CrossRef]
  9. Zhu, Z.; Woodcock, C.E. Continuous change detection and classification of land cover using all available Landsat data. Remote Sens. Environ. 2014, 144, 152–171. [Google Scholar] [CrossRef] [Green Version]
  10. Fan, F.; Weng, Q.; Wang, Y. Land Use and Land Cover Change in Guangzhou, China, from 1998 to 2003, Based on Landsat TM/ETM+ Imagery. Sensors 2007, 7, 1323–1342. [Google Scholar] [CrossRef]
  11. Li, C.; Kuang, Y.; Huang, N.; Zhang, C. The long-term relationship between population growth and vegetation cover: An empirical analysis based on the panel data of 21 cities in Guangdong province, China. Int. J. Environ. Res. Public Health 2013, 10, 660–677. [Google Scholar] [CrossRef] [PubMed]
  12. Li, X.; Yeh, A.G. Analyzing spatial restructuring of land use patterns in a fast growing region using remote sensing and GIS. Landsc. Urban Plan. 2004, 69, 335–354. [Google Scholar] [CrossRef]
  13. Lin, G.C.S.; Ho, S.P.S. China’s land resources and land-use change: Insights from the 1996 land survey. Land Use Policy 2003, 20, 87–107. [Google Scholar] [CrossRef]
  14. Du, S.; Shi, P.; Van Rompaey, A. The Relationship between Urban Sprawl and Farmland Displacement in the Pearl River Delta, China. Land 2014, 3, 34–51. [Google Scholar] [CrossRef]
  15. Jiang, C.; Wu, Z. Impacts of urbanization on net primary productivity in the Pearl River Delta, China. Int. J. Plant Prod. 2015, 9, 581–598. [Google Scholar]
  16. Hu, J.; Zhang, Y. Seasonal change of land-use/land-cover (LULC) detection using modis data in rapid urbanization regions: A case study of the pearl river delta region (China). IEEE J. Sel. Top. Appl. Earth Obs. Remote Sens. 2013, 6, 1913–1920. [Google Scholar] [CrossRef]
  17. Li, L.; Wang, Y. Land Use/Cover Change from 2001 to 2010 and its Socioeconomic Determinants in Guangdong Province, a Rapid Urbanization Area of China. J. Agric. Sci. 2015, 86. [Google Scholar] [CrossRef]
  18. Wenhua, L. Degradation and restoration of forest ecosystems in China. For. Ecol. Manag. 2004, 201, 33–41. [Google Scholar] [CrossRef]
  19. Dewan, A.M.; Yamaguchi, Y. Land use and land cover change in Greater Dhaka, Bangladesh: Using remote sensing to promote sustainable urbanization. Appl. Geogr. 2009, 29, 390–401. [Google Scholar] [CrossRef]
  20. Al-Bakri, J.T.; Duqqah, M.; Brewer, T. Application of Remote Sensing and GIS for Modeling and Assessment of Land Use/Cover Change in Amman/Jordan. J. Geogr. Inf. Syst. 2013, 5, 509–519. [Google Scholar] [CrossRef] [Green Version]
  21. Seto, K.C.; Woodcock, C.E.; Song, C.; Huang, X.; Lu, J.; Kaufmann, R.K. Monitoring land-use change in the Pearl River Delta using Landsat TM. Int. J. Remote Sens. 2002, 23, 1985–2004. [Google Scholar] [CrossRef]
  22. Özyavuz, M.; Onur, Ş.; Bilgili, B.C. A change vector analysis technique to monitor land-use/land-cover in the yildiz mountains, Turkey. Fresenius Environ. Bulletin 2011, 20, 1190–1199. [Google Scholar]
  23. Treitz, P.M.; Howarth, P.J.; Gong, P. Application of satellite and GIS technologies for land-cover and land-se mapping at the rural-urban fringe: A case study. Photogramm. Eng. Remote Sens. 1992, 58, 439–448. [Google Scholar]
  24. Xu, H.; Wang, X.; Xiao, G. A remote sensing and GIS integrated study on urbanization with its impact on arable lands: Fuqing City, Fujian Province, China. Land. Degrad. Dev. 2000, 11, 301–314. [Google Scholar] [CrossRef]
  25. Xiao, J.; Shen, Y.; Ge, J.; Tateishi, R.; Tang, C.; Liang, Y.; Huang, Z. Evaluating urban expansion and land use change in Shijiazhuang, China, by using GIS and remote sensing. Landsc. Urban Plan. 2006, 75, 69–80. [Google Scholar] [CrossRef]
  26. Dewan, A.M.; Corner, R.J. Spatiotemporal Analysis of Urban Growth, Sprawl and Structure. In Dhaka Megacity; Dewan, A., Corner, R., Eds.; Springer: Dordrecht, The Netherlands, 2014; pp. 99–121. ISBN 978-94-007-6735-5. [Google Scholar]
  27. Poelmans, L.; Van Rompaey, A. Detecting and modelling spatial patterns of urban sprawl in highly fragmented areas: A case study in the Flanders-Brussels region. Landsc. Urban Plan. 2009, 93, 10–19. [Google Scholar] [CrossRef]
  28. Haque, M.I.; Basak, R. Land cover change detection using GIS and remote sensing techniques: A spatio-temporal study on Tanguar Haor, Sunamganj, Bangladesh. Egypt. J. Remote Sens. Sp. Sci. 2017, 20, 251–263. [Google Scholar] [CrossRef]
  29. Hussain, M.; Chen, D.; Cheng, A.; Wei, H.; Stanley, D. Change detection from remotely sensed images: From pixel-based to object-based approaches. ISPRS J. Photogramm. Remote Sens. 2013, 80, 91–106. [Google Scholar] [CrossRef]
  30. Seto, K.C.; Fragkias, M. Quantifying spatiotemporal patterns of urban land-use change in four cities of China with time series landscape metrics. Landsc. Ecol. 2005, 20, 871–888. [Google Scholar] [CrossRef]
  31. Chen, J.; Gong, P.; He, C.; Pu, R.; Shi, P. Land-Use/Land-Cover Change Detection Using Improved Change-Vector Analysis. Photogramm. Eng. Remote Sens. 2003, 69, 369–379. [Google Scholar] [CrossRef] [Green Version]
  32. Fan, F.; Wang, Y.; Wang, Z. Temporal and spatial change detecting (1998–2003) and predicting of land use and land cover in Core corridor of Pearl River Delta (China) by using TM and ETM+ images. Environ. Monit. Assess. 2008, 137, 127–147. [Google Scholar] [CrossRef]
  33. Dai, J.; Wang, K.; Gao, X. Spatial structure and land use control in Extended Metropolitan Region of Zhujiang River Delta, China. Chin. Geogr. Sci. 2010, 20, 298–308. [Google Scholar] [CrossRef]
  34. Weng, Q. Land use change analysis in the Zhujiang Delta of China using satellite remote sensing, GIS and stochastic modelling. J. Environ. Manag. 2002, 64, 273–284. [Google Scholar] [CrossRef] [Green Version]
  35. Sodango, T.H.; Sha, J.; Li, X. Land Use/Land Cover Change (LULCC) in China, Review of Studies. Int. J. Sci. Eng. Res. 2017, 8, 943–958. [Google Scholar]
  36. Ma, Y.; Xu, R. Remote sensing monitoring and driving force analysis of urban expansion in Guangzhou City, China. Habitat Int. 2010, 34, 228–235. [Google Scholar] [CrossRef]
  37. Seto, K.C.; Kaufmann, R.K. Modeling the Drivers of Urban Land Use Change in the Pearl River Delta, China: Integrating Remote Sensing with Socioeconomic Data. Land Econ. 2003, 79, 106–121. [Google Scholar] [CrossRef] [Green Version]
  38. Wang, J.; Lin, Y.; Glendinning, A.; Xu, Y. Land-use changes and land policies evolution in China’s urbanization processes. Land Use Policy 2018, 75, 375–387. [Google Scholar] [CrossRef]
  39. Wang, J.; Chen, Y.; Shao, X.; Zhang, Y.; Cao, Y. Land-use changes and policy dimension driving forces in China: Present, trend and future. Land Use Policy 2012, 29, 737–749. [Google Scholar] [CrossRef]
  40. Zhang, H.; Chen, Y.; Zhou, J. Assessing the long-term impact of urbanization on run-off using a remote-sensing-supported hydrological model. Int. J. Remote Sens. 2015, 36, 5336–5352. [Google Scholar] [CrossRef]
  41. Mountrakis, G.; Im, J.; Ogole, C. Support vector machines in remote sensing: A review. ISPRS J. Photogramm. Remote Sens. 2011, 66, 247–259. [Google Scholar] [CrossRef]
  42. Liu, Q.; Guo, Y.; Liu, G.; Zhao, J. Classification of landsat 8 OLI image using support vector machine with tasseled cap transformation. In Proceedings of the 2014 10th International Conference on Natural Computation (ICNC), Xiamen, China, 19–21 August 2014; IEEE: Piscataway, NJ, USA, 2014; pp. 670–674. [Google Scholar]
  43. Bahari, N.I.S.; Ahmad, A.; Aboobaider, B.M. Application of support vector machine for classification of multispectral data. IOP Conf. Ser. Earth Environ. Sci. 2014, 20. [Google Scholar] [CrossRef]
  44. Pal, M.; Mather, P.M. Support vector machines for classification in remote sensing. Int. J. Remote Sens. 2005, 26, 1007–1011. [Google Scholar] [CrossRef]
  45. Ustuner, M.; Sanli, F.B.; Dixon, B. Application of support vector machines for landuse classification using high-resolution rapideye images: A sensitivity analysis. Eur. J. Remote Sens. 2015, 48, 403–422. [Google Scholar] [CrossRef]
  46. Gidudu, A.; Hulley, G.; Marwala, T. Classification of Images Using Support Vector Machines. arXiv 2007, arXiv:0709.3967v1. [Google Scholar]
  47. Candade, N.; Dixon, D.B. Multispectral Classification of Landsat Images: A Comparison of Support Vector Machine and Neural Network Classifiers. In Proceedings of the ASPRS Annual Conference Proceeding, Denver, CO, USA, 23–28 May 2004; p. 12. [Google Scholar]
  48. Mohammadimanesh, F.; Salehi, B.; Mahdianpari, M.; Motagh, M.; Brisco, B. An Efficient Feature Optimization for Wetland Mapping by Synergistic Use of SAR Intensity, Interferometry, and Polarimetry Data. Int. J. Appl. Earth Obs. Geoinf. 2018, 73, 450–462. [Google Scholar] [CrossRef]
  49. Griffiths, P.; Hostert, P.; Gruebner, O.; van der Linden, S. Mapping megacity growth with multi-sensor data. Remote Sens. Environ. 2010, 114, 426–439. [Google Scholar] [CrossRef]
  50. Huang, C.; Song, K.; Kim, S.; Townshend, J.R.G.; Davis, P.; Masek, J.G.; Goward, S.N. Use of a dark object concept and support vector machines to automate forest cover change analysis. Remote Sens. Environ. 2008, 112, 970–985. [Google Scholar] [CrossRef]
  51. Hao, M.; Shi, W.; Deng, K.; Zhang, H.; He, P. An Object-Based Change Detection Approach Using Uncertainty Analysis for VHR Images. J. Sens. 2016, 2016, 1–17. [Google Scholar] [CrossRef]
  52. Megahed, Y.; Cabral, P.; Silva, J.; Caetano, M. Land Cover Mapping Analysis and Urban Growth Modelling Using Remote Sensing Techniques in Greater Cairo Region—Egypt. ISPRS Int. J. Geo-Inf. 2015, 4, 1750–1769. [Google Scholar] [CrossRef]
  53. Devadas, R.; Denham, R.J.; Pringle, M. Support Vector Machine Classification of Object-Based Data for Crop Mapping, Using Multi-Temporal Landsat Imagery. ISPRS Int. Arch. Photogramm. Remote Sens. Spat. Inf. Sci. 2012, XXXIX-B7, 185–190. [Google Scholar] [CrossRef]
  54. Xiowei, X.; Xiangxin, C.; Jianfu, Y. Guangdong Statistics Yearbook 2017; China Statistics Press: Beijing, China, 2017. [Google Scholar]
  55. Shobairi, S.O.; Li, M. Dynamic Modelling of VFC from 2000 to 2010 Using NDVI and DMSP/OLS Time Series: A Study in Guangdong Province, China. J. Geogr. Inf. Syst. 2016, 8, 205–223. [Google Scholar] [CrossRef] [Green Version]
  56. Chen, Y.; Li, X.; Liu, X.; Ai, B. Analyzing land-cover change and corresponding impacts on carbon budget in a fast developing sub-tropical region by integrating MODIS and Landsat TM/ETM+ images. Appl. Geogr. 2013, 45, 10–21. [Google Scholar] [CrossRef]
  57. USGS Earth Explorer. Available online: https://earthexplorer.usgs.gov/ (accessed on 28 February 2018).
  58. National Centers for Environmental Information. Available online: https://ngdc.noaa.gov/eog/dmsp/downloadV4composites.html (accessed on 7 July 2018).
  59. Shi, K.; Chen, Y.; Yu, B.; Xu, T.; Li, L.; Huang, C.; Liu, R.; Chen, Z.; Wu, J. Urban Expansion and Agricultural Land Loss in China: A Multiscale Perspective. Sustainability 2016, 8, 790. [Google Scholar] [CrossRef]
  60. Li, X.; Zhou, Y. Urban mapping using DMSP/OLS stable night-time light: A review. Int. J. Remote Sens. 2017. [Google Scholar] [CrossRef]
  61. Pandey, B.; Joshi, P.K.; Seto, K.C. Monitoring urbanization dynamics in India using DMSP/OLS night time lights and SPOT-VGT data. Int. J. Appl. Earth Obs. Geoinf. 2013, 23, 49–61. [Google Scholar] [CrossRef]
  62. Faouzi, B.; Washaya, P. Tracking dynamic changes and monitoring socioeconomic parameters in Algeria between 1993 and 2012, using nighttime light remote sensing. In Proceedings of the the International Archives of the Photogrammetry, Remote Sensing and Spatial Information Sciences, Wuhan, China, 18–22 September 2017; Volume XLII, pp. 18–22. [Google Scholar]
  63. Elvidge, C.; Hsu, F.-C.; Baugh, K.; Ghosh, T. National Trends in Satellite-Observed Lighting: 1992–2012. In Global Urban Monitoring and Assessment through Earth Observation; CRC Press: Boca Raton, FL, USA, 2014; pp. 97–120. [Google Scholar]
  64. Jiang, W.; He, G.; Long, T.; Wang, C.; Ni, Y.; Ma, R. Assessing Light Pollution in China Based on Nighttime Light Imagery. Remote Sens. 2017, 9, 135. [Google Scholar] [CrossRef]
  65. Zhang, Q.; Seto, K.C. Mapping urbanization dynamics at regional and global scales using multi-temporal DMSP/OLS nighttime light data. Remote Sens. Environ. 2011, 115, 2320–2329. [Google Scholar] [CrossRef]
  66. Burges, C.J. A Tutorial on Support Vector Machines for Pattern Recognition. Data Min. Knowl. Discov. 1998, 2, 121–167. [Google Scholar] [CrossRef]
  67. Rimal, B.; Zhang, L.; Keshtkar, H.; Haack, B.; Rijal, S.; Zhang, P. Land Use/Land Cover Dynamics and Modeling of Urban Land Expansion by the Integration of Cellular Automata and Markov Chain. ISPRS Int. J. Geo-Inf. 2018, 7, 154. [Google Scholar] [CrossRef]
  68. Abbas, S.; Nichol, J.E.; Wong, M.S. Object-based, multi-sensor habitat mapping of successional age classes for effective management of a 70-year secondary forest succession. Land Use Policy 2018, 1–10. [Google Scholar] [CrossRef]
  69. Lillesand, T.; Kiefer, R.W.; Chipman, J.W. Remote Sensing and Image Interpretation, 6th ed.; John Wiley & Sons: Hoboken, NJ, USA, 2008. [Google Scholar]
  70. Resources and Environment Data Cloud Platform. Available online: http://www.resdc.cn/Default.aspx (accessed on 10 September 2018).
  71. Pontius, R.G.; Shusas, E.; McEachern, M. Detecting important categorical land changes while accounting for persistence. Agric. Ecosyst. Environ. 2004, 101, 251–268. [Google Scholar] [CrossRef]
  72. Puyravaud, J. Standardizing the calculation of the annual rate of deforestation. Ecol. Manag. 2003, 177, 593–596. [Google Scholar] [CrossRef]
  73. Teferi, E.; Bewket, W.; Uhlenbrook, S.; Wenninger, J. Understanding recent land use and land cover dynamics in the source region of the Upper Blue Nile, Ethiopia: Spatially explicit statistical modeling of systematic transitions. Agric. Ecosyst. Environ. 2013, 165, 98–117. [Google Scholar] [CrossRef]
  74. Wei, Y.; Liu, H.; Song, W.; Yu, B.; Xiu, C. Normalization of time series DMSP-OLS nighttime light images for urban growth analysis with pseudo invariant features. Landsc. Urban Plan. 2014, 128, 1–13. [Google Scholar] [CrossRef]
  75. Zhang, Q.; Pandey, B.; Seto, K.C. A Robust Method to Generate a Consistent Time Series from DMSP/OLS Nighttime Light Data. IEEE Trans. Geosci. Remote Sens. 2016, 54, 5821–5831. [Google Scholar] [CrossRef]
  76. Ramakrishnan, P.S.; George, P.S.; Kulkarni, S.; Vashishtha, P.S.; Shidong, Z.; Qiguo, Z.; Wenmei, C.; Yi, Z.; Wolman, M.G.; Long, J.F.; et al. Growing Populations, Changing Landscapes; National Academies Press: Washington, DC, USA, 2001; ISBN 978-0-309-07554-1. [Google Scholar]
  77. Liu, Z.; Huang, H.; Werners, S.E.; Yan, D. Construction area expansion in relation to economic-demographic development and land resource in the Pearl River Delta of China. J. Geogr. Sci. 2016, 26, 188–202. [Google Scholar] [CrossRef]
  78. Ng, M.K.; Hang Hui, D.L. Practice report: Sustainability impact assessment in Hong Kong and the Pearl River Delta: “both necessary and impossible”? Impact Assess. Proj. Apprais. 2007, 25, 233–238. [Google Scholar] [CrossRef]
  79. Bai, X.; Chen, J.; Shi, P. Landscape Urbanization and Economic Growth in China: Positive Feedbacks and Sustainability Dilemmas. Environ. Sci. Technol. 2012, 46, 132–139. [Google Scholar] [CrossRef] [PubMed]
  80. Bui, T.; Yang, D.; Jones, W.; Li, J. China’s Economic Powerhouse: Economic Reform in Guangdong Province; Palgrave Macmillan: New York, NY, USA, 2003. [Google Scholar]
  81. Chokkalingam, U.; Zhou, Z.; Toma, T. Learning Lessons from China’s Forest Rehabilitation Efforts National Level Review and Special Focus on Guangdong Province; Center for International Forestry Research: Jakarta, Indonesia, 2006; ISBN 9792446672. [Google Scholar]
  82. Trac, C.J.; Schmidt, A.H.; Harrell, S.; Hinckley, T.M. Is the Returning Farmland to Forest Program a Success? Three Case Studies from Sichuan. Environ. Pr. 2013, 15, 350–366. [Google Scholar] [CrossRef]
  83. Peng, S.; Hou, Y.; Chen, B. Vegetation Restoration and Its Effects on Carbon Balance in Guangdong Province, China. Restor. Ecol. 2008, 17, 487–494. [Google Scholar] [CrossRef]
Figure 1. Location map of Guangdong, Hong Kong, and Macao.
Remotesensing 11 01658 g001
Figure 2. Land use land cover classification map of Guangdong, Hong Kong, and Macao from 1986 to 2017.
Remotesensing 11 01658 g002
Figure 3. Area distribution of different land use land cover classes and change trends in Guangdong, Hong Kong, and Macao from 1986 to 2017: (a) land use land cover area of forest, water, built-up land, and farmland; (b) land use land cover change trends in forest, water, built-up land, and farmland; (c) land use land cover area of grassland, fishponds, and bareland; and (d) land use land cover change trends in grassland, fishponds, and bareland.
Remotesensing 11 01658 g003
Figure 4. Relative land use change at prefecture (city) level in (A) built-up, (B) farmland, and (C) forest.
Remotesensing 11 01658 g004
Figure 5. Summary of land policies, gross domestic product, urban area (urbanization), and farmland trend in different economic development periods from 1986 to 2017 (where, LAL = Land administration Law).
Remotesensing 11 01658 g005
Figure 6. Changes of gross domestic product in each city of Guangdong, Hong Kong, and Macao.
Remotesensing 11 01658 g006
Figure 7. Night light urban expansion images of the study area for the years 1994, 2000, 2005, and 2010.
Remotesensing 11 01658 g007
Figure 8. The correlation between (a) fixed assets and built-up area (1986−2017), (b) GDP and population (1986−2017), (c) farmland and population (1986−2017), (d) light index and urban area (1994−2010), (e) light index and population (1994−2010), and (f) light index and socioeconomic indicators (1994−2010).
Remotesensing 11 01658 g008
Table 1. Description of land use land cover classes.
ClassDescriptionAbbreviation
ForestForest, tree coverF
GrasslandNatural shrubs and grasslandG
WaterNatural water bodies, oceans, lakes, rivers, and reservoir. Water bodies that are not used for intensive aquacultureW
FishpondsWater bodies that are used for intensive aquaculture. Dike pond, including mulberryFP
Built-upLand covered by buildings and other man-made structuresBU
BarelandExposed soil, sand, rocks, landfill sites, areas of active excavationBL
FarmlandLand used for farming, cropland, orchardsFL
Table 2. The annual rate of change of each class as a percentage.
1986–19891989–19941994–20002000–20052005–20102010–20171986–2017
(% Change Per Year)
Forest2.951.230.580.420.750.860.98
Grassland−19.026.51−8.2111.96−21.005.10−2.69
Water0.19−0.02−0.19−0.500.060.30−0.02
Fishponds6.084.94−1.36−2.02−4.94−5.51−1.24
Built-up19.1514.377.216.266.933.178.41
Bareland−21.4013.36−17.0824.64−29.473.45−3.22
Farmland−2.38−1.83−0.86−1.16−1.60−1.85−1.55
Table 3. Socioeconomic indicators of Guangdong, Hong Kong, and Macao.
1986198919942000200520102017
Gross Domestic Product (100 million Yuan)667.531381.394619.0210,741.2522,557.3746,036.2579,512.05
Primary Industry188.37351.73692.25986.321428.272286.983694.37
Secondary Industry255.88554.132253.254999.5111,356.6022,821.7734,001.31
Tertiary Industry223.28475.531673.524755.429772.5020,927.5041,816.37
Total Population
(10,000 persons)
5740.706024.986691.467498.547899.648521.559164.90
Total Investment in
Fixed Assets
(100 million yuan)
216.50347.342141.153233.707164.1116,113.1933,008.86
Government Revenue (100 million yuan)82.41136.87298.70910.561807.204517.0410,390.35
Gross Agricultural output value (100 million yuan)279.15548.601151.381701.182447.573754.866078.43
Gross Industrial output value (100 million yuan)632.891647.247273.9516,904.4741,661.7493,462.97144,926.10
Total Retail Sales of Consumer Good (100 million yuan)327.02636.151991.334379.817915.5117,458.4434,739.00
Table 4. Population growth rate during different period.
1986−19891989−19941994−20002000−20052005−20102010−2017
Population growth rate (%)4.9511.0612.065.357.877.55
Table 5. Light index of the study area for the years 1994, 2000, 2005, and 2010.
YearLight IndexNTL* Built-Up Area (km2)AverageSDV **
19943.42786053.004.77
20004.40102452.844.90
20056.2115,10454.274.53
20108.3817,43155.344.07
* NTL = nighttime light, ** SDV = Standard deviation.
Table 6. Changing land use policies from 1978 to 2017.
YearsPeriodsLand Use PoliciesIssues
1978−1991Opening up and economic reformLocal entrepreneurshipInitial productivity but effect development of town and village enterprises
1992−2002Initial period of the socialist market-oriented economyFarmland protection and land-use planningConflict over farmland protection and land development
2003−2008Mid-term of the socialist market-oriented economyUrbanization and regional development
Regulating land markets, use rights and property law
Uneven urban-rural and regional social and economic development
2009−nowSocialist market-oriented economyIntensive land use under construction of civilization
Regulating land markets, use rights and property
Conflict over farmland conversion, protection and land development
Uneven urban–rural and regional social and economic development

