Abstract
Object detection is a significant and challenging problem in the study area of remote sensing and image analysis. However, most existing methods are easy to miss or incorrectly locate objects due to the various sizes and aspect ratios of objects. In this paper, we propose a novel end-to-end Adaptively Aspect Ratio Multi-Scale Network (ARMNet) to solve this problem. On the one hand, we design a multi-scale feature gate fusion network to adaptively integrate the multi-scale features of objects. This network is composed of gate fusion modules, refine blocks and region proposal networks. On the other hand, an aspect ratio attention network is leveraged to preserve the aspect ratios of objects, which alleviates the excessive shape distortions of objects caused by aspect ratio changes during training. Experiments show that the proposed ARMNet significantly outperforms the previous state of the arts on the DOTA dataset, NWPU VHR-10 dataset, RSOD dataset and UCAS-AOD dataset by , , and , respectively.
1. Introduction
With the rapid development and progress of remote sensing technology, object detection in remote sensing images has attracted more and more attention from researchers owing to its wide application in many areas, such as urban planning [1], resource and environment survey [2], and traffic control [3]. Nevertheless, it is still a challenging task to achieve accurate object detection because the targets usually appear with diverse sizes and aspect ratios in remote sensing images. For example, as shown in Figure 1, the vehicle objects are small while the harbor objects are large and their aspect ratios differ significantly.
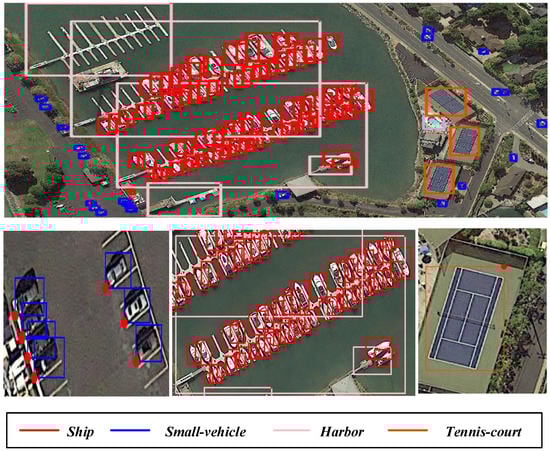
Figure 1.
An example of annotated image from the DOTA dataset [4]. The annotated image is placed on the top. Some enlarged subfigures containing objects are exhibited on the bottom. As shown in Figure 1, there is a significant difference in sizes, e.g., small-vehicles/ships and harbors, and aspect ratios, e.g., small-vehicles and tennis-courts/harbors.
Existing methods have made a great effort to overcome this challenge in three ways. The first way is to use the image/sliding window pyramids at input. Zhang et al. [5,6] resized the input image to multiple scales, and extracted image features on each scale. Yao et al. [7,8,9] used multi-scale sliding windows and different step sizes to sample each training image for generating potential candidate boxes. However, it is difficult to meet the requirements of practical applications because these methods usually expend more computation and memory.
The second way is mainly based on various multi-scale features of manual design, such as SIFT [10], HOG [11], BOW [12] etc. Beril et al. [13] used SIFT keypoints and graph theory to detect the urban areas and buildings. Shi et al. [14,15] combined the Circle Frequency features with the HOG features to characterize the appearances and shapes of objects. Sun et al. [16] proposed a spatial sparse coding BOW model to construct the visual vocabulary by clustering local features (e.g., SIFT, HOG). This model encoded local features into a global representation, which was more effective than the first two methods. However, these methods all depend on hand-designed features, which make it difficult to achieve satisfactory performance since they are extracted according to the human experience and lack of representativeness.
The third way uses semantic features extracted by a convolution neural network (CNN) to detect objects of various sizes and aspect ratios. Chen et al. [17] presented a hybrid deep convolutional neural network to extract rich features for vehicle detection at various scales based on the sliding window technique, which generated thousands of redundant windows. Instead of the sliding windows, Cheng et al. [18] employed a region proposal method called the selective search algorithm [19] to generate regions-of-interest (RoI), which segmented the input image into several sub-regions and merged them in accordance with similarity. In addition, to solve the problem of object rotation variations in remote sensing images, they introduced a new rotation-invariant layer on the basis of the existing CNN architectures. Nevertheless, one drawback of these detection networks is that their region proposal methods consume excessive running time. To reduce the computing time, Han et al. [20] proposed a fast and efficient geospatial object detection framework based on Faster R-CNN [21], which adopted a region proposal network (RPN) that shared convolutional features with the detection network. Specifically, the RPN was designed by introducing the "anchor" boxes with multiple scales and aspect ratios to predict region proposals containing objects of various sizes and aspect ratios. Similarity, Chen et al. [22] added more scales and aspect ratios of "anchor" boxes in RPN to achieve more accurate airport detection. However, these methods predict the locations and categories of objects on the top of the classification network (e.g., VGG16 [23], ResNet-50 [24]). Under consecutive convolution and pooling operations, it is easy to result in the incorrectly locations of objects due to the loss of details of the feature maps.
To make networks more robust for geometric variations of objects in remote sensing images, one effective way is to make use of features of middle layers from CNN and then exploit the multi-scale features with multi-level information [25,26,27,28,29,30,31]. Ding et al. [25] directly concatenate the multi-scale features of CNN to obtain the fine-grained details for detecting small objects. Mou et al. [26] adopted the pixel-wise summation to incorporate the score maps generated by multilevel context features of different residual blocks for segmenting small objects such as vehicle. Guo et al. [27] proposed a top-down pathway and lateral connection to build feature pyramid network that had strong semantic feature maps at all scales. It assigned the feature maps of different layers to be responsible for objects with different scales. Jiao et al. [28,29] introduced the dense feature pyramid network (DFPN) for automatic ship detection in which each feature map was densely connected and merged by concatenation. Furthermore, Li et al. [30] proposed a hierarchical selective filtering layer that mapped features of multiple scales to the same scale space for ship detection with various scales. Gao et al. [31] designed a tailored pooling pyramid module (TPPM) to take advantage of the contextual information of different subregions with different scales.
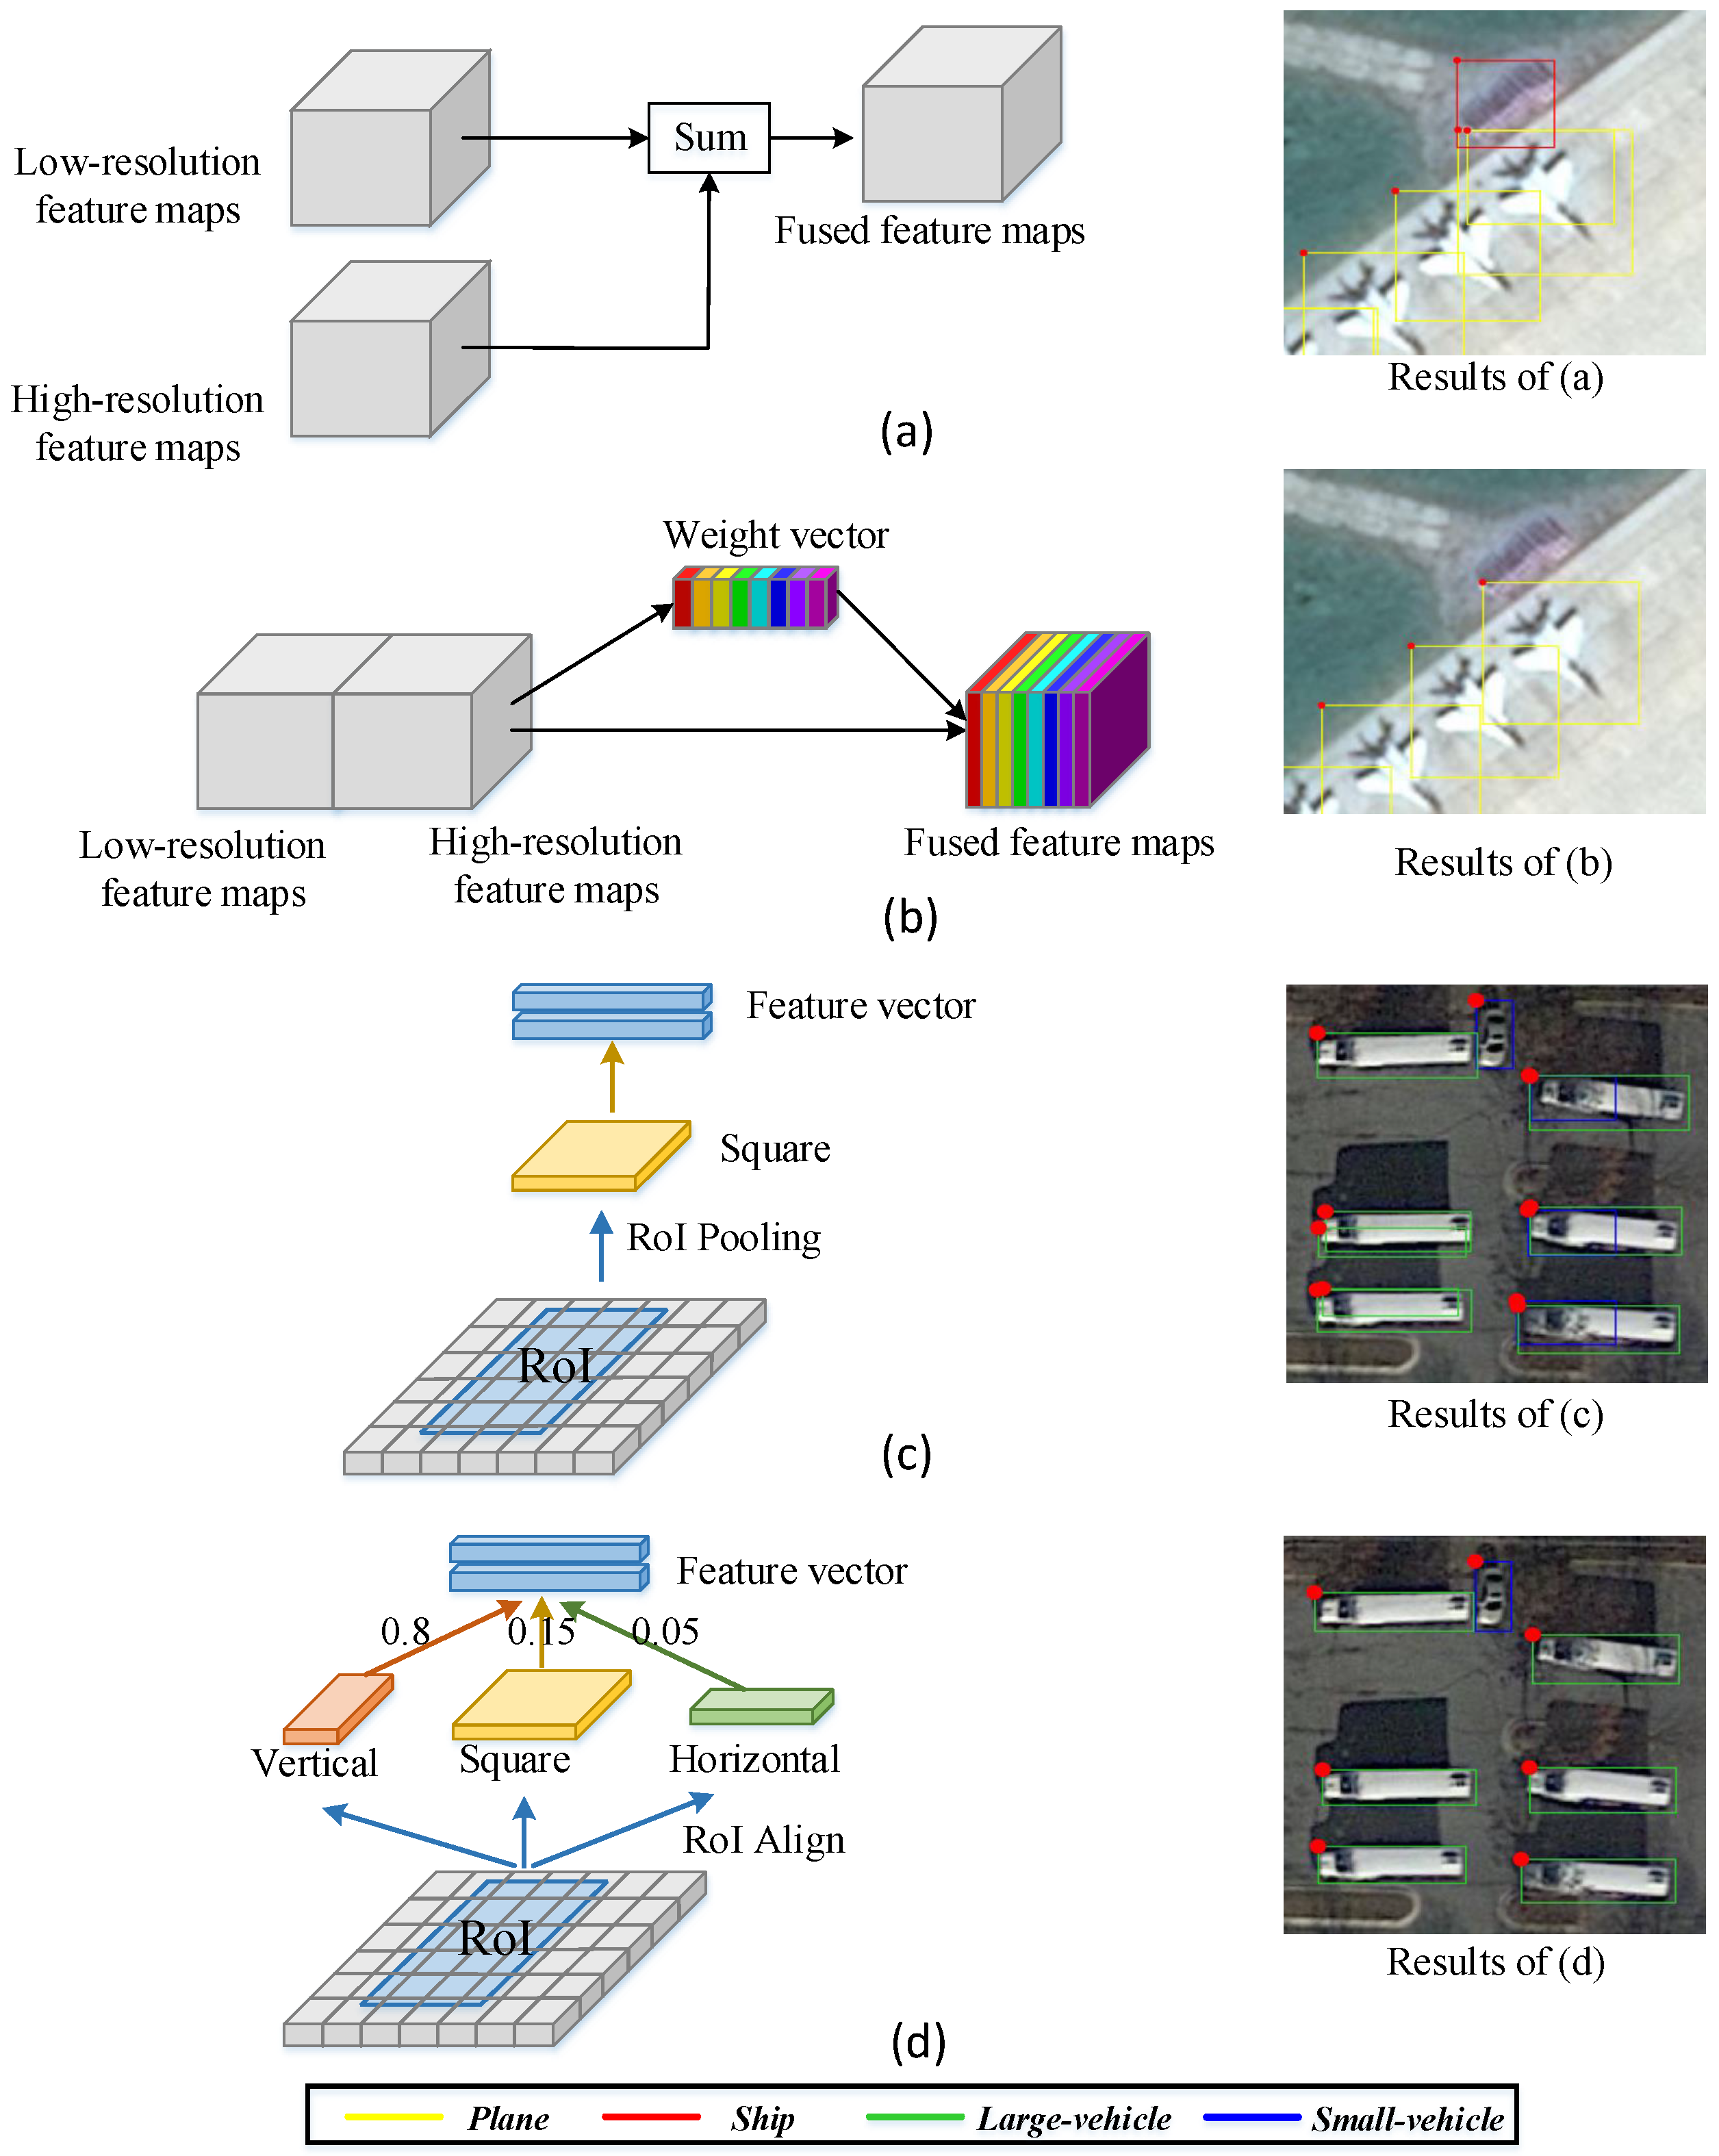
Although the above methods have achieved promising detection results by aggregating multi-scale features, there also exist two common problems. (1) These previous works [25,26,27,28,29,30,31] aggregate multi-scale features of CNN to detect objects of various scales using unified weights in Figure 2a, e.g., a simple summation, which ignore the different importance of different scales. It is easy to interfere with detection due to some noisy features. For example, in the right of Figure 2a, the background is incorrectly detected as ship. (2) To extract features of each RoI, these methods [20,21,22,25,27,28,29,30] compress RoI feature maps of different aspect ratios into the same size in Figure 2c, which is easy to cause excessive shape distortions of objects and then disturb location and recognition of objects. For example, in the right of Figure 2c, the large-vehicle is misclassified as small-vehicle and has an incorrect location.

Figure 2.
The structures and detection results of different methods. (a) aggregates features of different scales by simple summation. (b) utilizes the learned weight vector to adaptively aggregate features of different scales. (c) maps the RoI into the square size (e.g., ) using RoI Pooling. (d) maps the RoI into different aspect ratios (e.g., the vertical size, the square size and the horizontal size) and selects the appropriate size in accordance with aspect ratios of objects. The detection results of different methods are shown on the right.
To deal with the above problems, we propose an Adaptively Aspect Ratio Multi-Scale Network (ARMNet) for object detection of diverse sizes and aspect ratios in remote sensing images. ARMNet is composed of a multi-scale feature gate fusion network and an aspect ratio attention network, which takes into account various scales of objects and the distortions of aspect ratios, respectively. The main contributions of this paper are as follows:
- We propose a multi-scale feature gate fusion network to selectively aggregate different-scale features of CNN from top to bottom for detecting objects of various scales. Instead of simply combining different-scale features, a gate fusion is developed to control information flow of different-scale features using the learned weight vector in Figure 2b, and then adaptively select the desired features and suppress irrelevant features. For instance, the false detection result ship is suppressed in the right of Figure 2b.
- We propose a novel aspect ratio attention network based on RoIs to solve the shape distortion caused by the aspect ratio changes. This network can select the RoI features of appropriate aspect ratios in accordance with aspect ratios of objects in Figure 2d. It alleviates the excessive shape distortions of objects caused by aspect ratio changes, and further improves the detection performance of the network for objects of diverse aspect ratios. For instance, the large-vehicle is correctly detected in the right of Figure 2d.
- We implement our method on the DOTA dataset [4], NWPU VHR-10 dataset [18], RSOD dataset [6], and UCAS-AOD dataset [32], respectively. In addition, our method exceeds several existing methods that are widely applied to object detection in remote sensing images. The experimental results demonstrate the effectiveness of our method.
The rest of this paper is organized as follows: Section 2 describes the proposed ARMNet for object detection in remote sensing images in more detail. Section 3 shows and analyzes the results of the experiment. Section 4 summarizes the contributions of this paper and looks forward to the future research directions.
2. Proposed Method
The overall framework of our Adaptively Aspect Ratio Multi-Scale Network (ARMNet) for object detection is illustrated in Figure 3, which is based on Faster R-CNN [21] and FPN [33]. It consists of two components: Multi-scale Feature Gate Fusion Network and Aspect Ratio Attention Network. Given a remote sensing image, a multi-scale feature gate fusion network adaptively aggregates semantic features of different scale using gate fusion modules and refine blocks. A great deal of region proposals at various scales are generated on the fused multi-scale feature maps using RPN, respectively. Furthermore, in order to preserve the aspect ratios of objects, an aspect ratio attention network utilizes the relevance scores to select the RoI features that match the shapes of objects. This network guarantees more accurate classification and localization for objects of various aspect ratios.
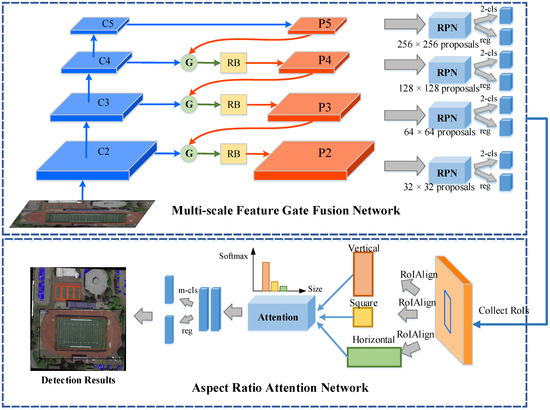
Figure 3.
Overall framework of Adaptively Aspect Ratio Multi-Scale Network (ARMNet) for object detection. The framework consists of two main parts: Multi-scale Feature Gate Fusion Network and Aspect Ratio Attention Network. The multi-scale feature gate fusion network is composed of gate fusion modules (G), refine blocks (RB) and region proposal networks (RPN). The aspect ratio attention network is leveraged to select the appropriate aspect ratios of objects based on the attention module.
2.1. Multi-Scale Feature Gate Fusion Network
For typical object detection framework Faster R-CNN [21], it is difficult to achieve object detection of various sizes using a single scale features of CNN. An effectively way to solve this problem is to utilize the multi-scale features of middle layers from CNN, such as FPN [33]. Considering that low-resolution features contain strong semantics and poor details, while high-resolution features have weak semantics and rich details, FPN [33] combines different-resolution feature of CNN to create a feature pyramid that has strong representational power at all scale. However, it is noteworthy that not all features is useful for specific scale object detection when fusing different-scale feature maps. In previous works [25,26,27,28,29,30,31], the different-scale feature maps are fused via a simple summation, which ignores the different importance of different scales. It is easy to produce the false detection results due to some potential noisy features. To address this problem, we propose a novel fusion mechanism called gate fusion, which expects that different-scale features will be assigned different importance, and thus achieves adaptively select the useful features and suppress useless or noisy features.
The top of Figure 3 shows the multi-scale feature gate fusion network. The feature maps of different scales are adaptively aggregated by gate fusion module. The refine block is followed by the gated fusion features to further refine the expressive powers of the fused feature maps. Finally, we use RPN on the refined feature maps to generate a great deal of proposals that may contain objects of various sizes and aspect ratios.
Specifically, we adopt ResNet [24] as backbone network, and the feed-forward computation of which is executed by bottom-top pathway. To construct a feature pyramid that contains multi-scale feature maps, following FPN [33], we firstly choose the last layer of residual block conv2, conv3, conv4, conv5 as , and their strides are pixels respectively for the input images. Then, we upsample the low-resolution feature maps via nearest neighbor interpolation operation and aggregate it with the next high-resolution feature maps using gated mechanism by top-down pathway. The final outputs of feature maps are obtained by refine blocks. Here, we also assigned the feature maps which is down-sampling of for larger-scale objects.
2.1.1. Gate Fusion Module
Our gate fusion module is designed to control the information flow of different-scale features and select the necessary features for objects of specific scale. To achieve this, we leverage the global information of feature maps at each channel and the dependencies between features to generate important score for each feature map, which is used to weight different-scale feature maps. In Figure 4a, the network structure diagram of gate fusion module is shown. In order to aggregate multi-resolution features, we firstly conduct a upsample layer with stride of 2 on the coarse resolution feature maps . Then the feature maps are stacked with the fine resolution feature maps using a concat operator along the channel, where . C, H and W are the channel dimension, height and width, respectively. The feature maps are obtained by feeding in the backbone network into a convolution layer with kernel of to reduce the channel numbers. In this paper, we set up . The cascaded feature maps can be denoted as:
where , represents the feature map of the c-th channel of .

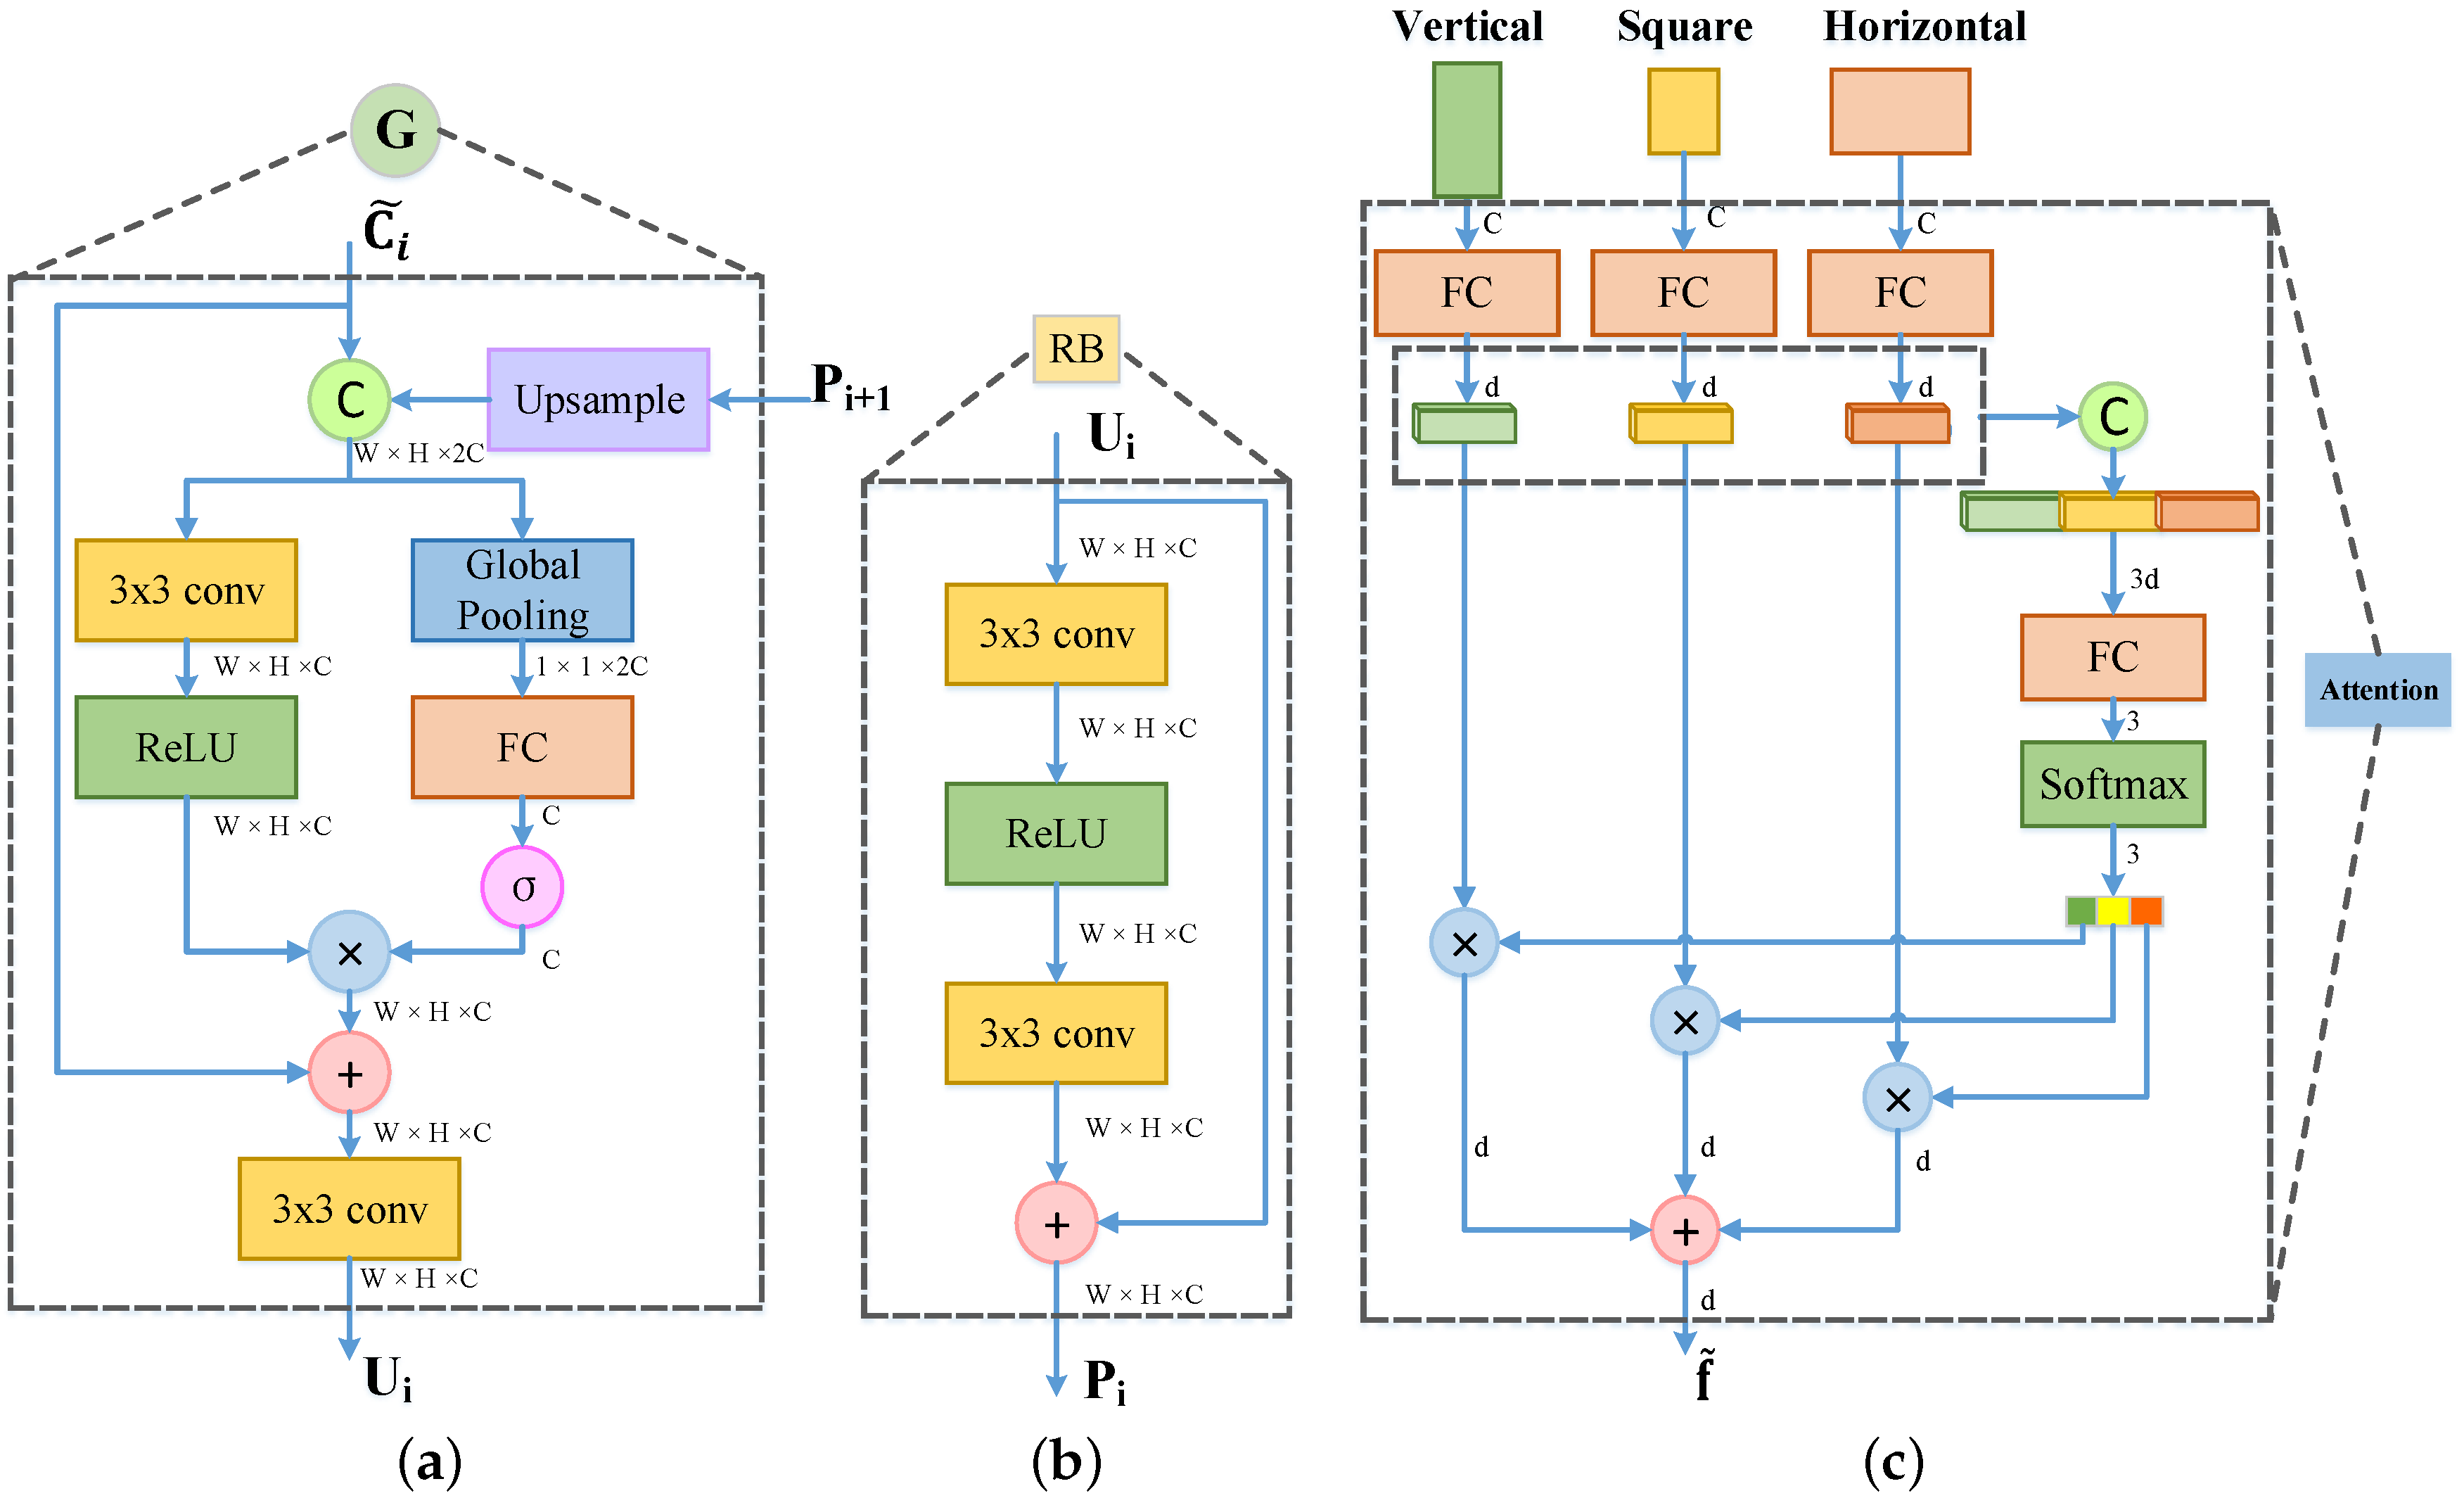
Figure 4.
(a) The network structure diagram of the gate fusion module. The feature maps generated by the feature maps from the backbone network and the last fused feature maps are fed into the gate fusion module for getting the fused feature maps . (b) The network structure diagram of the refine block. It is used to refine the expressive powers of the feature maps . (c) The network structure diagram of the aspect ratio attention network. It adaptively selects the features with suitable aspect ratios or shapes for more accurate classification and localization. and C denote sigmoid function and concatenate operator. ⊗ is channel-wise product operator and ⊕ is element-wise sum operator.
Next, we design a fusion function to gather different-scale feature maps and a gate function to generate the important scores of these feature maps, respectively. For fuse function , we employ a convolution layer with kernel of and a relu layer to understand and aggregate different scale features:
where . represents the weight matrix of convolution layer.
In gate function , it is expensive and difficult to converge for calculating the importance of each pixel of the feature maps, so we statistic the importance for each channel and their relevance of the feature maps. Naturally, we use the global pooling operator to obtain the global information of the cascaded feature maps :
where is the c-th element of . In order to make the module adaptively selects meaningful features for objects with different sizes, thus we learn the weight matrix to capture the interdependency between different-scale feature maps, and then follow a sigmoid function to dominate the values of weights:
where is a weight vector, each element is mapped to . 0 means that the feature information is not passed, 1 means the feature information is not weaken.
Finally, we use the learned weight vector to rescale the feature maps from , which contributes to detect the specific scale objects. The gate fusion module can be defined as:
where ⊗ is channel-wise product operator, and ⊕ is element-wise sum operator, expresses a convolution layer with kernel of .
2.1.2. Refine Block
The refine block is followed by the feature map of each level after gate fusion to generate the refined feature maps , and then these feature maps is used to predict the location and category of objects of different sizes. As shown in the Figure 4b, we employ a basic residual block [24] consisting of two convolution layers with kernel of and a relu layer, which can purify the feature maps. It makes the network easier to optimize due to the addition of short cut. Furthermore, the refine block can effectively avoid over-fitting and enhance the expressive powers of features.
2.1.3. Region Proposal Network
Due to the high-resolution features containing richer details, it is better to detect small objects. The high-resolution features are captured in a larger receptive field, which is helpful for large object detection. In order to make full use of the advantages of feature maps of different scales after fusion, the areas of anchors are separately assigned to the feature maps , and the aspect ratios of anchors are set to , as shown in Figure 3. After that, we use RPN [21] to predict the objectness scores and position offsets of anchors of different sizes on different-scale feature maps separately, and then use non maximum suppression (NMS) to screen out the regions of interest (RoIs).
2.2. Aspect Ratio Attention Network
Recently, most of state-of-the-art methods are [7,8,9,20,21,22] based on the two-stage object detection framework Faster R-CNN [21]. This framework firstly extracts the features of each RoI generated by RPN using RoI Pooling and then leverages a series of classifiers and regressors to obtain the categories and locations of objects, respectively. However, the RoI pooling maps object regions of different aspect ratios or shapes into the same size (e.g., (1:1)) to satisfy the requirement that the input size of the network is consistent. It is easy to cause excessive shape distortions of objects and then disturb the location and recognition of objects. To address this problem, we propose an aspect ratio attention network based on RoIs, as shown in Figure 4c. This network extracts RoI features of appropriate aspect ratio more flexibly according to the relevance scores between each shape and RoI, so that the actual aspect ratio of object is preserved as much as possible, avoiding the distortion of RoI features. In the following, we will describe the details for this network.
Unlike previous methods using an RoI Pooling operator [34], we adopt the RoI Align operator proposed by Mask R-CNN [35] to extract RoI features. It cancels the quantization operation, and uses bilinear interpolation to get the relative pixel values at the coordinates of floating points replacing nearest neighbor interpolation, which solves the problem of misalignment of RoI Pooling operator. Similar to FPN [33], we assign an RoI to the corresponding feature maps according to to the size of RoI. Because objects in images often appears in three shapes: vertical, square and horizontal, we map each RoI to the three shapes by adjusting aspect ratios instead of the previously fix square shape. The aspect ratios are set to be consistent with that of anchors ().
Denote as a set of multi-shapes RoI feature maps. In this paper, we set up , , , where is the channel dimension of the RoI feature maps. We embed RoI feature map of each shape into a vector respectively for the global information, where , and cascade these feature vectors:
where symbolizes the weight matrix corresponding to the i-th aspect ratios of RoI, is the feature vector after concating.
To make the network automatically select the RoI feature maps that match the aspect ratio of object, we design an attention module to generate their relevance scores. The possibility of selecting RoI features for each specific aspect ratio can be described as:
where is the attention weight, which combines features of different aspect ratios into a weight vector with 3 dimension. Based on the above probability values , the RoI features of each aspect ratio can be weighted and summed to gain the final features matching with aspect ratio of original objects:
Subsequently, similar to Faster R-CNN [21], two fully connected layers are needed for achieving the final classification and location of objects.
where and are the weight matrices, h is the dimension of hidden layer, which is usually set to 1024. is the output feature vector. In addition, we use the multi-task loss function [34] to train the proposed ARMNet, which is composed of classified loss and regression loss.
3. Experiments
In this section, we will demonstrate the effectiveness of our methods for object detection of remote sensing images on four popular datasets: DOTA dataset [4], NWPU VHR-10 dataset [18], RSOD dataset [6], and UCAS-AOD dataset [32]. We firstly introduce the above datasets, the experimental details and the evaluation criteria. Then, we analyze the impact of each module on the performance of the network. Finally, we compare the accuracy of our ARMNet method with the state-of-the-art methods on the four datasets.
3.1. Datasets
3.1.1. DOTA Dataset
The DOTA dataset [4] is a large-scale dataset for object detection in aerial images, which contains 15 object classes with various scales and 2806 images with higher resolution. The width of images mainly ranges from 800 to 4000 pixels from different sensors and platforms. For DOTA, there are 1411 images for training, 458 images for validation, 937 images for testing, of which 188,282 are annotated instances. Since the annotations are not available for test set, the accuracy evaluation of the test data needs to be submitted to the website (https://captain-whu.github.io/DOTA/). In this paper, to meet the requirements of our research, we use the published code (https://github.com/CAPTAIN-WHU/DOTA_devkit) to transform the coordinates of annotated instances from 8 to 4 points for the detection of horizontal bounding boxes.
3.1.2. NWPU VHR-10 Dataset
The NWPU VHR-10 dataset [18] is a public dataset including 800 images (about 1000 × 1000) with 650 positive samples and 150 negative samples collected from Google Earth and Vaihingen dataset, and consists of ten categories. In this paper, we divide the dataset into training set, validation set and test set according to the ratio of 20%, 20%, 60%, which is randomly selected from images according to the corresponding proportion.
3.1.3. RSOD Dataset
The RSOD dataset [6] has 936 annotated images, which are mainly comprised of 4993 aircraft in 446 images, 191 playgrounds in 189 images, 180 overpass in 176 overpass and 1586 oiltanks in 165 images. In this paper, we split 25% of the dataset into training set, 25% into validation set and 50% into test set.
3.1.4. UCAS-AOD Dataset
The UCAS-AOD dataset [32] is a aerial object detection dataset. It is obtained by cropping with Google Earth software in some parts of the world, which consists of 1510 images (about 1000 × 1000) and two categories of cars and planes. In this paper, following Xia et al. [4] settings, we randomly choose 1110 images for training, 400 images for testing.
3.2. Implementation Details
The designed ARMNet is an end-to-end learning network using ResNet [24] pretrained on ImageNet [36]. For DOTA dataset [4], because of the high resolution of the image, we utilize the sliding window of size to cut the original image with step size of 400 for the input image of our network. For the other three datasets with relatively not high resolution of image (about 1000 × 1000), we resize the short side of image to 800, the long side is fitted with the same ratio. We adopted Soft-NMS method [37] with gaussian weighting, where sigma of 0.5 is set. Our network is implemented on the caffe2 [38] deep learning framework with Nvidia Titan X GPU of 12G memory. We define the hyper-parameters of our network following FPN [33] provided by Detectron object detection platform (https://github.com/facebookresearch/Detectron). The mini-batch stochastic gradient descent (SGD) algorithm is adopted to optimize the network with batch size of images 1, batch size of RoIs 512. The weight decay is set to 0.0001, and the momentum of 0.9 was selected. In this paper, we choose the learning policy of step with decay, and set the basic learning rate of 0.01 for the first 20k iterations, 0.001 for the next 10k iterations, 0.0001 for the last 10k iterations on DOTA dataset [4]. In all our experiments, we do not use any data augmentation unless otherwise specified.
3.3. Evaluation Criteria
To evaluate the performance of object detectors, we adopt the typical measure of mean Average Precision (mAP) that is obtained by recall (R) and precision (P). The mAPs are defined using true positive (TP), false positive (FP), true negative (TN), and false negative (FN) as:
where the detection result will be considered true if the IOU with the proposal and matching ground truth is larger than a certain threshold. In our experiments, the threshold is determined to 0.5. Meanwhile, we can also leverage Recall and Precision to draw the P-R curve. Furthermore, the area under the curve means the average precision (AP) of each category. The formula is as follows:
The mAP means that the mean value of AP for all categories:
where indicates the number of categories.
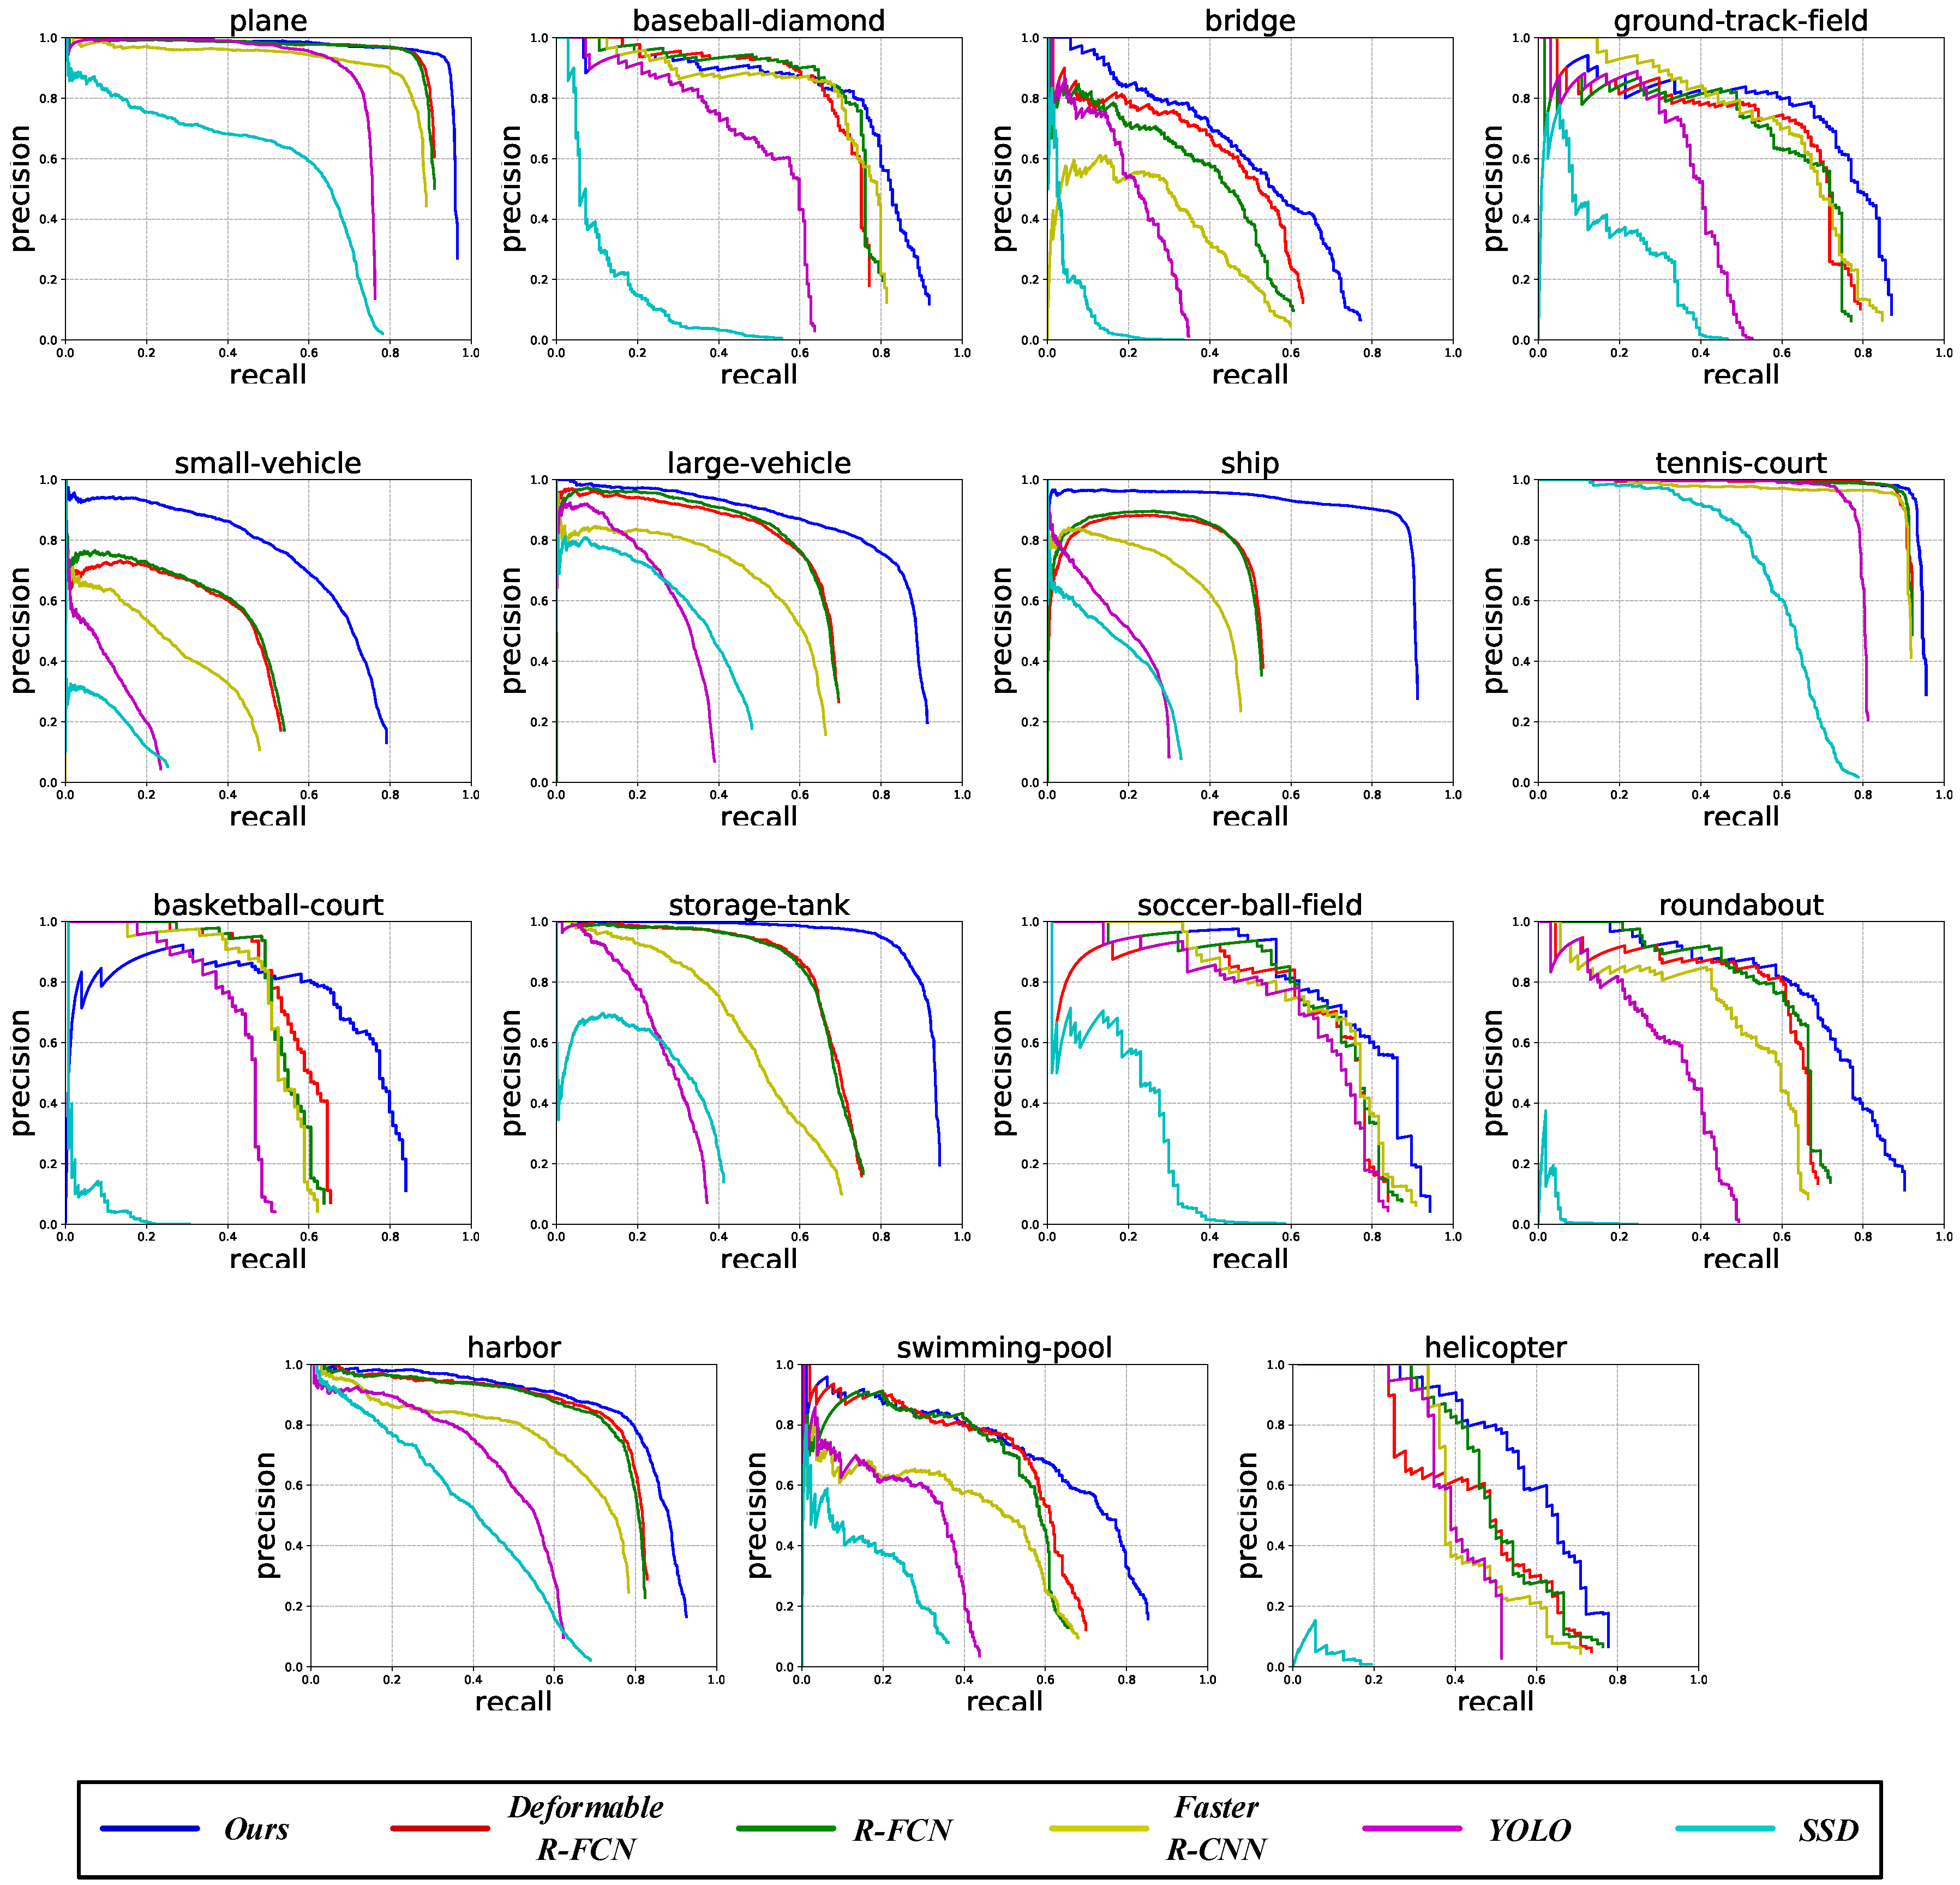
For ease of understanding, Figure 5 shows the P-R curves of our ARMNet method and the other state-of-the-art methods. We can see that the area under the blue line (ours) is larger than that under the other lines for the 15 categories of DOTA dataset [4]. When the recall is determined, the precision of ARMNet is higher than other methods. When the precision value is given, our recall is also higher than other methods. In short, the proposed ARMNet method has better performance than the other methods.
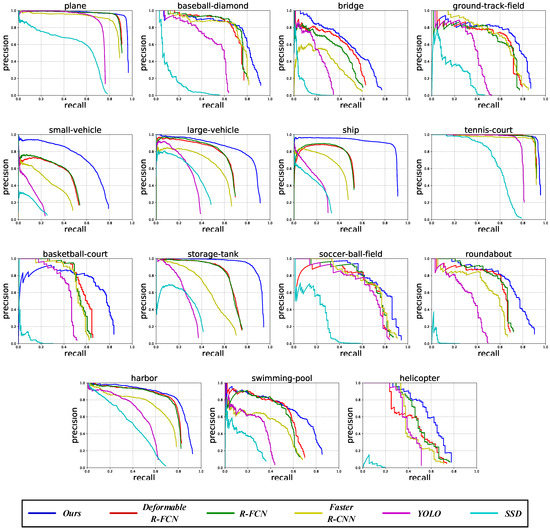
Figure 5.
The P-R curves of the proposed ARMNet method and the other state-of-the-art methods for plane, baseball-diamond, bridge, ground-track-field, small-vehicle, large-vehicle, ship, tennis-court, basketball-court, storage-tank, soccer-ball-field, roundabout, harbor, swimming-pool and helicopter on the DOTA dataset [4]. The horizontal axis represents recall, the vertical axis stands for precision, and the area under the curve means the average precision (AP) of each category.
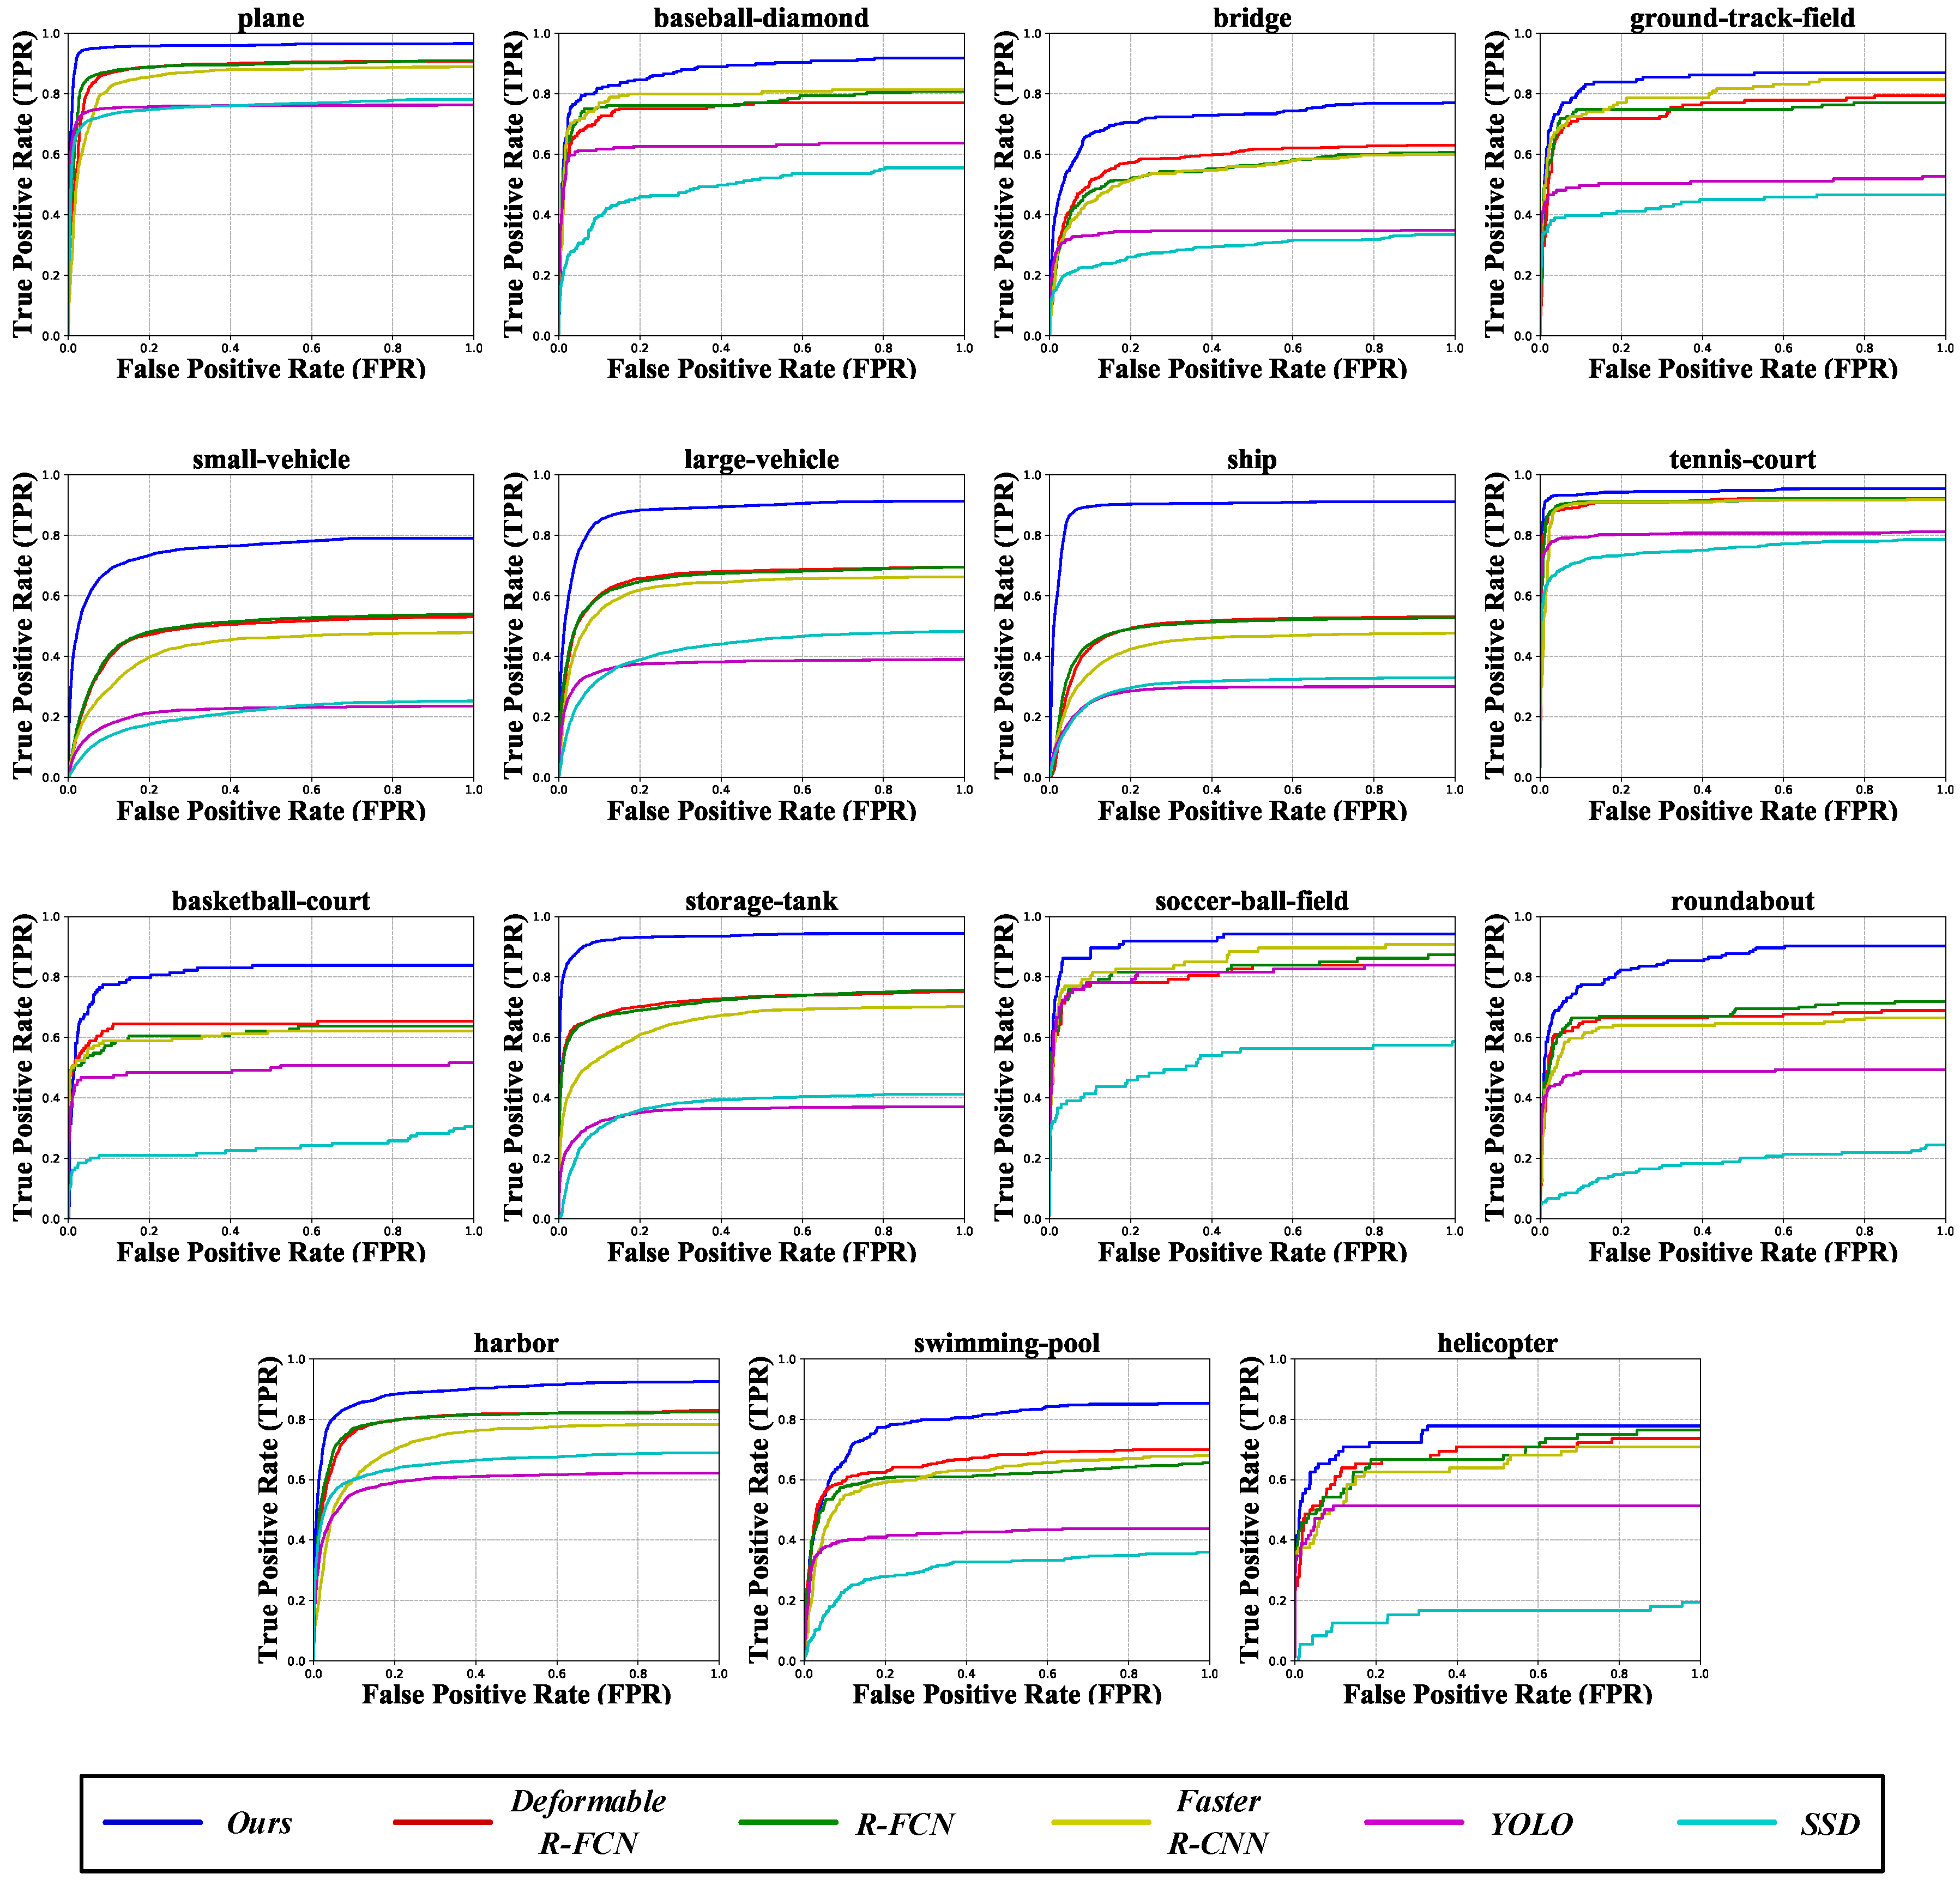
In addition, we also use the receiver operating characteristics curve (ROC) to evaluate the detection performance, which is obtained by true positive rate (TPR) and false positive rate (FPR).
where TPR is equivalent to recall. Figure 6 shows the ROC curves of different methods for each category on the DOTA dataset. The closer the ROC curve is to the upper left corner (0,1), the better the detection performance of the network. It can be observed that our method achieves better performance than other existing methods.
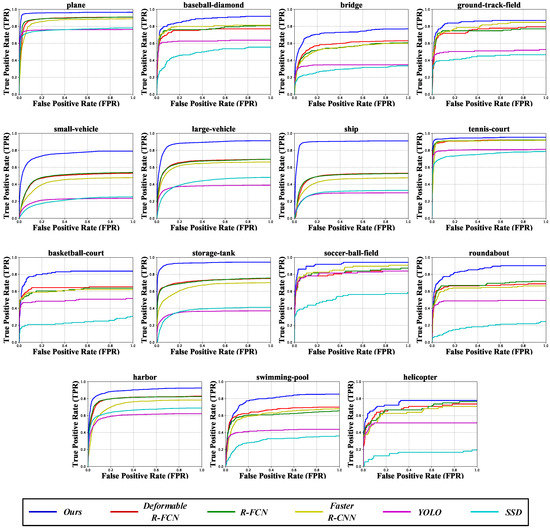
Figure 6.
The ROC curves of the proposed ARMNet method and the other state-of-the-art methods for each category on the DOTA dataset [4]. The horizontal axis stands for false positive rate (FPR) and the vertical axis for true positive rate (TPR).
Furthermore, we compare the classification performance of different methods in a rigorous way. Following [39], we use the proportion correct ( indicates the number of correctly allocated cases, represents the total number of ground truth) to evaluated the classification accuracy for each detection method and compare the statistical significance of difference in accuracy using MCNemar test [40] for related samples. This test is based upon the standardized normal test statistic:
where indicates the entries lying in confusion matrix element . Table 1 shows the paired comparison of classification accuracy for different methods. It can be observed that our method significantly outperforms the compared methods. In addition, there is no significant difference between Deformble R-FCN [41] and R-FCN [42].

Table 1.
Comparison of the classification accuracy for different methods using McNemar test on the DOTA dataset. The level is selected as the level of difference significant.
3.4. Ablation Study
In this subsection, we reveal the impact of each module of the proposed network on performance. For ablation experiments, the backbone network with ResNet-50 [24] is used to evaluate the performance on DOTA dataset [4], where these networks are trained on the training set, and tested on the validation set.
3.4.1. Ablation for Multi-Scale Feature Gate Fusion Network
To demonstrate the effectiveness of the multi-scale feature gate fusion network, we set up the baseline detection network (Faster R-CNN [21]) and FPN [33] with a lateral connection to be consistent with our network in the implement details. The fourth row of Table 2 shows that the results of introducing the gate fusion module on the baseline detection network. The module adaptively aggregates different-scale feature maps for object detection of various sizes, which significantly improves the detection accuracy by 6.58%. Further, in order to enhance the discrimination of features, the refined block is appended after the gate fusion module. As shown in Table 2, the detection accuracy is increased from 70.79% to 71.49%. Furthermore, the performance of the multi-scale feature gate fusion network also overwhelms the popular multi-scale method FPN [33] by 1.52%, which fuses different-scale feature maps by simple summation.
Table 2.
Ablation study on the components of Adaptively Aspect Ratio Multi-scale Network (ARMNet) (SF: Sum Fusion, GFM: Gate Fusion Module, RB: Refined Block, ARAN: Aspect Ratio Attention Network). The bold numbers represent the best detection result.
Table 3 shows the influences of different combination ways regarding the different-scale feature maps on the detection accuracy. Following [4], we measure the sizes of objects according to the height of objects. The height ranges from 0 to 50 for a small object, from 50 to 300 for a medium object, and over 300 for a large object. In Table 3, it can be observed that the mAP of only the last feature map is lowest while the AP of large objects is best in four combination ways due to the large receptive field. By gradually incorporating the feature map , , , the detection accuracy is constantly improved. The fusion of all the feature maps performs the best in Table 3, and the performance is boosted from 65.11% to 72.89%. Meanwhile, the detection accuracies (APs, APm, Apl) of small objects, medium objects and large objects have been greatly improved, which indicates the effectiveness of the designed multi-scale feature gate fusion network for object detection of various sizes. The main reason for this result is that the high-level feature maps have strong semantic information and a large receptive field, which are good for large object detection. The low-level feature maps with rich details are continuously integrated to strengthen the expressive power of the network, thus, improving the detection accuracy.
Table 3.
Different combination ways of the feature maps. The bold numbers represent the best detection results.
3.4.2. Ablation for Aspect Ratio Attention
The fifth row of Table 2 shows the results of introducing the aspect ratio attention network, which adaptively selects the appropriate features from three different aspect ratios of RoIs using the designed attention module. This network improves the detection accuracy by 1.4%. Other results in Table 2 only use RoIs with an aspect ratio of 1:1 at the stage of region feature extraction, like Faster R-CNN [21]. Table 4 compares three different designs about the attention module for the region feature extraction network. The first row of Table 4 shows the results of without aspect ratio attention network (ARAN), which maps the RoIs of all scales to the features of same size . In order to verify the effectiveness of the proposed aspect ratio module, we also exhibit the result of the plain method, which is a natural feature fusion method. Unfortunately, We can notice that the performance of the plain method is lower than without ARAN. In the plain method, we first cascade the RoI feature vectors with different aspect ratios using a concat operator, and then combine the features of different channels with a inner product layer. Nevertheless, the performance of the attention module designed in this paper can reach 72.1%, which demonstrates that the attention module performs better than the simple plain method. In addition, we evaluate the detection accuracy of objects of different aspect ratios. The aspect ratio from 0 to 0.5 for a vertical object, from 0.5 to 2 for a square object, and over 2 for a horizontal object. Meanwhile, we can see that the detection accuracies (APv, APsq, APh) of objects of diverse aspect ratios have been increased by adding the aspect ratio attention module.
Table 4.
Different designs about the attention module. denotes the aspect ratios of objects. w/o ARAN denotes without Aspect Ratio Attention Network (ARAN). The bold numbers represent the best detection results.
3.5. Comparison with the-State-of-the-Art Methods
In this subsection, we compare the proposed method with the state-of-the-art detection networks on different remote sensing datasets, and exhibit qualitative results, thus, verifying the generality and effectiveness of our detection network.
3.5.1. Results on DOTA Dataset
In Table 5, the performance of some current state-of-the-art detection networks on DOTA dataset [4] is evaluated, such as YOLOv2 (https://pjreddie.com/darknet/yolo/) [43] based on Darknet19, Inceptionv2 [45] for SSD (https://github.com/tensorflow/models/tree/master/research/object_detection) [44], and ResNet-101 [24] for R-FCN (https://github.com/msracver/Deformable-ConvNets) [41], Deformable R-FCN (https://github.com/msracver/Deformable-ConvNets) [42] and Faster R-CNN (https://github.com/msracver/Deformable-ConvNets) [21]. Note that the performance of existing methods in Table 5 is taken from [4,46]. In order to evaluate the performance of our method on the test set of DOTA dataset [4], we adopt multi-scale training and testing strategies due to the large-scale of DOTA dataset [4]. In Table 5, it is remarkably shown that our approach has better performance, which greatly exceeds the Faster R-CNN [21] by 18% at mAP. The detection performance of SSD [44] is the lowest among these approaches mentioned in Table 5, although it uses multi-scale feature maps. The main reason may be that it only uses the low-level feature maps for small objects, resulting in inadequate feature extraction, high-level feature maps for large targets, resulting in the loss of detail information. Moreover, the performance of our method also exceeds Deformable R-FCN [42], which adjusts the size and shape of receptive field to detect objects of various sizes and aspect ratios. In addition, our method outperforms the recent two methods by Azimi et al. [47] and Yan et al. [46] by 6% and 5.73%, respectively.
Table 5.
Comparison of the performance of different detection models on the test set of DOTA dataset [4]. The abbreviation names of category follow [4] (BD: Baseball diamond, GTF: Ground field track, SV: Small vehicle, LV: Large vehicle, TC: Tennis court, BC: Basketball court, ST: Storage tank, SBF: Soccerball field, RA: Roundabout, SP: Swimming pool, and HC: Helicopter.). The bold numbers represent the best detection results on each category.
To evaluate the computational efficiency of our method, we run other recent methods that have released code and our method on the same machine Nvidia GTX Titan X GPU with 12 G memory to ensure a fair comparison. Table 6 shows the average computing time per image for different detection models. It can be observed that our A2RMNet expends a little more computing time than other recent methods for adaptively detecting objects of various sizes and aspect ratios.
Table 6.
The average computing time per image for different detection models.
3.5.2. Results on NWPU VHR-10 Dataset
In Table 7, we validate the effectiveness of our method and other state-of-the-art methods on the NWPU VHR-10 dataset [18]. The proposed ARMNet improves the detection performance of Faster R-CNN [21] and Deformable R-FCN [42] by 12.76% and 7%, respectively. For fair comparison, we train and test all methods using the same data.
Table 7.
Comparison of the performance of different detection models on the test set of NWPU VHR-10 dataset [18].The abbreviation names of category can be described as follows. (ST: Storage tank, BD: Baseball diamond, BC: Basketball court and GTF: Ground track field). The bold numbers represent the best detection results on each category.
3.5.3. Results on RSOD Dataset
We also compare the performance of our method ARMNet with other existing methods on RSOD dataset [6], and our method ARMNet achieved the best detection performance of 93.57% in Table 8. For fair comparison, we train and test all methods using the same data.
Table 8.
Comparison of the performance of different detection models on the test set of RSOD dataset [6]. The bold numbers represent the best detection results on each category.
3.5.4. Results on UCAS-AOD Dataset
As shown in Table 9, the detection accuracy of our method ARMNet is 96.94% on UCAS-AOD dataset [32], which goes beyond the other state-of-the-arts. In particular, the mAP of Plane is almost perfect. For fair comparison, we train and test all methods using the same data.
Table 9.
Comparison of the performance of different detection models on the test set of UCAS-AOD dataset [32]. The bold numbers represent the best detection results on each category.
3.5.5. Qualitative Results
Figure 7 exhibits the detection results of the proposed network ARMNet in the test set of DOTA dataset [4], whose ground truth is not available. It can be observed that our method performs well for objects of diverse sizes and aspect ratios.
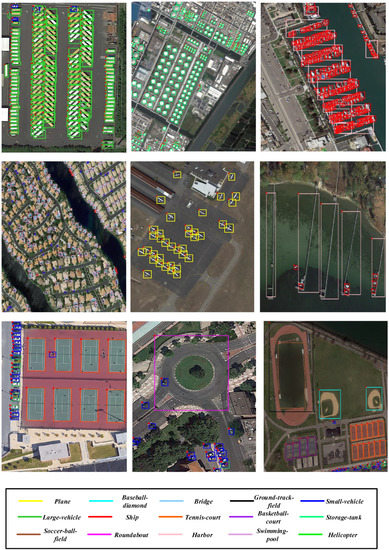
Figure 7.
The detection results of the proposed ARMNet on the test set of DOTA dataset [4]. The categories corresponding to the colors of bounding boxes are listed below.
3.6. Discussion
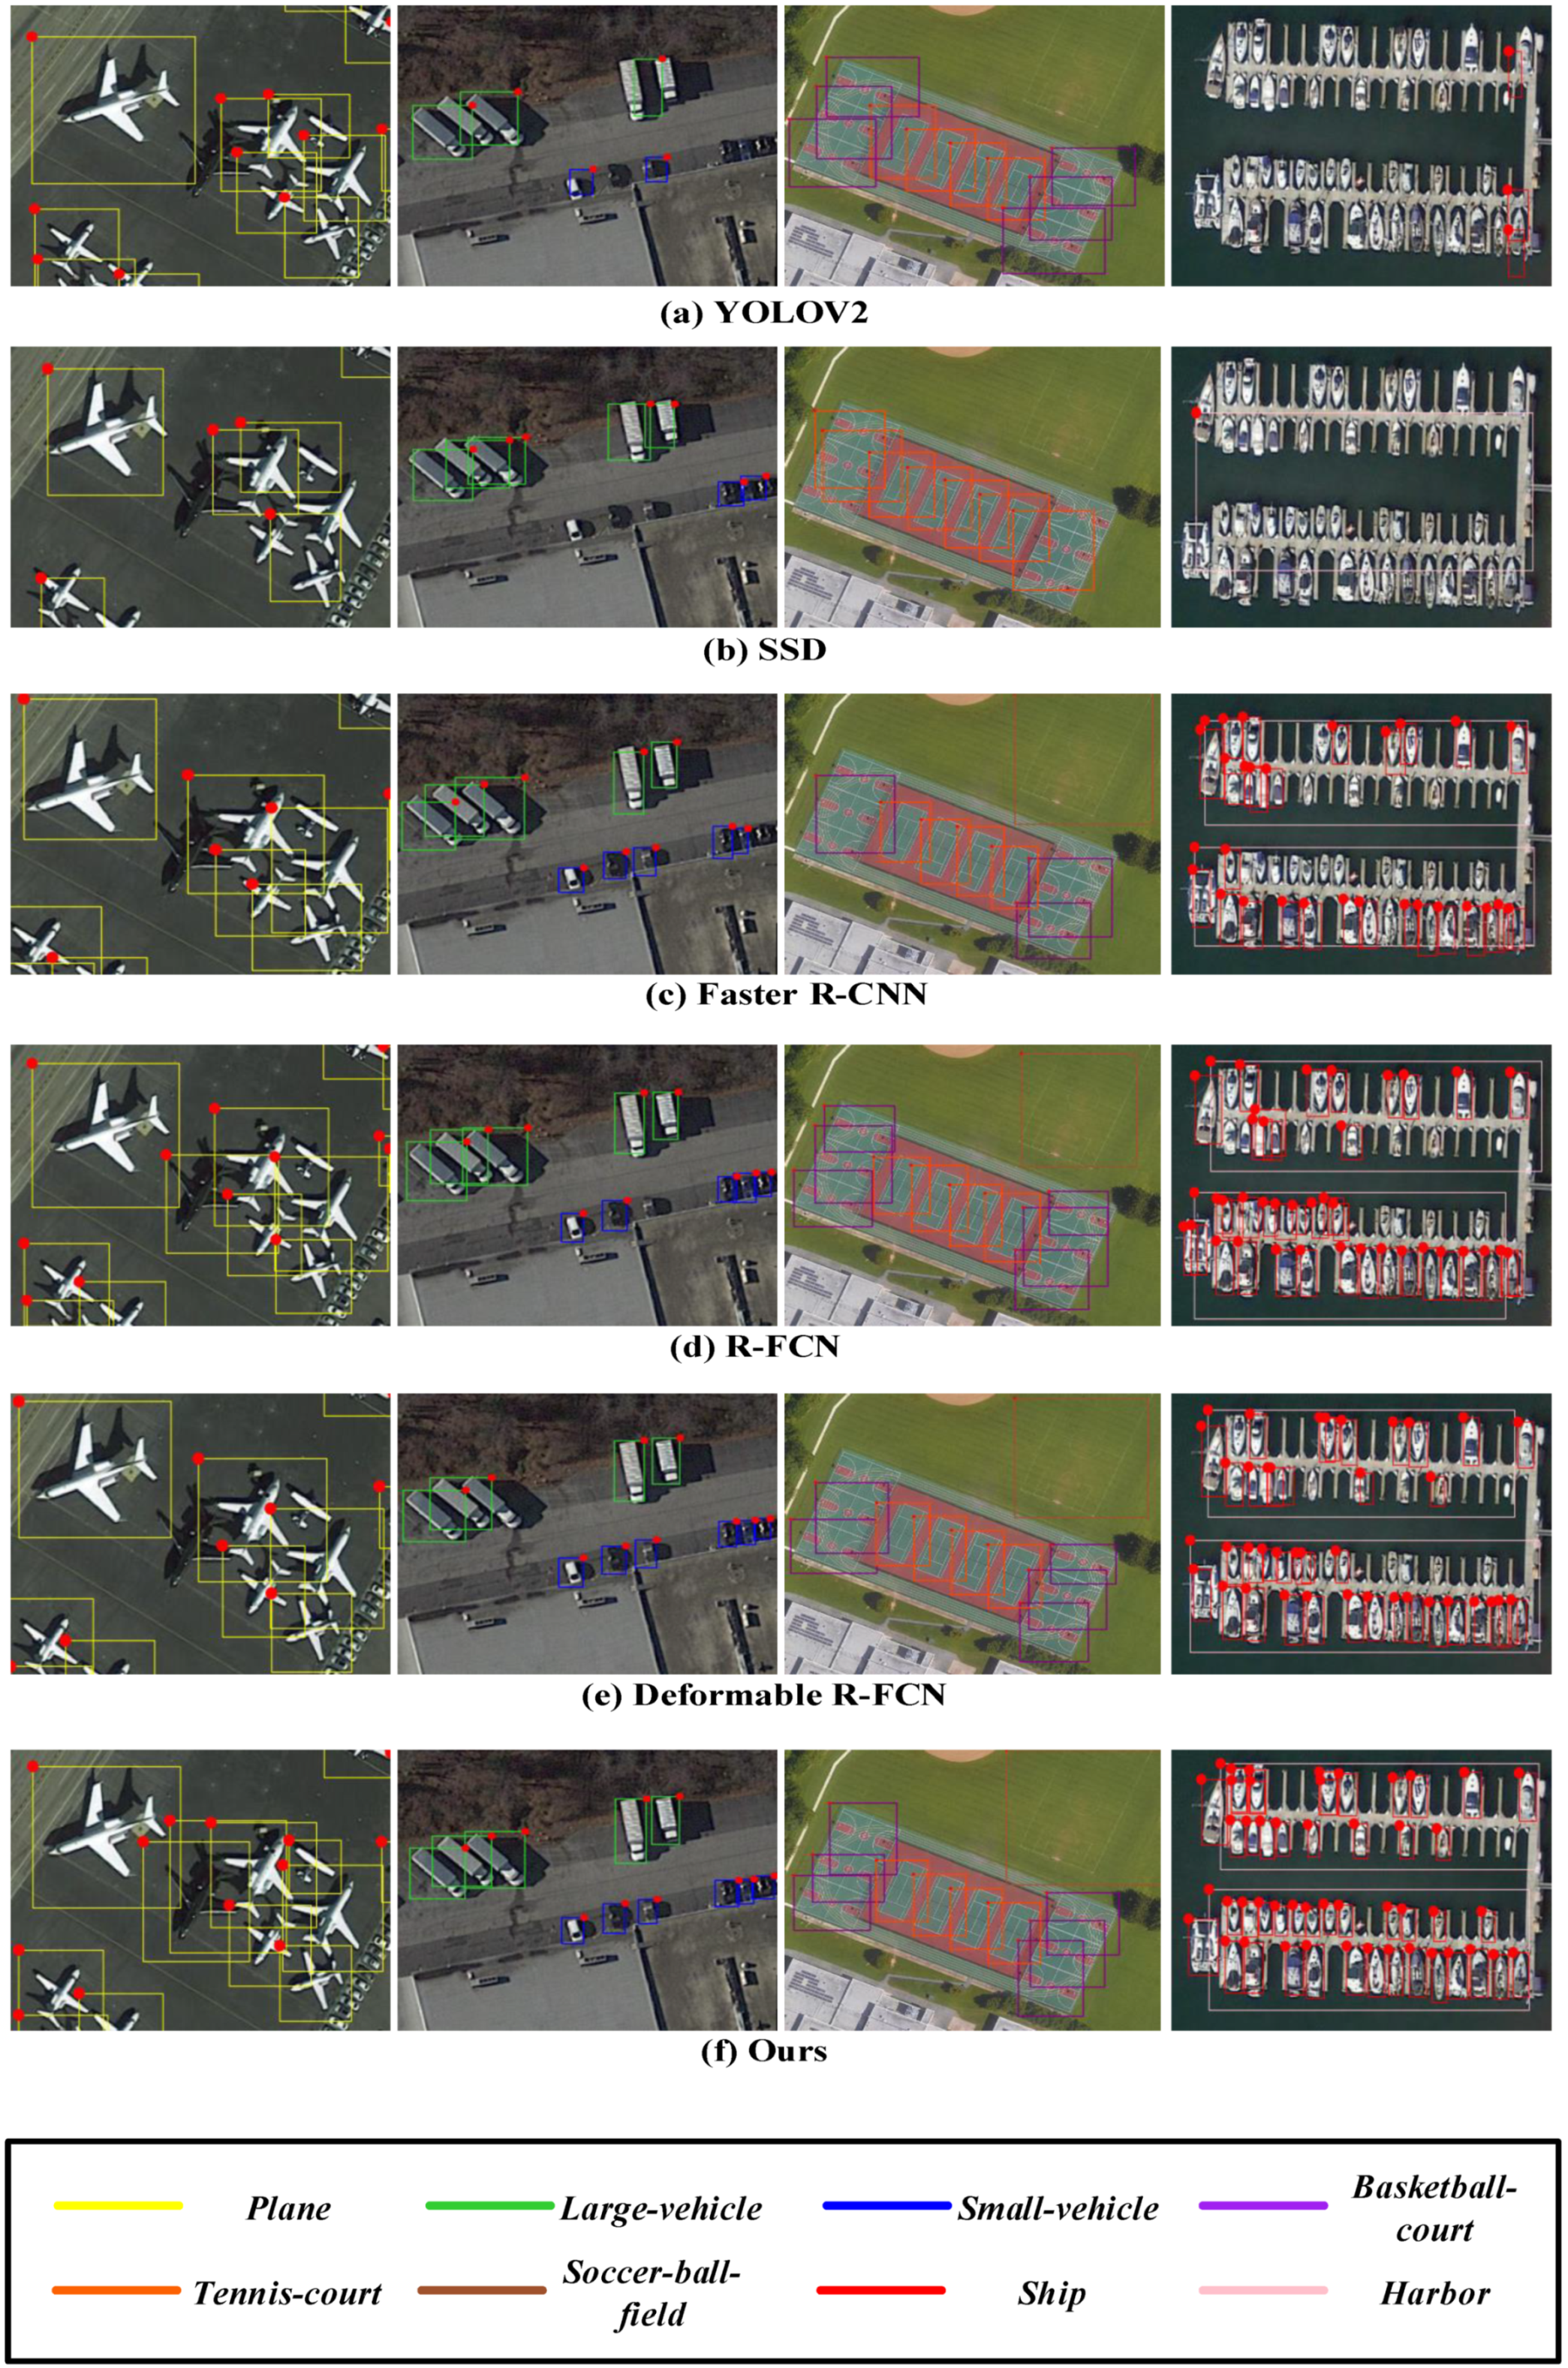
In order to compare our method with other state-of-the-art methods in more detail, we show some subjective detection results obtained on the DOTA dataset in Figure 8. It can be observed that the existing methods are easy to miss and incorrectly detect some objects. For example, other methods miss the vehicle objects (small-vehicle, large-vehicle) of different sizes in second column and the objects (harbor, ship) of different aspect ratios in fourth column. In addition, SSD incorrectly classifies basketball-court as tennis-court in third column. YOLOv2 incorrectly locates the ship objects in the fourth column. Compared with other recent methods, our method adaptively chooses more appropriate scale and aspect ratio object features, thus achieving more accurate object detection.
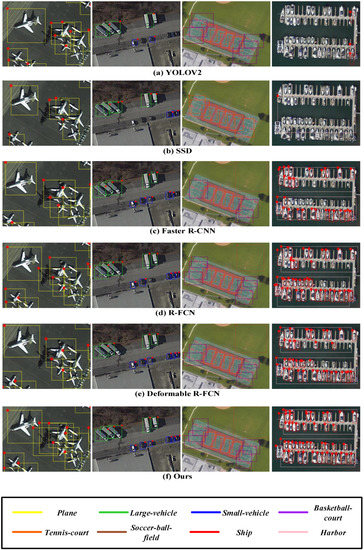
Figure 8.
Comparison of the object detection results of other state-of-the-art methods with our method on the DOTA dataset.
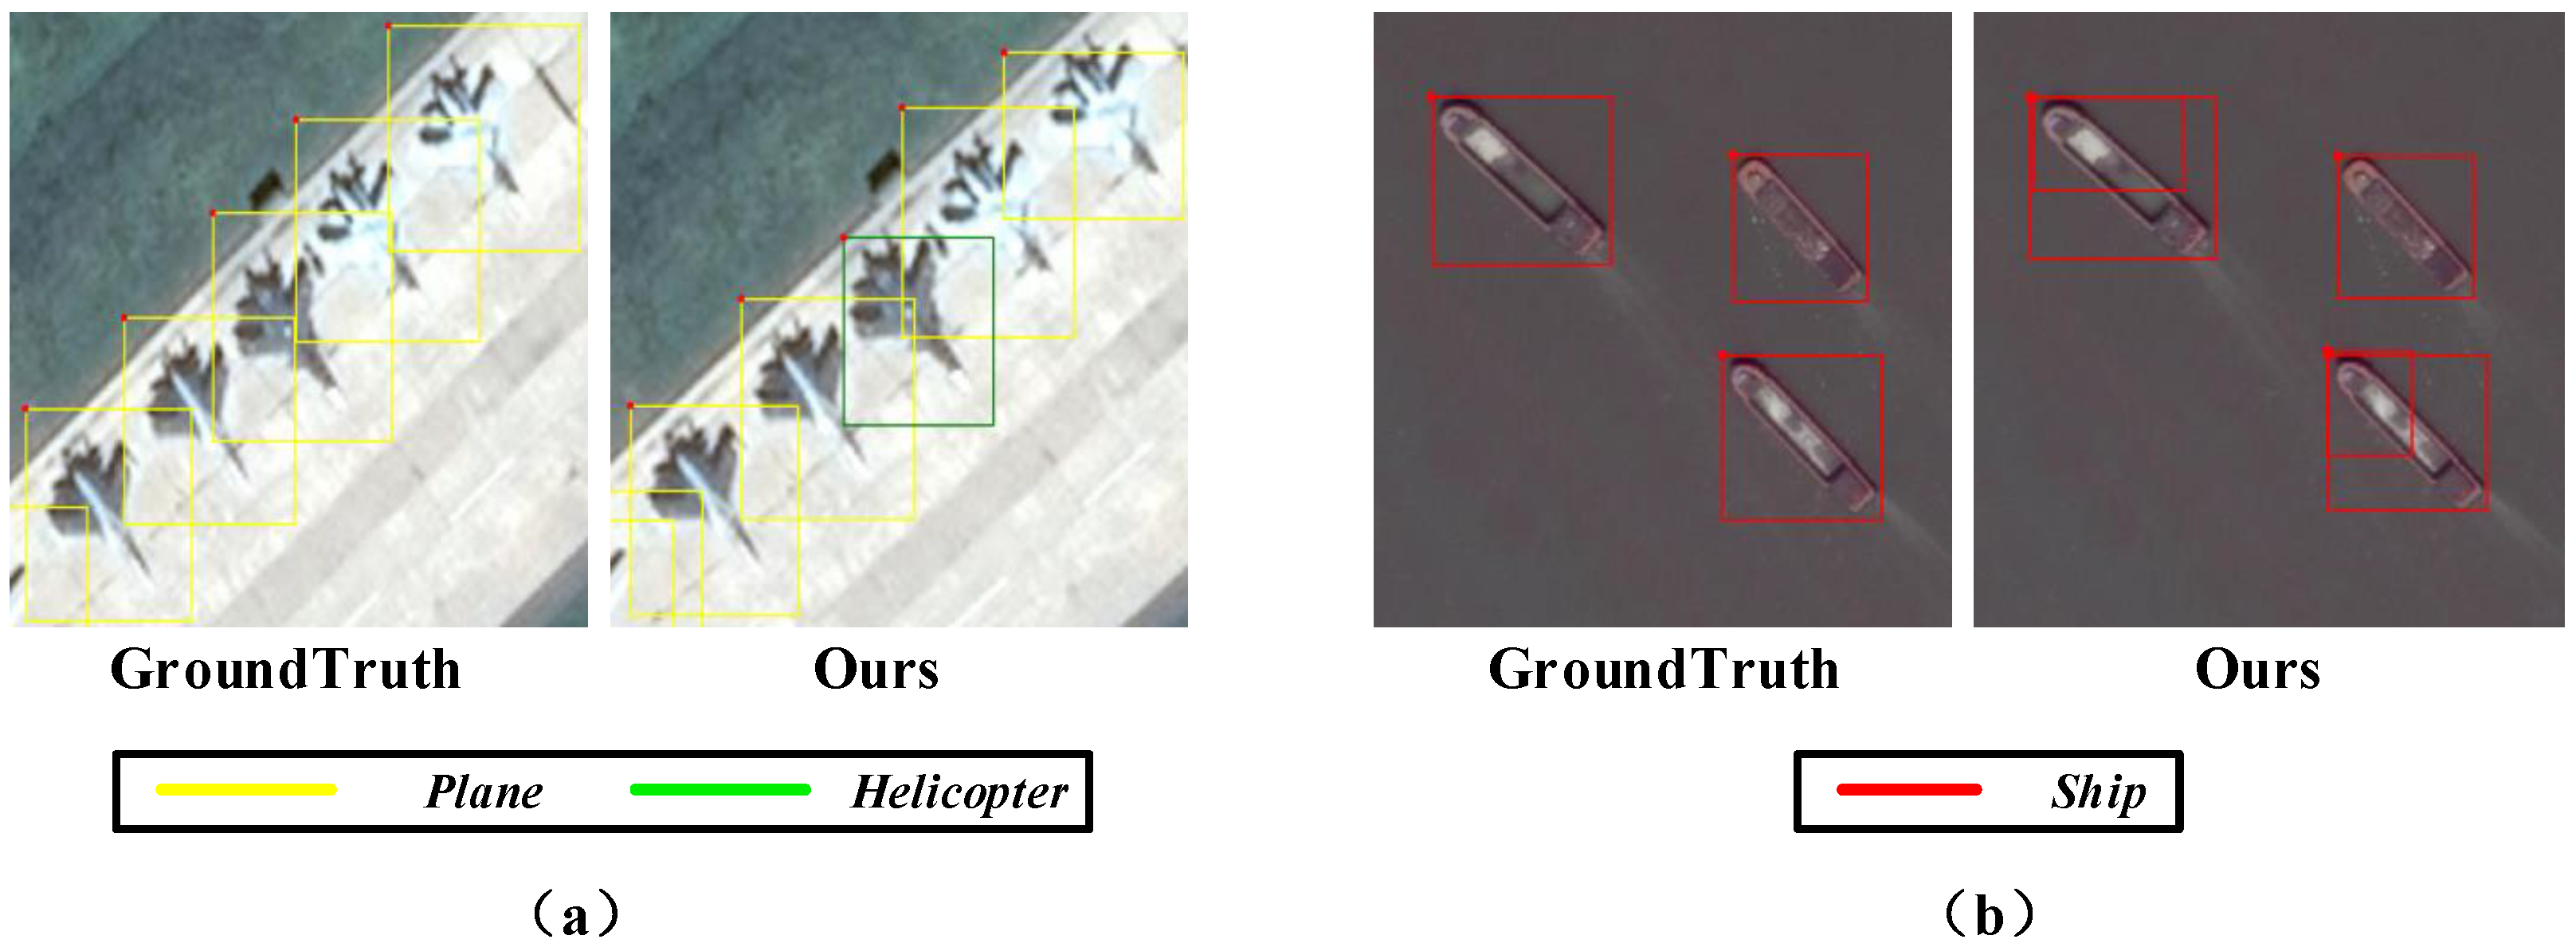
Figure 9 shows two main types of mistakes. The first type of mistake occurs when objects have similar appearance features. For example, in Figure 9a, our method incorrectly classifies the plane object as helicopter. Another case is that our method sometimes generates some noisy bounding boxes that do not tightly surround the objects. For instance, in Figure 9b, some bounding boxes inaccurately located the ship objects, although they are correctly classified. One possible reason for this case is that we divide positive and negative samples using a lower IoU threshold of 0.5 during training, which makes it difficult to train detectors that can effectively reject close false positive samples.
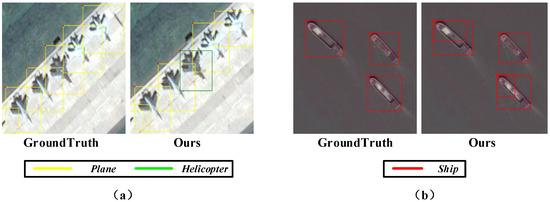
Figure 9.
Failed detection results of our method on the DOTA dataset.
4. Conclusions
In this paper, we have proposed a novel and effective approach to learn an end-to-end Adaptively Aspect Ratio Multi-Scale Network (ARMNet) for object detection in remote sensing images, which adaptively selected useful and discriminative features for objects of various sizes and aspect ratios. The proposed ARMNet approach consisted of a multi-scale feature gate fusion network and an aspect ratio attention network. The ablation study demonstrated the performance improvement of the two components of the overall architecture. Compared with other state-of-the-art methods, the quantitative comparison results on four public datasets for remote sensing object detection have shown the higher detection accuracy of the proposed ARMNet approach. In the future, we hope to leverage the context information to further enhance the discriminability of features and select the appropriate IoU threshold to train object detectors for more accurate location and classification.
References
Author Contributions
Conceptualization, H.Q.; Funding acquisition, H.L., Q.W. and F.M.; Investigation, H.Q.; Methodology, H.Q.; Project administration, H.L.; Supervision, H.L.; Validation, H.Q.; Visualization, H.Q. and Q.W.; Writing—original draft preparation, H.Q., H.L., Q.W., F.M., K.N.N. and H.S.; Writing—review and editing, H.Q., H.L., Q.W. and H.S.
Funding
This work was supported in part by National Natural Science Foundation of China under Grant 61831005, Grant 61525102, Grant 61601102, and Grant 61871087.
Acknowledgments
This author would like to thank the providers of DOTA dataset, NWPU VHR-10 dataset, RSOD dataset and UCAS-AOD dataset. The author would like to express their appreciation to the developers of caffe2 and Detectron for their open source platforms.
Conflicts of Interest
The authors declare no conflict of interest.
References
- Feng, H.; Zou, B.; Tang, Y. Scale-and region-dependence in landscape-PM2.5 correlation: Implications for urban planning. Remote Sens. 2017, 9, 918. [Google Scholar] [CrossRef]
- Leichtle, T.; Geiß, C.; Wurm, M.; Lakes, T.; Taubenböck, H. Unsupervised change detection in VHR remote sensing imagery-an object-based clustering approach in a dynamic urban environment. Int. J. Appl. Earth Obs. Geoinf. 2017, 54, 15–27. [Google Scholar] [CrossRef]
- Kalantar, B.; Mansor, S.B.; Halin, A.A.; Shafri, H.Z.M.; Zand, M. Multiple Moving Object Detection From UAV Videos Using Trajectories of Matched Regional Adjacency Graphs. IEEE Trans. Geosci. Remote Sens. 2017, 55, 5198–5213. [Google Scholar] [CrossRef]
- Xia, G.; Bai, X.; Ding, J.; Zhu, Z.; Belongie, S.; Luo, J.; Datcu, M.; Pelillo, M.; Zhang, L. DOTA: A Large-Scale Dataset for Object Detection in Aerial Images. In Proceedings of the 2018 IEEE/CVF Conference on Computer Vision and Pattern Recognition, Salt Lake City, UT, USA, 18–22 June 2018; pp. 3974–3983. [Google Scholar]
- Zhang, L.; Zhang, Y. Airport Detection and Aircraft Recognition Based on Two-Layer Saliency Model in High Spatial Resolution Remote-Sensing Images. IEEE J. Sel. Top. Appl. Earth Obs. Remote Sens. 2017, 10, 1511–1524. [Google Scholar] [CrossRef]
- Long, Y.; Gong, Y.; Xiao, Z.; Liu, Q. Accurate Object Localization in Remote Sensing Images Based on Convolutional Neural Networks. IEEE Trans. Geosci. Remote Sens. 2017, 55, 2486–2498. [Google Scholar] [CrossRef]
- Yao, X.; Han, J.; Guo, L.; Bu, S.; Liu, Z. A coarse-to-fine model for airport detection from remote sensing images using target-oriented visual saliency and CRF. Neurocomputing 2015, 164, 162–172. [Google Scholar] [CrossRef]
- Han, J.; Zhang, D.; Cheng, G.; Guo, L.; Ren, J. Object Detection in Optical Remote Sensing Images Based on Weakly Supervised Learning and High-Level Feature Learning. IEEE Trans. Geosci. Remote Sens. 2015, 53, 3325–3337. [Google Scholar] [CrossRef]
- Xiao, Z.; Gong, Y.; Long, Y.; Li, D.; Wang, X.; Liu, H. Airport Detection Based on a Multiscale Fusion Feature for Optical Remote Sensing Images. IEEE Geosci. Remote Sens. Lett. 2017, 14, 1469–1473. [Google Scholar] [CrossRef]
- Lowe, D.G. Distinctive image features from scale-invariant keypoints. Int. J. Comput. Vis. 2004, 60, 91–110. [Google Scholar] [CrossRef]
- Dalal, N.; Triggs, B. Histograms of oriented gradients for human detection. In Proceedings of the 2005 IEEE Computer Society Conference on Computer Vision and Pattern Recognition (CVPR’05), San Diego, CA, USA, 20–25 June 2005; Volume 1, pp. 886–893. [Google Scholar]
- Fei-Fei, L.; Perona, P. A Bayesian hierarchical model for learning natural scene categories. In Proceedings of the 2005 IEEE Computer Society Conference on Computer Vision and Pattern Recognition (CVPR’05), San Diego, CA, USA, 20–25 June 2005; Volume 2, pp. 524–531. [Google Scholar]
- Sirmacek, B.; Unsalan, C. Urban-Area and Building Detection Using SIFT Keypoints and Graph Theory. IEEE Trans. Geosci. Remote Sens. 2009, 47, 1156–1167. [Google Scholar] [CrossRef]
- Shi, Z.; Yu, X.; Jiang, Z.; Li, B. Ship Detection in High-Resolution Optical Imagery Based on Anomaly Detector and Local Shape Feature. IEEE Trans. Geosci. Remote Sens. 2014, 52, 4511–4523. [Google Scholar]
- Xiao, Z.; Liu, Q.; Tang, G.; Zhai, X. Elliptic Fourier transformation-based histograms of oriented gradients for rotationally invariant object detection in remote-sensing images. Int. J. Remote Sens. 2015, 36, 618–644. [Google Scholar] [CrossRef]
- Sun, H.; Sun, X.; Wang, H.; Li, Y.; Li, X. Automatic Target Detection in High-Resolution Remote Sensing Images Using Spatial Sparse Coding Bag-of-Words Model. IEEE Geosci. Remote Sens. Lett. 2012, 9, 109–113. [Google Scholar] [CrossRef]
- Chen, X.; Xiang, S.; Liu, C.; Pan, C. Vehicle Detection in Satellite Images by Hybrid Deep Convolutional Neural Networks. IEEE Geosci. Remote Sens. Lett. 2014, 11, 1797–1801. [Google Scholar] [CrossRef]
- Cheng, G.; Zhou, P.; Han, J. Learning Rotation-Invariant Convolutional Neural Networks for Object Detection in VHR Optical Remote Sensing Images. IEEE Trans. Geosci. Remote Sens. 2016, 54, 7405–7415. [Google Scholar] [CrossRef]
- Uijlings, J.R.; Van De Sande, K.E.; Gevers, T.; Smeulders, A.W. Selective search for object recognition. Int. J. Comput. Vis. 2013, 104, 154–171. [Google Scholar] [CrossRef]
- Han, X.; Zhong, Y.; Zhang, L. An efficient and robust integrated geospatial object detection framework for high spatial resolution remote sensing imagery. Remote Sens. 2017, 9, 666. [Google Scholar] [CrossRef]
- Ren, S.; He, K.; Girshick, R.; Sun, J. Faster r-cnn: Towards real-time object detection with region proposal networks. In Advances in Neural Information Processing Systems; Curran Associates: Montreal, QC, Canada, 7–12 December 2015; pp. 91–99. [Google Scholar]
- Chen, F.; Ren, R.; Voorde, T.V.D.; Xu, W.; Zhou, G.; Zhou, Y. Fast Automatic Airport Detection in Remote Sensing Images Using Convolutional Neural Networks. Remote Sens. 2018, 10, 443. [Google Scholar] [CrossRef]
- Simonyan, K.; Zisserman, A. Very deep convolutional networks for large-scale image recognition. arXiv 2014, arXiv:1409.1556. [Google Scholar]
- He, K.; Zhang, X.; Ren, S.; Sun, J. Deep Residual Learning for Image Recognition. In Proceedings of the 2016 IEEE Conference on Computer Vision and Pattern Recognition (CVPR), Las Vegas, NV, USA, 27–30 June 2016; pp. 770–778. [Google Scholar]
- Ding, P.; Zhang, Y.; Deng, W.J.; Jia, P.; Kuijper, A. A light and faster regional convolutional neural network for object detection in optical remote sensing images. ISPRS J. Photogramm. Remote Sens. 2018, 141, 208–218. [Google Scholar] [CrossRef]
- Mou, L.; Zhu, X.X. Vehicle Instance Segmentation from Aerial Image and Video Using a Multi-Task Learning Residual Fully Convolutional Network. arXiv 2018, arXiv:1805.10485. [Google Scholar]
- Guo, W.; Yang, W.; Zhang, H.; Hua, G. Geospatial Object Detection in High Resolution Satellite Images Based on Multi-Scale Convolutional Neural Network. Remote Sens. 2018, 10, 131. [Google Scholar] [CrossRef]
- Jiao, J.; Zhang, Y.; Sun, H.; Yang, X.; Gao, X.; Hong, W.; Fu, K.; Sun, X. A Densely Connected End-to-End Neural Network for Multiscale and Multiscene SAR Ship Detection. IEEE Access 2018, 6, 20881–20892. [Google Scholar] [CrossRef]
- Yang, X.; Sun, H.; Fu, K.; Yang, J.; Sun, X.; Yan, M.; Guo, Z. Automatic ship detection in remote sensing images from google earth of complex scenes based on multiscale rotation dense feature pyramid networks. Remote Sens. 2018, 10, 132. [Google Scholar] [CrossRef]
- Li, Q.; Mou, L.; Liu, Q.; Wang, Y.; Zhu, X.X. HSF-Net: Multiscale Deep Feature Embedding for Ship Detection in Optical Remote Sensing Imagery. IEEE Trans. Geosci. Remote Sens. 2018, 56, 7147–7161. [Google Scholar] [CrossRef]
- Gao, X.; Sun, X.; Zhang, Y.; Yan, M.; Xu, G.; Sun, H.; Jiao, J.; Fu, K. An End-to-End Neural Network for Road Extraction From Remote Sensing Imagery by Multiple Feature Pyramid Network. IEEE Access 2018, 6, 39401–39414. [Google Scholar] [CrossRef]
- Zhu, H.; Chen, X.; Dai, W.; Fu, K.; Ye, Q.; Jiao, J. Orientation robust object detection in aerial images using deep convolutional neural network. In Proceedings of the 2015 IEEE International Conference on Image Processing (ICIP), Quebec, QC, Canada, 27–30 September 2015; pp. 3735–3739. [Google Scholar]
- Lin, T.; Dollár, P.; Girshick, R.; He, K.; Hariharan, B.; Belongie, S. Feature Pyramid Networks for Object Detection. In Proceedings of the 2017 IEEE Conference on Computer Vision and Pattern Recognition (CVPR), Honolulu, HI, USA, 21–26 July 2017; pp. 936–944. [Google Scholar]
- Girshick, R. Fast R-CNN. In Proceedings of the 2015 IEEE International Conference on Computer Vision (ICCV), Santiago, Chile, 7–13 December 2015; pp. 1440–1448. [Google Scholar]
- He, K.; Gkioxari, G.; Dollár, P.; Girshick, R. Mask R-CNN. In Proceedings of the 2017 IEEE International Conference on Computer Vision (ICCV), Venice, Italy, 22–29 October 2017; pp. 2980–2988. [Google Scholar]
- Krizhevsky, A.; Sutskever, I.; Hinton, G.E. Imagenet classification with deep convolutional neural networks. In Advances in Neural Information Processing Systems; Curran Associates: Lake Tahoe, NV, USA, 2–6 December 2012; pp. 1097–1105. [Google Scholar]
- Bodla, N.; Singh, B.; Chellappa, R.; Davis, L.S. Soft-NMS—Improving Object Detection with One Line of Code. In Proceedings of the 2017 IEEE International Conference on Computer Vision (ICCV), Venice, Italy, 22–29 October 2017; pp. 5562–5570. [Google Scholar]
- Paszke, A.; Gross, S.; Chintala, S.; Chanan, G.; Yang, E.; DeVito, Z.; Lin, Z.; Desmaison, A.; Antiga, L.; Lerer, A. Automatic differentiation in PyTorch. Available online: https://pytorch.org/ (accessed on 3 July 2019).
- Foody, G.M. Thematic map comparison. Photogramm. Remote Sens. 2004, 70, 627–633. [Google Scholar] [CrossRef]
- McNemar, Q. Note on the sampling error of the difference between correlated proportions or percentages. Psychometrika 1947, 12, 153–157. [Google Scholar] [CrossRef]
- Dai, J.; Li, Y.; He, K.; Sun, J. R-fcn: Object detection via region-based fully convolutional networks. In Advances in Neural Information Processing Systems; Curran Associates: Barcelona, Spain, 5–10 December 2016; pp. 379–387. [Google Scholar]
- Dai, J.; Qi, H.; Xiong, Y.; Li, Y.; Zhang, G.; Hu, H.; Wei, Y. Deformable Convolutional Networks. In Proceedings of the 2017 IEEE International Conference on Computer Vision (ICCV), Venice, Italy, 22–29 October 2017; pp. 764–773. [Google Scholar]
- Redmon, J.; Farhadi, A. YOLO9000: Better, Faster, Stronger. In Proceedings of the 2017 IEEE Conference on Computer Vision and Pattern Recognition (CVPR), Honolulu, HI, USA, 21–26 July 2017; pp. 6517–6525. [Google Scholar]
- Liu, W.; Anguelov, D.; Erhan, D.; Szegedy, C.; Reed, S.; Fu, C.Y.; Berg, A.C. Ssd: Single shot multibox detector. In European Conference on Computer Vision; Springer: Cham, Switzerland, 2016; pp. 21–37. [Google Scholar]
- Ioffe, S.; Szegedy, C. Batch normalization: Accelerating deep network training by reducing internal covariate shift. In Proceedings of the International Conference on International Conference on Machine Learning, Lille, France, 6–11 July 2015; pp. 448–456. [Google Scholar]
- Yan, J.; Wang, H.; Yan, M.; Diao, W.; Sun, X.; Li, H. IoU-Adaptive Deformable R-CNN: Make Full Use of IoU for Multi-Class Object Detection in Remote Sensing Imagery. Remote Sens. 2019, 11, 286. [Google Scholar] [CrossRef]
- Azimi, S.M.; Vig, E.; Bahmanyar, R.; Körner, M.; Reinartz, P. Towards multi-class object detection in unconstrained remote sensing imagery. arXiv 2018, arXiv:1807.02700. [Google Scholar]


© 2019 by the authors. Licensee MDPI, Basel, Switzerland. This article is an open access article distributed under the terms and conditions of the Creative Commons Attribution (CC BY) license (http://creativecommons.org/licenses/by/4.0/).