Article

Power Pylon Reconstruction Based on Abstract Template Structures Using Airborne LiDAR Data

1
College of Geoscience and Surveying Engineering, China University of Mining & Technology (Beijing), Beijing 100083, China
2
Key Laboratory of Digital Earth Science, Institute of Remote Sensing and Digital Earth, Chinese Academy of Sciences, Beijing 100094, China
3
University of Chinese Academy of Science, Beijing 100049, China
4
School of Surveying and Land Information Engineering, Henan Polytechnic University, Jiaozuo 454003, Henan, China
5
Department of Geography and the Environment, University of North Texas, Denton, TX 76203, USA
6
Kazakh National Research Technical University named after K.I.Satpayev, Almaty 050013, Kazakhstan
*
Author to whom correspondence should be addressed.
Remote Sens. 2019, 11(13), 1579; https://doi.org/10.3390/rs11131579
Submission received: 15 May 2019 / Revised: 20 June 2019 / Accepted: 2 July 2019 / Published: 3 July 2019

Abstract

:
As an important power facility for transmission corridors, automatic three-dimensional (3D) reconstruction of the pylon plays an important role in the development of smart grid. In this study, a novel three-dimensional reconstruction method using airborne LiDAR (Light Detection And Ranging) point cloud is developed and tested. First, a principal component analysis (PCA) algorithm is performed for pylon redirection based on the structural feature of the upper part of a pylon. Then, based on the structural similarity of a pylon, a pylon is divided into three parts that are inverted triangular pyramid lower structures, quadrangular frustum pyramid middle structures, and complex upper or lateral structures. The reconstruction of the inverted triangular pyramid structures and quadrangular frustum pyramid structures is based on prior knowledge and a data-driven strategy, where the 2D alpha shape algorithm is used to obtain contour points and 2D linear fitting is carried out based on the random sample consensus (RANSAC) method. Complex structures’ reconstruction is based on the priori abstract template structure and a data-driven strategy, where the abstract template structure is used to determine the topological relationship among corner points and the image processing method is used to extract corner points of the abstract template structure. The main advantages in the proposed method include: (1) Improving the accuracy of the pylon decomposition method through introducing a new feature to identify segmentation positions; (2) performing the internal structure of quadrangular frustum pyramids reconstruction; (3) establishing the abstract template structure and using image processing methods to improve computational efficiency of pylon reconstruction. Eight types of pylons are tested in this study, and the average error of pylon reconstruction is 0.32 m and the average of computational time is 0.8 s. These results provide evidence that the pylon reconstruction method developed in this study has high accuracy, efficiency, and applicability.

1. Introduction

As important electric transmission facilities of transmission corridors, the safe and reliable operation of power pylons and lines has a direct impact on the stable development of global and national economy [1,2,3]. In order to ensure stable and continuous supply of electricity, it is necessary to conduct regular inspections of transmission facilities. Globally, high-voltage power lines will increase from 5.5 million km in 2014 to 6.8 million km in 2020 [4]. The traditional method of inspection is usually carried out by humans using instruments or their eyes while driving or walking under the power pylons and lines. Due to the long transmission line of high voltage and the complex terrain, the inspection work is labor intensive, has low efficiency, and is sometimes dangerous. With the rapid development of remote sensing technology, a variety of remote sensing technologies have been applied to power transmission facilities inspection [5], such as synthetic aperture radar [6], optical satellite images [7], optical aerial images [8], airborne LiDAR (Light Detection And Ranging) [9], and mobile LiDAR [10]. Among these methods, airborne LiDAR has been widely applied in power transmission facility inspection because it can directly and quickly acquire high-precision and dense 3D point clouds without being limited by illumination and terrain [11,12,13].
Based on airborne LiDAR data, point cloud classification and 3D reconstruction have become a hot topic in photogrammetry and remote sensing. As an important part of the power transmission system, the 3D model of power pylon can be applied in urban planning, environmental protection, disaster management, numerical simulation analysis on weather, tree growth, and three-dimensional visualization of transmission corridors [14,15]. Therefore, it is necessary to develop an efficient, accurate, and universal method of pylon reconstruction.

1.1. Related Work

At present, the published methods of pylon reconstruction are mainly divided into four categories: Manual or semi-automatic reconstruction using modeling software [16], automatic data-driven [17], model-driven [15], and hybrid-driven [18,19,20] reconstruction methods. For the first type method, although the reconstructed pylon model has high precision, it is inefficient. Kwoczy′nska and Dobek [16] used the pylon reconstruction module in MicroStation V8i software for pylon reconstruction and the computational time for reconstructing a pylon is more than 5 minutes. For the second method, if pylon point cloud has low noise and high fidelity, the result of pylon reconstruction can be good. Han [17] proposed a data-driven method for pylon reconstruction. In this method, a three-dimensional space grid was first established and binarized, and then the image contour tracking method was used to track the three-dimensional line structure. Finally, the three-dimensional model of pylon was constructed based on the feature of lines in three-dimensional space. However, if there are many missing and noise points in acquired point cloud, it becomes very hard to reconstruct pylon structure using this method. Moreover, a large amount of iteration times is required in recognizing the type of pylon. Compared with the second method, the third method greatly reduces the data requirement and is robust, but it is limited by the predefined model library. For example, Guo et al. [15] proposed a stochastic geometric approach for pylon reconstruction. This method transforms the pylon reconstruction process to an energetic formulation, where a combined Markov chain Monte Carlo (MCMC) method and the simulated annealing (SA) algorithm is used to optimize the energy formulation for finding the optimal parameters of pylons. However, due to the similarity of the pylon structure, it causes redundancy parameter to be calculated.
Unlike the second and third methods, the fourth method uses a hybrid-driven strategy for block reconstruction, and thus improves the efficiency of pylon reconstruction. Based on the structural height of a pylon, it is divided into three parts: Pylon foot, pylon body, and pylon head. Pylon foot is manually reconstructed, pylon body is reconstructed based on data-driven strategy, and pylon head is reconstructed based on model-driven strategy. For example, Chen et al. [18] divided the pylon into pylon foot, pylon body, and pylon head based on local maximum point density. Then, the frame of pylon body was reconstructed by fitting ridge lines. Subsequently, the type of the pylon was recognized by the features extracted based on points elevation histogram. But the 3D models of pylon head and foot were manually reconstructed. Later, this method was improved by Li et al. [19]. However, the pylon decomposition approach in this method is not suitable for some pylons whose shape are like cups and cat heads and the process of pylon reconstruction is only semi-automatic. Zhou et al. [20] divided the pylon into pylon body and head based on a statistical analysis approach. The frame of pylon body was reconstructed by fitting ridge lines. The type of pylon head was recognized by a shape context algorithm, and the associated parameters were estimated by a Metropolis–Hastings (MH) sampler coupled with a simulated annealing (SA) algorithm. This method effectively improves the efficiency of pylon reconstruction, but is still limited by the predefined model library.

1.2. Contributions

As a kind of artificial object with a specific structure, the pylon contains lines according to certain rules. The core of pylon reconstruction is determining the 3D coordinates of lines and the topological relationship among them. Different from other pylon reconstruction methods, this paper introduces a novel method for power pylon reconstruction using airborne LiDAR data, where the abstract template structure based on multi-type pylons is established to determine the topological relationship among lines and then the data-driven strategy is used for instance reconstruction.
The point-cloud data processing flowchart of the proposed method is shown in Figure 1. First, the pylon is redirected based on the upper structure of it. Then, based on the similarity of the tower structure, the pylon is divided into three parts: Inverted triangular pyramids (lower structure), quadrangular frustum pyramids (middle structure), and complex upper or lateral structures. Finally, the inverted triangular pyramids and quadrangular frustum pyramids are reconstructed based on the data-driven strategy. In order to reconstruct the complex structures, the abstract template structure is pre-established to determine topological relationships among lines, and then the data-driven strategy is used to reconstruct the complex structures.

1.3. Overview

The rest of the paper is organized as follows. Section 2 introduces the pylon redirection, decomposition, and reconstruction method in detail. Experimental data and their characteristics are described in Section 3. The results with multi-type pylon reconstruction are shown in Section 4. Discussion of the influencing factors on pylon reconstruction is presented in Section 5, followed by conclusions in Section 6.

2. Methodology

By analyzing the geometric characteristics of various power pylons, the entire structure of power towers can be divided into three parts: The inverted triangular pyramid structure, the quadrangular frustum pyramid structure, and the complex structure, as shown in Figure 2. Different structures are reconstructed with different modeling strategies. Section 2.1 firstly introduces pylon redirection method. The pylon decomposition classification method is given in Section 2.2. Then, Section 2.3 and Section 2.4, respectively, introduce a method to reconstruct the inverted triangular pyramid structure and the quadrangular frustum pyramid structure. Finally, the method of the complex structure reconstruction is introduced detailly in Section 2.5.

2.1. Pylon Redirection

Although the general structure of power pylons is symmetric, pylons extracted from LiDAR point clouds of electric transmission corridors often exhibit arbitrary orientations on the horizontal plane. In order to make full use of the pylon structural symmetry and facilitate the subsequent pylon decomposition and reconstruction, it is necessary to rotate pylons by a certain angle θ along the Z axis. Since the horizontal orientation of pylon depends on the upper structure of pylon, upper pylon scan points are projected onto the XY plane for uniform sampling. Then, the principal component analysis (PCA) algorithm is used to calculate the eigenvalues and eigenvectors of sampled point cloud, and eigenvector V(v1,v2) corresponding to the minimum eigenvalue is designated as the X′ axis. Finally, rotation angle θ and point coordinates (xp′, yp′) are calculated by Equation (1). The projection views of pylon after redirection are shown in Figure 3.
{ θ = arccos ( v 1 v 1 2 + v 2 2 ) x p = x p cos ( θ ) y p sin ( θ ) y p = x p sin ( θ ) + y p cos ( θ )

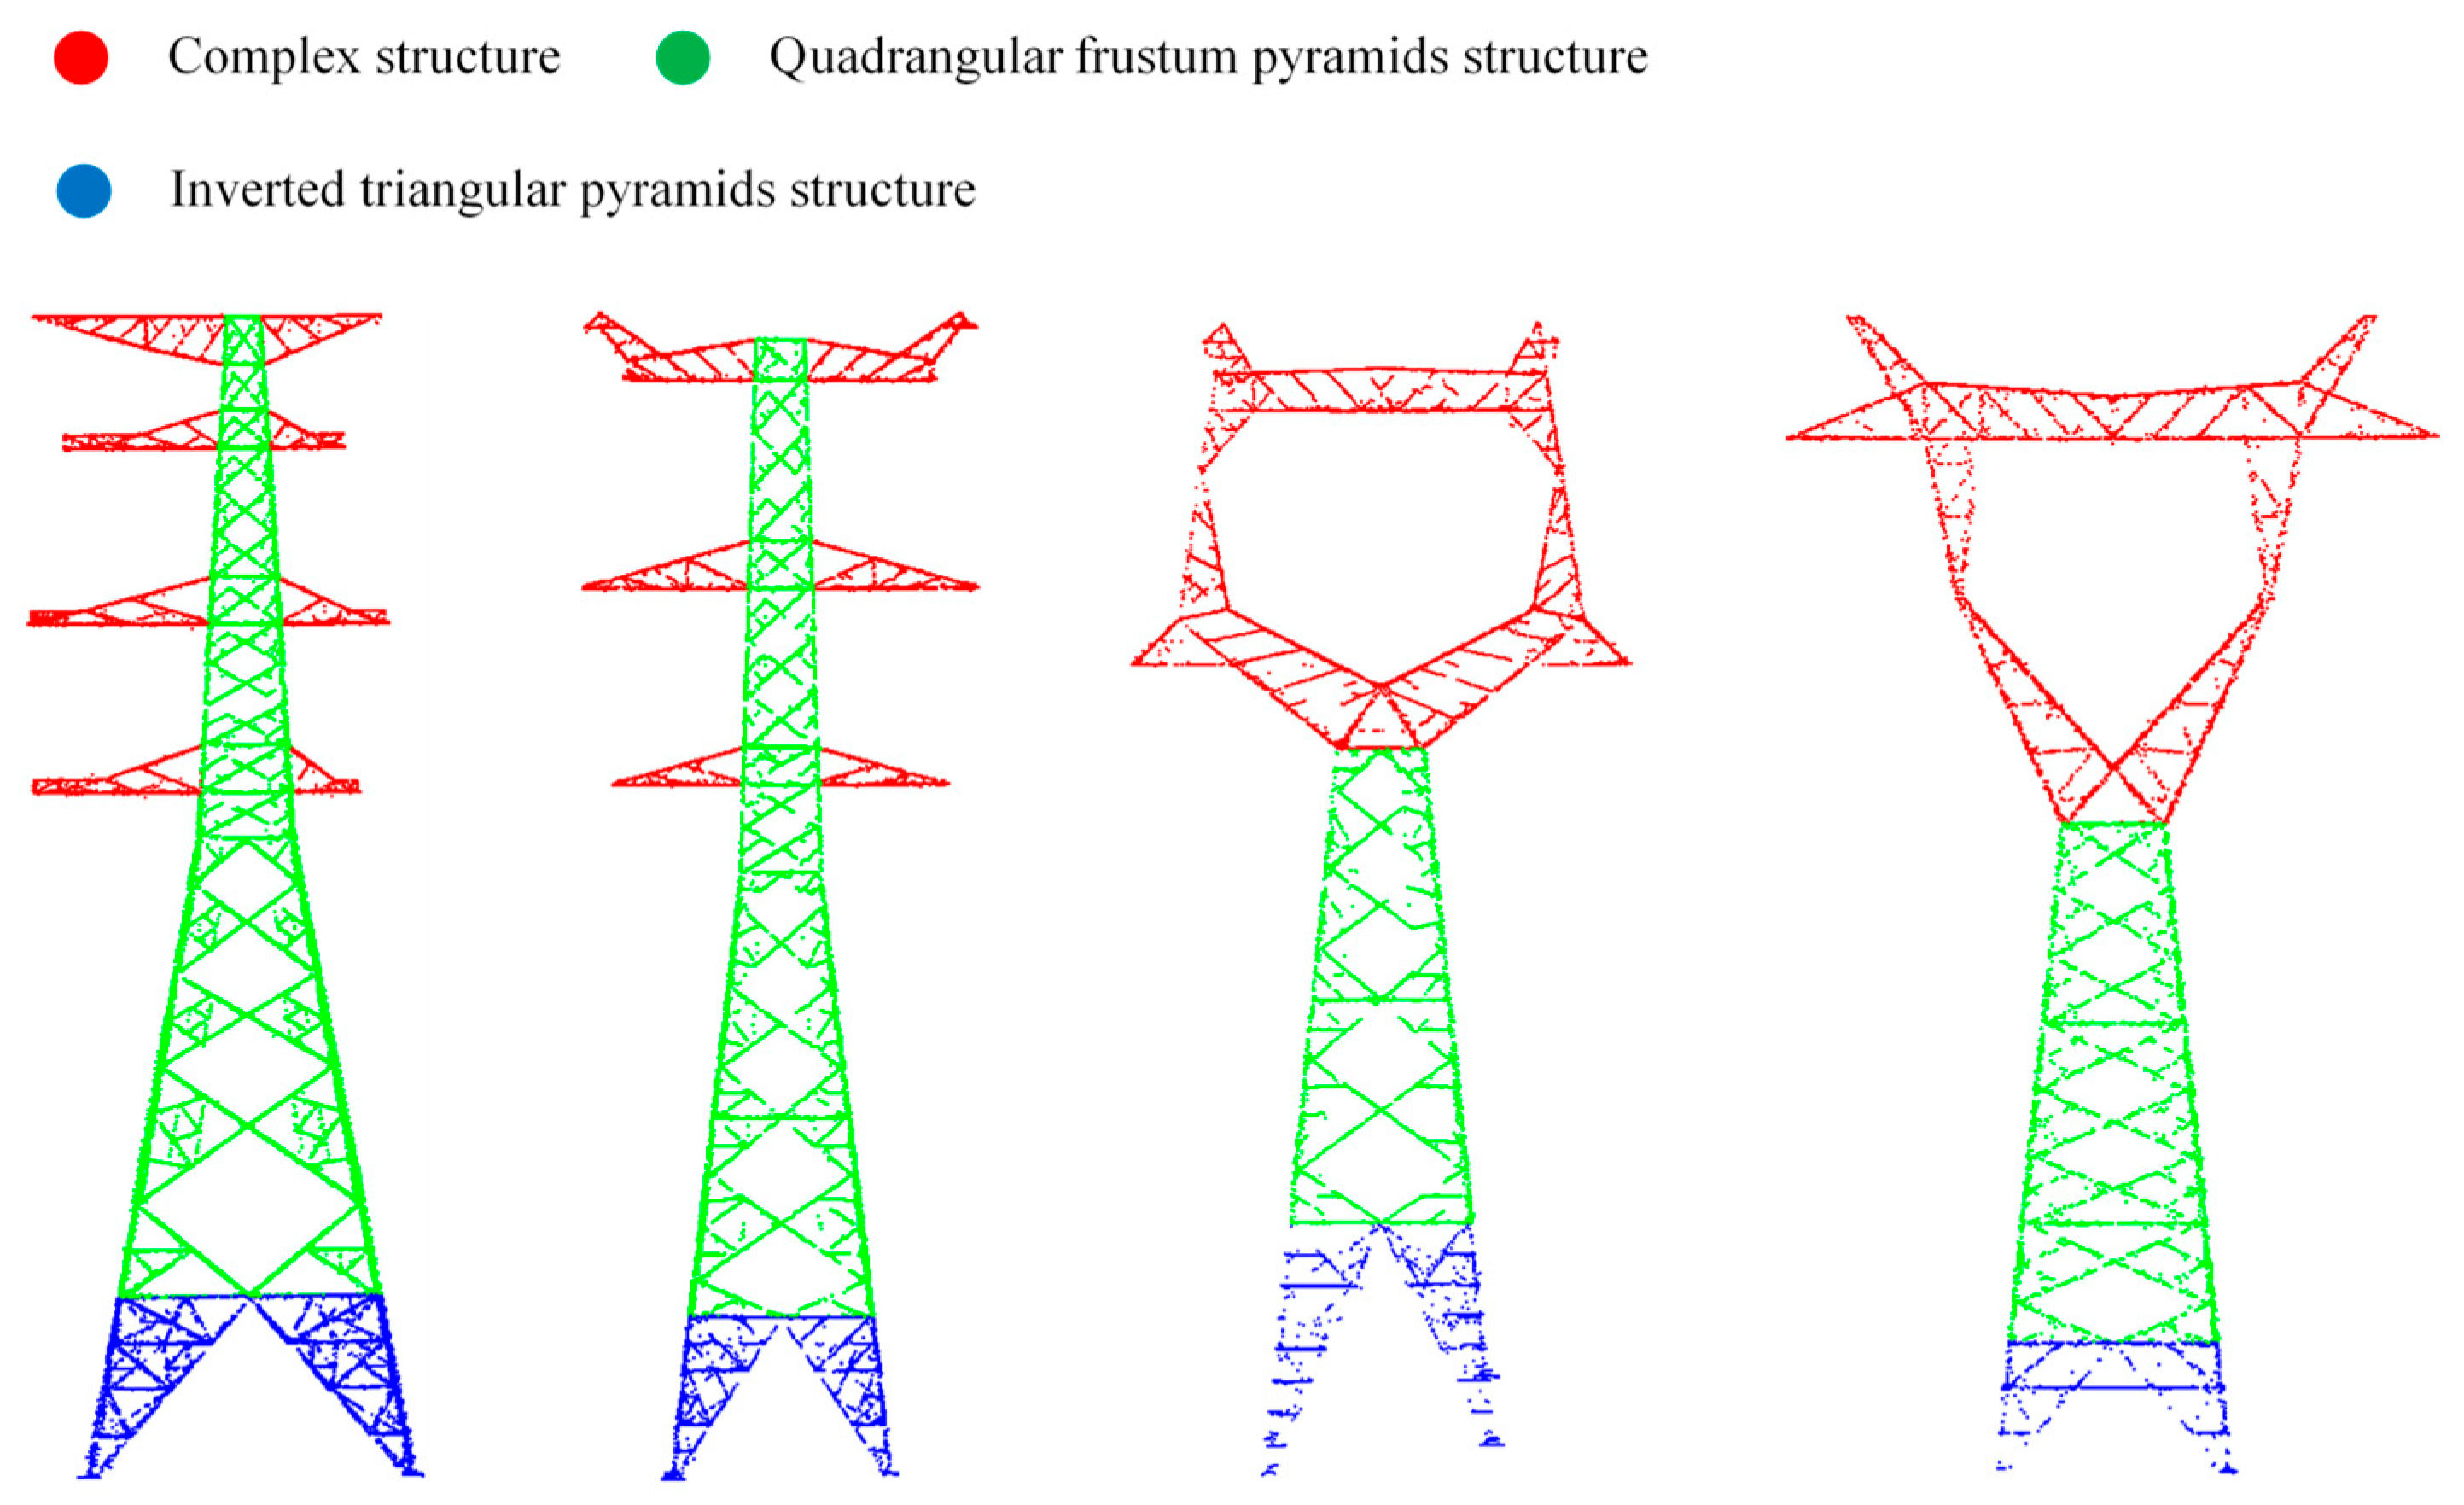
2.2. Pylon Decomposition

As mentioned above, a pylon can be divided into three parts, which are the inverted triangular pyramid structure, the quadrangular frustum pyramid structure, and the complex structure. According to the shape of the complex structure, the complex structure can be classified into type-T with non-inner contour and type-O with inner contours, as shown in Figure 4.
Firstly, the segmentation positions need to be identified for pylon decomposition. Then, in order to distinguish the complex structure types, it is necessary to find the key segmentation position. The component above the key segmentation position is used to detect whether there are inner contours. The part below the key segmentation position includes an inverted triangular pyramid lower structure and quadrangular pyramid middle structure. Finally, the image processing method is used to identify the type of complex structure.

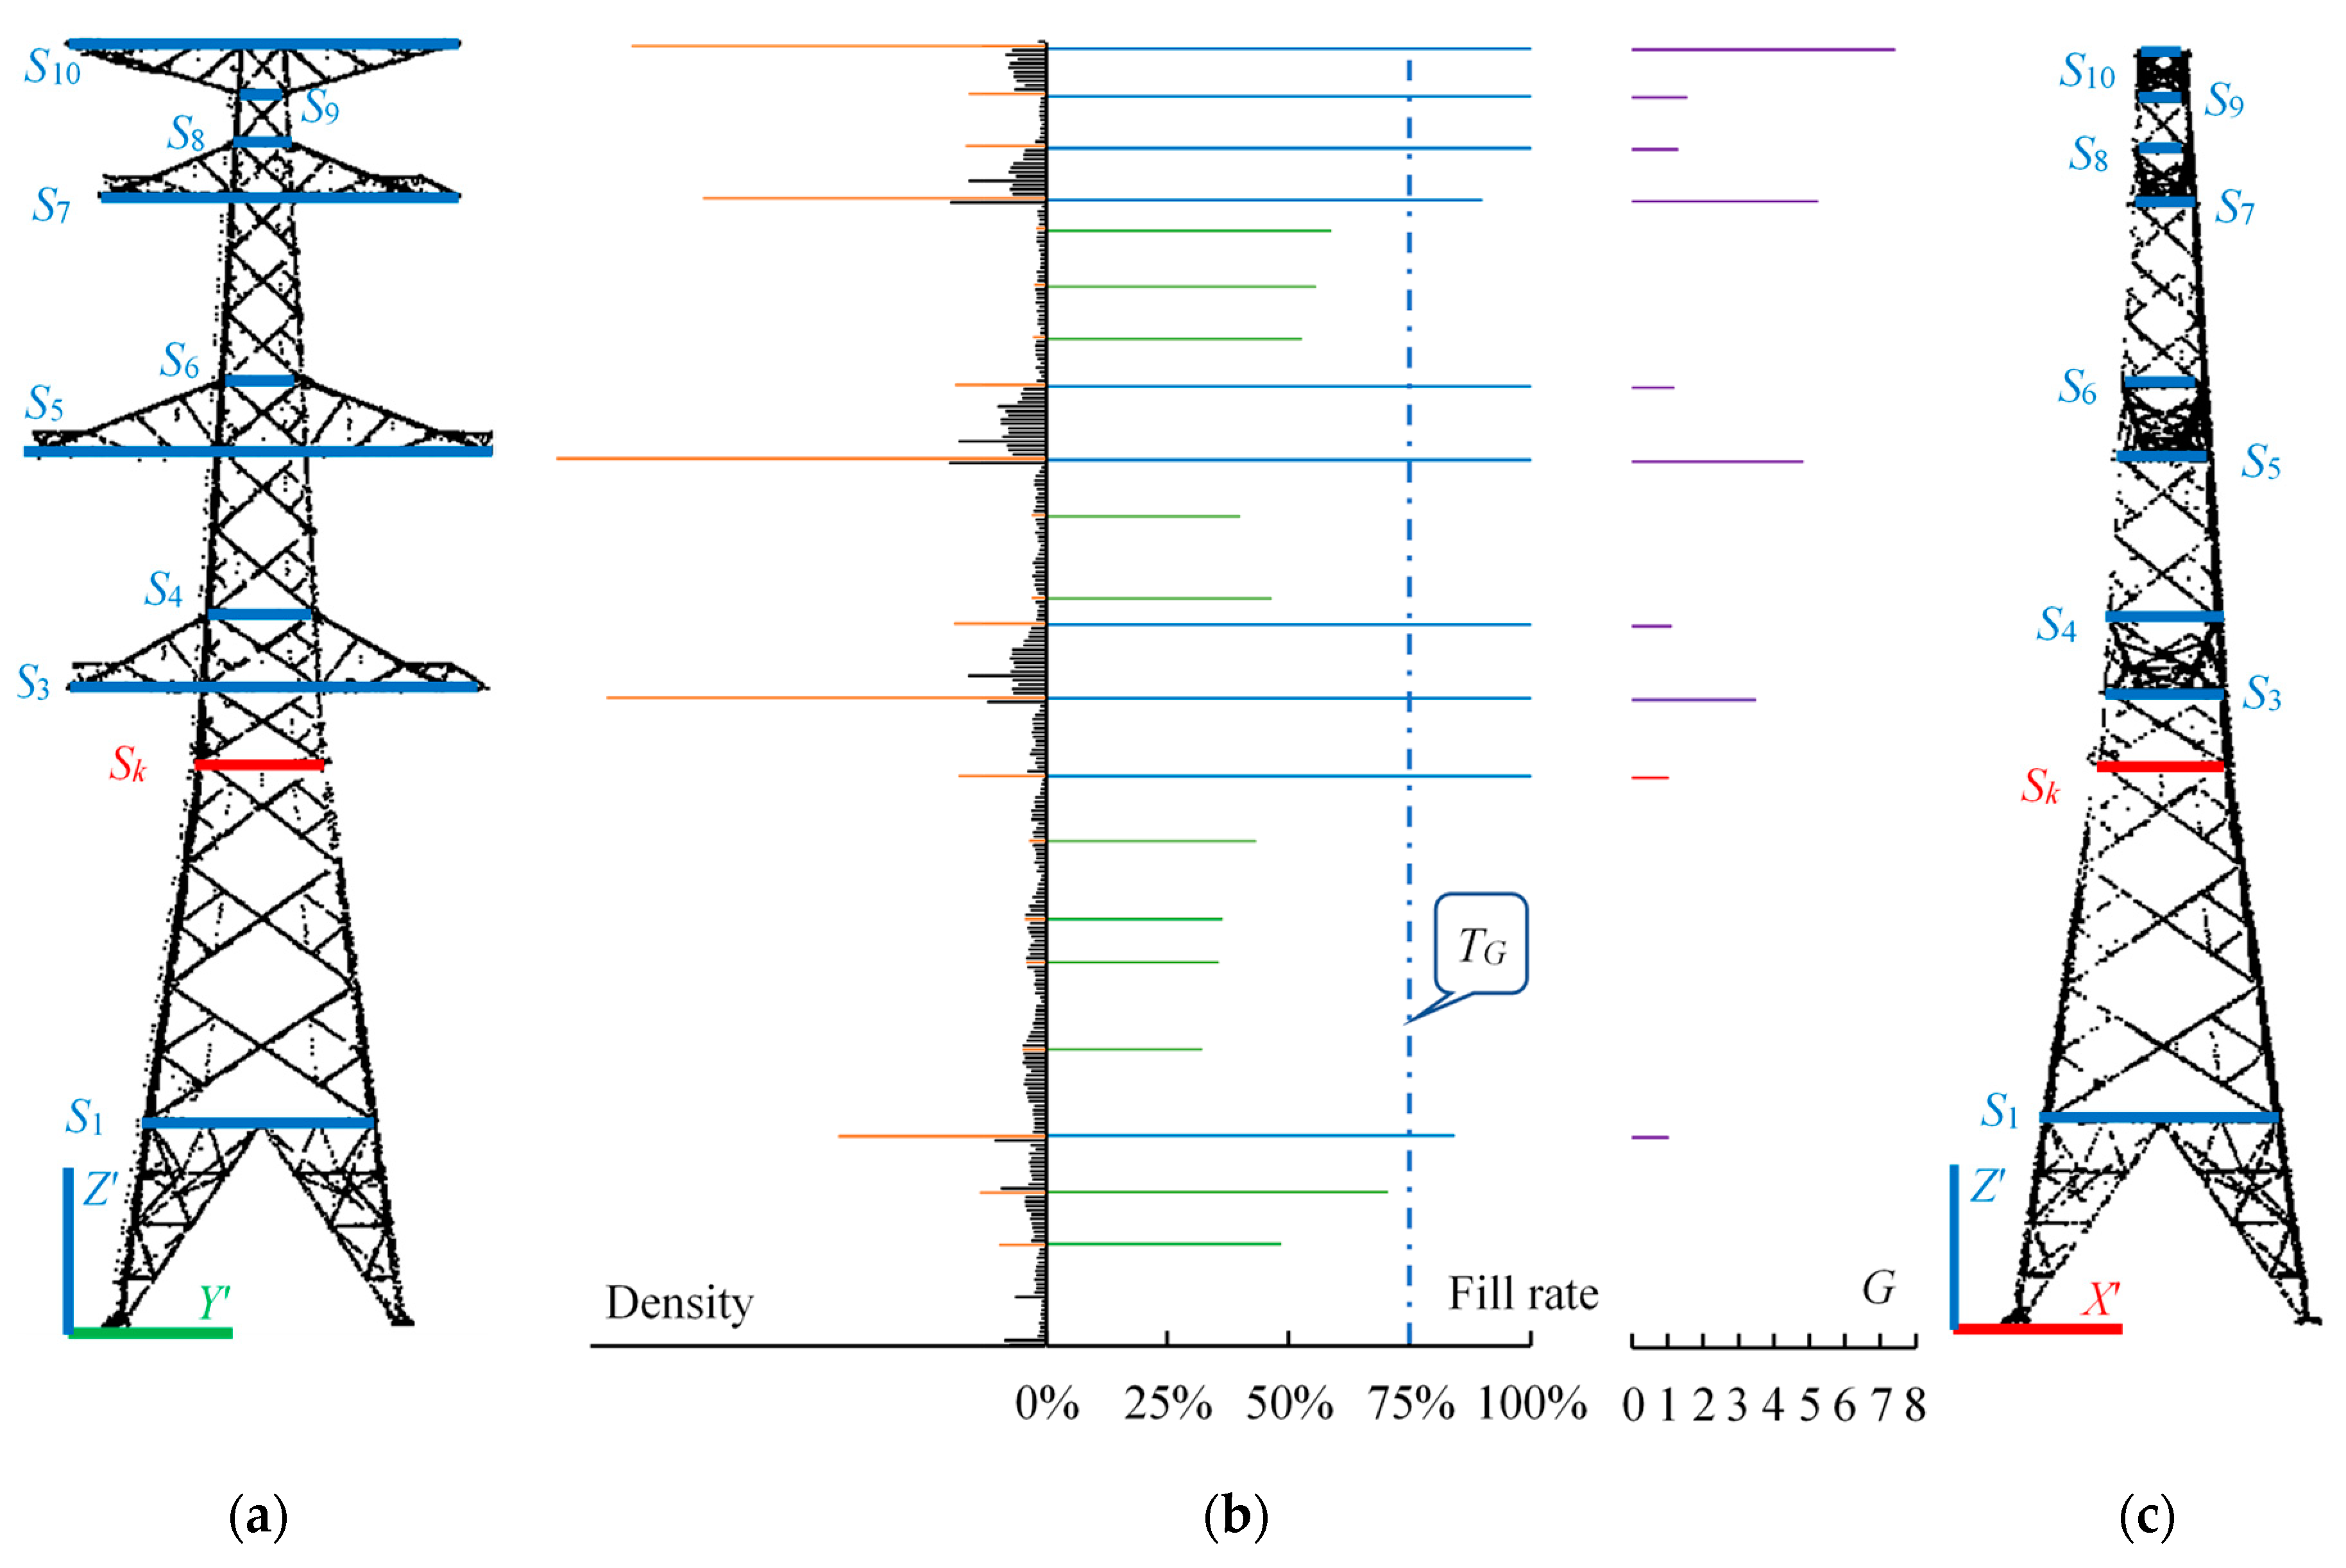
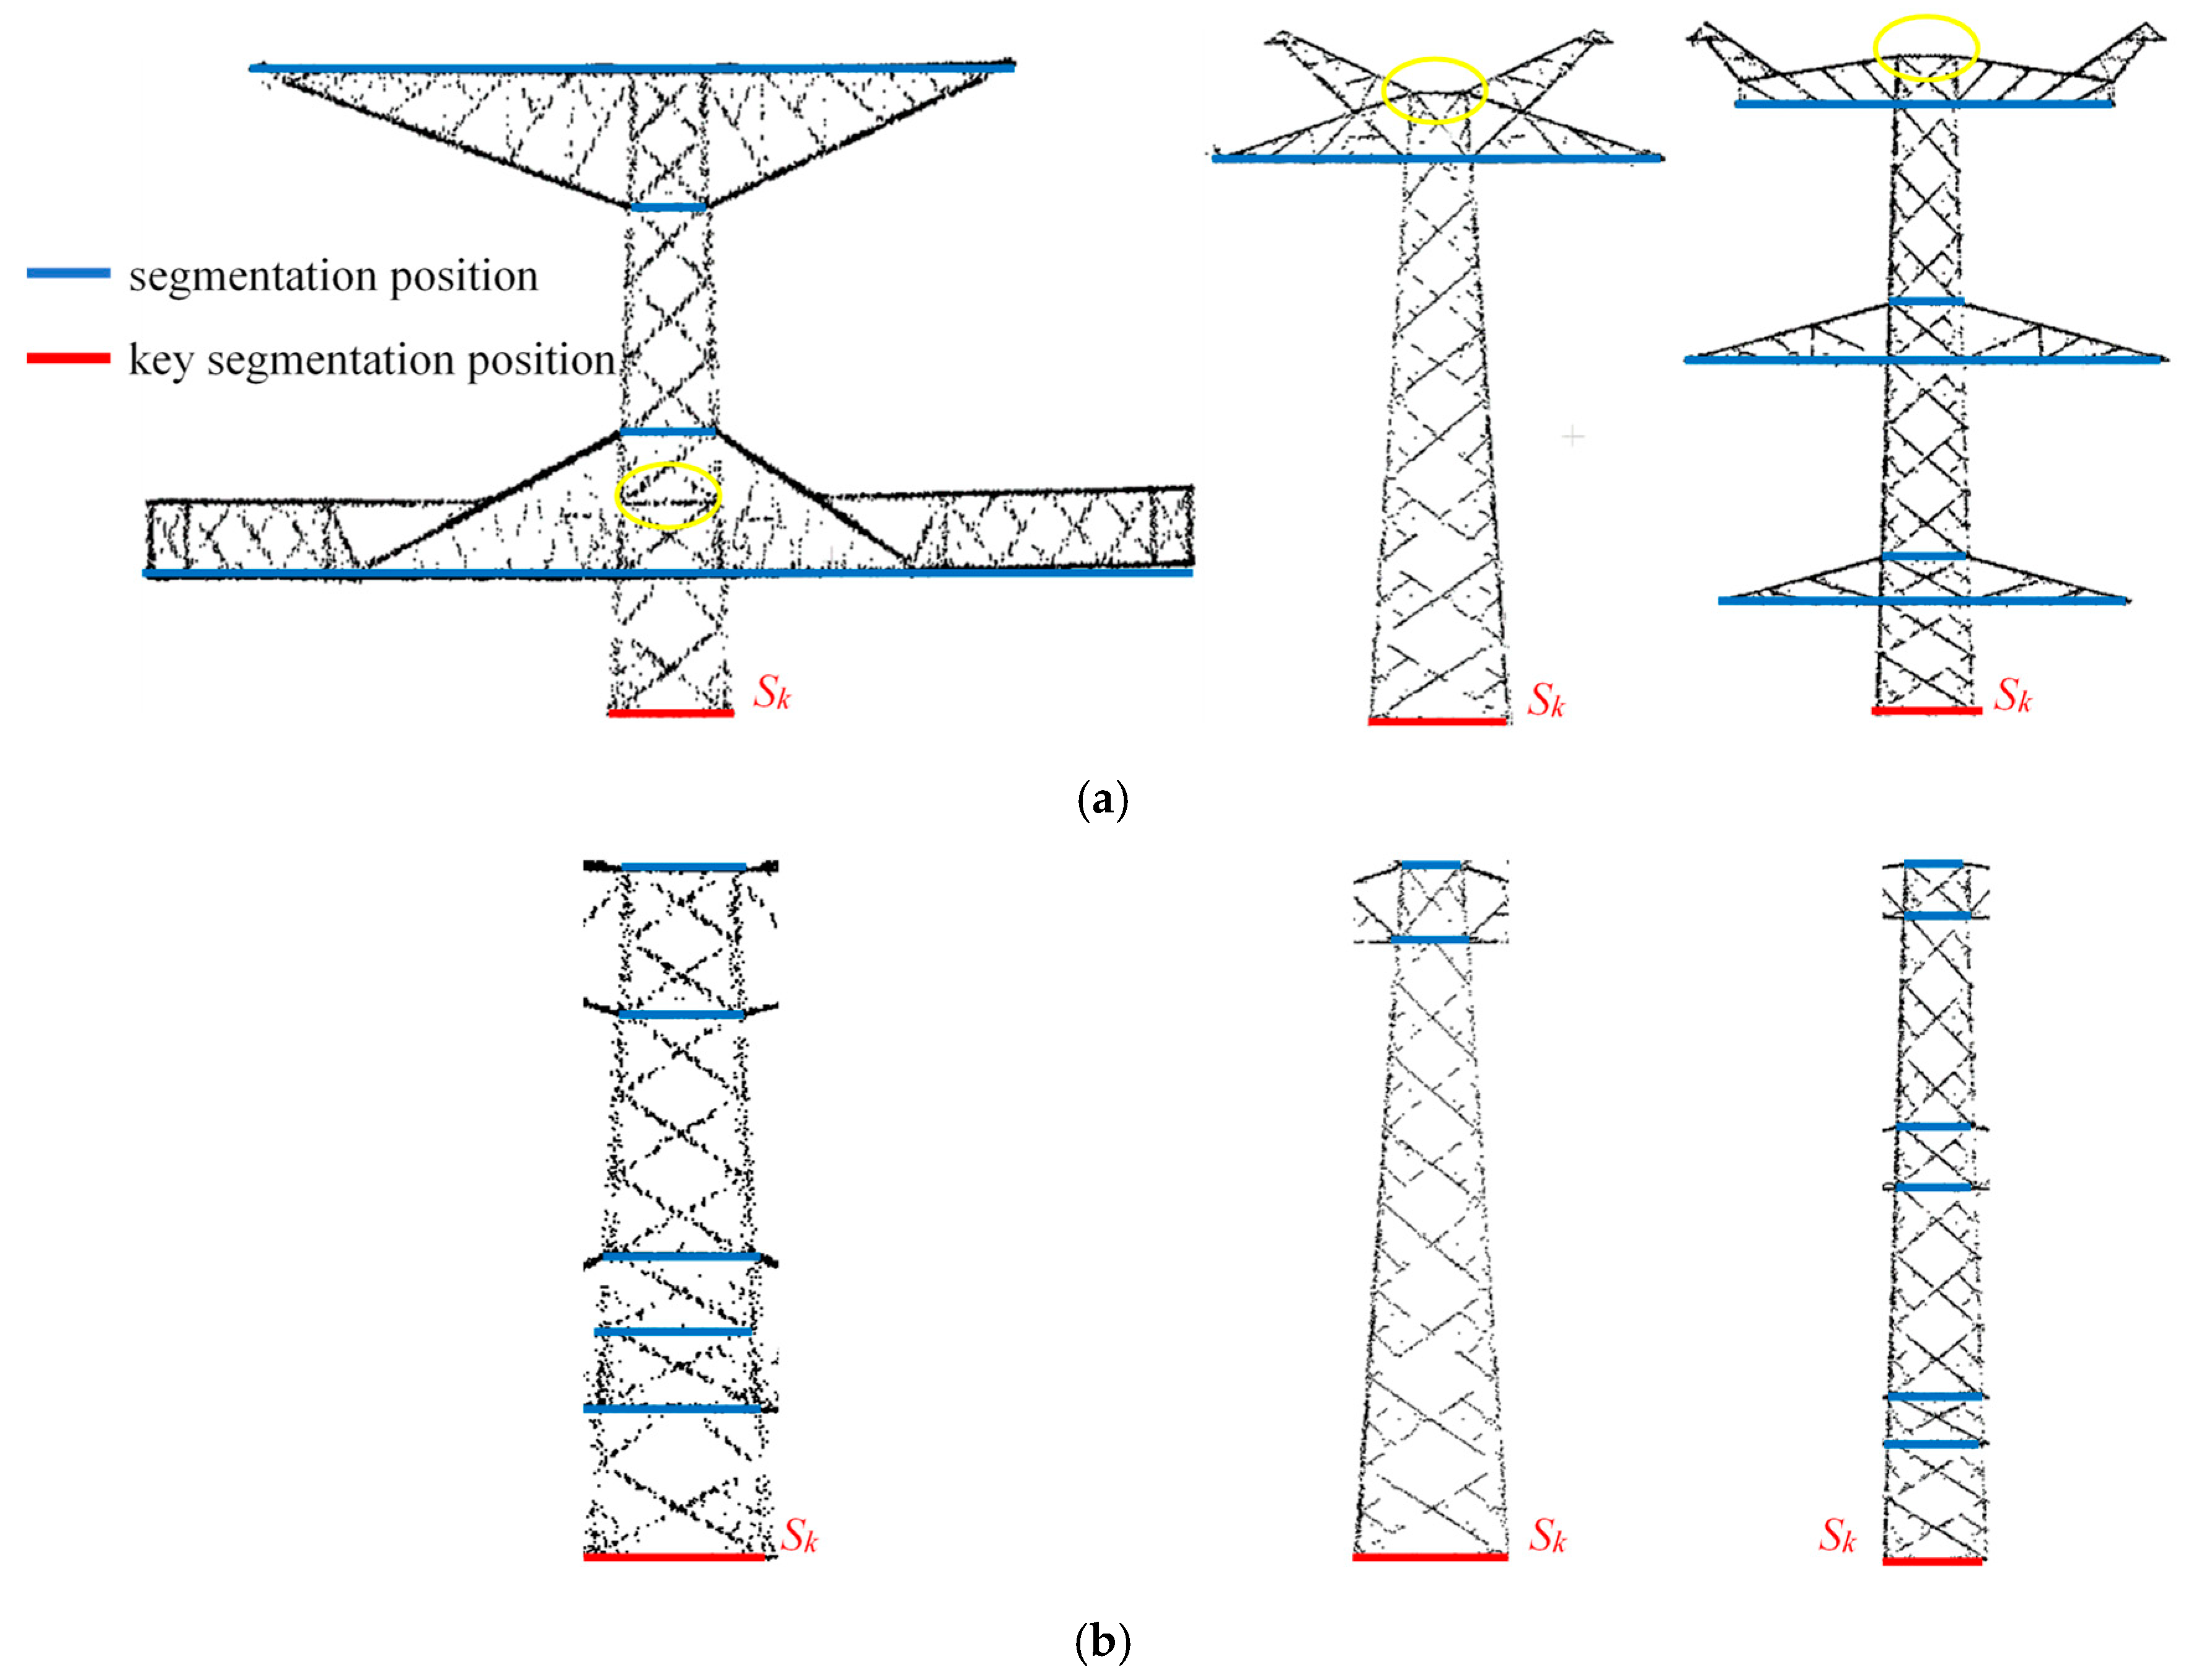
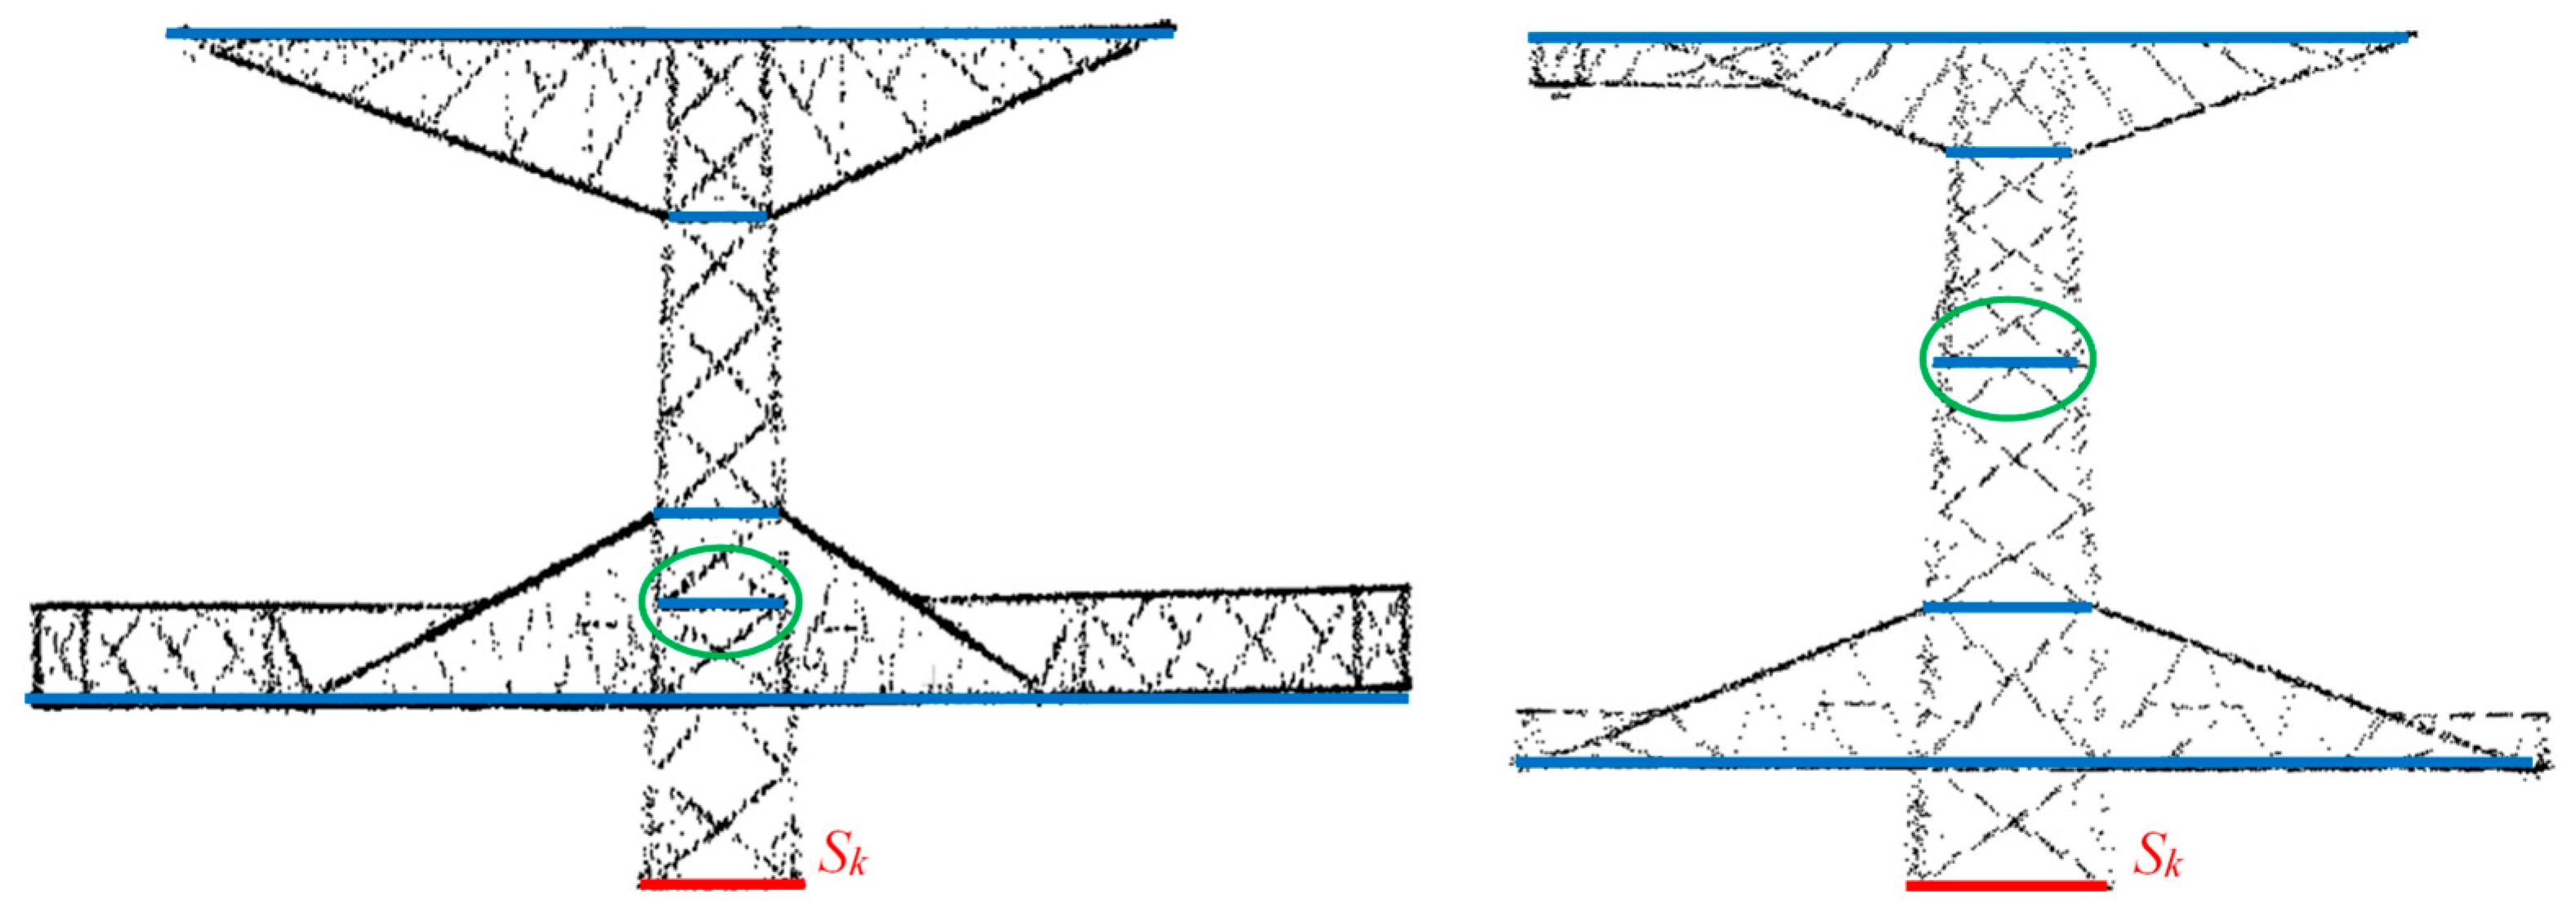
2.2.1. Segmentation Positions and Key Segmentation Position Identification

The segmentation positions S are shown in Figure 5a,c,d,f, with blue lines representing segmentation positions (SP) and red line indicating the key segmentation position (KSP). There are two distinct features associated with these positions: (1) Local maximum point density (point density is defined as the number of points in each bin); and (2) great filling rate. The filling rate is illustrated in Figure 6. As shown in Figure 6, a bin is equally divided into a number of smaller bins with a width of Δh1 along the Y′ axis, and the ratio of the number of smaller bins with points to the number of smaller bins is defined as the filling rate.
To determine SP, pylon points are first equally divided into bins with a width of Δh2 along the Z′ axis, and the number of points in each bin is recorded in an array. Then, a forward- or backward-moving window with a certain width W1 is used to find the local maximum density in the array. The orange lines are the positions corresponding to the local maximum density in Figure 5b,e. Subsequently, the filling rate of each bin corresponding to the local maximum density is calculated. If the filling rate of the bin is more than a pre-defined filling rate threshold Tf, the average of Z′ coordinates for all points in the bin is defined as the segmentation position S, as labeled by blue lines in the Figure 5b,e.
The projection shape of bins is employed to identify the KSP. Bins below the KSP share a common projection shape in the X′Y′ plane, and the projection shape of bins above the KSP varies with the height in the X′Y′ plane. A projection shape parameter Gi is used to define the ratio of the maximum projection length of bins on the Y′ axis to that on the X′ axis at the segmentation position Si (i is the index of the segmentation positions from bottom to top). The value of G1 is added with an error constant Ce as the projection shape parameter threshold TG. Starting from G1, Gi is compared with TG in turn. If Gi is greater than TG, the key segmentation position Sk is Si−1 corresponding to Gi−1, as the position of the red line in Figure 5b,e. The required parameters for identifying the segmentation positions and the key segmentation position and the associated empirical values are listed in Table 1.
The part below S1 is an inverted triangular pyramid structure, and the part between S1 and Sk belongs to quadrangular frustum pyramid structures. Similar to the pylon in Figure 5a, the part above Sk consists of quadrangular frustum pyramid structures and complex structures. The segmentation position corresponding to the purple line above the red line in Figure 5b can assist the confirmation of quadrangular frustum pyramid structures and complex structures. Similar to the pylon in Figure 5d, the part above Sk is a complex structure, and no further decomposition is required. The segmentation position corresponding to the purple line above the red line in Figure 6e needs to be eliminated.

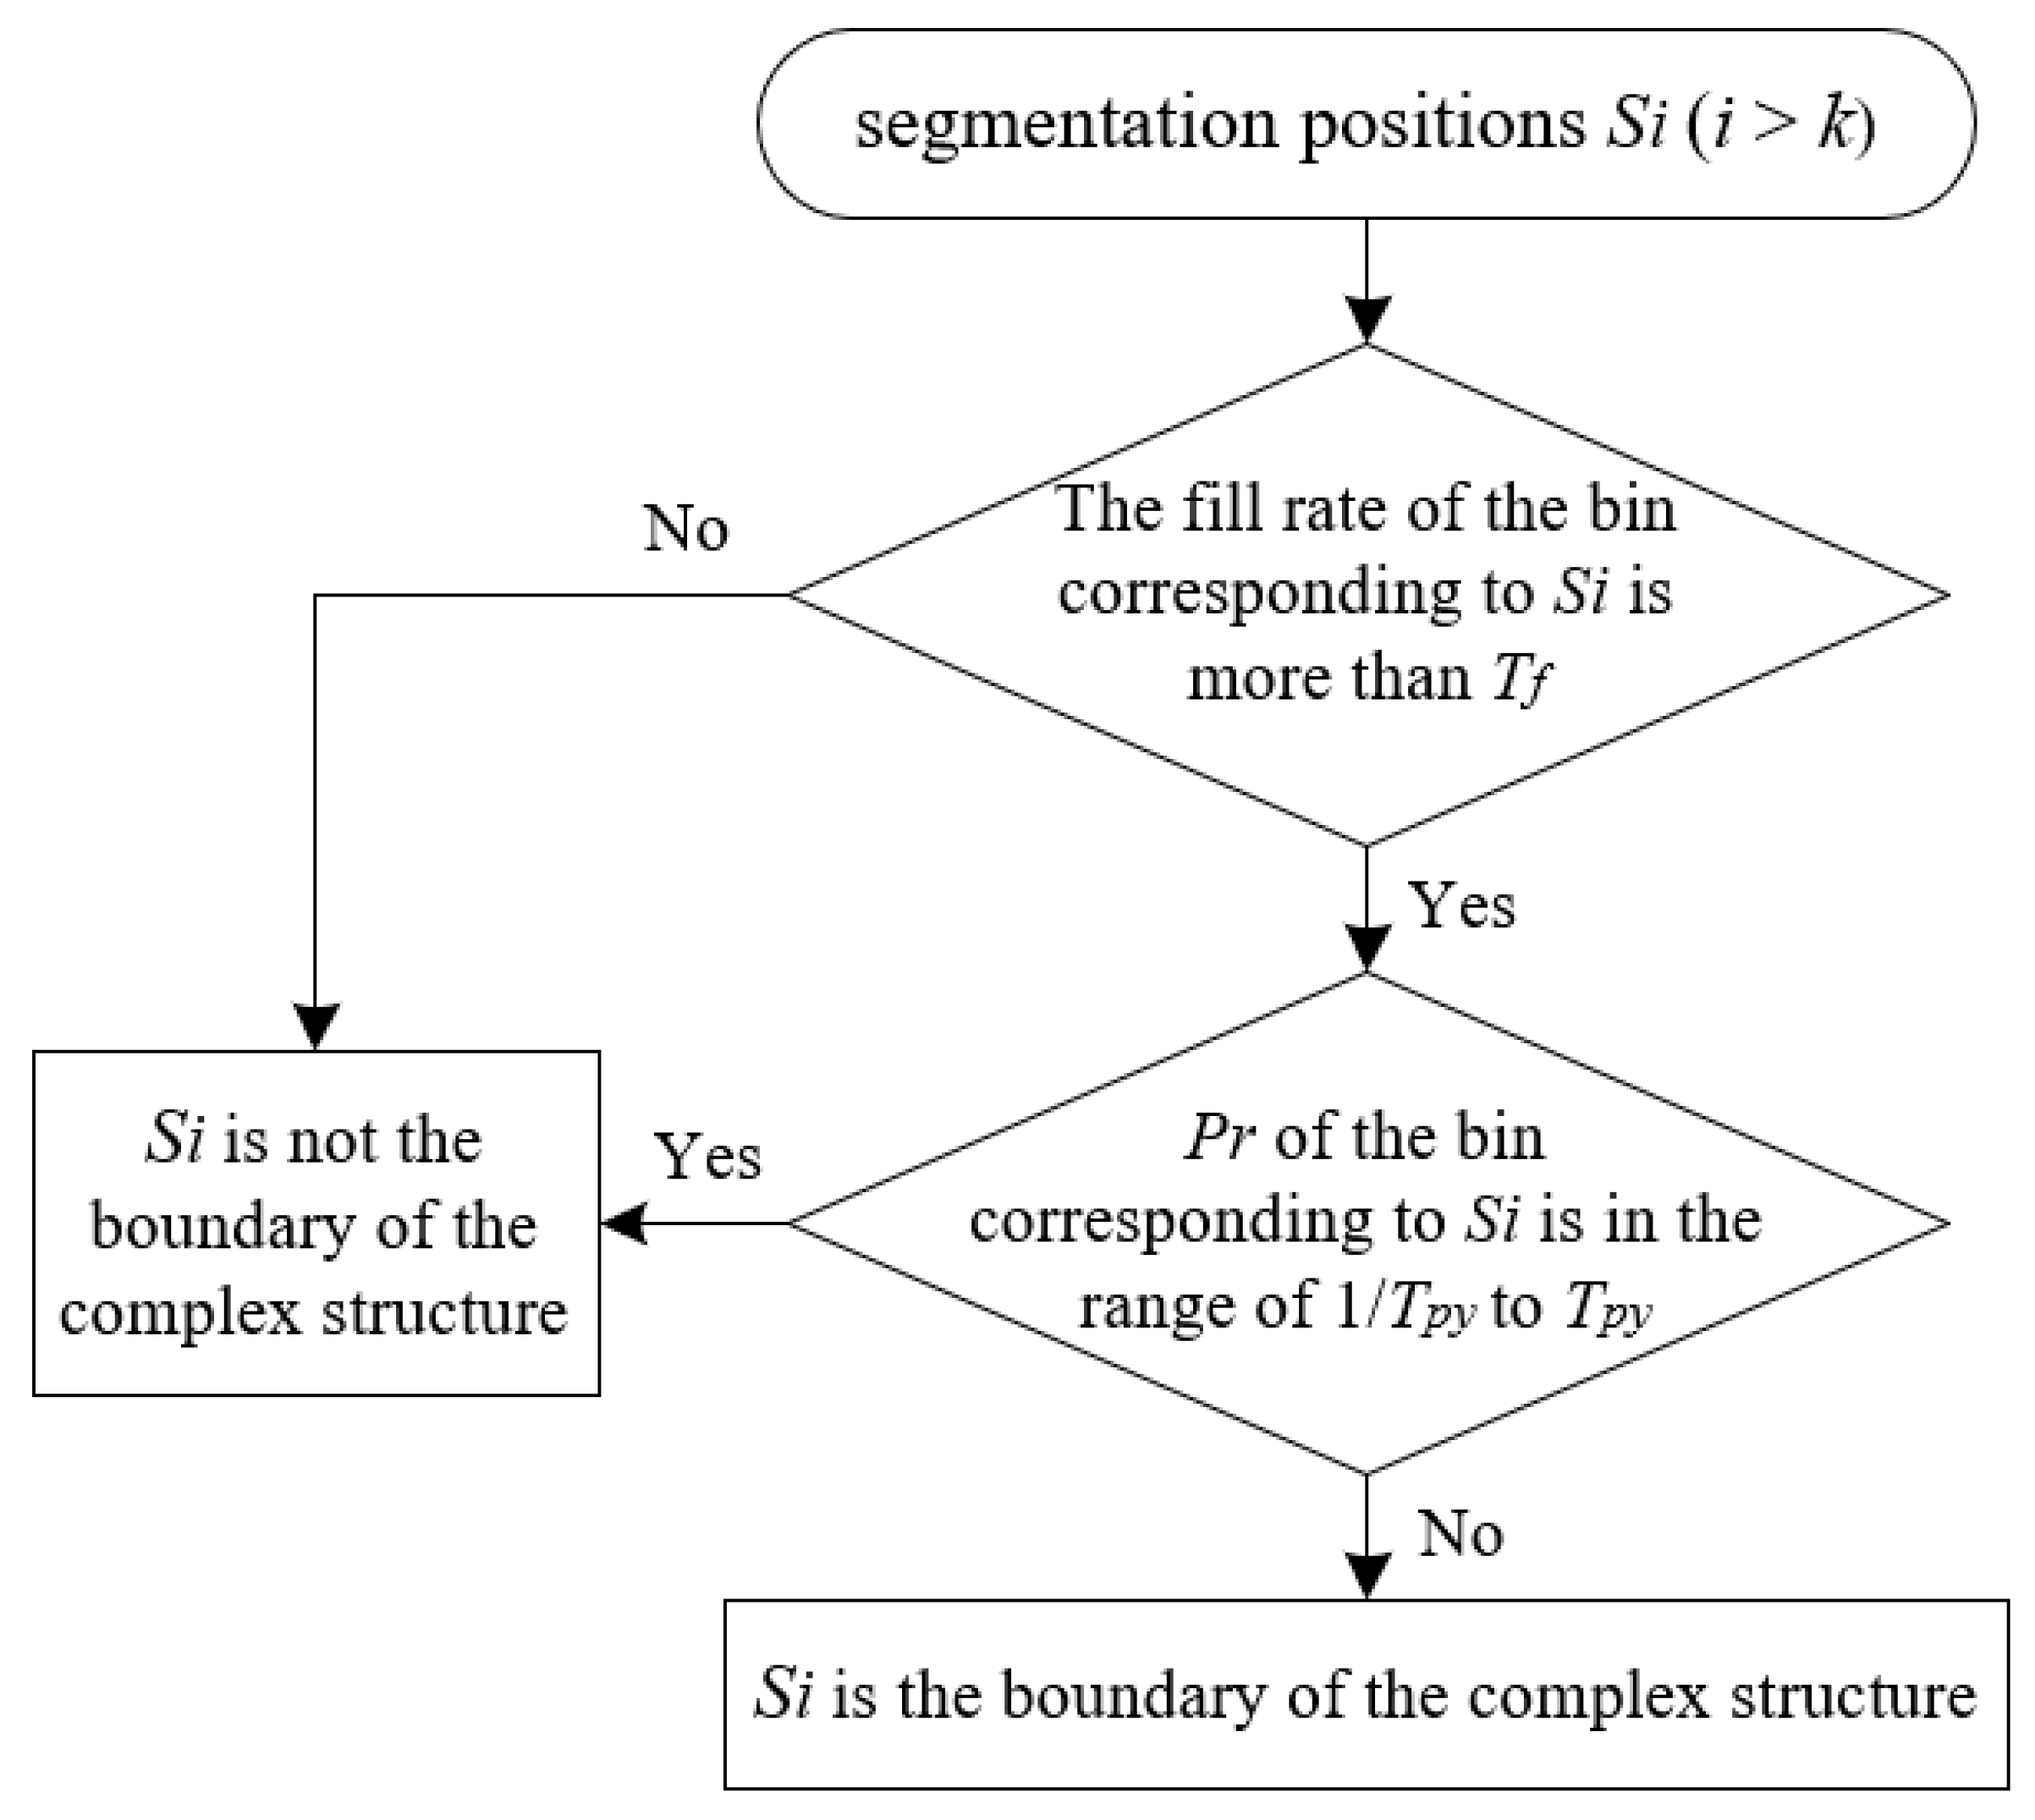
2.2.2. Complex Structure Recognition

In the field of image processing, there are many literatures on object recognition [21,22,23,24,25]. As can be seen from Figure 4, the type of complex structure is mainly reflected by its projection shape on the Y′Z′ plane. Combined with the image processing method, the dimensional reduction process of point cloud is employed, which is illustrated in Figure 7. First, pylon points above Sk are projected onto the Y′Z′ plane, and binarized to create a grayscale image. The grayscale images of the middle and upper structures are respectively shown in Figure 7a,e. Second, the morphological gradient operation is used to smooth image and highlight contours of the object, and the results of the middle and upper structures are respectively shown in Figure 7b,f. Third, the morphological closing operation is used to fill the local small holes resulting in Figure 7c,g for the middle and upper structures, respectively. Finally, a contour extraction algorithm [26] is applied to extract the image contours of the middle and upper structures (see Figure 7d,h). All contours are sorted by the number of pixels inside them from large to small, and the results are plotted in Figure 8a,b. The number of pixels inside actual contours are much more than that inside false contours. A ratio is defined as the ratio of the number of pixels inside the previous contour to that inside the next contour for ordered contours, as shown in Figure 8a,b. A maximum searching algorithm is applied to identify the maximum ratio of the actual contour length to the false contour length. If the number of actual contours is equal to 1, further decomposition is required due to this part consisting of quadrangular frustum pyramid structures and complex structures.
Similar to the pylon in Figure 9a, segmentation positions inside the complex structure or on the top of the pylon cannot be detected because of a low filling rate, as shown by the segmentation position inside the yellow circle in Figure 9a. In order to prevent the interference of the complex structure on detection of segmentation positions, it is necessary to preprocess point cloud data above the KSP. Constrained by the extremum Y′ coordinate of the bin corresponding to Sk, points in bins above Sk that are not in the range are removed. Then, a program referred to as the above-described segmentation positions detection method is carried out. The parameters of the program are the same as those of the above-described segmentation positions detection method. The results are shown in Figure 9b.
After finishing segmentation positions detection, the upper and lower boundaries of complex structures need to be confirmed. Based on the decomposition results, Sk+1 and Send (last segmentation position) are true boundaries. But not all of other segmentation positions are the boundaries of the complex structures, just like the segmentation position inside the green circle in Figure 10. The segmentation positions inside the complex structures can be distinguished by the filling rate, and those outside the complex structures can be distinguished by the ratio Pr. In Figure 11, i is the bin number corresponding to the segmentation position, and Pr is defined as the ratio of the maximum projection length of points inside the upper red box along Y′ axis to that of points inside the lower red box along Y′ axis. The flowchart of the complex structure boundary recognition is shown in Figure 12. The parameters involved in the complex structure boundary recognition based on the empirical values are listed in Table 2. Results of pylons decomposition are shown in Figure 13.

2.3. Inverted Triangular Pyramid Reconstruction

There are four inverted triangular pyramids at the bottom of the pylon, and the model is shown in Figure 14. In Figure 14a, the Z′ coordinate of P2i (i = 1, 2, ···, 8) is the segmentation position S1, and P2i (i = 5, 6, 7, 8) is an intermediate point of the edge line. First, the X′Y′ plane coordinates of P2i (i = 1, 2, 3, 4) can be calculated by the line equation of Li (i = 1, 2, 3, 4), and the X′Y′ plane coordinates of P2i (i = 5, 6, 7, 8) are determined by the X′Y′ plane coordinates of P2i (i = 1, 2, 3, 4). Then, points are projected onto the X′Y′ plane and evenly divided into four parts as shown in Figure 14b, and the minimum Z′ coordinate of each part is the Z′ coordinate of the corresponding P1i (i = 1, 2, 3, 4). Finally, the X′Y′ plane coordinates of P1i (i = 1, 2, 3, 4) are calculated by the line equation of Li (i = 1, 2, 3, 4). The connection points are connected based on the priori topological relation among them. The result of reconstruction is shown in Figure 14c.
There are two steps for calculating the line equation of Li (i = 1, 2, 3, 4), which are obtaining fitting points and linear fitting. These points after redirection are symmetric along the X′ or Y′ axis in Figure 3, which means that only line equation of L1 and L3 on the X′Z′ and Y′Z′ plane need to be fitted. To obtain fitting points, point cloud is projected onto the Y′Z′ plane and divided into several bins with a width of Δh2 along the Z′ axis. The extreme point of each bin on the Y′ axis is selected. A similar method is used to obtain fitting points on the X′Z′ plane. Line fitting is the second step. There are several line fitting methods, such as iterative least squares fitting [27,28], Hough transform [29,30], RANSAC (random sample consensus) linear fitting [31,32] and others. Because fitting points may contain some noises, the RANSAC linear fitting method is applied in this study.

2.4. Quadrangular Frustum Pyramid Reconstruction

The quadrangular frustum pyramid structure consists of the frame and the internal structure. First, the frame reconstruction is described in Section 2.4.1. Then, Section 2.4.2 introduces a method of the internal structure reconstruction based on prior knowledge of the internal structure of the quadrangular frustum pyramid.

2.4.1. The Frame Reconstruction

The Z′ coordinate of the frame vertices is the segmentation position Si. Similar to the idea of calculating coordinates of vertices in Section 2.3, the coordinates of frame vertices are calculated by the line equation. But there is a different way to determine fitting points. First, the 2D alpha shape algorithm is used to obtain 2D contour points, as shown by green points in Figure 15a,b. Contour points at the top and bottom are removed. Then, the average of X′ coordinates and Y′ coordinates of the removed points are set as the critical value. Based on this critical value, contour points are divided into left and right fitting points. RANSAC linear fitting is used to fit the 2D line equation. Finally, based on the Z′ coordinate of the frame vertices, the 3D coordinates of the vertices are calculated. The model of frame reconstruction is shown in Figure 15c.

2.4.2. The Internal Structure Reconstruction

The current automatic reconstruction algorithm only reconstructs the frame of a quadrangular frustum pyramid [15,18,19,20], and ignores the internal structure of the quadrangular frustum pyramid, which is usually a "left-right cross" structure from bottom to top. According to the intersection type of the upper and lower structures, the quadrangular frustum pyramid can be classified into four types: XX, XV, VX, and VV, as shown in Figure 16. The process of the structure reconstruction contains two steps: (1) Identifying the type of structure and (2) calculating 3D coordinates of connection points.

Identifying the Type of the Internal Structure

In Figure 17b, the type of the internal structure is distinguished by the ratio of db1 to db2 and the ratio of dt1 to dt2. The ratio is larger for V type, and it is approximately zero for X type. The first step is to calculate the coordinates of the intermediate intersection, as shown by red points in Figure 17a. The X′ Y′ coordinates of red points are the center of the quadrangular frustum pyramid, and it is critical to calculate the Z′ coordinate of red points. A rectangle, whose center is at the center of the quadrangular frustum pyramid with a width W2, is used to select middle points. The selected points are sorted according to their Z′ coordinates from small to large. A DBSCAN(Density-Based Spatial Clustering of Applications with Noise)-based approach is used to classify points into several point-clusters. The average Z′ coordinate of each cluster is determined as the Z′ coordinate of the intermediate intersection. The second step is to fit the purple line in Figure 17b. In a circle of with a radius of r and a center at the intermediate intersection, there are two point-clusters of linearly symmetrical distribution whose slopes are opposite to each other. The value of r depends on the distance L between the left and right edge. A linear fitting approach based on RANSAC is applied to calculate the slope of cross lines. The maximum number of iterations Imax is set and the absolute value of the slope of each fitted line is recorded. A least squares iterative fit is performed to remove gross errors, and the average of reserved values is the best slope. The equation of the purple line is confirmed by the coordinates of the intermediate intersection and the best slope. The third step is identifying the type of the internal structure. The Z′ coordinates of point PCT and PCB are calculated by the line equation of the green line and the purple line. The structure type is determined according to Equation (2), where P(z′) represents the Z′ coordinate of P.
{ | P C T ( z ) P 6 j ( z ) | | C T ( z ) P 6 j ( z ) | < T r , | P C B ( z ) P 1 j ( z ) | | C B ( z ) P 1 j ( z ) | < T r XX | P C T ( z ) P 6 j ( z ) | | C T ( z ) P 6 j ( z ) | < T r , | P C B ( z ) P 1 j ( z ) | | C B ( z ) P 1 j ( z ) | > T r XV | P C T ( z ) P 6 j ( z ) | | C T ( z ) P 6 j ( z ) | > T r , | P C B ( z ) P 1 j ( z ) | | C B ( z ) P 1 j ( z ) | < T r VX | P C T ( z ) P 6 j ( z ) | | C T ( z ) P 6 j ( z ) | > T r , | P C B ( z ) P 1 j ( z ) | | C B ( z ) P 1 j ( z ) | > T r VV

Calculating the Coordinates of the Connection Points

In Figure 17b, only the Z′ coordinate of Pij (i = 2, 3, 4, 5; j = 1, 2, 3, 4) need to be calculated, whose plane coordinates can be calculated by frame line equations as described in Section 2.4.1. The Z′ coordinate of Pij can be calculated by the middle cross line equation and the frame line equation in turn. The parameters involved in the internal structure reconstruction based on the empirical values are shown in Table 3. The model of the quadrangular frustum pyramid is shown in Figure 18.

2.5. Complex Structure Reconstruction

Due to the diversity of complex structures and a lower point density of pylon obtained from LiDAR, it is difficult to achieve fine reconstruction of complex structures. The proposed method is used to reconstruct the major contours of complex structures. The core of pylon reconstruction is to determine the 3D coordinates of the connection points and the topological relationship among them. Section 2.5.1 describes how to establish the topological relationship among corner points, and Section 2.5.2 introduces a method for calculating the 3D coordinates of them.

2.5.1. Establishing the Topological Relationship among Corner Points

A template structure is extracted from multiple complex structures, and from which the topological relationship among corner points can be derived. For type-T complex structures as shown in Figure 19a, their projections on the Y′Z′ plane exhibit a complex polygon with a trapezoidal bond and their projections on the Y′Z′ plane show a symmetric polygon with a rectangle bond. The template structure of type-T complex structures is shown in Figure 19c. For type-O complex structures just like Figure 19b, the projection of them on the Y′Z′ plane is a symmetric polygon with inner contours and the projection of them on the X′Z′ plane is approximately trapezoidal. The template structure of type-O complex structures is shown in Figure 19d. Based on the template structure, a solution is adopted. Firstly, the Y′Z′ coordinates of corner points need to be calculated. Then, the X′ coordinate of corner points is calculated by Y′Z′ coordinates of them and fitted line equations. Finally, a complete 3D model of the complex structure is obtained according to the symmetry of template structures on the X′Z′ plane.

2.5.2. Calculating 3D Coordinates of Corner Points

Extracting Corner Points

Contours of complex structures are extracted using the contour extraction method described in Section 2.2.2. Based on the extracted contours, the Douglas–Peucker algorithm [33] is used to obtain corner points of them. The result of each key step in extracting corner points process is shown in Figure 20.

Optimization

(1) Optimizing the Y′Z′ coordinates of corner points
The grayscale images of point cloud data certainly have some degree of expansion effect after the morphological operation, which results in model deviation when the model of different structures is assembled. The connection points as represented by green points in Figure 19a,b need to be optimized. In extracted corner points, the closest points to known points are replaced with known points.
(2) Optimizing corner points of type-O complex structures
Based on the symmetry of type-O complex structures on the Y′Z′ plane, the symmetry coefficient CSi (i = 1, 2, ···, n) of each point is calculated by Equation (3) and the symmetry point of each point is recorded. In Equation (3), Yave is equal to the mean Y′ coordinate of known points in the template structure. If the symmetry point of the symmetry point of each point is itself, it is regarded as the true corner point.
{ C S i = M i n { | ( P i ( y ) + P j ( y ) ) 2 + | P i ( z ) P j ( z ) | Y a v e | , j = 0 , 1 , , n } i j ( P i ( y ) < Y a v e P j ( y ) > Y a v e ) ( P i ( y ) > Y a v e P j ( y ) < Y a v e )
(3) Calculating X′ coordinate of corner points
For the type-T complex structure, points projected onto the X′Y′ plane are divided into an upper part and a lower part according to the upper and lower boundaries of the rectangle in Figure 19a. The contour points of the upper and lower part are respectively extracted by 2D alpha shape algorithm, and then they are respectively divided into two parts based on the X′ coordinate of the rectangle center. Subsequently, points of each part are used to fit a line based on RANSAC. Finally, the X′ coordinate of corner points is calculated by the fitted line equation and Y′ coordinate of them.
For the type-O complex structure, points are projected onto the X′Z′ plane and 2D alpha shape algorithm is used to extract contour points. Then, the extracted contour points are divided into two parts based on the mean X′ coordinate of known points. Subsequently, points of each part are used to fit a line based on RANSAC. Finally, the X′ coordinate of corner points is calculated by the fitted line equation and the Z′ coordinate of them.

3. Experimental Data

In order to verify the reliability and applicability of the proposed method, experiments with point cloud of multi-type pylons were conducted. The point cloud data were collected by a Riegl VUX-1 laser measurement system from Anhui Province, China. Details about data acquisition are shown in Table 4. The points of multi-type pylons are shown in Figure 21 and the details of those are shown in Table 5.
The footprint size of the scanning laser beam is determined by the laser beam divergence and flight height. In this experiment, the laser beam divergence is 0.5 mrad, and the flying height is about 90 m above the ground. Therefore, the footprint size of the scanning laser beam is less than 4.5 cm. For power application, the small-footprint airborne LiDAR system was used in common. The three-dimensional of the pylon is about 20 m × 13 m × 60 m, and the length and width of major structures are both greater than 4.5 cm. In addition, the airborne LiDAR measurement system in this experiment has a laser pulse repetition rate of up to 600 kHz and a point density of up to 100 pts/m2. Therefore, the 3D point cloud from ALS can capture the major structures of pylons, as shown in Figure 21.
The multiple returns can obtain more point cloud of scanning objects. The emitted laser pulse might detect the multiple targets with different depths. Then, the multiple targets with different depths are recorded. The hollowed-out structure of the pylon can make the multiple returns fully applied, as shown in Figure 22. Multiple-returns data form the complete pylon point cloud.

4. Results

The program of power pylon reconstruction is written in C++ and runs on a laptop. The laptop configuration is shown in Table 6.
Applying the proposed method to the eight experimental datasets, the parameters involved in the proposed algorithm were obtained and listed in Table 7. The accuracy of each processing of the proposed method, i.e., pylon redirection, pylon decomposition, and pylon reconstruction, is presented in Section 4.1, Section 4.2, and Section 4.3, respectively.

4.1. Accuarcy of Pylon Redirection

Pylon redirection is the basis for subsequent pylon decomposition, and the accurate result of pylon redirection can better reflect the structural characteristics of pylon. The accuracy of pylon redirection can be evaluated through computing the rotation θ angle difference (Δθ) between the manually measured θ and calculated θ by the proposed method. Results listed in Table 8 show that the proposed method for pylon redirection can achieve high accuracy.

4.2. Accuracy of Pylon Decomposition

Pylon decomposition is a key step in pylon reconstruction, and the correct segmentation result is the basis for subsequent pylon reconstruction. Six parameters need to be set in pylon decomposition process. The determination of the parameters is greatly affected by the sparseness and integrity of pylon points, especially Tf and Tpy. If parameters are not determined correctly, incorrect segmentation positions will be obtained. The accuracy of pylon decomposition can be assessed by difference between the manually measured and estimated by the proposed method segmentation position. Results listed in Table 9 provide evidence that the proposed method for pylon decomposition.

4.3. Accuracy of Pylon Reconstruction

The accuracy of the inverted triangular pyramid reconstruction mainly depends on the accuracy of four best-fit ridge lines and Z′ coordinates of four vertices at the bottom of pylon. For the quadrangular frustum pyramid reconstruction, the accuracy mainly depends on the accuracy of the extracted intermediate intersection points, and the best-fit four legs and internal cross lines, while the accuracy of the extracted corner points and the best-fit edge lines directly impacts the accuracy of the complex structure. Overall, the accuracy of pylon reconstruction depends on error A1 in the Z′ coordinates of four vertices at the bottom of pylon, error A2 of the extracted intermediate intersection points, error A3 of the best-fit lines using the RANSAC algorithm, and error A4 of the extracted corner points. Ai (i = 1, 2, 4) can be expressed by difference between the measured and estimated results, and A3 is the linear fitting residual. Errors in the pylon reconstruction are listed in Table 10, and the corresponding fraction of each of these four errors is plotted in Figure 23.
Among four errors, A1 and A4 account for a larger proportion. Point cloud of the inverted triangular pyramid located at the bottom of pylon is often mixed with vegetation points and ground points, and it is more likely to be missed in extracting pylons from transmission corridors. These conditions result in a larger A1. A4 is relatively larger because image edges usually have a certain degree of expansion after the morphological operation in the image processing process. Because the inverted triangular pyramid model has less impact on the entire pylon model and the error of pylon redirection and decomposition classification is less than 0.1 m, the accuracy of pylon model mainly depends on A4. The average of A4 of the eight experimental pylons is about 0.32 m.
The efficiency of pylon reconstruction can be evaluated by computational time as listed in Table 11, and the average of computational time is about 0.8 s. The reconstructed 3D models of pylons using the proposed method are shown in Figure 24.

5. Discussion

In this section, three factors that affect the accuracy of pylon reconstruction are analyzed. The impacts of the LiDAR data noise, data sparsity, and data loss on pylon reconstruction are discussed in Section 5.1, Section 5.2, and Section 5.3, respectively.

5.1. The Impact of Noise on Pylon Reconstruction

Noise mainly contains three types of points, which are respectively inside green ellipses, red ellipses, and blue ellipses in Figure 25. Type 1 noise inside red ellipses is mainly composed of insulator string points and drain wire points. Type 2 noise inside green ellipses is mainly composed of vegetation points and ground points. Type 3 noise inside red ellipses is mainly composed of local scattered points. Type 1 noise has the greatest influence on pylon reconstruction among these three types of noise, and it directly affects pylon decomposition. If there is type 1 noise in pylon points, reconstruction is hard to complete based on the proposed method, and thus type 1 noise must be eliminated manually before pylon reconstruction is carried out, as shown in Figure 26.
Since the proposed method uses the block modeling approach, type 2 noise and type 3 noise only affect the accuracy of local model. In Figure 26, type 2 noise has little influence on inverted triangular pyramids reconstruction. The spatial distribution of type 3 noise as shown in Figure 26 indicates that this type of noise mainly affects the structural reconstruction inside the quadrangular frustum pyramid and the extraction of corner points of the complex structure. Type 2 noise inside the quadrangular frustum pyramid can be eliminated by a point density threshold, and type 3 noise surrounding the complex structure can be eliminated by a minimum distance threshold between two points.

5.2. The Impact of Data Sparsity on Pylon Reconstruction

Power patrol is often performed along the transmission corridor in one way, which results in a higher point density on one side of pylon and a lower point density on the other side. To analyze the impact of data sparsity on pylon reconstruction, original pylon points are uniformly sampled. The number of uniformly sampled pylon points is shown in Table 12, and the corresponding reconstructed pylons using different numbers of sampled points are illustrated in Figure 27. When the sampling distance is equal to 0.2 m, a quadrangular frustum pyramid structure of type-c pylon is not reconstructed. When the sampling distance is equal to 0.3 m, three quadrangular frustum pyramid structures of type-c pylon and a complex structure of type-e pylon are not reconstructed. The reason for this may be due to the selection of inappropriate parameters. In general, when the average distance among points is less than 0.2 m, the proposed method can obtain a better pylon model.

5.3. The Impact of Data Loss on Pylon Reconstruction

Due to the occlusion of the pylon itself and the other objects, there are often missing points in acquired point cloud. Figure 28 shows an example of data loss in pylon points. Based on the symmetry of pylon structure, 3D points are reduced to 2D points in the modeling process, which can make up for data loss and improve the efficiency of modeling. The missing data of the quadrangular frustum pyramid structure shown in Figure 28 can be filled by symmetrical points after a projection of 3D to 2D. For the missing data around the complex structure in Figure 28, pylon can be reconstructed as long as missing data is not on both sides of the symmetry. The outer contour of complex structures will expand to the outside and the inner contour of complex structures will expand to the inside after image processing. However, if there is missing data in the outer contour, the extracted corner points will be closer to the central axis of the pylon. If there is data loss in the inner contour, the extracted corner points will be away from the central axis of the pylon. Based on this characteristic, points correction, where one point is corrected by the other point far from the center of the pylon in the pair of matching corner points on the outer contour and one point is corrected by the other point close to the center of the pylon in the pair of matching corner points on the inner contour, is done after symmetrical corner points matched. Some points of the pylon in Figure 28 will be manually removed, and remaining points are shown in Figure 29a. The result of the pylon with data loss is shown in Figure 29b. The result indicates that the proposed method is better at handling data loss. The removed points in Figure 29a are all located at secondary locations, so there is little impact on modeling. The key points that are located at segmentation positions of the pylon and the corner of complex structures are missing, which will result in model distortion or modeling failure.

6. Conclusions

In this paper, a novel method for power pylon reconstruction using airborne LiDAR data is developed and tested. Compared with existing power pylon reconstruction methods, the advantages and characteristics of the proposed method are mainly reflected in the following five aspects: (1) Based on existing power pylon decomposition methods, the filling rate is added as a new feature for finer pylon decomposition; (2) the proposed method can reconstruct the internal structure of quadrangular frustum pyramid structures; (3) the abstract template structure is adopted for modeling; therefore, no third-party library is required and thus, the proposed method is more flexible; (4) the impact of missing data on pylon reconstruction is reduced in the proposed method; (5) the average of computational time of reconstructing a pylon is 0.8 s, which indicates that the proposed method is efficient. In a summary, the proposed method in this study is accurate, stable, and efficient for pylon reconstruction.
Although the proposed method has five advantages mentioned above, it has few limitations because it cannot automatically process data noise and construct non-major contours of complex structures. A future study is necessary for improving the proposed method in the following four aspects: (1) Prior to pylon reconstruction, a fine pylon point cloud extraction method is needed to remove noise points; (2) develop more template types; (3) enhance reconstruction of finer scale pylon structural features; (4) include power lines and insulator strings in the 3D pylon reconstruction.

Author Contributions

C.W., S.C., X.X., and P.W. designed the experiments; S.C. and C.W. analyzed the data and wrote the paper; X.Y. and X.Z. assisted with process of airborne LiDAR data. H.D., F.P., Y.Y., H.Z., and A.A. revised the paper.

Funding

This research was funded by National Natural Science Foundation of China, grant number 41671434; and National Natural Science Foundation of China, grant number 51574242.

Conflicts of Interest

The authors declare no conflict of interest.

References

  1. Kim, H.B.; Sohn, G. Point-based classification of power line corridor scene using random forests. Photogramm. Eng. Remote Sens. 2013, 79, 821–833. [Google Scholar] [CrossRef]
  2. Wang, Y.; Chen, Q.; Liu, L.; Li, X.; Sangaiah, A.K.; Li, K. Systematic Comparison of Power Line Classification Methods from ALS and MLS Point Cloud Data. Remote Sens. 2018, 10, 1222. [Google Scholar] [CrossRef]
  3. Yang, J.; Kang, Z. Voxel-based extraction of transmission lines from airborne LiDAR point cloud data. IEEE J. Sel. Top. Appl. Earth Obs. Remote Sens. 2018, 11, 3892–3904. [Google Scholar] [CrossRef]
  4. Qin, X.; Wu, G.; Ye, X.; Huang, L.; Lei, J. A novel method to reconstruct overhead high-voltage power lines using cable inspection robot LiDAR data. Remote Sens. 2017, 9, 753. [Google Scholar] [CrossRef]
  5. Matikainen, L.; Lehtomaki, M.; Ahokas, E.; Hyyppa, J.; Karjalainen, M.; Jaakkola, A.; Kukko, A.; Heinonen, T. Remote sensing methods for power line corridor surveys. ISPRS J. Photogramm. Remote Sens. 2016, 119, 10–31. [Google Scholar] [CrossRef] [Green Version]
  6. Xie, L.; Zhang, H.; Wang, C.; Zhang, B.; Wu, F. High-voltage transmission towers detection using hybrid polarimetric SAR data. In Proceedings of the 3rd International Workshop on Earth Observation and Remote Sensing Applications, Changsha, China, 11–14 June 2014. [Google Scholar]
  7. Ahmad, J.; Malik, A.S.; Xia, L.; Ashikin, N. Vegetation encroachment monitoring for transmission lines right-of-ways: A survey. Electr. Power Syst. Res. 2013, 95, 339–352. [Google Scholar] [CrossRef]
  8. Sampedro, C.; Martinez, C.; Chauhan, A.; Campoy, P. A supervised approach to electric tower detection and classification for power line inspection. In Proceedings of the International Symposium on Neural Networks, Beijing, China, 6–11 July 2014. [Google Scholar]
  9. Zhou, R.; Zhai, R.; Jiang, W.; Xu, B.; Huang, W. Automatic extraction and reconstruction of bundle conductors from airborne LiDAR point clouds. Sci. Surv. Mapp. 2018, 43, 124–130. [Google Scholar]
  10. Guan, H.; Yu, Y.; Li, J.; Ji, Z.; Zhang, Q. Extraction of power-transmission lines from vehicle-borne lidar data. Int. J. Remote Sens. 2016, 37, 229–247. [Google Scholar] [CrossRef]
  11. Zhu, L.; Hyyppa, J. Fully-automated power line extraction from airborne laser scanning point clouds in forest areas. Remote Sens. 2014, 6, 11267–11282. [Google Scholar] [CrossRef]
  12. Guo, B.; Li, Q.; Huang, X.; Wang, C. An improved method for power-line reconstruction from point cloud data. Remote Sens. 2016, 8, 36. [Google Scholar] [CrossRef]
  13. Zhou, R.; Jiang, W.; Jiang, S. A novel method for high-voltage bundle conductor reconstruction from airborne LiDAR data. Remote Sens. 2018, 10, 2051. [Google Scholar] [CrossRef]
  14. Fang, X.; Misra, S.; Xue, G.; Yang, D. Smart grid—The new and improved power grid: A Survey. IEEE Commun. Surv. Tutor. 2012, 14, 944–980. [Google Scholar] [CrossRef]
  15. Guo, B.; Huang, X.; Li, Q.; Zhang, F.; Zhu, J.; Wang, C. A stochastic geometry method for pylon reconstruction from airborne LiDAR data. Remote Sens. 2016, 8, 243. [Google Scholar] [CrossRef]
  16. Kwoczyńska, B.; Dobek, J. Elaboration of the 3D model and survey of the power lines using data from airborne laser scanning. J. Ecol. Eng. 2016, 17, 65–74. [Google Scholar] [CrossRef]
  17. Han, W. Three-dimensional power tower modeling with airborne LiDAR data. J. Yangtze River Sci. Res. Inst. 2012, 29, 122–126. [Google Scholar]
  18. Chen, Z.; Lan, Z.; Long, H.; Hu, Q. 3D modeling of pylon from airborne LiDAR data. In Proceedings of the 18th China National Symposium on Remote Sensing—Remote Sensing of the Environment, Wuhan, China, 20–23 October 2012. [Google Scholar]
  19. Li, Q.; Chen, Z.; Hu, Q. A model-driven approach for 3D modeling of pylon from airborne LiDAR data. Remote Sens. 2015, 7, 11501–11524. [Google Scholar] [CrossRef]
  20. Zhou, R.; Jiang, W.; Huang, W.; Xu, B.; Jiang, S. A heuristic method for power pylon reconstruction from airborne LiDAR data. Remote Sens. 2017, 9, 1172. [Google Scholar] [CrossRef]
  21. Uijlings, J.R.R.; Van de Sande, K.E.A.; Gevers, T.; Smeulders, A.W.M. Selective search for object recognition. Int. J. Comput. Vis. 2013, 104, 154–171. [Google Scholar] [CrossRef]
  22. Lecun, Y.; Bengio, Y.; Hinton, G. Deep learning. Nature 2015, 521, 436–444. [Google Scholar] [CrossRef]
  23. Park, Y.; Yang, H. Convolutional neural network based on an extreme learning machine for image classification. Neurocomputing 2019, 339, 36–76. [Google Scholar] [CrossRef]
  24. Fu, K.; Dai, W.; Zhang, Y.; Wang, Z.; Yan, M.; Sun, X. MultiCAM: Multiple Class Activation Mapping for Aircraft Recognition in Remote Sensing Images. Remote Sens. 2019, 11, 544. [Google Scholar] [CrossRef]
  25. Brahimi, S.; Aoun, N.B.; Amar, C.B. Boosted Convolutional Neural Network for object recognition at large scale. Neurocomputing 2019, 330, 337–354. [Google Scholar] [CrossRef]
  26. Suzuki, S.; Abe, K. Topological structural analysis of digitized binary images by border following. Comput. Vis. Graph. Image Process. 1985, 30, 32–46. [Google Scholar] [CrossRef]
  27. Wang, J.; Huang, B.; Wu, X. Application of iterative method in linear equations. Agro Food Ind. Hi-tech 2017, 28, 2261–2264. [Google Scholar]
  28. Wang, B.; Li, J.; Liu, C. A robust weighted total least squares algorithm and its geodetic applications. Studia Geophys. Et Geod. 2016, 60, 177–194. [Google Scholar] [CrossRef]
  29. Xu, Z.; Shin, B.; Klette, R. Accurate and robust line segment extraction using minimum entropy with hough transform. IEEE Trans. Image Process. 2015, 24, 813–822. [Google Scholar] [PubMed]
  30. Xu, Z.; Shin, B.; Klette, R. Closed form line-segment extraction using the Hough transform. Pattern Recognit. 2015, 48, 4012–4023. [Google Scholar] [CrossRef]
  31. Yuan, Q.; Zhang, Z.; Bi, Q. Linear fitting application based on the improved RANSAC algorithm. Modul. Mach. Tool Autom. Manuf. Tech. 2015, 1, 123–125. [Google Scholar]
  32. Wang, X.; Cai, Y.; Shi, T. Road edge detection based on improved RANSAC and 2D LIDAR data. In Proceedings of the Fourth International Conference on Control, Automation and Information Sciences, Changshu, China, 29–31 October 2015. [Google Scholar]
  33. Zhao, L.; Shi, G. A method for simplifying ship trajectory based on improved Douglas-Peucker algorithm. Ocean Eng. 2018, 166, 37–46. [Google Scholar] [CrossRef]
Figure 1. The flowchart of power pylon reconstruction algorithm.
Remotesensing 11 01579 g001
Figure 2. The structure of power pylon.
Remotesensing 11 01579 g002
Figure 3. The projection views of pylon after redirection: (a) A pylon after redirection is projected to Y′Z′ plane; (b) a pylon after redirection is projected to X′Y′ plane; (c) a pylon after redirection is projected to X′Z′ plane.
Remotesensing 11 01579 g003
Figure 4. The type of complex structure: (a) Type-T structure; (b) Type-O structure.
Remotesensing 11 01579 g004
Figure 5. Pylon decomposition: (a,d) The projection view of pylon in the Y′Z′ plane, and blue lines are the segmentation positions (SP) and the red line is the key segmentation position (KSP); (b,e) density, filling rate, and projection shape parameter histogram; (c,f) the projection view of pylon in the X′Z′ plane, and blue lines are the segmentation position and red line is the key segmentation position.
Remotesensing 11 01579 g005aRemotesensing 11 01579 g005b
Figure 6. The filling rate is the ratio of the number of smaller bins with points to the number of smaller bins.
Remotesensing 11 01579 g006
Figure 7. Image processing on point cloud above the key segmentation position: (a,e) The result of binarization processing; (b,f) the result of morphological gradient operation; (c,g) the result of morphological close operation; (d,h) the result of contours extraction.
Remotesensing 11 01579 g007
Figure 8. The number of pixels inside contours and the ratio of the number of pixels inside previous contour to that inside next contour: (a) The result of Figure 7d; (b) the result of Figure 7h.
Remotesensing 11 01579 g008
Figure 9. The type of partial pylons: (a) Segmentation positions detection exception; (b) points after interference points are removed.
Remotesensing 11 01579 g009
Figure 10. The relation between the segmentation positions with the boundaries of complex structures.
Remotesensing 11 01579 g010
Figure 11. Point cloud around the segmentation positions: (a) Point cloud around the non-boundary; (b) point cloud around the boundary.
Remotesensing 11 01579 g011
Figure 12. The flow chart of the complex structure boundary recognition.
Remotesensing 11 01579 g012
Figure 13. The results of pylons decomposition.
Remotesensing 11 01579 g013
Figure 14. Four inverted triangular pyramids: (a) The model of four inverted triangular pyramids; (b) the plane division of four inverted triangular pyramids; (c) the reconstruction result.
Remotesensing 11 01579 g014aRemotesensing 11 01579 g014b
Figure 15. The frame of a quadrangular frustum pyramid: (a,b) 2D contour points extracted by 2D alpha shape algorithm; (c) the frame model of a quadrangular frustum pyramid.
Remotesensing 11 01579 g015
Figure 16. The type of the internal structure.
Remotesensing 11 01579 g016
Figure 17. The diagram of the internal structure reconstruction: (a) The intermediate intersection; (b) the internal structure identification.
Remotesensing 11 01579 g017
Figure 18. The model of the quadrangular frustum pyramid.
Remotesensing 11 01579 g018
Figure 19. The complex structure: (a) Type-T complex structure; (b) Type-O complex structure; (c) Type-T template structure; (d) Type-O template structure.
Remotesensing 11 01579 g019aRemotesensing 11 01579 g019b
Figure 20. Extracting corner points: (a,e) the result of binarization; (b,f) the result of morphological operation; (c,g) the result of actual contour extraction; (d,h) the result of corner points extraction.
Remotesensing 11 01579 g020
Figure 21. Original point cloud of multi-type pylons: (a) Pylon of Type a; (b) pylon of Type b; (c) pylon of Type c; (d) pylon of Type d; (e) pylon of Type e; (f) pylon of Type f; (g) pylon of Type g; (h) pylon of Type h.
Remotesensing 11 01579 g021
Figure 22. Pylon point cloud from multiple-returns data.
Remotesensing 11 01579 g022
Figure 23. The proportion of four types of errors. (a) the proportion of four types of errors of the type-a pylon; (b) the proportion of four types of errors of the type-b pylon; (c) the proportion of four types of errors of the type-c pylon; (d) the proportion of four types of errors of the type-d pylon; (e) the proportion of four types of errors of the type-e pylon; (f) the proportion of four types of errors of the type-f pylon; (g) the proportion of four types of errors of the type-g pylon; (h) the proportion of four types of errors of the type-h pylon.
Remotesensing 11 01579 g023
Figure 24. The 3D result of multi-type pylons reconstruction. (a) the three views of pylon model of type-a; (b) the three views of pylon model of type-b; (c) the three views of pylon model of type-c; (d) the three views of pylon model of type-d; (e) the three views of pylon model of type-e; (f) the three views of pylon model of type-f; (g) the three views of pylon model of type-g; (h) the three views of pylon model of type-h.
Remotesensing 11 01579 g024aRemotesensing 11 01579 g024b
Figure 25. Pylon points with noise.
Remotesensing 11 01579 g025
Figure 26. The result of pylon reconstruction after type 1 noise removed.
Remotesensing 11 01579 g026
Figure 27. The result of pylon reconstruction with different point densities: (a,e,i) The 3D model of original point cloud of type-a, type-c, and type-d pylon; (b,f,j) the 3D model of sampled data of type-a, type-c, and type-d pylon with a sampling distance of 0.1 m; (c,g,k) the 3D model of sampled data of type-a, type-c, and type-d pylon with a sampling distance of 0.2 m; (d,h,l) the 3D model of sampled data of type-a, type-c, and type-d pylon with a sampling distance of 0.3 m.
Remotesensing 11 01579 g027aRemotesensing 11 01579 g027b
Figure 28. Pylon points with data loss.
Remotesensing 11 01579 g028
Figure 29. The pylon with data loss and 3D pylon model: (a) Pylon with data loss; (b) the result of pylon reconstruction with data loss.
Remotesensing 11 01579 g029
Table 1. The empirical values of parameters for identifying the segmentation positions and key segmentation position.
ParameterEmpirical Value
Δh10.2 m
Δh20.2 m
W12 m
Tf75%
Ce0.5
TGTG = G1 + Ce
Table 2. The empirical values of parameters involved in the complex structure boundary recognition.
ParameterEmpirical Value
Tf75%
Tpy1.5
Table 3. The empirical values of parameters involved in the internal structure reconstruction.
ParameterEmpirical Value
W21 m
r1/3L
Imax15
Tr0.4
Table 4. Details about data acquisition.
ALS
System
Flying HeightHorizontal DistanceFlying SpeedField of ViewScanning SpeedRateLaser Beam DivergenceAngle Measurement ResolutionAccuracy
RIEGLVUX-140 m above the powerline30 m above the powerline30 km/h330°200 lines/s600 kHz0.5 mrad0.001°15 mm
Table 5. Details about pylon points.
The Type of PylonThe Number of PointsThe Length of Pylon (m)The Width of Pylon (m)The Height of Pylon (m)The Average Density of Points (pts/m3)
a32,79823.0615.14360.155
b593333.07910.74549.356
c16,42322.6913.2265.5518
d18,64620.16813.60763.5424
e39,64045.33718.99563.5437
f13,13329.42313.79367.7611
g712917.398.65643.5716
h619615.15415.15434.13218
Table 6. The laptop configuration.
LaptopCPUGPURAMVM
Lenovo Y700Intel Core I7-6700HQNvidia GeForce GTX 960M16G4G
Table 7. The parameters of the proposed method.
The Type of PylonPylon DecompositionPylon Reconstruction
Δh1
(m)
Δh2
(m)
W1
(m)
TfCeTpyW2
(m)
rImaxTrThe Distance Threshold of Linear Fitting Based on RANSAC(m)
a0.20.2275%0.51.511/3L150.40.2
b0.20.2275%0.51.511/3L150.40.2
c0.20.2275%0.51.511/3L150.40.2
d0.20.2275%0.51.511/3L150.40.2
e0.20.2275%0.51.511/3L150.40.2
f0.20.2275%0.51.511/3L150.40.2
g0.20.2275%0.51.511/3L150.40.2
h0.20.2275%0.51.511/3L150.40.2
Table 8. The result of precision verification about pylon redirection.
The Type of Pylonabcdefgh
Δθ(°)0.250.310.240.220.350.410.190.15
Table 9. The result of precision verification about pylon decomposition.
The Type of PylonΔS1
(m)
ΔS2
(m)
ΔS3
(m)
ΔS4
(m)
ΔS5
(m)
ΔS6
(m)
ΔS7
(m)
ΔS8
(m)
ΔS9
(m)
ΔS10
(m)
Average Value
(m)
a0.050.020.10.050.090.020.110.070.050.070.06
b0.030.080.02 0.04
c0.010.020.020.030.110.10.110.030.04 0.05
d0.020.030.010.090.030.120.080.1 0.06
e0.050.030.020.10.030.020.14 0.06
f0.030.030.07 0.05
g0.060.020.050.07 0.05
h0.050.040.030.08 0.05
Table 10. Errors in the pylon reconstruction.
The Type of PylonA1A2A3A4
Average (m)Maximum (m)Average (m)Maximum (m)Average (m)Maximum (m)Average (m)Maximum (m)
a0.210.350.120.270.080.390.150.33
b0.150.260.030.050.040.050.450.81
c0.450.790.050.070.030.060.290.75
d0.330.640.080.120.040.070.431.31
e0.240.290.070.130.030.070.250.68
f0.170.230.050.080.030.060.190.72
g0.130.180.070.110.040.070.330.67
h0.160.210.040.090.030.090.510.82
Table 11. The efficiency of pylon reconstruction.
The Type of Pylonabcdefgh
Time consumption (s)1.90.20.70.81.50.30.40.3
Table 12. The number of pylon points sampled uniformly.
The Type of PylonThe Number of Points
Original Point CloudSampling Distance
0.1 m0.2 m0.3 m
a32,79815,39173534358
c16,42311,41758713598
e39,64017,56810,7687105

