Article

Double-Rice System Simulation in a Topographically Diverse Region—A Remote-Sensing-Driven Case Study in Hunan Province of China

1
State Key Laboratory of Earth Surface Processes and Resource Ecology, Key Laboratory of Environmental Change and Natural Hazards, Faculty of Geographical Science, Beijing Normal University, Beijing 100875, China
2
Sino-French Institute for Earth System Science, College of Urban and Environmental Sciences, Peking University, Beijing 100871, China
3
Institute of Geographical Sciences and Natural Resources Research, Chinese Academy of Sciences, Beijing 100101, China
*
Author to whom correspondence should be addressed.
Remote Sens. 2019, 11(13), 1577; https://doi.org/10.3390/rs11131577
Submission received: 31 May 2019 / Revised: 27 June 2019 / Accepted: 27 June 2019 / Published: 3 July 2019
(This article belongs to the Section Remote Sensing in Agriculture and Vegetation)

Abstract

:
Few studies have focused on the potential impacts of topography on regional crop simulation, which might constrain the development of crop models and lead to inaccurate estimations for food security. In this study, we used remote sensing data to calibrate a regional crop model (MCWLA-Rice) for yield simulation in a double-rice crop rotation system in counties of Hunan province dominated by three landforms (plain, hill, and mountain). The calibration scheme with coarse remote sensing data (Global LAnd Surface Satellite, GLASS) greatly improved model accuracy for the double-rice system and is a promising method for yield estimation in large areas. The average improvement in relative root mean square error (RRMSE) was at most 48.00% for early rice and 41.25% for late rice. The average improvement in coefficient of determination (R2) value was at most 0.54 for early rice and 0.19 for late rice. Estimation of yield in counties dominated by different landform types indicated that: (1) MCWLA-Rice tended to be unstable in areas of complex topography and resulted in unbalanced proportions of overestimations and underestimations. (2) Differences in yield simulation between early rice and late rice varied among counties; yield estimates were highest in predominantly hilly counties, followed by counties dominated by plains, and lowest in predominantly mountainous counties. The results indicated that the topography might harm the accuracy of crop model simulations. Integration of topographic factors into crop models may enable yield estimation with enhanced accuracy to promote social development.

1. Introduction

As the world’s largest rice producer, China contributes almost 30% of the global rice production [1,2,3], and is distinguished from other rice-cropping countries in having the most complex topography. Topography can be collectively referred to as different landforms, such as plains, hills, mountains, valleys, plateaus, canyons, and islands. As a result, rice yield varies greatly with landform type. For example, according to the annual editions of the China Agriculture Yearbook [4,5], the average late rice yield ranged from ~6500 kg/ha on a plain to 7305 kg/ha on a hill and 7000 kg/ha on a mountain in Hunan province of China during the period 2000–2012. Previous studies have concluded that topography could influence rice growth together with field management practices and climatic variables [6,7,8]. However, the effects of topographic features, field management, and meteorological variables, as well as their interactions, are typically complex on crop growth and can only be adequately assessed at a crop model system level [9]. Many studies have examined how field managements and climatic variables contribute to crop growth through the use of crop models [10,11] at both field and regional scales. For example, Dhungana et al. [12] used the CERES-Wheat model to identify optimal management practices in Nebraska, USA. Their results revealed that farmers should delay sowing and decrease plant density with an increase in CO2 concentration. Similarly, Cho et al. [13] applied the CERES-Wheat model to 13 administrative regions in the UK and observed that earlier sowing may be beneficial in the future, whereas increasing the amount of fertilizer did not improve yields in a warm environment. Promoted by technological developments, such as in irrigation, fertilizers, and pesticides, improved field management has increased yield to the maximum potential [14,15,16]. Tao et al. [17] developed the MCWLA-Rice model under 10 future climate change scenarios, and observed that Chinese rice yield would change on average by 7.5–17.5%, 0.0–25.0%, and −10.0% to 25.0% during the 2020s, 2050s, and 2080s, respectively. Rosenzweig et al. [18] estimated the loss from heavy precipitation might double during the next 30 years in the USA by CERES-Maize. Overall, climatic variables play the most important role in yield variability, among which precipitation and temperature account for roughly one-third or more of yield variability [11,16,19]. However, few studies have examined the effects of topography on crop yield estimation, because process-based crop models usually include only the interactions between atmosphere, soil, water, and plant physiology, but do not consider topographic factors [20,21,22,23]. This limitation would weaken our understanding of real crop growth states, and ever more uncertainties would arise when we apply a crop model in areas of complex terrain.
Before incorporating topographic factors into crop models, an important prerequisite is to investigate how topography affects the performance of a crop model. The estimated yield is the most fundamental and important indicator with which to evaluate the performance of a crop model. At a regional scale, remote sensing is often coupled with crop models to estimate spatially accurate yields [24,25,26,27,28,29]. For example, Zhou et al. [28] incorporated MODIS-retrieved phenological information into the WOFOST model to improve rice leaf area index (LAI) simulation accuracy in the Dongting Lake region, Hunan province, China. Performance of WOFOST was remarkably improved with correlation coefficients (R) higher than 0.79 and root mean square error (RMSE) lower than 0.52 for LAI simulation. Chen et al. [30] assimilated phenology dates and Global LAnd Surface Satellite (GLASS) LAI into the regional crop model MCWLA to estimate winter wheat yield on the North Plain of China. The results showed that, the average coefficient of determination ( R 2 ) increased from 0.30 to 0.42 and the RMSE decreased from 1012 kg/ha to 737 kg/ha. Therefore, through coupling with remote sensing data, yield can be estimated accurately across large areas and model performance on different landforms can then be analyzed to reveal the of topographic impacts. Diversity in landforms is a notable feature in South China [31], especially in Hunan province, where the double-rice cropping system is the typical agricultural cropping system. The main objectives of the present study were (1) to improve regional yield estimation on different landforms for the double-rice cropping system in Hunan province, (2) to reveal topographic effects on yield estimation, and (3) to evaluate the potential factors that control yield estimation accuracy in areas with complex landforms.

2. Materials and Methods

Considering that crop models usually do not include topographic factors, we evaluated the topographic impacts on regional crop simulation through comparing model performance on different landforms. This is a relatively compromised way to evaluate the impact of topography on crop production. If the model performance varies significantly on different landforms, the potential findings will imply future model improvements to interpret topographic factors into a crop model for better simulation ability. Specifically, only a calibrated crop model can estimate yield with sufficient accuracy. Therefore, we firstly introduced a study area and materials (Section 2.1, Section 2.2, and Section 2.3); then explained the calibration and validation process for MCWLA-Rice (Section 2.4); and finally, discussed how to evaluate model performance on different landforms (Section 2.5).

2.1. Study Area

Hunan province is located in southern-central China (Figure 1a) and consists of a variety of topographic conditions (Figure 1c): Low-lying plains near Dongting Lake, tablelands and hills along the Xiangjiang River, and mountains in the eastern, western, and southern portion of the province. The continental subtropical monsoon humid climate and dense river network provide plentiful sunlight, heat, and water sources for double-rice cropping in the province, which contributes the largest portion (19%) to overall Chinese rice production. Land use data [32,33] show that the rice-cultivation areas are mainly concentrated around Dongting Lake and Xiangjiang River (Figure 1b). Considering the availability of long-term historical crop data and the diversity of landforms, we selected 21 counties as the study areas (Figure 1d), where the predominant landform within one county was defined as the county-scale landform. The rice-cultivation ratio is higher than 0.05 in each county [11]. The portion of paddy soil is highest on the plain around Dongting Lake and Xiangjiang River. Less-fertile red soil is concentrated in hilly and mountainous areas (Figure 1e). On the basis of statistics from 2000 to 2012 for the 21 counties, we calculated the average and standard deviation (SD) for the main rice phenological dates (transplanting date, heading date, and harvest date). For early rice crops, the mean ± SD day of year (DOY) was 174 ± 5 for transplanting, 174 ± 3 for heading, and 197 ± 3 for harvest (Figure 1f). For late rice crops, the DOY was 203 ± 4, 255 ± 3, and 292 ± 6, respectively. Overall, the main phenological dates showed limited variation among the selected 21 counties.

2.2. MCWLA-Rice Model

The Model to capture the Crop-Weather relationship over a Large Area for rice (MCWLA-Rice, [17,34]) was used to simulate the growth and productivity of the double-rice cropping system in the present study. Same to other process-based regional crop models, MCWLA-Rice does not include topography components. The MCWLA-Rice parameters consist of 17 biological and physical variables (details in Table S1) in two main sub-model components: The phenology component (the first seven parameters) and the yield component (the rest ten parameters). Specifically, growing degree days during the vegetative growth period (VGP) and the reproductive growth period (RGP) determines rice phenology dates. The biomass is accumulated from photosynthate in the RGP and subsequently transferred into yield using a harvest index. A detailed description of equations and corresponding parameters in the MCWLA-Rice model can be found in previous studies [17,34,35,36]. MCWLA-Rice has shown excellent ability and expansibility to capture crop growth and productivity over a variety of large areas [17,34,36,37,38,39,40,41,42].

2.3. Data

The study period comprised the growing seasons for early rice (late March to early July) and late rice (mid-July to October) from 2000 to 2012. A portion (77%) of the study period was used for calibration (from 2000 to 2009) and 23% was used for validation (from 2010 to 2012). The calibration period was featured with climate cycles in the study area (Supplementary S2), which could improve the simulation robustness of crop models under various climate scenarios. The calibration process used both ground observations and remotely sensed data to localize crop parameters for the double-rice system in each county, whereas the validation process only used ground-observed data.
Ground-observed data included weather information, soil and hydrological properties, and crop growth information. Simulating crop growth in a daily time-step, MCWLA-Rice requires daily precipitation, vapor pressure, solar radiation, wind speed, and the maximum and minimum temperatures, which were extracted from a 0.25° × 0.25° daily grid weather dataset [43]. Data for the soil texture and hydrological properties were obtained from the Food and Agriculture Organization of the United Nations soil dataset [44]. We obtained county-scale yield data from the China Agriculture Yearbooks, which were used as the reference data for both calibration and validation processes.
Remote sensing data can provide more heterogeneous spatial and temporal information for crop model inputs, and have been widely used for calibration of canopy state variables [24,45,46], soil properties [25,47,48], and phenological information [28,42,49] in modeling processes. In the present research, the Global LAnd Surface Satellite LAI (GLASS LAI; [50]) product was used as ancillary remote sensing data to calibrate MCWLA-Rice over a large area; this product is superior in temporal integrity and spatial continuity than other available LAI products [50]. We obtained GLASS LAI data with an 8-day composite and 1 km × 1 km spatial resolution for the study period (http://glass-product.bnu.edu.cn/?pid=3&c=1), and then retrieved the 0.25° × 0.25° grid phenology dates (transplanting, heading, and harvest dates) of the double-rice cropping system using wavelet methods [51]. The retrieval process was based on the bimodal features of double-rice LAI (Figure S2), which increased after early-rice transplanting, reached the first LAI peak around the early-rice heading date, then remained at relatively low LAI values with a short interval between early-rice harvest and late-rice transplanting. The second LAI peak was attained at the late-rice heading date, and finally ended up with an abrupt decrease in LAI reflecting the late-rice harvest. The retrieved phenology dates were evaluated at the grid scale (Supplementary S4) and were regarded as suitable for MCWLA-Rice calibration.

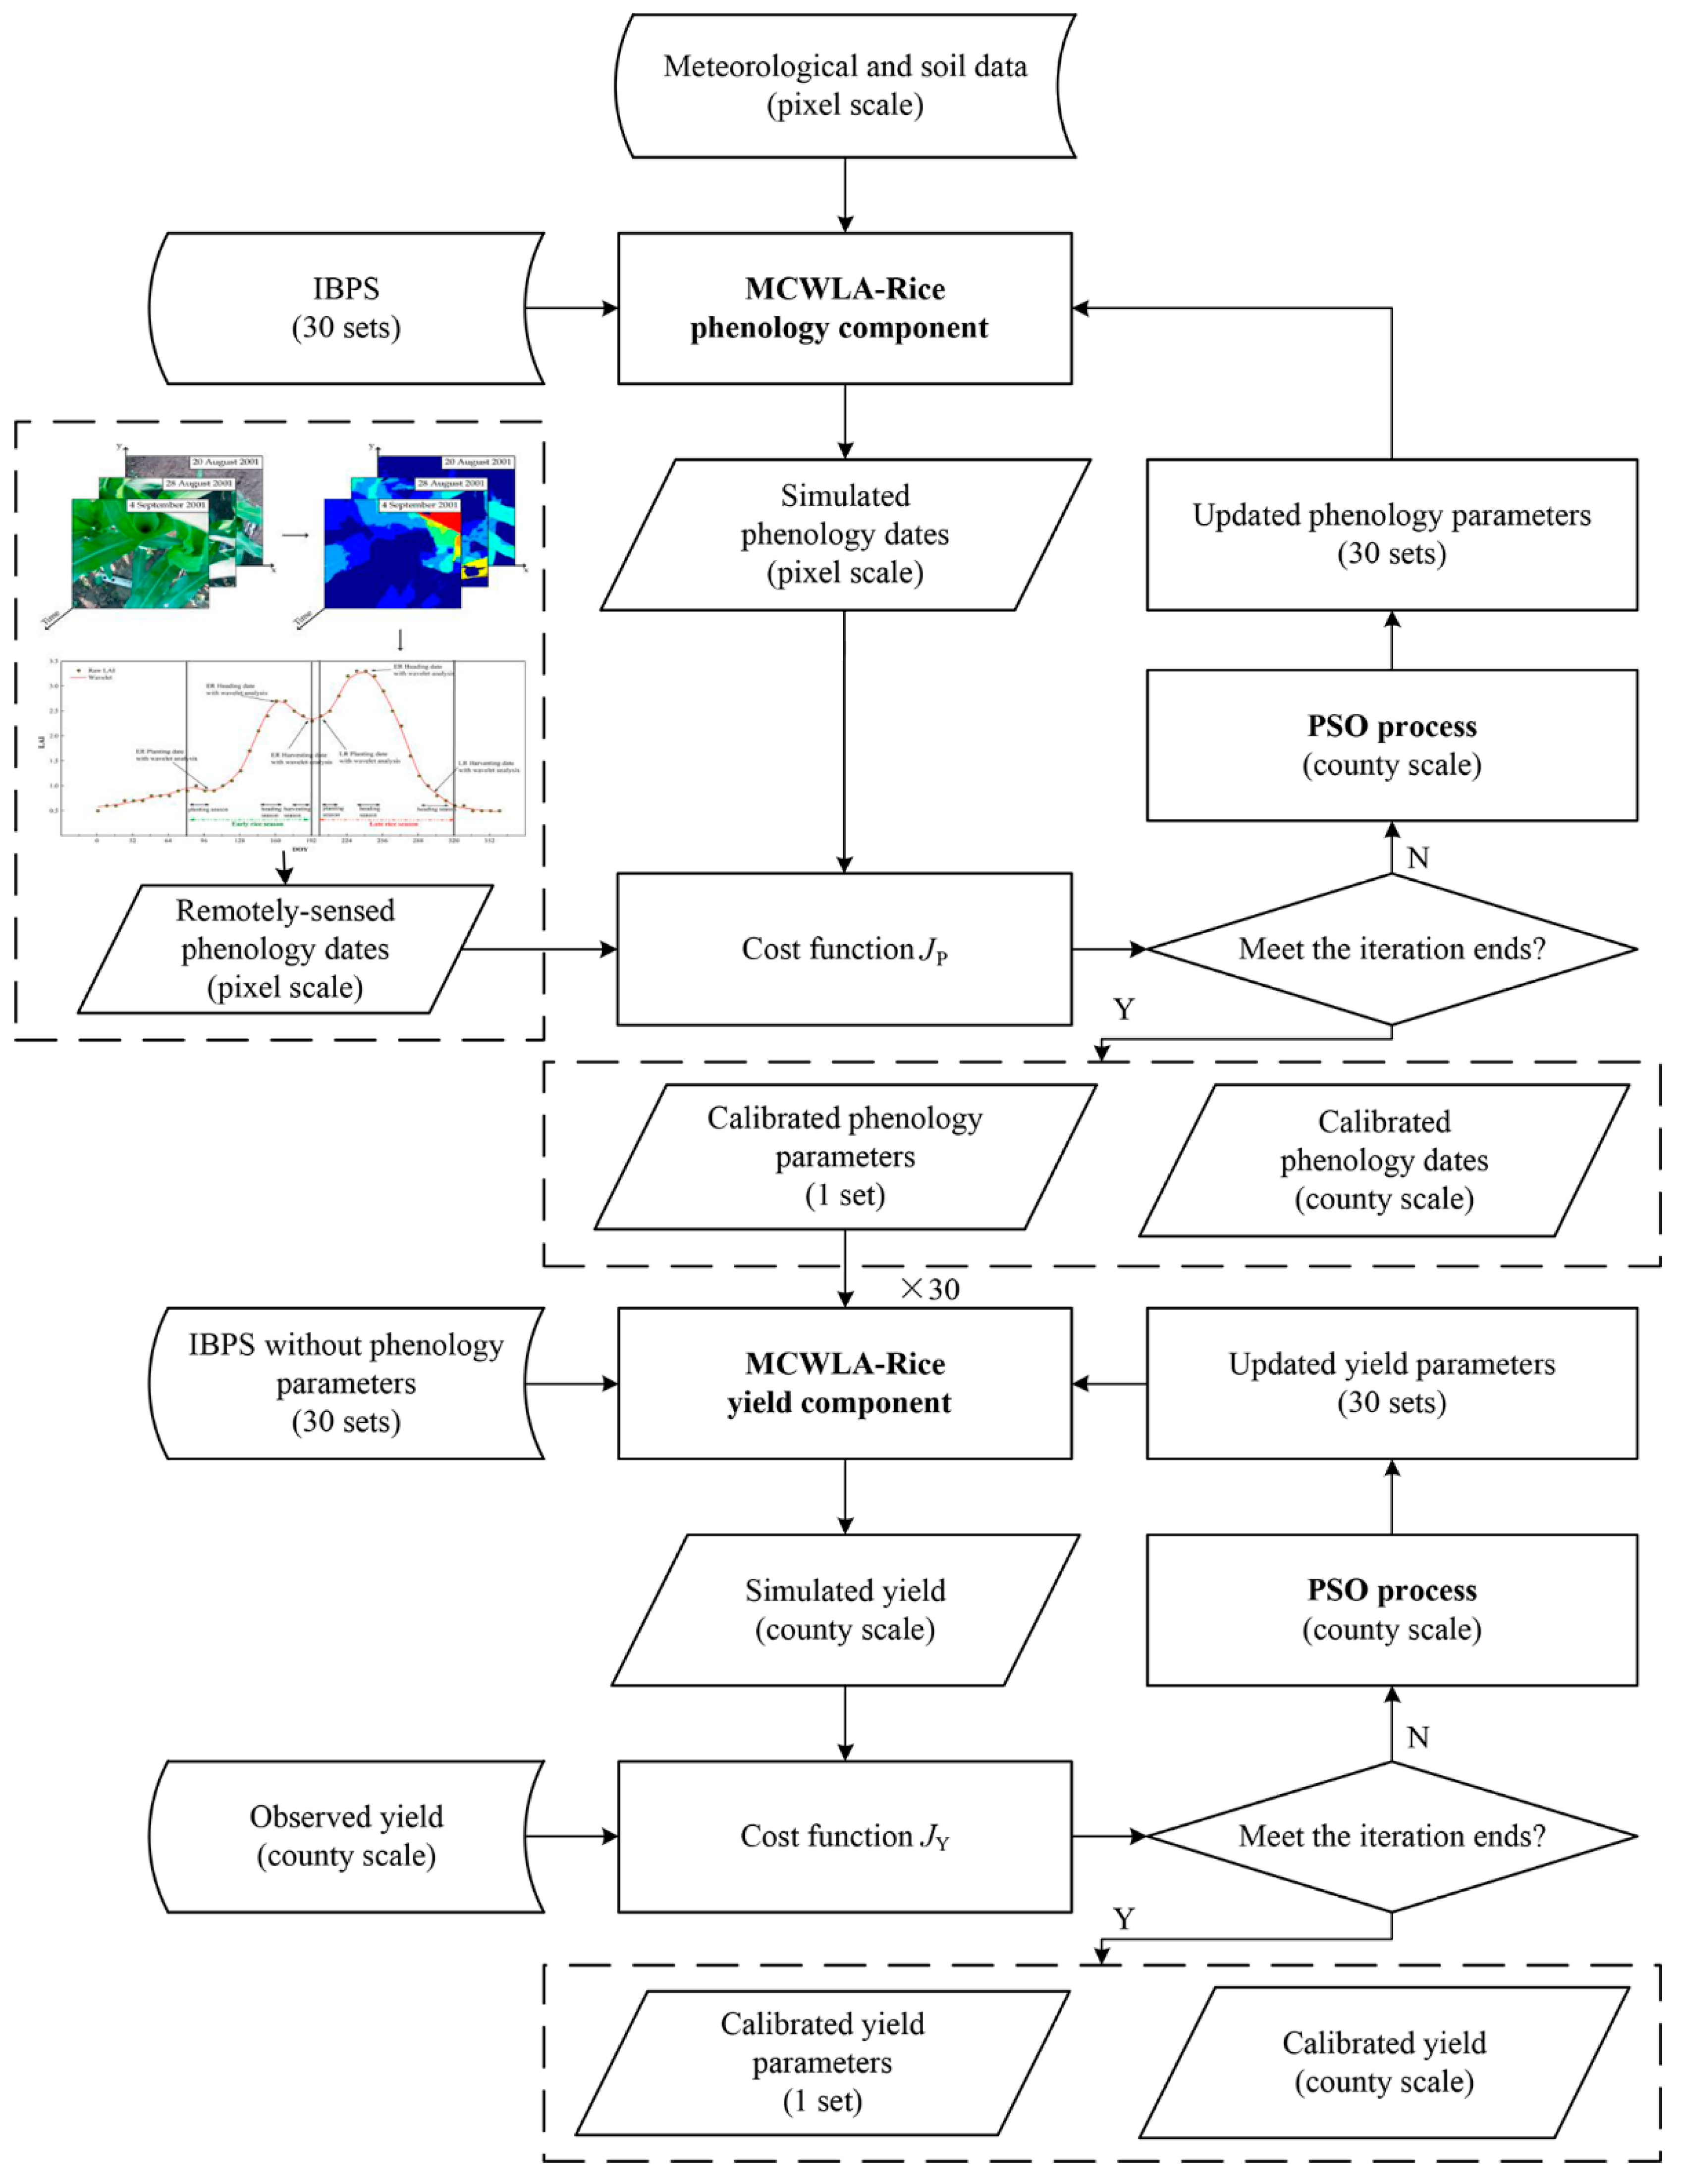
2.4. Calibration and Validation Framework

2.4.1. Calibration Process

Calibration of crop models at the county scale can improve the heterogeneity of simulation results at broad spatial scales [29,41,42,52,53,54]. In addition, only after the VGP and RGP are determined using the simulated phenology dates, MCWLA-Rice can accumulate biomass for the final yield output [34,36,55]. Therefore, the calibration strategy in the present study was to minimize the cost functions for phenology dates and yield in sequence. Particle swarm optimization (PSO; [56]) was used for the minimization process in MCWLA-Rice to output the calibrated results from 2000 to 2009. The following general framework for the calibration process (Figure 2) was applied to early rice and late rice independently.
(1) After generating 300 initial parameter sets by Latin hypercube sampling from parameter intervals (Supplement S1), we selected 30 parameter sets with the minimum RMSE between the simulated and historical crop yield series, and defined these as the initial best parameter sets (IBPS) for calibration of MCWLA-Rice.
(2) A cost function ( J P , Equation (1)) was calculated to assess the difference between the simulated and remotely retrieved phenology dates at the county scale in each iteration. The PSO scheme minimized J P and updated the phenology parameters until the iteration targets were reached (details in (4)).
J P = y = 1 10 i = 1 m abs ( P h e n o l o g y i y s     P h e n o l o g y i y r ) m / 10 ,
where P h e n o l o g y i y s and P h e n o l o g y i y r are the simulated and remotely retrieved phenology dates, respectively, at grid i of year y; and m is the grid number within the cultivation area of each county.
(3) After obtaining the calibrated phenology dates and parameters from the phenology component of MCWLA-Rice, we replaced the first seven parameters in each IBPS and then began the yield calibration process. By calculating the relative RMSE (RRMSE; Equation (2)) between the simulated yield and observed detrended rice yield at the county scale in each iteration, the PSO scheme updated the yield parameters until reaching the iteration target (details in (4)).
J Y   =   RRMSE   =   y = 1 10 ( ( i = 1 m Y i e l d i y s / m )     Y i e l d y o ) 2 10 / y = 1 10 Y i e l d y o 10 100 % ,
where Y i e l d i y s is the simulated yield at pixel i of year y, and Y i e l d y o is the county-scale observed yield of year y .
(4) Calibration for phenology/yield ended up when either the minimum fitness value or the maximum number of iterations (100 times in the present study) was met. To avoid suboptimal results, the initial parameter sets were reinitialized if fitness values remained unchanged in the last 10 loops. In addition, the PSO process was ended after continuous re-initialization for five loops.

2.4.2. Validation Process

Using the calibrated MCWLA-Rice parameters based on 77% of the study period (from 2000 to 2009) and ground-observed data for the remaining 23% of the study period (from 2010 to 2012), we validated the county-scale yield by comparing the simulated yield with the ground-observed detrended yield. The validation process was applied to early rice and late rice independently, and used the criteria outlined in Section 2.4.1 and Section 2.5 to analyze the predictive ability of MCWLA-Rice.

2.5. Evaluation Methods

For evaluation of the model calibration and validation performance in counties dominated by different landforms [57,58,59], we also used additional criteria besides fitness values (Equations (1) and (2)) outlined in Section 2.4.1. The RMSE for phenology dates (Equation (3)) summarized statistical characteristics of the model output errors from Equation (1). The R 2 (Equation (4)) represented the proportion of total variance in the observed yield that could be explained by the model output, while the RRMSE in Equation (2) could be used to compare yield errors across large areas.
RMSE   =   y = 1 10 ( i = 1 m P h e n o l o g y i y s     i = 1 m P h e n o l o g y i y r ) 2 13   ,
where all variables are defined in Section 2.4.1.
R 2   =   [ y = 1 10 ( Y i e l d   y   s   Y i e l d s ¯ ) ( Y i e l d y o     Y i e l d o ¯ ) σ s σ o ] 2 ,
where
  • Y i e l d y s = i = 1 m Y i e l d i y s / m ,
  • Y i e l d s ¯ = y = 1 10 Y i e l d y s / 10 ,
  • Y i e l d o ¯ = y = 1 10 Y i e l d y o / 10 ,
where Y i e l d y s is the simulated yield of year y at the county scale, and Y i e l d s ¯ and Y i e l d o ¯ are the mean of the simulated and observed yields, respectively, during 2000–2009. The remainder of the variables are defined in Section 2.4.1.

3. Results and Discussion

3.1. Evaluation of Model Simulation

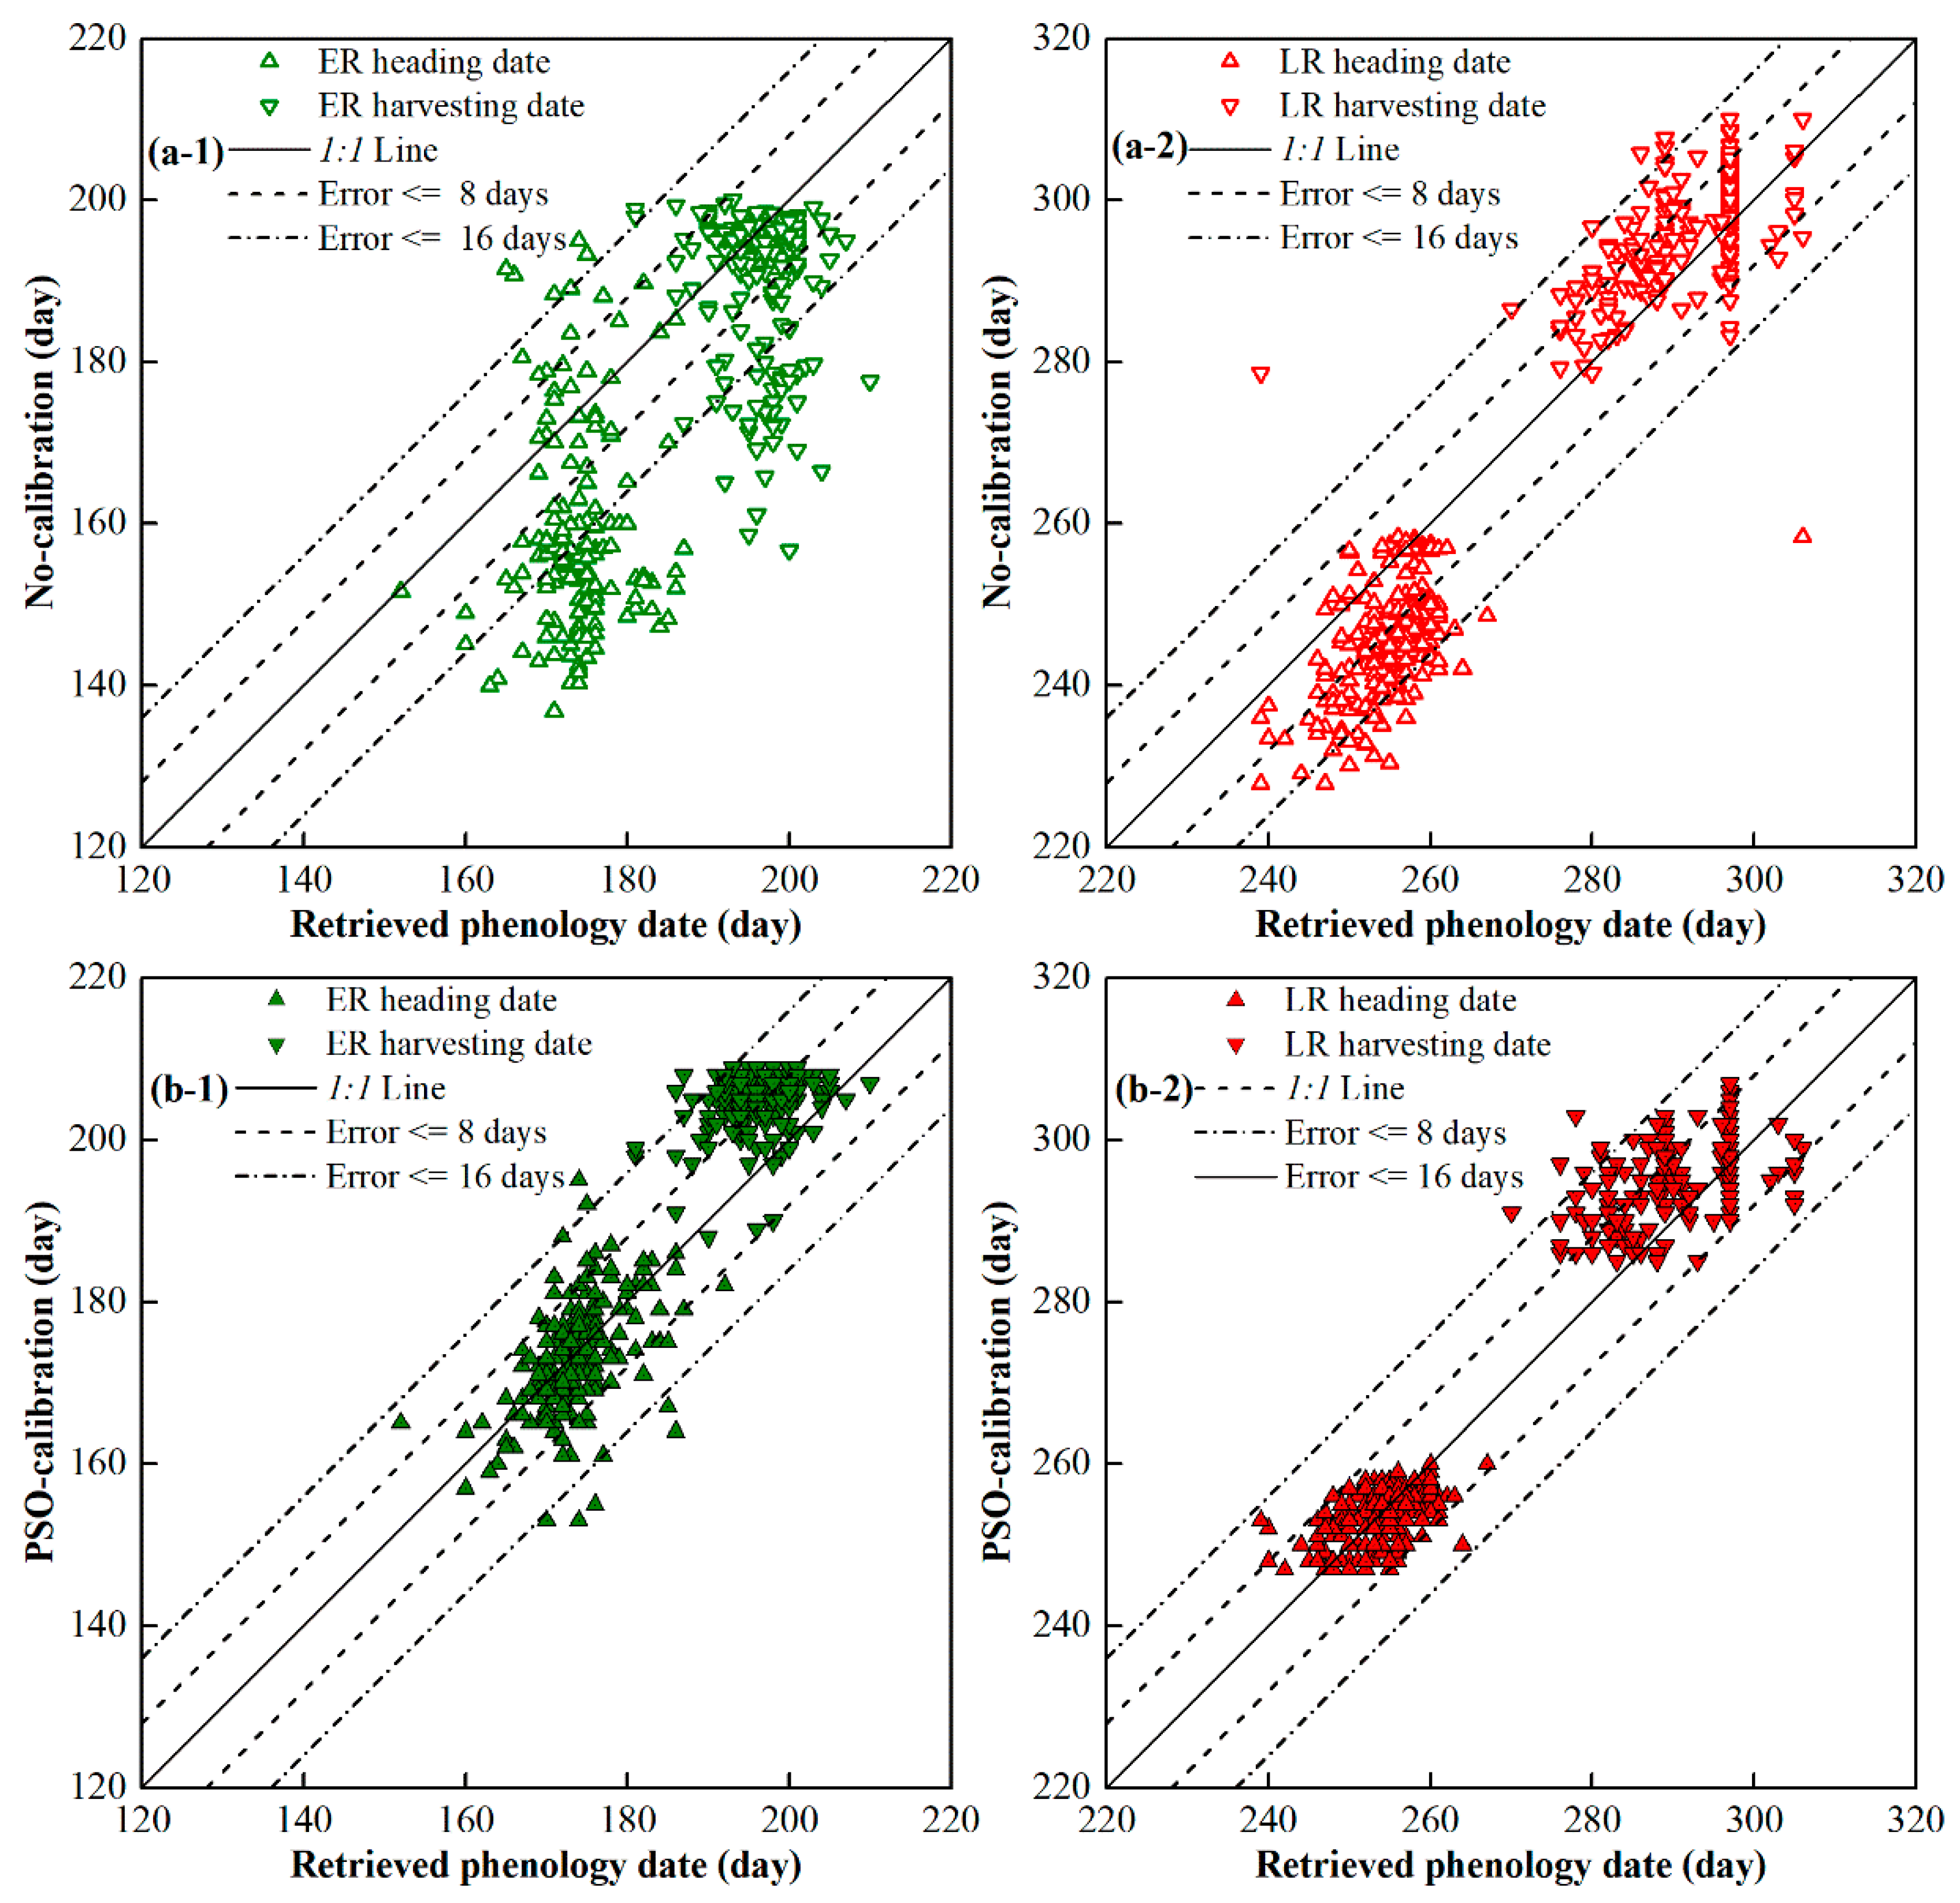
3.1.1. Calibration for Phenology Dates

As a critical intermediate variable during the calibration of a crop model, the accurate simulation of phenology dates ultimately benefits the yield output. Coupled with remotely sensed phenology dates, the PSO calibration scheme greatly improved the modeling accuracy of phenology dates, especially for early rice (Figure 3). The early-rice calibration results revealed that the ratio of error exceeding 16 days was reduced from 69.05% to 3.81% for heading date and from 17.14% to 2.86% for harvest date (Figure 3a-1,b-1). With regard to late rice, the ratio of error exceeding 16 days decreased from 12.86% to zero for heading date and showed little change (from 2.83% to 2.57%) for harvest date (Figure 3a-2,b-2). Statistically, the average RMSE of early rice was reduced from 40 days to six days for heading date and from 18 days to nine days for harvest date. The average RMSE of late rice decreased from 10 days to four days for heading date and from eight days to six days for harvest date. Although PSO-calibrated heading dates closely followed the 1:1 line (Figure 3b-1,b-2), most no-calibrated heading dates were grossly underestimated (Figure 3a-1,a-2). In contrast, most harvest dates were overestimated (Figure 3a-2,b-1,b-2) except for no-calibrated early rice (Figure 3a-1). The overall overestimation of PSO-calibrated harvest dates for both early and late rice (Figure 3b-1,b-2) suggested that the crop model was limited in its ability to accurately capture the double-rice rotation system, and attempted to extend each simulation period as long as a single-rice cropping system could be extended. However, farmers in reality usually use early-maturing cultivars for early rice to ensure a quick harvest for the first crop, and late-maturing cultivars for late rice so that the crop can grow as long as possible to gain enough accumulated heat for a second harvest in the same year. Therefore, the model simulation mismatched the early-rice phenology but more closely matched that of late rice. As a result, it was not surprising that the simulation errors for phenology dates were higher for early rice than for late rice.

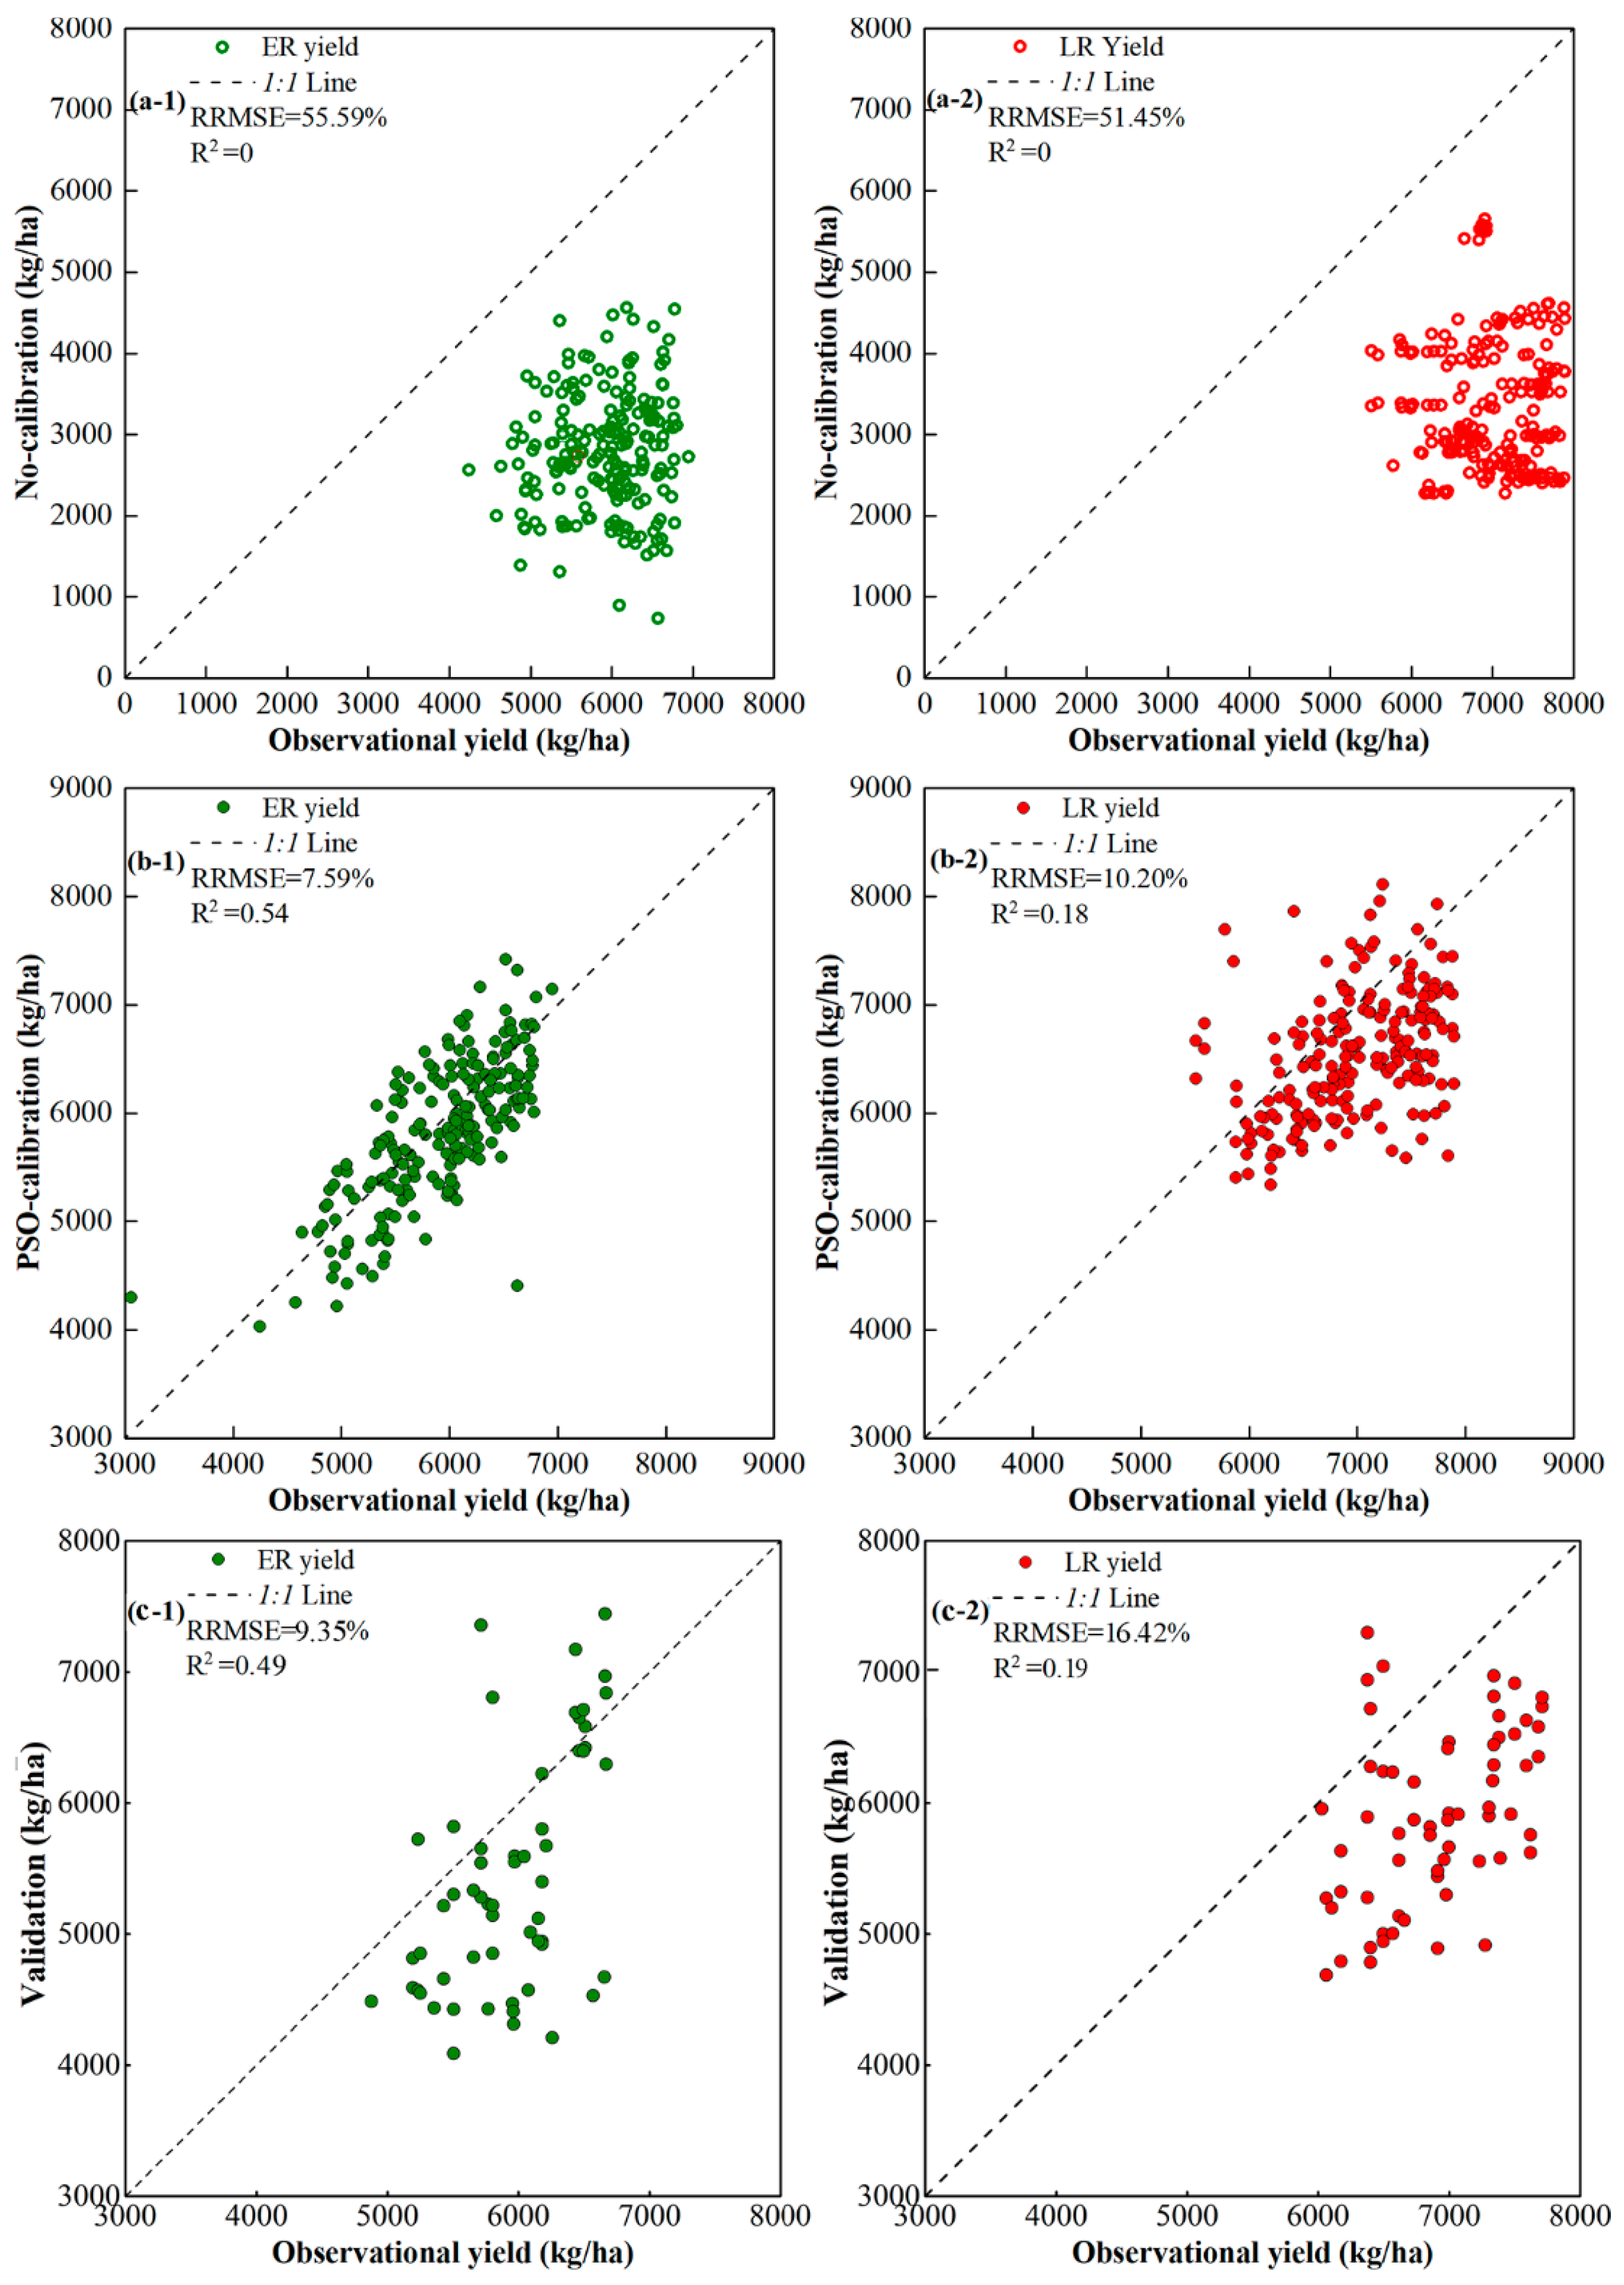
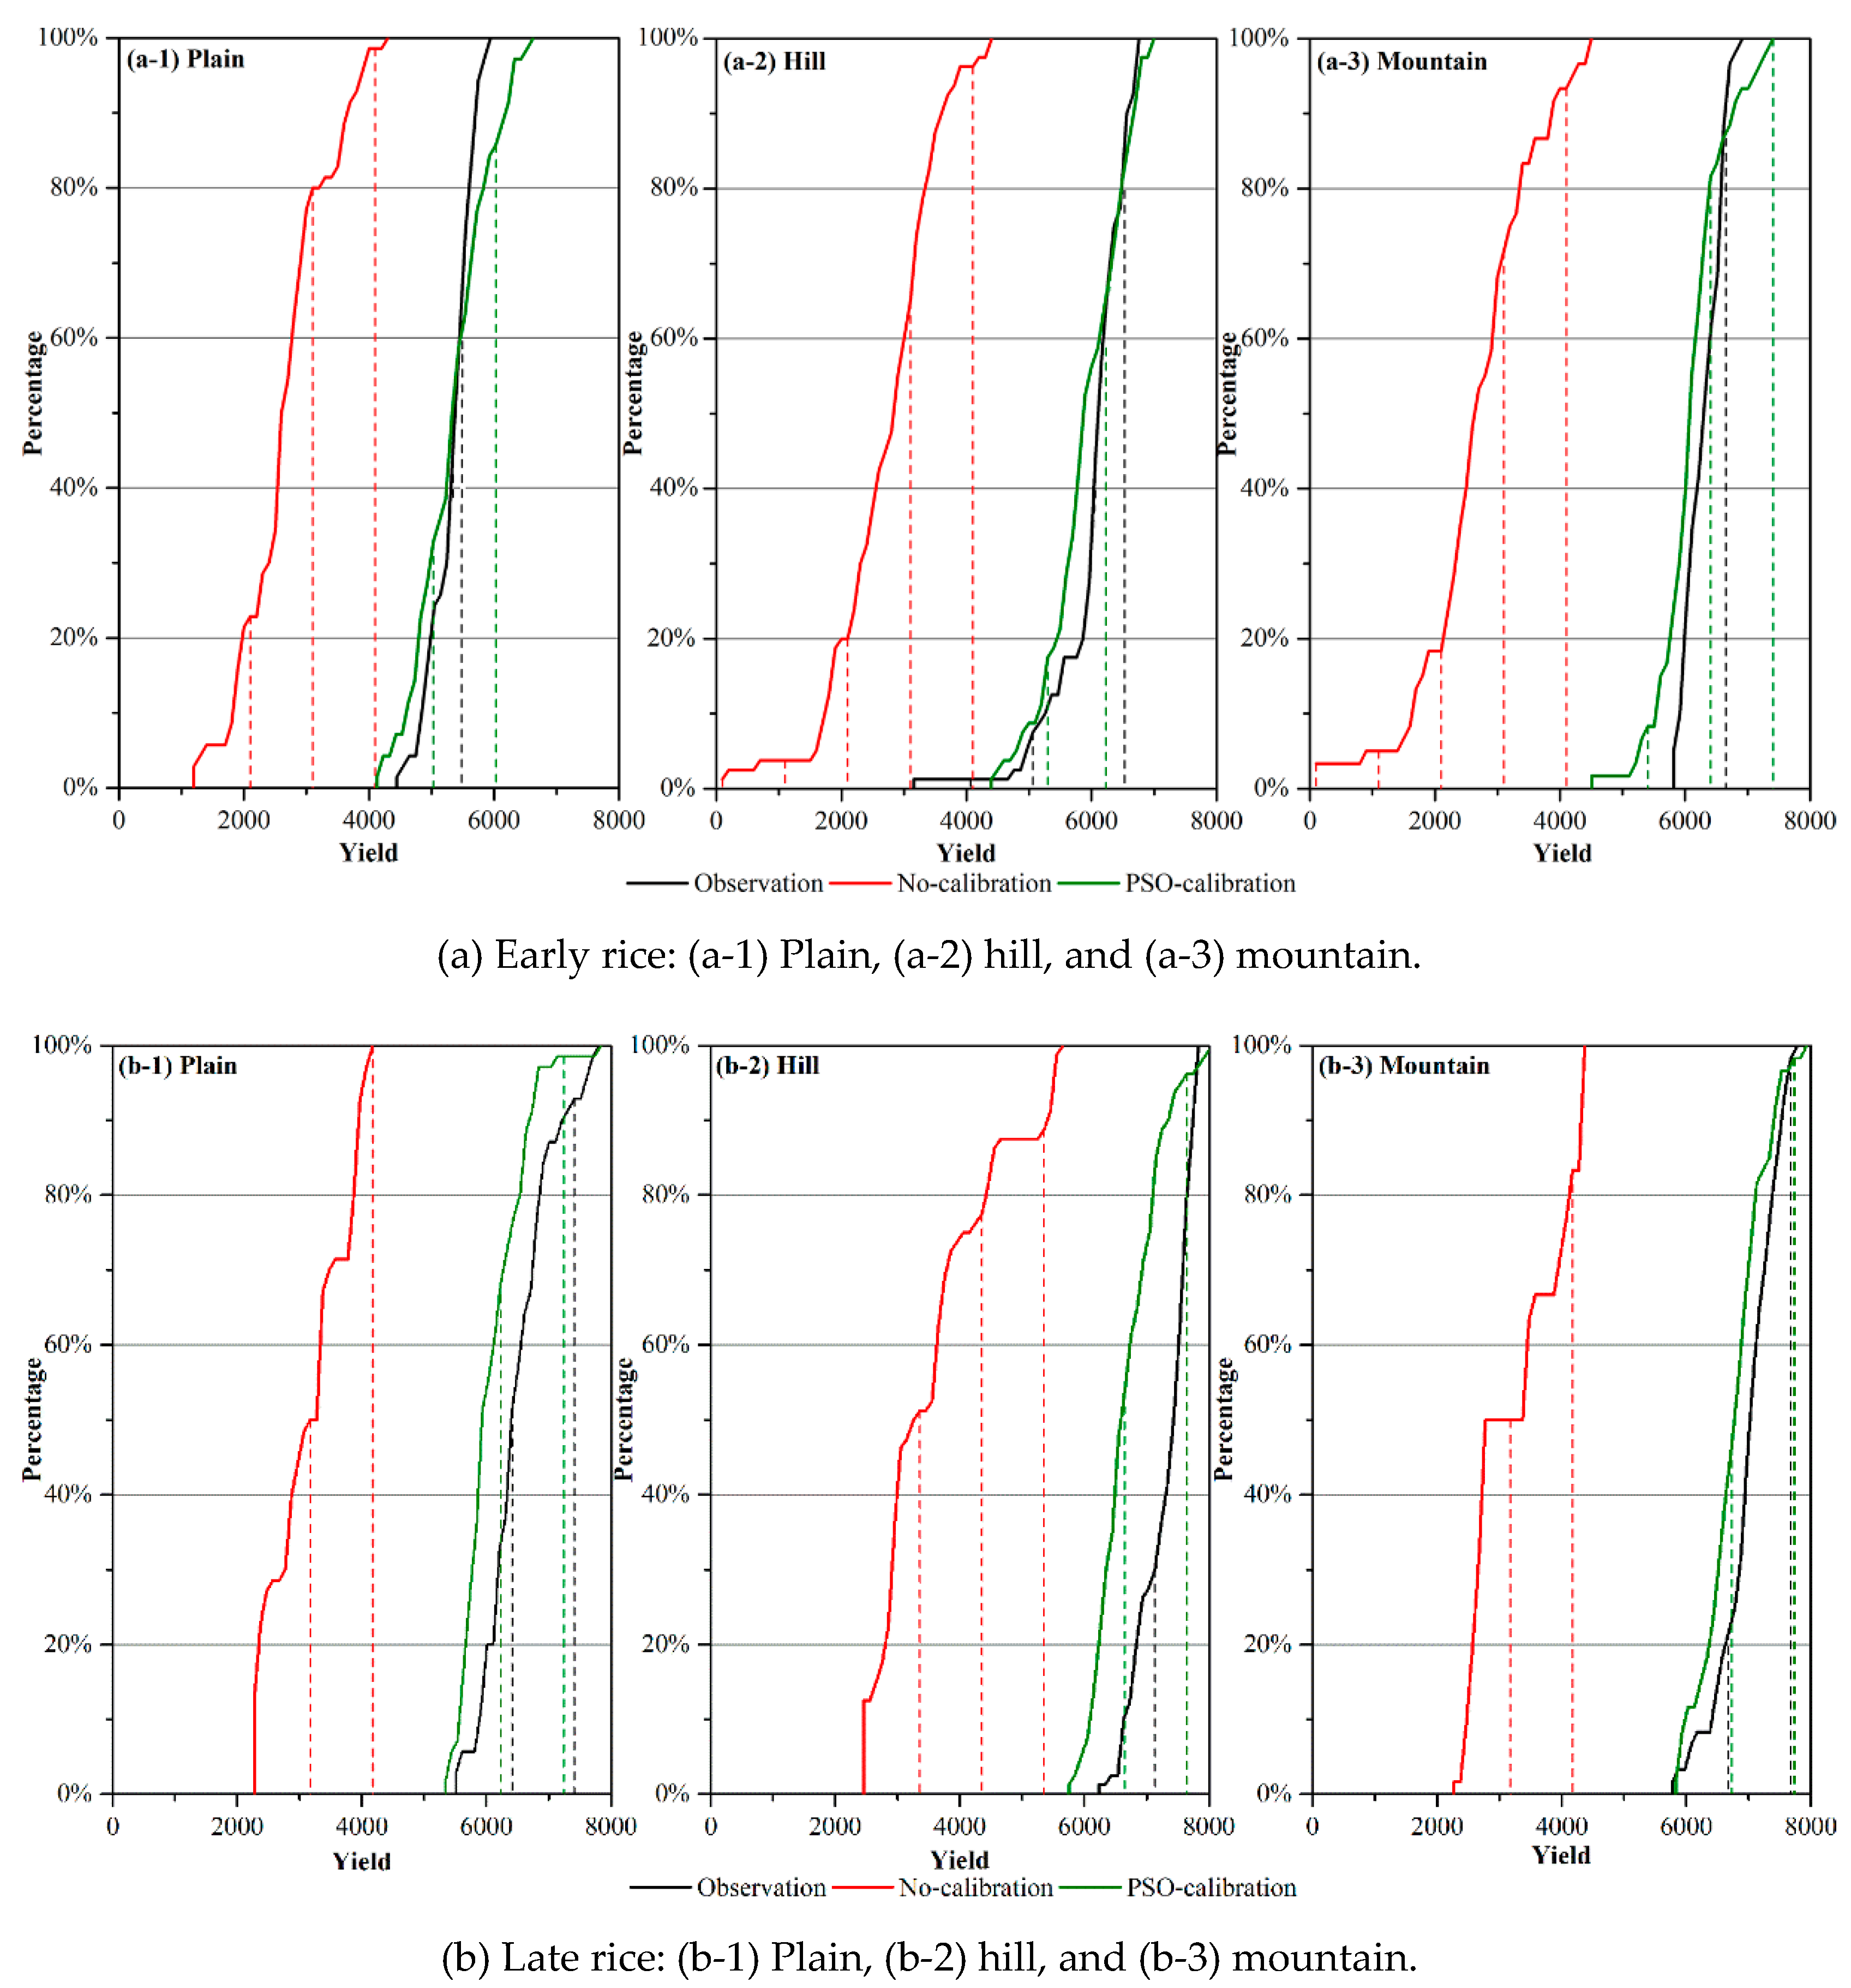
3.1.2. Calibration and Validation for Final Yield

Final yield is an important focus of researchers and was used to assess the crop simulation ability. We calculated the RRMSE and R 2 between the observation and model outputs to evaluate the performance of the model calibration and validation results (Figure 4). The PSO-calibration scheme reduced yield estimation errors for double rice from 2000 to 2009, and performed better for early rice than for late rice. Without PSO-calibration, the simulated yields were greatly underestimated (Figure 4a-1,a-2) with yield average RRMSE of 55.59% for early rice (Figure 4a-1) and 51.45% for late rice (Figure 4a-2). After PSO-calibration, one-by-one comparison between the observed and simulated yield were clustered around the 1:1 line for both early rice and late rice (Figure 4b-1,b-2). The average RRMSE was 7.59% for early rice (Figure 4b-1) and 10.20% for late rice (Figure 4b-2). In addition, the R 2 values were greatly improved from near zero to 0.54 for early rice and 0.18 for late rice after applying PSO-calibration (Figure 4a-1,a-2). Considering that heading and harvest dates determine the length of the dry matter accumulation process in the reproductive stages, more accurate estimation of phenology dates in Section 3.1.1 might contribute considerably to the satisfactory performance for yield simulation. Moreover, the main reason for the good calibration results must be that we used a mechanism-wiser calibration method. Cost functions of traditional calibration methods usually combined errors between simulation and observation into an overall value. For example, Wallach et al. [60] calculated least squared errors between modeled and observed values for yield, biomass, and LAI. These errors were weighted by the variance in observation data and summed together to provide a single goodness-of-fit value. However, weighting schemes depend on research objectives, which likely increase simulation uncertainty. Another potential problem of the traditional calibration methods is that parameter estimation is a “black-box” calibration, where errors in one parameter may compensate for errors in other parameters. In the present study, we divided MCWLA-Rice into two function components and calibrated parameters through minimizing two cost functions individually. Such a calibration strategy could avoid the “black-box” effects and improved estimation accuracy to some extent.
The validation results (2010–2012) showed a slight increase in RRMSE and decrease in R 2 compared with those of the calibration results (2000–2009). The average RRMSE of early rice and late rice were 9.35% and 16.42%, respectively (Figure 4c-1,c-2), and the corresponding R 2 values were 0.49 and 0.19, respectively. The validation performance was sufficiently accurate when compared with that of previous studies. For example, in previous reports, the yield RRMSE was in the range of 17–30% [61] and 12%~22% [62]. A RRMSE for yield of less than 20% is commonly regarded as an acceptable accuracy by many researchers [63,64,65,66]. In the current study, the majority of RRMSEs for validation of double-rice yield were less than 10%, which suggested that modeling accuracy was superior to that achieved in previous studies.
Comparison of the present results with those of similar studies conducted in South China supported the conclusion that the PSO-calibration scheme performed best to estimate rice yield across large areas with complex landforms (Table 1). The estimation error in the study by Shen et al. [66] was the highest, with a yield RRMSE of 12.70%. The yield RRMSEs in the studies by Chen et al. [67] and Wang [68] were only slightly lower than those in the present study, which might reflect the high-resolution remote sensing data used in their studies (30 m for Landsat 8, 100 m for HJ-1 A/B). However, the money- and time-consuming processing of these high-resolution products constrained their broad application to large geographic areas. By using the coarser GLASS LAI data for a much larger area (240 times the area studied by Chen et al. [67] and 146 times that of Wang [68]), we also gained sufficiently accurate results. Overall, the calibration scheme with coarse remote sensing data used in the present study is a potentially powerful tool to estimate and predict yields of double-rice cropping systems over a large area with complex landforms.

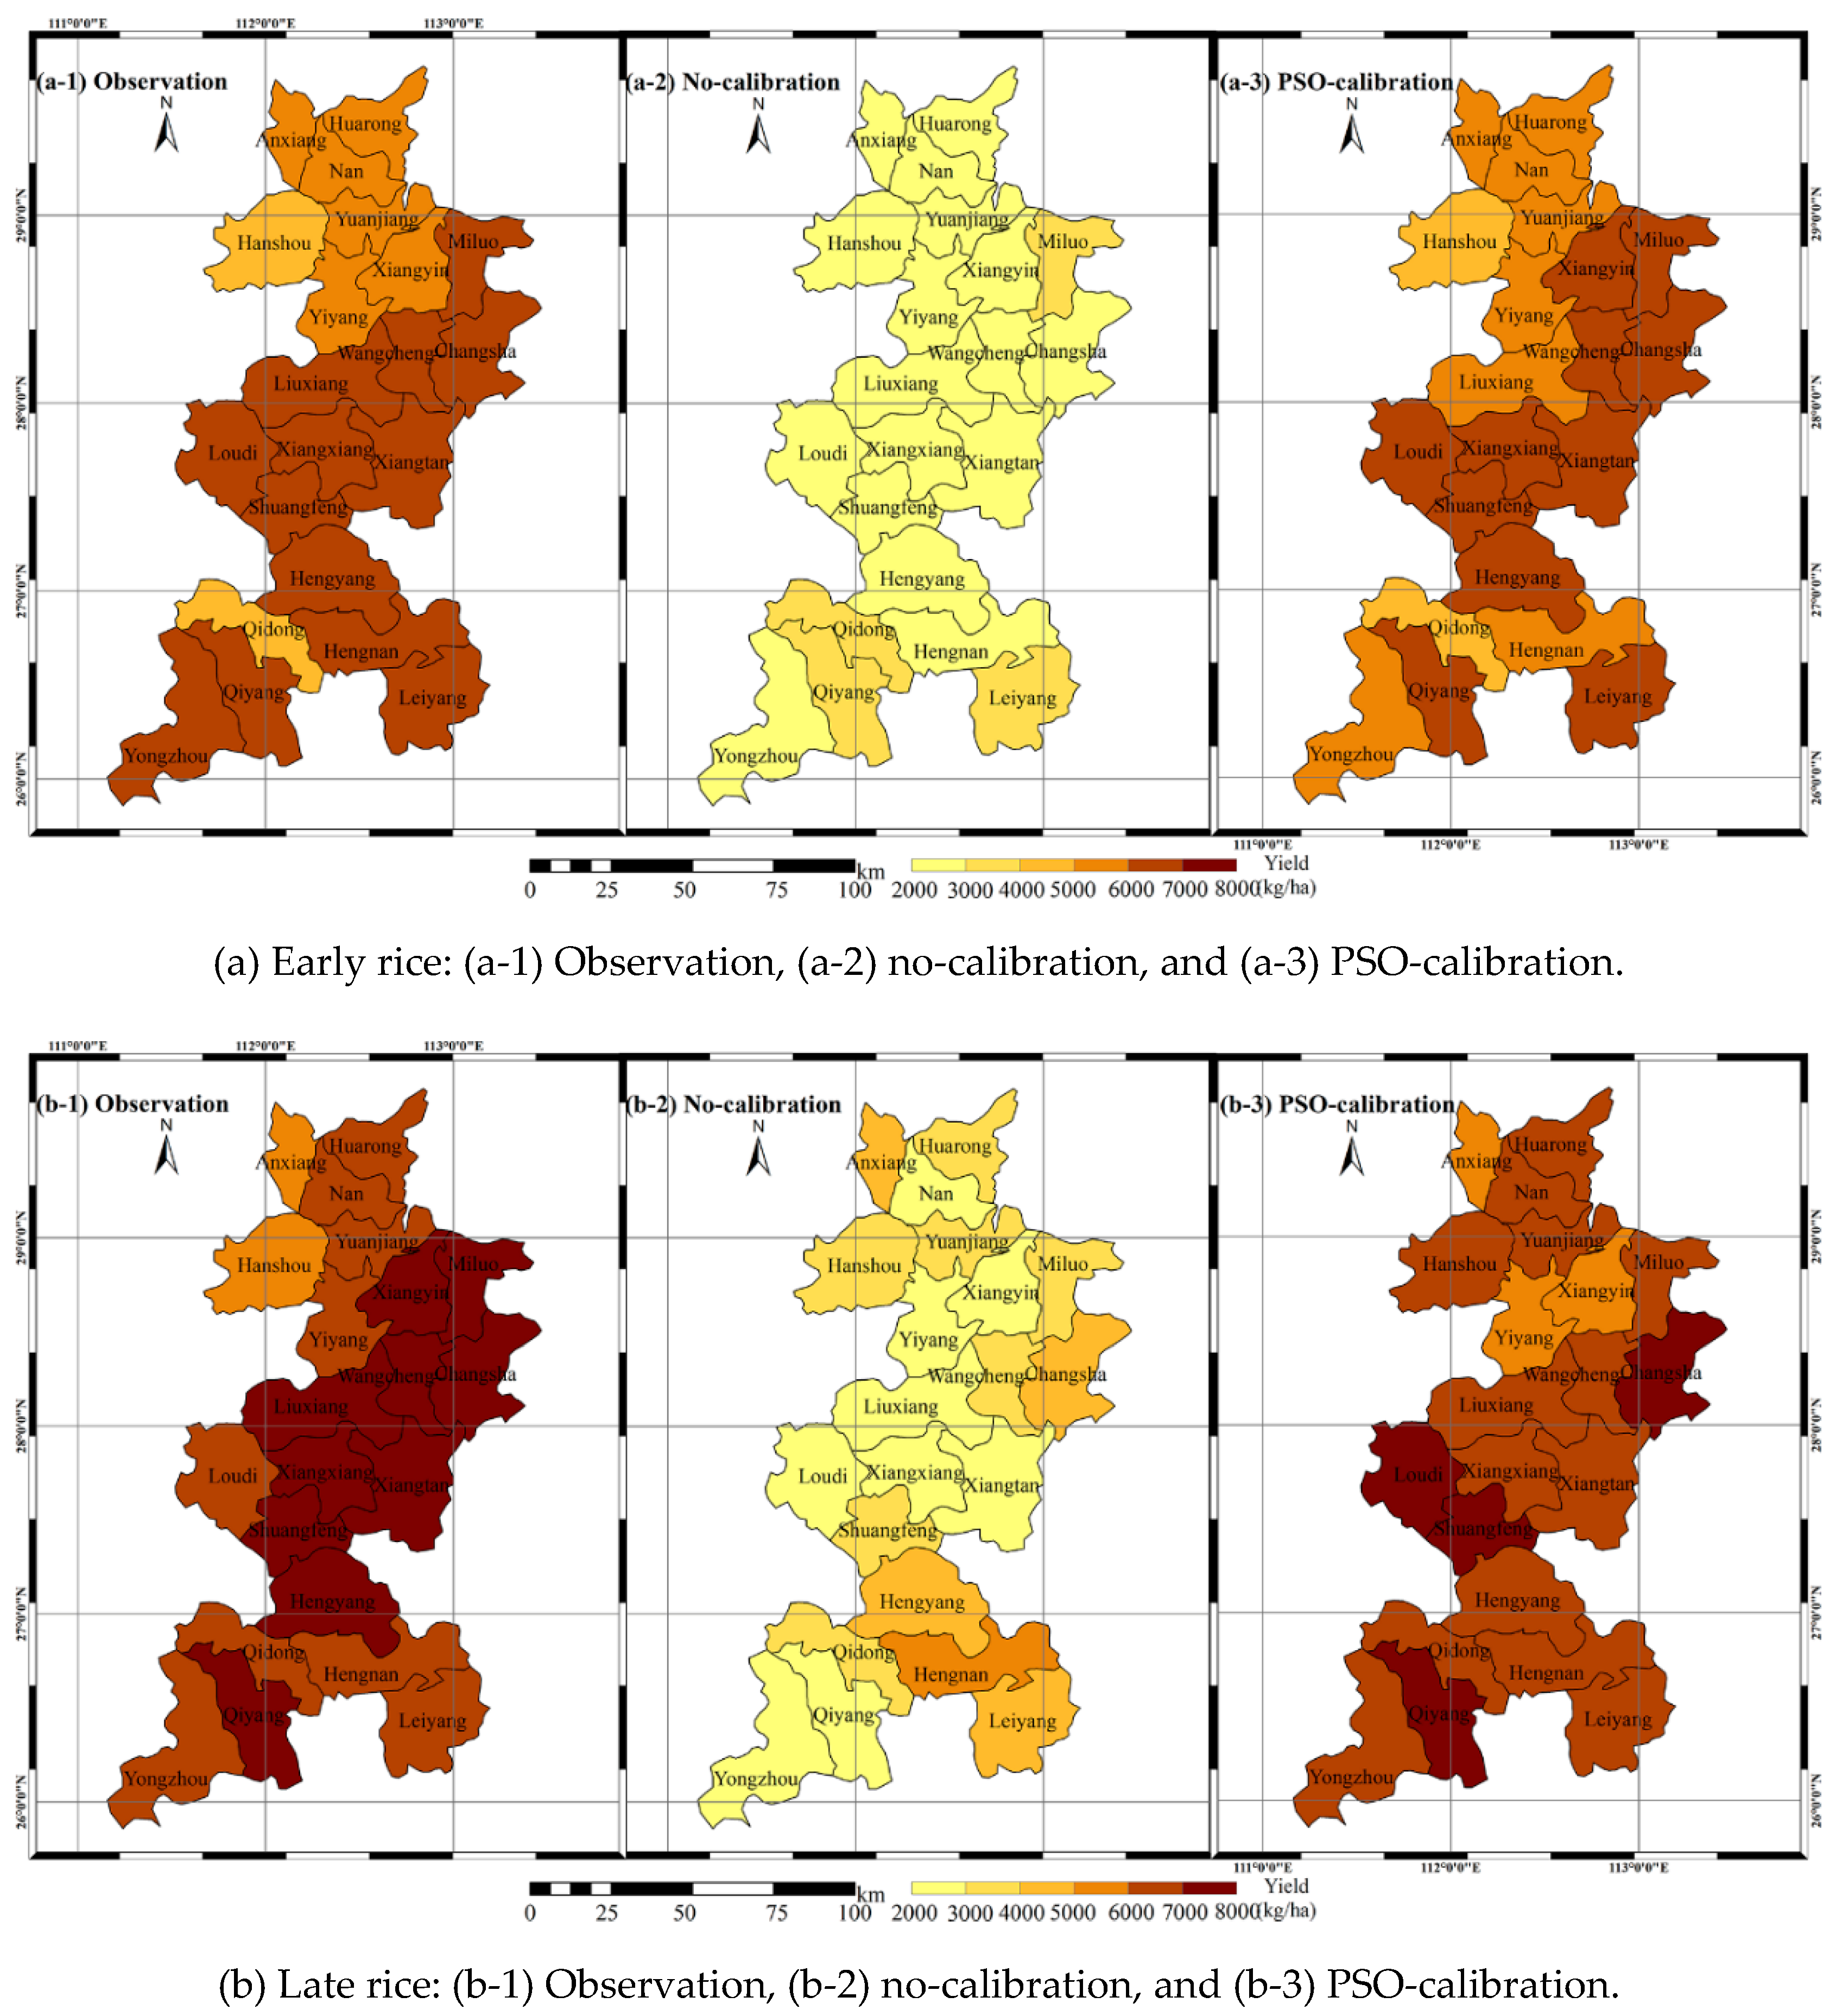
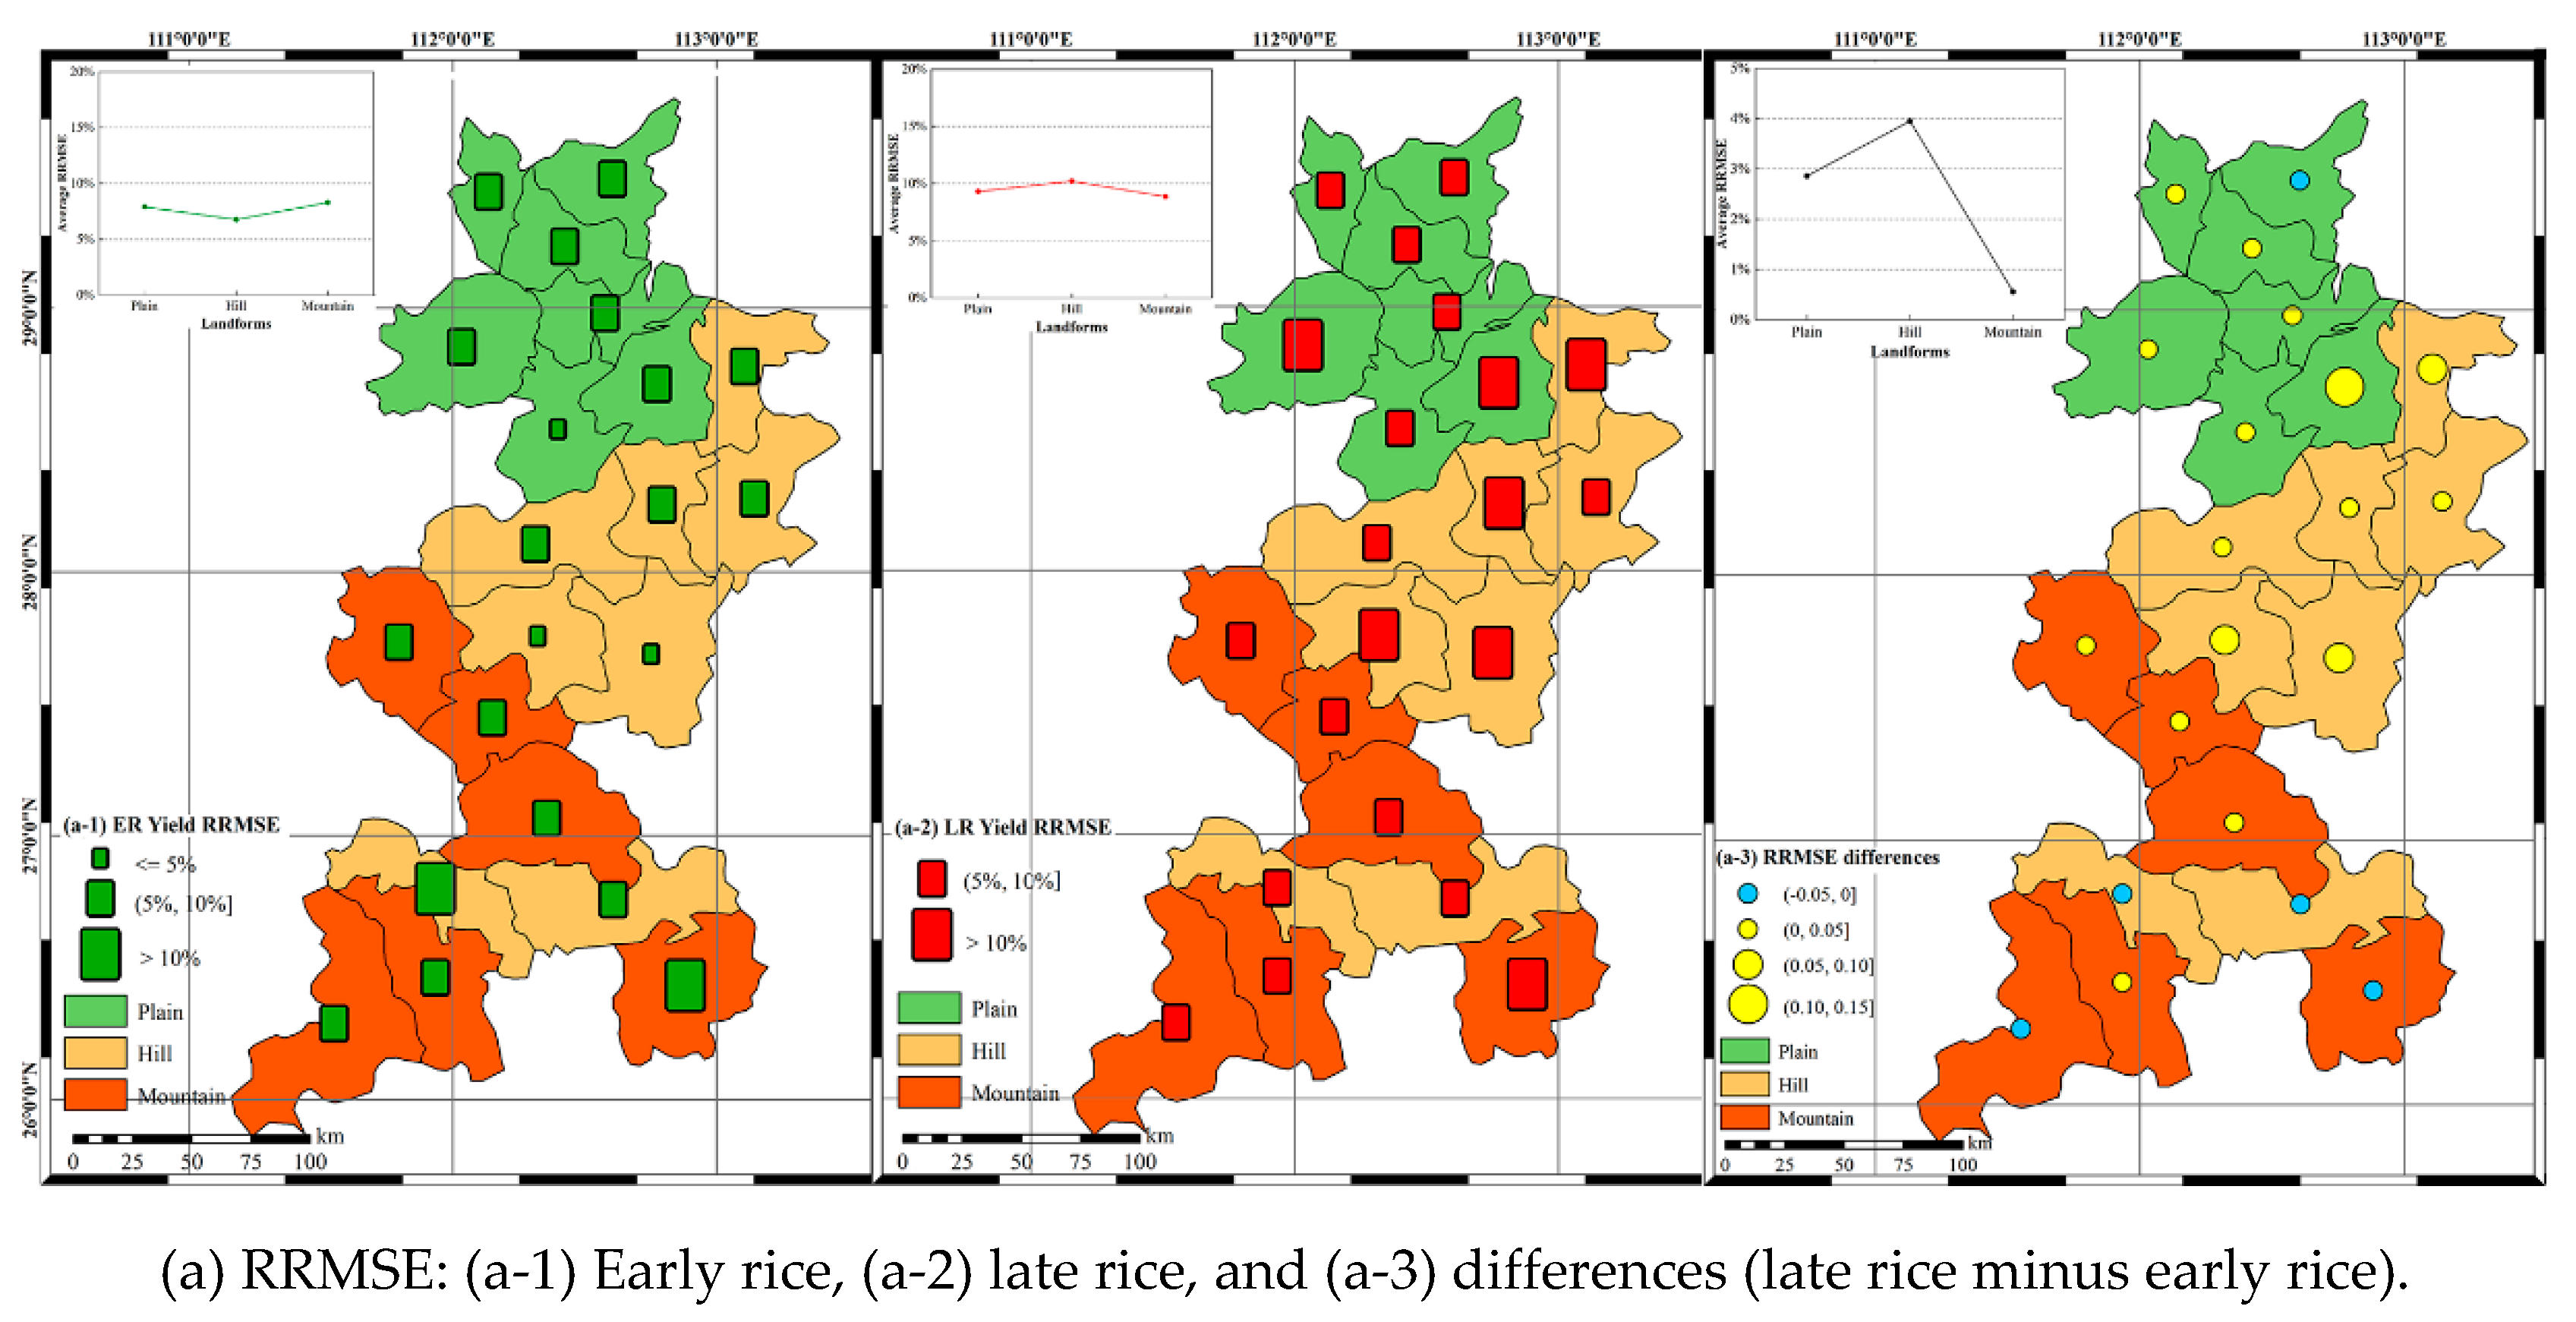
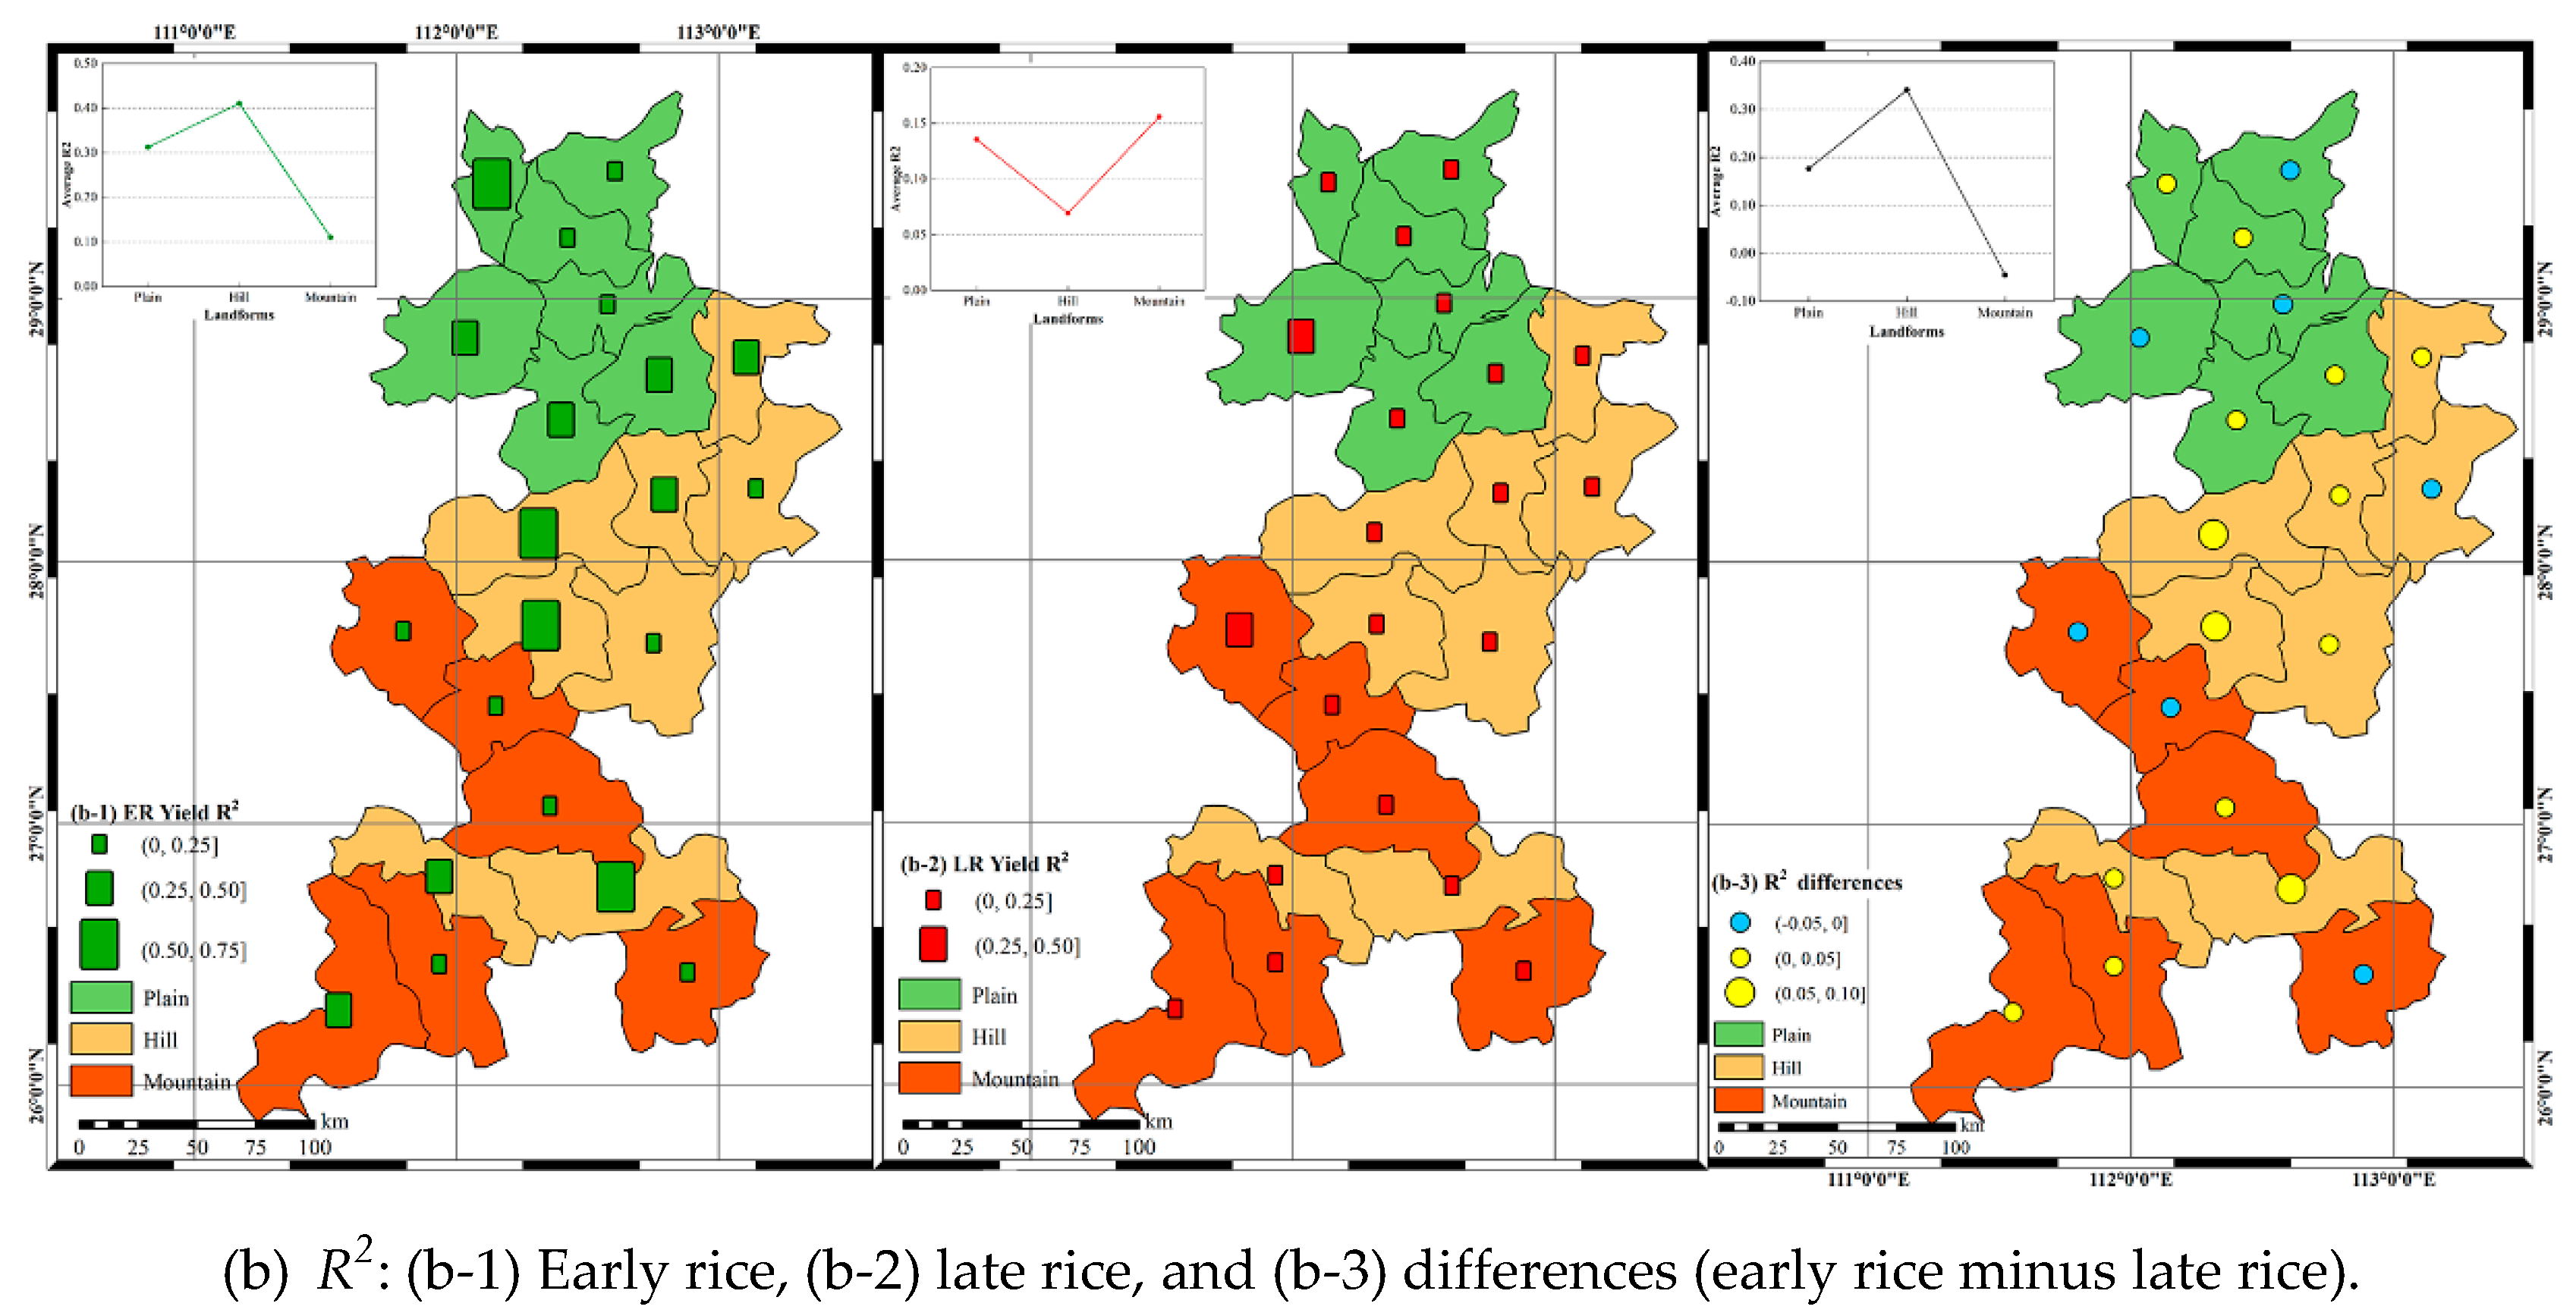
3.2. Simulation Improvements on Different Landforms

The PSO calibration scheme not only improved modeling accuracy, but also improved model ability to capture spatial differences in double-rice yields (Figure 5 and Figure 6). Spatial patterns of average observed and simulated yields are shown in Figure 5, and cumulative curves of simulated and observed yields on different landforms for early rice and late rice are presented in Figure 6.
Compared with no-calibrated yields, PSO-calibrated results showed greatly improved accuracy in estimation of spatial differences for double-rice yields (Figure 5a,b). On the basis of the observed data, double-rice yields were relatively higher in central and southern counties than in northern counties of Hunan province (Figure 5a-1,b-1). The highest yields were attained in predominantly hilly counties in central Hunan. The no-calibration yield estimations (Figure 5a-2,b-2), however, were smallest in predominantly hilly counties for early rice and late rice, suggesting that the non-calibrated MCWLA-Rice model failed to capture such spatial patterns. The PSO-calibrated yields were spatially identical to those of the observed data (Figure 5a-3,b-3). Specifically, PSO-calibrated early rice yields were 4000–6000 kg/ha in northern counties, 6000–7000 kg/ha in central counties, and 4000–7000 kg/ha in southern counties (Figure 5a-3). With regard to late rice, the PSO-calibrated yields were 5000–7000 kg/ha in northern counties and 6000–8000 kg/ha in the central and southern counties (Figure 5b-3).
In addition to spatial differences across the entire study area, cumulative curves more clearly revealed the topographic impacts on simulated double-rice yields (Figure 6). Ideally, the cumulative curves for simulated yield should overlap with the curves for observed yield. Without calibration, simulated yields for all landforms were lower than the observed yields for early rice and late rice (Figure 6). The PSO-calibrated yields more closely concurred with the observed yields. For early rice grown on plains, MCWLA-Rice underestimated some 40% of the yields (<~5300 kg/ha), overestimated some 40% of the yields (>5500 kg/ha), and accurately simulated the rest 20% of the yields on plain (Figure 6a-1). Regarding early rice grown on hills, around 20% of the estimated yields corresponded with observations at yields from 6200 kg/ha to 6500 kg/ha, 60% of the yields were overestimated (4200–6200 kg/ha), and 20% of the yields were underestimated (Figure 6a-2). For early rice grown on mountains, ~85% of the yields were underestimated and the remainder were overestimated (Figure 6a-3). With regard to late rice, PSO-calibrated yields were consistently overestimated on each landform, except for the highest yields (Figure 6b).
We might attribute the errors of the estimated yields to the corresponding cropping environments. Rice prefers warm and wet conditions. For example, the ideally average temperature for double rice in VGP ranges from 12 °C to 30 °C, and that in RGP is from 12 °C to 30 °C for early rice and from 22 °C to 30 °C for late rice, respectively [3]. The humid climate and dense river network in Hunan does not limit water availability for rice growth. Thus, temperature and sunlight are the most critical factors for the double-rice cropping system in Hunan. According to previous research [51,69], the cumulative temperature during double-rice growing periods increases from north to south in Hunan province, while the opposite pattern is observed for cumulative sunlight. As a result, the highest yields are attained in central counties, e.g., Xiangxiang and Xiangtan counties with a predominantly hilly landform (Figure 5a-1,b-1). After calibration, the estimated yields reflected such spatial patterns for early rice (Figure 5a-3), but failed for late rice to some extent (Figure 5b-3). The reason for this difference might be the different growth conditions between the early and late rice crops, with more severe and frequent extreme-weather events experienced during the late rice growing period [55]. Unfortunately, crop models tend to perform poorly for simulations under extreme weather conditions [70,71,72]. Therefore, improvement in the simulation ability of crop models for extreme climatic events is a matter of urgency.
In addition to the reduced yield RRMSE and increased accuracy of the spatial distribution of yield simulations for early rice (Figure 4b-1 and Figure 5c), the cumulative curves of early rice revealed that landform type might affect the estimation accuracy of a crop model (Figure 6a). For example, accurate estimations were observed for yields of 5300–5500 kg/ha in predominantly flat counties (Figure 6a-1) and yields of 6200–6500 kg/ha in predominantly hilly counties (Figure 6a-2). For early rice, the proportions of underestimated or overestimated yields were equal (40%:40%) on plains because of the random errors. However, the proportions changed with increasing topographic complexity to 60%:20% in predominantly hilly counties (Figure 6a-2) and 85%:15% in predominantly mountainous counties (Figure 6a-3). Such unbalanced estimation errors indicated that a regional crop model should consider topographic factors to enable adaption for different landform types for more accurate estimation over a large geographic area.

3.3. Simulation Differences Between Early Rice and Late Rice on Different Landforms

The 1:1 comparison in Section 3.1 and spatial distribution in Section 3.2 both demonstrated that MCWLA-Rice performed better for estimation of yield of early rice than for late rice. Further analysis of whether such simulation differences between early rice and late rice was affected by landform type is important and would enrich our understanding of the evaluation and improvement of model performance. Therefore, we mapped the RRMSE and R 2 values for estimated yields of early rice and late rice, as well as the differences between them (Figure 7a,b).
The yield RRMSEs of early rice (Figure 7a-1) were smaller than those of late rice (Figure 7a-2) for each landform type. Specifically, three counties were identified with the yield RRMSE less than 5% for early rice, but no similarly low RRMSE values were observed for late rice. In addition, the majority of yield R2 values for early rice (Figure 7b-1) were considerably higher than those of late rice (Figure 7b-2). The average RRMSE value in predominantly hilly counties was smallest (7%) for early rice and highest (11%) for late rice. Correspondingly, the average yield R2 in predominantly hilly counties was highest (0.41) for early rice and smallest (0.07) for late rice. As a result, the average differences in RRMSE and R2 were highest for counties dominated by hills (4%, Figure 7a-3; 0.34, Figure 7b-3), followed by plains (3%, Figure 7a-3; 0.18, Figure 7b-3), and smallest for mountainous counties (0.6%, Figure 7a-3; −0.05, Figure 7b-3). Overall, in the rotation of early rice and late rice, the accuracy of regional crop simulation varied among counties dominated by different landforms, especially for predominantly hilly counties. Therefore, incorporation of topographic factors into crop models is potentially a means to reduce the models’ instability for simulation of double-rice yields.

4. Conclusions

Topographic effects on regional crop simulation have been generally ignored, which has constrained our understanding of the performance and development of crop models. In the present study, we used remote sensing data to improve the accuracy of MCWLA-Rice model estimations and then explored the potential influence of topography on crop simulation. By calibrating MCWLA-Rice with the remotely retrieved phenology dates and observed yield data under the double-rice cropping system for each county, errors and uncertainties in the model outputs were greatly reduced. Given differences in the dominant landform type of a county, the lack of topographic factors in the process-based crop model constrained the model’s simulation accuracy for both a single cropping season and a rotation between early rice and late rice. With the increasing importance of global food security and social development, further studies focusing on regional simulation performance of crop models to account for the influence of complex topography are warranted.

Supplementary Materials

The following are available online at https://www.mdpi.com/2072-4292/11/13/1577/s1. Figure S1: The disaster times per experiment station during the period from 2000 to 2009, Figure S2: Raw remotely-sensed LAI data and time profiles smoothed using the wavelet method for a typical double-rice pixel, Figure S3: One-to-one comparison between observed and remotely-retrieved phenology dates at the pixel scale: (a) early rice (ER); (b) late rice (LR), Figure S4: The improvement of crop parameters after calibration for (a) early rice and (b) late rice, Table S1: Description and prior intervals for the 17 parameters incorporated in the MCWLA-Rice model, Table S2: RMSE between the observed and remotely-estimated phenology dates at the pixel scale.

Author Contributions

Conceptualization, J.Z.; Data curation, C.W.; Methodology, J.Z. and C.W.; Project administration, Z.Z. and F.T.; Software, J.Z.; Supervision, Z.Z and F.T.; Validation, C.W.; Writing—original draft, J.Z.; Writing—review & editing, Z.Z.

Funding

This research was funded by the National Key Research and Development Program of China (Projects No. 2017YFD0300301, 2016YFD0300201); the National Natural Science Foundation of China (Nos. 31761143006, 31561143003, 41571493, and 41571088); and the State Key Laboratory of Earth Surface Processes and Resource Ecology.

Acknowledgments

The authors would like to thank the editors and anonymous reviewers for valuable comments, which are significant for improving this manuscript. We also thank Robert McKenzie, PhD, from Liwen Bianji, Edanz Group China (www.liwenbianji.cn/ac), for editing the English text of a draft of this manuscript.

Conflicts of Interest

The authors declare no conflict of interest.

References

  1. Food and Agriculture Organization of the United Nations (FAO). FAOSTAT Database 2010. 2010. Available online: http://www.fao.org/fishery/org/GlobalRecord/en (accessed on 14 July 2010).
  2. Seck, P.A.; Diagne, A.; Mohanty, S.; Wopereis, M.C. Crops that feed the world 7: Rice. Food Secur. 2012, 4, 7–24. [Google Scholar] [CrossRef]
  3. Wang, P.; Zhang, Z.; Song, X.; Chen, Y.; Wei, X.; Shi, P.; Tao, F. Temperature variations and rice yields in China: Historical contributions and future trends. Clim. Change 2014, 124, 777–789. [Google Scholar] [CrossRef]
  4. Tao, F.; Zhang, S.; Zhang, Z. Spatiotemporal changes of wheat phenology in China under the effects of temperature, day length and cultivar thermal characteristics. Eur. J. Agron. 2012, 43, 201–212. [Google Scholar] [CrossRef]
  5. Wang, P.; Zhang, Z.; Chen, Y.; Wei, X.; Feng, B.; Tao, F. How much yield loss has been caused by extreme temperature stress to the irrigated rice production in China? Clim. Chang. 2016, 134, 635–650. [Google Scholar] [CrossRef]
  6. Kravchenko, A.N.; Robertson, G.P.; Thelen, K.D.; Harwood, R.R. Management, topographical, and weather effects on spatial variability of crop grain yields. Agron. J. 2005, 97, 514–523. [Google Scholar] [CrossRef]
  7. Huang, X.; Wang, L.; Yang, L.; Kravchenko, A.N. Management effects on relationships of crop yields with topography represented by wetness index and precipitation. Agron. J. 2008, 100, 1463. [Google Scholar] [CrossRef]
  8. Kumhálová, J.; Kumhála, F.; Kroulík, M.; Matějková, Š. The impact of topography on soil properties and yield and the effects of weather conditions. Precis. Agric. 2011, 12, 813–830. [Google Scholar] [CrossRef]
  9. Zhang, X.C.; Liu, W.Z. Simulating potential response of hydrology, soil erosion, and crop productivity to climate change in Changwu tableland region on the Loess Plateau of China. Agric. For. Meteorol. 2005, 131, 127–142. [Google Scholar] [CrossRef]
  10. Greene, J.S.; Maxwell, E. Climatic impacts on winter wheat in Oklahoma and potential applications to climatic and crop yield prediction. Int. J. Biometeorol. 2007, 52, 117–126. [Google Scholar] [CrossRef]
  11. Tao, F.; Zhang, Z. Climate change, wheat productivity and water use in the North China Plain: A new super-ensemble-based probabilistic projection. Agric. For. Meteorol. 2013, 170, 146–165. [Google Scholar] [CrossRef]
  12. Dhungana, P.; Eskridge, K.M.; Weiss, A.; Baenziger, P.S. Designing crop technology for a future climate: An example using response surface methodology and the CERES-Wheat model. AGR Syst. 2006, 87, 63–79. [Google Scholar] [CrossRef]
  13. Cho, K.; Falloon, P.; Gornall, J.; Betts, R.; Clark, R. Winter wheat yields in the UK: Uncertainties in climate and management impacts. Clim. Res. 2012, 54, 49–68. [Google Scholar] [CrossRef]
  14. Easterling, W.E.; Chhetri, N.; Niu, X. Improving the realism of modeling agronomic adaptation to climate change: Simulating technological substitution. In Issues in the Impacts of Climate Variability and Change on Agriculture; Mearns, L.O., Ed.; Springer: Dordrecht, The Netherlands, 2003; pp. 149–173. [Google Scholar] [CrossRef]
  15. Lobell, D.B.; Cassman, K.G.; Field, C.B. Crop yield gaps: Their importance, magnitudes, and causes. Annu. Rev. Environ. Resour. 2009, 34, 179–204. [Google Scholar] [CrossRef]
  16. Godfray, H.C.J.; Beddington, J.R.; Crute, I.R.; Haddad, L.; Lawrence, D.; Muir, J.F.; Pretty, J.; Robinson, S.; Thomas, S.M.; Toulmin, C. Food security: The challenge of feeding 9 billion people. Science 2010, 327, 812–818. [Google Scholar] [CrossRef] [PubMed]
  17. Tao, F.; Zhang, Z. Climate change, high-temperature stress, rice productivity, and water use in Eastern China: A new superensemble-based probabilistic projection. J. Appl. Meteorol. Clim. 2013, 52, 531–551. [Google Scholar] [CrossRef]
  18. Rosenzweig, C.; Tubiello, F.N.; Goldberg, R.; Mills, E.; Bloomfield, J. Increased crop damage in the US from excess precipitation under climate change. Glob. Environ. Chang. 2002, 12, 197–202. [Google Scholar] [CrossRef] [Green Version]
  19. Wang, Z.; Ye, T.; Wang, J.; Cheng, Z.; Shi, P. Contribution of climatic and technological factors to crop yield: Empirical evidence from late paddy rice in Hunan Province, China. Stoch. Environ. Res. Risk A 2016, 30, 2019–2030. [Google Scholar] [CrossRef]
  20. Tubiello, F.N.; Donatelli, M.; Rosenzweig, C.; Stockle, C.O. Effects of climate change and elevated CO2 on cropping systems: Model predictions at two Italian locations. Eur. J. Agron. 2000, 13, 179–189. [Google Scholar] [CrossRef]
  21. Tubiello, F.N.; Ewert, F. Simulating the effects of elevated CO2 on crops: Approaches and applications for climate change. Eur. J. Agron. 2002, 18, 57–74. [Google Scholar] [CrossRef]
  22. Trnka, M.; Dubrovský, M.; Semerádová, D.; Žalud, Z. Projections of uncertainties in climate change scenarios into expected winter wheat yields. Theor. Appl. Climatol. 2004, 77, 229–249. [Google Scholar] [CrossRef]
  23. Landau, S.; Mitschell, R.A.C.; Barnett, V.; Colls, J.J.; Craigon, J.; Moore, K.L.; Payne, R.W. Testing winter wheat simulation models’ predictions against observe UK grain yields. Agric. For. Meteorol. 1998, 89, 85–99. [Google Scholar] [CrossRef]
  24. Doraiswamy, P.C.; Hatfield, J.L.; Jackson, T.J.; Akhmedov, B.; Prueger, J.; Stern, A. Crop condition and yield simulations using Landsat and MODIS. Remote Sens. Environ. 2004, 92, 548–559. [Google Scholar] [CrossRef]
  25. Noory, H.; Van Der Zee, S.E.A.T.M.; Liaghat, A.M.; Parsinejad, M.; Van Dam, J.C. Distributed agro-hydrological modeling with SWAP to improve water and salt management of the Voshmgir Irrigation and Drainage Network in Northern Iran. Agric. Water Manag. 2011, 98, 1062–1070. [Google Scholar] [CrossRef]
  26. Li, H.; Chen, Z.; Liu, G.; Jiang, Z.; Huang, C. Improving Winter Wheat Yield Estimation from the CERES-Wheat Model to Assimilate Leaf Area Index with Different Assimilation Methods and Spatio-Temporal Scales. Remote Sens. 2017, 9, 190. [Google Scholar] [CrossRef]
  27. Setiyono, T.D.; Quicho, E.D.; Gatti, L.; Campos-Taberner, M.; Busetto, L.; Collivignarelli, F.; García-Haro, F.J.; Boschetti, M.; Khan, N.I.; Holecz, F. Spatial Rice Yield Estimation Based on MODIS and Sentinel-1 SAR Data and ORYZA Crop Growth Model. Remote Sens. 2018, 10, 293. [Google Scholar] [CrossRef]
  28. Zhou, G.; Liu, X.; Liu, M. Assimilating Remote Sensing Phenological Information into the WOFOST Model for Rice Growth Simulation. Remote Sens. 2019, 11, 268. [Google Scholar] [CrossRef]
  29. Jin, X.; Kumar, L.; Li, Z.; Feng, H.; Xu, X.; Yang, G.; Wang, J. A review of data assimilation of remote sensing and crop models. Eur. J. Agron. 2018, 92, 141–152. [Google Scholar] [CrossRef]
  30. Chen, Y.; Zhang, Z.; Tao, F. Improving regional winter wheat yield estimation through assimilation of phenology and leaf area index from remote sensing data. Eur. J. Agron. 2018, 101, 163–173. [Google Scholar] [CrossRef]
  31. Leff, B.; Ramankutty, N.; Foley, J.A. Geographic distribution of major crops across the world. Glob. Biogeochem. Cycles 2004, 18. [Google Scholar] [CrossRef]
  32. Liu, J.; Zhang, Z.; Xu, X.; Kuang, W.; Zhou, W.; Zhang, S.; Li, R.; Yan, C.; Yu, D.; Wu, S.; et al. Spatial patterns and driving forces of land use change in China during the early 21st century. J. Geogr. Sci. 2010, 20, 483–494. [Google Scholar] [CrossRef]
  33. Liu, J.; Kuang, W.; Zhang, Z.; Xu, X.; Qin, Y.; Ning, J.; Zhou, W.; Zhang, S.; Li, R.; Yan, C.; et al. Spatiotemporal characteristics, patterns, and causes of land-use changes in China since the late 1980s. J. Geogr. Sci. 2014, 24, 195–210. [Google Scholar] [CrossRef]
  34. Tao, F.; Zhang, Z.; Liu, J.; Yokozawa, M. Modelling the impacts of weather and climate variability on crop productivity over a large area: A new super-ensemble-based probabilistic projection. Agric. For. Meteorol. 2009, 149, 1266–1278. [Google Scholar] [CrossRef]
  35. Streck, N.A.; Weiss, A.; Xue, Q.; Baenziger, P.S. Improving predictions of developmental stages in winter wheat: A modified Wang and Engel model. Agric. Meteorol. 2003, 115, 139–150. [Google Scholar] [CrossRef]
  36. Tao, F.; Yokozawa, M.; Zhang, Z. Modelling the impacts of weather and climate variability on crop productivity over a large area: A new process-based model development, optimization, and uncertainties analysis. Agric. For. Meteorol. 2009, 149, 831–850. [Google Scholar] [CrossRef]
  37. Zhang, Z.; Song, X.; Chen, Y.; Wang, P.; Wei, X.; Tao, F. Dynamic variability of the heading–flowering stages of single rice in China based on field observations and NDVI estimations. Int. J. Biometeorol. 2015, 59, 643–655. [Google Scholar] [CrossRef] [PubMed]
  38. Zhang, Z.; Chen, Y.; Wang, C.; Wang, P.; Tao, F. Future extreme temperature and its impact on rice yield in China. Int. J. Climatol. 2017, 37, 4814–4827. [Google Scholar] [CrossRef]
  39. Shuai, J.; Zhang, Z.; Tao, F.; Shi, P. How ENSO affects maize yields in China: Understanding the impact mechanisms using a process-based crop model. Int. J. Climatol. 2016, 36, 424–438. [Google Scholar] [CrossRef]
  40. Chen, Y.; Wang, P.; Zhang, Z.; Tao, F.; Wei, X. Rice yield development and the shrinking yield gaps in China, 1981–2008. Reg. Environ. Chang. 2017, 17, 2397–2408. [Google Scholar] [CrossRef]
  41. Chen, Y.; Zhang, Z.; Tao, F.; Wang, P.; Wei, X. Spatio-temporal patterns of winter wheat yield potential and yield gap during the past three decades in North China. Field Crop. Res. 2017, 206, 11–20. [Google Scholar] [CrossRef]
  42. Chen, Y.; Zhang, Z.; Tao, F. Impacts of climate change and climate extremes on major crops productivity in China at a global warming of 1.5 and 2.0 °C. Earth Syst. Dyn. 2018, 9, 543. [Google Scholar] [CrossRef]
  43. Yuan, W.; Xu, B.; Chen, Z.; Xia, J.; Xu, W.; Chen, Y.; Wu, X.; Fu, Y. Validation of China-wide interpolated daily climate variables from 1960 to 2011. Theor. Appl. Climatol. 2015, 119, 689–700. [Google Scholar] [CrossRef]
  44. Food and Agriculture Organization of the United Nations (FAO). The Digitized Soil Map of the World (Release 1.0) World Soil Resources Report 67; FAO: Rome, Italy, 1991. [Google Scholar]
  45. Dente, L.; Satalino, G.; Mattia, F.; Rinaldi, M. Assimilation of leaf area index derived from ASAR and MERIS data into CERES-Wheat model to map wheat yield. Remote Sens. Environ. 2008, 112, 1395–1407. [Google Scholar] [CrossRef]
  46. Curnel, Y.; de Wit, A.J.; Duveiller, G.; Defourny, P. Potential performances of remotely sensed LAI assimilation in WOFOST model based on an OSS Experiment. Agric. For. Meteorol. 2011, 151, 1843–1855. [Google Scholar] [CrossRef]
  47. Moulin, S.; Kergoat, L.; Cayrol, P.; Dedieu, G.; Prévot, L. Calibration of a coupled canopy functioning and SVAT model in the ReSeDA experiment. Towards the assimilation of SPOT/HRV observations into the model. Agronomie 2002, 22, 681–686. [Google Scholar] [CrossRef]
  48. Ines, A.V.; Mohanty, B.P.; Shin, Y. An unmixing algorithm for remotely sensed soil moisture. Water Resour. Res. 2013, 49, 408–425. [Google Scholar] [CrossRef]
  49. Xu, L.; Yang, M.; Steward, B.L. System of field operations for double-cropped paddy rice production mechanization in South China. In Proceedings of the Agricultural Biosystems Engineering Conference, Louisville, KY, USA, 7–10 August 2011; Paper 32. Available online: http://lib.dr.iastate.edu/abe_eng_conf/32 (accessed on 10 August 2011).
  50. Liang, S.; Zhao, X.; Liu, S.; Yuan, W.; Cheng, X.; Xiao, Z.; Zhang, X.; Liu, Q.; Cheng, J.; Tang, H.; et al. A long-term Global LAnd Surface Satellite (GLASS) data-set for environmental studies. Int. J. Digit. Earth 2013, 6, 5–33. [Google Scholar] [CrossRef]
  51. Wang, C.; Zhang, Z.; Chen, Y.; Tao, F.; Zhang, J.; Zhang, W. Comparing different smoothing methods to detect double-cropping rice phenology based on LAI products—A case study in the Hunan province of China. Int. J. Remote Sens. 2018, 39, 6405–6428. [Google Scholar] [CrossRef]
  52. Delécolle, R.; Maas, S.J.; Guérif, M.; Baret, F. Remote sensing and crop production models: Present trends. ISPRS J. Phototgramm. 1992, 47, 145–161. [Google Scholar] [CrossRef]
  53. Plummer, L.N.; Busenberg, E.; Riggs, A.C. In-situ growth of calcite at Devils Hole, Nevada: Comparison of field and laboratory rates to a 500,000 year record of near-equilibrium calcite growth. Aquat. Geochem. 2000, 6, 257–274. [Google Scholar] [CrossRef]
  54. Dorigo, W.A.; Zurita-Milla, R.; de Wit, A.J.; Brazile, J.; Singh, R.; Schaepman, M.E. A review on reflective remote sensing and data assimilation techniques for enhanced agroecosystem modeling. Int. J. Appl. Earth Obs. 2007, 9, 165–193. [Google Scholar] [CrossRef]
  55. Tao, F.; Zhang, S.; Zhang, Z. Changes in rice disasters across China in recent decades and the meteorological and agronomic causes. Reg. Environ. Chang. 2013, 13, 743–759. [Google Scholar] [CrossRef]
  56. Poli, R.; Kennedy, J.; Blackwell, T. Particle swarm optimization. Swarm Intell. 2007, 1, 33–57. [Google Scholar] [CrossRef]
  57. Rivington, M.; Bellocchi, G.; Matthews, K.B.; Buchan, K. Evaluation of three model estimations of solar radiation at 24 UK stations. Agric. For. Meteorol. 2005, 132, 228–243. [Google Scholar] [CrossRef]
  58. Bellocchi, G.; Rivington, M.; Donatelli, M.; Matthews, K. Validation of biophysical models: Issues and methodologies. In Sustainable Agriculture; Lichtfouse, E., Hamelin, M., Navarrete, M., Debaeke, P., Eds.; Springer: Dordrecht, The Netherlands, 2011; Volume 2, pp. 577–603. [Google Scholar] [CrossRef]
  59. Coucheney, E.; Buis, S.; Launay, M.; Constantin, J.; Mary, B.; de Cortázar-Atauri, I.G.; Ripoche, D.; Beaudoin, N.; Ruget, F.; Andrianarisoa, K.S.; et al. Accuracy, robustness and behavior of the STICS soil–crop model for plant, water and nitrogen outputs: Evaluation over a wide range of agro-environmental conditions in France. Environ. Modell. Softw. 2015, 64, 177–190. [Google Scholar] [CrossRef]
  60. Wallach, D.; Goffinet, B.; Bergez, J.E.; Debaeke, P.; Leenhardt, D.; Aubertot, J.N. Parameter estimation for crop models. Agron. J. 2001, 93, 757–766. [Google Scholar] [CrossRef]
  61. Angulo, C.; Rötter, R.; Lock, R.; Enders, A.; Fronzek, S.; Ewert, F. Implication of crop model calibration strategies for assessing regional impacts of climate change in Europe. Agric. For. Meteorol. 2013, 170, 32–46. [Google Scholar] [CrossRef]
  62. Guillaume, S.; Bergez, J.E.; Wallach, D.; Justes, E. Methodological comparison of calibration procedures for durum wheat parameters in the STICS model. Eur. J. Agron. 2011, 35, 115–126. [Google Scholar] [CrossRef]
  63. Belder, P.; Bouman, B.A.M.; Spiertz, J.H.J. Exploring options for water savings in lowland rice using a modelling approach. Agric. Syst. 2007, 92, 91–114. [Google Scholar] [CrossRef]
  64. Boling, A.A.; Bouman, B.A.M.; Tuong, T.P.; Murty, M.V.R.; Jatmiko, S.Y. Modelling the effect of groundwater depth on yield-increasing interventions in rainfed lowland rice in Central Java, Indonesia. Agric. Syst. 2007, 92, 115–139. [Google Scholar] [CrossRef]
  65. Zhang, T.; Zhu, J.; Yang, X. Non-stationary thermal time accumulation reduces the predictability of climate change effects on agriculture. Agric. For. Meteorol. 2008, 148, 1412–1418. [Google Scholar] [CrossRef]
  66. Shen, S.; Yang, S.; Li, B.; Tan, B.; Li, Z.; Le Toan, T. A scheme for regional rice yield estimation using ENVISAT ASAR data. Sci. China Ser. D 2009, 52, 1183–1194. [Google Scholar] [CrossRef]
  67. Chen, J.S.; Huang, J.X.; Lin, H.; Fei, Z.Y. Rice yield estimation by assimilation remote sensing into crop growth model. Sci. China Inf. Sci. 2010, 2010, 173–183. (In Chinese) [Google Scholar]
  68. Wang, J. Rice Information Extraction Studies Based on Multi-Source Remote Sensing Data Integrating and Data Assimilating. Ph.D. Thesis, Zhejiang University, Hangzhou, China, 2016. (In Chinese). [Google Scholar]
  69. Qing, X.G.; Ai, Z.Y. On regional distribution of rice cultivation in Hunan Province. Res. Agric. Mod. 2007, 28, 704–708. (In Chinese) [Google Scholar]
  70. Deryng, D.; Sacks, W.J.; Barford, C.C.; Ramankutty, N. Simulating the effects of climate and agricultural management practices on global crop yield. Glob. Biogeochem. Cycles 2011, 25. [Google Scholar] [CrossRef]
  71. Bassu, S.; Brisson, N.; Durand, J.L.; Boote, K.; Lizaso, J.; Jones, J.W.; Rosenzweig, C.; Ruane, A.C.; Adam, M.; Baron, C.; et al. How do various maize crop models vary in their responses to climate change factors? Glob. Change Biol. 2014, 20, 2301–2320. [Google Scholar] [CrossRef]
  72. Li, Y.; Zhou, Q.; Zhou, J.; Zhang, G.; Chen, C.; Wang, J. Assimilating remote sensing information into a coupled hydrology-crop growth model to estimate regional maize yield in arid regions. Ecol. Model. 2014, 291, 15–27. [Google Scholar] [CrossRef]
Figure 1. Physical status of the study region. (a) Location of Hunan province in China; (b) land use and (c) landforms in Hunan province; (d) landforms and (e) soil distribution in the selected counties in which the double-rice cropping system is practiced; (f) transplanting, heading, and harvest dates for early rice (ER) and late rice (LR).
Remotesensing 11 01577 g001
Figure 2. Workflow of the calibration process for MCWLA-Rice based on multisource data.
Remotesensing 11 01577 g002
Figure 3. One-to-one comparison of the remotely retrieved and the model output phenology dates at the county scale: (a) No-calibration; and (b) particle swarm optimization (PSO)-calibration.
Remotesensing 11 01577 g003
Figure 4. One-to-one comparison of the observed and the simulated yield at the county scale: (a) No-calibration; (b) PSO-calibration; and (c) validation.
Remotesensing 11 01577 g004
Figure 5. Spatial distribution of observed and simulated yields on different landforms: (a) Early rice and (b) late rice in the selected counties of Hunan province.
Remotesensing 11 01577 g005
Figure 6. Cumulative distribution curves of observations and model outputs for double-rice yield on different landforms: (a) Early rice and (b) late rice.
Remotesensing 11 01577 g006
Figure 7. Spatial distribution of (a) relative root mean square error (RRMSE) and (b) coefficient of determination ( R 2 ) values for PSO-calibrated estimated yield for early rice and late rice in the selected counties of Hunan province.
Remotesensing 11 01577 g007aRemotesensing 11 01577 g007b
Table 1. Comparison of studies on rice yield estimation in South China with complex landforms.
ResearchesShen et al. [66]Chen et al. [67]Wang et al. [68]Present Research
Study area1000 ha7000 ha11,500 ha1,686,600 ha
CropSingle riceEarly riceSingle riceDouble rice
Referenced dataAdvanced Synthetic Aperture RadarHJ-1 A/BHJ-1 A/B, Landsat 8MODIS and ground observations
Crop modelWOFOSTWOFOSTORYZA2000MCWLA-Rice
Intermediate variableBackscattering coefficientsLAILAIRetrieved phenology dates
RRMSE 12.70%7.20%7.04%7.59% (best average for early rice) and 10.20% (best average for late rice)

