Abstract
Postclassification Comparison (PCC) has been widely used as a change-detection method. The PCC algorithm is straightforward and easily applicable to all satellite images, regardless of whether they are acquired from the same sensor or in the same environmental conditions. However, PCC is prone to cumulative error, which results from classification errors. Alternatively, Change Vector Analysis in Posterior Probability Space (CVAPS), which interprets change based on comparing the posterior probability vectors of a pixel, can alleviate the classification error accumulation present in PCC. CVAPS identifies the type of change based on the direction of a change vector. However, a change vector can be translated to a new position within the feature space; consequently, it is not inconceivable that identical measures of direction may be used by CVAPS to describe multiple types of change. Our proposed method identifies land-cover transitions by using a fusion of CVAPS and PCC. In the proposed algorithm, contrary to CVAPS, a threshold does not need to be specified in order to extract change. Moreover, the proposed method uses a Random Forest as a trainable fusion method in order to obtain a change map directly in a feature space which is obtained from CVAPS and PCC. In other words, there is no need to specify a threshold to obtain a change map through the CVAPS method and then combine it with the change map obtained from the PCC method. This is an advantage over other change-detection methods focused on fusing multiple change-detection approaches. In addition, the proposed method identifies different types of land-cover transitions, based on the fusion of CVAPS and PCC, to improve the results of change-type determination. The proposed method is applied to images acquired by Landsat and Quickbird. The resultant maps confirm the utility of the proposed method as a change-detection/labeling tool. For example, the new method has an overall accuracy and a kappa coefficient relative improvement of 7% and 9%, respectively, on average, over CVAPS and PCC in determining different types of change.
1. Introduction
Remote sensing can be used to detect ‘land-use/land-cover’ (LULC) changes [1]. Generally, digital remote sensing change-detection methods can be classified into two types [2,3]: (1) methods based on classification results; and (2) methods based on algebraic expressions. Change-detection methods based on classification results, such as Postclassification Comparison (PCC) [4] and Change Vector Analysis in Posterior Probability Space (CVAPS) [5], do not need the remotely sensed data to be acquired in the same season or from the same remote sensor [2], an improvement over the latter methods (i.e., methods based on algebraic expressions), such as Change Vector Analysis (CVA) [6,7]. Therefore, PCC and CVAPS are selected for further investigation in this study.
The PCC method overlays multitemporal coincident land-cover maps in order to recognize changes between them. The PCC technique is a widely used technique for a range of different applications [8]. However, the PCC method is affected by map-production difficulties and can be prone to cumulative error, which results from classification errors [2]. On the other hand, CVAPS extracts change by comparing the posterior probability vectors of each pixel, instead of thematic maps; this can alleviate the classification error accumulation present in PCC effectively [8]. The type of change can be determined by using the direction information of a change vector, but CVAPS does not consider that a change vector can be translated to a new position within the feature space. Consequently, it is not inconceivable that identical measures of direction may be used to describe multiple types of change, limiting the ability of CVAPS as a land-cover-transition labeling method.
Recently, some attempts have been made with the purpose of using more than one change-detection method to improve LULC change-detection results. For instance, Waske and van der Linden produced prior change maps from Synthetic Aperture Radar (SAR) and optic images, and then used Support Vector Machine (SVM) and Random Forest (RF) methods to fuse the resultant change maps [9]. The results demonstrated that the RF-based fusion method outperformed other decision fusion methods. In addition, Du et al. proposed the use of decision-level fusion to improve change-detection results [10]. Moreover, Zheng et al. fused two difference images and then used k-means clustering to detect changed areas [11]. Fusion of change-detection methods was further explored by Jia et al. [12]. They first fused the wavelet kernels of two difference images, and then used a classification method to produce the final change map. Recently, Singh and Singh fused spectral change information and a similarity index, and then used a classifier to detect changes [13]. Moreover, Luo et al. detected urban change by first obtaining multiple change maps using different change-detection methods, and then applied Dempster–Shafer theory to fuse the results, based on a segmentation object map [14]. These examples demonstrate how the fusion of change-detection methods may be an effective way to improve the results of LULC change detection.
Fusion of CVAPS and PCC may make feasible the extraction of different types of ‘from–to’ classes, since combining different change-detection methods may give a better output than a single one. Therefore, our study presents a change-detection method to determine the from–to classes, based on the fusion of CVAPS and PCC. In the proposed fusion algorithm, CVAPS and PCC change maps do not need to be obtained in order to extract changed pixels. In other words, there is no need to specify a threshold to obtain a change map through the CVAPS method and then combine it with the change map obtained from the PCC method. The proposed method uses RF as a trainable fusion method to obtain a change map directly in a feature space which is obtained from CVAPS and PCC. This is an advantage over other change-detection methods focused on fusing multiple change-detection approaches. In addition, since both CVAPS and PCC are based on classification results, the proposed method makes the best use of the information that is available at present to improve the performance of CVAPS and PCC in change-type recognition.
2. Materials and Methods
The CVAPS method consists of three main steps: (1) estimating the posterior probabilities of images acquired on two different dates by a supervised classifier; (2) generating change vectors and applying a threshold on their magnitude to detect changed pixels; and (3) determining the types of change based on the direction of change vectors. The theoretical framework of the CVAPS [5] method is described below.
The change vector of a pixel, , is given by the equation
where and are the posterior probability vectors of the pixel for n classes on the dates and , respectively. We can extract the changed pixels by setting a threshold for the magnitude of ∆P.
In the CVAPS method, of a pure pixel (one that changed from a land-cover class to another class) is denoted as a ‘base change vector’. A group of base change vectors is defined to identify different types of LULC trajectories. The inner product of a base change vector and ∆P can be considered to be a measure of their similarity. As all elements in the group of base change vectors have the same norm value, the maximum of the inner product can indicate the type of change.
There are two main limitations in CVAPS: (1) setting a specific threshold to extract the changed pixels is an important parameter, which can influence change-detection results; and (2) as can be translated to a new position within the feature space, there is some likelihood that identical measures of direction may be used to describe multiple types of change (see Figure 1).
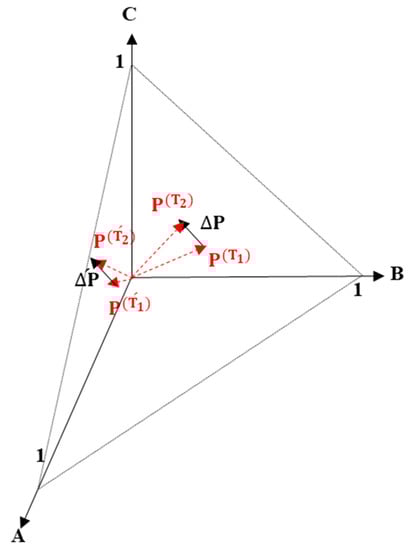
Figure 1.
Representation of two change vectors ( in a posterior probability space having the same measures of direction and magnitude, where are change vectors with different ‘from–to’ classes, and A, B, and C represent class labels.
2.1. Proposed Method
Due to the shortcomings of the CVAPS and PCC methods, this study proposes an ensemble of CVAPS and PCC to obtain change and from–to maps of greater accuracy than the change and from–to maps obtained from each of them alone. As both the CVAPS and PCC methods are based on classification results, we hypothesize that making better use of all available information should improve overall performance.
When performing change detection using two coincident images acquired at different times, specification of from–to information is needed. Accordingly, the proposed method is twofold, using change-detection and change-type recognition steps (see Figure 2). In the change-detection step, the aim is to obtain a change map with two classes (change and no-change); the change-type recognition step tries to determine the from–to classes.
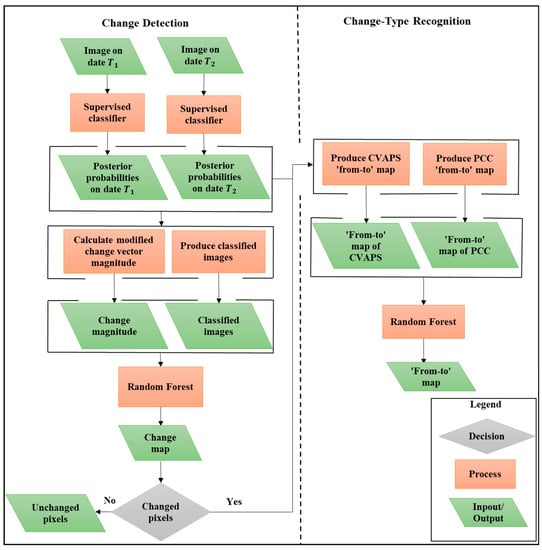
Figure 2.
Flowchart of the proposed method. CVAPS, Change Vector Analysis in Posterior Probability Space; PCC, Postclassification Comparison.
In the change-detection step, the proposed method highlights changed pixels, based on the use of RF as a trainable fusion method, to detect changed pixels directly in a feature space which is obtained from CVAPS and PCC. This avoids the reliance on threshold specification by classifying a new feature vector consisting of the magnitude of , as well as the resultant classified images, to extract changed pixels. In the change-type recognition step, different types of change are recognized by the fusion of CVAPS and PCC, based on the RF. This reduces the possible change-type determination errors, mentioned in the second limitation of CVAPS. The details of the change-detection and change-type recognition sections will be discussed in Section 2.1.1 and Section 2.1.2, respectively.
2.1.1. Change Detection
The change-detection part consists of three main steps; first, we approximate the posterior probabilities as a function of reflectance, by using a supervised classifier. In the proposed method, the RF algorithm, an alternative method to single parametric classifiers [15], is used to produce the posterior probability images. As a result of offering probabilistic class memberships, the RF method can provide more information about the probability of change in LULC [16,17].
A pixel-based RF classification model usually generates a ‘salt-and-pepper’ phenomenon. In this study, the salt-and-pepper phenomenon is decreased by employing the Markov Random Field (MRF) model, proposed in [18], on the classified images. In the MRF model, the class of a pixel is determined by using both the spectral information and the labels of the neighboring pixels in an optimization approach. Therefore, we employ Iterated Conditional Modes [19] as an optimization algorithm due to its good performance for classification [18].
Secondly, we calculate the magnitude of . CVAPS calculates the magnitude of (see Equation (1)) as
Suppose of a pixel on date , for classes A, B, and C, respectively, is , and on date is . Then, the most probable class on both dates is class A and is . If we change on date to , then the most probable class is class B on date but is still equal to 0.424. Therefore, in both cases, is equal to 0.424, but the probability of change in the latter is higher than in the former case.
We introduce a simple way to calculate in order to solve this issue. In this method, the most probable class on each date is recognized; then, is calculated as
For the former case in the example, is and, for the latter, is , so a higher probability of change is demonstrated by in the latter case.
Assume that the magnitude of change and the classified images are given as three-dimensional vectors , classified image on date , classified image on date ). Let C be our training data set with M points and, for each point, the magnitude of change, the classified images, and the real ‘change/no-change’ label are given. Finally, to highlight the changed areas, the RF model (which was trained based on the training data set, C) is used to classify a newly constructed feature vector (i.e., CVPC). This procedure improves on the CVAPS algorithm by not being reliant on threshold selection.
2.1.2. Change-Type Recognition
If CVAPS and PCC work separately and agree on the same from–to class, then the final class type is obvious. However, if both have different results for the type of change, then there will be no final result. The role of fusion here is to deduce an answer by using an ensembled fusion model. Assume that the from–to outputs of the CVAPS and PCC are given as two-dimensional vectors ], where is the type of change indicated by CVAPS and is the type of change indicated by PCC. In the proposed method, in order to determine land-cover change trajectories, the outputs of CVAPS and PCC are combined, using RF as a trainable combining method. Let C be our training data set with M points and, for each point, the from–to outputs of the CVAPS and PCC and the real from–to label are given. An RF model is trained based on the training data set (i.e., C). After the RF model has been trained, the combiner (i.e., the RF model) is ready to operate on the vectors.
3. Description of Data Sets and Experiments
Experiments were conducted on Landsat and Quickbird data sets with different thematic changes, to confirm the efficacy of the proposed method.
3.1. Experiment I
3.1.1. Study Area and Data
The first study area was the city of Prince George located in northern British Columbia, Canada. A pair of Landsat TM/ETM+ data ( pixels), with six spectral bands, of this area was used in order to assess our method. The images were collected in August 1990 and September 1999. This area is well known for the logging activities that occurred there (see Figure 3).
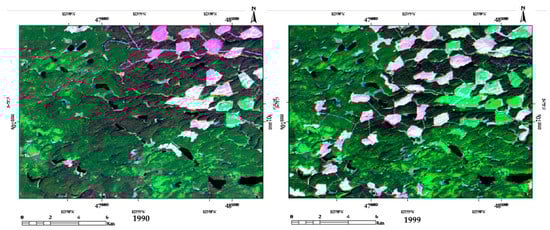
Figure 3.
False-color (7-4-2) composite of satellite images acquired from Landsat imagery over Prince George, northern British Columbia, Canada.
3.1.2. Data Processing
To obtain classified images, an RF model with 500 trees was used as a classifier, which was followed with MRF to reduce the salt-and-pepper phenomenon (Figure 4). A total of 700 pixels, with known labels obtained through accurate visual interpretation, were utilized as the training set in the RF model.
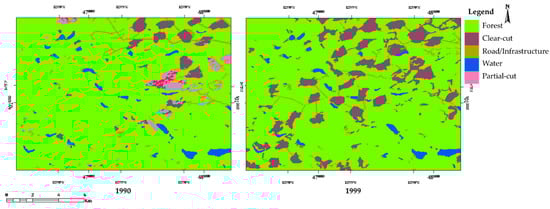
Figure 4.
The resultant images obtained by the Random Forest (RF) classifier using the Experiment I data set.
To define a reference change map (Figure 5a) and a reference LULC type-of-change map (Figure 6a), the data set was accurately interpreted, which was time-consuming. In order to extract the changed pixels, first was calculated, according to Equation (3). Then, , classified image on date , classified image on date ) was classified by RF with 500 trees to detect the changes (Figure 5e).
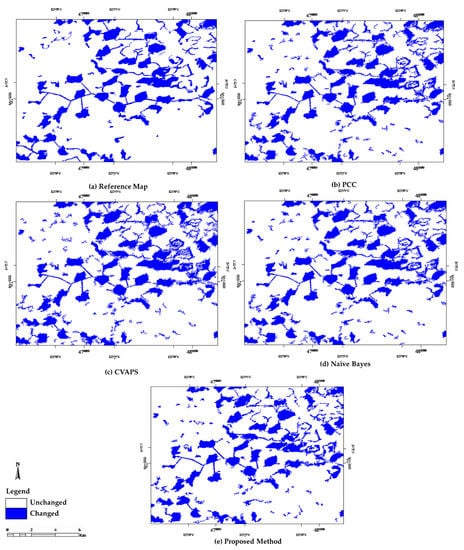
Figure 5.
Change maps obtained from the Experiment I data set.
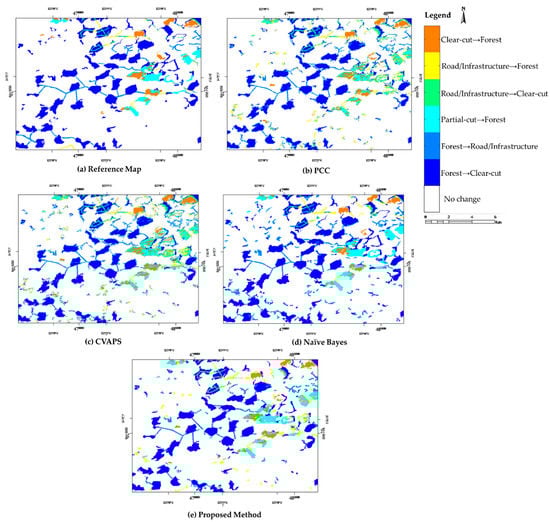
Figure 6.
Land-Use/Land-Cover (LULC) type-of-change maps obtained from the Experiment I data set.
In order to recognize the types of change, first, the LULC type-of-change maps of CVAPS and PCC were generated. Then, was classified by RF with 500 trees (Figure 6e).
3.1.3. Accuracy Assessment
The results of the proposed method were compared with those of PCC, CVAPS, and a Naïve Bayes fusion method [20]. Considering that both PCC and CVAPS are based on classification results, an RF model with 500 trees was used as a classifier. The same training set utilized for the proposed algorithm was also utilized for PCC and CVAPS. As the change magnitude was not a normal distribution, the Otsu method [21] was used to set a threshold value for the CVAPS method. A Naïve Bayes method was used to fuse CVAPS and PCC results at a decision level. We randomly selected 3504 pixels for validation. Overall accuracy (OA), kappa coefficient (KC), producer’s accuracy, and user’s accuracy were used as accuracy measurements to compare CVAPS, PCC, Naïve Bayes, and the proposed method. The accuracy assessments of the change-detection results in Experiment I obtained using CVAPS, PCC, Naïve Bayes, and the proposed method are summarized in Table 1. As Table 1 shows, the proposed method had an OA of 85% and a KC of 0.70, while CVAPS, PCC, and Naïve Bayes achieved OAs of 81.9%, 83.2%, and 83.2%, and KCs of 0.63, 0.66, and 0.66, respectively. The proposed method performed better than CVAPS, PCC, and Naïve Bayes on the Experiment I data set. A more accurate change-detection decision was expected by using RF as a trainable combining method to obtain a change map directly in the feature space which was obtained from CVAPS and PCC.

Table 1.
Accuracy assessment of change detection in Experiment I.
Table 2 summarizes the OAs and the KCs of the LULC type-of-change maps, obtained using CVAPS, PCC, Naïve Bayes, and the proposed method. As Table 2 shows, the proposed method had an OA of 71.2% and a KC of 0.67, while CVAPS, PCC, and Naïve Bayes achieved OAs of 69.8%, 65.4%, and 64%, and KCs of 0.64, 0.60, and 0.58, respectively. The proposed method also achieved a better type-of-change map than CVAPS, PCC, and Naïve Bayes for the Experiment I data set. This result has further strengthened our hypothesis that change-type recognition performance can be improved by fusion of CVAPS and PCC, based on using RF as an ensemble combiner.
Table 2.
Accuracy assessment of LULC type-of-change identification in Experiment I.
3.2. Experiment II
3.2.1. Study Area and Data
The second data set is made up of two Quickbird subimages (474 × 561 pixels) with four spectral bands, taken in December 2004 and January 2005 over Indonesia, before and after the 2004 Indian Ocean tsunami (Figure 7).
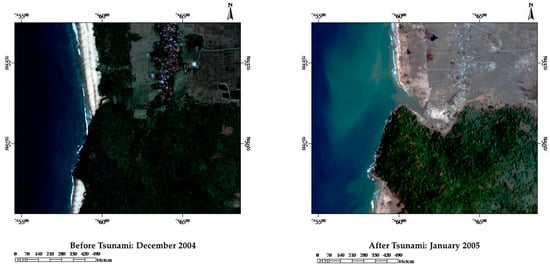
Figure 7.
True-color composite of satellite images acquired from Quickbird imagery over Indonesia.
3.2.2. Data Processing
The same process described in Section 3.1.2 was followed to classify the data set. The classification results were generated using a set of 635 pixels with known labels (Figure 8).
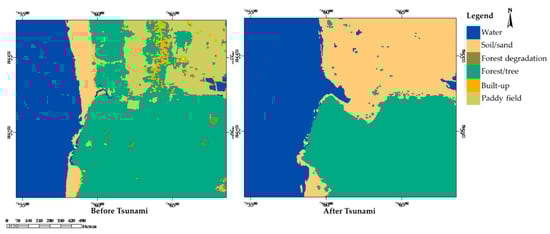
Figure 8.
The resultant images obtained by the RF classifier using the Experiment II data set.
The Quickbird data set was visually interpreted to obtain a reference change map (Figure 9a) and a reference LULC type-of-change map (Figure 10a).
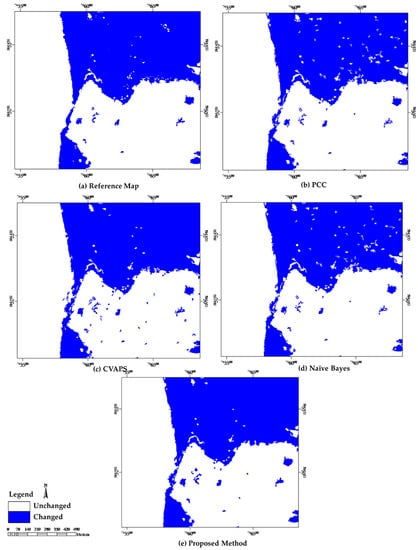
Figure 9.
Change maps for the Experiment II data set.
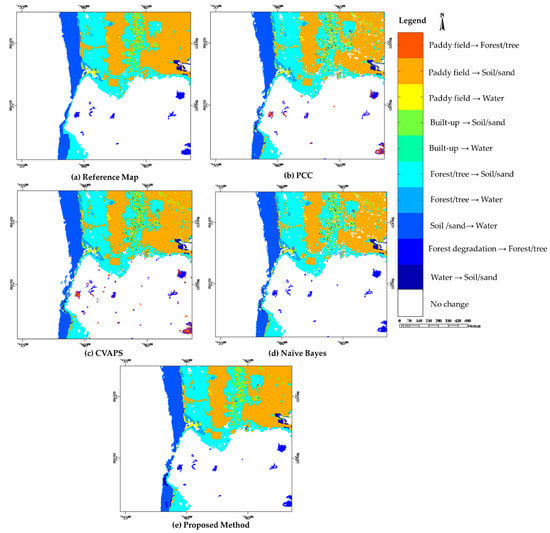
Figure 10.
LULC type-of-change maps obtained from the Experiment II data set.
3.2.3. Accuracy Assessment
The accuracy assessment of the resultant change maps in Experiment II was obtained using a set of 3515 test pixels, through the same procedure as mentioned in Section 3.1.3. The accuracy assessment of the resultant change maps shows that the proposed method had an OA of 98.4% and a KC of 0.96, while CVAPS, PCC, and Naïve Bayes achieved OAs of 97.6%, 97.3%, and 97.3%, and KCs of 0.95, 0.94, and 0.94, respectively (Table 3). Similar to the results of Experiment I, the Experiment II results also validate that the proposed method performed better than CVAPS, PCC, and Naïve Bayes.
Table 3.
Accuracy assessment of change detection in Experiment II.
Table 4 compares the accuracy assessment of the LULC type-of-change maps obtained using CVAPS, PCC, Naïve Bayes, and the proposed method. As presented in Table 4, the proposed method had an OA of 89.1% and a KC of 0.87, while CVAPS, PCC, and Naïve Bayes achieved OAs of 82.6%, 80%, and 83.8%, and KCs of 0.80, 0.77, and 0.81, respectively. These results support the idea that the proposed change-detection method can lead to increased robustness in change-type recognition due to the fusion of CVAPS and PCC.
Table 4.
Accuracy assessment of LULC type-of-change identification in Experiment II.
4. Conclusions
This study has presented a change-detection method, based on CVAPS and PCC fusion in a trainable ensemble, to detect changes and determine from–to classes. Given that both the CVAPS and PCC methods are based on classification results, the main idea of the proposed method is to make better use of all available information in order to improve overall performance. The proposed method was applied to images acquired by Landsat and Quickbird. The results of the proposed method were compared with those of CVAPS, PCC, and a Naïve Bayes fusion method. The resultant maps confirm the utility of the proposed method as a change-detection/labeling tool. For example, the new method had an overall accuracy and a kappa coefficient relative improvement of 7% and 9%, respectively, on average, over CVAPS and PCC in determining different types of change. Furthermore, it should be noticed that the proposed fusion method performed better than Naïve Bayes as a fusion method. Therefore, the proposed method exhibits a good potential in fusion of change-detection methods based on classification results, specifically in fusion of CVAPS and PCC. Moreover, contrary to CVAPS, the proposed method does not require setting a specific threshold to determine whether a pixel has changed or not, since the proposed method uses RF as a trainable fusion method to detect changed areas directly in a feature space which is obtained from CVAPS and PCC, an advantage over other change-detection methods focused on fusing multiple change-detection approaches, which need to achieve change maps first and then fuse them to achieve the final change map. Furthermore, the uncertainties of change-type recognition can be reduced by the fusion of CVAPS and PCC. Meanwhile, the selection of the training data is an essential step in change-detection methods based on classification results, including CVAPS, PCC, and the proposed method. This study has shown RF, as a trainable fusion method, to be useful for combining CVAPS and PCC. Future studies should examine other ensemble methods to combine CVAPS and PCC. Furthermore, this study only focused on combining CVAPS and PCC; other change-detection methods based on classification results can also be combined, using the same trainable fusion approach as in the proposed method.
Author Contributions
M.R.S. and B.H. conceived and designed the experiments; F.Z. performed the experiments; F.Z., M.R.S. and B.H. analyzed the data; F.Z. and M.R.S. wrote the paper.
Funding
This research received no external funding.
Acknowledgments
We gratefully acknowledge PCI Geomatics and ENVI EXCELIS for making available the Experiment I and the Experiment II data sets, respectively. The first author is particularly grateful to A.T. Delvin and K.L. Posanau for proofreading this letter.
Conflicts of Interest
The authors declare no conflict of interest.
References
- Fung, T. Land use and land cover change detection with Landsat MSS and SPOT HRV data in Hong Kong. Geocarto Int. 1992, 7, 33–40. [Google Scholar] [CrossRef]
- Chen, X.; Chen, J.; Shi, Y.; Yamaguchi, Y. An automated approach for updating land cover maps based on integrated change detection and classification methods. ISPRS J. Photogramm. Remote Sens. 2012, 71, 86–95. [Google Scholar] [CrossRef]
- Zhao, L.; Tang, J.; Yu, X.; Tang, P. A land-cover change detection method using data-oriented composite-kernel-based one-class support vector machine. Geocarto Int. 2017, 32, 1049–1068. [Google Scholar] [CrossRef]
- Chou, T.; Lei, T.; Wan, S.; Yang, L. Spatial knowledge databases as applied to the detection of changes in urban land use. Int. J. Remote Sens. 2005, 26, 3047–3068. [Google Scholar] [CrossRef]
- Chen, J.; Chen, X.; Cui, X.; Chen, J. Change vector analysis in posterior probability space: A new method for land cover change detection. IEEE Geosci. Remote Sens. Lett. 2011, 8, 317–321. [Google Scholar] [CrossRef]
- Carvalho Júnior, O.A.; Guimarães, R.F.; Gillespie, A.R.; Silva, N.C.; Gomes, R.A. A new approach to change vector analysis using distance and similarity measures. Remote Sens. 2011, 3, 2473–2493. [Google Scholar] [CrossRef]
- Singh, S.; Talwar, R. A comparative study on change vector analysis based change detection techniques. Sadhana 2014, 39, 1311–1331. [Google Scholar] [CrossRef]
- Tewkesbury, A.P.; Comber, A.J.; Tate, N.J.; Lamb, A.; Fisher, P.F. A critical synthesis of remotely sensed optical image change detection techniques. Remote Sens. Environ. 2015, 160, 1–14. [Google Scholar] [CrossRef]
- Waske, B.; van der Linden, S. Classifying multilevel imagery from SAR and optical sensors by decision fusion. IEEE Trans. Geosci. Remote Sens. 2008, 46, 1457–1466. [Google Scholar] [CrossRef]
- Du, P.; Liu, S.; Xia, J.; Zhao, Y. Information fusion techniques for change detection from multi-temporal remote sensing images. Inf. Fusion 2013, 14, 19–27. [Google Scholar] [CrossRef]
- Zheng, Y.; Zhang, X.; Hou, B.; Liu, G. Using combined difference image and k-means clustering for SAR image change detection. IEEE Geosci. Remote Sens. Lett. 2014, 11, 691–695. [Google Scholar] [CrossRef]
- Jia, L.; Li, M.; Zhang, P.; Wu, Y.; An, L.; Song, W. Remote-sensing image change detection with fusion of multiple wavelet kernels. IEEE J. Sel. Top. Appl. Earth Obs. Remote Sens. 2016, 9, 3405–3418. [Google Scholar] [CrossRef]
- Singh, A.; Singh, K.K. Unsupervised change detection in remote sensing images using fusion of spectral and statistical indices. Egypt. J. Remote Sens. Space Sci. 2018, 21, 345–351. [Google Scholar] [CrossRef]
- Luo, H.; Liu, C.; Wu, C.; Guo, X. Urban change detection based on Dempster–Shafer theory for multitemporal very high-resolution imagery. Remote Sens. 2018, 10, 980. [Google Scholar] [CrossRef]
- Waske, B.; Braun, M. Classifier ensembles for land cover mapping using multitemporal SAR imagery. ISPRS J. Photogramm. Remote Sens. 2009, 64, 450–457. [Google Scholar] [CrossRef]
- Foody, G.; Boyd, D. Detection of partial land cover change associated with the migration of inter-class transitional zones. Int. J. Remote Sens. 1999, 20, 2723–2740. [Google Scholar] [CrossRef]
- Veh, G.; Korup, O.; Roessner, S.; Walz, A. Detecting Himalayan glacial lake outburst floods from Landsat time series. Remote Sens. Environ. 2018, 207, 84–97. [Google Scholar] [CrossRef]
- Bruzzone, L.; Prieto, D.F. Automatic analysis of the difference image for unsupervised change detection. IEEE Trans. Geosci. Remote Sens. 2000, 38, 1171–1182. [Google Scholar] [CrossRef]
- Besag, J. On the statistical analysis of dirty pictures. J. R. Stat. Soc. Ser. B (Methodol.) 1986, 48, 259–302. [Google Scholar] [CrossRef]
- Kuncheva, L.I. Combining Pattern Classifiers: Methods and Algorithms; John Wiley & Sons: Hoboken, NJ, USA, 2004. [Google Scholar]
- Otsu, N. A threshold selection method from gray-level histograms. IEEE Trans. Syst. Man Cybern. 1979, 9, 62–66. [Google Scholar] [CrossRef]
© 2019 by the authors. Licensee MDPI, Basel, Switzerland. This article is an open access article distributed under the terms and conditions of the Creative Commons Attribution (CC BY) license (http://creativecommons.org/licenses/by/4.0/).