Abstract
Drought is a natural hazard disaster that can deeply affect environments, economies, and societies around the world. Therefore, accurate monitoring of patterns in drought is important. Precipitation is the key variable to define the drought index. However, the spare and uneven distribution of rain gauges limit the access of long-term and reliable in situ observations. Remote sensing techniques enrich the precipitation data at different temporal–spatial resolutions. In this study, the climate prediction center morphing (CMORPH) technique (CMORPH-CRT), the tropical rainfall measuring mission (TRMM) multi-satellite precipitation analysis (TRMM 3B42V7), and the integrated multi-satellite retrievals for global precipitation measurement (IMERG V05) were evaluated and compared with in situ observations for the drought monitoring in the Xiang River Basin, a humid region in China. A widely-used drought index, the standardized precipitation index (SPI), was chosen to evaluate the drought monitoring utility. The atmospheric water deficit (AWD) was used for comparison of the drought estimation with SPI. The results were as follows: (1) IMERG V05 precipitation products showed the highest accuracy against grid-based precipitation, followed by CMORPH-CRT, which performed better than TRMM 3B42V7; (2) IMERG V05 showed the best performance in SPI-1 (one-month SPI) estimations compared with CMORPH-CRT and TRMM 3B42V7; (3) SPI-1 was more suitable for drought monitoring than AWD in the Xiang River Basin, because its high R-values and low root mean square error (RMSE) compared with the corresponding index based on in situ observations; (4) drought conditions in 2015 were apparently more severe than that in 2016 and 2017, with the driest area mainly distributed in the southwest part of the Xiang River Basin.
1. Introduction
Droughts usually occur over months to years in a region, including high and low precipitation regions, and cause damage to ecosystems and human well-being. The influence of climate change has led to an increasing trend of temperature, which is expected to significantly affect the spatial–temporal pattern of precipitation and the intensity of droughts [1]. Droughts might be further aggravated around the world, including in humid regions [2,3]. Therefore, it is essential to accurately monitor and predict drought because of its importance in risk management.
Precipitation plays an important role in drought monitoring as the primary factor affecting the formation and persistence of droughts and the estimation of drought indices [4,5]. Conventionally, precipitation data are derived from rain gauge observations through in situ gauge networks. However, the spare and uneven distribution of rain gauges limit the access of long-term and reliable ground-based precipitation measurements [6,7]. This phenomenon is particularly common in remote regions of developing countries. Moreover, unlike air pressure and temperature, precipitation always features large spatial–temporal variation and high uncertainty [8], thus, the spatial–temporal interpolation cannot always accurately capture the dynamics of precipitation data.
The development of remote sensing techniques enriches precipitation data at different spatial and temporal resolutions. In recent decades, satellite-based precipitation datasets have been widely applied for drought and flood forecasting [9,10,11,12], hydrological modelling [13,14], and water resource exploration [8]. There are now many distinct satellite-based precipitation products available, with some of them being widely used and having large-scale coverage with high spatial and temporal resolutions, such as the National Aeronautics and Space Administration (NASA) tropical rainfall measuring mission (TRMM) multi-satellite precipitation analysis (TMPA) [15], the climate prediction center morphing (CMORPH) technique [16] and integrated multi-satellite retrievals for global precipitation measurement (IMERG) [17]. The TRMM precipitation datasets have been available since November 1997 and many researchers have proved its ability for drought monitoring [18,19,20,21,22,23,24]. For example, Zeng et al. [18] evaluated the TRMM multi-satellite precipitation analysis (TMPA) in drought monitoring in Lancang River Basin. They discovered that one-month and three-month scale standard precipitation indexes (SPI) obtained from the version 6 monthly TMPA product from 1998 to 2009 both agreed well for most of the grid points in Lancang River Basin. Obtaining a drought index using solely CMORPH precipitation products has also been utilized for drought monitoring in many regions worldwide [25,26,27,28,29]. Lu et al. [26] compared the CMORPH-based SPI with the SPI estimate using in situ precipitation observations from 2221 meteorological stations across China from 1998 to 2014. They found that the CMORPH-based SPI values were generally consistent with the SPI obtained with in situ measurements, which suggested that the SPI estimate using CMORPH precipitation data products could be applied to drought assessment and monitoring. The IMERG precipitation products were characterized with high temporal and spatial resolutions (0.1° × 0.1°, 30 min) and its capability of real-time drought monitoring [30,31,32]. Among them, Jang et al. [31] calculated the SPI based on the global precipitation measurement (GPM) IMERG data and compared them with the results obtained from the in situ observations. They confirmed that the GPM IMERG-based SPI correlated well with the SPI, based on the ground precipitation observations.
Hunan province is located at the Yangtze River Basin, a humid region in China with the highest incidence of drought [33]. Xiang River is the largest river in Hunan province, China, and is one of the eight tributaries of the Yangtze River. The Xiang River Basin suffered moderate drought events before the 1990s and the condition has become drier since 2003 [34]. Therefore, it is urgent and significant to investigate the spatial–temporal distribution characteristics of droughts in the Xiang River Basin. In recent years, a variety of studies have been conducted on drought monitoring in the Xiang River Basin [7,26,33,35,36,37]. However, most of them explored the drought monitoring with in situ precipitation observations [7,33,35,36], some of them with satellite soil moisture [37] and some of them with TMPA and CMORPH-BLD precipitation products [26]. As far as we know, there are few works evaluating the efficiency of CMORPH-CRT or IMERG V05 in drought monitoring in Xiang River Basin. Therefore, it is critical to explore the utility of satellite-based precipitation products for more effective drought monitoring and forecasting in Xiang River Basin.
The aim of this study is to investigate and compare the drought monitoring utility of CMORPH-CRT, IMERG V05, and TRMM 3B42V7 precipitation estimates with the drought index, which is standard precipitation index (SPI). The remaining structure of the paper is organized as follows. The descriptions of the study area, the in situ observations, and three satellite-based precipitation products are presented in Section 2; the methodology and evaluation indices are introduced in Section 3; Section 4 provides the results and discussions; and conclusions are drawn in Section 5.
2. Study Area and Data
2.1. Study Area
The Xiang river is located in the south of the Yangtze River Basin and is the largest river in Hunan province and the Dongting Lake water system [33,37]. As the main tributary of the Yangtze River Basin, the Xiang river originates from the mountainous area in the southwest and flows into the northeast of Xiang River Basin [36]. The Xiangtan discharge station is the control station of the Xiang River Basin and the streamflow in this basin (Figure 1). As shown in Figure 2, the annual rainfall ranges from 1500 to 1800 mm and is unevenly distributed, with approximately 60% of annual rainfall falling from April to September. The average annual temperature is 18.4 °C and annual evaporation is about 932 mm. The uneven distribution of rainfall has led to frequent floods and droughts in the Xiang River Basin [7].
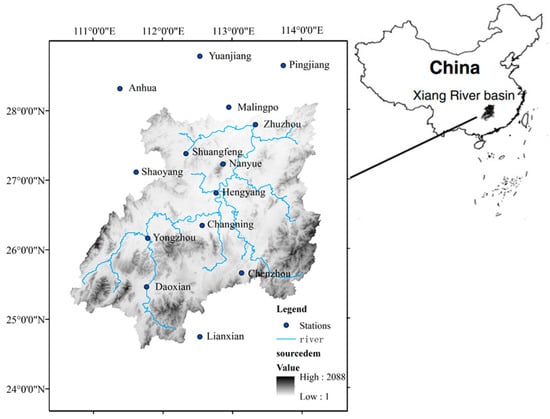
Figure 1.
Xiang River Basin and distribution of the meteorological stations.
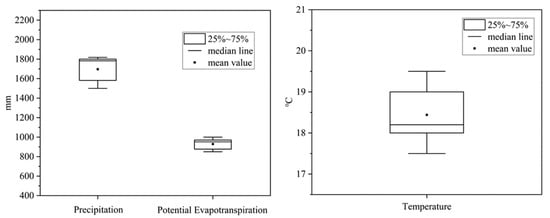
Figure 2.
Ranges for annual precipitation, annual average temperature, and potential evapotranspiration.
2.2. Data Sources
2.2.1. In Situ Observations
The daily in situ observations used in this study are collected from fourteen meteorological stations provided by the China National Meteorological Information Center (https://data.cma.cn) from 2015 to 2017. All the selected stations have complete records of daily precipitation, average daily temperature, maximum and minimum daily temperature, average pressure, average relative humidity, and solar radiation. The in situ observations are used as the reference to evaluate the accuracy of satellite-based precipitation and satellite-based drought indices at station scale.
2.2.2. Grid-Based Precipitation
In order to comprehensively illustrate the accuracy and drought monitoring utility of the selected satellite-based precipitation datasets on grid scale, the dataset of daily 0.5° × 0.5° grid-based precipitation over China from 2015 to 2017 is selected as the reference. It is developed by the China Meteorological Administration (CMA) and generated from the daily precipitation observations from 2472 stations using Thin Plate Spline. The dataset has been evaluated and used for exploring the spatial and temporal distributions of the precipitation over China and the results claim that the dataset can be used in meteorological monitoring and hydrological studies [38].
2.2.3. TRMM 3B42V7
The tropical rainfall measuring mission (TRMM) multi-satellite precipitation analysis (TMPA) is a satellite-based precipitation product providing the estimation of quasi-global rainfall (50°N–50°S) with high spatial and temporal resolution (0.25° × 0.25°, 3 h). The available data covers the period from 1998 to present. The TRMM 3B42 series products are the main precipitation products obtained from TRMM merged with other satellite estimates [15]. Two main 3B42 precipitation products are the near-real-time 3B42RT and the post-real-time 3B42V7. The 3B42RT product is generated from the satellite remote sensing information, while the post-real-time 3B42V7 is corrected by the Global Precipitation Climatology Centre (GPCC) gauge precipitation [39]. This study only focuses on the post-real-time 3B42V7 product. The datasets of this product from 2015 to 2017 are available on the NASA website (https://pmm.nasa.gov/data-access/downloads/trmm).
2.2.4. CMORPH-CRT
The CMORPH products, with high resolution (0.25° × 0.25°, 3 h) and near total global coverage (60°N–60°S), are generated by the National Ocean and Atmospheric Administration (NOAA) Climate Prediction Center’s MORPHing technique [16,40]. CMORPH products estimate the global precipitation from passive microwave satellite scans [14]. CMORPH has two versions, Version 0.x and Version 1.0. The former starts from December 2002 and presents satellite-only products, while the latter starts from January 1998 and contains three individual precipitation products [16,41]. CMORPH Version 1.0 includes raw (CMORPH-RAW), bias-corrected (CMORPH-CRT), and gauge satellite-blended (CMORPH-BLD) precipitation products. In this study, 0.25°and daily CMORPH-CRT product from 2015 to 2017 is utilized and the CMORPH-CRT datasets are freely downloaded (ftp://ftp.cpc.ncep.noaa.gov/precip/).
2.2.5. IMERG V05
The GPM mission, as a successor to the TRMM satellite, was launched on Feb 2014 by NASA and JAXA, aiming at providing an accurate and reliable global precipitation estimation with both active and passive microwave sensors [15,42,43]. There are four levels of GPM products based on different algorithms. The IMERG products are the GPM level 3 products with high spatial–temporal resolution (0.1° × 0.1°, 30 min) within a 60°N–60°S latitude–longitude band [15,44,45]. IMERG provides three types of products: Near-real-time Early Run (IMERG-E, with a latency of 6 h), reprocessed near-real-time Late Run (IMERG-L, with a latency of 12 h), and gauged-adjusted Final Run (IMERG-F, with a latency of 2.5 months). Among these three products, IMERG-F usually provides more accurate precipitation datasets compared to the other two products [6,15]. Therefore, the latest version of IMERG-F from 2015 to 2017, namely IMERG V05, is selected for this study. This can be obtained from the Precipitation Measurement Missions website at https://pmm.nasa.gov/data-access/downloads/gpm.
Considering the available daily precipitation data of IMERG V05 is from 2015, while the accessible data of in situ meteorological observations ends at 2017, the time period of this study is from 2015 to 2017.
3. Methodology
As mentioned above, the in situ observations and grid-based precipitation data from CMA are used as reference datasets to evaluate the accuracy of TRMM 3B42V7, CMORPH-CRT, and IMERG V05 precipitation products and their performance on drought monitoring. Generally, 1–2 month SPI and 3–6 month SPI are suitable for exploring meteorological and agricultural droughts, respectively [46]. In this study, SPI-1 is selected for drought monitoring in the Xiang River Basin due to the short records of satellite-based precipitation data. The SPI-1 obtained from these three precipitation products are compared with the SPI-1 calculated from the reference datasets. For comparison, the atmospheric water deficit (AWD) is also used to illustrate the drought conditions. Considering that potential evapotranspiration is required to calculate AWD, the AWD is only analyzed at station scale. Because the grid-based observations just provide precipitation data instead of other variables (e.g., temperature), there is no grid-based potential evapotranspiration data available. Based on the evaluation results, the best product among the three is then selected to analyze the drought conditions in the Xiang River Basin.
The analysis was accomplished on both temporal and spatial scales. Figure 3 shows the flow-chart of the main steps of the study. The detailed steps are as follows:
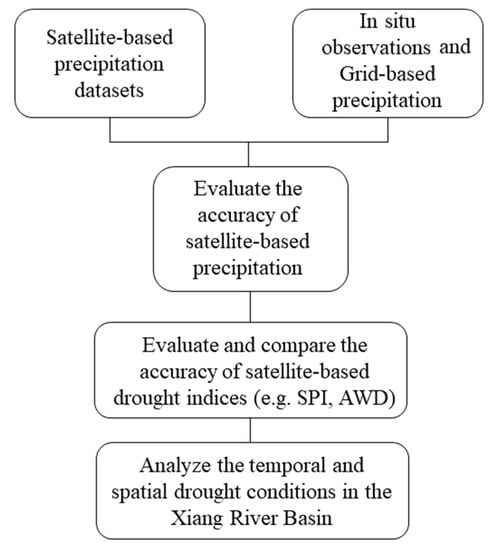
Figure 3.
The flow-chart of the main steps of the study.
- (1)
- Evaluate the accuracy of TRMM 3B42V7, CMORPH-CRT, and IMERG V05 precipitation products;
- (2)
- Evaluate the accuracy of SPI-1 calculated from TRMM 3B42V7, CMORPH-CRT, and IMERG V05 precipitation products;
- (3)
- Calculate the AWD values with in situ observations and compare the performance of AWD and SPI at station scale;
- (4)
- Analyze the temporal and spatial drought conditions in the Xiang River Basin.
3.1. Standard Precipitation Index (SPI)
The SPI is a widely used drought index developed by McKee et al. [47], which is calculated with accumulated precipitation observations over a time period (e.g., one month). This index is a valuable tool for the determination of the intensity and duration of different droughts [48]. It is generally accepted that the calculation of SPI needs a minimum data-record period of 30 years [47]. However, this index has also been shown to be of use in drought monitoring on small time scales [48]. Rhee and Carbone [30] also confirmed that short data records of precipitation can be used for the estimation of SPI. Therefore, even though the IMERG data records are relatively short compared with rain gauge observations and the other two satellite-based precipitation products, the estimation of SPI based on IMERG precipitation data for drought monitoring in the Xiang River Basin is still worth exploring.
SPI can be measured at different time periods, i.e., 1 month, 3 months, 6 months, or 12 months, with monthly precipitation data [49]. The SPI is defined as follows:
where is the accumulated precipitation observations of a time period and and s are the mean and standard deviation of precipitation data obtained from the time series of monthly precipitation dataset, respectively.
The SPI is calculated based on the gamma probability density function, so SPI < 0 reflects drought conditions and SPI > 0 implies wet conditions [47]. According to McKee et al. [47], the levels of wet and drought conditions and their corresponding categories are listed in Table 1.

Table 1.
Drought categories defined for SPI values.
3.2. Atmospheric Water Deficit (AWD)
Atmospheric water deficit is the difference between precipitation (P) and potential evapotranspiration (). Atmospheric water deficit is claimed to be a suitable index to reflect the drought condition related to meteorological parameters [50]. The AWD value is calculated by P minus on a weekly scale and the daily was computed using the Penman–Monteith equation:
where i represents the week of the study period, and denote the sum of precipitation and sum of evapotranspiration () of week i, respectively, is the net radiation, is the slope of the vapor pressure curve, G is the soil heat flux, is the wind speed at 2 m above ground level, is the psychometric constant, T is the temperature, is saturation vapor pressure at air temperature, and is actual vapor pressure. The Penman–Monteith equation is useful for computing ET based on temperature, humidity, wind speed, and solar radiation [51]. The condition is defined as drought when AWD is lower than 0. Extreme drought occurs when AWD is lower than −50 mm [52]. As mentioned above, no grid-based is available, therefore, the AWD values on meteorological stations are calculated and compared with the SPI-1 at station scale.
3.3. Evaluation Indices
Multiple statistical indices are used to evaluate the accuracy of the three satellite-based precipitation products and the performance of their SPI estimates. These indices include Pearson correlation coefficient (R-value), relative bias (BIAS), root mean square error (RMSE), Nash–Sutcliffe efficiency (NSE), the probability of detection (POD), and the false alarm ration (FAR). The six indices are defined as follows:
where and represent the in situ dataset (or grid-based dataset) and satellite-based dataset, respectively, and and represent the mean values of these two datasets, respectively. For POD and FAR, A means “hits”, B means “false alarms”, and C means “misses”.
4. Results and Discussion
4.1. Evaluation of Satellite-Based Precipitation Products
To investigate the efficiency of the selected three satellite-based precipitation datasets on the drought monitoring in the Xiang River Basin, the accuracy of these precipitation products needs to be evaluated against the in situ observations and grid-based precipitation firstly. The accuracy of precipitation estimates of TRMM 3B42V7, CMORPH-CRT, and IMERG V05 from January 2015 to December 2017 are compared and evaluated using in situ observations and grid-based precipitation as the references at catchment scale and grid/station scale, with the mentioned evaluation indices.
At the catchment scale, the areal daily satellite-based precipitation estimates are compared with those calculated with precipitation from the fourteen meteorological stations (Figure 4). The daily precipitations from CMORPH-CRT, IMERG V05, and TRMM 3B42V7 are rather consistent with gauge measurements, with high R-values, POD, and NSE values (R-values > 0.58, POD > 0.87, and NSE > 0.91), and low BIAS, FAR, and RMSE values (BIAS between −23.3% and 5.6%, FAR < 0.16, and RMSE between 6.6 and 6.97). The results show that the CMORPH-CRT and the IMERG V05 have a comparably good performance next to TRMM 3B42V7 at the Xiang River Basin. The TRMM 3B42V7 and the CMORPH-CRT both underestimate the daily precipitation, while the IMERG V05 overestimates the daily precipitation. Figure 5 shows the time series of monthly average precipitation based on three satellite-based precipitation products and in situ observations. It can be seen that heavy rains mainly occur in June and July. As for temporal variation, IMERG V05 and CMORPH-CRT show similarly good performances in capturing the dynamics of monthly precipitation and the former has a slight advantage, as CMOPRH-CRT has some minor underestimation. The TRMM 3B42V7 shows the worst performance relatively, exhibiting underestimation, especially in November 2015, June 2016, and June 2017.
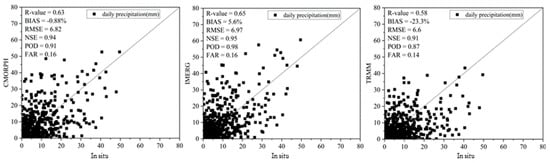
Figure 4.
Comparison of the daily precipitation data from satellite-based products with in situ observations.
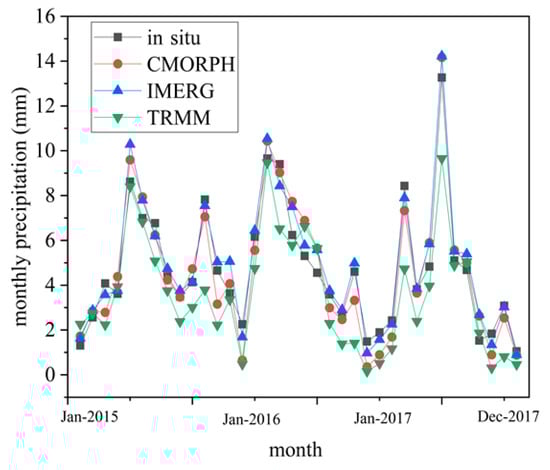
Figure 5.
Temporal comparison of monthly average precipitation between satellite-based precipitation products and in situ observations.
Regarding the grid scale, the spatial distributions of R-value, BIAS, RMSE, and NSE based on the satellite-based precipitation products and daily 0.5° × 0.5° grid-based precipitation are shown in Figure 6. In terms of R-values, around 40%, 78%, and 56% of the grids are higher than 0.4 [53] for the CMORPH-CRT, IMERG V05, and TRMM 3B42V7 techniques, respectively. The central and southwest parts of the Xiang River Basin show high agreement with larger R-values. The IMERG V05 presents the highest accuracy, followed by the TRMM 3B42V7. Regarding the results of BIAS, CMORPH-CRT presents a relatively poor performance, with underestimation among most parts of the basin. The BIAS values of IMERG V05 range from −20% to 10%, while the values range from −20% to 20% for TRMM 3B42V7. IMERG V05 underestimates most parts of the basin, while TRMM 3B42V7 shows the opposite pattern.
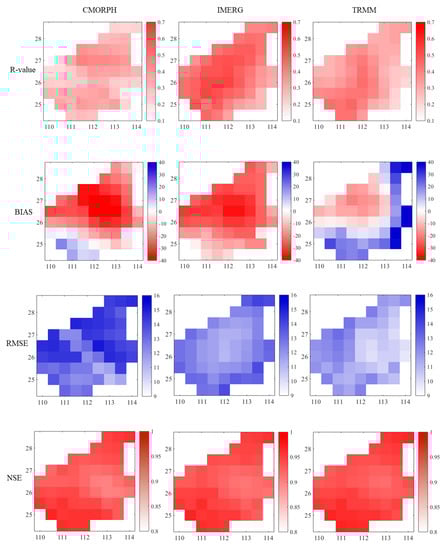
Figure 6.
Spatial distribution of the R-value, relative bias (BIAS), root mean square error (RMSE), and Nash–Sutcliffe efficiency (NSE) values based on an evaluation of daily 0.5° × 0.5° grid-based precipitation data.
In terms of RMSE, TRMM 3B42V7 shows the smallest RMSE values compared with IMERG V05 and CMORPH-CRT. Small values of RMSE are observed in the central part of the basin with IMERG V05, the eastern part with TRMM 3B42V7, and the southwest part with CMORPH-CRT. As for NSE, it is obvious that all three satellite-based precipitation products exhibit good performance (NSE > 0.8) over the whole basin. Approximately 82%, 90%, and 95% of grids showed a high value of NSE (>0.9) for the CMORPH-CRT, IMERG V05, and TRMM 3B42V7 techniques, respectively. Higher NSE values between satellite-based precipitation products and in situ observations were mostly observed in the south and north parts of the Xiang River Basin. Poor performance of NSE values were mainly illustrated in the eastern basin with the highest elevation.
Above all, these three satellite-based precipitation products are satisfactory in terms of R-value, BIAS, RMSE, and NSE for both catchment and grid scale, with acceptable accuracy and relatively good performance in most of the Xiang River Basin. Among these three products, generally, IMERG V05 performs the best based on the results of evaluation indices.
4.2. Evaluation of the Performance of Satellite-Based Precipitation on Drought Monitoring
4.2.1. Evaluation with Meteorological Stations
The SPI-1 was calculated based on CMORPH-CRT, IMERG V05, TRMM 3B42V7 and in situ observations at catchment scale and station scale in the Xiang River Basin from 2015 to 2017. As stated above, the SPI-1 is used to explore the drought conditions. R-value, RMSE, and NSE are utilized to evaluate the performance of the satellite-based precipitation products on drought monitoring against the in situ observations. There are no BIAS values because the cumulative precipitation distribution is transformed to a normal distribution with a mean of zero [44]. The comparison of areal SPI-1 is shown in Figure 7.
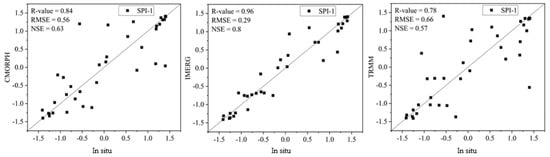
Figure 7.
Comparison of the one-month standardized precipitation index (SPI-1) calculated from the satellite-based precipitation products and in situ observations.
Similar to the results of evaluation about the accuracy of precipitation estimates, IMERG V05 shows the best performance in SPI-1 estimations compared with CMORPH-CRT and TRMM 3B42V7, with the highest R-value (0.96) and NSE (0.8) and the lowest RMSE (0.29) (Figure 7). The SPI-1 estimates based on CMORPH-CRT and TRMM 3B42V7 are also in good agreement with those based on in situ observations. CMORPH-CRT performs better than TRMM 3B42V7, withSPI relatively higher R-value and NSE and a low RMSE. These results indicate that all the three satellite-based precipitation products are suitable for drought monitoring in the Xiang River Basin, while IMERG V05 performs the best on drought monitoring.
Because of the common time period of the selected three precipitation datasets and the reason mentioned above, only SPI-1 is used to investigate their application on drought monitoring. However, since CMORPH and TRMM data cover longer time periods, other SPI time periods are also utilized to justify whether the results based on SPI-1 are solid. Therefore, based on the available data of in situ observations, TRMM 3B42V7, and CMORPH-CRT, the common time period is from 1998 to 2013. The SPI-3, SPI-6, and SPI-12 based on in situ observations, TRMM 3B42V7, and CMORPH-CRT are calculated at catchment scale over Xiang River Basin. Figure 8 shows the R-value, RMSE, and NSE results based on the comparison between in situ observations and satellite-based precipitation products. Similar to the results of evaluation about the SPI-1 estimates from CMORPH-CRT and TRMM 3B42V7, the CMORPH-CRT performs better than TRMM 3B42V7, especially the SPI-6 and SPI-12. The SPI-6 and SPI-12 of CMORPH-CRT shows similar performance, which indicates that a longer time scale of SPI based on CMORPH-CRT does not have a significant impact on its performance of drought monitoring. However, the longer the time scales of SPI, the worse the performance of TRMM 3B42V7 on drought monitoring. Short time scale of SPI (e.g., SPI-1 or SPI-3) might more suitable for TRMM 3B42V7 for drought estimations at catchment scale over Xiang River Basin.
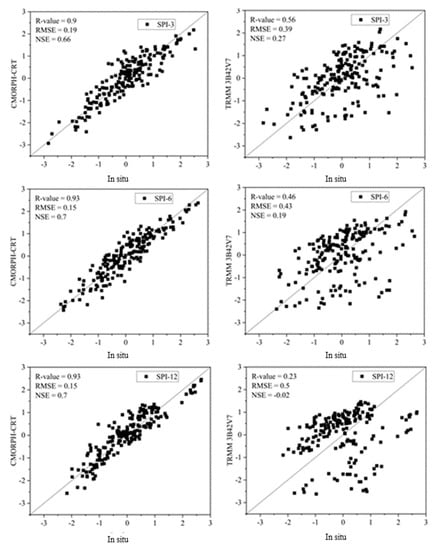
Figure 8.
Comparison of the SPI-3, SPI-6, and SPI-12 calculated from the satellite-based precipitation products and in situ observations.
The short-term records of precipitation from IMERG limited its investigation for long-term drought monitoring, however, in this study, the high resolution but short-term IMERG precipitation product shows the best performance in both precipitation detection and drought monitoring over Xiang River Basin. Thus, the use of the IMERG precipitation product for further application in drought monitoring is still worth exploring.
Based on the above analysis, it can be seen that the SPI-1 has comparable performance with other SPI time periods. Therefore, considering the short available time period of IMERG, the following analysis is just based on SPI-1.
Time series of SPI-1 values from the three satellite-based precipitation products and in situ observations are shown in Figure 9. This illustrates that SPI-1 based on IMERG V05 captures the variations well, indicating that IMERG V05 can be an alternative precipitation source instead of in situ observations for drought monitoring. Compared with IMERG V05 and CMORPH-CRT, TRMM 3B42V7 is less suitable for drought monitoring over the Xiang River Basin, because of the disparities along the time.
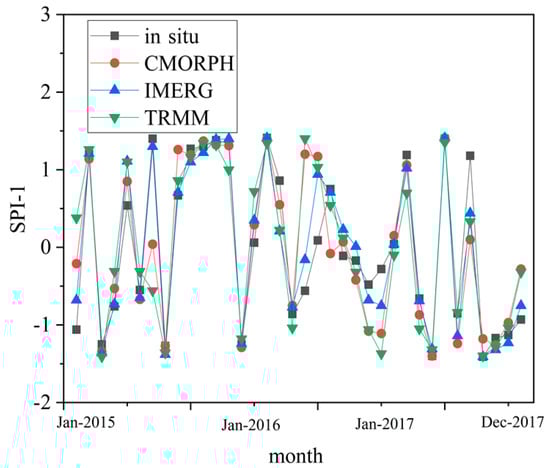
Figure 9.
Temporal comparison of 1-month SPI values between satellite-based precipitation products and in situ observations.
With regard to the capability of drought detection at station scale, 10 meteorological stations within the Xiang River Basin were selected for statistical metric calculation (Table 2). NSE values for the SPI-1 based on IMERG V05 are mainly between 0.42 and 0.78. However, the values of NSE for SPI-1 based on CMORPH-CRT are between 0.11 and 0.51 and for SPI-1 based on TRMM 3B42V7, the values are between 0.06 and 0.39. These results indicate that IMERG V05 apparently has better capability in drought monitoring than those of CMORPH-CRT and TRMM 3B42V7. Moreover, SPI based on the IMERG V05 shows a higher correlation with in situ observations than TRMM 3B42V7 and CMORPH-CRT, with the R-values ranging from 0.58 to 0.95. As for RMSE, similar to the above results, the RMSE values of IMERG V05 are lower than those of CMORPH-CRT and TRNN 3B42V7 in most meteorological stations.
Table 2.
SPI-1 comparison between satellites and in situ in each meteorological station.
For comparison between two different drought indices, the atmospheric water deficit (AWD) was also used to estimate the drought conditions at catchment (Figure 10) and station scale (Table 3). Figure 10 shows the comparison results of the one-week AWD calculated from the satellite-based precipitation products and in situ observations. CMORPH-CRT-based AWD presents similar values of R-value and RMSE with those of IMERG V05, with a high R-value of nearly 0.9 and a low RMSE below 6.1. BIAS of both CMORPH-CRT and IMERG V05 based AWD are lower than TRMM 3B42V7 (−50.6%), with bias values between −2% and 12%. Apparently, AWD based on the IMERG V05 shows a higher correlation with in situ observations than TRMM 3B42V7 and CMORPH-CRT, with the R-value ranging from 0.7 to 0.99 (Table 3). As for BIAS and RMSE, the TRMM 3B42V7-based AWD shows very high bias values in most meteorological stations. The values of BIAS and RMSE for IMERG V05-based AWD is relatively low compared to those of CMORPH-CRT in most meteorological stations. These results indicate that the IMERG V05 is superior to TRMM3B42V7 and CMORPH-CRT in AWD estimates.
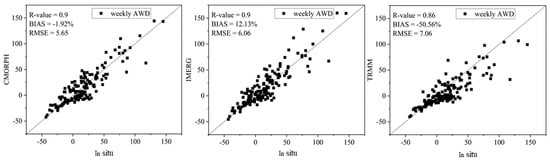
Figure 10.
Comparison of the one-week AWD calculated from the satellite-based precipitation products and in situ observations.
Table 3.
One-week AWD comparison between satellites and in situ observations at each meteorological station.
Above all, SPI-1 based on satellite-based precipitation products have good performance in both temporal and spatial analyses with acceptable accuracy and capability for drought monitoring in the Xiang River Basin. Even though the R-value of satellite-based AWD is not much higher than satellite-based SPI, the RMSE values of satellite-based AWD are much larger than those of SPI-1 based on satellite-based precipitation products. Therefore, SPI-1 might be more suitable for drought monitoring in the Xiang River Basin.
4.2.2. Evaluation with Grid-Based Precipitation
To further evaluate the accuracy of three satellite-based precipitation products on drought monitoring, the spatial patterns of R-value, RMSE, and NSE of SPI-1 based on these products are conducted and shown in Figure 11.
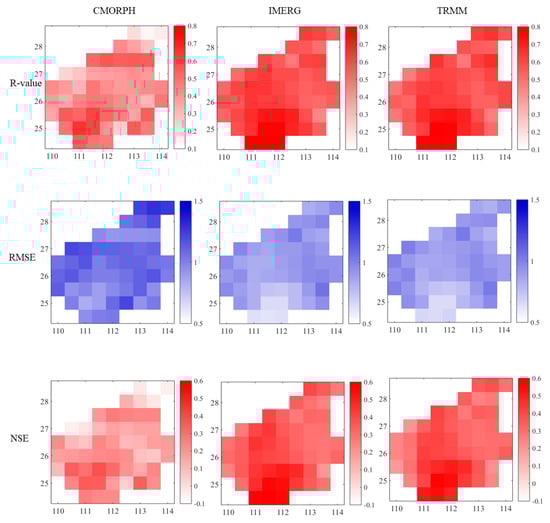
Figure 11.
Spatial distribution of the R-values and RMSE values based on an evaluation of daily 0.5° × 0.5° grid-based precipitation data.
It is obvious that the spatial distributions of R-value, RMSE, and NSE of SPI-1 based on TRMM 3B42V7 are similar to those of IMERG V05, with high R-values and NSE values in the south basin and relatively low R-values in the west basin. Poor performances of R-value, NSE, and RMSE are observed in CMORPH-CRT product, with low R-values and NSE values and high RMSE values in most of the basin. These results indicate that IMERG V05 and TRMM 3B42V7 are more suitable for drought monitoring with SPI-1 than CMORPH-CRT at grid scale. However, these satellite-based SPI values all show good performance in the southern Xiang River Basin, which is located in a region with relatively low altitude compared to surrounding regions. The values of R-value and NSE are high and the RMSE values are low in the southern Xiang River Basin, implying that satellite-based precipitation products can be used to monitor drought in the southern basin, while uncertainties are much larger in the western basin.
4.3. Analysis of Drought Conditions in the Xiang River Basin
The SPI-1 based on IMERG V05 are selected for catchment drought studies from 2015 to 2017. As Zhu et al. [34] mentioned, August basically represents the driest period in the Xiang River Basin. Therefore, the spatial distributions of SPI-1 in August from 2015 to 2017 are selected to be compared.
As shown in Figure 12, August of 2015 suffered the most severe and wide range of droughts, with the driest area mainly in the southwest part of the Xiang River Basin. However, the driest part of the basin in 2015 tended to become wet in 2016, but the northern basin still remained under mild drought in August 2016. During August of 2017, the severity of drought in the north part of was relieved compared to 2015 and 2016, but the moderate drought shifted from the north to the southwest part of the basin. As a whole, drought conditions in 2015 were apparently more severe than in 2016 and 2017 and the severity and range of droughts in the Xiang River Basin present a decreasing trend from 2015 to 2017. Even though the severity of drought was reduced in August 2017, there still remains a small area with moderate drought in the southwest basin.
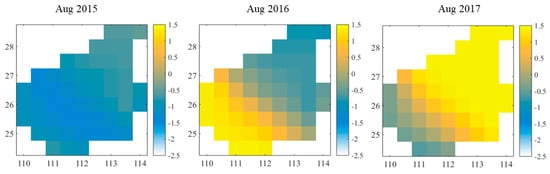
Figure 12.
The distributions of IMERG V05 SPI-1 in August from 2015 to 2017.
5. Conclusions
In this study, the accuracy of three satellite-based precipitation products, namely CMORPH-CRT, IMERG V05, and TRMM 3B42V7, was evaluated with the in situ observations and the datasets of daily 0.5° × 0.5° grid-based precipitation over China obtained from CMA. Their applications on drought monitoring were also evaluated with grid-based SPI-1. In addition, the efficiency of satellite-based SPI-1 values were explored by comparing with the AWD based on meteorological variables at station scale. Moreover, the drought conditions in August from 2015 to 2017 were analyzed based on IMERG V05 SPI-1 values. The main conclusions are as follows:
- (1)
- IMERG V05 precipitation product shows the highest accuracy in the Xiang River Basin. CMORPH-CRT performs better than the TRMM 3B42V7 precipitation product at both catchment and grid scales.
- (2)
- Based on evaluation results of SPI-1, IMERG V05 shows the best performance in SPI-1 estimations at both station and grid scales. The CMORPH-CRT has a better performance than TRMM 3B42V7 on drought monitoring at station scale, but shows the worst performance at grid scale.
- (3)
- The drought conditions of the Xiang River Basin in 2015 were apparently more severe than in 2016 and 2017, with the driest area mainly in the southwest part of the basin. The severity and range of droughts in the Xiang River Basin present a decreasing trend from 2015 to 2017.
In summary, IMERG V05 precipitation product is more suitable for drought monitoring in the Xiang River Basin. The performances of CMORPH-CRT and TRMM 3B42V7 are acceptable but the application for drought estimation of these two products still needs further determination.
Author Contributions
Conceptualization, Q.Z. and Y.L.; methodology, Y.L.; software, D.Y.; validation, Q.Z., Y.-P.X. and Y.L.; formal analysis, Y.L.; investigation, Q.Z.; resources, G.W.; data curation, D.Y.; writing—original draft preparation, Y.L.; writing—review and editing, Q.Z.; visualization, Y.L.; supervision, Q.Z.; project administration, Q.Z.; funding acquisition, Q.Z.
Funding
This study was financially supported by the Natural Science Foundation of Jiangsu Province (BK20180403) and the National Key Research and Development Programs of China (2016YFA0601501).
Acknowledgments
Thank the National Meteorological Information Center of China Meteorological Administration for archiving the observed climate data (http://data.cma.cn/). Thank the National Aeronautics Space Agency (NASA) and the National Ocean and Atmospheric Administration (NOAA)for providing the satellite-based precipitation data (https://pmm.nasa.gov/data-access/downloads/trmm; https://pmm.nasa.gov/data-access/downloads/gpm; ftp://ftp.cpc.ncep.noaa.gov/precip/). Authors have great thanks to Jie Wang for technical supporting and the anonymous reviewers for providing so valuable comments.
Conflicts of Interest
The authors declare no conflict of interest.
References
- Edenhofer, O.; Pichs-Madruga, R.; Sokona, Y.; Farahani, E.; Kadner, S.; Seyboth, K.; Adler, A.; Baum, I.; Brunner, S.; Eickemeier, P.; et al. (Eds.) IPCC, 2014: Climate Change 2014: Mitigation of Climate Change. Contribution of Working Group III to the Fifth Assessment Report of the Intergovernmental Panel on Climate Change; Cambridge University Press: Cambridge, UK, 2014. [Google Scholar]
- Dai, A. Increasing drought under global warming in observations and models. Nat. Clim. Chang. 2013, 3, 52. [Google Scholar] [CrossRef]
- Dai, A. Drought under global warming: A review. Wiley Interdisciplinary Reviews. Clim. Chang. 2011, 2, 45–65. [Google Scholar]
- Tao, H.; Fischer, T.; Zeng, Y.; Fraedrich, K. Evaluation of TRMM 3B43 precipitation data for drought monitoring in Jiangsu Province, China. Water 2016, 8, 221. [Google Scholar] [CrossRef]
- Katsanos, D.; Retalis, A.; Tymvios, F.; Michaelides, S. Study of extreme wet and dry periods in Cyprus using climatic indices. Atmos. Res. 2018, 208, 88–93. [Google Scholar] [CrossRef]
- Tan, M.; Tan, K.; Chua, V.; Chan, N. Evaluation of TRMM Product for Monitoring Drought in the Kelantan River Basin, Malaysia. Water 2017, 9, 57. [Google Scholar] [CrossRef]
- Tian, Y.; Xu, Y.-P.; Wang, G. Agricultural drought prediction using climate indices based on Support Vector Regression in Xiangjiang River basin. Sci. Total Environ. 2018, 622, 710–720. [Google Scholar] [CrossRef] [PubMed]
- Zhong, R.; Chen, X.; Lai, C.; Wang, Z.; Lian, Y.; Yu, H.; Wu, X. Drought monitoring utility of satellite-based precipitation products across mainland China. J. Hydrol. 2019, 568, 343–359. [Google Scholar] [CrossRef]
- Toté, C.; Patricio, D.; Boogaard, H.; van der Wijngaart, R.; Tarnavsky, E.; Funk, C. Evaluation of Satellite Rainfall Estimates for Drought and Flood Monitoring in Mozambique. Remote Sens. 2015, 7, 1758–1776. [Google Scholar] [CrossRef]
- Fan, F.M.; Collischonn, W.; Quiroz, K.; Sorribas, M.; Buarque, D.; Siqueira, V. Flood forecasting on the Tocantins River using ensemble rainfall forecasts and real-time satellite rainfall estimates. J. Flood Risk Manag. 2016, 9, 278–288. [Google Scholar] [CrossRef]
- Zambrano, F.; Wardlow, B.; Tadesse, T.; Lillo-Saavedra, M.; Lagos, O. Evaluating satellite-derived long-term historical precipitation datasets for drought monitoring in Chile. Atmos. Res. 2017, 186, 26–42. [Google Scholar] [CrossRef]
- Gao, F.; Zhang, Y.; Ren, X.; Yao, Y.; Hao, Z.; Cai, W. Evaluation of CHIRPS and its application for drought monitoring over the Haihe River Basin, China. Nat. Hazard 2018, 92, 155–172. [Google Scholar] [CrossRef]
- Tobin, K.J.; Bennett, M.E. Adjusting Satellite Precipitation Data to Facilitate Hydrologic Modeling. J. Hydrometeorol. 2010, 11, 966–978. [Google Scholar] [CrossRef]
- Zhao, H.; Yang, S.; Wang, Z.; Zhou, X.; Luo, Y.; Wu, L. Evaluating the suitability of TRMM satellite rainfall data for hydrological simulation using a distributed hydrological model in the Weihe River catchment in China. J. Geogr. Sci. 2015, 25, 177–195. [Google Scholar] [CrossRef]
- Huffman, G.J.; Bolvin, D.T.; Nelkin, E.J.; Wolff, D.B.; Adler, R.F.; Gu, G.; Hong, Y.; Bowman, K.P.; Stocker, E.F. The TRMM multisatellite precipitation analysis (TMPA): Quasi-global, multiyear, combined-sensor precipitation estimates at fine scales. J. Hydrometeorol. 2007, 8, 38–55. [Google Scholar] [CrossRef]
- Joyce, R.J.; Janowiak, J.E.; Arkin, P.A.; Xie, P. CMORPH: A method that produces global precipitation estimates from passive microwave and infrared data at high spatial and temporal resolution. J. Hydrometeorol. 2004, 5, 487–503. [Google Scholar] [CrossRef]
- Huffman, G.; Bolvin, D.; Braithwaite, D.; Hsu, K.; Joyce, R.; Kidd, C.; Sorooshian, S.; Xie, P.; Yoo, S.-H. Developing the Integrated Multi-Satellite Retrievals for GPM (IMERG). Available online: http://meetingorganizer.copernicus.org/EGU2012/EGU2012-6921.pdf (accessed on 27 April 2012).
- Zeng, H.; Li, L.; Li, J. The evaluation of TRMM Multisatellite Precipitation Analysis (TMPA) in drought monitoring in the Lancang River Basin. J. Geogr. Sci. 2012, 22, 273–282. [Google Scholar] [CrossRef]
- Lingtong, D.; Qingjiu, T.; Yan, H.; Jun, L. Drought monitoring based on TRMM data and its reliability validation in Shandong province. Trans. Chin. Soc. Agric. Eng. 2012, 28, 121–126. [Google Scholar]
- Naumann, G.; Barbosa, P.; Carrao, H.; Singleton, A.; Vogt, J. Monitoring drought conditions and their uncertainties in Africa using TRMM data. J. Appl. Meteorol. Climatol. 2012, 51, 1867–1874. [Google Scholar] [CrossRef]
- De Jesús, A.; Breña-Naranjo, J.; Pedrozo-Acuña, A.; Alcocer Yamanaka, V. The use of TRMM 3B42 product for drought monitoring in Mexico. Water 2016, 8, 325. [Google Scholar] [CrossRef]
- Santos, C.A.G.; Neto, R.M.B.; de Araújo Passos, J.S.; da Silva, R.M. Drought assessment using a TRMM-derived standardized precipitation index for the upper São Francisco River basin, Brazil. Environ. Monit. Assess. 2017, 189, 250. [Google Scholar] [CrossRef]
- Zhao, Q.; Chen, Q.; Jiao, M.; Wu, P.; Gao, X.; Ma, M.; Hong, Y. The temporal-spatial characteristics of drought in the Loess Plateau using the remote-sensed TRMM precipitation data from 1998 to 2014. Remote Sens. 2018, 10, 838. [Google Scholar] [CrossRef]
- Xia, L.; Zhao, F.; Mao, K.; Yuan, Z.; Zuo, Z.; Xu, T. SPI-Based Analyses of Drought Changes over the Past 60 Years in China’s Major Crop-Growing Areas. Remote Sens. 2018, 10, 171. [Google Scholar] [CrossRef]
- Lessel, J.; Sweeney, A.; Ceccato, P. An agricultural drought severity index using quasi-climatological anomalies of remotely sensed data. Int. J. Remote Sens. 2016, 37, 913–925. [Google Scholar] [CrossRef]
- Lu, J.; Jia, L.; Menenti, M.; Yan, Y.; Zheng, C.; Zhou, J. Performance of the Standardized Precipitation Index Based on the TMPA and CMORPH Precipitation Products for Drought Monitoring in China. IEEE J. Sel. Top. Appl. Earth Obs. Remote Sens. 2018, 11, 1387–1396. [Google Scholar] [CrossRef]
- Monteleone, B.; Martina, M. Remote-sensing based model for drought identification. Available online: http://adsabs.harvard.edu/abs/2018EGUGA.2019658M (accessed on 23 April 2018).
- Prat, O.; Leeper, R.; Bell, J.; Nelson, B.; Adams, J.; Ansari, S. Toward Earlier Drought Detection Using Remotely Sensed Precipitation Data from the Reference Environmental Data Record (REDR) CMORPH. Available online: http://adsabs.harvard.edu/abs/2018EGUGA.2011468P (accessed on 13 April 2018).
- Wang, F.; Yang, H.; Wang, Z.; Zhang, Z.; Li, Z. Drought Evaluation with CMORPH Satellite Precipitation Data in the Yellow River Basin by Using Gridded Standardized Precipitation Evapotranspiration Index. Remote Sens. 2019, 11, 485. [Google Scholar] [CrossRef]
- Rhee, J.; Carbone, G.J. Estimating drought conditions for regions with limited precipitation data. J. Appl. Meteorol. Clim. 2011, 50, 548–559. [Google Scholar] [CrossRef]
- Jang, S.; Center, A.C.; Rhee, J.; Center, A.C.; Yoon, S.; Center, A.C.; Lee, T.; Park, K.; Center, A.C. Evaluation of GPM IMERG Applicability Using SPI based Satellite Precipitation. J. Korean Soc. Agric. Eng. 2018, 59, 29–39. [Google Scholar]
- Rushi, B.R.; Mishra, V.; Ellenburg, W.L.; Qamer, F.M.; Limaye, A.S.; Irwin, D. Application of Satellite Remote Sensing in Drought Monitoring in Bangladesh Using a User-Friendly Tool. Available online: http://adsabs.harvard.edu/abs/2018AGUFMGC31K1381R (accessed on 21 June 2019).
- Du, J.; Fang, J.; Xu, W.; Shi, P. Analysis of dry/wet conditions using the standardized precipitation index and its potential usefulness for drought/flood monitoring in Hunan Province, China. Stoch. Environ. Res. Risk Assess. 2013, 27, 377–387. [Google Scholar] [CrossRef]
- Zhang, T.; Zhang, X.; Wu, H.; Shen, L. Analysis of Pan Evaporation Trend and Its Influence Factors in Xiangjiang River Basin. Progress. Inquis. Mutat. Clim. 2013, 9, 35–42. [Google Scholar]
- Ma, C.; Pan, S.; Wang, G.; Liao, Y.; Xu, Y.-P. Changes in precipitation and temperature in Xiangjiang River Basin, China. Theor. Appl. Climatol. 2016, 123, 859–871. [Google Scholar] [CrossRef]
- Zhao, L.; Wu, J.; Fang, J. Robust response of streamflow drought to different timescales of meteorological drought in Xiangjiang River Basin of China. Adv. Meteorol. 2016. [Google Scholar] [CrossRef]
- Zhu, Q.; Luo, Y.; Xu, Y.-P.; Tian, Y.; Yang, T. Satellite Soil Moisture for Agricultural Drought Monitoring: Assessment of SMAP-Derived Soil Water Deficit Index in Xiang River Basin, China. Remote Sens. 2019, 11, 362. [Google Scholar] [CrossRef]
- Yufei, Z.; Jiang, Z. Assessing quality of grid daily precipitation datasets in China in recent 50 years. Plateau Meteorol. 2015, 34, 50–258. [Google Scholar]
- Huffman, G.J.; Bolvin, D.T. Real-Time TRMM Multi-Satellite Precipitation Analysis Data Set Documentation. Available online: https://pmm.nasa.gov/sites/default/files/document_files/3B4XRT_doc_V7_180426.pdf (accessed on 26 April 2018).
- Wei, G.; Lü, H.; Crow, W.T.; Zhu, Y.; Wang, J.; Su, J. Comprehensive Evaluation of GPM-IMERG, CMORPH, and TMPA Precipitation Products with Gauged Rainfall over Mainland China. Adv. Meteorol. 2018, 2018, 1–18. [Google Scholar] [CrossRef]
- Jiang, S.-h.; Zhou, M.; Ren, L.-l.; Cheng, X.-r.; Zhang, P.-j. Evaluation of latest TMPA and CMORPH satellite precipitation products over Yellow River Basin. Water Sci. Eng. 2016, 9, 87–96. [Google Scholar] [CrossRef]
- Li, N.; Tang, G.; Zhao, P.; Hong, Y.; Gou, Y.; Yang, K. Statistical assessment and hydrological utility of the latest multi-satellite precipitation analysis IMERG in Ganjiang River basin. Atmos. Res. 2017, 183, 212–223. [Google Scholar] [CrossRef]
- Wang, Z.; Zhong, R.; Lai, C.; Chen, J. Evaluation of the GPM IMERG satellite-based precipitation products and the hydrological utility. Atmos. Res. 2017, 196, 151–163. [Google Scholar] [CrossRef]
- Sharifi, E.; Steinacker, R.; Saghafian, B. Assessment of GPM-IMERG and Other Precipitation Products against Gauge Data under Different Topographic and Climatic Conditions in Iran: Preliminary Results. Remote Sens. 2016, 8, 135. [Google Scholar] [CrossRef]
- Chen, F.; Li, X. Evaluation of IMERG and TRMM 3B43 Monthly Precipitation Products over Mainland China. Remote Sens. 2016, 8, 472. [Google Scholar] [CrossRef]
- Tan, M.L.; Chua, V.P.; Tan, K.C.; Brindha, K. Evaluation of TMPA 3B43 and NCEP-CFSR precipitation products in drought monitoring over Singapore. Int. J. Remote Sens. 2018, 39, 2089–2104. [Google Scholar] [CrossRef]
- McKee, T.B.; Doesken, N.J.; Kleist, J. The relationship of drought frequency and duration to time scales. In Proceedings of the 8th Conference on Applied Climatology, American Meteorological Society, Boston, MA, USA, 17–22 January 1993; 17, pp. 179–183. [Google Scholar]
- Livada, I.; Assimakopoulos, V. Spatial and temporal analysis of drought in Greece using the Standardized Precipitation Index (SPI). Theor. Appl. Climatol. 2007, 89, 143–153. [Google Scholar] [CrossRef]
- Sönmez, F.K.; Koemuescue, A.U.; Erkan, A.; Turgu, E. An analysis of spatial and temporal dimension of drought vulnerability in Turkey using the standardized precipitation index. Nat. Hazard 2005, 35, 243–264. [Google Scholar] [CrossRef]
- Torres, G.M.; Lollato, R.P.; Ochsner, T.E. Comparison of Drought Probability Assessments Based on Atmospheric Water Deficit and Soil Water Deficit. Agron. J. 2013, 105, 428–436. [Google Scholar] [CrossRef]
- Moran, M.; Rahman, A.; Washburne, J.; Goodrich, D.; Weltz, M.; Kustas, W. Combining the Penman-Monteith equation with measurements of surface temperature and reflectance to estimate evaporation rates of semiarid grassland. Agric. For. Meteorol. 1996, 80, 87–109. [Google Scholar] [CrossRef]
- Martínez-Fernández, J.; Sánchez, N.; González-Zamora, A.; Gumuzzio-Such, A.; Herrero-Jiménez, C.M. Feasibility of the SMOS soil moisture for agricultural drought monitoring: Assessment with the soil water deficit index. IEEE Int. Geosci. Remote Sens. Symp. (IGARSS) 2015, 11, 976–979. [Google Scholar]
- Albergel, C.; De Rosnay, P.; Gruhier, C.; Muñoz-Sabater, J.; Hasenauer, S.; Isaksen, L.; Kerr, Y.; Wagner, W. Evaluation of remotely sensed and modelled soil moisture products using global ground-based in situ observations. Remote Sens. Environ. 2012, 118, 215–226. [Google Scholar] [CrossRef]
© 2019 by the authors. Licensee MDPI, Basel, Switzerland. This article is an open access article distributed under the terms and conditions of the Creative Commons Attribution (CC BY) license (http://creativecommons.org/licenses/by/4.0/).