Determining Optimal Solar Power Plant Locations Based on Remote Sensing and GIS Methods: A Case Study from Croatia


Abstract
1. Introduction
2. Materials and Methods
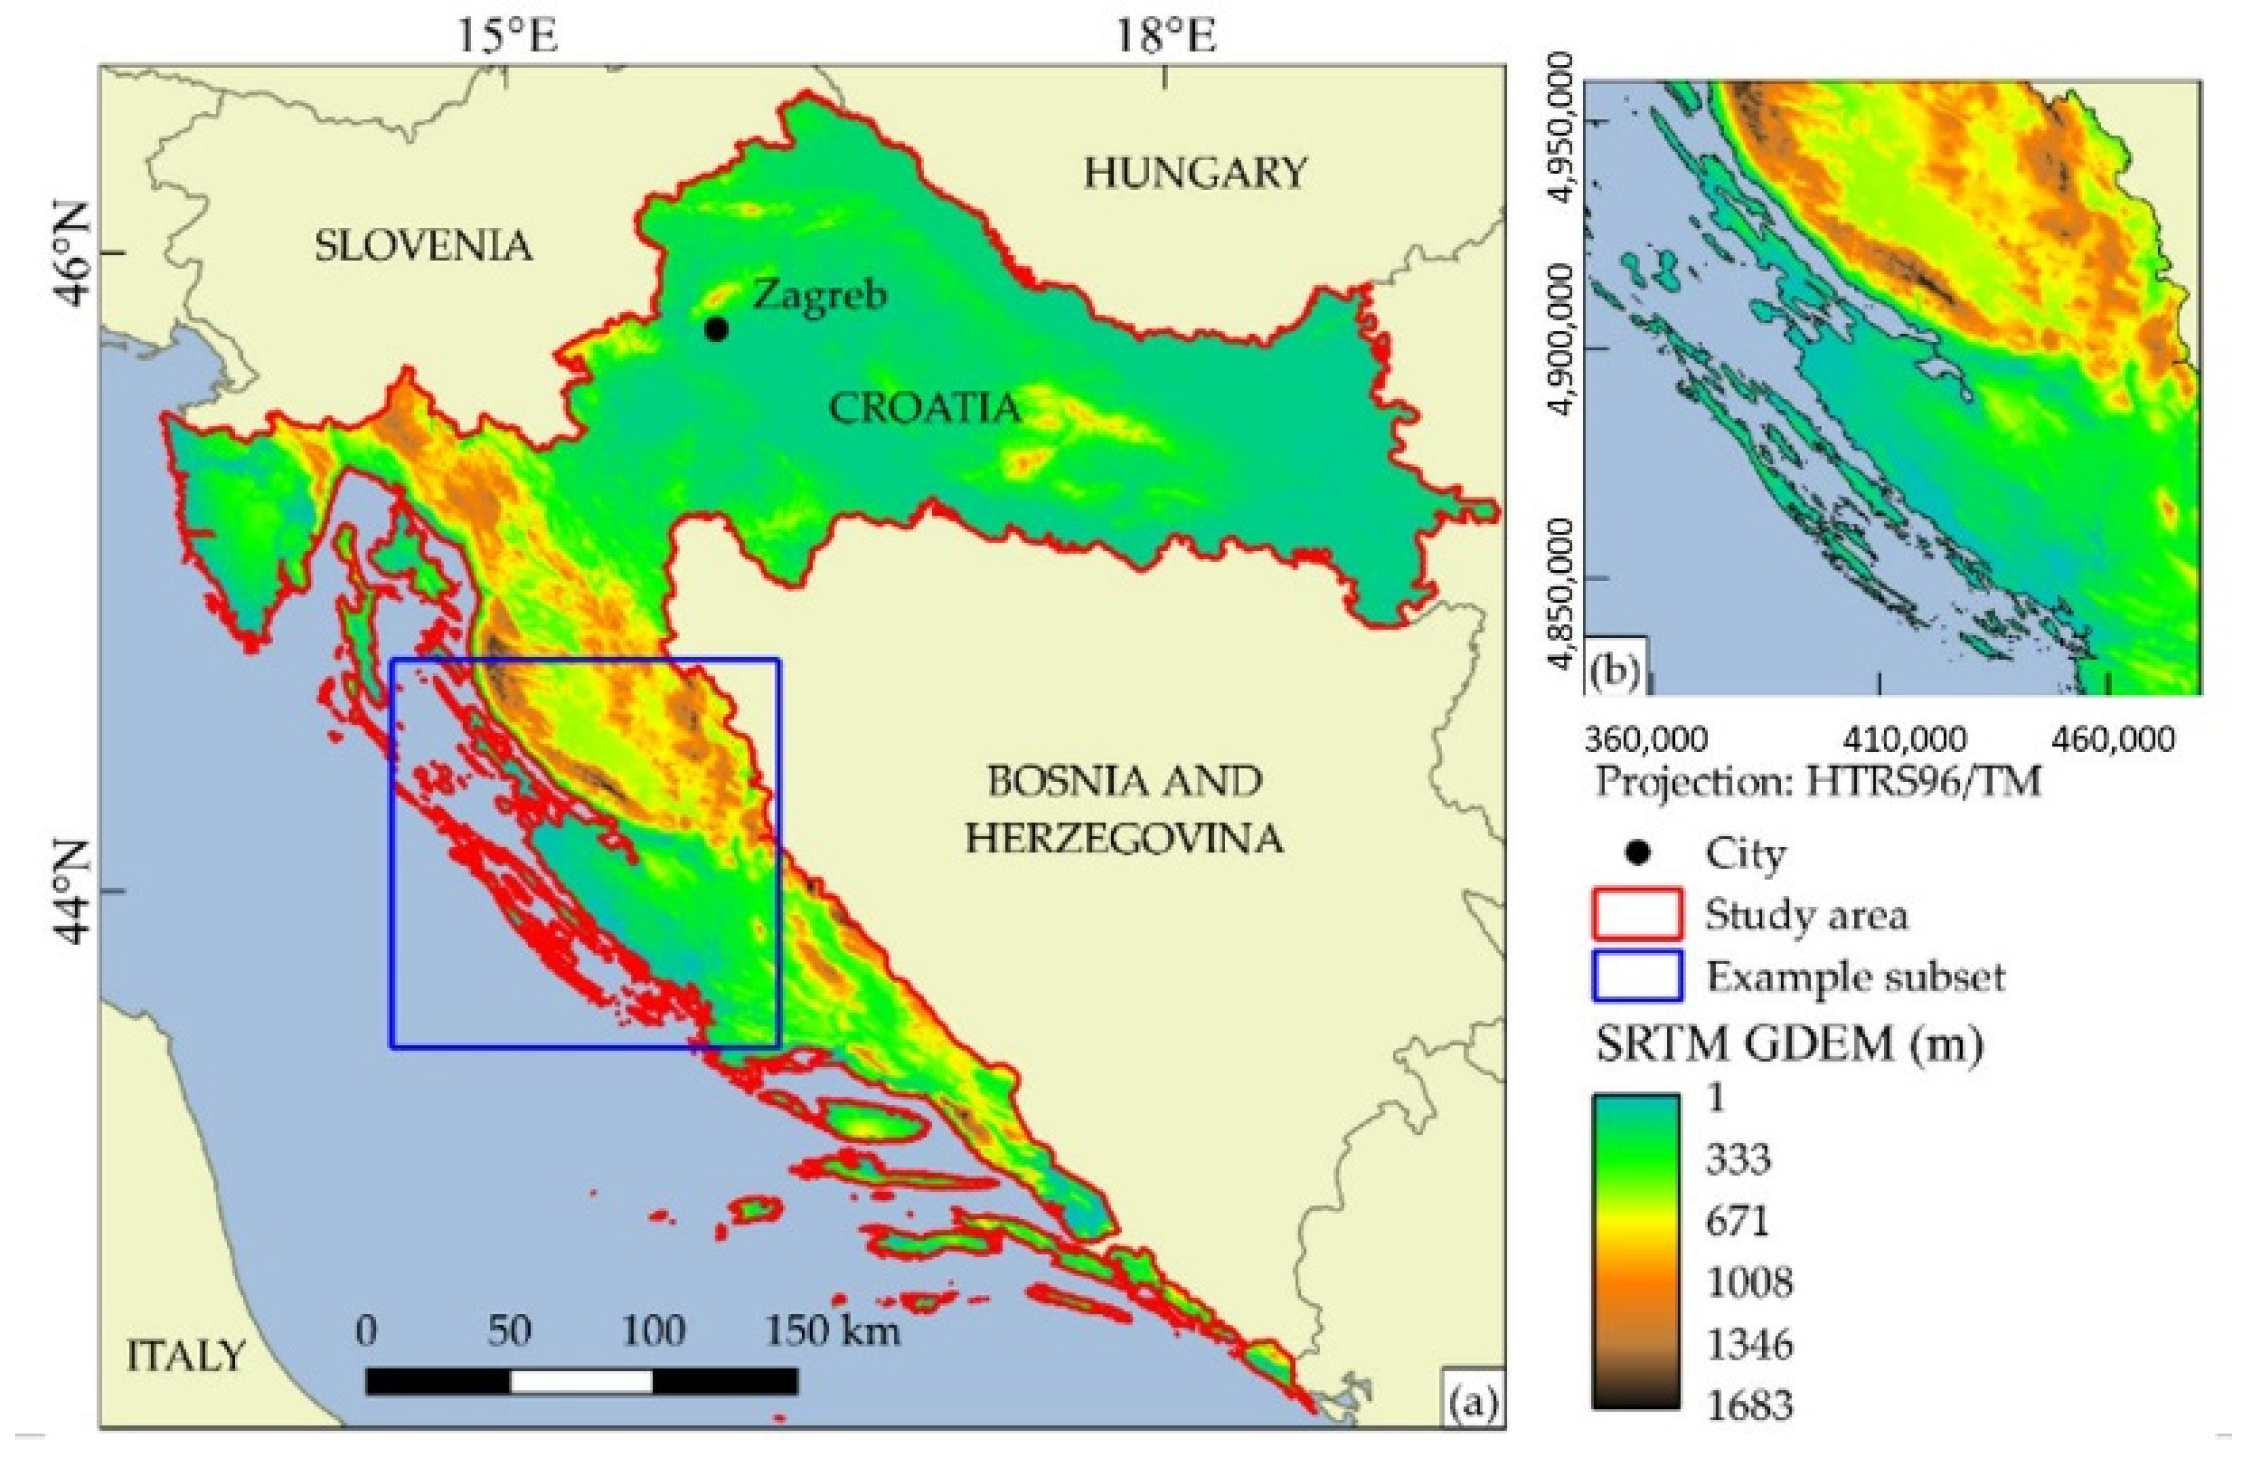
2.1. Study Area
2.2. Integration of GIS and MCDM
- Multi-attribute decision making (MADM); and
- Multi-objective decision making (MODM).
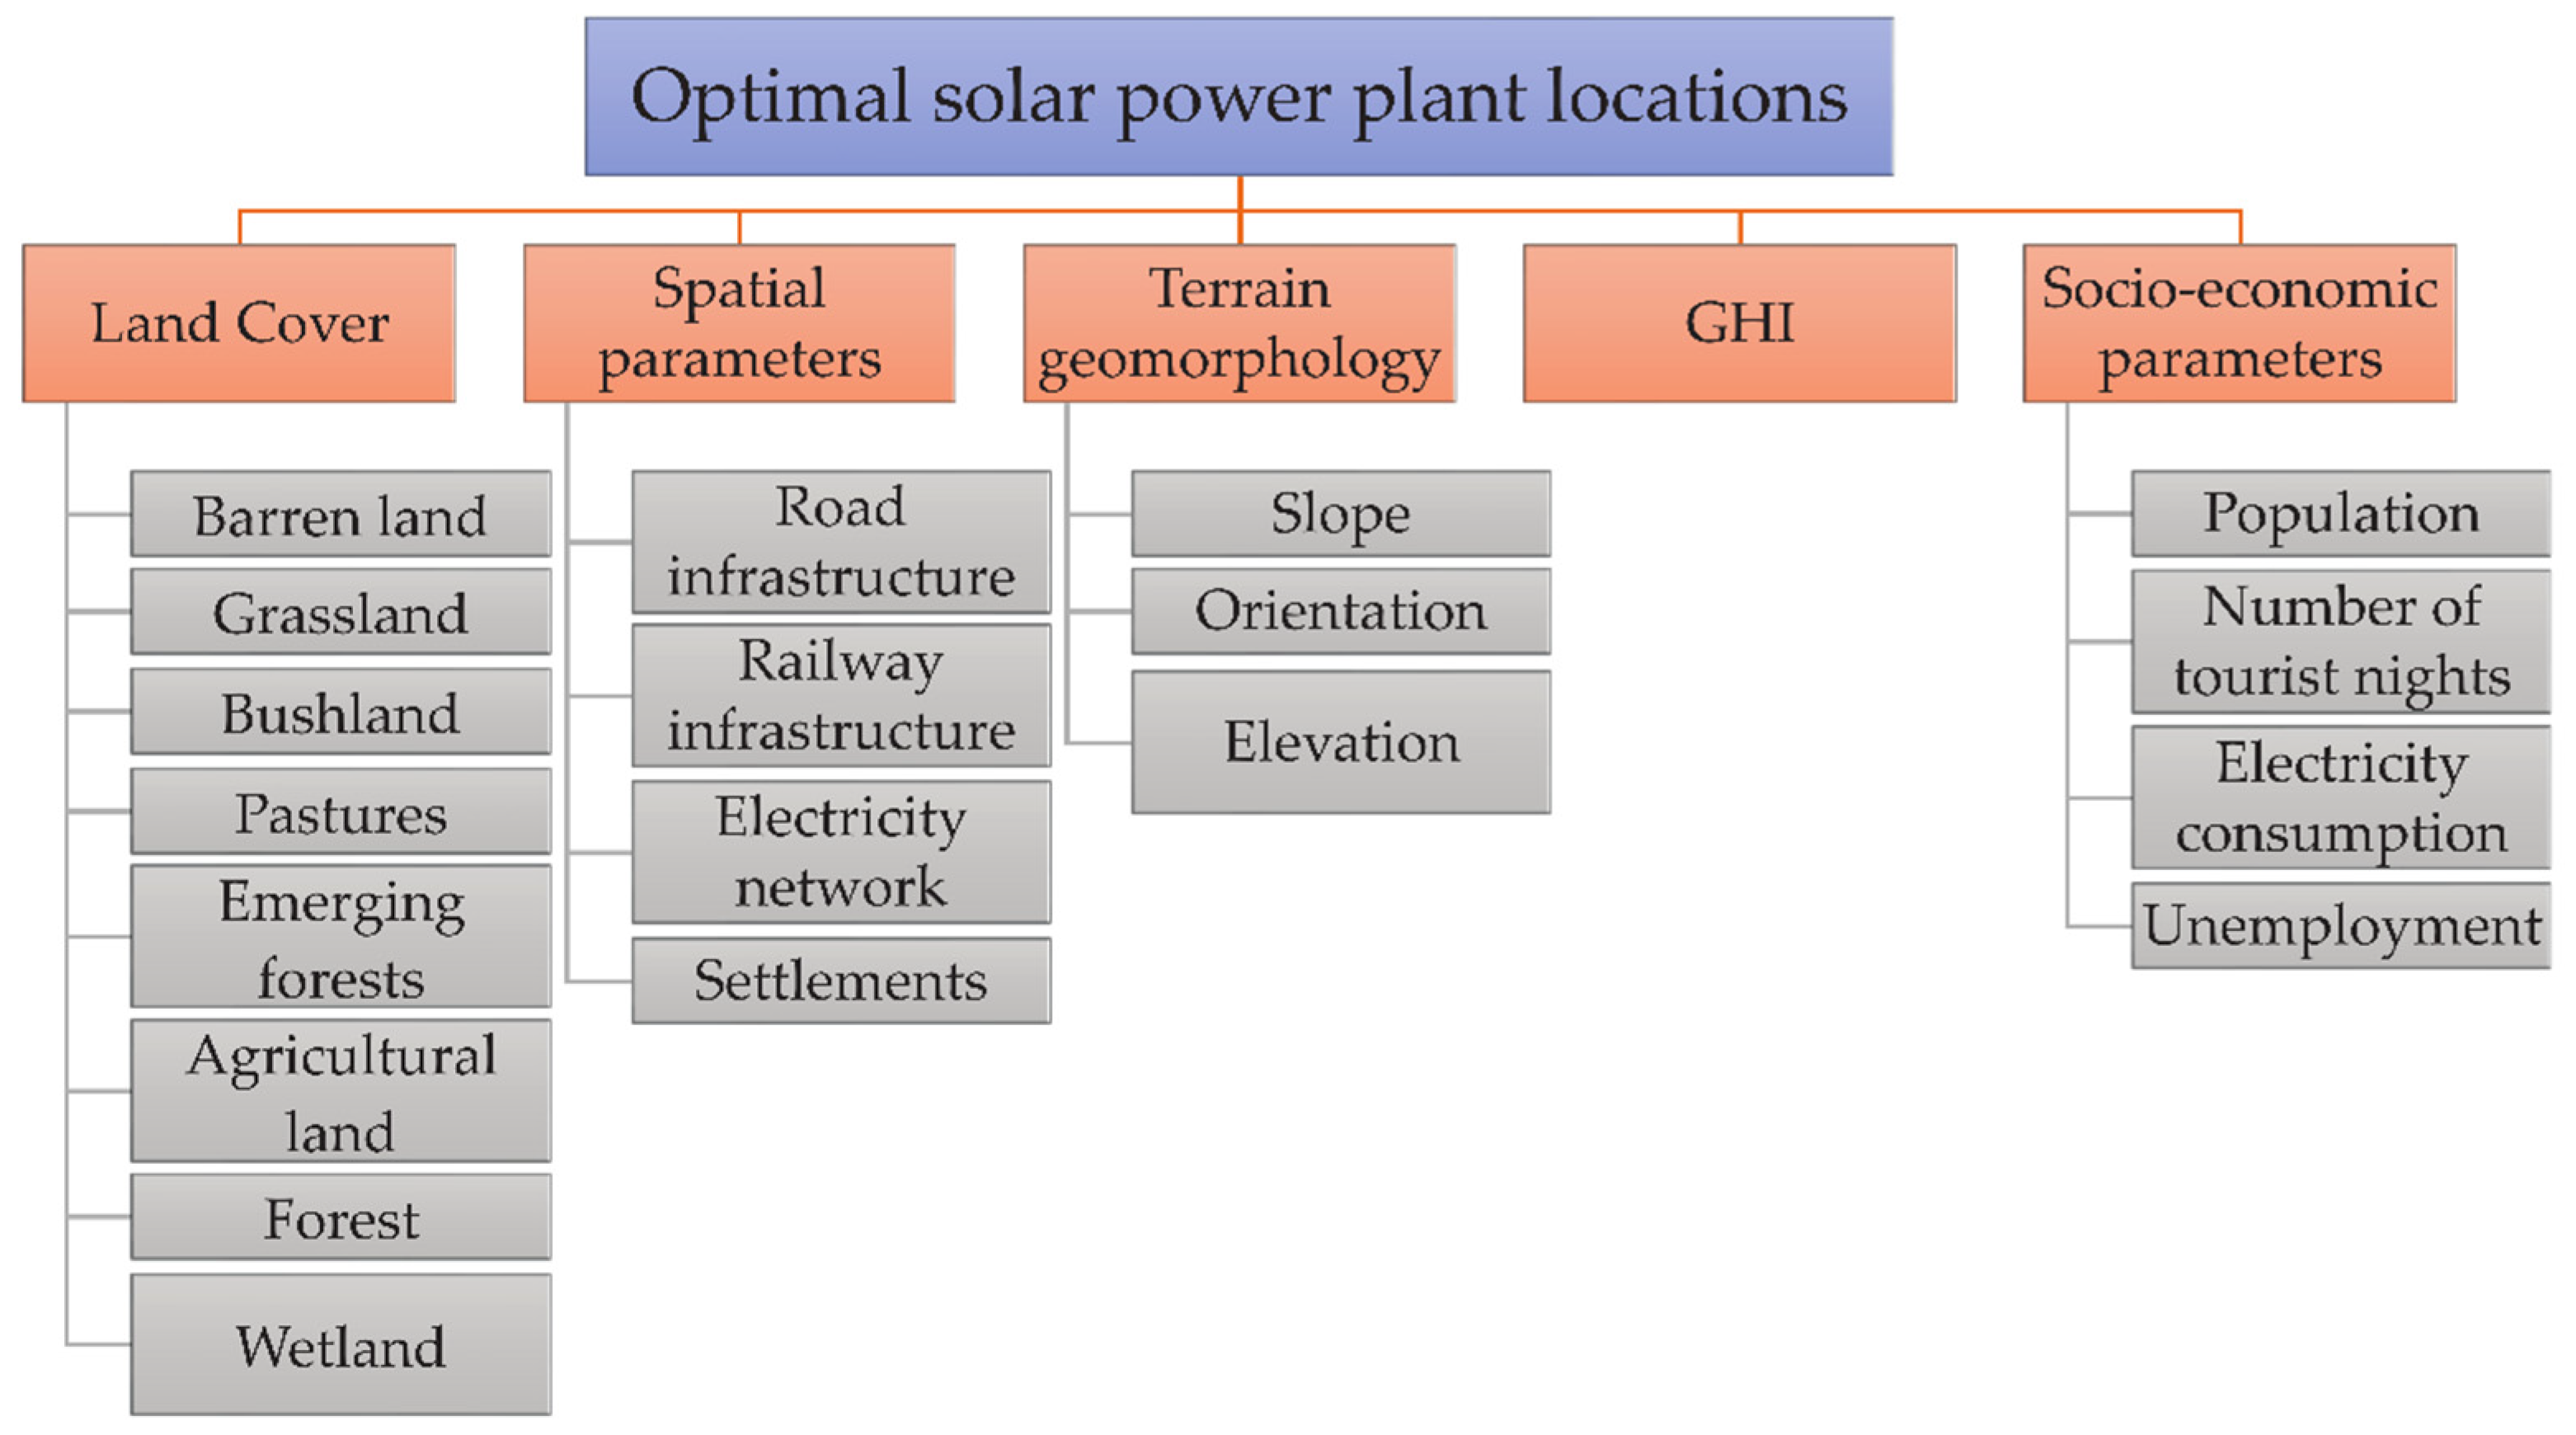
2.3. Determination of Research Parameters
- Climate;
- Geomorphological;
- Spatial; and
- Environmental.
- —population number;
- —number of tourist nights;
- —average annual electricity consumption in Croatia;
- —population number in Croatia; and
- —administrative unit.
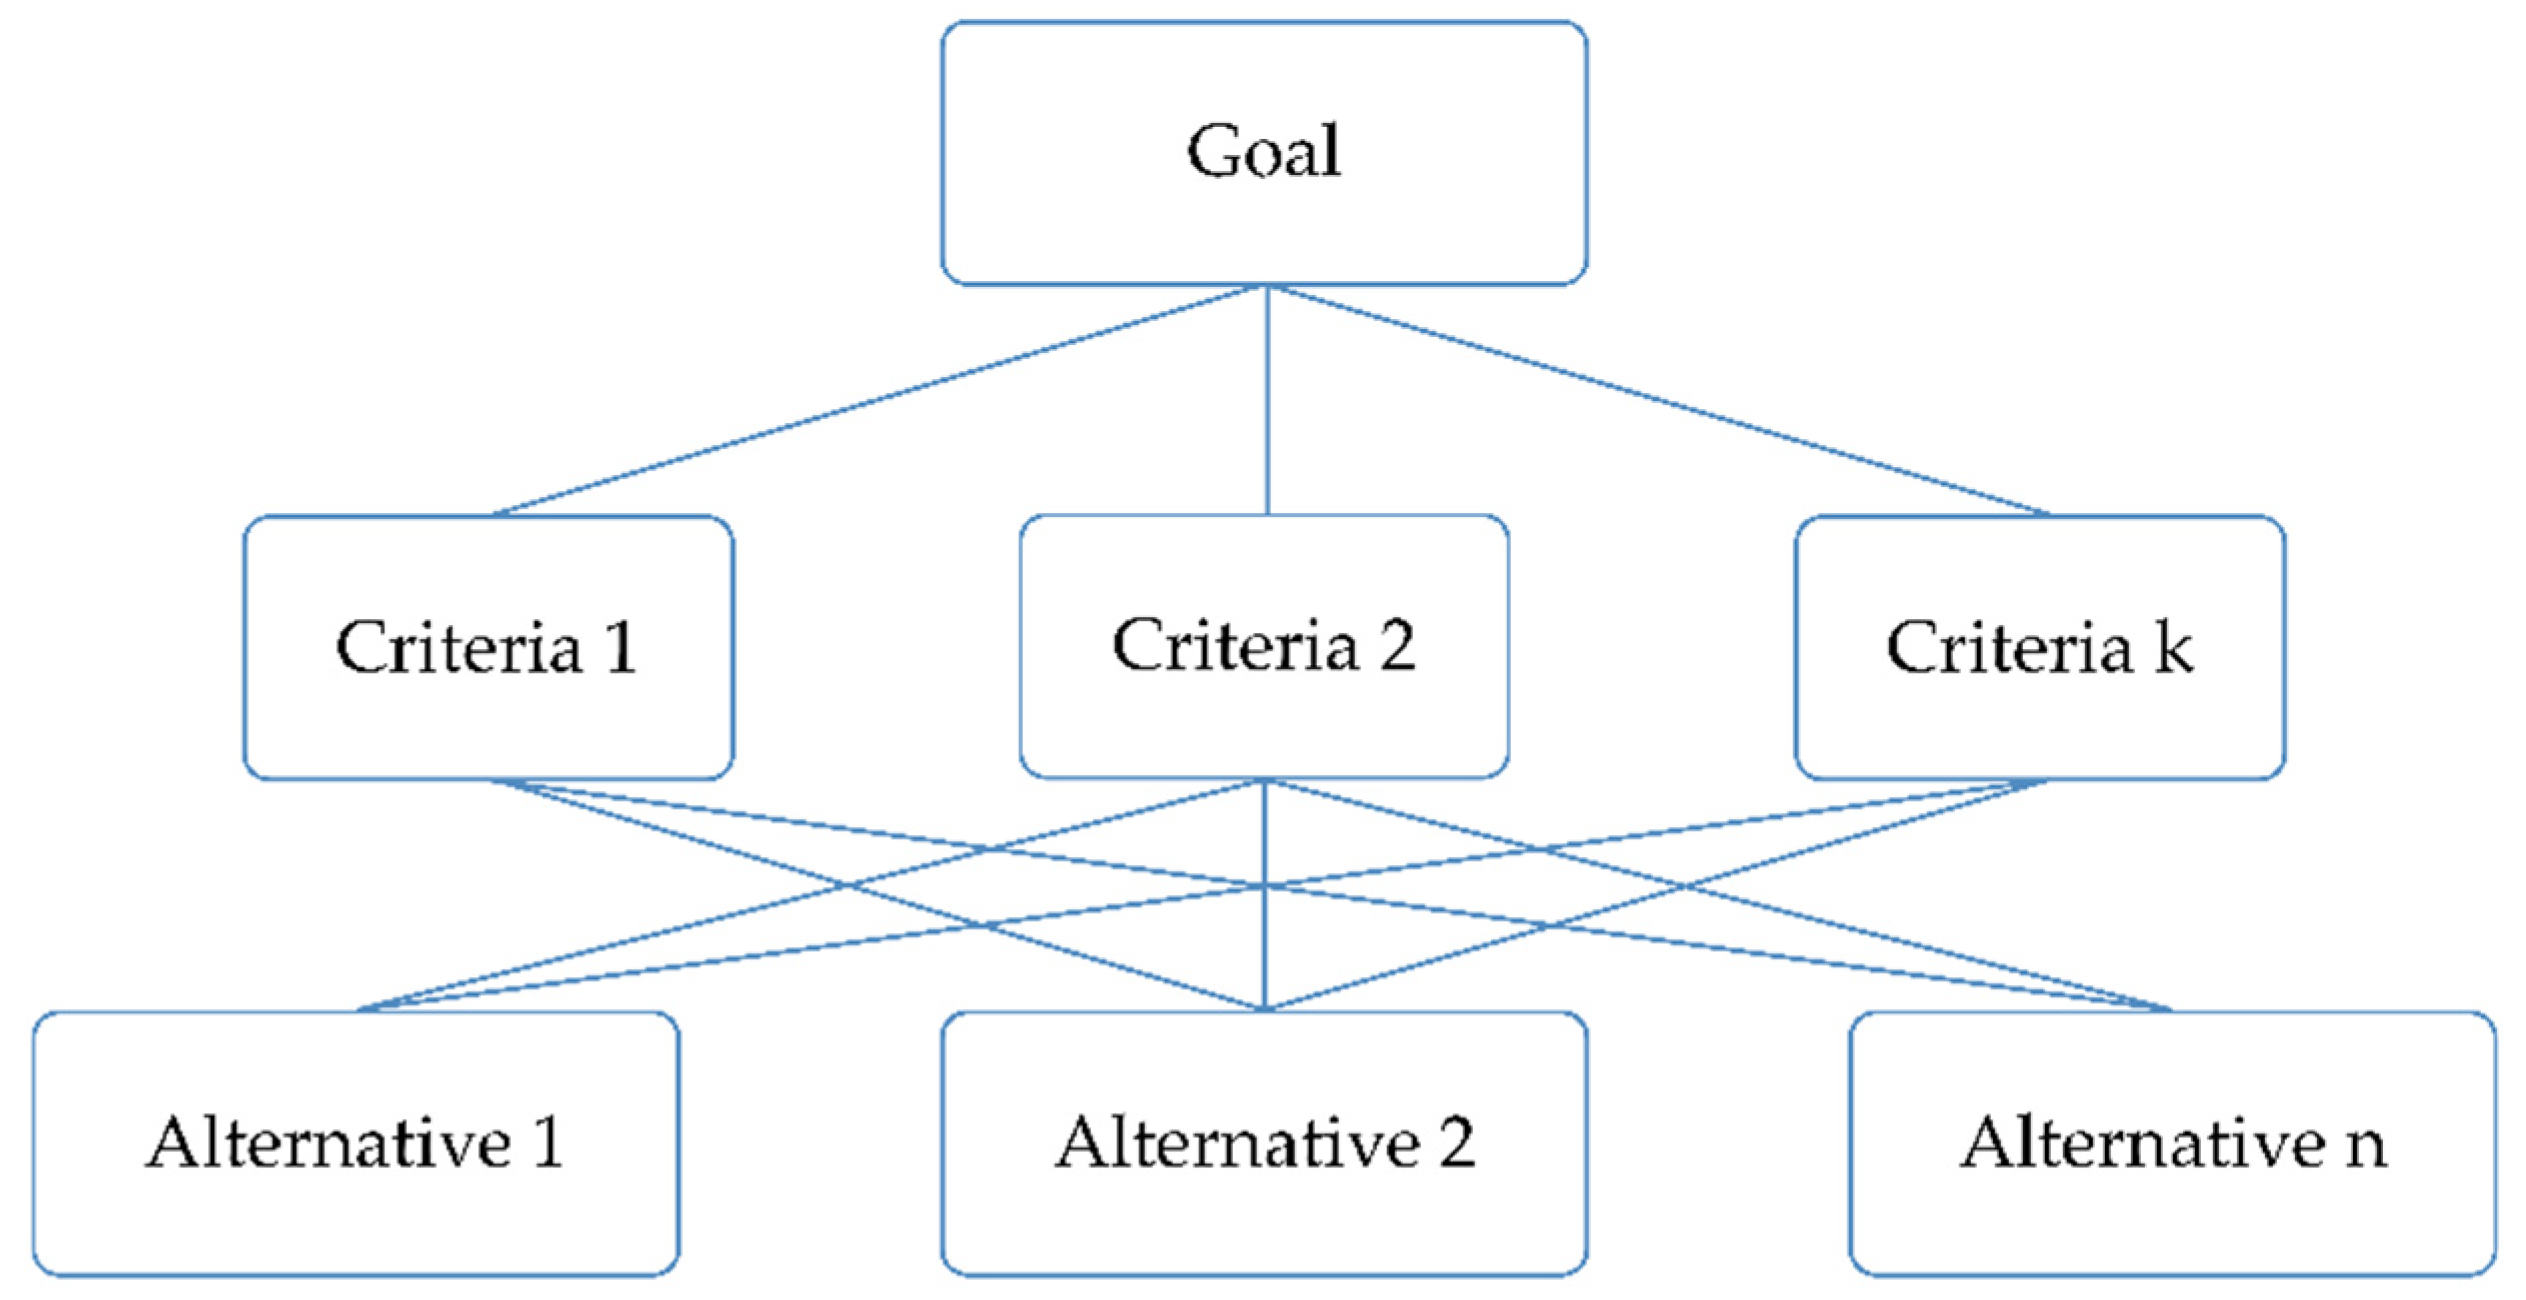
2.4. Determination of Weight Coefficients of Parameters with AHP
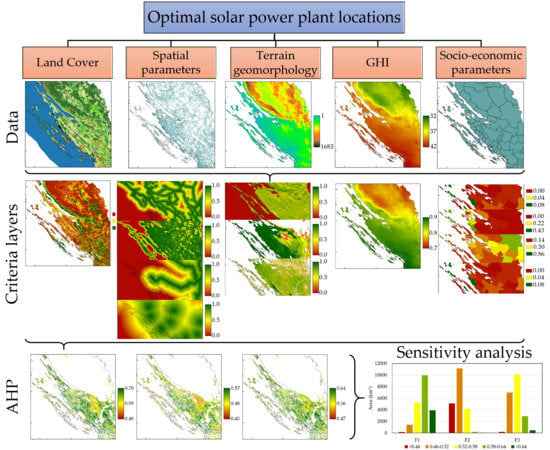
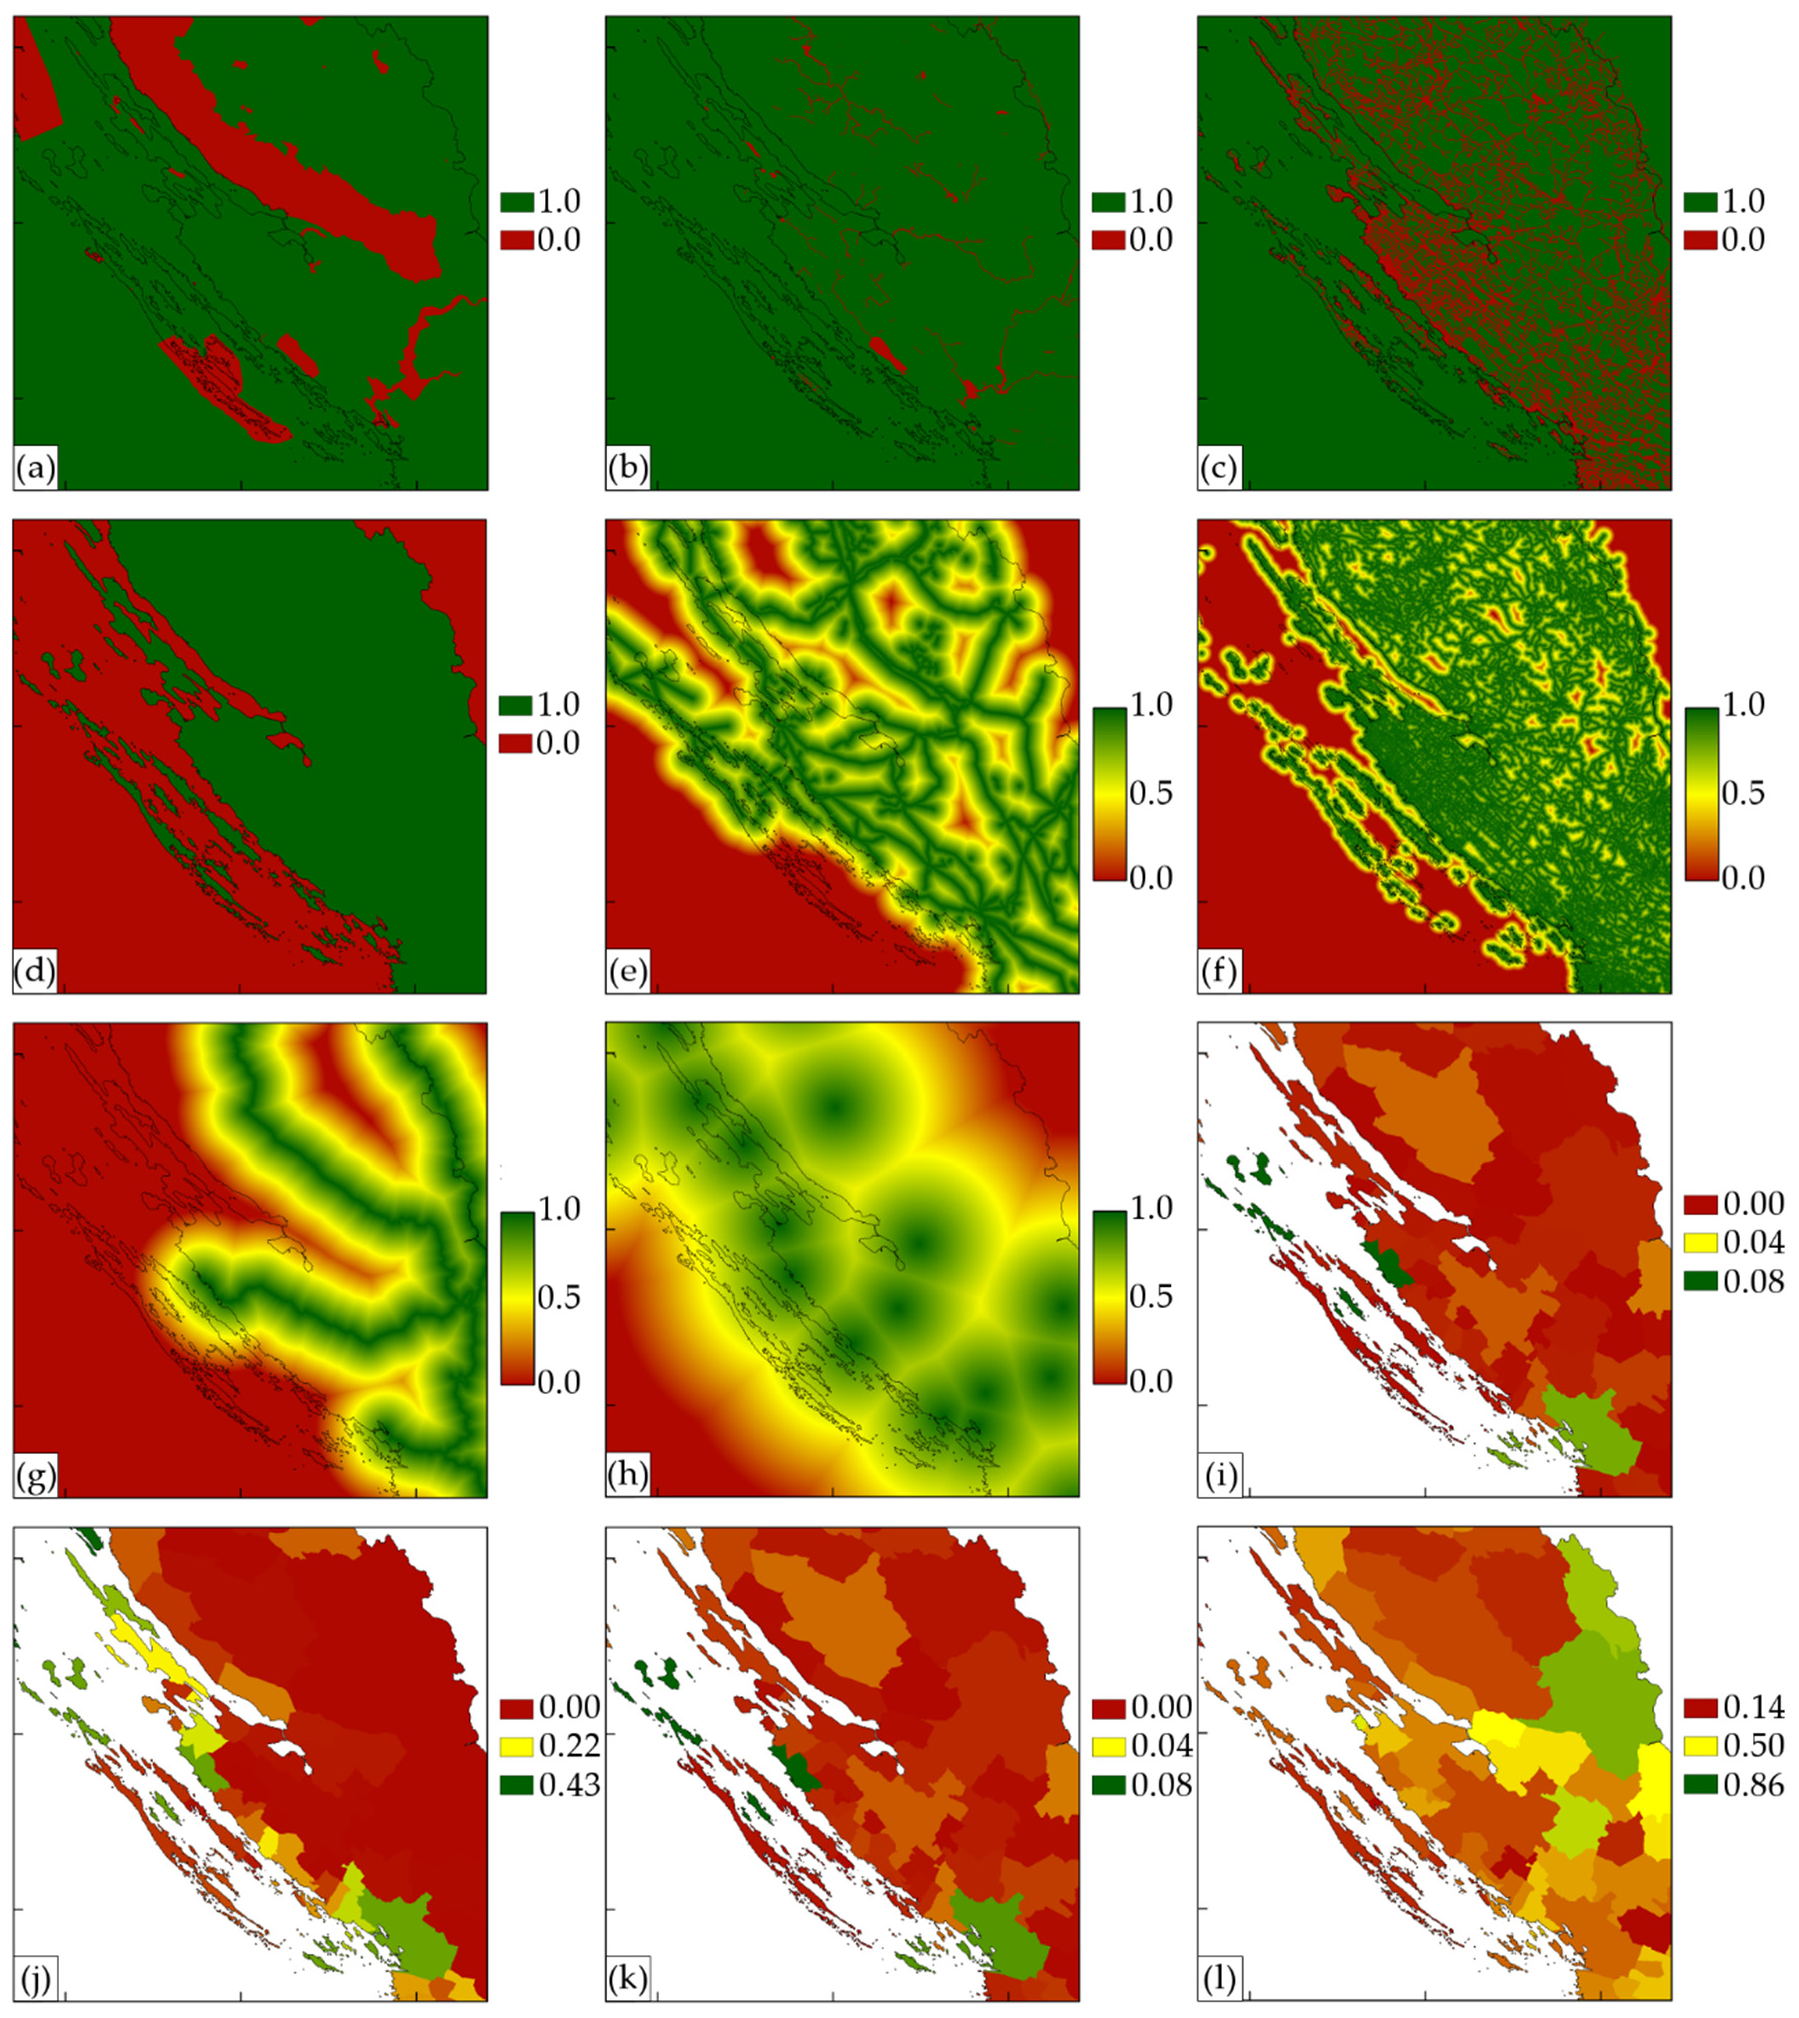
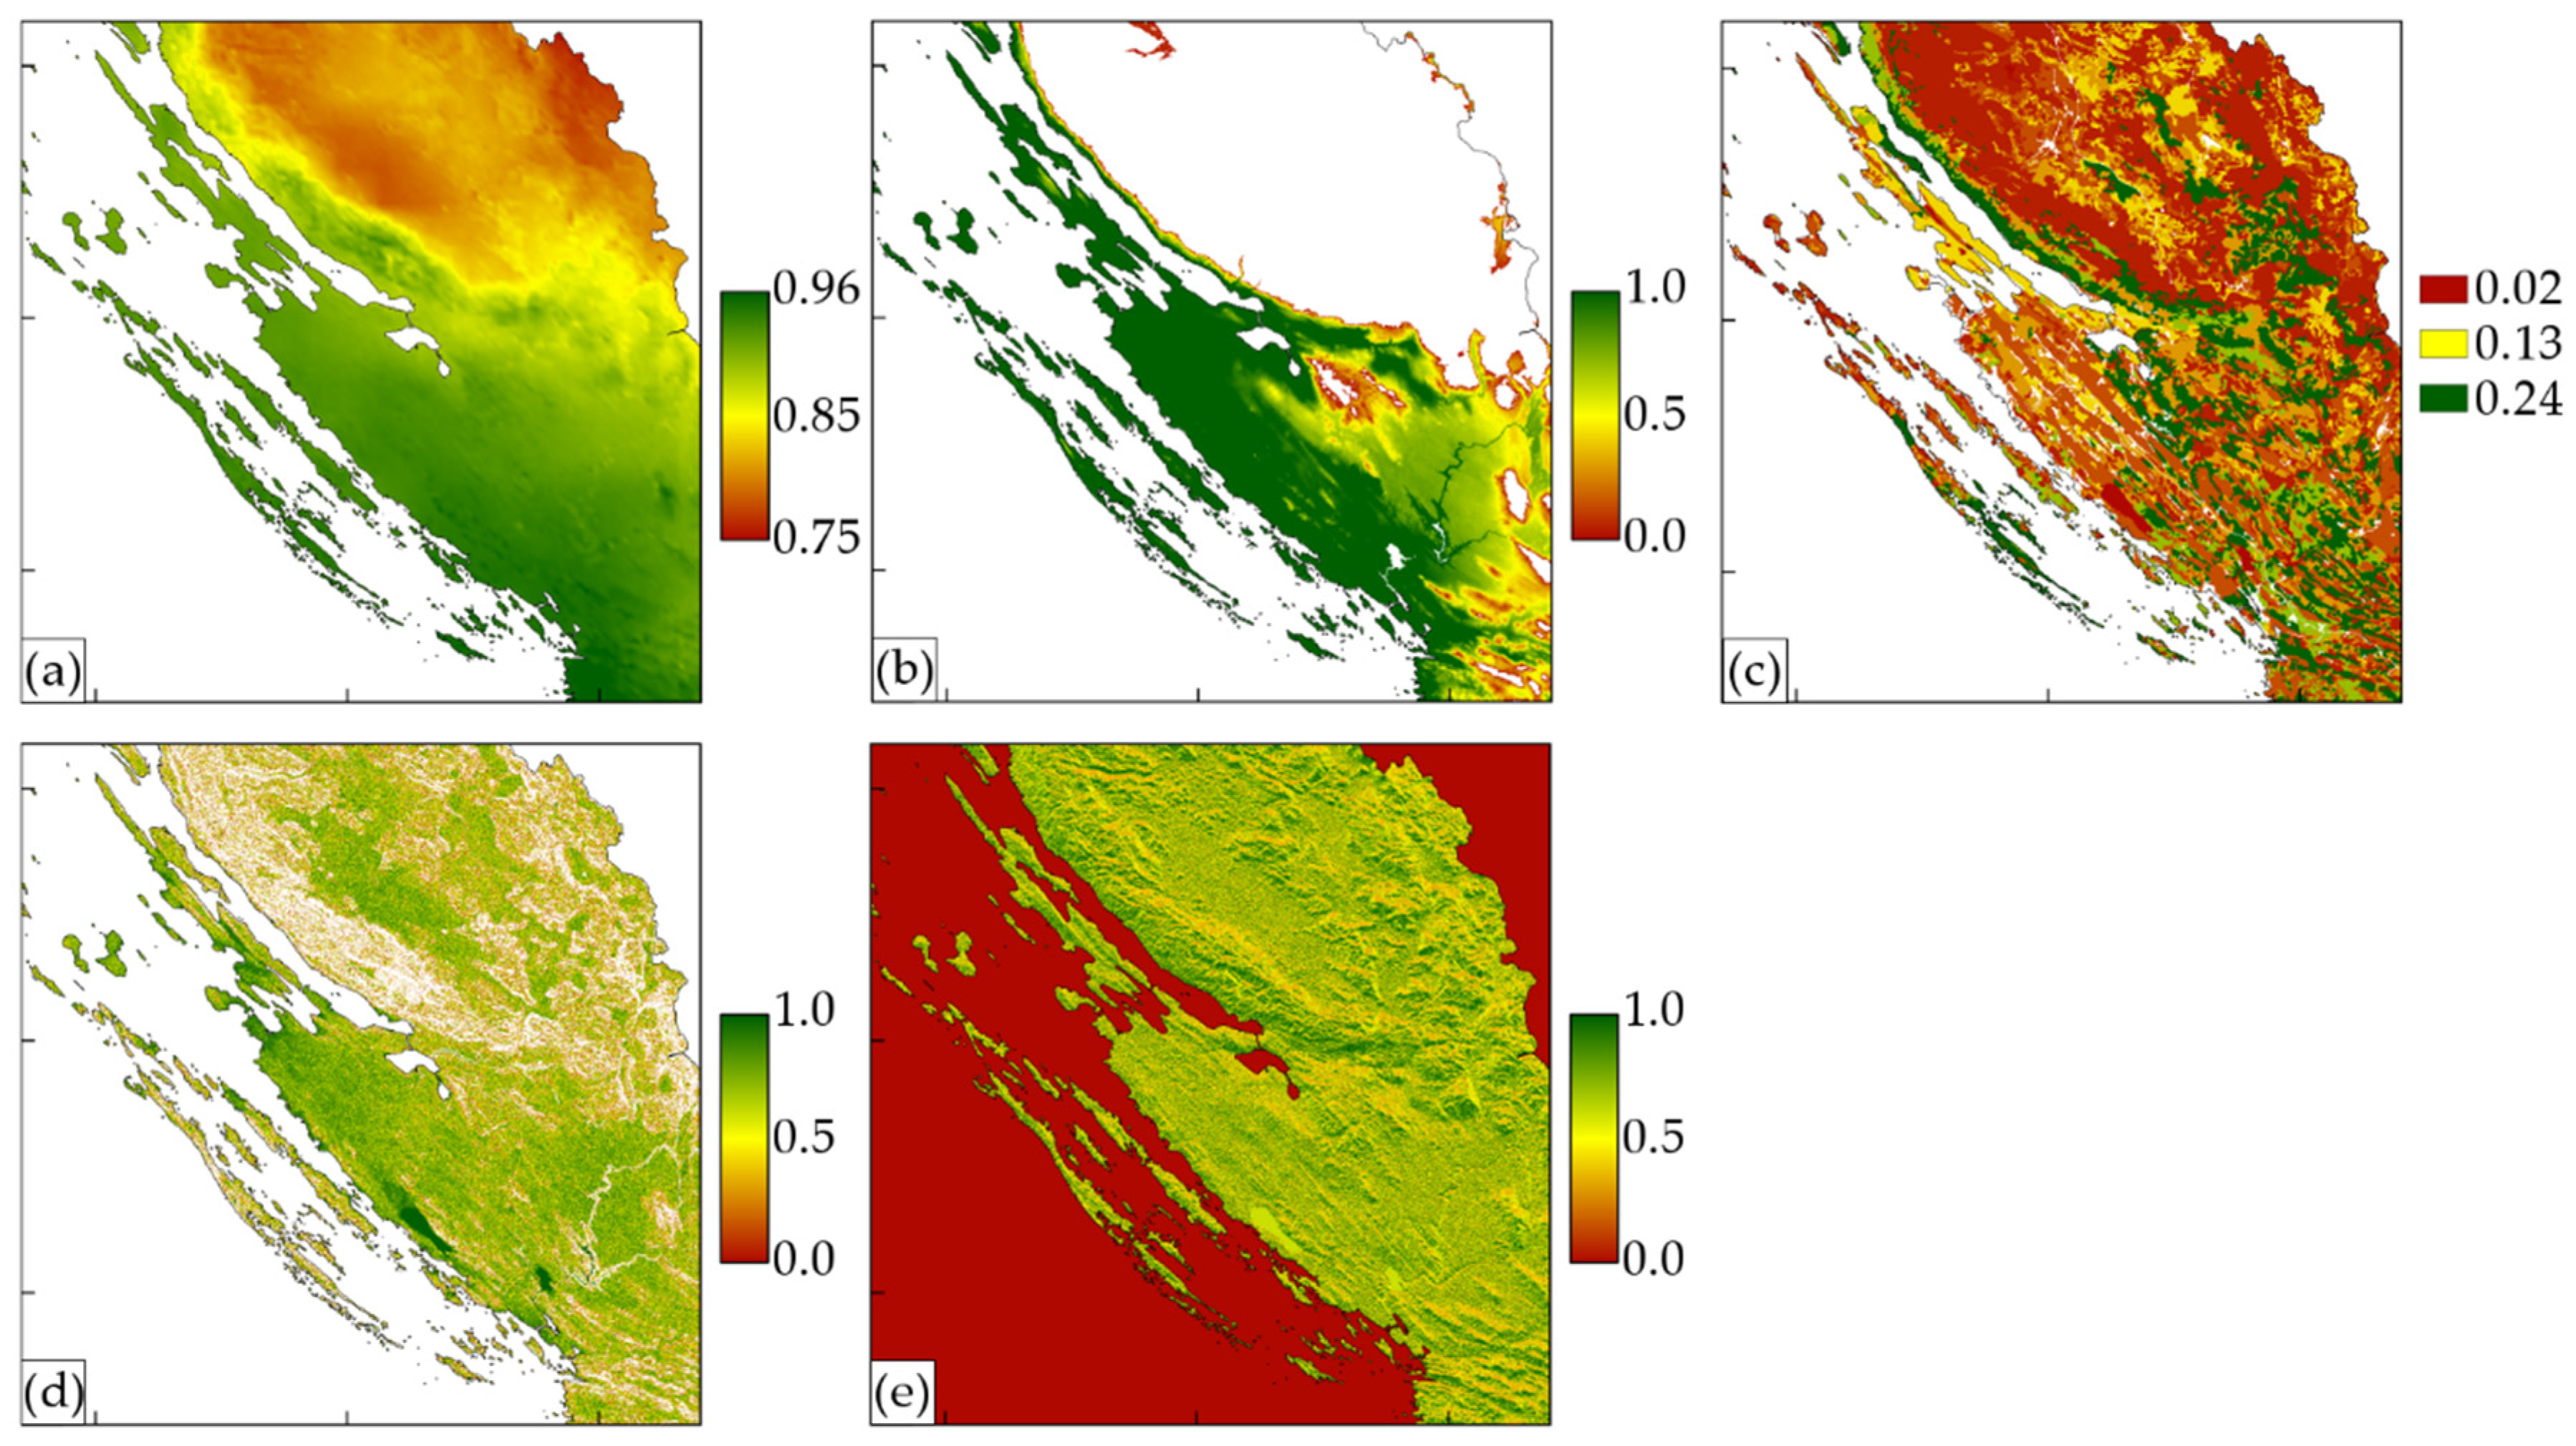
3. Results
- —GHI;
- —land cover;
- —slope;
- —orientation;
- —elevation;
- —distance to settlements;
- —distance to electricity network;
- —distance to road infrastructure;
- —distance to railway infrastructure;
- —electricity consumption;
- —population;
- —number of tourist nights; and
- —unemployment.
4. Discussion
5. Conclusions
Author Contributions
Funding
Acknowledgments
Conflicts of Interest
Appendix A

| Sub-Criteria | Settlements | Electricity Network | Road Infrastructure | Railway Infrastructure | Weight Coefficient |
|---|---|---|---|---|---|
| Settlements | 1 | 0.333 | 1 | 7 | 0.220 |
| Electricity network | 3 | 1 | 3 | 9 | 0.529 |
| Road infrastructure | 1 | 0.333 | 1 | 6 | 0.209 |
| Railway infrastructure | 0.143 | 0.111 | 0.167 | 1 | 0.042 |
| λ = 4.107 | Cl = 0.036 | CR = 0.040 | |||
| Sub-Criteria | Barren Land | Grassland | Bushland | Pastures | Emerging Forests | Agricultural Land | Forest | Wetland | Weight Coefficient |
|---|---|---|---|---|---|---|---|---|---|
| Barren land | 1 | 2 | 2 | 3 | 5 | 7 | 9 | 9 | 0.300 |
| Grassland | 0.5 | 1 | 2 | 3 | 5 | 6 | 7 | 9 | 0.239 |
| Bushland | 0.5 | 0.5 | 1 | 2 | 3 | 5 | 7 | 9 | 0.173 |
| Pastures | 0.333 | 0.333 | 0.5 | 1 | 2 | 3 | 5 | 7 | 0.110 |
| Emerging forests | 0.2 | 0.2 | 0.333 | 0.5 | 1 | 3 | 5 | 7 | 0.083 |
| Agricultural land | 0.143 | 0.167 | 0.2 | 0.333 | 0.333 | 1 | 3 | 5 | 0.049 |
| Forest | 0.111 | 0.143 | 0.143 | 0.2 | 0.2 | 0.333 | 1 | 3 | 0.028 |
| Wetland | 0.111 | 0.111 | 0.111 | 0.143 | 0.143 | 0.2 | 0.333 | 1 | 0.018 |
| λ = 8.704 | Cl = 0.101 | CR = 0.071 | |||||||
| Sub-criteria | Slope | Orientation | Elevation | Weight Coefficient |
|---|---|---|---|---|
| Slope | 1 | 3 | 5 | 0.633 |
| Orientation | 0.333 | 1 | 3 | 0.260 |
| Elevation | 0.2 | 0.333 | 1 | 0.106 |
| λ = 3.055 | Cl = 0.028 | CR = 0.048 | ||
| Sub-Criteria | Electricity Consumption | Population | Number of Tourist Nights | Unemployment | Weight Coefficient |
|---|---|---|---|---|---|
| Electricity consumption | 1 | 2 | 3 | 9 | 0.489 |
| Population | 0.5 | 1 | 1 | 7 | 0.246 |
| Number of tourist nights | 0.333 | 1 | 1 | 7 | 0.225 |
| Unemployment | 0.111 | 0.143 | 0.143 | 1 | 0.040 |
| λ = 4.093 | Cl = 0.031 | CR = 0.034 | |||
References
- UNFCCC. Adoption of the Paris Agreement, FCCC/CP/2015/Add.1; United Nations Framework Convention on Climate Change: Paris, France, 2015. [Google Scholar]
- Camargo, L.R.; Zink, R.; Dorner, W.; Stoeglehner, G. Spatio-temporal modeling of roof-top photovoltaic panels for improved technical potential assessment and electricity peak load offsetting at the municipal scale. Comput. Environ. Urban Syst. 2015, 52, 58–69. [Google Scholar] [CrossRef]
- Liang, J.; Gong, J.; Zhou, J.; Ibrahim, A.N.; Li, M. An open-source 3D solar radiation model integrated with a 3D Geographic Information System. Environ. Model. Softw. 2015, 64, 94–101. [Google Scholar] [CrossRef]
- Šúri, M.; Hofierka, J. A new GIS-based solar radiation model and its application to photovoltaic assessments. Trans. GIS 2004, 8, 175–190. [Google Scholar] [CrossRef]
- Martins, F.R.; Pereira, E.B.; Abreu, S.L. Satellite-derived solar resource maps for Brazil under SWERA project. Sol. Energy 2007, 81, 517–528. [Google Scholar] [CrossRef]
- Amillo, A.G.; Huld, T.; Müller, R. A new database of global and direct solar radiation using the eastern meteosat satellite, models and validation. Remote Sens. 2014, 6, 8165–8189. [Google Scholar] [CrossRef]
- Huld, T. PVMAPS: Software tools and data for the estimation of solar radiation and photovoltaic module performance over large geographical areas. Sol. Energy 2017, 142, 171–181. [Google Scholar] [CrossRef]
- Hofierka, J.; Šúri, M. The solar radiation model for Open source GIS: Implementation and applications. In Proceedings of the Open Source GIS-GRASS Users Conference, Trento, Italy, 11–13 September 2002; pp. 51–70. [Google Scholar]
- Hofierka, J.; Kaňuk, J.; Gallay, M. The spatial distribution of photovoltaic power plants in relation to solar resource potential: The case of the Czech Republic and Slovakia. Morav. Geogr. Rep. 2014, 22, 26–33. [Google Scholar] [CrossRef]
- Gašparović, I.; Gašparović, M.; Medak, D. Determining and analysing solar irradiation based on freely available data: A case study from Croatia. Environ. Dev. 2018, 26, 55–67. [Google Scholar] [CrossRef]
- Sanchez-Lozano, J.M.; Teruel-Solan, J.; Soto-Elvira, P.L.; Socorro García-Cascales, M. Geographical Information Systems (GIS) and Multi-Criteria Decision Making (MCDM) methods for the evaluation of solar farms locations: Case study in southeastern Spain. Renew. Sustain. Energy Rev. 2013, 24, 544–556. [Google Scholar] [CrossRef]
- Uyan, M. GIS-based solar farms site selection using analytic hierarchy process (AHP) in Karapinar region, Konya/Turkey. Renew. Sustain. Energy Rev. 2013, 28, 11–17. [Google Scholar] [CrossRef]
- Asakereh, A.; Omid, M.; Alimardani, R.; Sarmadian, F. Developing a GIS-based Fuzzy AHP Model for Selecting Solar Energy Sites in Shodirwan Region in Iran. Int. J. Adv. Sci. Technol. 2014, 68, 37–48. [Google Scholar] [CrossRef]
- Tahri, M.; Hakdaoui, M.; Maanan, M. The evaluation of solar farm locations applying Geographic Information System and Multi-Criteria Decision-Making methods: Case study in southern Morocco. Renew. Sustain. Energy Rev. 2015, 51, 1354–1362. [Google Scholar] [CrossRef]
- Georgiou, A.G.; Skarlatos, D. Optimal site selection for sitting a solar park using multi-criteria decision analysis and geographical information systems. Geosci. Instrum. Methods 2016, 5, 321–332. [Google Scholar] [CrossRef]
- Weng, Q. Remote Sensing and GIS Integration: Theories, Methods, and Applications: Theory, Methods, and Applications; McGraw-Hill Education: New York, NY, USA, 2009. [Google Scholar]
- Broesamle, H.; Mannstein, H.; Schillings, C.; Trieb, F. Assessment of solar electricity potentials in North Africa based on satellite data and a geographic information system. Sol. Energy 2001, 70, 1–12. [Google Scholar] [CrossRef]
- Fluri, T. The potential of concentrating solar power in South Africa. Energy Policy 2009, 37, 5075–5080. [Google Scholar] [CrossRef]
- Clifton, J.; Boruff, B.J. Assessing the potential for concentrated solar power development in rural Australia. Energy Policy 2010, 38, 5272–5280. [Google Scholar] [CrossRef]
- Lehman, R.G. Concentrated Solar Thermal Facilities: A GIS Approach for Land Planning. Master’s Thesis, University of Southern California, Los Angeles, CA, USA, May 2011. [Google Scholar]
- Gade, P.K.; Osuri, M. Evaluation of Multi Criteria Decision Making Methods for Potential Use in Application Security. Master’s Thesis, School of Computing Blekinge Institute of Technology, Karlskrona, Sweden, May 2014. [Google Scholar]
- Triantaphyllou, E. Multi-Criteria Decision Making Methods: A Comparative Study; Kluwer Academic Publishers: Dordrecht, The Netherlands, 2000. [Google Scholar]
- Jankowski, P. Integrating geographical information systems and multiple criteria decision-making methods. Int. J. Geogr. Inf. Sci. 1995, 9, 251–273. [Google Scholar] [CrossRef]
- Kumar, A.; Sah, B.; Singh, A.R.; Deng, Y.; He, X.; Kumar, P.; Bansal, R.C. A review of multi criteria decision making (MCDM) towards sustainable renewable energy development. Renew. Sustain. Energy Rev. 2017, 69, 596–609. [Google Scholar] [CrossRef]
- Ramanathan, R.; Ganesh, L. Energy resource allocation incorporating qualitative and quantitative criteria: An integrated model using goal programming and AHP. Socioecon. Plan. Sci. 1995, 29, 197–218. [Google Scholar] [CrossRef]
- Ishizaka, A.; Labib, A. Analytic hierarchy process and expert choice: Benefits and limitations. OR Insight 2009, 22, 201–220. [Google Scholar] [CrossRef]
- Saaty, T.L. Decision making with the analytic hierarchy process. Int. J. Serv. Sci. 2008, 1, 83–98. [Google Scholar] [CrossRef]
- Saaty, T.L.; Vargas, L.G. Models, Methods, Concepts & Applications of the Analytic Hierarchy Process; Kluwer Academic Publishers: Boston, MA, USA, 2000. [Google Scholar]
- Srđević, B.; Suvočarev, K.; Srđević, Z. Analitički hijerarhijski proces: Individualna i grupna konzistentnost donosilaca odluka. Vodoprivreda 2009, 41, 13–21. [Google Scholar]
- Cameron, D.R.; Cohen, B.S.; Morrison, S.A. An approach to enhance the conservation-compatibility of solar energy development. PLoS ONE 2012, 7, e38437. [Google Scholar] [CrossRef] [PubMed]
- Gašparović, I. Geospatial Analysis of Solar Energy Potential in the Republic of Croatia Using Multi-Criteria Decision Making. Ph.D. Thesis, University of Zagreb, Zagreb, Croatia, November 2018. [Google Scholar]


| Intensity of Importance | Definition | Explanation |
|---|---|---|
| 1 | Equal importance | Two activities contribute equally to the objective |
| 3 | Moderate importance | Experience and judgment slightly favour one activity over another |
| 5 | Strong importance | Experience and judgment strongly favour one activity over another |
| 7 | Very strong or demonstrated importance | An activity is favoured very strongly over another; its dominance demonstrated in practice |
| 9 | Extreme importance | The evidence favouring one activity over another is of the highest possible order of affirmation |
| 2, 4, 6, 8 | Intermediate values | |
| Reciprocals of above | In the case of reverse comparison of the relationship between the elements, reciprocal values are assigned to the intensity of importance |
| Constraint Parameter | Type of Parameter | Criteria |
|---|---|---|
| Built-up areas | Environmental | < 100 m |
| Water bodies | Spatial | < 100 m |
| Protected areas (archaeological sites, military zones, forest areas, animal protection areas, biologically important areas) | Spatial/ Environmental | < 100 m |
| Parameter | Type of Parameter | Criteria |
|---|---|---|
| Distance to settlements | Spatial | < 50,000 m |
| Distance to road infrastructure | Spatial | < 3000 m |
| Distance to railway infrastructure | Spatial | < 20,000 m |
| Distance to the electricity network | Spatial | < 10,000 m |
| Land Cover | Environmental | Barren land, grasslands, bushland, pastures, emerging forests, agricultural land, forest, wetland |
| Slope | Geomorphological | < 25% |
| Orientation | Geomorphological | North = 0.3 East, West = 0.6 South = 1 |
| Elevation | Geomorphological | < 150 m 150 m–500 m |
| GHI | Climate | Max = 1 Min = 0 |
| Population | Socioeconomic | Max = 1 Min = 0 |
| Number of tourist nights | Socioeconomic | Max = 1 Min = 0 |
| Electricity consumption | Socioeconomic | Max = 1 Min = 0 |
| Unemployment | Socioeconomic | Max = 1 Min = 0 |
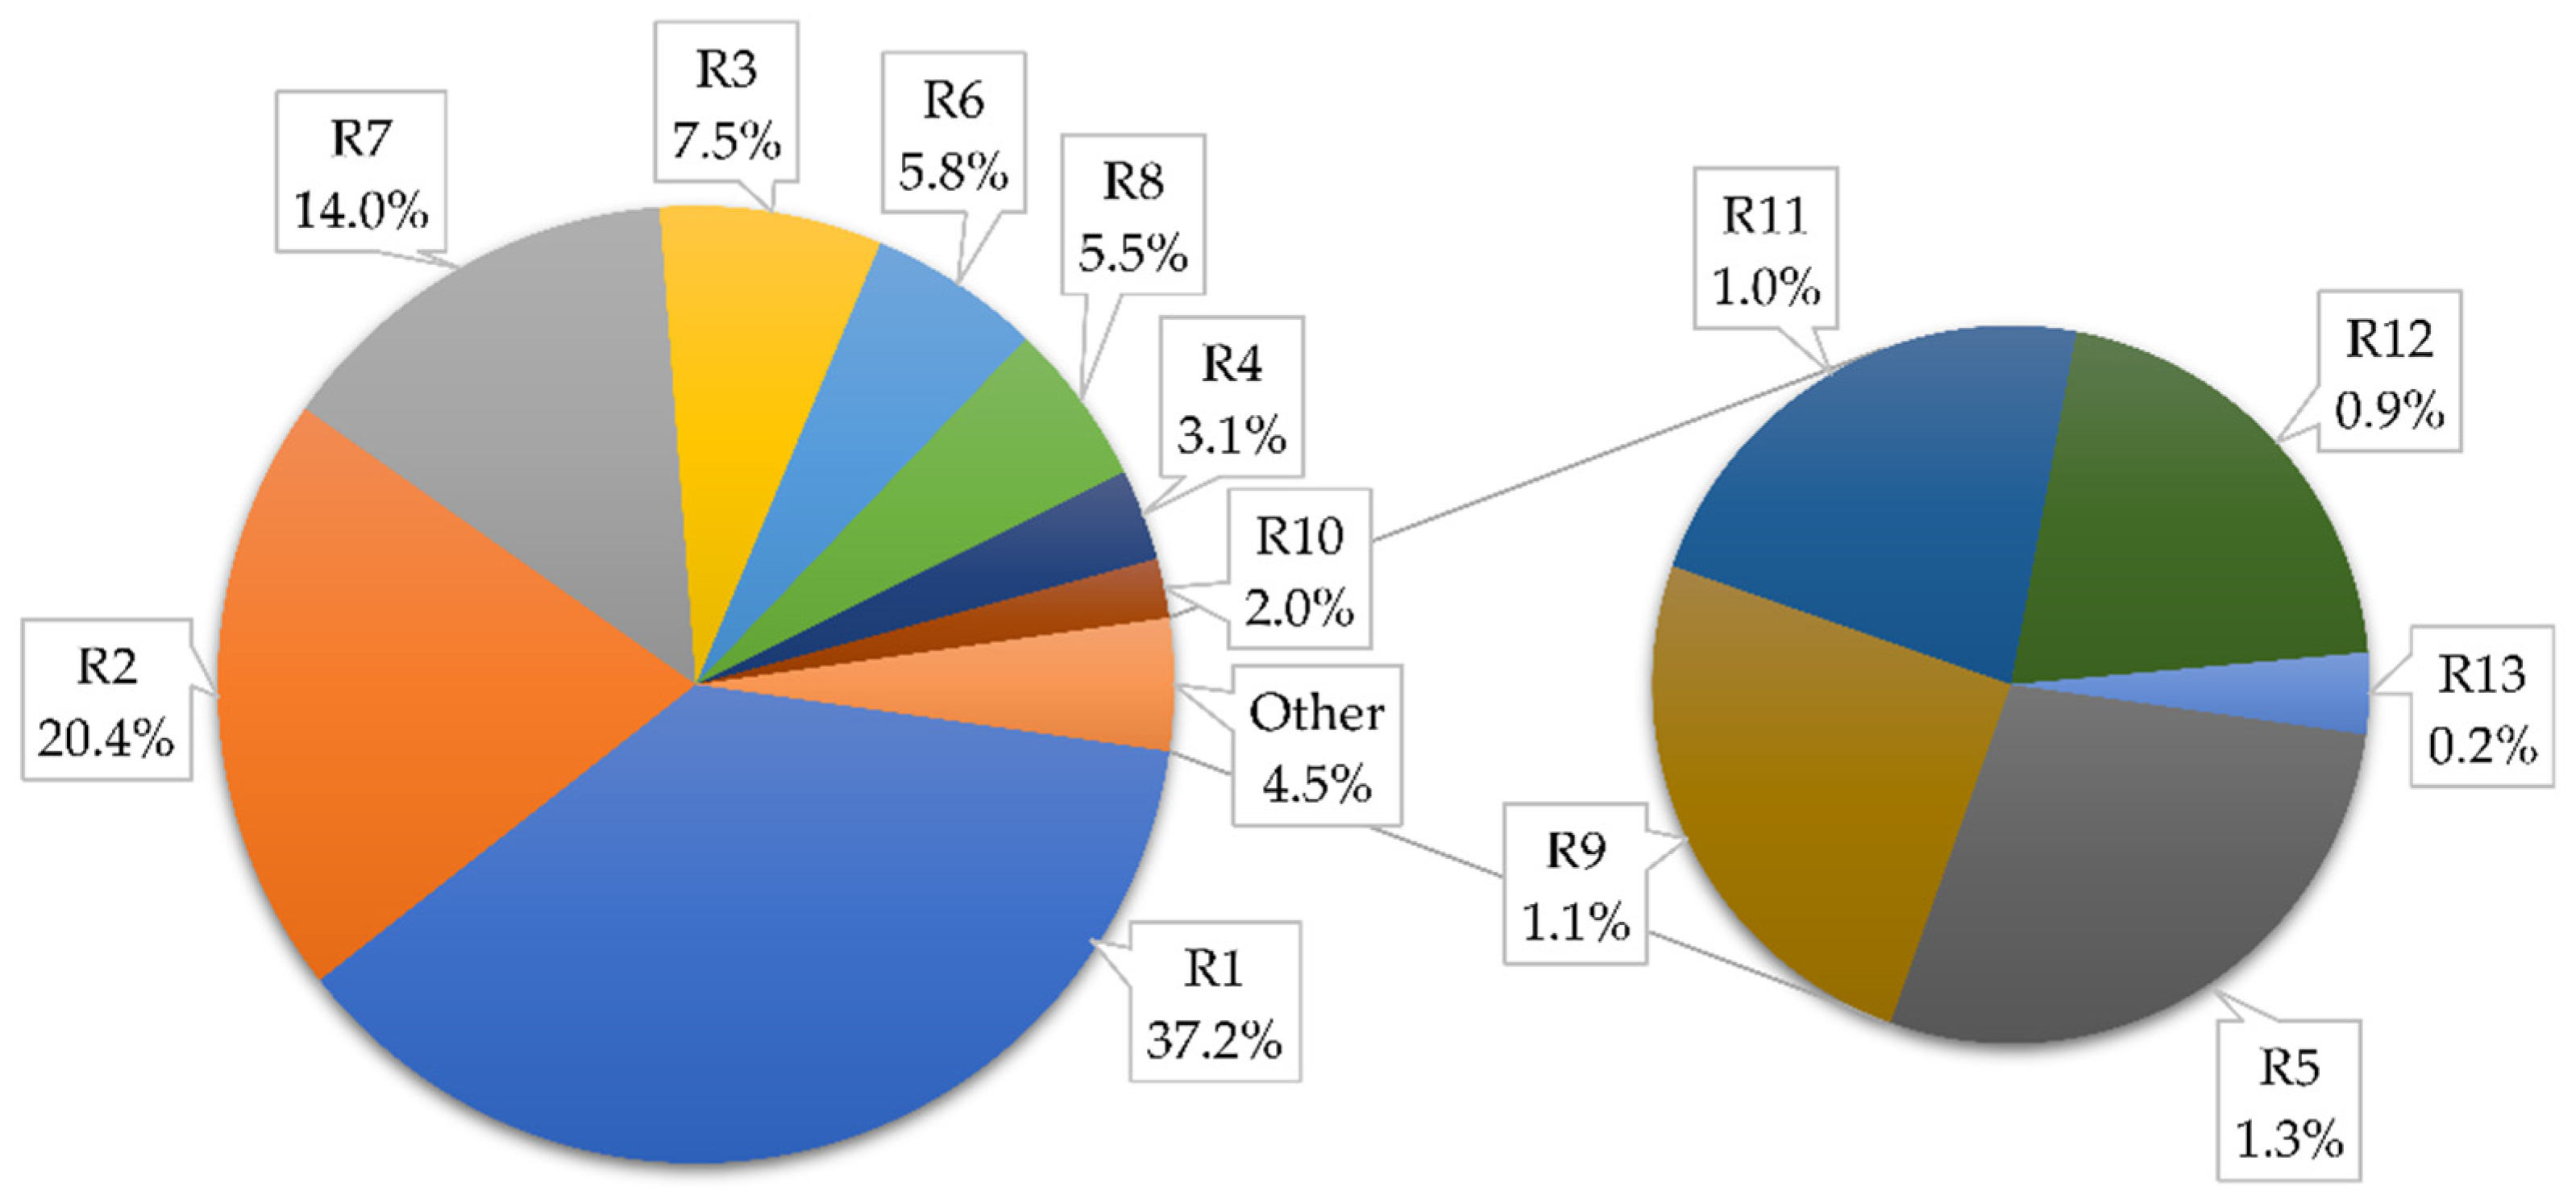
| Criteria | GHI | Land Cover | Terrain Geomorphology | Spatial Paramete | Socioeconomic Parameters | Weight Coefficient |
|---|---|---|---|---|---|---|
| GHI | 1 | 2 | 3 | 2 | 7 | 0.372 |
| Land Cover | 0.5 | 1 | 3 | 0.5 | 5 | 0.204 |
| Terrain geomorphology | 0.333 | 0,333 | 1 | 0.333 | 5 | 0.119 |
| Spatial parameters | 0.5 | 2 | 3 | 1 | 5 | 0.265 |
| Socioeconomic parameters | 0.143 | 0.2 | 0.2 | 0.2 | 1 | 0.041 |
| λ = 5.274 | Cl = 0.069 | CR = 0.061 | ||||
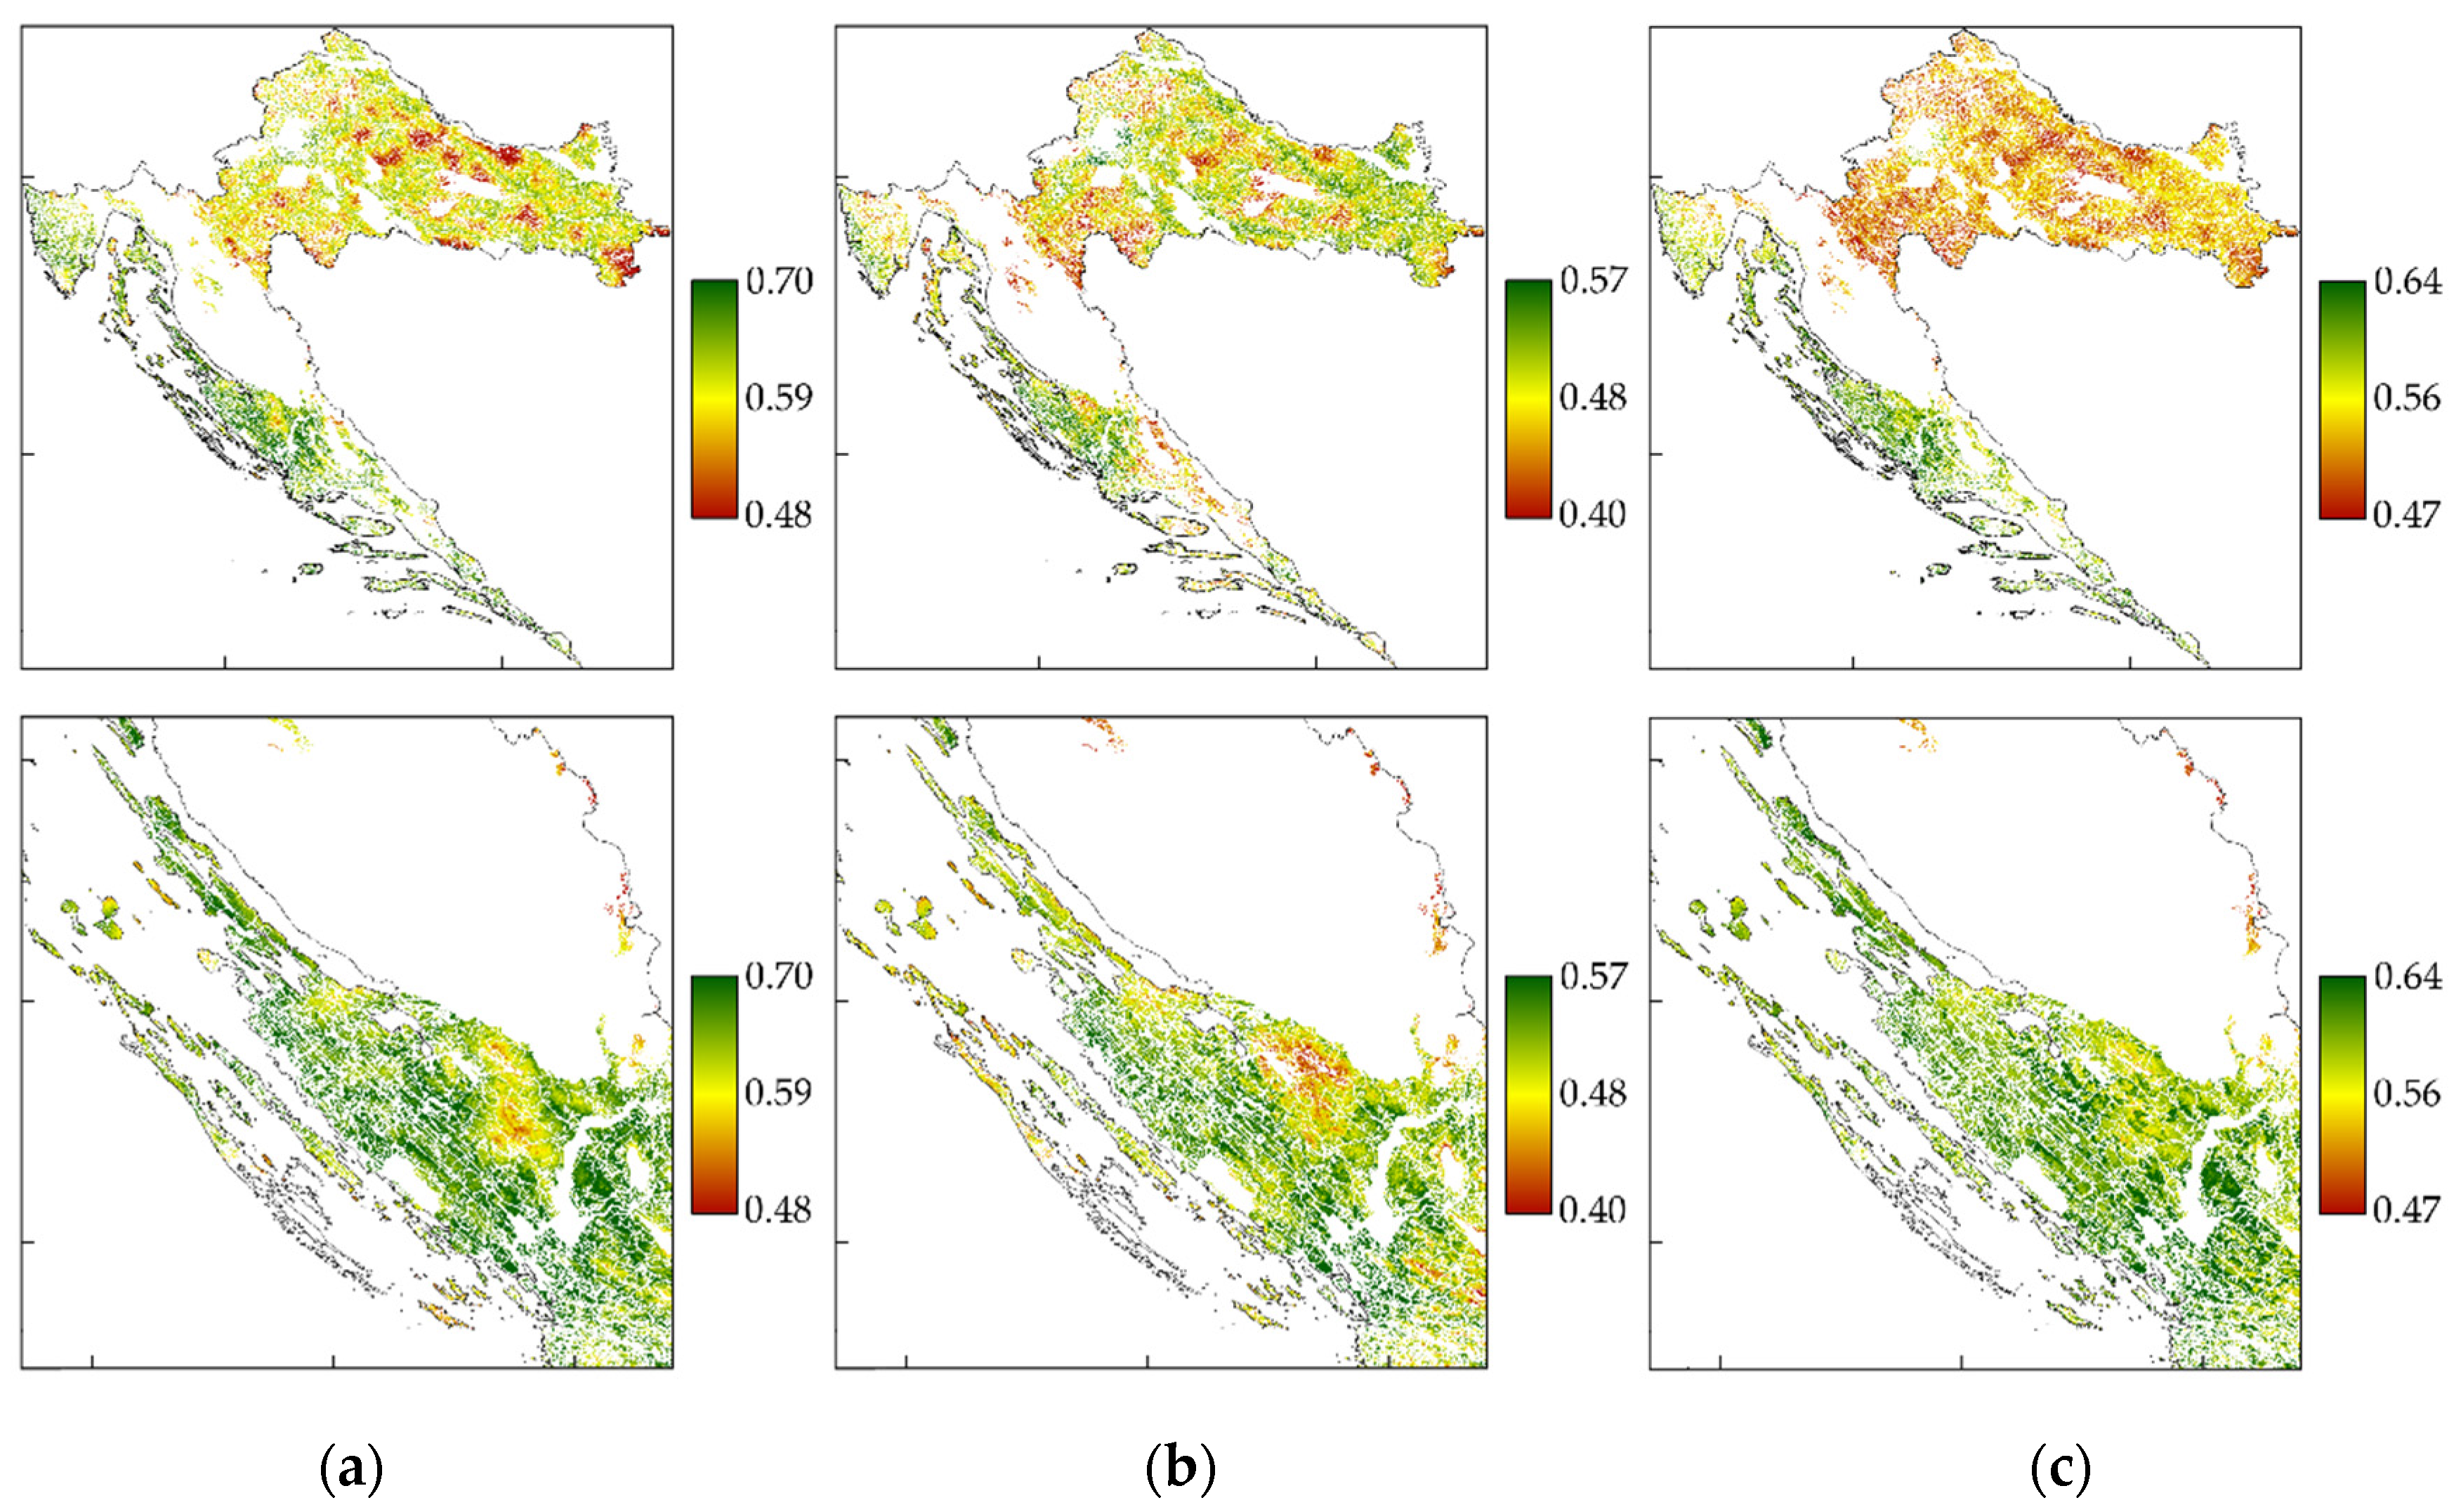
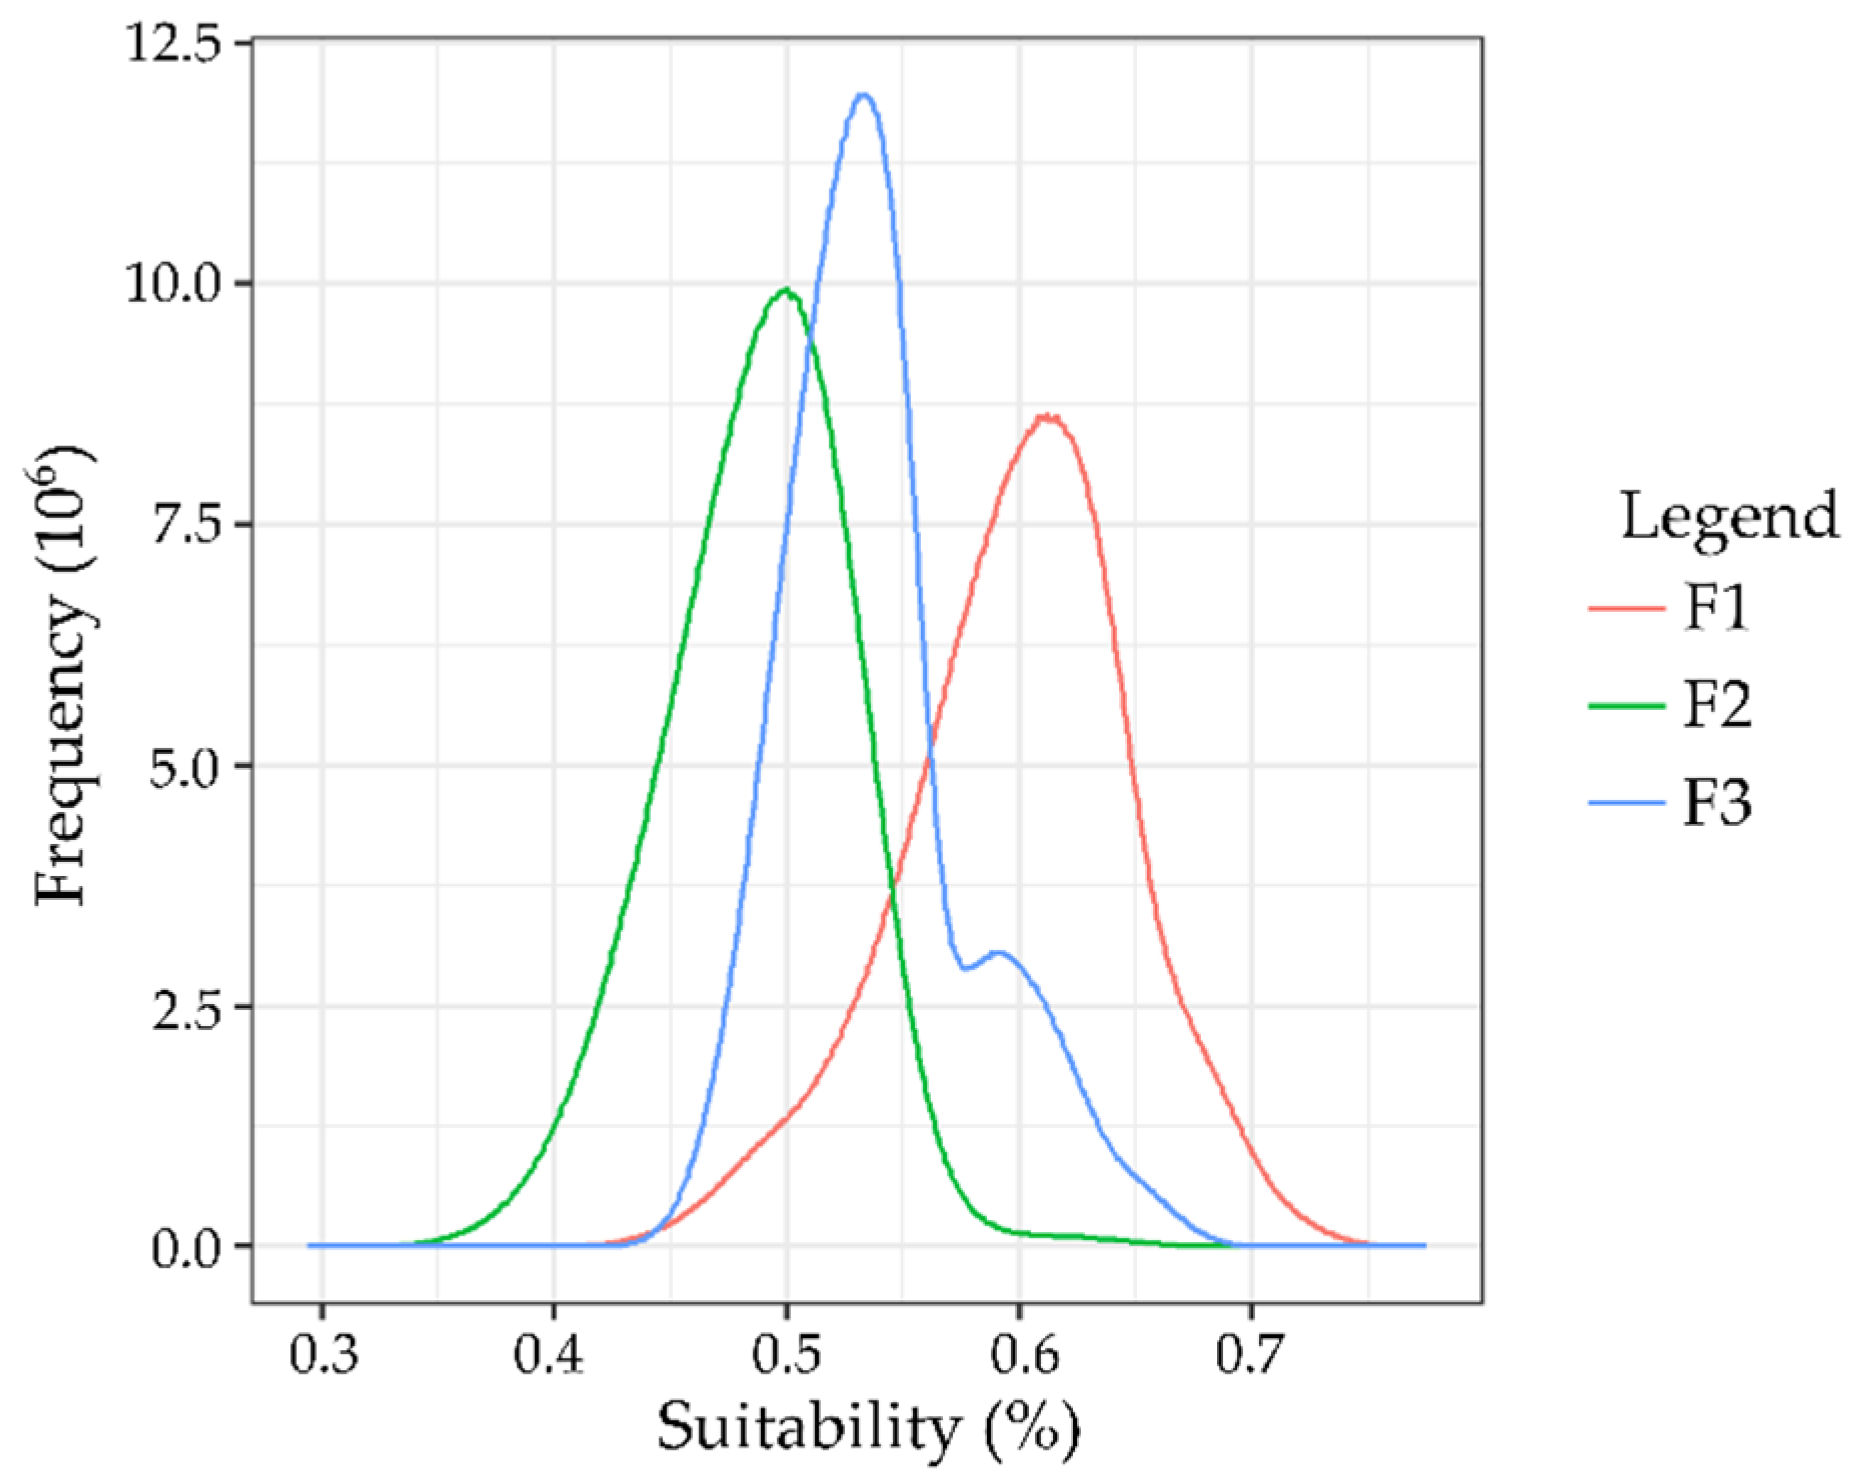
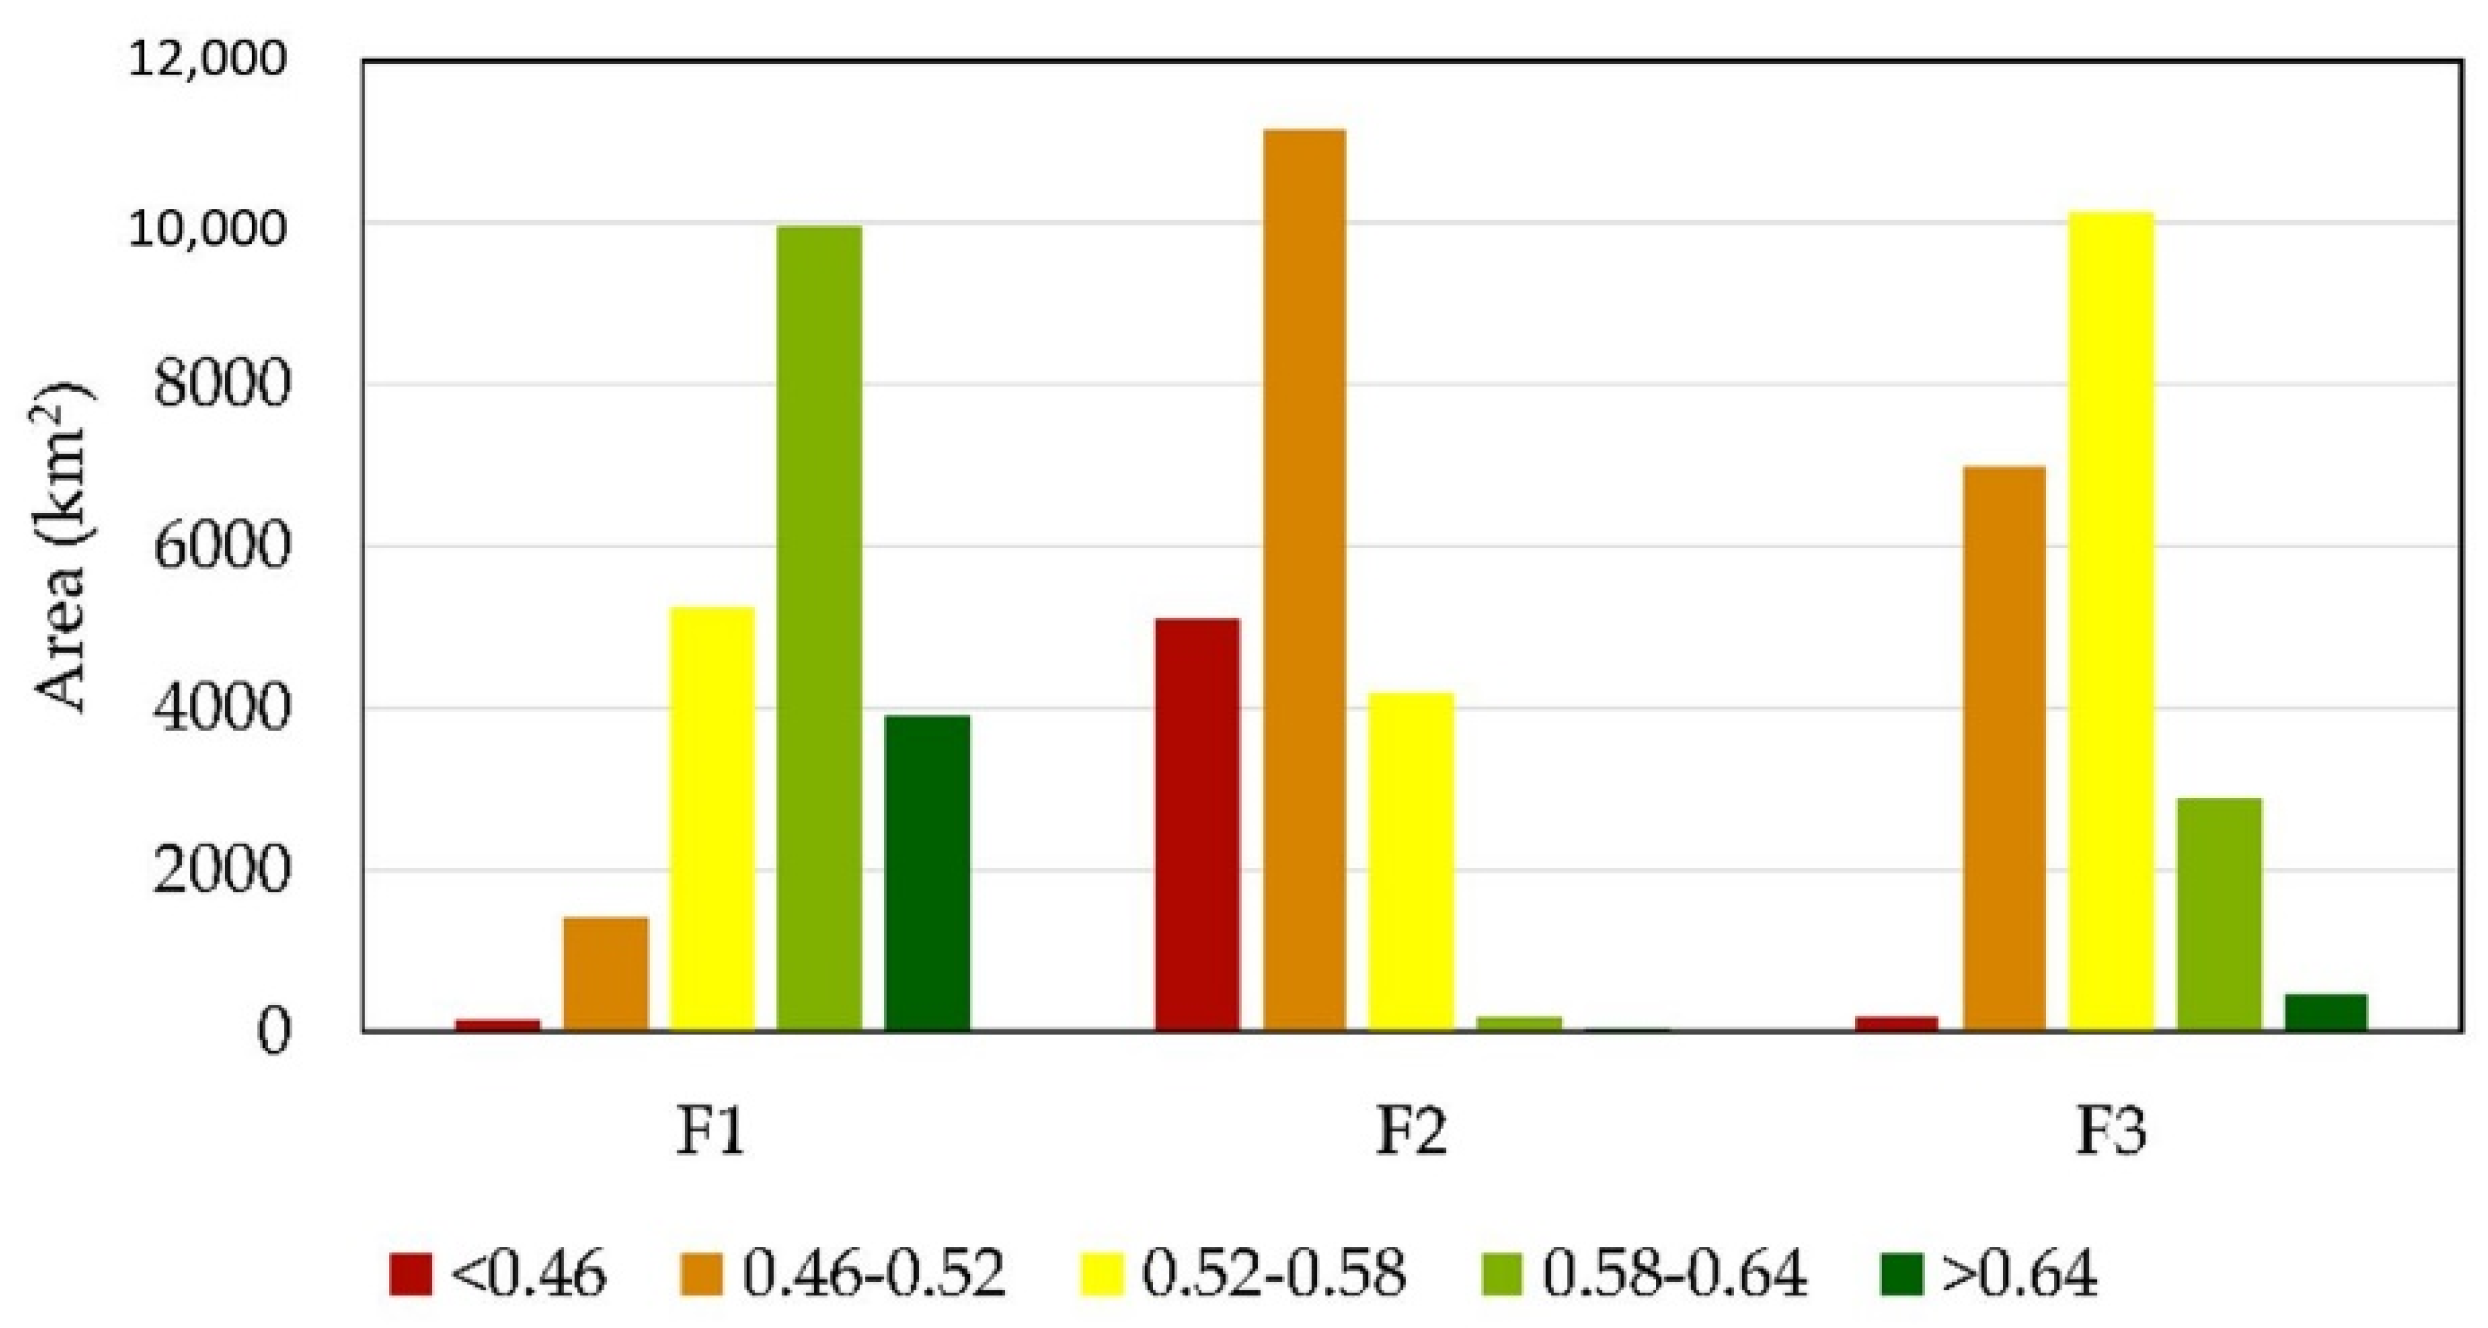
| Value | F1 | F2 | F3 |
|---|---|---|---|
| Number of pixels | 240,276,905 | 240,276,905 | 240,276,905 |
| No. suitable pixels | 217,313,988 | 217,313,988 | 217,313,988 |
| No. unsuitable pixels | 22,962,917 | 22,962,917 | 22,962,917 |
| Minimum (%) | 0.3686 | 0.2945 | 0.3992 |
| Maximum (%) | 0.7736 | 0.6967 | 0.7188 |
| Range (%) | 0.4049 | 0.4021 | 0.3196 |
| Mean value (%) | 0.5984 | 0.4876 | 0.5387 |
| Standard deviation (%) | 0.0508 | 0.0418 | 0.0417 |
© 2019 by the authors. Licensee MDPI, Basel, Switzerland. This article is an open access article distributed under the terms and conditions of the Creative Commons Attribution (CC BY) license (http://creativecommons.org/licenses/by/4.0/).
Share and Cite
Gašparović, I.; Gašparović, M. Determining Optimal Solar Power Plant Locations Based on Remote Sensing and GIS Methods: A Case Study from Croatia. Remote Sens. 2019, 11, 1481. https://doi.org/10.3390/rs11121481
Gašparović I, Gašparović M. Determining Optimal Solar Power Plant Locations Based on Remote Sensing and GIS Methods: A Case Study from Croatia. Remote Sensing. 2019; 11(12):1481. https://doi.org/10.3390/rs11121481
Chicago/Turabian StyleGašparović, Iva, and Mateo Gašparović. 2019. "Determining Optimal Solar Power Plant Locations Based on Remote Sensing and GIS Methods: A Case Study from Croatia" Remote Sensing 11, no. 12: 1481. https://doi.org/10.3390/rs11121481
APA StyleGašparović, I., & Gašparović, M. (2019). Determining Optimal Solar Power Plant Locations Based on Remote Sensing and GIS Methods: A Case Study from Croatia. Remote Sensing, 11(12), 1481. https://doi.org/10.3390/rs11121481