1. Introduction
Earth observation technology that is remote sensing-based on time-series images can obtain the dynamic change information of the Earth’s surface. Further, it has broad application prospects in the fields of resource surveying, emergency response, and surface monitoring. However, at present, the processing and analysis of time-series images, especially the collection of training samples, often requires a lot of manual intervention, and it is difficult to meet the need for the rapid processing of time-series images. Furthermore, the processed historical remote sensing data contain a lot of information and how to effectively use the historical information to assist with the processing and analysis of time-series images, and then improve the automation level of time-series remote sensing Earth observation technology, is an important problem that needs to be urgently solved.
Transfer learning technology can provide a reliable solution to the above problems. Given a source domain, a source task, a target domain, and a target task, transfer learning aims to improve the performance of the target task in the target domain using the knowledge in the source domain and source task [
1].
Firstly, with regard to “what to transfer”, transfer learning can be categorized into four approaches: instance-based transfer, feature-representation-based transfer, parameter-based transfer, and relational knowledge transfer. Taking remote sensing image classification as an example, instance-based transfer methods, such as the methods proposed in [
2,
3,
4,
5,
6,
7,
8], use partial training samples in the source domain to improve the performance of the model of the target domain in the model training. The feature-representation-based transfer methods, such as the methods proposed in [
9,
10,
11,
12], learn a more effective feature expression from the source domain, so that the target domain classifier built in the new feature space has a better performance. Parameter-based transfer methods, such as the methods proposed in [
13,
14,
15,
16], consider that the source domain classifier and target domain classifier have some of the same optimal parameters, which can be found from the source domain classifier and then used for the target domain classifier. The basic assumption behind relational knowledge transfer is that some of the relationships among the data in the source and target domains are similar, and thus knowledge of the relationships can be transferred from the source domain to the target domain. Examples of such methods include the methods proposed in [
17,
18,
19,
20].
Secondly, according to whether labeled data are available, transfer learning can be categorized into three sub-settings [
1]: inductive transfer learning, when labeled data in the target domain are available; transductive transfer learning, when only labeled data in the source domain are available; and unsupervised transfer learning, when labeled data do not exist in either the source or target domain. Among the different categories of methods, there has been much research into inductive transfer learning and a number of studies of transductive transfer learning, with a few related applications. However, unsupervised transfer learning is a future research direction with only a few relevant studies conducted to date.
When applied to the information extraction of time-series images, inductive transfer learning needs to select appropriate labeled samples from the target domain. However, when the number of time-series images is large and the classes of ground objects are complex, the workload involved with selecting labeled samples from each temporal image is huge. Moreover, the inherent speckle noise of synthetic aperture radar (SAR) images further increases the difficulty of the manual selection of the labeled samples. Therefore, the dependence on the labeled target domain samples often means a reduction of the effectiveness and automation of the information extraction. Although the existing transductive transfer learning methods do not need target domain samples, they generally need to set more parameters and have weak robustness and the selection of optimal parameters often depends on expert experience. Therefore, the existing methods mentioned above have difficulty in meeting the requirements in practical applications such as emergency response, regional automatic monitoring, and so on. Considering the information contained in polarimetric synthetic aperture radar (PolSAR) time-series images, such as the spatio-temporal relational knowledge and physical scattering information, in order to use this information to avoid the dependence on labeled target domain samples, time-series clustering theory is introduced in this paper.
Time-series clustering can be defined as follows [
21]: given a dataset of
n time-series images
, the process of unsupervised partitioning of
into
is conducted in such a way that the homogeneous time-series images are grouped together based on a certain similarity measure. Time-series clustering is widely used in the field of data mining, in applications such as seasonal retail pattern analysis [
22], seismic wave, and mining explosion analysis [
23], gene expression pattern extraction [
24,
25], climate analysis [
26], and stock market trend analysis [
27]. To date, the research into time-series clustering has mainly focused on the following four aspects [
1]: (1) The representation method for the time-series data [
28,
29,
30,
31,
32], because an effective representation method is crucial to the subsequent clustering process. (2) The similarity or distance measure for the time-series curve, because the calculation of the distance measure needs to be balanced between computational efficiency and accuracy. Furthermore, how to match the distance measure with the representation of the time-series data is also a difficult problem. Related approaches include finding similar time points [
33,
34], judging the similarity of shape [
32,
35,
36], or finding the sequence with the most similar change [
37,
38]. (3) Clustering algorithms, based on the representation method and the distance measure of the time-series data, use an appropriate clustering algorithm to cluster the data. Generally speaking, there are six main kinds of clustering methods: hierarchical clustering, partitioning clustering, model-based clustering, density-based clustering, grid-based clustering, and multi-step clustering. (4) The definition of cluster prototypes also has an important impact on the clustering effect [
27,
39,
40]. There are three commonly used prototypes: a medoid as a prototype, an averaging prototype, and a local search prototype. However, most of the above studies of time-series clustering have been aimed at the application in the field of data mining, and their data representation methods, curve similarity measures, and so on, are difficult to match with the unique structural and physical significance of PolSAR data, so these methods cannot be directly applied to the field of PolSAR image processing.
In this paper, aiming at the above problems, and based on the spatio-temporal correlation of time-series samples and the characteristics of the multi-view polarization covariance matrix subject to a complex Wishart distribution, we propose a new three-phase time-series clustering algorithm, which can realize transductive label transfer from source domain to target domain, without relying on supervised target domain information. In this method, the samples from different images are first composed into time-series samples. Secondly, the time-series samples are clustered into different clusters by the time-series clustering algorithm. The time-series samples which do not change in the whole time series are then extracted from the clusters. Finally, the labels from the source domain samples are transferred to these unchanged target domain samples. For convenience of description, the proposed method is referred to as time-series clustering for transductive label transfer (TCTLT).
The rest of this paper is organized as follows. In
Section 2, how to construct the TCTLT method based on the characteristics of PolSAR time-series images is introduced in detail. Then, in
Section 3, the methods of accuracy evaluation are introduced, and the experimental results obtained with different time-series images are analyzed. In
Section 4, the performances of TCTLT and the existing methods are discussed. Finally, our conclusions are drawn in
Section 5.
2. Materials and Methods
2.1. The Introduction of Time-Series Clustering Theory into the Field of PolSAR Images
For the sample label transfer task of PolSAR time-series images considered in this paper, some important concepts are defined as follows:
- (1)
Source domain: an image with plenty of labeled samples.
- (2)
Source domain samples: labeled samples in the source domain image.
- (3)
Target domain: other images in the time-series images, except for the source domain image.
- (4)
Target domain samples: samples in the target domain images with the sample geographical location as the source domain samples, but without an object label.
- (5)
Time-series samples: sample sequences consisting of samples from the same geographic location of all the sequential images, including source domain samples and target domain samples.
- (6)
Time-series samples of a certain class of objects: taking the water time-series sample as an example, it is defined as a time-series sample, for which the label in the source domain image is “water”.
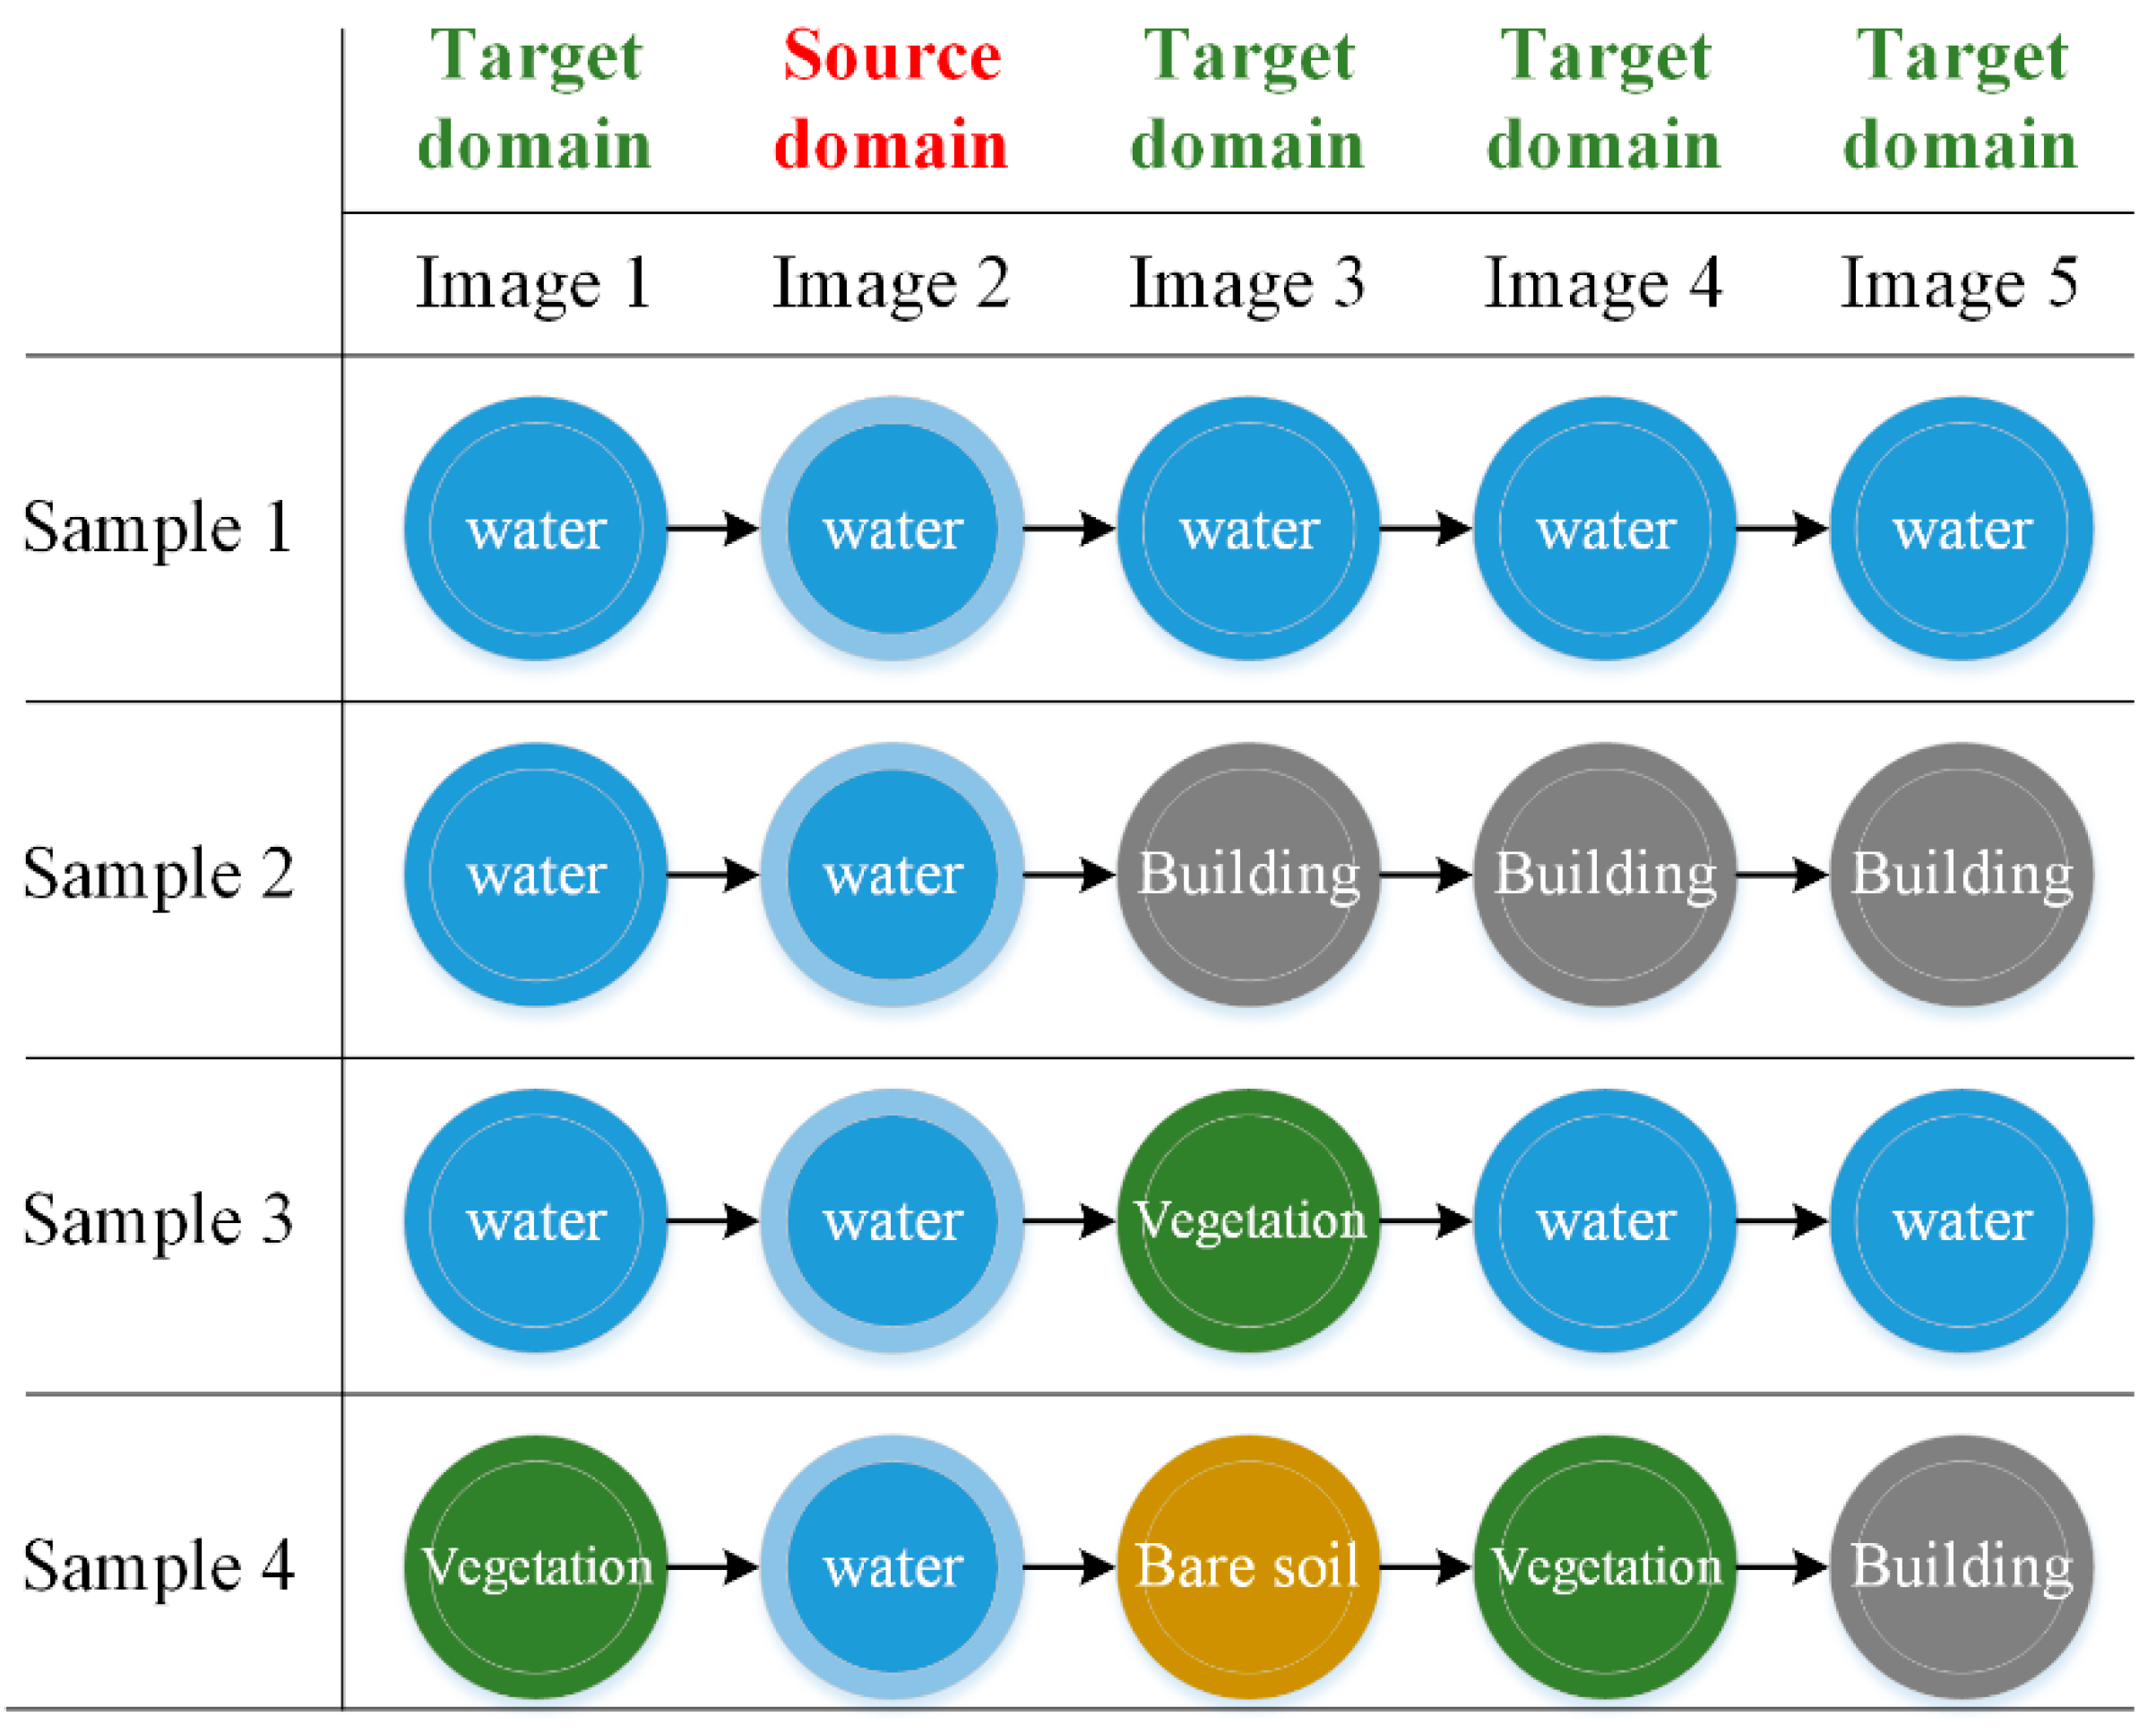
The aim of this paper is to assign class labels to the target domain samples. Although the geographic locations of target domain samples and source domain samples are exactly the same, their corresponding types of ground objects may change with time. Therefore, the class labels of source domain samples cannot be directly assigned to target domain samples, as shown in
Figure 1.:
In order to avoid any confusion, “type” and “class” in this paper have different specific meanings: “type” describes the temporal variation of the time-series samples and “class” represents the label of the time-series samples in the source domain. For example, there are four types of water time-series samples in
Figure 1. Their labels in the source images are all water, and the labels in the target images are not identical. Among them, the class of the object of Sample 1 does not change in the whole time series, while the class of the objects of Samples 2–4 do change in some images. Therefore, only for those time-series samples such as Sample 1 can the class labels of the source domain samples be directly assigned to the target domain samples.
In order to extract time-series samples such as Sample 1, for which the class does not change in the whole time series, we assume that each time-series sample has a value
reflecting the corresponding object class in each image, and then a time-series sample
can form a time-series curve
. We assume that the similarity between the same types of time-series curves is greater than that between different types of time-series curves, as shown in the following formula:
where
and
are the time-series curves of time-series samples of type
i and
j, respectively.
Based on the similarity, the same types of time-series samples can be clustered into one group by clustering, and we can then extract the required time-series samples from the clusters. Therefore, we introduce the theory of time-series clustering, which, according to the shape, characteristics, or model of the time-series curve, clusters the curves with high similarity into one group under certain criteria.
2.2. A Three-Phase Time-Series Clustering Algorithm for PolSAR Images
To introduce the theory of time-series clustering into the clustering of PolSAR time-series samples, the following key problems need to be solved: (1) How to represent a time-series curve (that is, how to define the value of ). The current time-series clustering algorithms mostly use a real value to represent , and then will be a two-dimensional curve. However, if the complex data of PolSAR images containing four polarization channels are compressed into a real value, much of the polarization information will be lost. Therefore, it is difficult for such two-dimensional curves to describe the characteristics of PolSAR time-series samples effectively, so the best way is to retain all the polarization information. (2) How to measure the similarity between the two time-series curves (that is, how to define the in Equation (1)). If all of the polarization information is used to describe the time-series curve, for example, then the data points on each phase will be represented by a polarimetric covariance matrix (the dimension is . The time-series curve will then be a curve in complex space and the existing distance measures cannot be applied to such a complex curve.
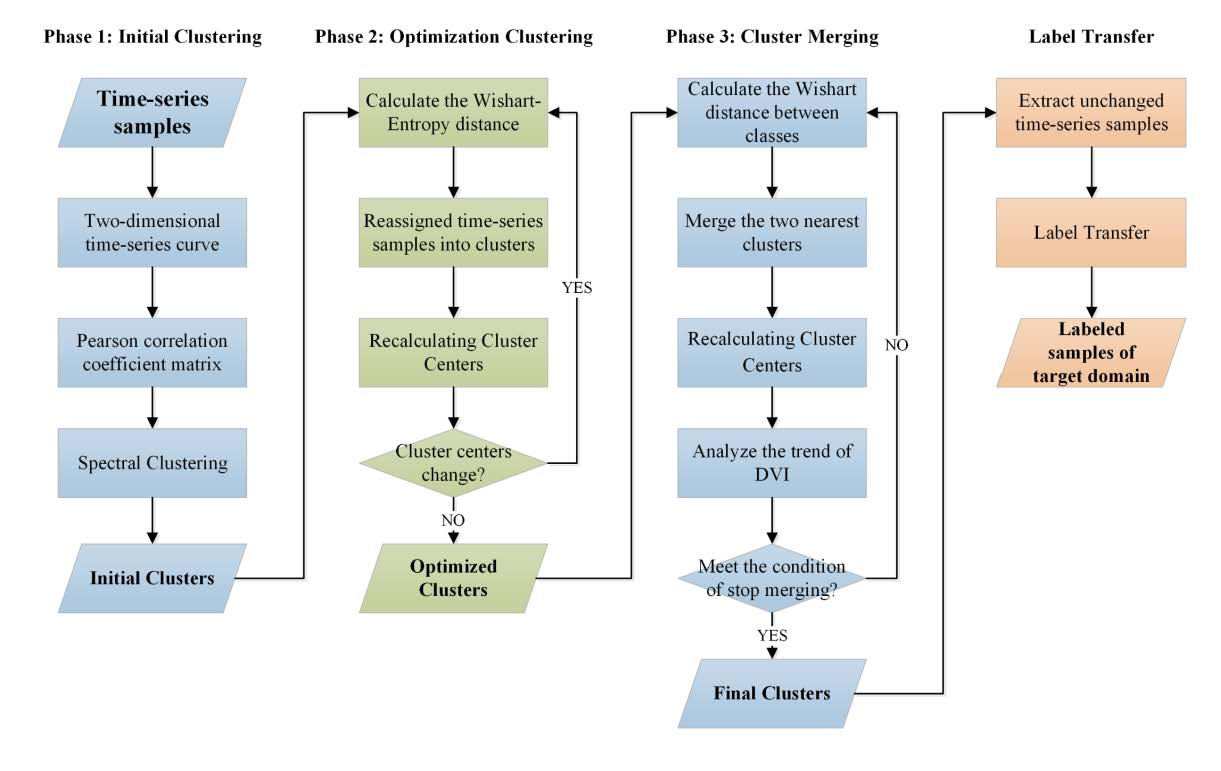
To solve the above problems, a three-phase time-series clustering algorithm is proposed in this paper. Firstly, initial clustering is carried out according to the polarimetric decomposition characteristics to provide the initial cluster centers for the next step. Secondly, optimization clustering is carried out based on the polarimetric covariance matrix and the initial cluster centers to obtain high-precision clustering results. Finally, the previous clustering results are merged so that the same types of time-series samples are further merged. The main flow chart of the algorithm is shown in
Figure 2 and each phase is described in detail below.
2.2.1. Initial Clustering
The purpose of the initial clustering is to quickly obtain a set of cluster centers that are as reliable as possible as the initial value of the next phase of optimization clustering. Firstly, to achieve this goal, a two-dimensional curve is adopted for the representation of the time-series curve, i.e., for each time-series sample, the abscissa is the time series and the ordinate is a real value of the sample in that time. The real values can be expressed in the form of amplitude, intensity, or polarimetric decomposition components. However, no matter which form is adopted, a lot of polarization information will be lost, so the precision of the clustering in this phase may not be very high. Thus, in this paper, the mean value of the commonly used Pauli decomposition is used as the real value. Secondly, the common distance measures, such as dynamic time warping (DTW), the Euclidean distance, hidden Markov models, the Kullback-Leibler (KL) distance, and the Pearson correlation coefficient, can measure the similarity of two-dimensional time-series curves. The shape-based similarity measures are very effective [
41], so the Pearson correlation coefficient is used as the similarity measure in this phase. For vector
and vector
, the formula for their Pearson correlation coefficient is as follows:
where
is the correlation coefficient;
is the covariance; and
and
are the standard deviation of
and
, respectively.
Finally, among the existing clustering methods, the two most commonly used types of methods are the hierarchical clustering methods and the partitioning clustering methods. Hierarchical clustering methods do not need the initial cluster centers, but the amount of computation is high. Partitioning clustering methods, such as the
k-means algorithm, have a fast computation speed, but they require a set of initial cluster centers, and the quality of the initial cluster centers often has a significant impact on the final clustering results. In this phase, because the priority of each sample is the same, in order to obtain reliable global clustering results, the spectral clustering algorithm is used. Spectral clustering connects every two points with one edge, with each edge given a weight that represents the correlation of the two endpoints, and thus a full connection graph is constructed. The graph cut strategy is used to cut the full connection graph into many sub-graphs (clusters), with the purpose of making the weight of the edges between different sub-graphs as low as possible, and the weight of the edges in the sub-graph as high as possible [
42]. This approach has the advantages of clustering in a sample space of any shape and converging to the global optimal solution, which helps to obtain a clustering result that is as reliable as possible.
The specific process of the initial clustering is shown in Phase 1 of
Figure 2. Firstly, two-dimensional time-series curves of each time-series sample are constructed, where each time-series curve corresponds to a point in the full connection graph. The Pearson correlation coefficients between the two time-series curves are then calculated as the weights of their edges. Finally, similar curves are clustered globally by spectral clustering.
2.2.2. Optimization Clustering
The purpose of optimization clustering is to make full use of the information of the ground objects contained in the polarimetric covariance matrix, to optimize the initial clustering results, and thus obtain high-precision time-series clustering results.
Firstly, to preserve all the information related to the class of the objects, the whole polarimetric covariance matrix is used to represent a pixel in this phase. Thus, for a time-series sample
and a time-series cluster center
, there are:
where
n is the number of time-series images.
Secondly, the time-series curve represented by the above method is a curve in complex space and the conventional distance measures cannot measure the similarity between such curves. Therefore, it is necessary to design a corresponding similarity measure according to the characteristics of PolSAR time-series data.
Considering the characteristics of PolSAR data, a revised Wishart (R-Wishart) distance [
43] is used to measure the distance between sample
and cluster center
at time t. It describes the similarity between the two classes of objects corresponding to the two C3 matrices. The formulas are as follows:
where
p is the dimension of the polarimetric covariance matrix. The smaller
is, the more similar the object classes of
and
are.
The time-series sample
and the time-series cluster center
can then form an R-Wishart distance sequence
in the whole time series:
Thirdly, based on the above information, three characteristics of PolSAR time-series images are given (taking the time-series samples , and the time-series cluster center of the same object class as examples) as follows:
- (1)
The R-Wishart distance between similar objects in the same image is smaller than that between different objects.
- (2)
Due to the influence of different imaging conditions, the R-Wishart distances between the same class of objects in different temporal images are different. For example, for the time-series samples
and
, their R-Wishart distances to the cluster center
in the first and second temporal images are as follows:
where
and
are the distance between
and
in the first and the second images, respectively.
- (3)
Since the influence of imaging conditions on the same class of objects is similar in a single image, the change degree of the R-Wishart distance between the same class of objects in different images will be close, as shown below:
Among the three characteristics, the first characteristic shows that the distance of the same type of time-series curve is close, and the second and the third characteristics show that the shape of the same type of time-series curve is similar. Therefore, it is necessary to establish a similarity measure based on and the above three characteristics to evaluate the shape similarity and distance of time-series curves.
First of all, we need to evaluate the shape similarity. According to the second and the third characteristics, when all the values in the distance sequence
are equal (as shown in Equation (7)), the shapes of the time-series curves of
and
will be exactly the same. When the value difference in
is great, their shapes will be dissimilar.
Therefore, Shannon information entropy is introduced to evaluate the similarity of the time-series curves. Its formula is as follows:
Shannon information entropy can measure the information quantity of a random event. When
, the random event contains the most abundant information. By substituting
into the above formula, we can obtain the following formula:
Equation (9) can then be used to measure the shape similarity of the two time-series curves. If is larger, the shape similarity is higher.
However, according to the first characteristic, the distance of the same type of curve should be close, but Equation (9) can only measure the similarity of the shapes: when the values of each point in are large and equal, the shapes of and will be exactly the same, but their distances will be very large, indicating that the corresponding object classes of each point are very different, which means that the time-series curves of and are not of the same type.
In order to simultaneously measure the shape and distance of the time-series curves, a penalty factor
m is added to Equation (9) to restrict the absolute distance, and the following formula is obtained:
The above similarity measure is referred to as the Wishart-entropy formula. It can measure the shape similarity and absolute distance between a time-series sample and a time-series cluster center simultaneously. The larger the value of , the more similar the shape and distance between the time-series sample and the time-series cluster center, indicating that the time-series samples are more likely to belong to the time-series cluster center.
As shown in Phase 2 of
Figure 2, the concrete steps of optimization clustering are as follows. Firstly, the similarity between each time-series sample and each time-series cluster center is calculated. The sample is then assigned to the most similar cluster center. The time-series cluster center is then recalculated after all the samples are reassigned. The above procedure is repeated until the time-series cluster centers no longer change.
2.2.3. Cluster Merging
The optimization clustering results have a high precision, but the number of clusters is still significantly larger than the number of types of time-series samples; that is, not all the time-series samples of the same type are merged into the same cluster. The first reason for this is that the number of types of time-series samples is unknown, so a large number of cluster centers is set up in the initial clustering. The second reason is the influence of the SAR imaging mode and the distribution of the ground objects, in that there will also be some differences between the same class of objects. For example, water samples may come from a calm water surface or a rough water surface and building samples may come from buildings with different dominant scattering mechanisms, leading to these time-series samples of the same type with certain differences being assigned into different cluster centers. Therefore, it is necessary to merge the time-series clusters of the same type into the same cluster, so that all the time-series samples of the same type are in the same cluster.
Cluster merging is aimed at the merging of two time-series cluster centers and it is effective enough to use a symmetric Wishart distance between classes [
44] as the measure of merging. The difficulty lies in the setting of the rule for the stopping of the merging. For example, when there are four types of water time-series samples, as shown in
Figure 1., the ideal result is to output four time-series cluster centers, each of which corresponds to one type of time-series sample. However, in reality, the number of types of time-series samples is unknown. If the number of cluster centers is too small, it will lead to the merging of different types of time-series cluster centers. If the number of cluster centers is too large, it may lead to the total number of unchanged samples in the final output cluster being too small. In addition, the total number of types of time-series samples in different data and different ground objects is unique, so it is impossible to obtain reliable results by setting an empirical number of clusters.
At the same time, it should be noted that the strategy of setting the number of clusters to two (i.e., dividing them into unchanged clusters and changed clusters) is not feasible, because the similarity between the changed time-series samples and the unchanged time-series samples (e.g., Sample 1 and Sample 3 in
Figure 1) may be greater than that between the different types of changed time-series samples (e.g., Sample 3 and Sample 4 in
Figure 1). Thus, when the number of clusters set is less than the real number of types of time-series samples, it will lead to merging between the cluster composed of changed samples and the cluster composed of unchanged samples.
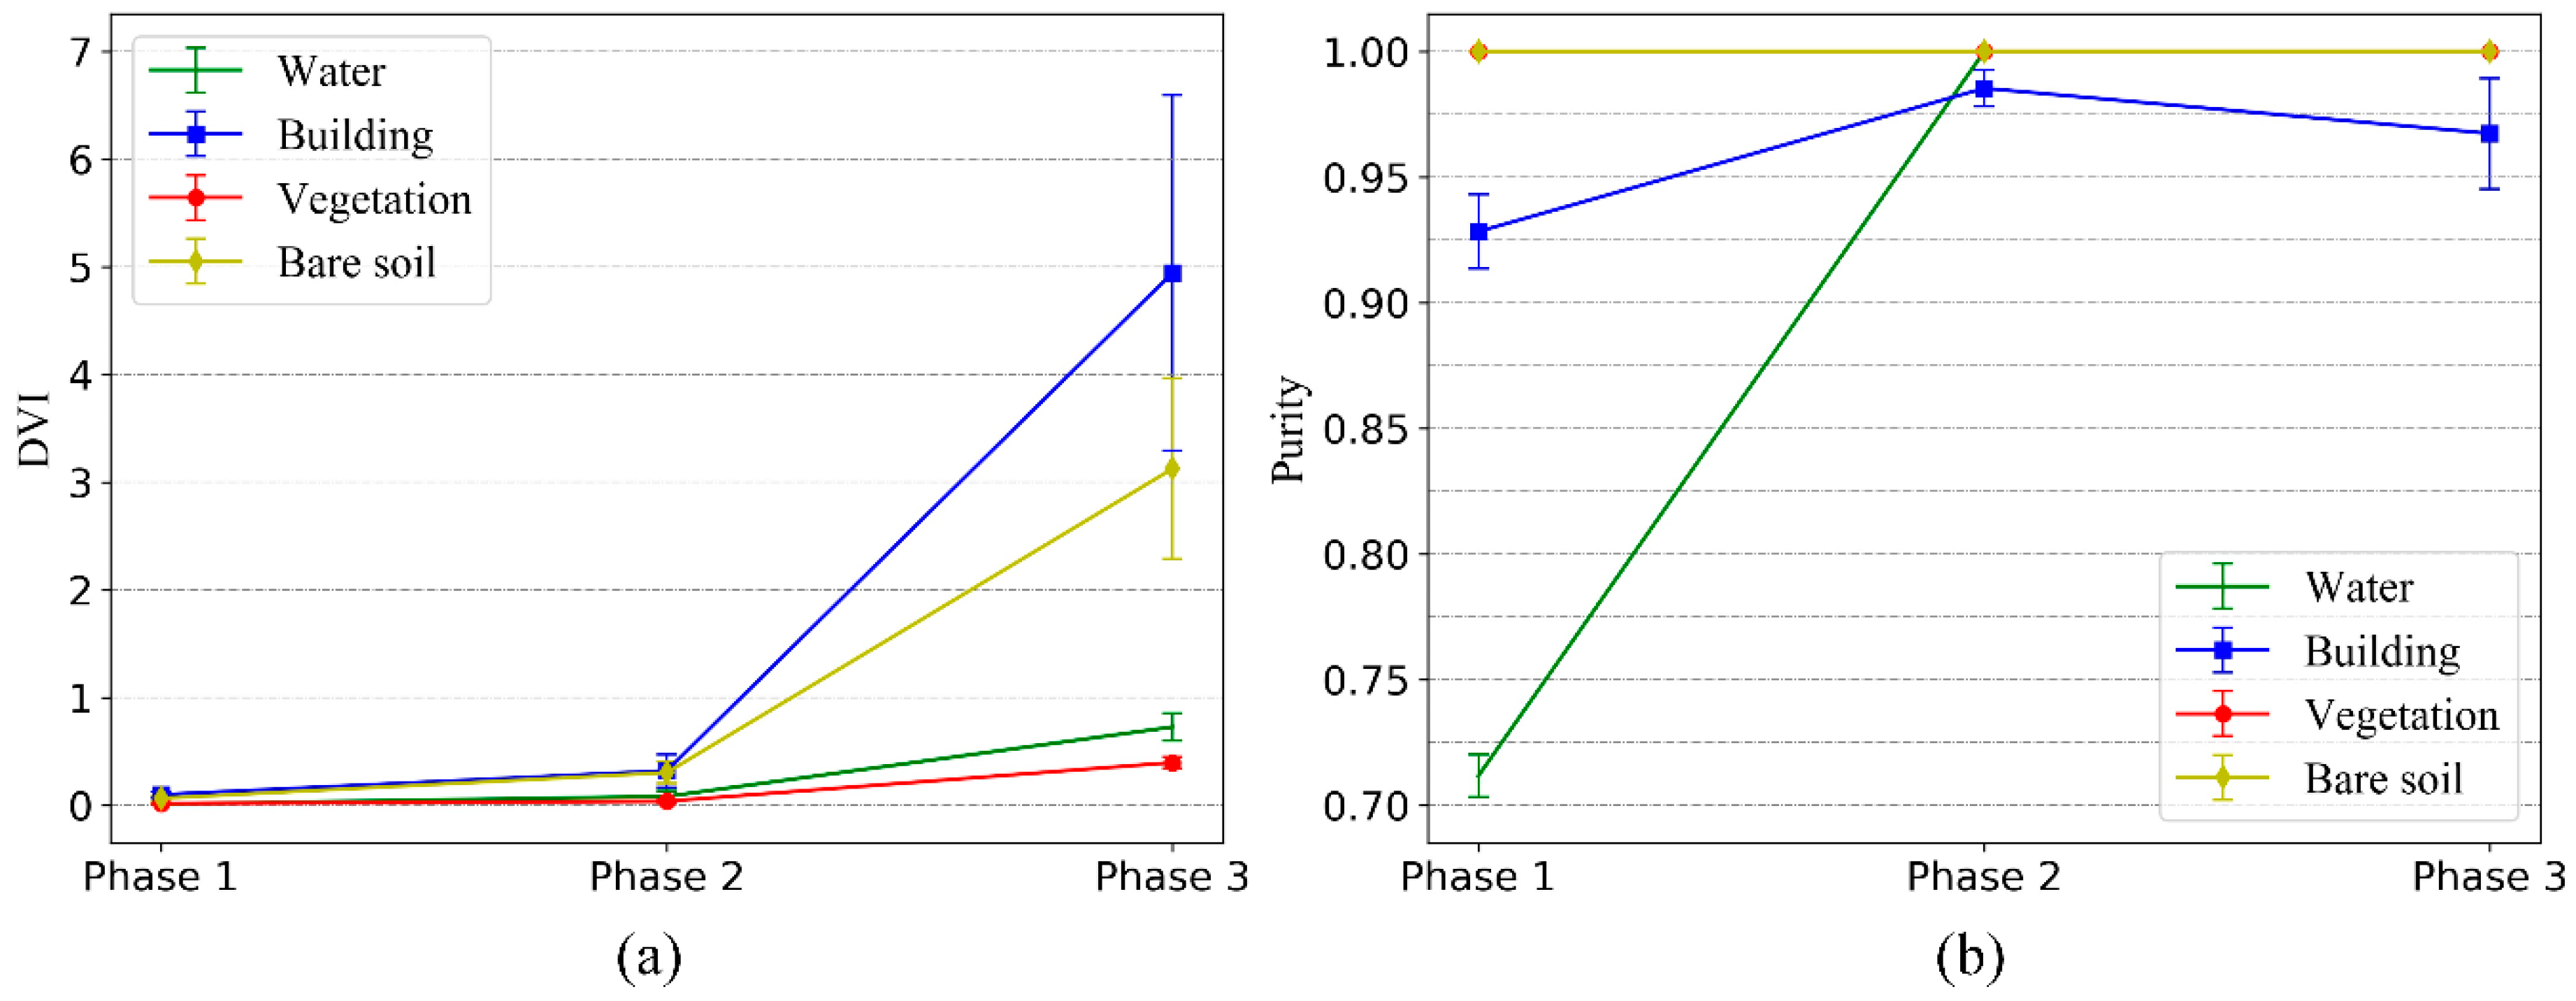
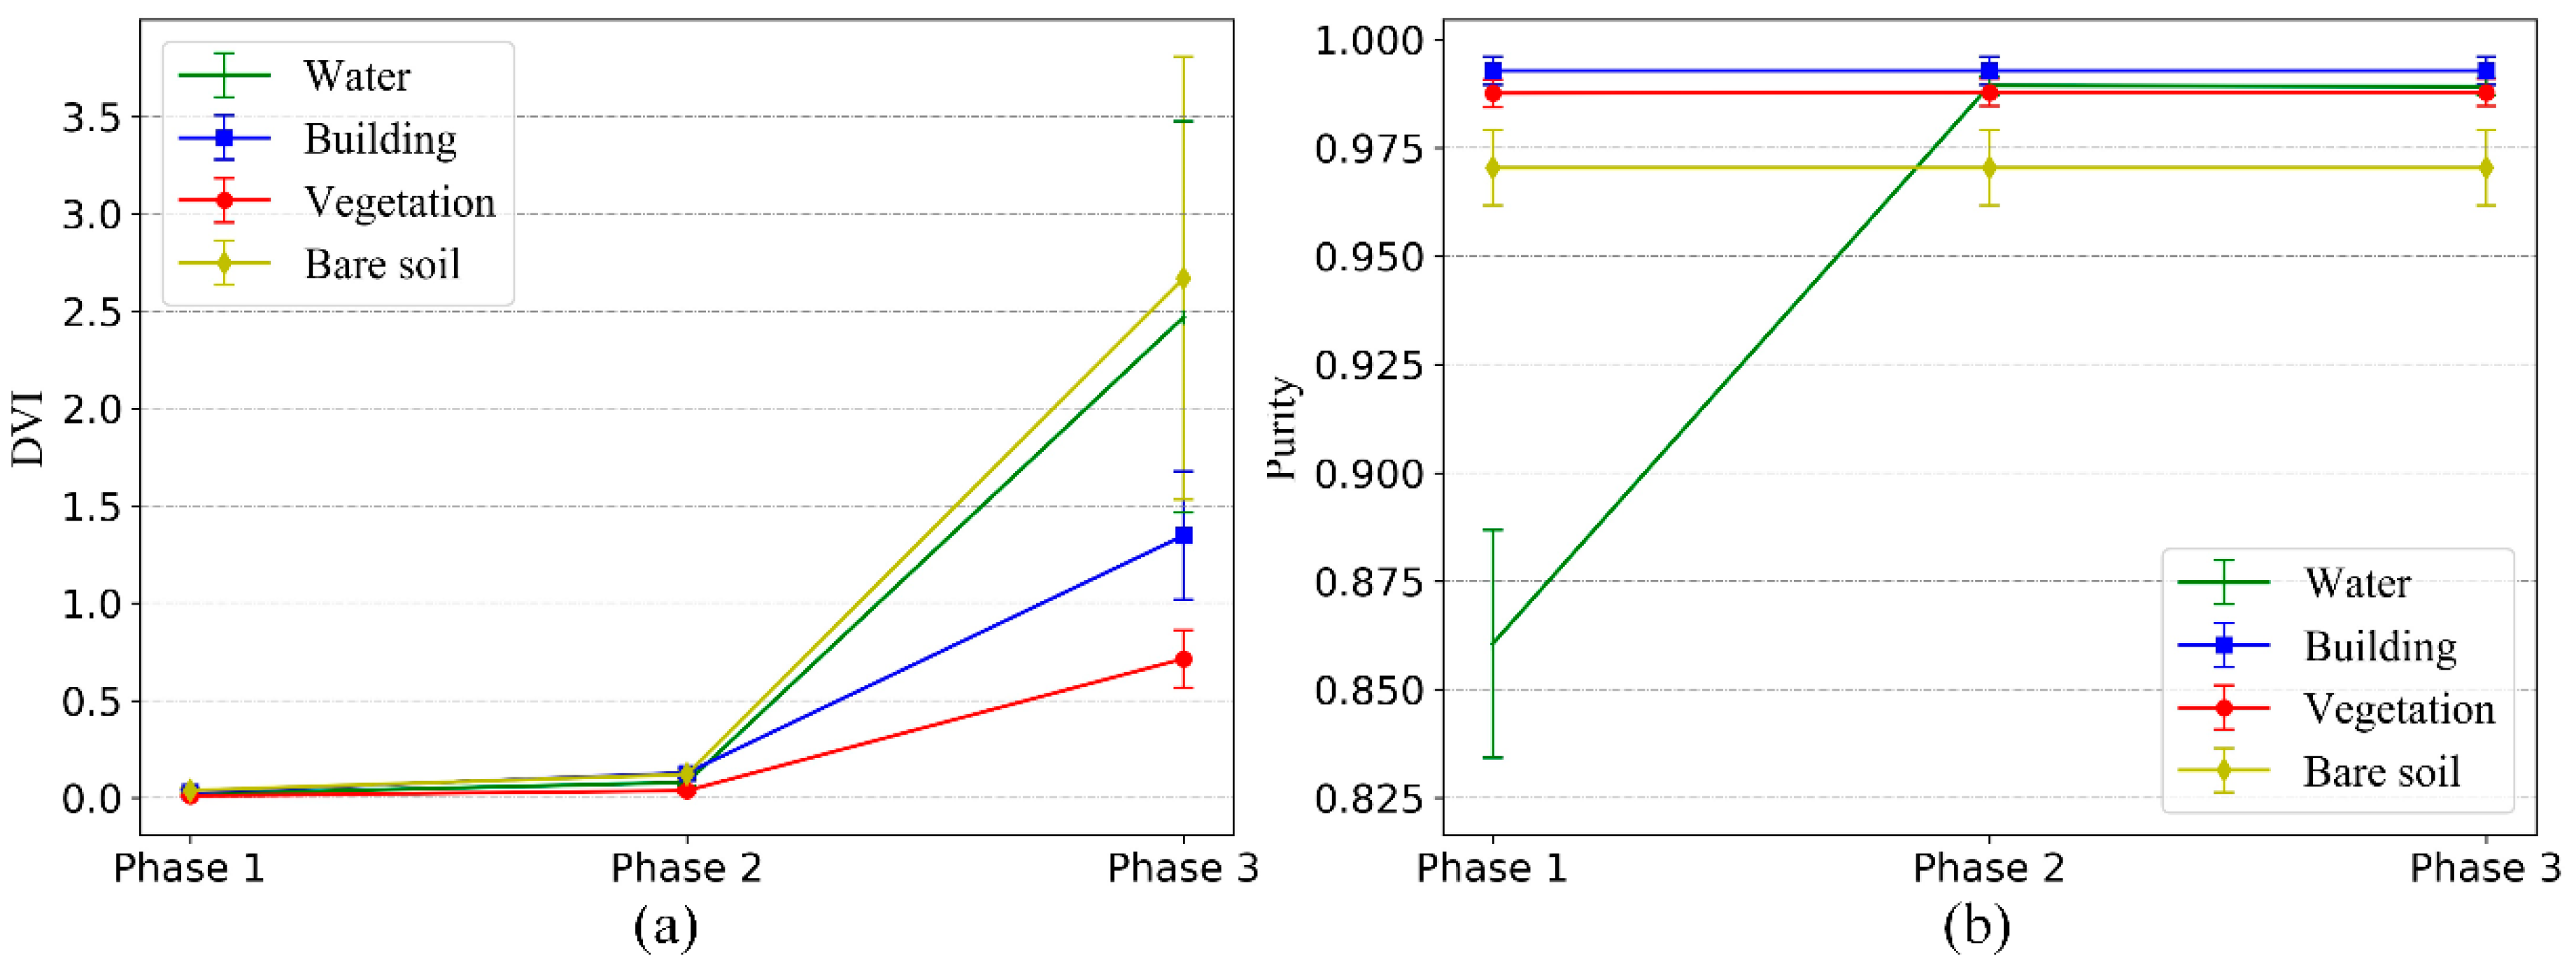
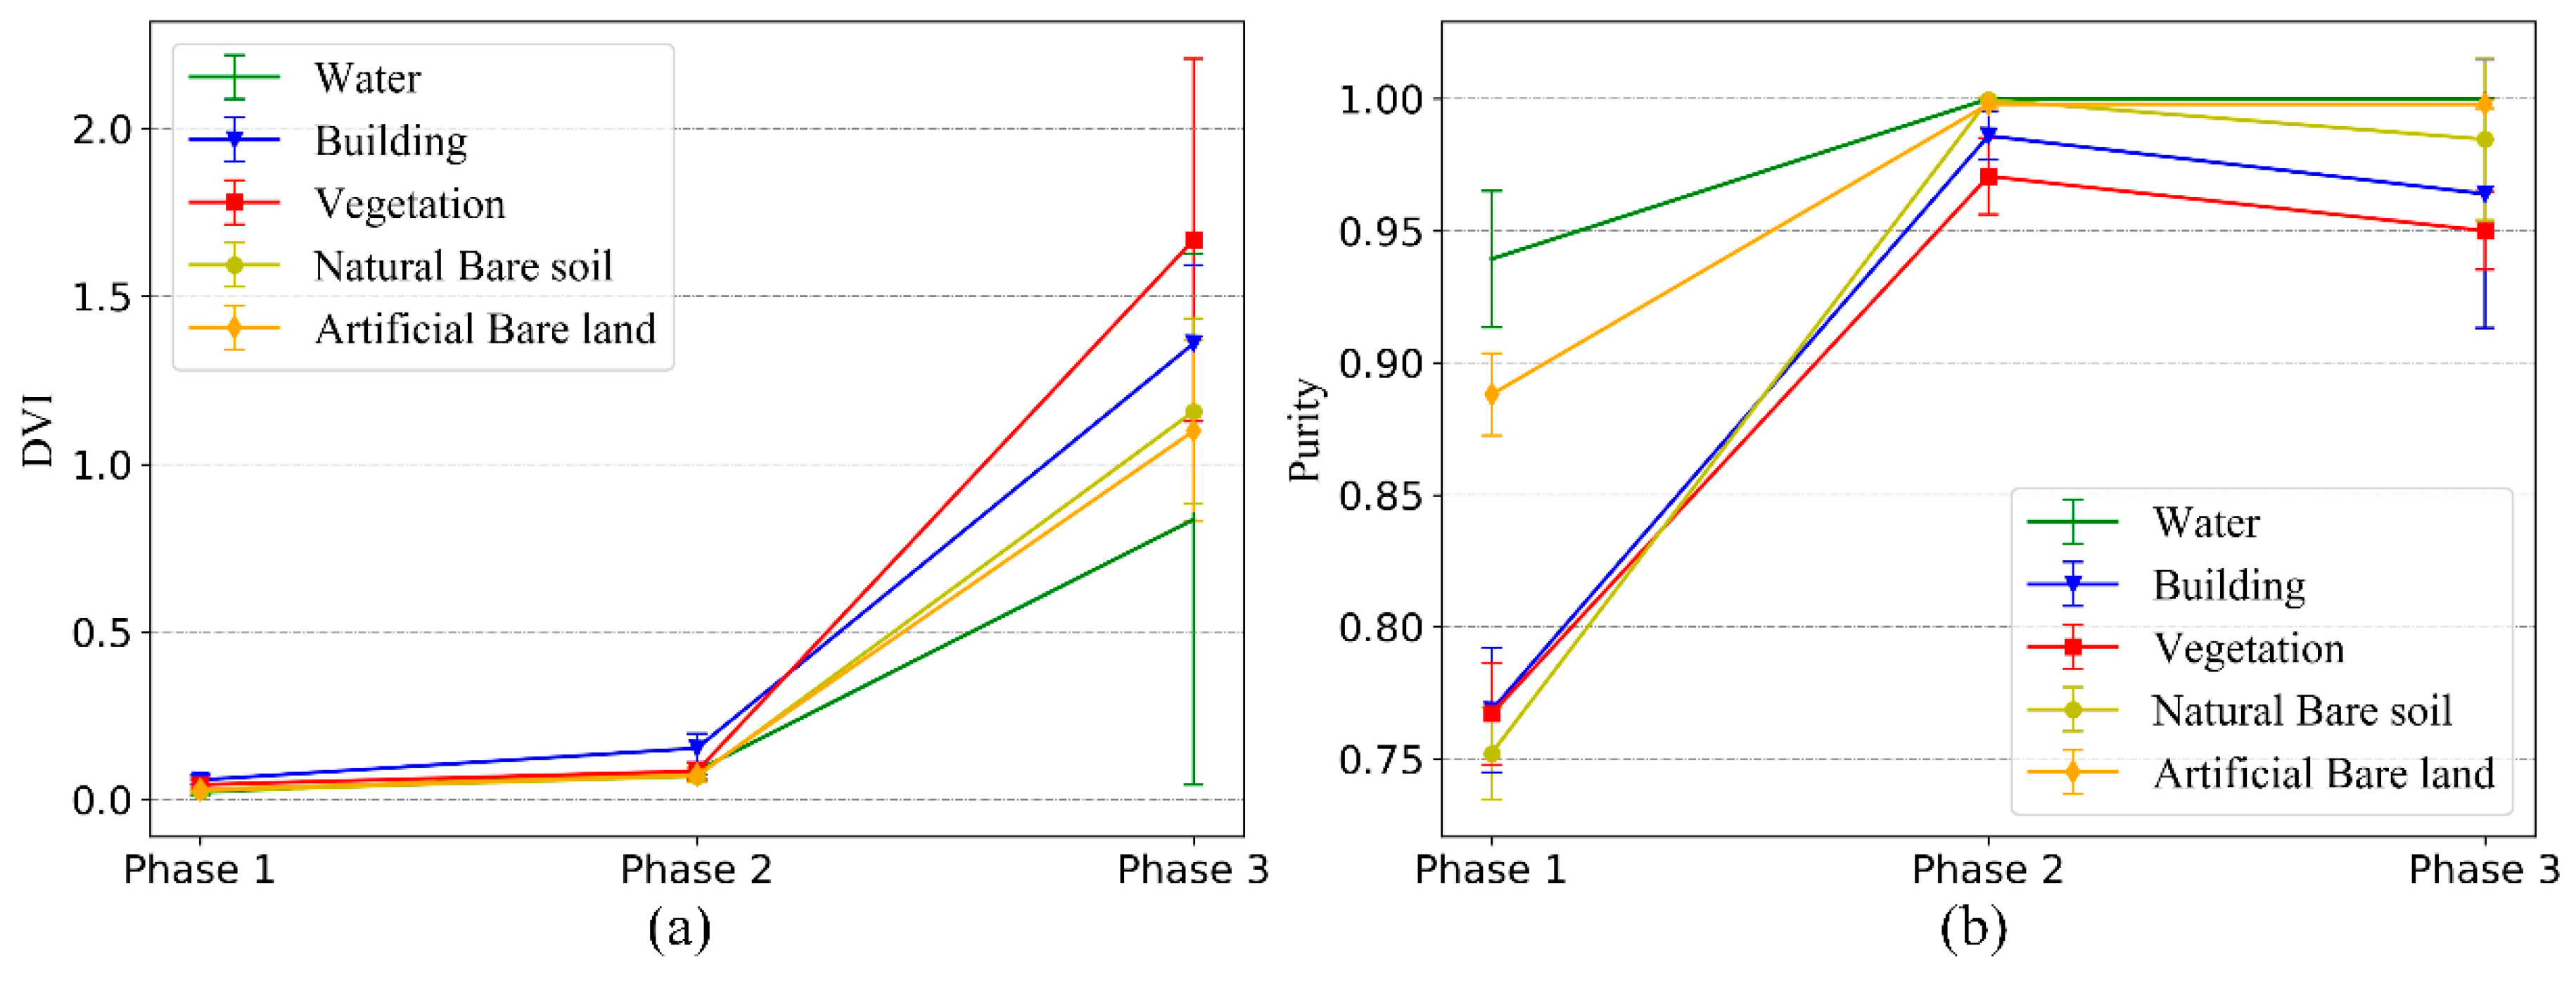
In view of the above problems, we use the Dunn validity index (DVI) to assist in the automatic setting of the rule for the stopping of the merging. The DVI is defined as the shortest distance of any two clusters divided by the largest distance in any cluster. Its formula is as follows:
where
is the Wishart distance between two time-series clusters and
is the distance (reciprocal of
) between the time-series sample and the cluster center in a time-series cluster.
Since is the maximum distance between the sample and the cluster center in any cluster, it depends on the internal situation of a cluster. Therefore, only when incorrect cluster merges occur will the value change significantly, so it can be considered that it is almost unchanged in the process of cluster merging. However, the cluster merging involves merging the two nearest clusters at a time, so will increase progressively, and the DVI will also increase progressively. After each time of cluster merging, if there are two or more clusters of the same type, the change range of will be very small, because the distance between the same type cluster is far less than the distance between different types of clusters. If the number of the same type of cluster is less than two after a merging, the value of will become the distance between the two different types of clusters, which will then increase dramatically, resulting in a sharp increase in DVI value.
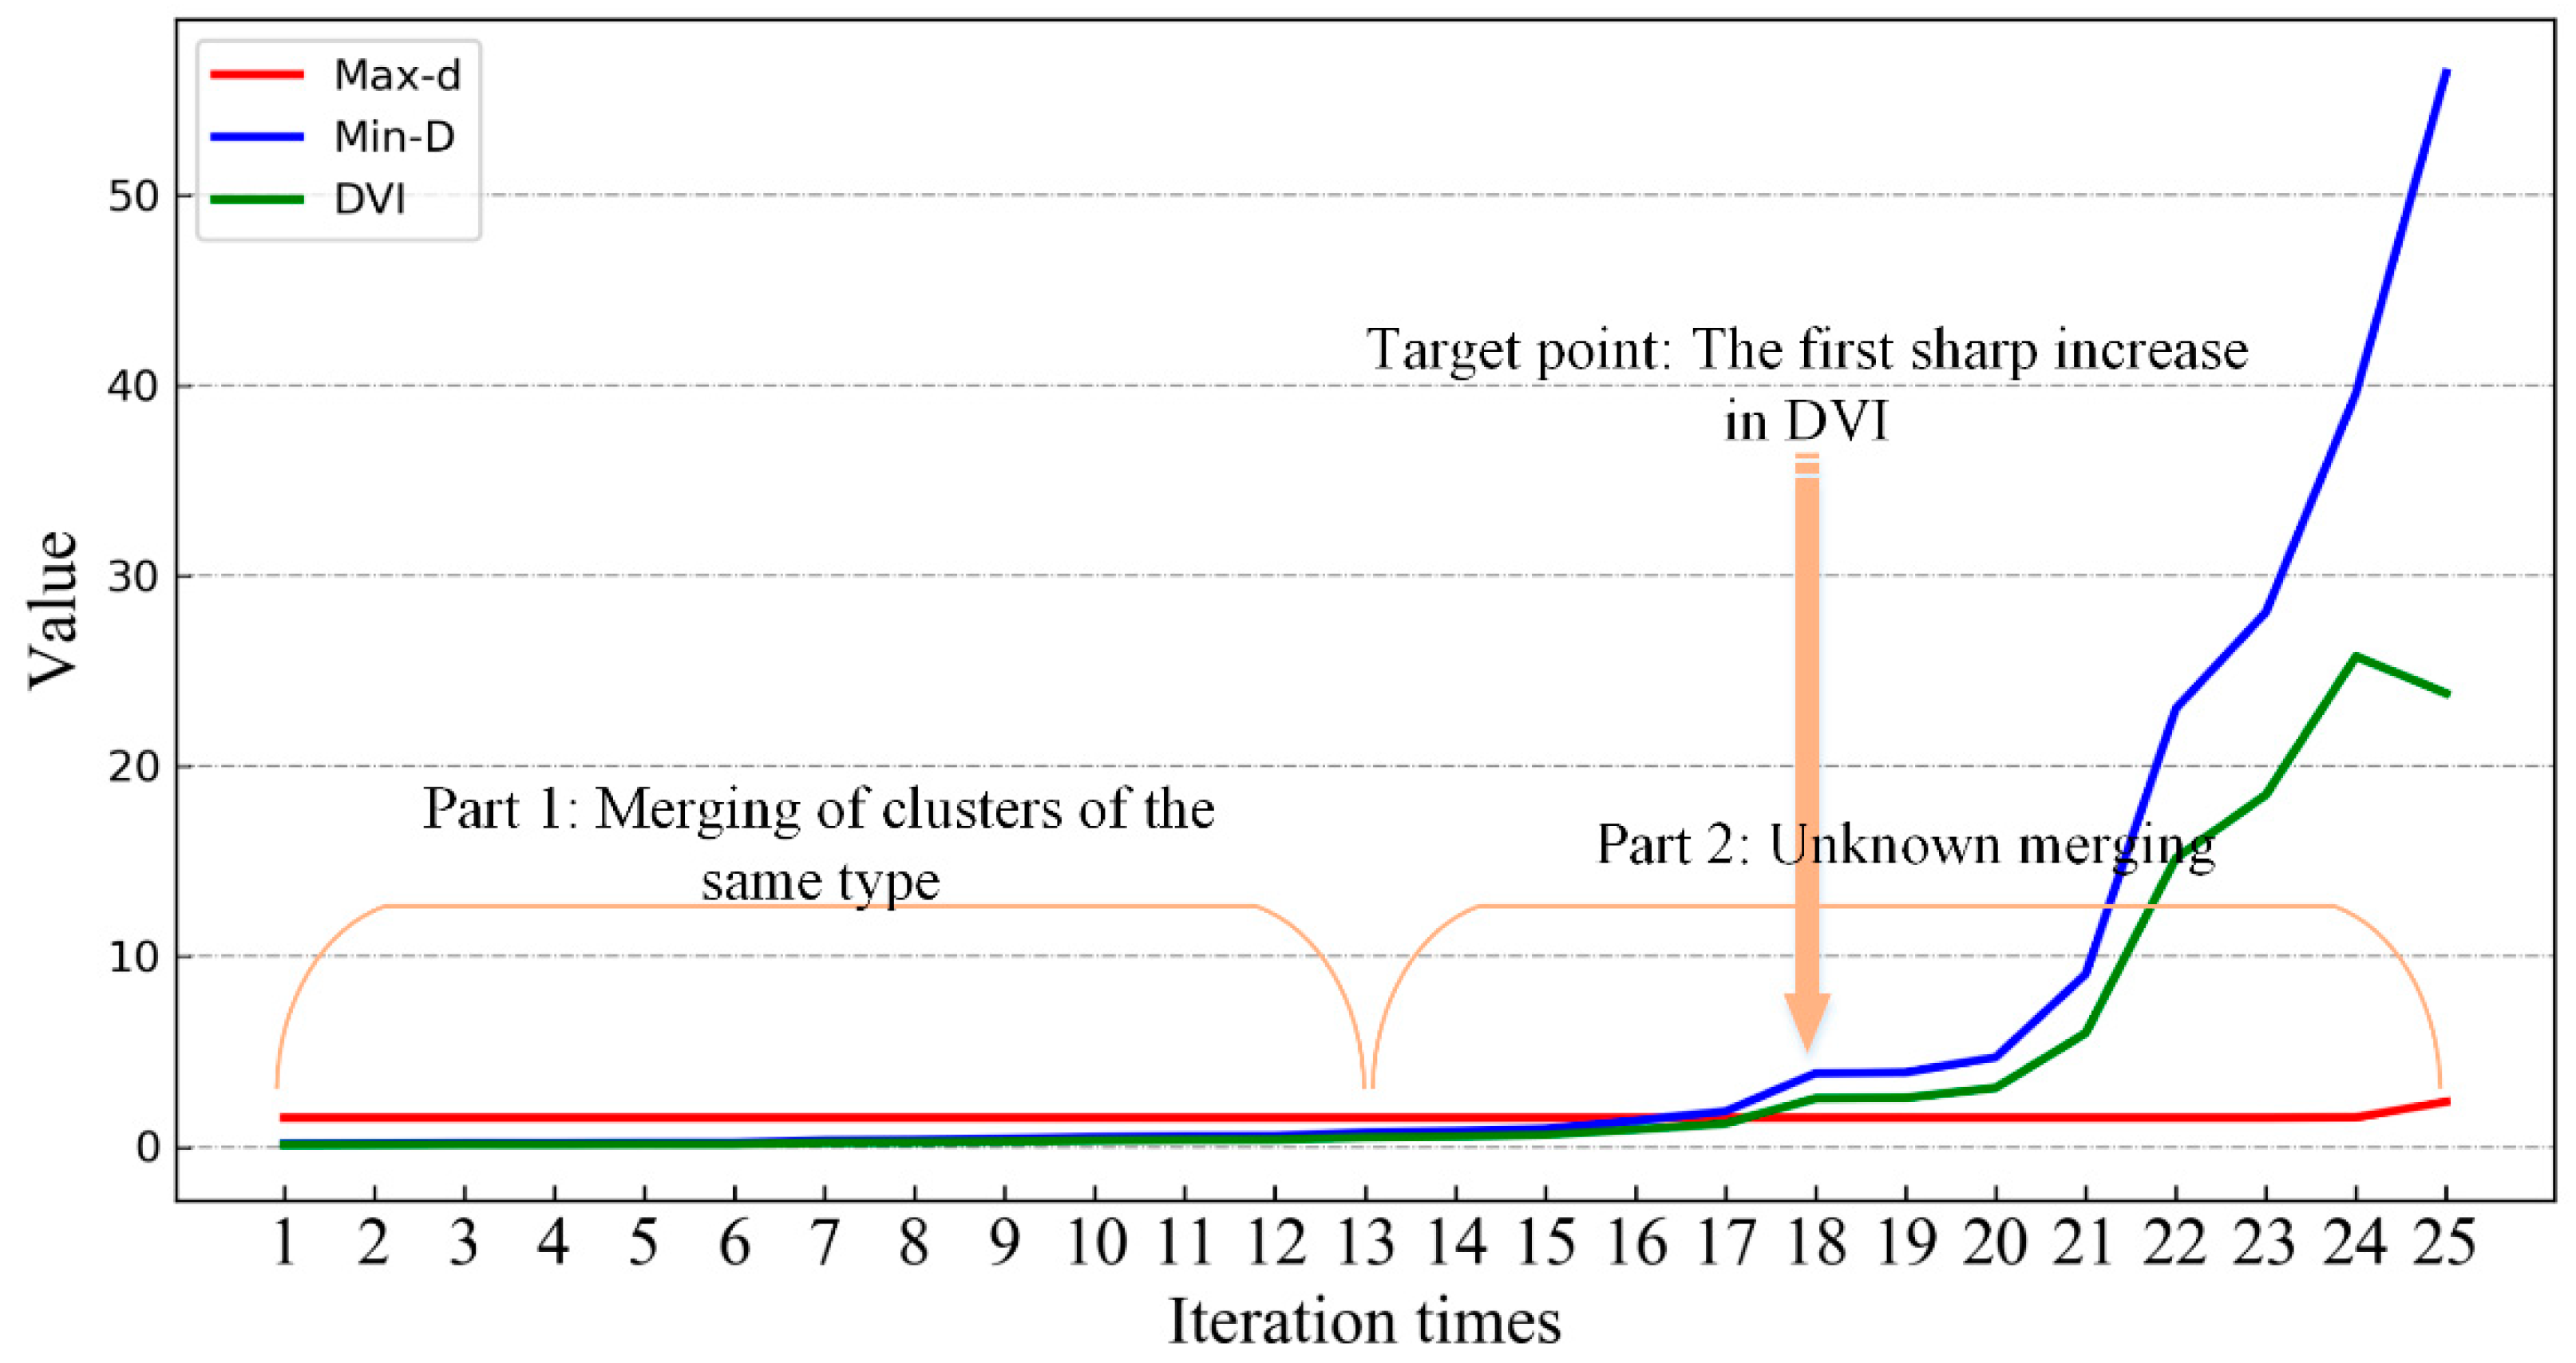
Therefore, the first sharp increase in DVI means that all the same types of time-series clusters are merged. Since the size of the change is a relative value, a simple but effective strategy to automatically determine when the DVI has a sharp change is described in detail below in
Figure 3:
Figure 3 is the curve of DVI change with merging times when the number of clusters is merged to two. The DVI of the 18
th merging in the graph increases obviously, which indicates that all the same types of clusters have been merged at this time, so the 18
th merging is the best merging termination position.
In order to automatically locate the above position, the number of initial cluster centers is and the totality of the types of time-series samples is , where is set artificially, and the specific value of is unknown, but it is related to the condition of the change of samples in each phase image, so it is generally small. If is set to a large value so that > * 2, then the former /2 times of cluster merging will be the merging of the same type of cluster, and then their DVI changes can be used as a benchmark to judge the degree of DVI change in the subsequent merging.
In
Figure 3, Part 1 is the reference area, Part 2 is the search area, and a threshold is set based on the change of DVI value of Part 1 (the difference between the maximum and minimum values is used as the threshold in this paper). When the change of DVI in Part 2 is greater than the threshold, the merging will stop. Based on the above strategy, the merging can be stopped automatically and effectively, without knowing the optimal number of cluster centers.
The specific process of cluster merging is shown in Phase 3 of
Figure 2. Firstly, the distances between all the cluster centers are calculated using the Wishart distance between classes. The two nearest cluster centers are then merged and the cluster centers are recalculated. After each merge, the changes of the DVI curves are recorded and the above process is repeated iteratively. When the DVI increases significantly relative to the reference area after a merging, the merging does not continue and the clustering results are finally output.
2.3. Transductive Label Transfer-Based on Time-Series Clustering
The proposed three-phase time-series clustering algorithm can cluster the time-series samples into different clusters. In order to transfer the label of the source domain samples, we first need to extract the cluster we are interested in from the clustering results. In this paper, we are interested in the cluster which is composed of time-series samples that have not changed in the whole time series. Taking
Figure 1 as an example, the number of samples in each type of time series (i.e., the number of samples in their corresponding time-series clusters) is
, respectively. The first type is the time-series samples that have not changed in the whole time series. In order to extract this cluster, a condition is set as follows:
The above condition can be summarized as “the number of unchanged time-series samples is dominant”. Actually, this condition is easy to meet. Firstly, for a large area in a remote sensing image, its change in the time-series images will always be gradual. Secondly, even if the ground objects change significantly, the degree of change in each image will be different. In addition, we use a uniform sampling strategy when selecting samples from the images. Thus, the number of unchanged time-series samples is often dominant, which was proved by the experiments with different data and different types of objects. Based on the above condition, the time-series cluster with the largest number of time-series samples is the one we are interested in.
After extracting the time-series samples from the clusters of interest, because the class of the objects of these time-series samples does not change in the whole time series, their class labels in the source domain images can be directly assigned to the target domain images. Thus, we can obtain a group of target domain labeled samples, i.e., the label transfers, without relying on the supervised information of the target domain images.
In this paper, the three-phase time-series clustering algorithm is applied to the transfer of sample labels. In this process, there is no need to use labeled samples in the target domain, so it is a transductive transfer method. In the process of time-series clustering, the similarity measure is constructed based on the relational knowledge between objects in the sequential images, so it is also a relational knowledge transfer method.
4. Discussion
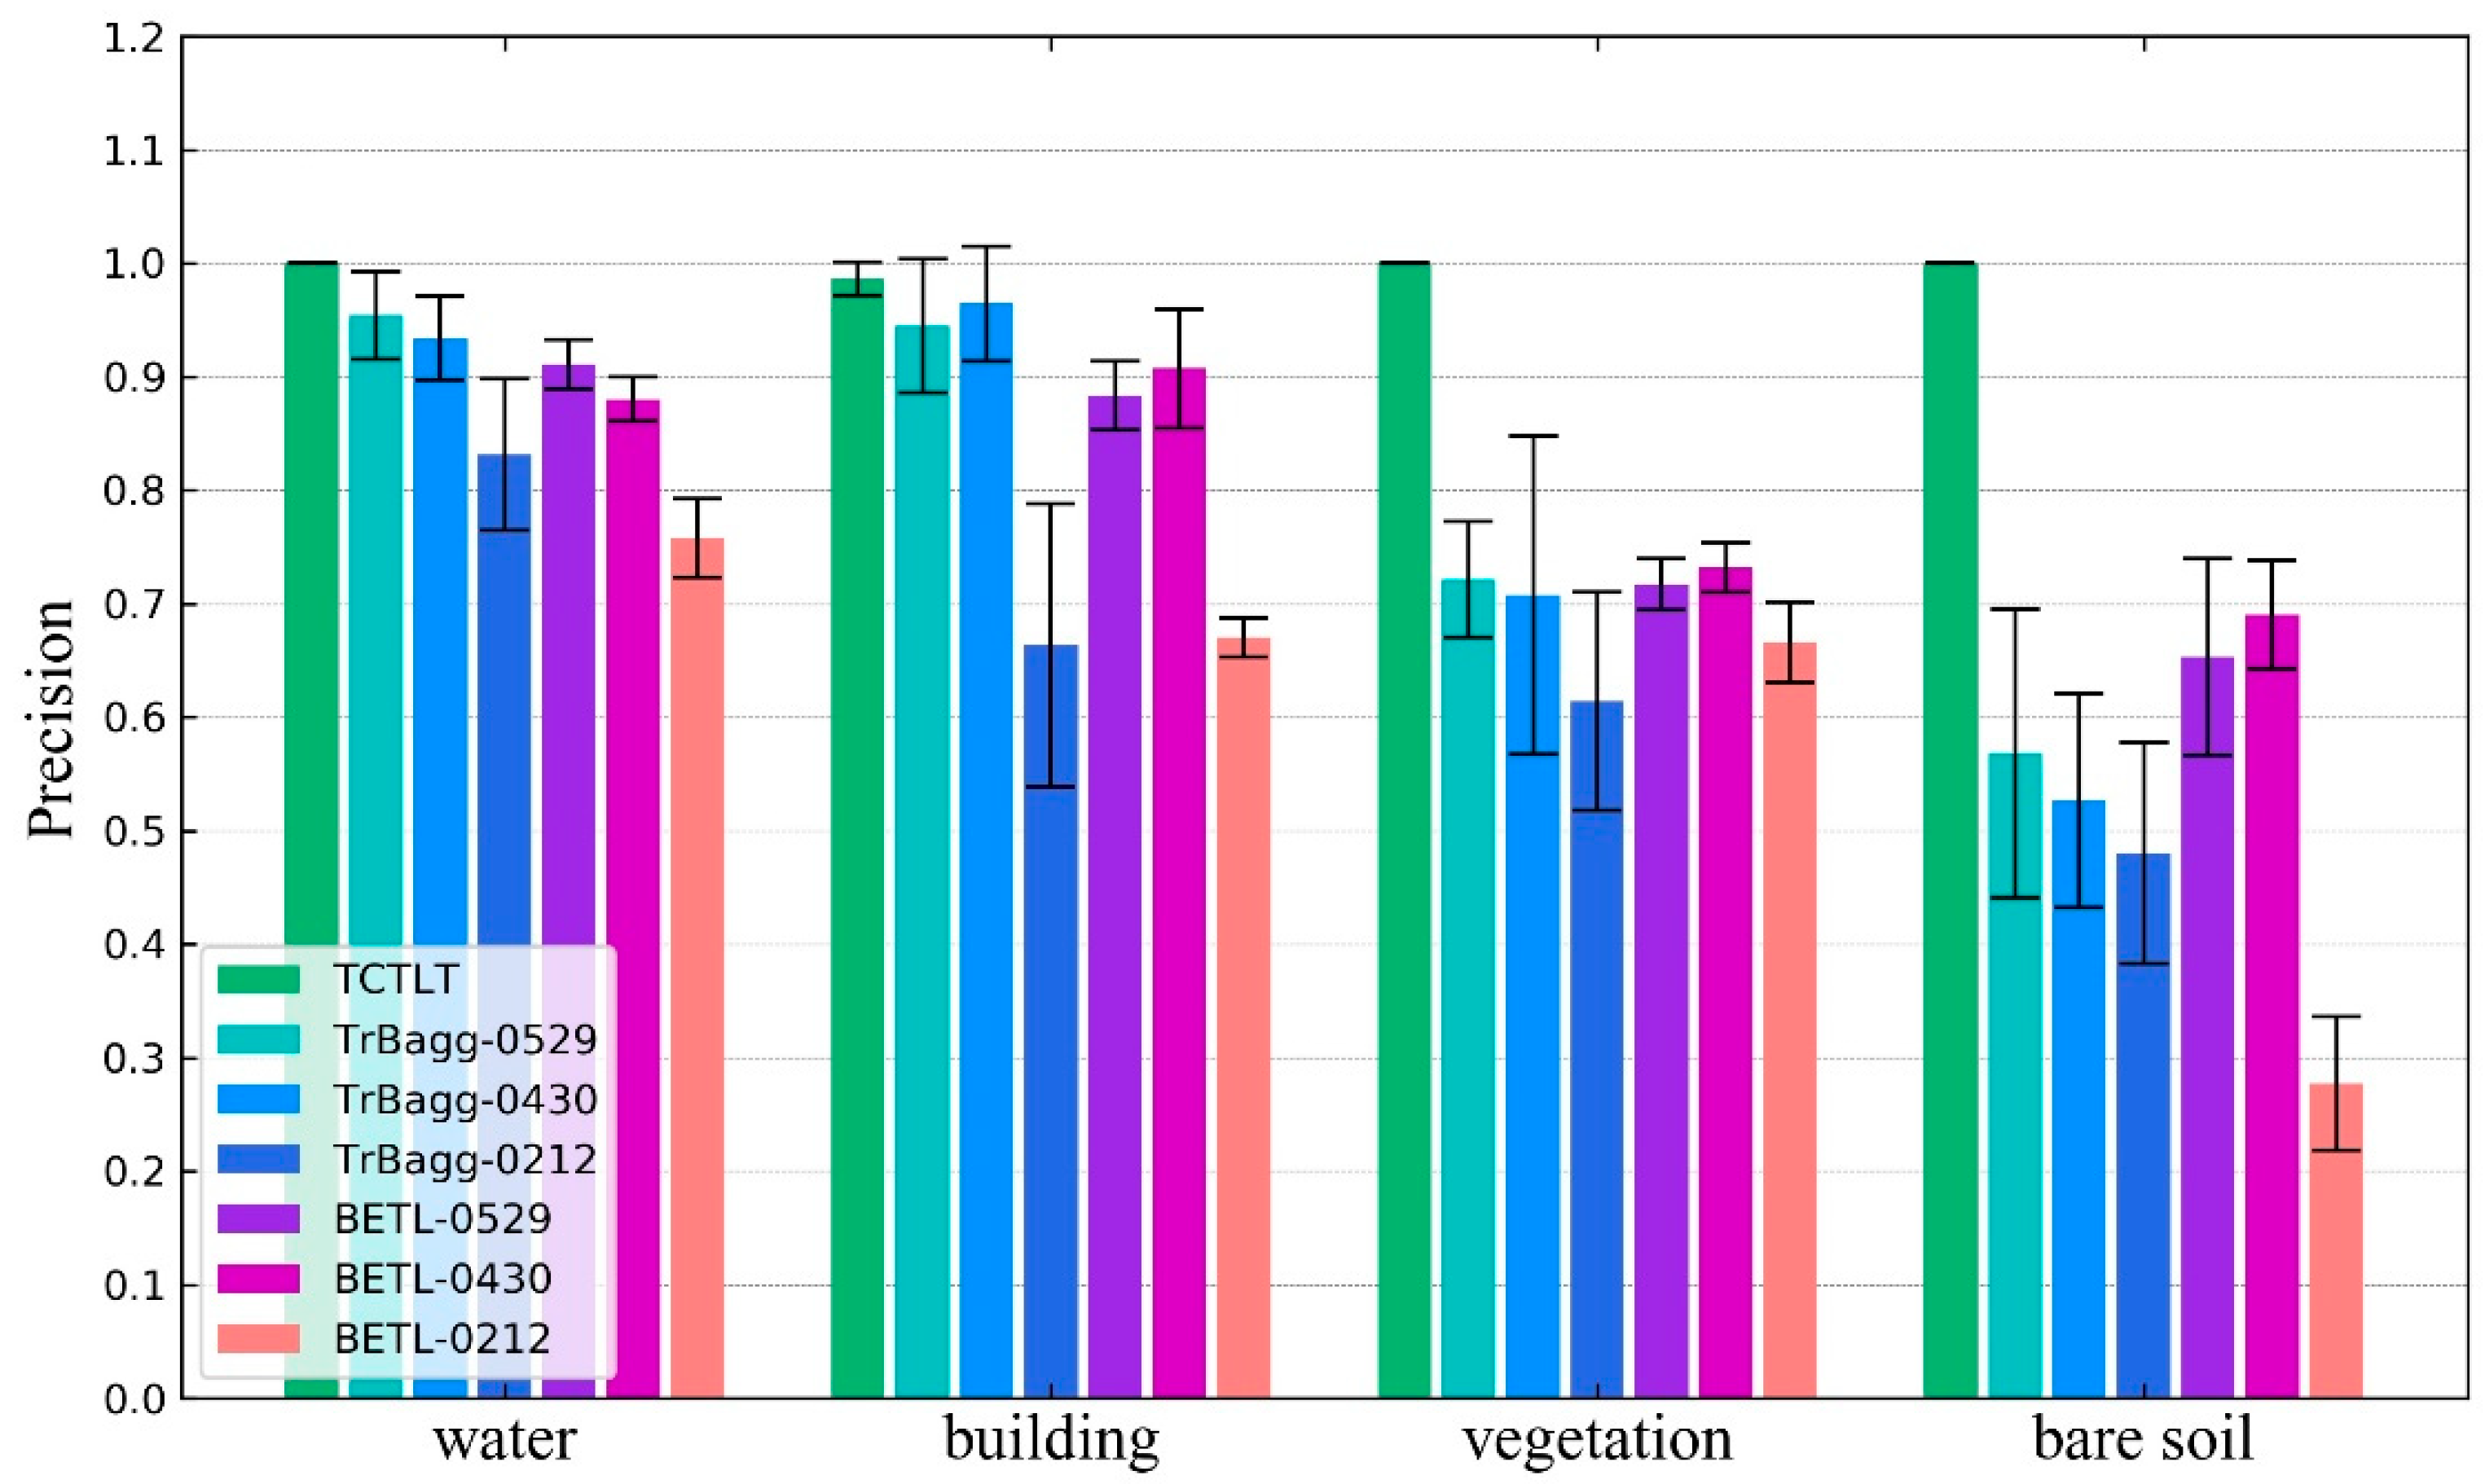
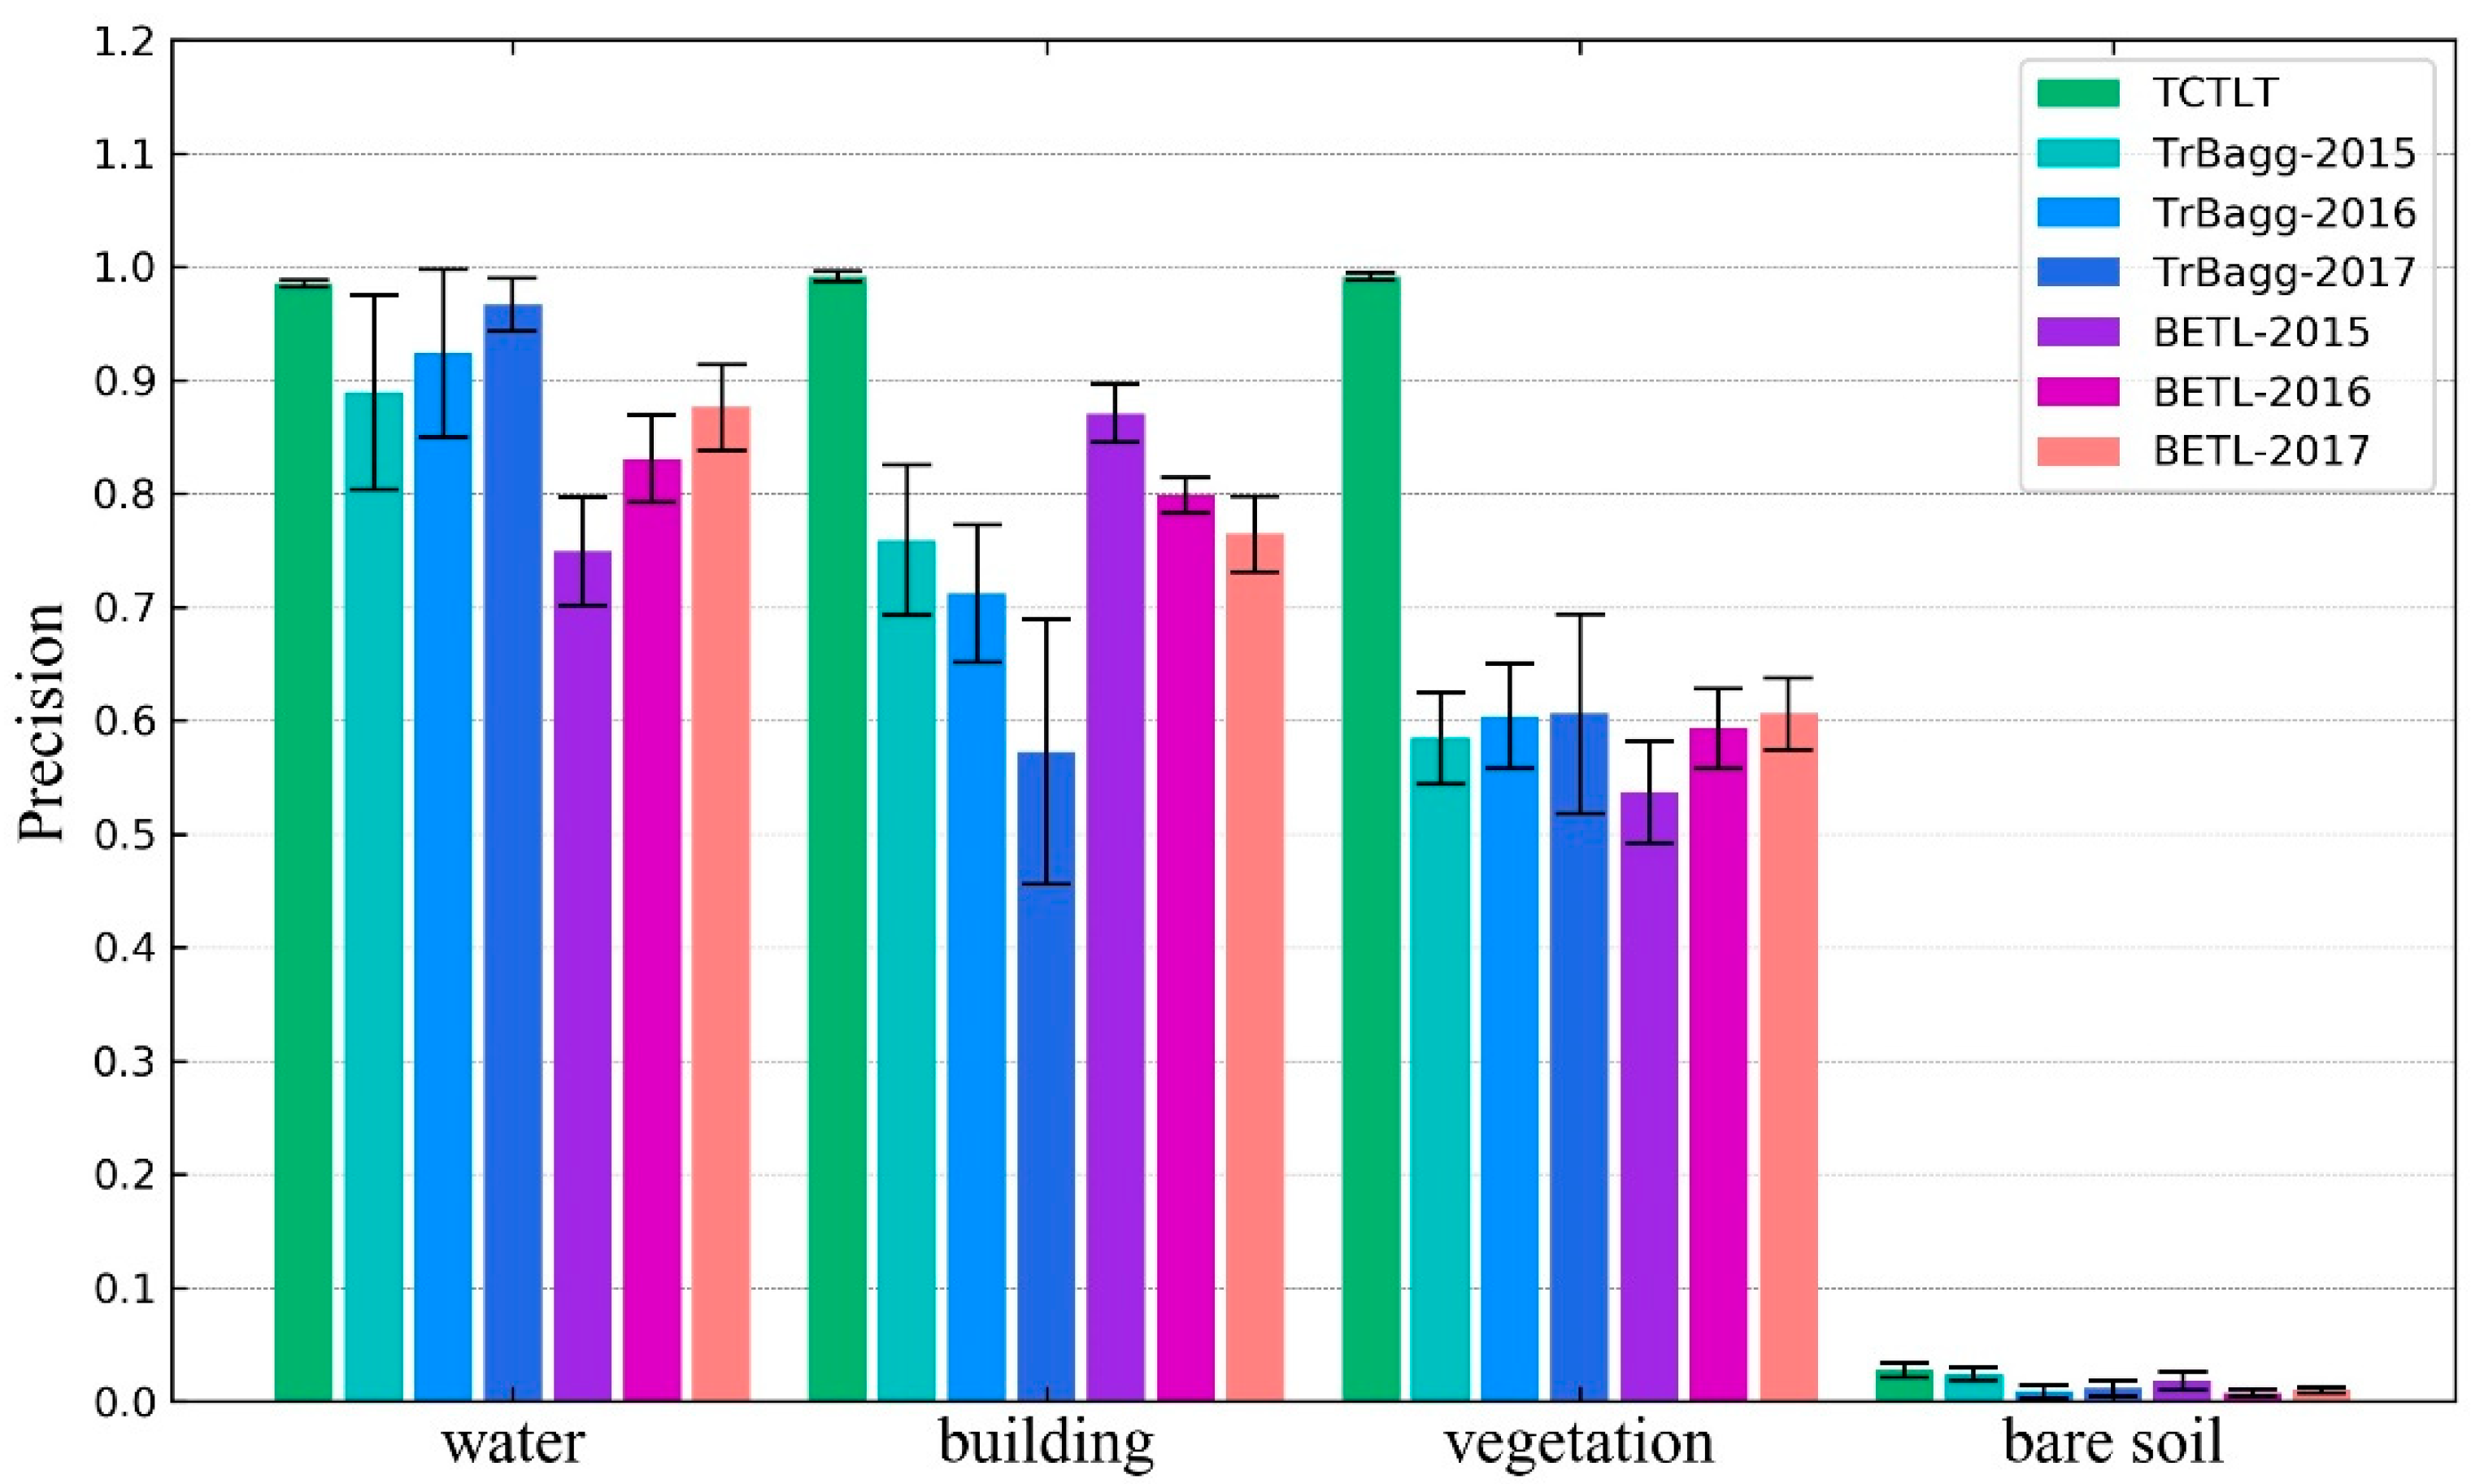
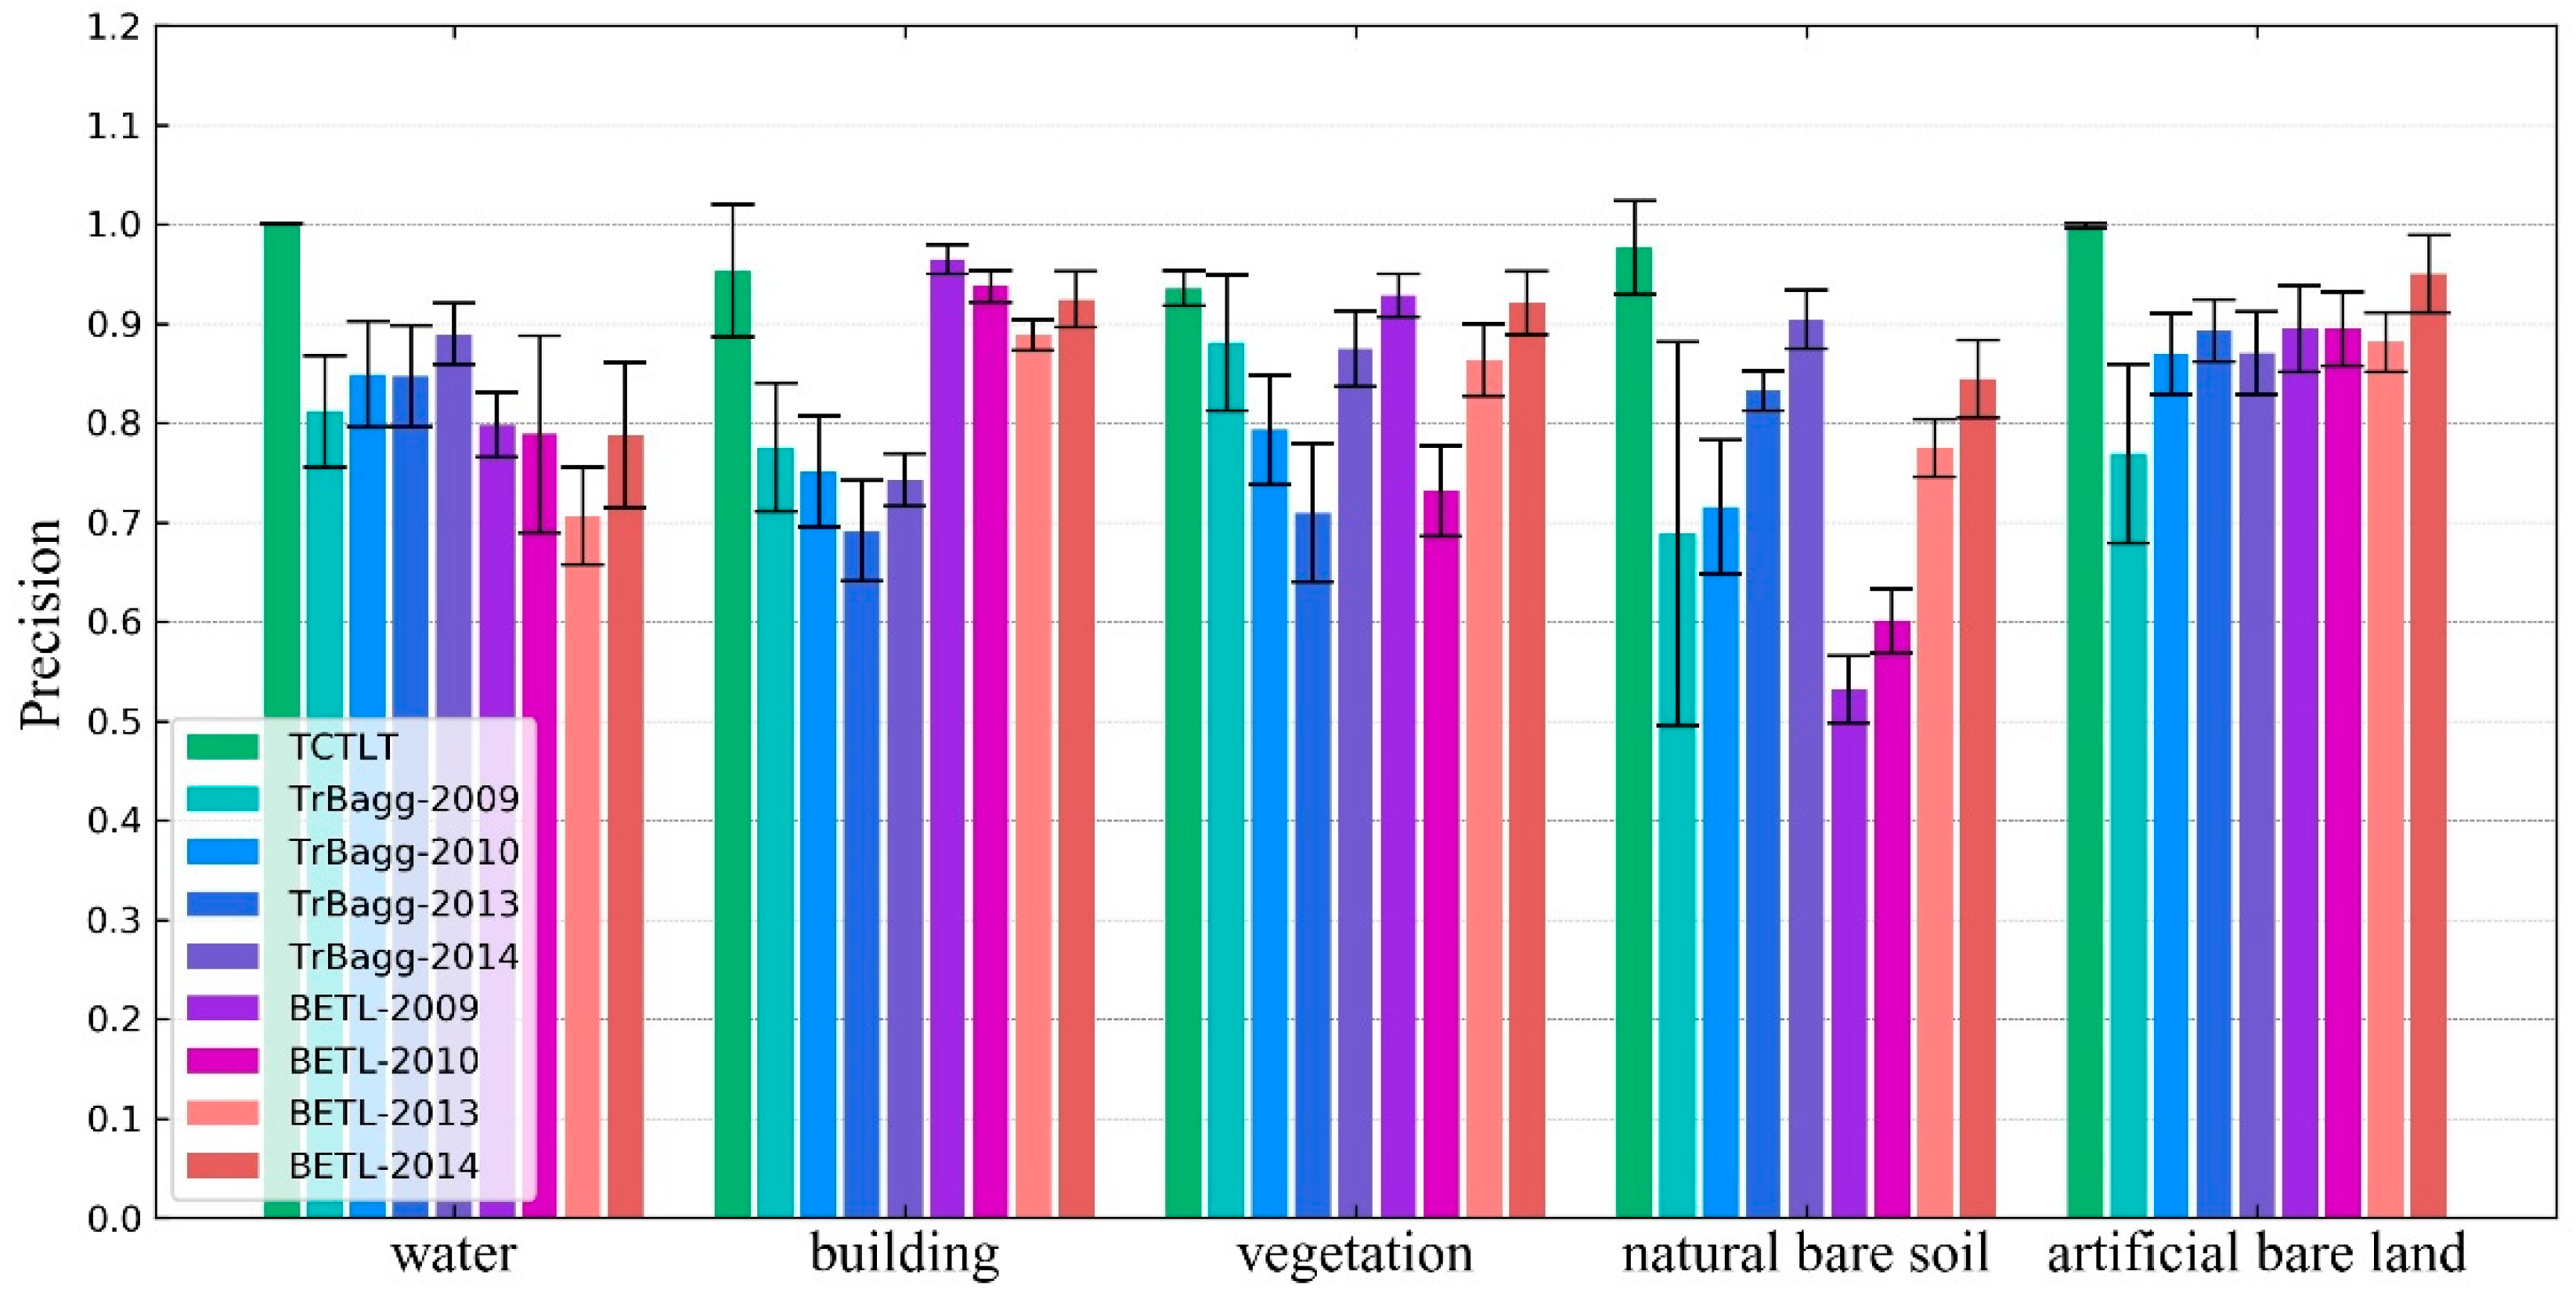
The difference between the target domain and the source domain is an important factor affecting the precision of the transfer learning methods. In this paper, when the difference between the target domain image and the source domain image is large (such as the 0212 image in experiment one), the transfer precision of TrBagg and BETL decreases significantly. Furthermore, for algorithms such as TrBagg and BETL, which rely on integrated weak classifiers for the transfer, the other main factors affecting the precision are the separability of the different classes of ground objects, the performance of the weak classifiers, the selection of features, and the quality of the target domain samples. (1) The transfer precision is high for objects which are easy to classify, but when the object is difficult to distinguish, its transfer precision will be very unreliable. (2) The weak classifier used in the corresponding literature [
2,
8] was the NB classifier, but in this study, the effect of this classifier was found to be not ideal. After comparing decision tree, NB, and SVM classifiers, it was found that using SVM as the weak classifier could allow TrBagg and BETL to reach a higher precision. (3) Feature selection is an important research topic in image classification and the quality of the feature selection directly affects the classification. In this paper, we do not discuss this issue further, so we chose as many features as possible for TrBagg and BETL. 4) The result of the label transfer is closely related to the quality of the labeled samples in the target domain. Because the labeled samples in the target domain were different in each run of the experiments, the experimental results showed that the transfer precision of TrBagg and BETL varies over a large range (the standard deviation is high).
For the above factors, first of all, the proposed method (TCTLT) is a transfer learning method based on relational knowledge: in a single image, the similarity between the objects of the same class is considered, and in different images, the overall difference is considered. Thus, the proposed method can effectively overcome the problem of a large difference between the target domain and source domain. Secondly, the label transfer process in the proposed method is carried out in a single class of object and is thus not easily affected by the separability of ground objects. Thirdly, this method does not undertake classification, but uses the polarimetric covariance matrix to describe the time-series curve, and designs an effective similarity measure, so that it can obtain reliable time-series clustering results.
TCTLT is also a transductive transfer learning method, which does not need labeled target domain samples in the process of label transfer. Therefore, this method has a high application value. For example, when faced with the classification task for a long time series of images, in the case of existing source domain sample labels, inductive transfer learning methods (such as TrBagg and BETL) need to select a certain number of labeled samples from each target domain image, and the more samples that are selected, the more accurate the transfer will be, so a lot of manual participation is needed. In contrast, the proposed method uses temporal and spatial correlation information between the time-series images to replace the supervised information of the target domain for the label transfer, without additional workload. Therefore, in the case of a long time series and a large amount of data, the advantages of TCTLT are more obvious. Thus, we believe that TCTLT will be able to provide technical support for surface dynamics monitoring, emergency response, remote sensing processing of large data volumes, and so on.
We have also observed the computational efficiency of TCTLT. In this method, optimization clustering and cluster merging are more time-consuming. The processing time of optimization clustering is related to the number of cluster centers (represented by m) and the number of time-series samples (represented by n), i.e., its time complexity is , and the time complexity of cluster merging is , which is related to the number of cluster centers. Taking experiment one as an example, the processing time of TCTLT is 518.9s, while the processing time of Trbagg and BETL are 73.5s and 16.7s, respectively. Although the TCTLT have a lower computational efficiency, it is still meaningful in practical applications for its relying not on the target domain labeled samples.
In summary, many of the existing transfer learning methods have strong universality and wide application scenarios, but in the label transfer of PolSAR time-series images, they either cannot achieve a high accuracy or require additional conditions, and thus have difficulty in meeting the requirements. In contrast, TCTLT is designed for PolSAR time-series images, and has strong pertinence, so it is more effective in the label transfer of PolSAR time-series images. The main disadvantage of TCTLT is that it needs to meet the condition that the number of unchanged time-series samples is dominant, but this condition is easily met in most application scenarios.


