1. Introduction
Communities in developing countries rely on freshwater stored in small waterbodies for agricultural, domestic, mining, and industrial use [
1]. These water resources are highly susceptible to climate variations and are often not sufficient to withstand long periods of drought. Recently, the water resources of the Cape Winelands District of South Africa have been under severe pressure due to drought conditions brought about by the El Niño weather cycle [
2]. Agriculture plays a critical role in this region’s economy [
3], with wine production alone contributing to more than 30% of its regional gross domestic product (RGDP). Furthermore, the wine production industry provides more than 8% of the employment in the Western Cape Province [
4]. The district is well-known for irrigated perennial crop production, mainly grapes (mostly for wine production) and fruits (apples, pears, peaches, olives, and citrus) [
2]. In contrast to other parts of southern Africa, the area has a semi-arid Mediterranean climate with a mean annual rainfall of about 400 mm [
5] and, as such, receives winter rainfall when demand for irrigation water is relatively low. In contrast, the growing season occurs during the dry and hot months when rainfall is low (about 20% of the total annual) and water demand for irrigation is at its apex [
6].
During the recent drought (2015–2018), water reserves in the principal reservoirs were reduced to below 17% (April 2018), necessitating the implementation of drastic water restrictions by as much as 80% of normal usage for crop irrigation and industrial and domestic use [
7]. Authorities were confronted with difficult decisions about how to best manage the limited available water resources and minimise the inevitable socio-economic impacts. Many limitations of existing procedures and gaps in available information sources were exposed. One of the biggest needs was to determine how resilient the agricultural industry, in particular the perennial crops sector, would be to severe water restrictions. This proved to be challenging given that no operational systems are in place to quantify and monitor how much water is stored in privately owned and managed reservoirs (dams). These reservoirs are of various sizes, ranging from 0.5–5 km
2. Most of these dams are ungauged and setting up, maintaining, and managing conventional in situ surveys, gauge stations, and telemetry networks would be prohibitively expensive and time-consuming [
8].
Satellite remote sensing techniques have been shown to provide a viable alternative for monitoring water bodies. Satellite data can provide real-time, dynamic, and cost-effective information, and Earth observation procedures can be set up to provide operational (autonomous) monitoring of water resources [
9,
10]. Several methods have been proposed to classify surface water areas using either multispectral [
9,
11,
12] or SAR remotely sensed data [
13,
14]. Popular techniques are image thresholding (rule-based classification) and supervised/unsupervised classification [
15]. Image thresholding is easy to implement and thresholds that can be applied to images of different dates and areas can be automatically applied and are computationally inexpensive (not time-consuming) [
9,
16].
During thresholding, a single threshold value within the image scene is determined and all pixels below (or above) it are classified as water or non-water. According to Pierdicca et al. [
17], the identification of a suitable threshold relies on a range of environmental factors, including atmospheric conditions, adjacency effects, mixed pixels, shadows and system factors such as viewing angle and pixel size [
18,
19,
20]. Defining a robust threshold, one that will work effectively in different areas and on imagery acquired on different dates, has been cited by Feyisa et al. [
21] as being a very challenging task, especially in optically complex (e.g., flooded vegetation and sedimented and turbid water) environments. An alternative approach to finding a single “optimal” threshold that will work in multiple situations is to make use of automated, image-specific, threshold identification methods. Several such techniques have been proposed, among which Otsu’s simple and robust algorithm [
22] is one of the most utilised techniques for surface water mapping [
9,
12,
15]. The Otsu algorithm finds a threshold by maximising the inter-class variance and minimising the weighted within-class variance [
22].
Supervised and unsupervised classification techniques have also been popular for mapping water features using remotely sensed data [
23,
24]. For instance, using 30 m multispectral Landsat TM imagery, Xie et al. [
25] obtained an accuracy of 96%, whereas Pradhan et al. [
26] achieved an accuracy of 58% using 3 m TerraSAR-X data to retrieve water (flooded) pixels based on iterative self-organizing data analysis technique (ISODATA) unsupervised classification. The relatively low accuracy of the latter study was attributed to the presence of vegetation in the flooded area. Feng et al. [
27] employed supervised classification to map surface waterbodies with 30 m multispectral HJ-1B imagery and achieved 94% overall accuracies. Similarly, Verpoorter et al. [
28] achieved an accuracy of 95% using Landsat 7 ETM+ imagery. Although many authors agree that supervised classification is an efficient (accurate and fast) approach to map waterbodies, many highlight the need for prior definitions (training sites) to construct models capable of classifying unknown sites. The generation and collection of training samples is time-consuming, expensive, and tedious, often requiring extensive field visits. Nevertheless, recent implementations of non-parametric MLAs, including SVM, RF and DT, have demonstrated their value for mapping surface water. MLAs have the ability to classify unknown sites accurately using relatively small training sets and can handle large numbers of features [
29].
In general, SAR and multispectral techniques are capable of accurately extracting water features if there is a significant contrast between water and non-water features in the data. However, the optical complexity of water affects the reflected spectral profile and backscatter values. For instance, the waterbodies in the Cape Winelands are characterised by varying concentrations of suspended sediments (turbidity), algae (e.g., chlorophylls, carotenoids), chemicals (e.g., nutrients, pesticides, and metals), dissolved organic matter, and aquatic plants [
30,
31]. This makes the implementation of supervised remote sensing-based water extraction methods difficult, as training data needs to be universally applicable and frequently updated, especially in the case of water bodies that are highly dynamic (reservoirs may be full or empty). To date, the remote sensing research community has given very little attention to how these variations affect waterbody mapping. Notable exceptions include Hong et al. [
32], Frazier and Page [
33], and Yang and Chen [
34], who used RADARSAT-1 (16 m), Landsat TM (30 m), and S2 (10 m) data to map optically complex waterbodies. The latter study mapped optically complex waterbodies in urban areas and concluded that it is necessary to find the most appropriate and practical water identification methods regardless of the physical and chemical characteristics of waterbodies. In the studies done by Hong, Jang, Kim, and Sohn [
32] and Yang and Chen [
34], the water properties and conditions were not characterised. However, Frazier and Page [
33] mapped the waterbodies with a defined turbidity of 90 mg/L.
The ESA recently launched a constellation of high spatial and temporal resolution satellites, namely S1 and S2, carrying C-band SAR and multispectral sensors, respectively [
35]. Thanks to their dual-satellite-per-orbit configurations, S1 and S2 have relatively high revisit times of six and five days respectively. To our knowledge, no research has evaluated how data from these satellites can be combined to improve classification accuracies of waterbodies in complex environments, such as the Winelands District of South Africa [
36,
37].
Taking into account the challenges of mapping waterbodies with diverse physical and chemical characteristics, the objective of this study is as follows:
To compare the performance of simple rule-based methods, i.e., the application of dynamic thresholds that can be easily incorporated into operational workflows, to the performance of supervised learning approaches (i.e., MLAs).
Thresholding and MLAs were applied to a range of features derived from Sentinel-1 (SAR) and Sentinel-2 (multispectral) data. This included a range of existing and new water indices and texture measures. Five popular MLAs, namely DTs, RF, k-NN, c-SVM, and SVM, were considered. The study concludes by assessing the value of combining SAR and multispectral thresholding rules for mapping optically complex waterbodies.
4. Discussion
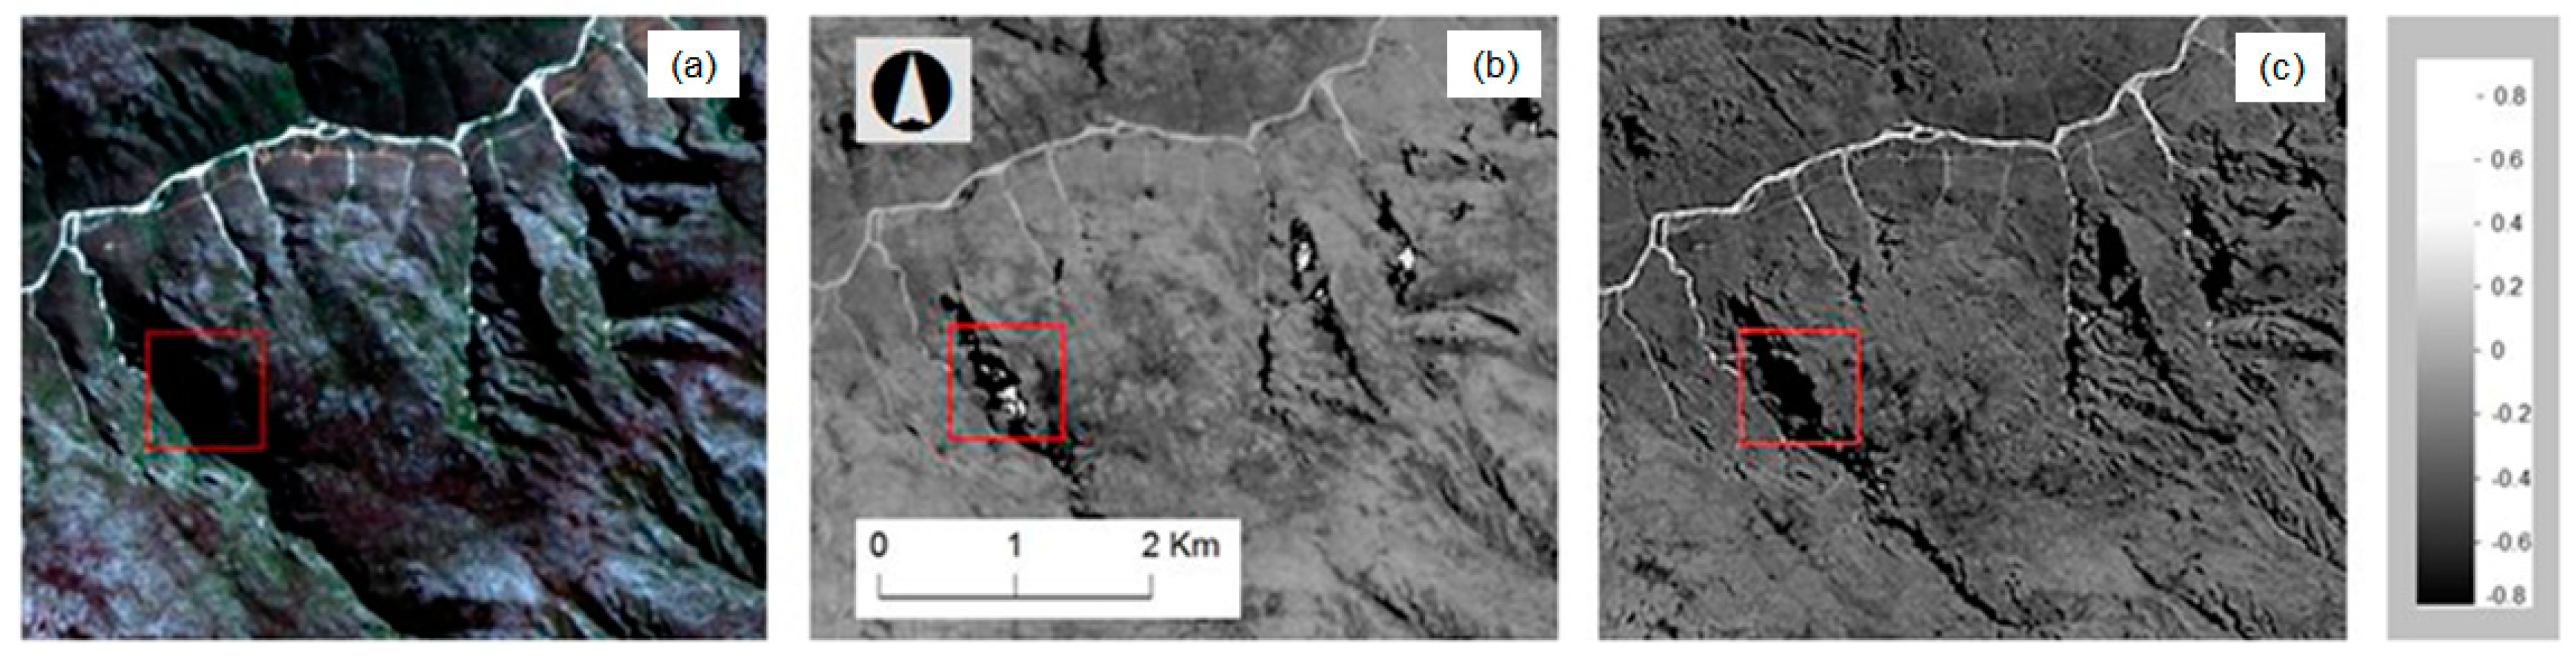
The results show that the characteristics of the water, type of classifier, and input feature dataset had a significant impact on the accuracies of the surface water classifications. With the multispectral data, the selection of the spectral index had a significant impact on accuracies. MNDWI’s lower OA compared to NDWI was mainly due to the under classification of humic rich water (
Figure 4) and over classification of shadows (
Figure 5).
NDWI was able to highlight dark, turbid, and eutrophied water more effectively than MNDWI. This finding contrasts with those of Xu [
41] and Zhai et al. [
73], who noted that MNDWI provided better discriminatory power than NDWI for shadowed and dark areas in close spectral proximity to water. Zhai, Wu, Qin, and Du [
73] found that MNDWI performed substantially better than NDWI in mapping waterbodies that have similar spectral profiles to shadows, while Xu [
41] showed that MNDWI performed significantly better than NDWI for extracting turbid water, which has a high spectral resemblance to some non-water classes. It should be noted, however, that these studies used spectral bands from Landsat 7 and Landsat 8, which differ from Sentinel-2 bands used in this study. However, our observations support those of Rokni et al. [
74] and Zhou et al. [
75], who found NDWI to be superior to other indices in delineating shallow and turbid lakes respectively. A likely explanation for NDWI performing better than MNDWI in our study was the study region. Although MNDWI is known to be more effective than NDWI in suppressing built-up features [
9,
11], it performed poorly in our study region, which is located in a rural setting. Nevertheless, the different OAs of NDWI and MNDWI suggest that the NIR and SWIR bands were more sensitive to the variations in physical and chemical properties of water than the green band.
It was observed that the SAR VH polarisation classified water more accurately than the VV polarisation did, irrespective of the targeted water characteristics. Classification errors at site H were mainly due to windy conditions at the time of acquisition, which created waves on the water surface and resulted in high backscatter signals. The VV polarization produced higher backscatter values over water surfaces than the VH polarization, which suggests that the former configuration is more sensitive to variations between water and non-water features. A bigger difference between the backscatter responses of land and water features was noted in the VH polarization than in the VV polarization. This corresponds well with Clement et al. [
76] who also noted that VH outperformed VV polarization for turbid water mapping. Our study observed that the refined Lee speckle filter can suppress the speckle effect and maintain details of the water boundary [
14], which is important for the identification of water pixels at the water/soil interface.
In this study, the semi-automated MLAs were used for benchmarking the autonomous thresholding results. All multispectral and SAR features were included in the MLAs to produce a best-case scenario. Although inequality within the waterbodies (e.g., depth, colour, and sediment variations) has been shown to affect classification results when using remotely sensed data [
75], this study has proved SVM to be less sensitive to intra-class variations compared to other classifiers. Moreover, SVM was credited with its ability to effectively separate classes that are spectrally similar (e.g., humic rich water and shadows). This was likely a major contributing factor to its outstanding performance in this study.
Challenges relating to different applications and data used were encountered when attempts were made to directly compare the findings of this study with those of previous studies. The majority of the published studies that focus on the use of MLAs for the supervised classification of RS data have been done for vegetation and crop type classification using Landsat data. However, the outcomes of this study are closely related to those of Sarp and Ozcelik [
77], who revealed that machine learning algorithms marginally outperform thresholding.
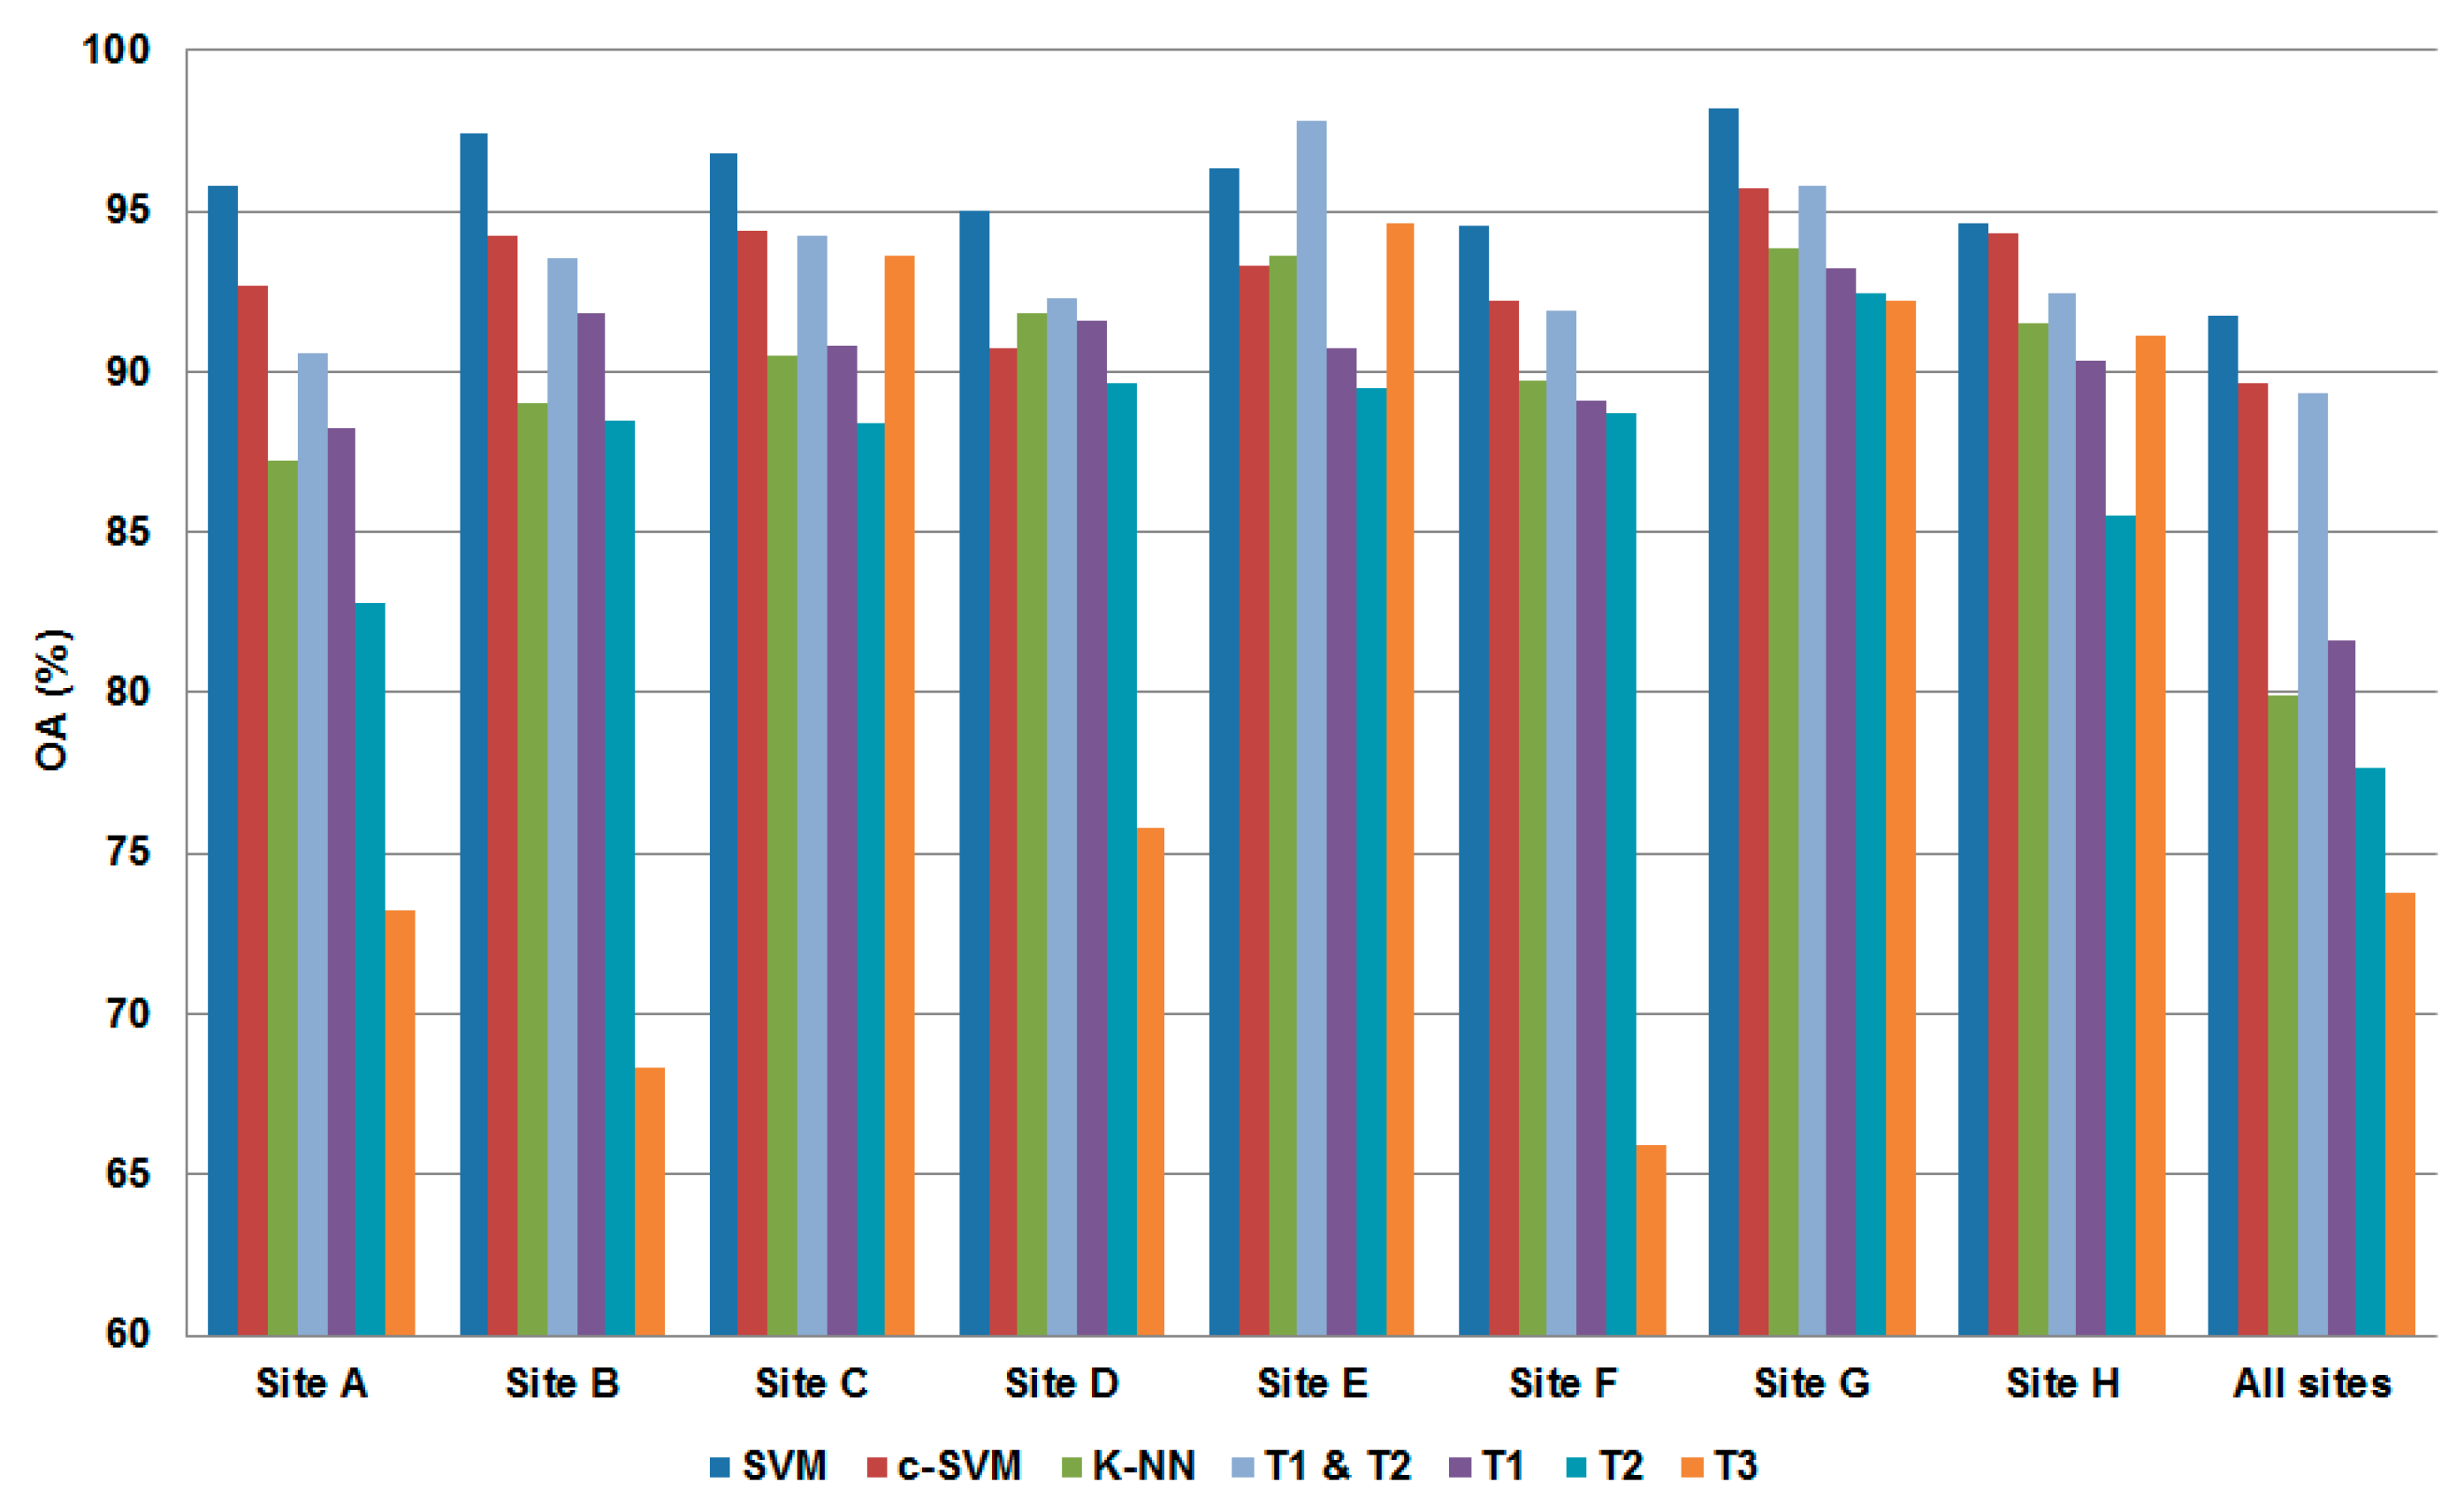
Although MLAs (specifically SVM) outperformed the thresholding methods in individual sites and when the sites were combined (i.e., when complexity increased), the main drawback of supervised MLAs is their dependence on training data. The application of supervised approaches is limited to regions for which representative samples of labelled data are available. Once training samples are established, they can be reused and applied to images with different dates and even of different areas. However, the accuracy of the resulting classifications is usually negatively affected [
24,
78,
79], mainly due to temporal and regional variations. Waterbodies are highly dynamic as they continuously fill up and empty, which makes the reuse of training sets very challenging and limits the operational implementation of supervised techniques for monitoring changes in surface water reservoirs.
Despite the relatively lower recorded accuracies of thresholding (compared to those of MLAs), it seems to be a viable solution for operational implementations. In contrast to supervised approaches that require training data and rule-set (expert system) approaches that make use of a set of static thresholds, thresholding generates dynamic rules (appropriate thresholds) that do not require human interaction or training data. However, our results show that the use of a single feature (rule) for thresholding produced relatively poor and unstable results. Combining the outputs of different thresholding results produced much better and more robust results. For instance, we combined the two best thresholding outputs (NDWI and VH Polarisation
RL) and found that the combination (using Boolean OR) of these SAR and multispectral features significantly improved the accuracy and stability of the surface water classifications. More work is needed to investigate the efficacy of other combinations of thresholding outputs. Furthermore, the differences in results between thresholding and MLAs can be related to many other issues, such as pre-processing (atmospheric effects), the thresholding algorithm used, and illumination geometry. Previous works have shown that larger variances between the water features and non-water features typically minimize the accuracy of water body mapping, especially when a small area of water bodies and large non-water features exist [
80,
81]. Future studies are recommended to quantitatively consider how the variations in depth and concentrations of sediments and chlorophyll can affect classification accuracies.
5. Conclusion
Accurate temporal and spatial changes for small waterbodies are critical for water security, drought monitoring, and crop irrigation decision-making. Remote sensing offers a reliable, cost-effective, and potentially autonomous alternative for surface water mapping of large and inaccessible areas. The recently launched Sentinel-1 and Sentinel-2 satellites provide fine spatial and temporal resolution remote sensing data, which makes it ideal for monitoring waterbodies at regional and even global scales.
In this study, we proposed an approach that combines automatic thresholding of near-concurrent NDWI (generated from Sentinel-1) and VH backscatter polarisations (generated from Sentinel-1) for mapping waterbodies (mainly reservoirs and dams) with diverse spectral and spatial characteristics. Waterbodies of different sizes and varying levels of turbidity, sedimentation, and eutrophication were targeted. The resulting maps were compared to the classification performances of five machine-learning algorithms (MLAs), namely decision tree (DT), k-nearest neighbour (k-NN), random forests (RF), and two implementations of the support vector machine (SVM). The results showed that the physical and chemical properties of water significantly affected classification accuracies. The performance of the best machine learning classifier (SVM) and thresholding (NDWI) dropped by more than 10% when the complexity of the task was increased (i.e., when the classifiers were applied to all sites in combination). However, the union of the two best thresholding results (NDWI and VHRL) was relatively accurate and stable, likely because it takes advantage of both SAR and multispectral data. Although several heterogeneous sites were used to evaluate the results, more work is needed to test whether the dynamic NDWI– VH PolRL rule-set will be as effective in other areas, on other water types, during different seasons, and under contrasting conditions. Other indices, such as the automated water extraction index (AWEI) and tasselled cap wetness transformation, should also be evaluated when the coefficients for Sentinel-2 bands are made available. In addition, when it comes to PCA, it might be useful to see the correlation of the various component images with the water locations; as one of the components might be a good water index.
In summary, the techniques and datasets evaluated in this study show much promise for the accurate classification of optically complex waterbodies. Moreover, the relatively accurate and stable classifications achieved when the multispectral and SAR data were fused and automatically thresholded are very encouraging and may provide a viable solution for the operational monitoring of surface waterbodies in the Winelands district of South Africa. The implementation of this technique will provide invaluable information for water management and water security.


