Method of Delimiting the Spatial Structure of Villages for the Purposes of Land Consolidation and Exchange


Department of Environmental Engineering and Geodesy, Faculty of Production Engineering, University of Life Sciences in Lublin, 20-069 Lublin, Poland
*
Author to whom correspondence should be addressed.
Remote Sens. 2019, 11(11), 1268; https://doi.org/10.3390/rs11111268
Submission received: 14 April 2019
/
Revised: 21 May 2019
/
Accepted: 24 May 2019
/
Published: 28 May 2019
(This article belongs to the Special Issue Remote Sensing and GIS for Environmental Analysis and Cultural Heritage)
Abstract
:Land fragmentation and the distribution of plots in rural areas has a negative effect on the profitability and efficiency of agricultural production. Land consolidation and exchange is an operation that facilitates improvements in the spatial structure, while at the same time contributing to the sustainable development of rural areas. With regard to the large number of problem areas, they cannot be subject to land consolidation and exchange at the same time for reasons related to finance and human resources. Therefore, the authors propose that land for consolidation should be consolidated into larger typological units. Identifying those areas that are most similar facilitates the analysis and makes it possible to capture the spatial differentiation of land. The proposed method was tested on 116 villages in the county of Łęczna, situated in Lublin Voivodeship in Eastern Poland. The aim of this research is to develop the concept of village grouping into larger typological units. The obtained results allowed for the creation of a grouping methodology based on selected diagnostic variables that can be applied to other research objects. The description of differences between the identified groups of villages makes it possible to determine the hierarchy of urgency of for land consolidation and exchange. Although delimitation itself does not determine the sequence in which consolidation should be performed, it does allow for the identification of similar areas where such works should be performed at the same time. Based on properly selected guidelines, it is also possible to develop an adequate hierarchy of works. In addition, identifying areas which share similar spatial characteristics and consolidating them has a positive influence, primarily on the cultural heritage, because some variables reflect both quantitative and qualitative aspects of human development on the use of land and on the built-up environment.
1. Introduction
Along with the growth in the global population over the centuries, human settlements have become more and more numerous. Initially, they were very primitive, but with time, the spatial structure of settlements has become increasingly ordered. Spatial planning of villages depends on multiple factors, including but not limited to terrain relief, the size of crop fields, and local customs [1,2,3]. The legal regulations in force facilitated splitting the farms into smaller plots. Owners of farms split their farms into smaller plots, mainly due to the process of transferring land to their heirs. The problem associated with excessive fragmentation of land refers to Mexico [4], India [5], Central Europe [6,7], China [8], Cyprus [9] Bulgaria [10], Turkey [11], Spain [12,13], Czech Republic [14], Hungary [15], Poland [16], The Netherlands [17], and Albania [18]. Another reason that land fragmentation occurred in Central and Eastern Europe after the fall of Communism in the 1990s was due to the process of privatisation. Another negative factor resulting in negative spatial structure is the distribution of plots. In world literature, both fragmentation and the distribution of land is referred to as ‘land fragmentation’. The authors distinguish four types of land fragmentation, depending on the number of owners using the specific piece of land, the form of ownership or title, the type of use, and the geometric structure of plots [6,9]. Along with the increase in the number of arable plots and their distance from the farmer’s settlement, the cost of production increases and the farmer’s income decreases [19,20,21,22,23]. The fragmentation of the land of individual farms is a huge problem that is a barrier to its development, modernization, and has the effect of the lowering the profitability obtained from production farming.
A land surveying tool used for improving the arrangement of land is the operation of consolidation and the exchange of land which exists in Poland and in the world, for example, in such countries as the Netherlands [17], Cyprus [9], Slovakia [24] Czech Republic [25], China [26], Finland [27], and Northern Ghana [28]. Land consolidation is an agricultural-device operation, the aim of which is to create more favourable farming and forestry conditions by improving the area structure of agricultural holdings, forests and forest land, rational landscaping of land, the adjustment of property boundaries to the systems of water melioration facilities, roads, and land relief. The regulations of the Food and Agriculture Organization of the United Nations (FAO) [29] land consolidation are classified on three levels: first, the micro level, in which the LC (Land Consolidation) aims to change the structure of farms and their immediate surroundings to enable farmers to increase their competitiveness. Second, there is a meso level in which LC has a wider range, with the tendency to change rural communities by improving infrastructure (roads, irrigation and drainage systems, water, drainage systems, etc.), the natural environment and nature management resources, landscape, and, as a consequence, the spatial arrangement of economic activity. At the macro level, we focus on changes that can positively affect the whole country by reducing disparities between rural and urban areas, by ensuring greater efficiency and diversity in the use of rural space by improving the overall competitiveness of the agricultural and rural sectors, and finally, by building trust between government and rural residents, as well as by strengthening the land market [9]. Land consolidation works are very important for improving the spatial structure of the village. As a result, better farming conditions are created in agriculture and forestry by improving the area structure of agricultural holdings, forests and forest land, rational shaping of land, the adjustment of property boundaries to the systems of water melioration facilities, roads, and land relief.
In the literature on the subject, the areas selected for consolidation work are based on synthetic indicators, thereby enabling the selection of an area for land consolidation works. The authors use a number of factors to describe the studied area in detail. Works related to land consolidation indicators were carried out, inter alia, in Denmark [30], China [26], Poland [31], and Finland [27]. Land consolidation and exchange have a big impact on cultural heritage, which is defined in the literature as an expression of ways of life developed by the community and passed down from generation to generation, including customs, practices, places, objects, artistic expressions, and values. Cultural heritage (CH) is often expressed as non-material or material cultural heritage. It has a historical, social, and anthropological value and is regarded as a factor of sustainable development. In human activity, cultural heritage produces tangible representations of systems of values, beliefs, traditions, and lifestyles. As a substantial part of the whole culture, cultural heritage contains visible and tangible traces of the historical past. As regards issues related to rural areas, such traces include land fragmentation. It was created based on historical conditions when parents would split their fields to ensure a fair share for each of their children. Cultural heritage consists primarily of specific features in the physical landscape associated with cultural meanings and related to histories of human use [32,33].
Rural areas in Poland and throughout the world require deep structural transformations connected both with agricultural production and the size of farms, spatial and technical configuration of plots, and the demographic, spatial, and institutional structures. Both the economic and environmental effects of rural management works are irrefutable [34]. Due to financial and personnel limitations, it is necessary to identify the most defective areas in order to eliminate them, which will have a positive contribution to building a full-featured real property cadastre [35,36,37,38]. At present, it is not possible to carry out consolidation works in large areas simultaneously. Therefore, works are carried out to identify areas that must be consolidated first. The authors also propose creating urgency rankings of consolidation works to ensure that the most problematic areas are consolidated first [31,39,40,41].
One proposal is to use the delimitation method or, in other words, clustering areas which share similar characteristics. The spatial structure of private land is not a permanent element. Transformations and changes that have taken place in that structure are determined by business and economic relations and legal and ownership relations [42]. Similarities and differences in the spatial structure of land provide the possibility of combining separate territorial units such as counties, communes, or villages into larger typological units. The identification of similar areas with regard to the adopted objective and level of detail makes it possible to determine the level of differentiation of the spatial structure of land [43]. In studies concerning spatial and economic phenomena occurring in rural areas, in a larger area, respective villages are grouped into larger typological units. This is connected with both the differentiation and similarity of rural areas. The identification of those areas which are most similar facilitates the analysis and makes it possible to capture the spatial differentiation of land [44]. In the past 20 years, reference literature works [42,43,44,45] refer to the identification of areas where consolidation works are most urgent and should be a priority.
In the first two studies [42,43], the applied methods of delimitation were based on identifying uniform types and subtypes of mountainous villages followed by the selection of 10% of farms for evaluation according to models of development of selected features in the groups of areas. The evaluation classified selected types of villages in terms of the urgency of works, and also determined the status of defectiveness of the patchwork before consolidation and the outputs of consolidation. On the other hand, studies [22,41,45,46] determine the rankings of the urgency of undertaking consolidation works in the county without considering the option of evaluating the completed rankings in terms of the sequence of consolidation works.
The identification of areas with similar spatial and economic conditions is a significant preliminary element for determining the scope of rural management works. In order to develop the hierarchy of the needs for land consolidation and exchange for the analysed area, it is necessary to select diagnostic features and then split the space into parts that share adopted features. Informally, classification means a systematic division of objects or phenomena into classes, divisions, and sub-divisions according to a specific principle. In a theoretical approach, classification is a complete division of a specific subset into a certain number of separate subsets. The object of classification is sets of observations—objects are normally described by multiple measurable (quantitative) and non-measurable (qualitative) features. The above-mentioned division is based on similarity and the resulting subsets are called classes of abstraction, classes of similarity, or uniformity.
In previous spatial and agricultural works, many region delimitation methods were developed [44,45,47,48,49,50,51,52]. Most often, the methods used for grouping agricultural spaces into regions at the macro-scale level are taxonomic methods and scores that allow grouping of areas with similar features. Ernst [53] initiated surveys concerning spatial and agricultural issues by means of taxonomic methods. Afterwards, taxonomic methods were developed by Fierich and his apprentices [54,55]. The first author to have grouped areas for the purposes of rural management works was Hopfer [56]. He presented the division into regions and hierarchization of agricultural management units with consideration of their readiness for the spatial structure of land to be transformed through legal and technical rural management procedures. The areas were grouped into three stages: at a macro-, meso- and micro-scale. The selection of features was differentiated and adapted to the level of detail of the grouped territorial units [43].
In connection with the above, the purpose of the article is to develop and present the proposed method of delimitation, i.e., grouping of areas according to selected variables that characterise the analysed area. The identification of areas in which the features are most similar will facilitate the analysis and allow for the spatial differentiation of land to be captured while indicating the areas that need to be consolidated at the same time. The analyses covered 41 variables arranged in six thematic groups that describe the analysed area as broadly as possible. Previous delimitation methods used other methods of analysis and a smaller number of variables was selected to characterize the analyzed area. The variables were not concerning all the important aspects. In this work, the variables were subjected to a group reduction so as to obtain significant variables for each group of factors, whereas earlier works reduced all the variables at the same time, which is not entirely correct from the point of view of statistics. The method presented in this work is an attempt to improve previously presented methods. Consolidation works have a direct influence on the sustainable territorial development of rural areas, which is also reflected in an improved competitiveness of agriculture. The aforementioned issues are the main objectives of the EU’s rural development programme (RDP) 2014–2020 [57,58].
In the first stage of research, it is necessary to collect up-to-date and reliable information about the research object, which will include as much quantitative data as possible, with the help of which, it is possible to characterize the studied area [59]. The selected factors allowed for combining villages into groups with similar conditions, which typify areas for land consolidation works. Nowadays in Poland, the consolidation works are carried out within the borders of the village. One village is subject to the consolidation process. The proposed methodology assumes that groups of villages with similar spatial conditions should be consolidated. The consolidation area does not have to or should not be limited to one village. Due to the significant percentage of rural areas in Poland that are characterized by a faulty spatial structure, larger areas should be consolidated.
2. Materials and Methods
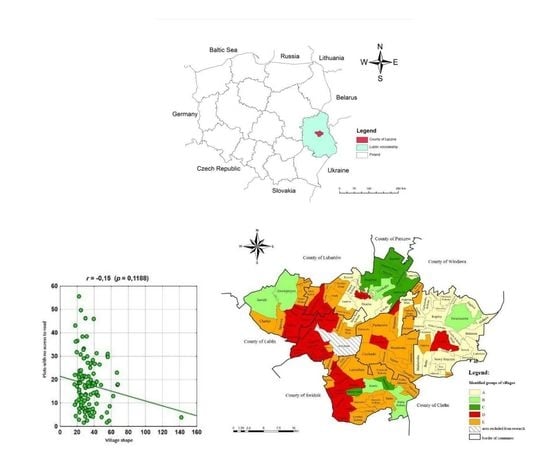
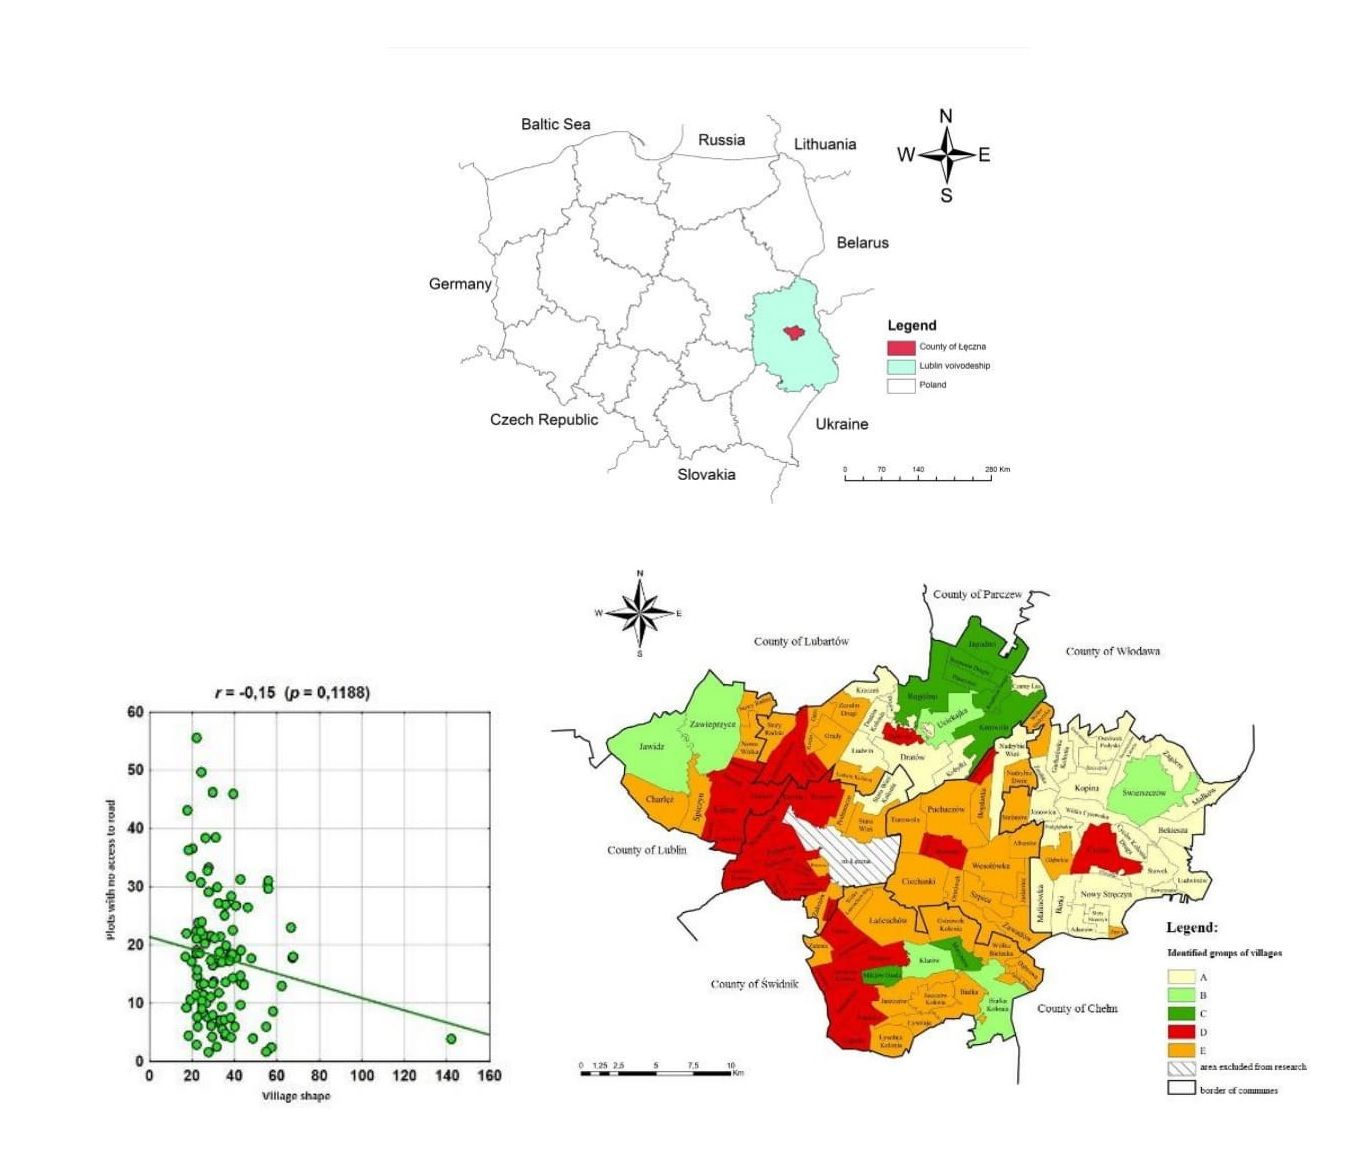
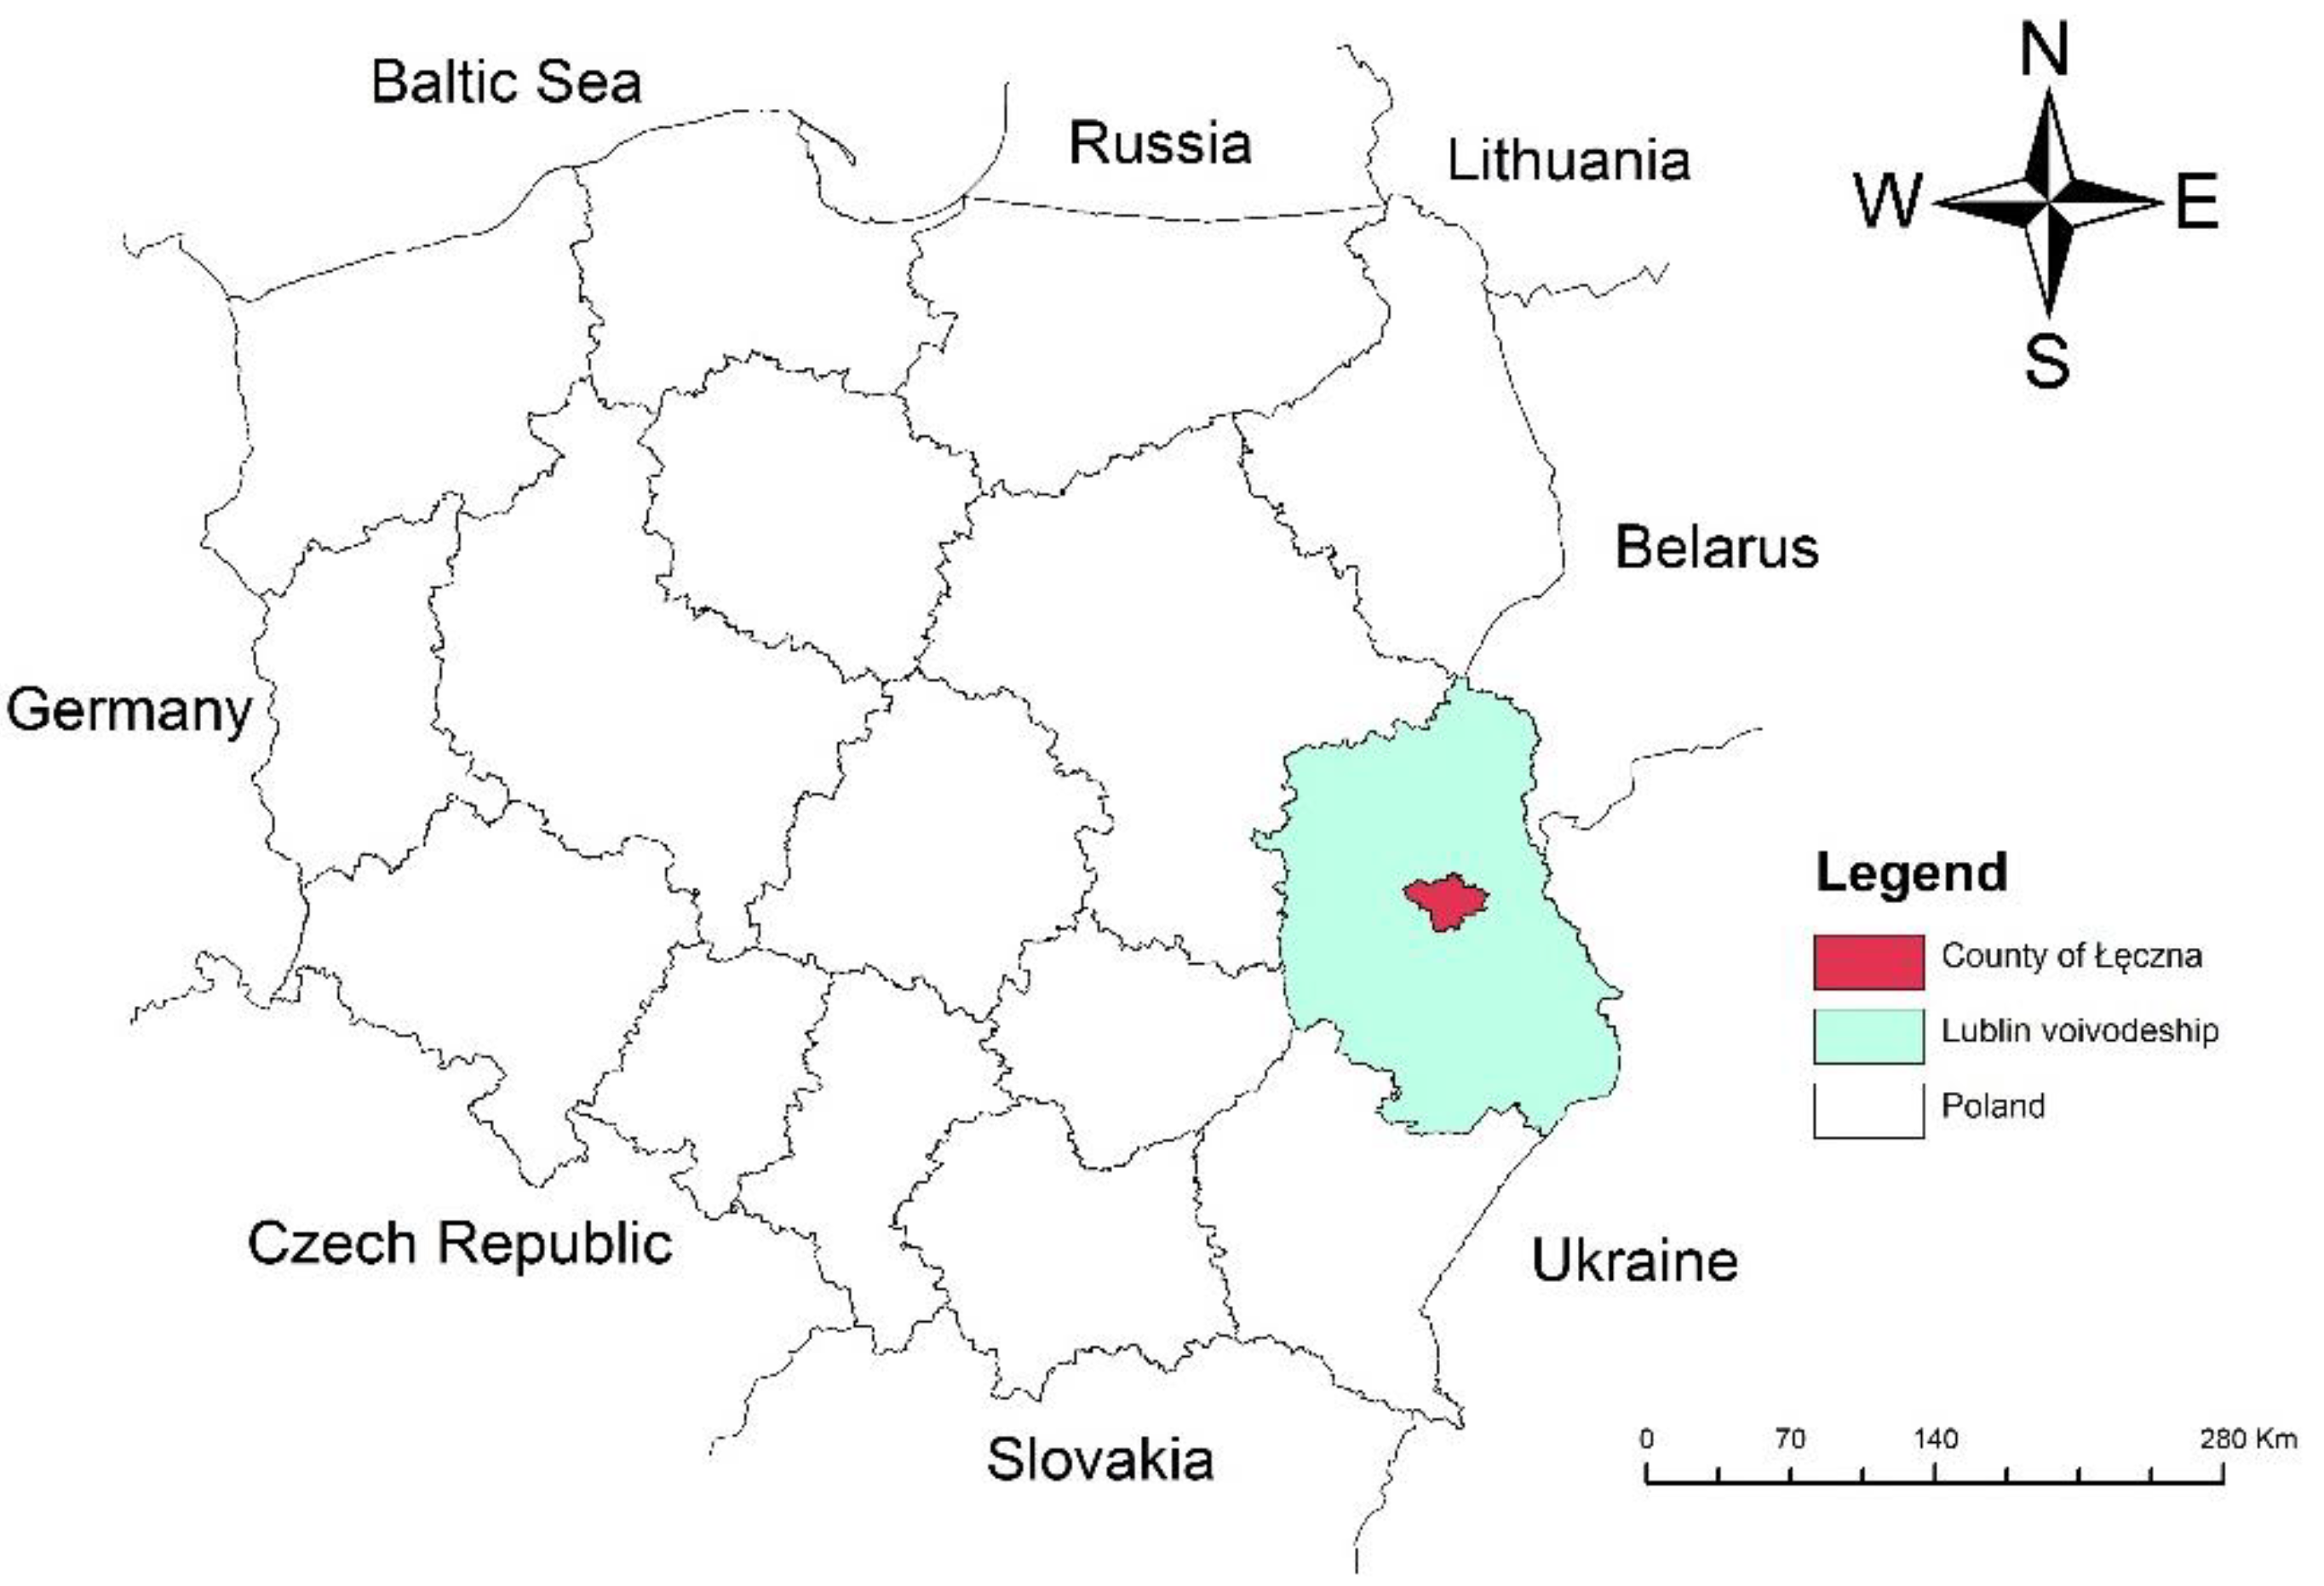
Specific surveys were carried out in Eastern Poland in the Lublin Voivodeship, county of Łęczna (Figure 1). The overall area of the county is 637 km2 and it is split into 6 communes. The county of Łęczna is situated on the border of two different geographical regions: the Lublin Upland and Polesie Lubelskie (Western Polesie), and two sub-regions: Łęczna-Włodawa Lakeland and Dorohusk Depression. The entire area of the county is situated within the North European Plain, which contributes to its plain terrain. Although the landscape is flat and at first glance monotonous, variety in the scenery in the county of Łęczna is provided by the River Wieprz. The county of Łęczna is characterised by quite a low share of forestland and also, comprises Nature 2000 areas. The high number of protected areas is due to, among other factors, rich flora and fauna in this region [60].
The research was carried out in this area because it is characterised by good soil productivity, differentiated use of land, and a high share of private property in the structure of ownership. A characteristic land feature is the ribbon-like plot patchwork. Land fragmentation is visible in this area.
The analysis aimed at grouping 116 villages into areas as similar as possible in terms of 41 adopted variables referring to the structure of ownership and use of land, fragmentation of plots, external plot patchwork, access roads to plots, shape of villages, and soil class productivity for cropland. In the first stage of the study, information was retrieved from the land and buildings register (EGiB), statistical censuses, and surveys. An information matrix consisting of 41 variables describing the analysed area was developed for the purposes of analyses (Table 1).
According to data in Table 1 and Table 2, these variables represent six groups of issues. The first group refers to the structure of land ownership and is represented by 7 variables (x1–x7). The variables were calculated based on data from the land and buildings register as a percentage share in the overall area of the villages. The second group refers to the structure of land ownership and it is described by 12 variables (x8–x19). Additionally, in this group, the variables were calculated based on data from the land and buildings register as a percentage share of the overall area of the villages. In the third group, variables (x20–x22) refer to the productivity of cropland, meadows, and pastures. Data on the surface area for respective classes of land was retrieved from the land and buildings register. The productivity index was calculated separately for cropland (Wg), for meadows (Wł), and for pastures (Wp). Based on the scores calculated for respective classes and agricultural land, the productivity indices were determined for cropland (Wg), meadows (Wł), and pastures (Wp), according to the formula [61]:
where:
Wg—index for cropland in the village,
Wpnk—unit size of points of bonitation classes for cropland,
Pnk—area of bonitation classes of cropland,
Pg—total area of cropland in the village,
bonitation classes—in Poland it is the class of land determined within the soil classification of grounds on the basis of the official land table, which defines soil quality in terms of its utility value. Group four is characterised by 8 variable features (x23–x30) describing the fragmentation of agricultural real property and plots. Land fragmentation analysis was carried out for plots owned by private owners only. Surveys were carried out in 8 size ranges because the average area of the plot does not reflect adequate fragmentation in respective villages. Distribution of agricultural real property and plots determines the size of the external patchwork, and variables x31–x39 creates the fifth group of variable features. Analyses of these figures for all 116 villages were carried out using chequerboard arrays [16]. Variables describing the patchwork were developed based on data from the land register by separating information on the number and area of plots and the number of owners residing outside the analysed village. The last group comprises variables that determine the shape parameters of plots and their accessibility by road.
A significant spatial element in the land exchange process is village shape. The shape determines the spatial distribution of plots in the village that are excessively elongated, unshapely, and have no access to a road. The analysed shape ratio for each village was based on the method developed by Kostrubiec [1], as the villages in the surveyed county have very differentiated and unshapely limits [20]. The presented diagnostic variables have been selected to effectively determine the status of the spatial and economic structure of the study area. From the point of view of the contents, the adopted set of diagnostic features satisfactorily takes into account the properties of land that significantly characterise its spatial and economic structure.
This paper makes use of cluster analysis as a data exploration tool. The applied algorithm groups objects into larger and larger clusters (sets) using the measure of probability or distance. Villages were grouped by means of Ward hierarchical clustering. The calculations were based on the square matrix of the Euclidean distance between the analysed objects. Ward’s method is one of the agglomerative grouping methods distinguished from other methods by the application of the analysis of variance for estimating the distance between clusters. The method aims to minimise the total square of deviations for any two clusters that may be formed at any stage. It is deemed the most effective hierarchical clustering algorithm [62].
Information on the delimitation of the study area was visualised using GIS software based on digital designs underlain by vectors in *.SHP form. The analyses made use of the ArcGIS programme in which geospatial data can be entered, stored, analysed and visualised. A spatial image of identified groups of villages was generated by assigning specific values in the table of attributes using the tools offered by the programme.
Taxonomy is a science of the rules for ordering and classifying objects. A practical objective of the taxonomic analysis is reducing the high amount of collected information to a few principal categories. Numerical taxonomy is a system of statistical procedures for grouping and classifying objects based on their numerical characteristics. Taxonomic methods consist of two sub-groups:
- (1).
- Grouping methods—used for identifying clusters of objects which are similar in terms of many of their statistical features. They are split into hierarchical and non-hierarchical ones.
- (2).
A decisive role in the development of applications and theory of taxonomy in social and economic surveys can be attributed to works by Hellwig from the 1960s and 1970s. In his works, Hellwig pointed to the possibility of applying taxonomic methods of grouping and linear ordering to economic issues. His proposed model taxonomy methodology created foundations for the development of the discipline referred to as multidimensional comparative analysis (MCA) [58]. According to Hellwig, MCA focuses on methods and techniques for comparing multi-feature objects [65]. This method is also used in studies concerning spatial and economic phenomena observed in rural lands [51]. Surveys regarding differentiation and similarities of social and economic structures and other characteristics of processes that occur within them (e.g., concentration) are multi-feature analyses in which the analysed phenomenon is described by more than one feature [66]. According to the spatial and economic typology of rural areas, one of the major activities is the selection of diagnostic features. The selected diagnostic features should meet the following requirements: they should be distinguished by a substantially large dispersion of values, poor correlation to other predictors, and they should be derived from reliable data [67,68].
At the first stage of the analysis, the number of adopted variables was reduced using factor analysis or principal component analysis. The reduction was performed separately for the groups of variables adopted with regard to their substance. The nature of the variables was also significant as it was necessary to consider not only the nature of structural indicators for which not only correlations but also their share in the total group of adopted variables matters. The distribution of values for all 41 variables was presented using selected descriptive statistics. Calculations for selected descriptive statistics included the following: is the arithmetic mean of the variable, Me is the median (middle value), s is the standard deviation, c25 and c75 are the centiles, that is, the figures determining the level below (above) which the quarter of the (25%) lowest (highest) measurements and the minimum and maximum value are situated.
The reduction of variables in the group ‘structure of agricultural land’ involved principal component analysis to ensure that the variables with a higher percentage share in the village were represented more strongly than the variables with a lower percentage share. Factor analysis, based only on the coefficients of correlation between variables, would give equal treatment to the factors describing the structure of land use. Such a solution would be incorrect, e.g., the percentage of land with tree stands and shrubs might be more correlated to selected factors than the percentage of cropland.
In this paper, delimitation was performed for 116 villages split into 5 groups showing internal similarities in terms of adopted variables, but which were also different from one another. Such differences between the identified groups of villages were evaluated by means of the Kruskal–Wallis test by calculating the significant value of test probability (p). The description of differences between the identified groups of villages makes it possible to determine the hierarchy of urgency of the needs for land consolidation and exchange. However, it must be stated that the delimitation of the study area is crucial since it facilitates analyses and syntheses of larger areas covering a considerable number of villages which are similar to one another. Areas in which differences were revealed in the existing defectiveness of the spatial structure in identified groups can be compared and subjected to a descriptive hierarchy of needs.
For the purposes of describing the villages included in respective groups for each input variable used in factor analysis (and indirectly for the clustering procedure), mean values were determined for each of the five groups. The output was interpreted by means of the Kruskal–Wallis test (test probability value) used for comparing the distribution of a numerical feature (or at least measured on the ordinal scale) over a few groups. This is a so-called non-parametric test, so it does not require meeting the restrictive assumptions that occur in parametric tests under the analysis of variance. Low values of test probability p indicate that the grouping factor differentiates the average level of the numerical feature under consideration. The test was used to evaluate the differentiation between the groups with regard to the values of the specific variable.
In the interpretation of the value of p, the following commonly applicable rules were adopted:
- (1).
- when p ≥0.05, we consider this to be a lack of grounds for refuting the zero hypothesis, which means that the tested difference between the groups is not statistically significant;
- (2).
- when p <0.05, we consider this to be a statistically significant difference (this fact is marked with *);
- (3).
- p <0.01 is a high significance of differences between groups (**);
- (4).
- p <0.001 is a very high significance of differences between groups (***).
3. Results and Discussion
Using factor analysis and principal component analysis, the number of adopted variables was reduced. The analysis of principal components identified two additional principal components of variation of the adopted percentage ratios that characterise the use of land (Table 3). The subsequent components explain the decreasing variation of input variables. In addition, they are not mutually correlated.
The first principal component contains as much as 70% of the information included in the entire set of 12 input variables, and the second one contains 18%. In total, the first two components retain nearly 90% of the information contained in the input variables. Thus, by reducing the number of input variables by six times, as much as 90% of information they contained was retained.
In order to establish what information best reflects the two selected components, two sets of ratios referring to the relationship between principal components with input variables are created (Table 4). The percentage input of the respective output variables in the specific factor indicates the percentage of variation of the output variables that is included in them, and vice versa.
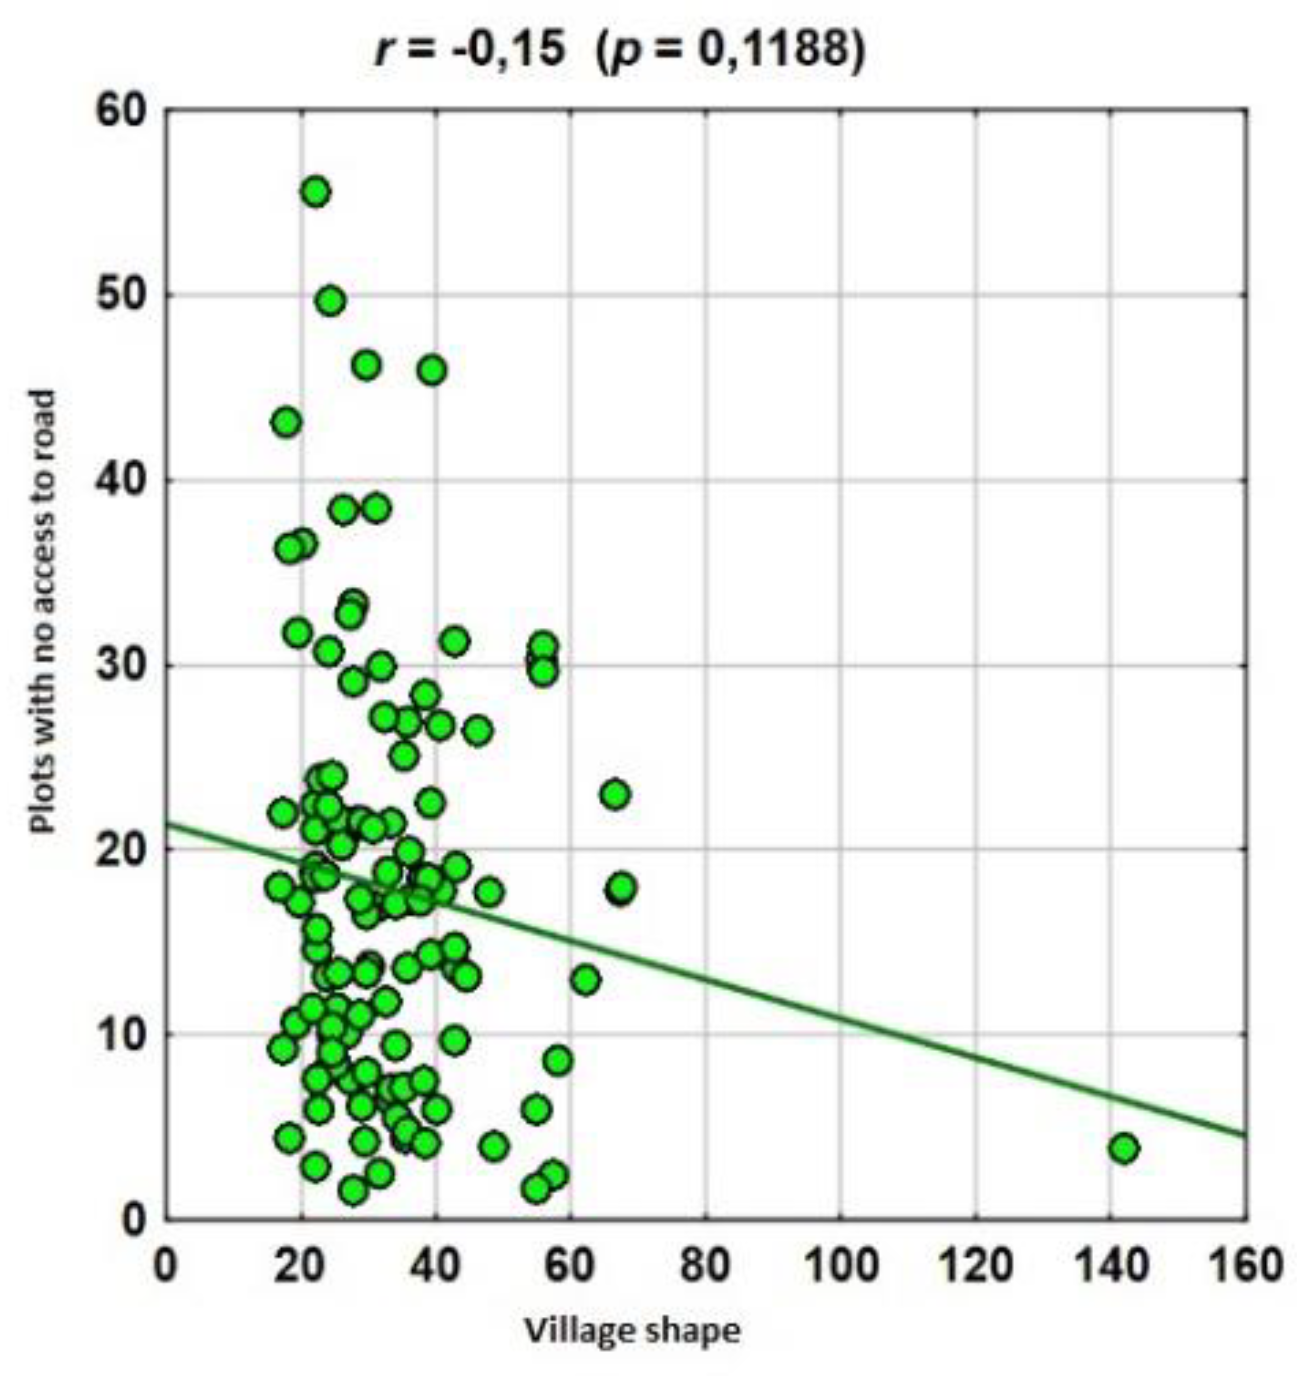
For villages, grouping the structure of land use will be represented by two factors that are identified in the above-mentioned analysis. Analogously, analyses were performed for variables which describe land ownership structure and land fragmentation. Other groups of variables, i.e., the productivity of agricultural land, distribution of agricultural real property and plots, were subject to reduction using factor analysis. In this case, the significance of the specific feature does not depend on the level of its variation, as was the case in the previously discussed groups of variables. The correlation between the latter two variables, i.e., accessibility by road and the village shape ratio, had been examined prior to factor analysis. The dispersion chart (Figure 2) presents the value of the linear correlation coefficient. Correlation is close to zero (r = −0.15); therefore, the number of variables cannot be reduced.
With regard to the lack of correlation between variables, it is not possible to identify a factor that contains sufficient information in the output ratios. The performance of factor analysis makes no sense; therefore, both ratios were included in clustering due to their substantial importance.
The villages were grouped based on the values obtained using principal component analysis and factor analysis. Out of 41 output variables, 13 factors were calculated and used as inputs for grouping. Cluster analysis was performed using Ward hierarchical clustering. It makes use of the analysis of variance in order to estimate the distances between clusters. All variables were standardised by means of a standardisation procedure. The calculations were performed based on the square matrix of the Euclidean distance between the analysed objects. The output was presented as a dendrogram. It showed successively combined objects which formed larger and larger clusters. According to the chart, it can be determined which villages are similar to a randomly selected village. In addition, division into any set number of groups can be made. However, for ease of interpretation, it is advisable to propose division into a specific number of groups. To this end, branches of the dendrogram must be cut off at a distance between clusters which generates the expected number. The number of groups remains an open issue—here, a clustering process chart, as presented below, is used most often. It is logical to perform the division at the moment of clustering when a considerable leap in the distance between the combined clusters occurs—in other words, until the consolidated clusters are similar, we continue consolidating them; otherwise, we divide them into the number of clusters generated by the set cut-off level.
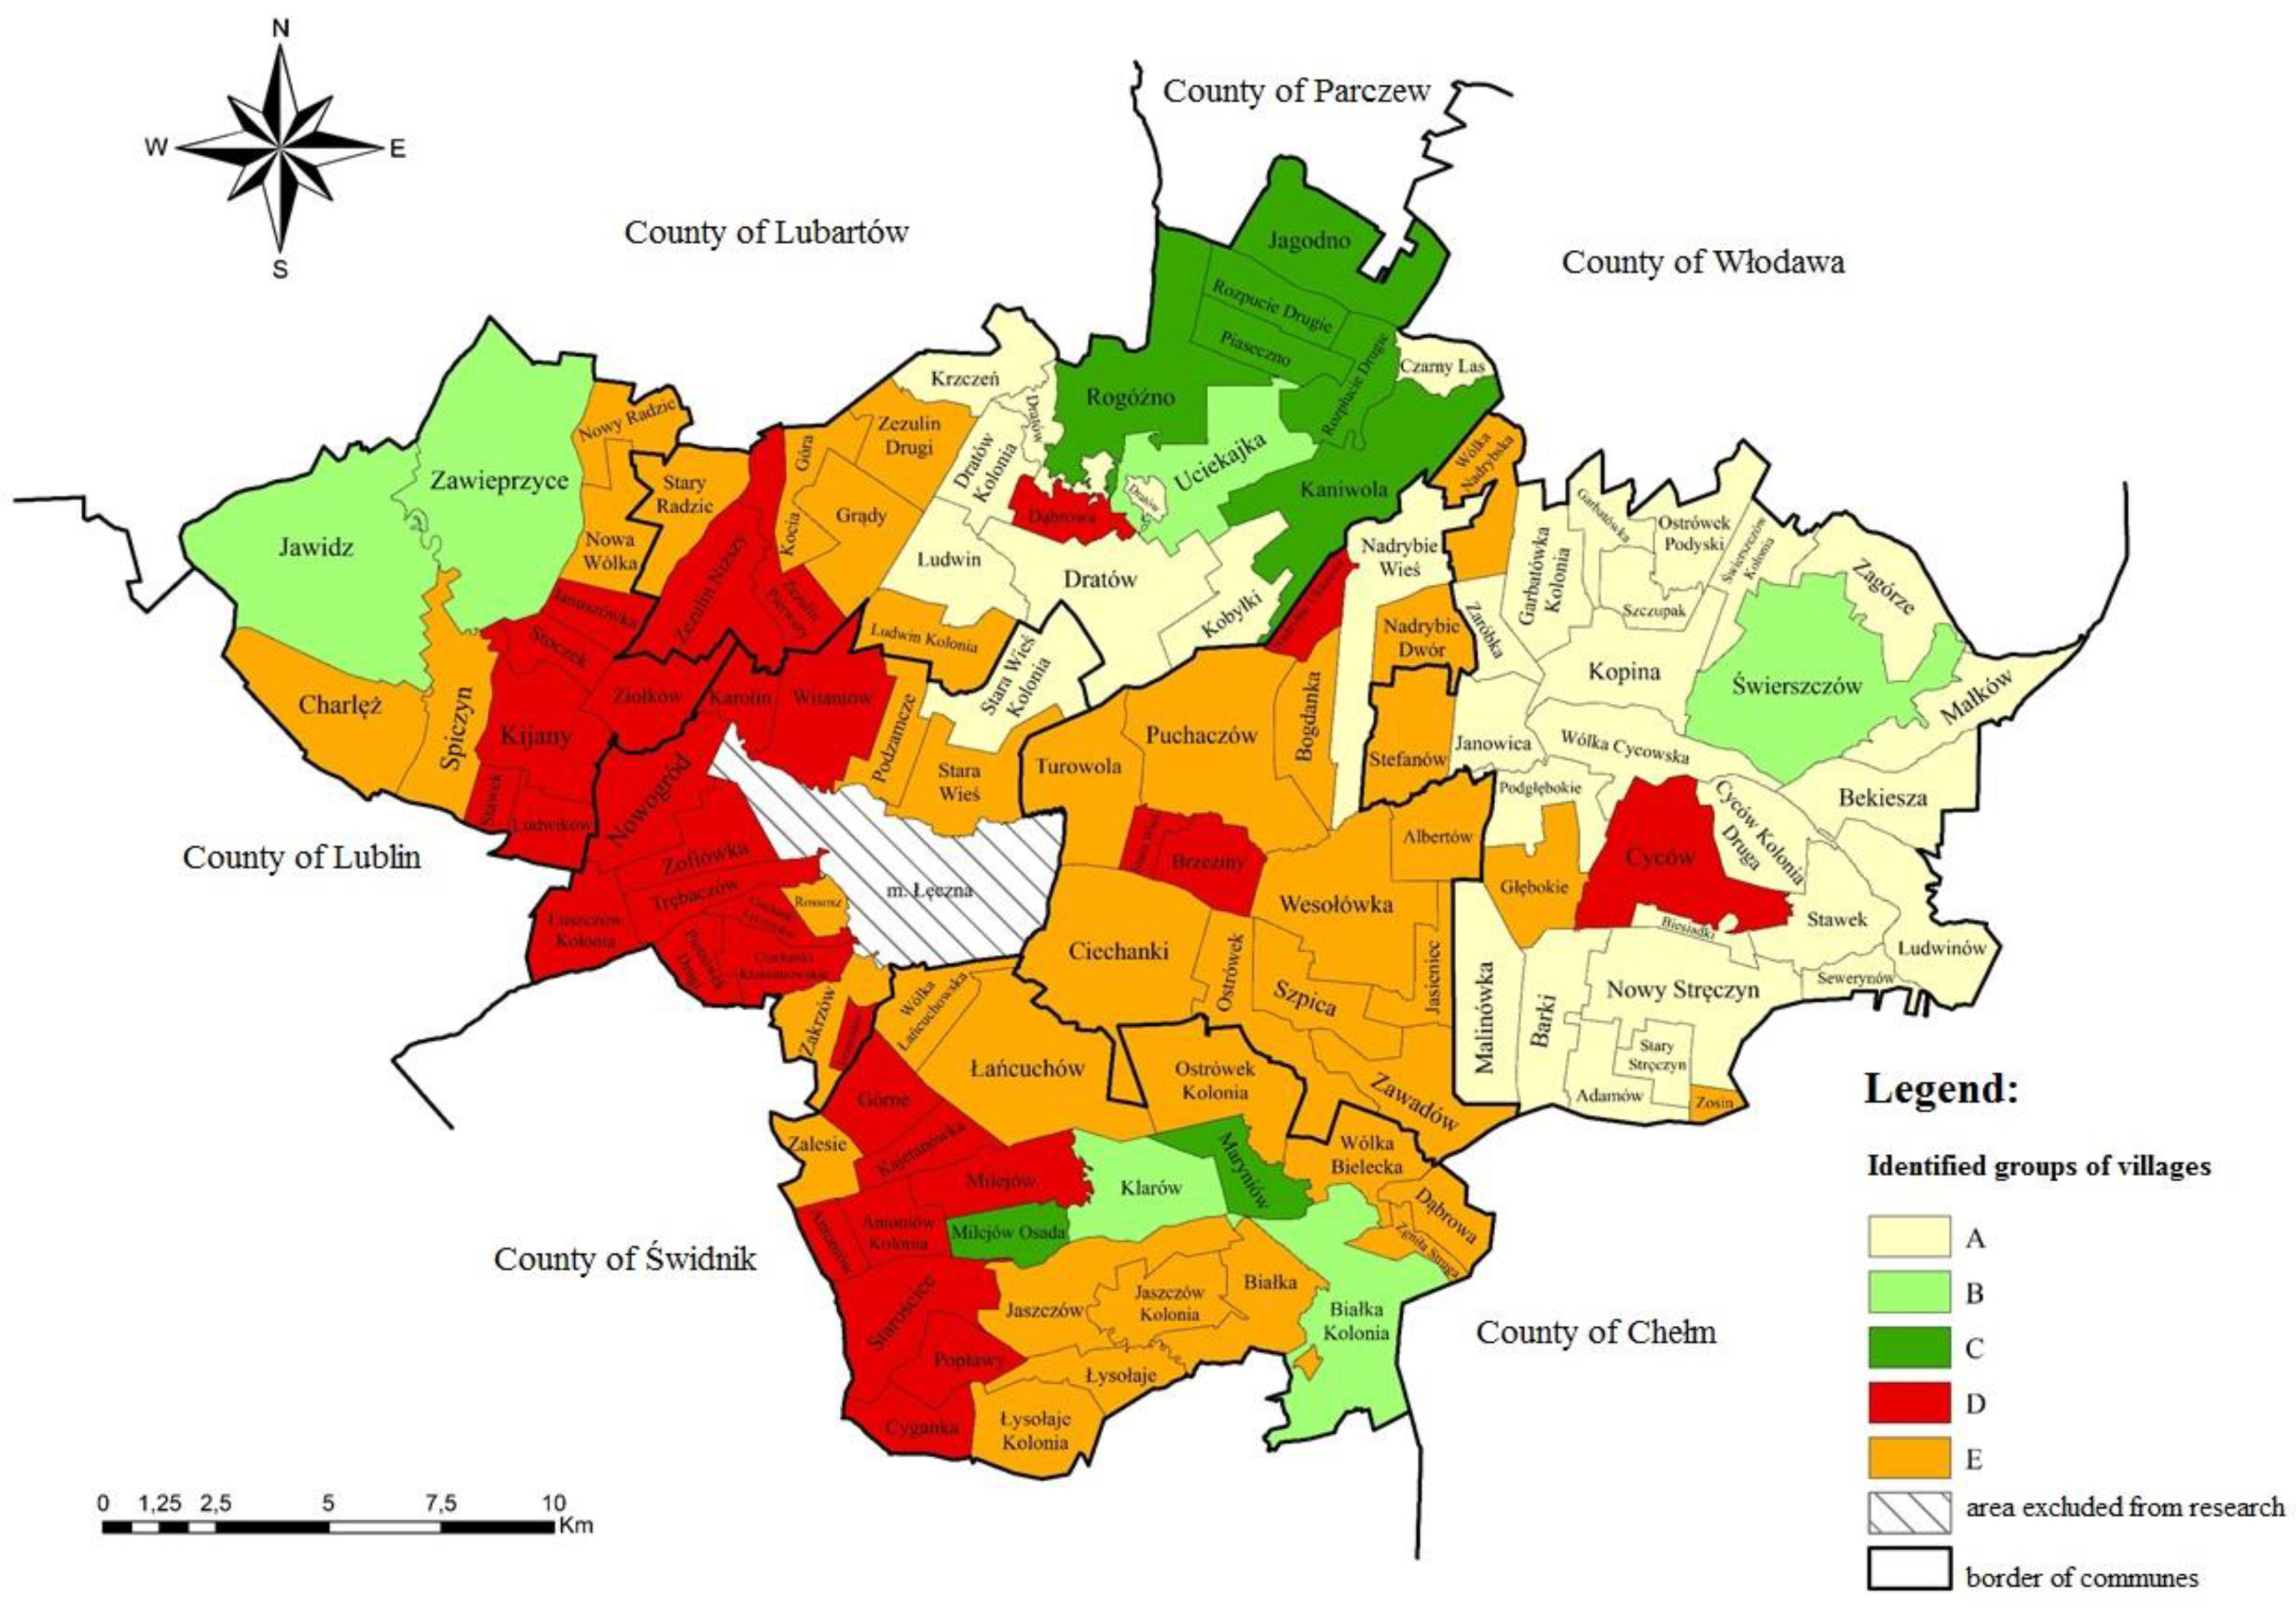
The cutting of the dendrogram resulted in 5 groups of villages with similar spatial conditions. The groups were marked with letters to facilitate the allocation of villages to a specific group according to the dendrogram; the name of the group is also given in brackets next to each village name. In the first place, the ordering of groups A, B, C, D, and E is not related to ‘better’ or ‘worse’ characteristics referring to the diagnostic variables—only later will the resulting clusters be described. The spatial distribution of the identified groups of villages in the study area performed in the ArcGIS software is presented in Figure 3.
Based on the dendrogram, 116 villages were clustered into 5 groups. The largest group is group E, which consists of 40 villages and corresponds to 34.5% of the total number of villages (Table 5). This group also covers the largest area. It covers 21208.8 ha, which accounts for 34.4% of the overall study area. The villages included in this group are mainly situated in the central part of the county of Łęczna. The other largest groups are groups A and D, consisting of 31 villages each, which corresponds to 26.7% of the total number of villages. With regard to the area, group A is definitely larger because it covers 15646.70 ha and accounts for 25.3% of the overall area. The smallest groups are groups C and B in which, respectively, 8 and 6 villages were included.
Groups for which the mean of the specific feature exceeded the value of the general mean were highlighted in green, whereas those for which the mean was below the general mean were in red (the colour intensity depended on the quotient for the specific group and the mean for the entire cluster).
The identified groups of villages were compared in terms of the groups of variables adopted for the needs of the study. The value of test probability p was analysed in detail. The comparison between identified groups with regard to the structure of ownership (Table 6) indicated that, apart from the share of land owned by counties and voivodeships, statistically significant differences do occur between them. Group B is distinguished by a low share of private land, whereas the highest share is found in group D. By contrast, group B has the highest percentage of forests; their share is also high in group C.
The table presents mean values for each variable referring to the structure of ownership in respective groups of villages. The group mean values for respective types of ownership of land clearly verify the specific features of the identified groups of villages. Group B is distinguished by a low share of private land, whereas the highest is found in group D. By contrast, group B has the highest percentage of forests; their share is also high in group C. Other groups have a relatively low percentage of forests. The area of land owned by the State Forests National Forest Holding is also different among the identified groups. The highest share was noted in group E, with the lowest in group D. Other statistically significant variables are variables which differentiate the groups of villages in terms of the area of land owned by the State Treasury under perpetual usufruct, which are highest in group C, as well as land owned by communes, the largest share of which also belongs to this group.
The description of legal and ownership relations to land testifies that the private sector has the predominant share and accounts for 80.3% of the area in the identified groups of villages. Only in group B does the share of private land account for 52.9% of the area. However, this group has a relatively high share of land owned by the State Forests National Forest Holding, that is, 40.7%.
The same analyses were carried out for all groups of variables. The identified groups of villages were compared in terms of the structure of ownership, use, land fragmentation and distribution, as well as the productivity of cropland. Summing up the statistical differences between respective changes, the 5 groups of villages are different from one another. At the same time, it must be stated that villages in the specific group share many common characteristics, which means that the identified area is uniform.
According to the accepted features of the object of the experiment according to 6 groups of variables, it can be concluded from the analysis that in separated groups of villages, statistical differences between variables confirm the diversity of these groups. In addition, it should be noted that, due to the accepted diagnostic features, villages with a similar spatial structure of land are grouped together. There are studies in the literature that, based on factors, allow for the prioritization of consolidation work [39,41]. However, the proposal to combine villages into larger objects for consolidation is more appropriate due to personnel and financial constraints. It is not possible to merge into a large area with many defects at the same time. Therefore, it is appropriate that villages should be joined into larger typological units and grouped together. As proposed in this work, the next step may be to develop the hierarchy (order) of consolidation based on existing algorithms [39,41]. Land consolidation works are so difficult that it is easier to merge villages which are similar to one another at the same time due to the structure of agricultural land, distribution of agricultural real property plots, or plot shape and access parameters. A crucial element that can be determined by the land consolidation process are variables from group 5 (Table 1), the distribution of agricultural real property and plots determines the size of the external patchwork, variables x31–x39, and creates the fifth group of variable features. Analyses of these figures were carried out for all 116 villages using chequerboard arrays [19]. Variables describing the patchwork were found for the most-developed villages in the world. The phenomenon of land fragmentation is closely related to the phenomenon of land scattering; therefore it should be considered during consolidation works.
The analyses of the collected data lead to the conclusion that the area of łęczyński district could be consolidated into separate groups of villages in research. The presented methodology could be the basis for the development of rural development programs. On the basis of separate types of villages, it is possible to determine the order of carrying out works to transform the spatial structure of a village. After dividing the area into groups, an evaluation of the separate groups should be carried out in order to determine the urgency of land consolidation. In earlier works [47], dividing homogeneous areas in terms of the hierarchization of the urgency of consolidation, there was the issue of separating areas that were similar due to the spatial structure of village land. The dendrite method was used and its division was not sufficiently precise; however, it should be emphasized that at present, a superior solution does not exist.
4. Conclusions
Comprehensive land consolidation and exchange works, as processes of transforming a defective spatial structure of fragmented private agricultural land, are complicated. This complication is not due to legal and technical conditions but also individual, general, social, and ecological conditions. Apart from the specified problems related to the consolidation and exchange of land, in rural areas, there are large territories that require such operations. In connection with this fact, such areas cannot be subject to land consolidation and exchange at the same time for reasons related to finance and human resources. Defectiveness of the spatial structure of private land is characterised by different degrees. The observed diversity of the spatial structure of land in villages provides the possibility of delimiting them into groups which share similar degrees of defects, thereby facilitating analysis and capturing the spatial differentiation of land.
In the paper, the delimitation of the study area was performed by means of Ward hierarchical clustering, in which 5 groups of quite similar villages were identified. The calculations were based on the square matrix of the Euclidean distance between the analysed objects. The delimitation allowed for similar groups of villages with different degrees of defective spatial structures of land to be identified. The identified groups of villages with similar features regarding the spatial structure of land do not prioritise the needs for consolidation of such areas but they allow similar areas where consolidation should take place simultaneously to be identified. Due to limited human and financial resources, it is advisable that the urgency for land consolidation and exchange works should be prioritised. Considering the degree of defectiveness within the study area, it is proposed that consolidation should be performed for more than one village in a larger commune, that is, according to the identified groups.
The conducted research has shown that it is possible to characterise the village through a number of selected features that describe the analysed area. Due to the fact that the features convey a very large amount of information, it was necessary to reduce them using statistical methods. The features selected for analysis comprehensively characterize the area of research but can also be used for other areas. It is possible to expand the set of features to better describe the area being explored.
Analyses using clustering methods demonstrated that the proposed method of delimitation of the spatial structure of villages for the purpose of land consolidation and exchange works under the sustainable development of rural areas is viable and can be applied to other areas. It is significant that the selection of diagnostic variables should ensure that the analysed area was correctly described. The use of the proposed solution makes it possible to identify mutually similar areas where consolidation works should take place at the same time. Although delimitation itself does not indicate the required sequence of consolidation and exchange of land, an adequate hierarchy of such works can also be developed on the basis of correctly selected guidelines.
However, it should be remembered that the main limitation of this method is the very large amount of data needed to develop the selected variables. The grouping process cannot be fully automated. Scholars’ duty to analyse variables still remains. It is necessary to check whether the selected variables will occur in the analysed area. However, the advantage is that the statistical methods used for analysis will determine whether a given variable is significant for the studied area.
It is also important that the land consolidation approach, as described in this article, is specific to countries that are strictly centrally planned, for example, former communist countries in Eastern Europe. The proposed approach cannot take place in market-oriented countries, if not on a voluntary basis, for instance, then under a compensation scheme.
Author Contributions
conceptualization, Ż.K.; methodology, Ż.K. and K.N.; software, Ż.K. and K.N.; validation, Ż.K. and K.N.; formal analysis, Ż.K. and K.N.; investigation, Ż.K. and K.N.; resources, Ż.K. and K.N.; data curation, Ż.K.; writing—original draft preparation, Ż.K. and K.N.; writing—review and editing, Ż.K.; visualization, Ż.K.; supervision, Ż.K. and K.N.; project administration, Ż.K. and K.N.; funding acquisition, Ż.K. and K.N.
Funding
This research received no external funding.
Acknowledgments
This research received no external funding.
Conflicts of Interest
The authors declare no conflict of interest.
References
- Kostrubiec, B. Analysis of Concentrations in the Settlement Network; Wyd. PAN: Warszawa, Poland, 1972. (In Polish) [Google Scholar]
- Tkocz, J. Spatial Organisation of Villages; Publishing House of the University of Silesia: Katowice, Poland, 1998. (In Polish) [Google Scholar]
- Szmytkie, R. Methods for Analysing the Morphology and Physiognomy of Settlement Units; Scientific Papers of the Institute of Geography and Regional Development; Institute of Geography and Regional Development: Wrocław, Poland, 2014. (In Polish) [Google Scholar]
- Bentley, J.W. Economic and ecological approaches to land fragmentation: In defense of a much-maligned phenomenon. Annu. Rev. Anthropol. 1987, 16, 31–67. [Google Scholar] [CrossRef]
- Manjunatha, A.V.; Anik, A.R.; Speelman, S.; Nuppenau, E.A. Impact of land fragmentation, farm size, land ownership and crop diversity on profit and efficiency of irrigated farms in India. Land Use Policy 2013, 31, 397–405. [Google Scholar] [CrossRef]
- Van Dijk, T. Scenarios of Central European land fragmentation. Land Use Policy 2003, 20, 149–158. [Google Scholar] [CrossRef]
- Pašakarnis, G.; Maliene, V. Towards sustainable rural development in Central and Eastern Europe: Applying land consolidation. Land Use Policy 2010, 27, 545–549. [Google Scholar] [CrossRef]
- Guo, B.; Jin, X.; Yang, X.; Guan, X.; Lin, Y.; Zhou, Y. Determining the effects of land consolidation on the multifunctionality of the cropland production system in China using a SPA-fuzzy assessment model. Eur. J. Agron. 2015, 63, 12–26. [Google Scholar] [CrossRef]
- Demetriou, D. The Development of an Integrated Planning and Decision Support System (IPDSS) for Land Consolidation; Springer Science and Business Media: Berlin, Germany, 2013. [Google Scholar]
- Di Falco, S.; Penov, I.; Aleksiev, A.; van Rensburg, T. Agrobiodiversity, farm profits and land fragmentation: Evidence from Bulgaria. Land Use Policy 2010, 27, 763–771. [Google Scholar] [CrossRef]
- Cay, T.; Ayten, T.; Iscan, F. Effects of different land reallocation models on the success of land consolidation projects: Social and economic approaches. Land Use Policy 2010, 2, 262–269. [Google Scholar] [CrossRef]
- Gonzalez, X.P.; Alvarez, C.J.; Crecente, R. Evaluation of land distributions with joint regard to plot size and shape. Agric. Syst. 2004, 82, 31–43. [Google Scholar] [CrossRef]
- Gonzalez, X.P.; Marey, M.F.; Alvarez, C.J. Evaluation of productive rural land patterns with joint regard to the size, shape and dispersion of plots. Agric. Syst. 2007, 92, 52–62. [Google Scholar] [CrossRef]
- Sklenicka, P.; Janovska, V.; Salek, M.; Vlasak, J.; Molnarova, K. The Farmland Rental Paradox: Extreme land ownership fragmentation as a new form of land degradation. Land Use Policy 2014, 38, 587–593. [Google Scholar] [CrossRef]
- Cegielska, K.; Noszczyk, T.; Kukulska, A.; Szylar, M.; Hernik, J.; Dixon-Gough, R.; Jombach, S.; Valanszki, I.; Kovacs, K.F. Land use and land cover changes in post-socialist countries: Some observations from Hungary and Poland. Land Use Policy 2018, 78, 1–18. [Google Scholar] [CrossRef]
- Janus, J. Measuring land fragmentation considering the shape of transportation network: A method to increase the accuracy of modelling the spatial structure of agriculture with a case study in Poland. Comput. Electron. Agric. 2018, 148, 259–271. [Google Scholar] [CrossRef]
- Stańczuk-Gałwiaczek, M.; Sobolewska-Mikulska, K.; Ritzema, H.; van Loon-Steensma Jantsje, M. Integration of water management and land consolidation in rural areas to adapt to climate change: Experiences from Poland and the Netherlands. Land Use Policy 2018, 77, 498–511. [Google Scholar] [CrossRef]
- Ciaian, P.; Guri, F.; Rajcaniova, M.; Drabik, D.; y Paloma, S.G. Land fragmentation and production diversification: A case study from rural Albania. Land Use Policy 2018, 76, 589–599. [Google Scholar] [CrossRef]
- Noga, K. Analysis of the Intervillage Plot Patchwork on the Example of Villages Situated in the Upstream Catchment of the River Soła; Scien. Sess. 7. Issue 7. Scien. Booklets No. 133; University of Agriculture: Kraków, Poland, 1977; pp. 154–170. (In Polish) [Google Scholar]
- Noga, K.; Król, Ż. The Patchwork of Land as a Problem Restricting the Development of Rural Areas. Barom. Reg. 2016, 14, 165–173. [Google Scholar]
- Król, Ż.; Leń, P. Individual plot patchwork determination of the urgency in realization consolidation and exchange of land. Infrastruct. Ecol. Rural Areas 2016, 2016, 311–322. [Google Scholar]
- Leń, P. The ranking destination areas for land consolidation works, due to the size checkerboard land on the example of Białaczów. In Proceedings of the “Environmental Engineering” 10th International Conference Vilnius Gediminas Technical University Article, Vilnius, Lithuania, 27–28 April 2017. [Google Scholar]
- Leń, P. The size of the external patchwork of fields as an indicator of the need for land consolidation and exchange in the villages of the commune of Drzewica. J. Water Land Dev. 2017, 33, 99–106. [Google Scholar] [CrossRef]
- Hudecova, L.; Geisse, R.; Gasincova, S.; Bajtala, M. Quantification of Land Fragmentation in Slovakia. Geod. List 2017, 4, 327–388. [Google Scholar]
- Moravcova, J.; Koupilova, M.; Pavliček, T.; Zemek, F.; Kvitek, T.; Pečenka, J. Analysis of land consolidation projects and their impact on land use change, landscape structure, and agricultural land resource protection: Case studies of Pilsen-South and Pilsen-North (Czech Republic). Landsc. Ecol. Eng. 2017, 13, 1–13. [Google Scholar] [CrossRef]
- Hong Ch Jin, X.; Ren, J.; Gu, Z.; Zhou, Y. Satellite data indicates multidimensional variation of agricultural production in land consolidation area. Sci. Total Environ. 2019, 653, 735–747. [Google Scholar] [CrossRef]
- Hiironen, J.; Riekkinen, K. Agricultural impacts and profitability of land consolidations. Land Use Policy 2016, 55, 309–317. [Google Scholar] [CrossRef]
- Asiama, K.O.; Bennett, R.M.; Zevenbergen, J.A.; Da Silva Mano, A. Responsible consolidation of customary lands: A framework for land reallocation. Land Use Policy 2019, 83, 412–423. [Google Scholar] [CrossRef] [Green Version]
- FAO. Opportunities to Mainstream Land Consolidation in Rural Development Programmes of the European Union; FAO-Land Tenure Policy Series; FAO: Rome, Italy, 2008. [Google Scholar]
- Johansen, P.H.; Ejrnæs, R.; Kronvang, B.; Vesterlund Olsen, J.; Præstholm, S.; Schou, J. Pursuing collective impact: A novel indicator-based approach to assessment of shared measurements when planning for multifunctional land consolidation. Land Use Policy 2018, 73, 102–114. [Google Scholar] [CrossRef]
- Janus, J.; Taszakowski, J. Spatial differentiation of indicators presenting selected barriers in the productivity of agricultural areas: A regional approach to setting land consolidation priorities. Ecol. Indic. 2018, 93, 718–729. [Google Scholar] [CrossRef]
- Stanik, N.; Aalders, I.; Miller, D. Towards an indicator-based assessment of cultural heritage as a cultural ecosystem service―A case study of Scottish landscapes. Ecol. Indic. 2018, 95, 288–297. [Google Scholar] [CrossRef]
- Xiao, W.; Mills, J.; Guidi, G.; Rodrigez-Gonzalvez, P.; Gonizzi Barsanti, S.; Gonzalez-Aguilera, D. Geoinformatics for the conservation and promotion of cultural heritage in support of the UN Sustainable Development Goals. ISPRS J. Photogramm. Remote Sens. 2018, 142, 389–406. [Google Scholar] [CrossRef]
- Sobolewska-Mikulska, K. (Ed.) Contemporary Consolidation of Land in Shaping the Limits of Agricultural Production Space; Publishing House of the Technical University of Warsaw: Warsaw, Poland, 2009. [Google Scholar]
- Mika, M. Interoperability cadastral data in the system approach. J. Ecol. Eng. 2017, 18, 150–156. [Google Scholar] [CrossRef]
- Mika, M. Proposals for changes in surveying-legal procedures for the needs of cadastre in Poland. Rep. Geod. Geoinform. 2016, 102, 67–77. [Google Scholar] [CrossRef]
- Mika, M.; Siejka, M.; Leń, P.; Król, Ż. The concept of using the water cadastre databases components for the construction of multi-dimensional cadastre in Poland. Surv. Rev. 2018, 50, 201–211. [Google Scholar] [CrossRef]
- Dawidowicz, A.; Źrobek, R. Analysis of concepts of cadastral system technological development. Procedia Engineering. In Proceedings of the 9th International Conference “Environmental Engineering”, Vilnius Gediminas Technical University, Vilnius, Lithuania, 22 May–23 May 2014. [Google Scholar] [CrossRef]
- Leń, P. An algorithm for selecting groups of factors for priorization of land consolidation in rural areas. Comput. Electron. Agric. 2018, 144, 216–221. [Google Scholar] [CrossRef]
- Postek, P. Differences in spatial structure of rural areas of commune of Goraj with regard to size of farms owned by natural persons. In Proceedings of the 17th International Scientific Conference Engineering for Rural Development, Jelgava, Latvia, 23–25 May 2018; pp. 605–610. [Google Scholar] [CrossRef]
- Tomic, H.; Mastelic Ivic, S.; Roić, M. Land Consolidation Suitability Ranking of Cadastral Municipalities: Information-Based Decision-Making Using Multi-Criteria Analyses of Official Registers’ Data. Int. J. Geo-Inform. 2018, 7, 87. [Google Scholar] [CrossRef]
- Noga, K. Methods of Consolidation Works Programming and Their Performance Technology in Mountainous Areas (Using the Example of the Catchment of the Soła River in the Beskid Mountains); Scientific Papers, Dissertations Series, No. 143; University of Agriculture: Kraków, Poland, 1990. (In Polish) [Google Scholar]
- Noga, K. Methodology of Programming and Implementation of Consolidation and Exchange of Land Works in the Complex Formulation; Szkoła wiedzy o Terenie: Kraków, Poland, 2001. (In Polish) [Google Scholar]
- Noga, K. Topology of Mountain Villages for the Needs of Rural Management Works. Land Surveying; Scientific Papers No. 155; University of Agriculture: Kraków, Poland, 1979; Volume 6, pp. 17–29. (In Polish) [Google Scholar]
- Leń, P. The Method for Determining the Urgency of Needs for Land Consolidation and Exchange. Ph.D. Dissertation, AGH University of Science and Technology in Kraków, Kraków, Poland, 2013. (In Polish). [Google Scholar]
- Leń, P.; Oleniacz, G.; Skrzypczak, I.; Mika, M. The Hellwig’s and zero unitarisation methods in creating a ranking of the urgency of land consolidation and land exchange work. In Proceedings of the 16th International Multidisciplinary Scientific GeoConference SGEM 2016, Albena, Bulgaria, 30 June–6 July 2016; Volume 2, pp. 617–624. [Google Scholar]
- Domański, S. Typological procedure in economic and agricultural surveys. Geogr. Rev. 1969, XVI Pt 1, 55–68. (In Polish) [Google Scholar]
- Fajferek, A. Economic Region and Methods of Regional Analysis; “ZN WSE Kraków”, Dissertations Series No. 6; Poland, 1964. (In Polish) [Google Scholar]
- Król, B. Taxonomic Method of Smallest Differences Applied in Classification of Farms; Scientific Papers of the School of Agriculture in Kraków, Series Economics; University of Agriculture: Kraków, Poland, 1969; Part 5. (In Polish) [Google Scholar]
- Liczkowski, J. Delimitation of agricultural intensity regions using the average differences method. Agric. Econ. Issues 1972, 2. (In Polish) [Google Scholar]
- Steczkowski, J. Principles and Methods of Identifying Agricultural Production Regions; PWRiL: Warsaw, Poland, 1966. (In Polish) [Google Scholar]
- Noga, K. Method of Grouping the Spatial Structure of Mountain Villages; Land Surveying Vol. 10, Scientific Papers 1988. No. 221; University of Agriculture: Kraków, Poland, 1998. (In Polish) [Google Scholar]
- Ernst, E. Geographical and agricultural regions of Poland. Geogr. J. 1934, 10. (In Polish) [Google Scholar]
- Fierich, J. Attempted application of taxonomic methods for the purposes of identifying agricultural system regions in Kraków voivodeship. Econo. Thought 1957, 3. (In Polish) [Google Scholar]
- Filip, T.; Steczkowski, J. Attempted application of spatial differences for the purposes of identifying agricultural production regions in Rzeszów voivodeship. Econ. Issues 1962, 5. (In Polish) [Google Scholar]
- Hopfer, A. Method for determining territorial maturity of agricultural management units for change in the structure of their area. ZN ART. In Olsztyn 1974, 3. (In Polish) [Google Scholar]
- The Rural Development Program. Available online: https://www.gov.pl/documents/912055/913531/Program_Rozwoju_Obszar%C3%B3w_Wiejskich_na_lata_2014-2020.pdf/0775b248-4719-35df-c44b-e81ffe4e977a (accessed on 4 March 2019).
- Wójcik-Leń, J.; Sobolewska-Mikulska, K.; Sajnóg, N.; Leń, P. The idea of rational management of problematic agricultural areas in the course of land consolidation. Land Use Policy 2018, 78, 36–45. [Google Scholar] [CrossRef]
- Madsen, L.M.; Adriansen, H.K. Understanding the use of rural space: The need for multi-methods. J. Rural Stud. 2004, 20, 485–497. [Google Scholar] [CrossRef]
- The Development Strategy of the Łęczna County for the Years 2016–2021. Available online: http://powiatleczynski.pl/strony,show,5038,strategia-rozwoju-powiatu-leczynskiego-na-lata-20162021.html (accessed on 4 March 2019).
- Matkowska, K. Land Valuation Methods for the Needs of Comprehensive Consolidation Works. Ph.D. Dissertation, Hugon Kołłątaj University of Agriculture in Kraków, Kraków, Poland, 2016. (In Polish). [Google Scholar]
- Grabiński, T.; Sokołowski, A. From Studies on the Efficiency of Selected Taxonomic Procedures; Scientific Papers of the University of Agriculture in Kraków, No. 181; 1984. (In Polish) [Google Scholar]
- Ostasiewicz, W. (Ed.) Statistical Methods of Data Analysis; Publishing House of the Economic University in Wrocław: Wrocław, Poland, 1999. (In Polish) [Google Scholar]
- Hydzik, P.; Sobolewski, M. Computer-Aided Analysis of Social and Economic Data; Publishing House of the Technical University of Rzeszów: Rzeszów, Poland, 2007. (In Polish) [Google Scholar]
- Hellwig, Z. Multidimensional comparative analysis and its applications in multi-feature studies of economic objects. In Economic and Mathematical Methods and Models in Improvement of Socialist Economy Management; Welfe, W., Ed.; PWE: Warsaw, Poland, 1981. (In Polish) [Google Scholar]
- Heffner, K.; Gibas, P. Economic and Spatial Analysis; Publishing House of the Economic University in Katowice: Katowice, Poland, 2007. (In Polish) [Google Scholar]
- Młynarczyk, W. Taxonomic Methods in Spatial Studies in Agriculture; KPZK; PAN: Poland, 1970; Volume 61. (In Polish) [Google Scholar]
- Kozłowski, S. On the method of verification of spatial divisions with reference to the taxonomic method of differences by J. Czekanowski. Stat. News 1972, 1. (In Polish) [Google Scholar]
Figure 1.
Spatial location of the study area in Poland.

Figure 2.
Chart illustrating the dispersion of the linear correlation coefficient between variables.
Figure 2.
Chart illustrating the dispersion of the linear correlation coefficient between variables.

Figure 3.
Spatial representation of the identified groups.


Table 1.
Specification of study variables
| No. | Groups of Study Variables | Number | % |
|---|---|---|---|
| 1. | Structure of land ownership | 7 | 17.1 |
| 2. | Structure of agricultural land | 12 | 29.3 |
| 3. | Productivity of cropland | 3 | 7.3 |
| 4. | Fragmentation of agricultural real property and plots | 8 | 19.5 |
| 5. | Distribution of agricultural real property and plots | 9 | 22.0 |
| 6. | Plot shape and access parameters | 2 | 4.9 |
| Total | 41 | 100.0 | |
Table 2.
List of variables accepted for the tests that characterize the analysed area.
| No. | Groups of Variables | The Abbreviation for the Variable | The Variable in Full |
|---|---|---|---|
| 1 | The structure of land ownership | x1 | % of the area of private land |
| x2 | % of land owned by the Agricultural Property Agency of the State Treasury | ||
| x3 | % of land owned by the State Forests National Forest Holding | ||
| x4 | % of land of the State Treasury subject to perpetual usufruct | ||
| x5 | % of the area of land owned by communes and their unions | ||
| x6 | % of the area of land owned by counties and their unions | ||
| x7 | % of the area of land owned by voivodeships | ||
| 2 | The structure of agricultural land | x8 | % of cropland (in the village) |
| x9 | % of orchards | ||
| x10 | % of meadows | ||
| x11 | % of pastures | ||
| x12 | % of built-up agricultural land | ||
| x13 | % of built-up land | ||
| x14 | % of water bodies (still) | ||
| x15 | % of forestland | ||
| x16 | % of land with tree stands and shrubs | ||
| x17 | % of roads | ||
| x18 | % of water courses | ||
| x19 | % share of wasteland | ||
| 3 | The productivity of cropland, meadows and pastures | x20 | productivity index for cropland |
| x21 | productivity index for meadows | ||
| x22 | productivity index for pastures | ||
| 4 | Fragmentation of agricultural real property and plots | x23 | % of the number of plots up to 0.10 ha |
| x24 | % of 0.11–0.30 ha plots | ||
| x25 | % of 0.31–0.60 ha plots | ||
| x26 | % of 0.61–0.90 ha plots | ||
| x27 | % of 0.91–1.20 ha plots | ||
| x28 | % of 1.21–1.50 ha plots | ||
| x29 | % of 1.51–1.80 ha plots | ||
| x30 | % of the number of plots with the area exceeding 1.81 | ||
| 5 | Distribution of agricultural real property and plots | x31 | % of plots of local non-resident owners in relation to the number of private plots in the village |
| x32 | average area of a plot of a local non-resident owner | ||
| x33 | % of plots of local non-resident owners in relation to the area of private land in the village | ||
| x34 | % of plots of out-of-village non-resident owners in relation to the number of private plots in the village | ||
| x35 | average area of a plot of an out-of-village non-resident owner | ||
| x36 | % of the number of out-of-village non-resident owners from cities | ||
| x37 | % of area of out-of-village non-resident owners in relation to the area of private land | ||
| x38 | % of the number of local non-resident owners in relation to the number of registered residents of the village | ||
| x39 | % of the number of out-of-village non-resident owners in relation to the number of registered residents of the village | ||
| 6 | shape parameters of plots and their accessibility by road | x40 | ratio of plots without access to roads |
| x41 | village shape ratio |
Table 3.
Principal components for the group of variables describing the structure of agricultural land.
Table 3.
Principal components for the group of variables describing the structure of agricultural land.
| Subsequent Principal Component | Own Value | Percentage of Variation | Accumulated Own Value | Accumulated Percentage of Variation |
|---|---|---|---|---|
| 1 | 453.4 | 70.5% | 453.4 | 70.5% |
| 2 | 118.6 | 18.4% | 572.0 | 88.9% |
Table 4.
Components for variables describing the structure of agricultural land.
| Structure of Agricultural Land (% Share) | Inputs for the Variable | Correlations of Variables | ||
|---|---|---|---|---|
| Factor 1 | Factor 2 | Factor 1 | Factor 2 | |
| cropland | 74.1% | 4.4% | −0.99 | −0.12 |
| orchards | 0.1% | 0.0% | −0.41 | −0.07 |
| meadows | 6.3% | 34.1% | 0.59 | 0.71 |
| pastures | 0.1% | 1.2% | 0.14 | 0.32 |
| farm buildings | 0.1% | 0.0% | −0.62 | −0.06 |
| buildings | 0.0% | 0.0% | −0.00 | −0.01 |
| still waters | 0.3% | 0.4% | 0.25 | 0.15 |
| forestland | 18.8% | 59.6% | 0.73 | −0.67 |
| tree stands and shrubs | 0.0% | 0.0% | 0.18 | 0.08 |
| roads | 0.0% | 0.0% | −0.06 | 0.23 |
| water courses | 0.0% | 0.0% | 0.22 | 0.16 |
| wasteland | 0.0% | 0.3% | 0.18 | 0.27 |
Table 5.
Specification of identified groups of villages.
| Group of Villages | Number of Villages | Total Area of the Village | ||
|---|---|---|---|---|
| Number | % | ha | % | |
| A | 31 | 26.7 | 15646.70 | 25.3 |
| B | 6 | 5.2 | 8196.47 | 13.3 |
| C | 8 | 6.9 | 4958.63 | 8.0 |
| D | 31 | 26.7 | 11726.8 | 19.0 |
| E | 40 | 34.5 | 21208.8 | 34.4 |
| In total: | 116 | 100.0 | 61737.38 | 100.0 |
Table 6.
Mean and test probability p values for the group of variables concerning the structure of ownership.
Table 6.
Mean and test probability p values for the group of variables concerning the structure of ownership.
| Percentage of Area According to Ownership | Group | P | ||||
|---|---|---|---|---|---|---|
| A | B | C | D | E | ||
| Private land | 85.1 | 48.0 | 72.2 | 94.8 | 85.3 | 0.0000 *** |
| Land of the Agricultural Property Agency of the State Treasury | 3.9 | 1.9 | 2.1 | 0.4 | 4.3 | 0.0000 *** |
| State Forests National Forest Holding | 1.8 | 45.5 | 10.5 | 0.6 | 1.7 | 0.0000 *** |
| Land of the State Treasury under perpetual usufruct | 0.2 | 0.1 | 2.8 | 0.4 | 1.5 | 0.0030 ** |
| Land owned by communes and their unions | 2.1 | 1.1 | 3.7 | 1.3 | 2.0 | 0.0052 ** |
| Land owned by counties and their unions | 0.6 | 0.7 | 0.6 | 0.8 | 0.7 | 0.9623 |
| Land owned by voivodeships | 0.1 | 0.0 | 0.2 | 0.3 | 0.2 | 0.4799 |
© 2019 by the authors. Licensee MDPI, Basel, Switzerland. This article is an open access article distributed under the terms and conditions of the Creative Commons Attribution (CC BY) license (http://creativecommons.org/licenses/by/4.0/).
Share and Cite
MDPI and ACS Style
Stręk, Ż.; Noga, K. Method of Delimiting the Spatial Structure of Villages for the Purposes of Land Consolidation and Exchange. Remote Sens. 2019, 11, 1268. https://doi.org/10.3390/rs11111268
AMA Style
Stręk Ż, Noga K. Method of Delimiting the Spatial Structure of Villages for the Purposes of Land Consolidation and Exchange. Remote Sensing. 2019; 11(11):1268. https://doi.org/10.3390/rs11111268
Chicago/Turabian StyleStręk, Żanna, and Karol Noga. 2019. "Method of Delimiting the Spatial Structure of Villages for the Purposes of Land Consolidation and Exchange" Remote Sensing 11, no. 11: 1268. https://doi.org/10.3390/rs11111268
Note that from the first issue of 2016, this journal uses article numbers instead of page numbers. See further details here.