Article

Analysis of the Spatiotemporal Variation in Land Subsidence on the Beijing Plain, China

1
College of Resources Environment and Tourism, Capital Normal University, 105 North Road of the Western 3rd Ringroad, Haidian District, Beijing 100048, China
2
Key Laboratory of 3D Information Acquisition and Application, MOE, Capital Normal University, Beijing 100048, China
3
Department of Geography, Yuying School, 11 West Street of Wanshou Road, Haidian District, Beijing 100036, China
*
Author to whom correspondence should be addressed.
Remote Sens. 2019, 11(10), 1170; https://doi.org/10.3390/rs11101170
Submission received: 19 April 2019 / Revised: 12 May 2019 / Accepted: 14 May 2019 / Published: 16 May 2019
(This article belongs to the Section Remote Sensing in Geology, Geomorphology and Hydrology)

Abstract

:
Since the 1970s, land subsidence has been rapidly developing on the Beijing Plain, and the systematic study of the evolutionary mechanism of this subsidence is of great significance in the sustainable development of the regional economy. On the basis of Interferometric Synthetic Aperture Radar (InSAR) results, this study employed the Mann–Kendall method for the first time to determine the mutation information of land subsidence on the Beijing Plain from 2004 to 2015. By combining the hydrogeological conditions, “southern water” project, and other data, we attempted to analyse the reasons for land subsidence mutations. First, on the basis of ENVISAT ASAR and RADARSAT-2 data, the land subsidence of the Beijing Plain was determined while using small baseline interferometry (SBAS-InSAR) and Persistent Scatterers Interferometry (PSI). Second, on the basis of the Geographic Information System (GIS) platform, vector data of displacement under different scales were obtained. Through a series of tests, a scale of 960 metres was selected as the research unit and the displacement rate from 2004 to 2015 was obtained. Finally, a trend analysis of land subsidence was carried out on the basis of the Mann–Kendall mutation test. The results showed that single-year mutations were mainly distributed in the middle and lower parts of the Yongding River alluvial fan and the Chaobai River alluvial fan. Among these mutations, the greatest numbers occurred in 2015 and 2005, being 1344 and 915, respectively. The upper and middle alluvial fan of the Chaobai River, the vicinity of the emergency water sources, and the edge of the groundwater funnel have undergone several mutations. Combining hydrogeological data of the study area and the impact of the south-to-north water transfer project, we analysed the causes of these mutations. The experimental results can quantitatively verify the mutation information of land subsidence in conjunction with time series to further elucidate the spatial-temporal variation characteristics of land subsidence in the study area.

Graphical Abstract

1. Introduction

Land subsidence is a geological phenomenon that is caused by human engineering activities (e.g., groundwater exploitation) or natural factors, and, in this phenomenon, the ground elevation within a certain area decreases [1,2]. The occurrence of land subsidence is nearly irreversible. When severe local surface subsidence occurs, it can induce a series of geological environmental disasters, such as foundation sinking, house cracking, and underground pipeline damage [3,4,5,6]; furthermore, subsidence is characterized as necessitating a long formation time, having a wide influential range, and being highly difficult to prevent and control [2]. At present, more than 150 countries and regions worldwide have suffered from land subsidence, among which the most severe areas are central Mexico [7,8], central Iran [9,10], the Bandung basin of Indonesia [11], and northern Italy [12,13]. In China, land subsidence has mainly occurred on the North China Plain and within the Yangtze River Delta, the Fenwei Basin, and the Pearl River Delta [6,14,15,16,17,18,19]. Among these areas, land subsidence on the North China Plain (the Beijing-Tianjin-Hebei region) continues to increase, the subsidence within the Yangtze River Delta region has been effectively controlled, and the subsidence within the Fenwei Basin region is still rapidly developing.
In 2000, Persistent Scatterers Interferometry Synthetic Aperture Radar (PS-InSAR), which was proposed by Ferretti, et al. [20], was used to effectively reduce the influence of phase incoherence and atmospheric delay in traditional differential interferometry SAR (D-InSAR). In 2002 and 2004, Berardino, et al. [21] and Lanari, et al. [22] proposed the small baseline set interferometry (SBAS-InSAR) technique, which is more suitable for the slow deformation of surface monitoring over the long term. Many researchers have used this method to carry out in-depth research. In recent years, related research has mainly focused on severe land subsidence areas. In 2014, Chaussard, Wdowinski, Cabral-Cano, and Amelung [1] used ALOS data to monitor land subsidence in central Mexico and confirmed that groundwater overdraft was the main cause of land subsidence in that region. In 2014, Qu, et al. [23] used ENVISAT ASAR, ALOS, and TerraSAR-X data to reveal the temporal and spatial variation characteristics of ground fractures and surface subsidence in Xi’an, China. In 2016, Amighpey and Arabi [9] used ENVISAT ASAR data to obtain surface deformation information of the Yazd-Ardakan Plain in central Iran and compared it with changes in water levels to estimate the skeleton water storage coefficient. In 2017, Shviro, et al. [24] used COSMO-SkyMed data to study the quantitative impacts of floods on land subsidence in the Dead Sea region. In 2018, Zhao, et al. [25] used ALOS data to reveal the surface deformations in the Linfen-Yuncheng (China) basin and successfully detected the active faults and ground fractures.
As the capital of China, Beijing resides on one of the most severe areas of land affected by subsidence worldwide. Beijing has been experiencing rapid urban development and population growth since the 1960s, and its demand for water resources continues to increase [19]. Over the years, groundwater has accounted for two-thirds of the total water supply in Beijing [26]. Moreover, Beijing is one of the few global metropolises whose main source of water supply is groundwater [27]. Land subsidence has been increasing rapidly in the Beijing area, with the long-term overexploitation of groundwater, and the land subsidence funnels have tended to be interconnected [28]. At the end of 2015, the maximum cumulative settlement of the Beijing Plain area was approximately 1.4 metres, and the area whose cumulative settlement exceeded one metre reached 4000 km2. Thus, land subsidence has become a major threat to Beijing’s urban construction and residential safety [29].
Using InSAR technology, many researchers have conducted in-depth studies on land subsidence in Beijing. In 2009, Gong, et al. [30] used ENVISAT ASAR data from 2003 to 2006 to monitor land subsidence on the Beijing Plain via Persistent Scatterers Interferometry (PSI). The results showed that Quaternary faults have certain influence on the spatial pattern of ground subsidence, which often occurs in areas whose clay layer is thicker than 50 m. In 2015, Chen, et al. [31] used ENVISAT ASAR data to obtain land subsidence information regarding Beijing, and, by combining GIS spatial analysis technology, they analysed the spatial and temporal evolutionary characteristics of uneven settlements. In 2015, Zhu, et al. [19] combined ENVISAT ASAR data, LANDSAT data, and hydrogeological data to study the land subsidence on the northern plain of Beijing. The results showed that the maximum subsidence rate reached 52 mm/year and that the silty clay layer strongly contributed to land subsidence. In 2016, Chen, et al. [32] used TerraSAR-X and ENVISAT ASAR data to analyse the spatial and temporal distribution characteristics of land subsidence on the Beijing Plain and revealed the main inducing factors. Chen, et al. [33] subsequently used the RADARSAT-2 data to reveal the spatial and temporal variation characteristics of the subsidence of Beijing Metro Line 6. In 2017, Zhou, et al. [31] used TerraSAR-X data to monitor the surface deformation information concerning the eastern Beijing Plain from 2010 to 2015 and analysed the correlations between the different land use types and land subsidence. In addition, Zhou, et al. [34] used TerraSAR-X and ENVISAT ASAR data to determine the surface deformation characteristics of the Beijing Plain. The authors determined that the maximum expansion direction of land subsidence on the Beijing Plain was East and that the growth rate was 11.3 km2/year using the equal-sector analysis method. In 2018, using TerraSAR-X, ENVISAT ASAR, and urban building information data, Yang, et al. [35] analysed the relationships between land subsidence and building density at the regional, block, and building scales. In 2019, Chen, et al. [36] used RADARSAT-2 data, SBAS technology, and wavelet change methodology to analyse the lag time between ground subsidence and groundwater levels quantitatively on the Beijing Plain. Relevant studies have mainly focused on the spatial distribution characteristics and formation mechanisms of land subsidence in Beijing; however, few studies have investigated the variation characteristics of land subsidence in conjunction with time series.
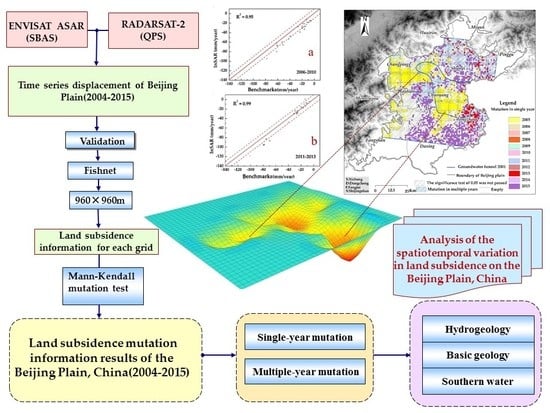
At present, the problem of land subsidence mainly concerns its spatial distribution and formation factors, and temporal issues that are associated with mutations of land subsidence have never been reported. Studying the mutation time and its corresponding region can help to quantitatively reveal the temporal and spatial variation characteristics of land subsidence. The Mann–Kendall method can be used to quantitatively analyse the mutation information of time series of precipitation, temperature, water quality, and other factors [37,38,39]. This method has never been applied to land subsidence. We can use this method to study the mutation information of land subsidence in conjunction with time series quantitatively to further grasp the spatial-temporal variation characteristics of land subsidence in a study area. Therefore, this study used ENVISAT ASAR and RADARSAT-2 to obtain the surface deformation information of the Beijing Plain area from 2004 to 2015; furthermore, the research area was divided into 5575 grids that were 960 m by 960 m via the Fishnet tool. A Mann–Kendall test was subsequently carried out for each grid via Python, and the land subsidence mutation information of the Beijing Plain area was obtained on the basis of the grids. The combination of hydrogeology and basic geological conditions ultimately resulted in an analysis of the causes of mutations.

2. Study Area

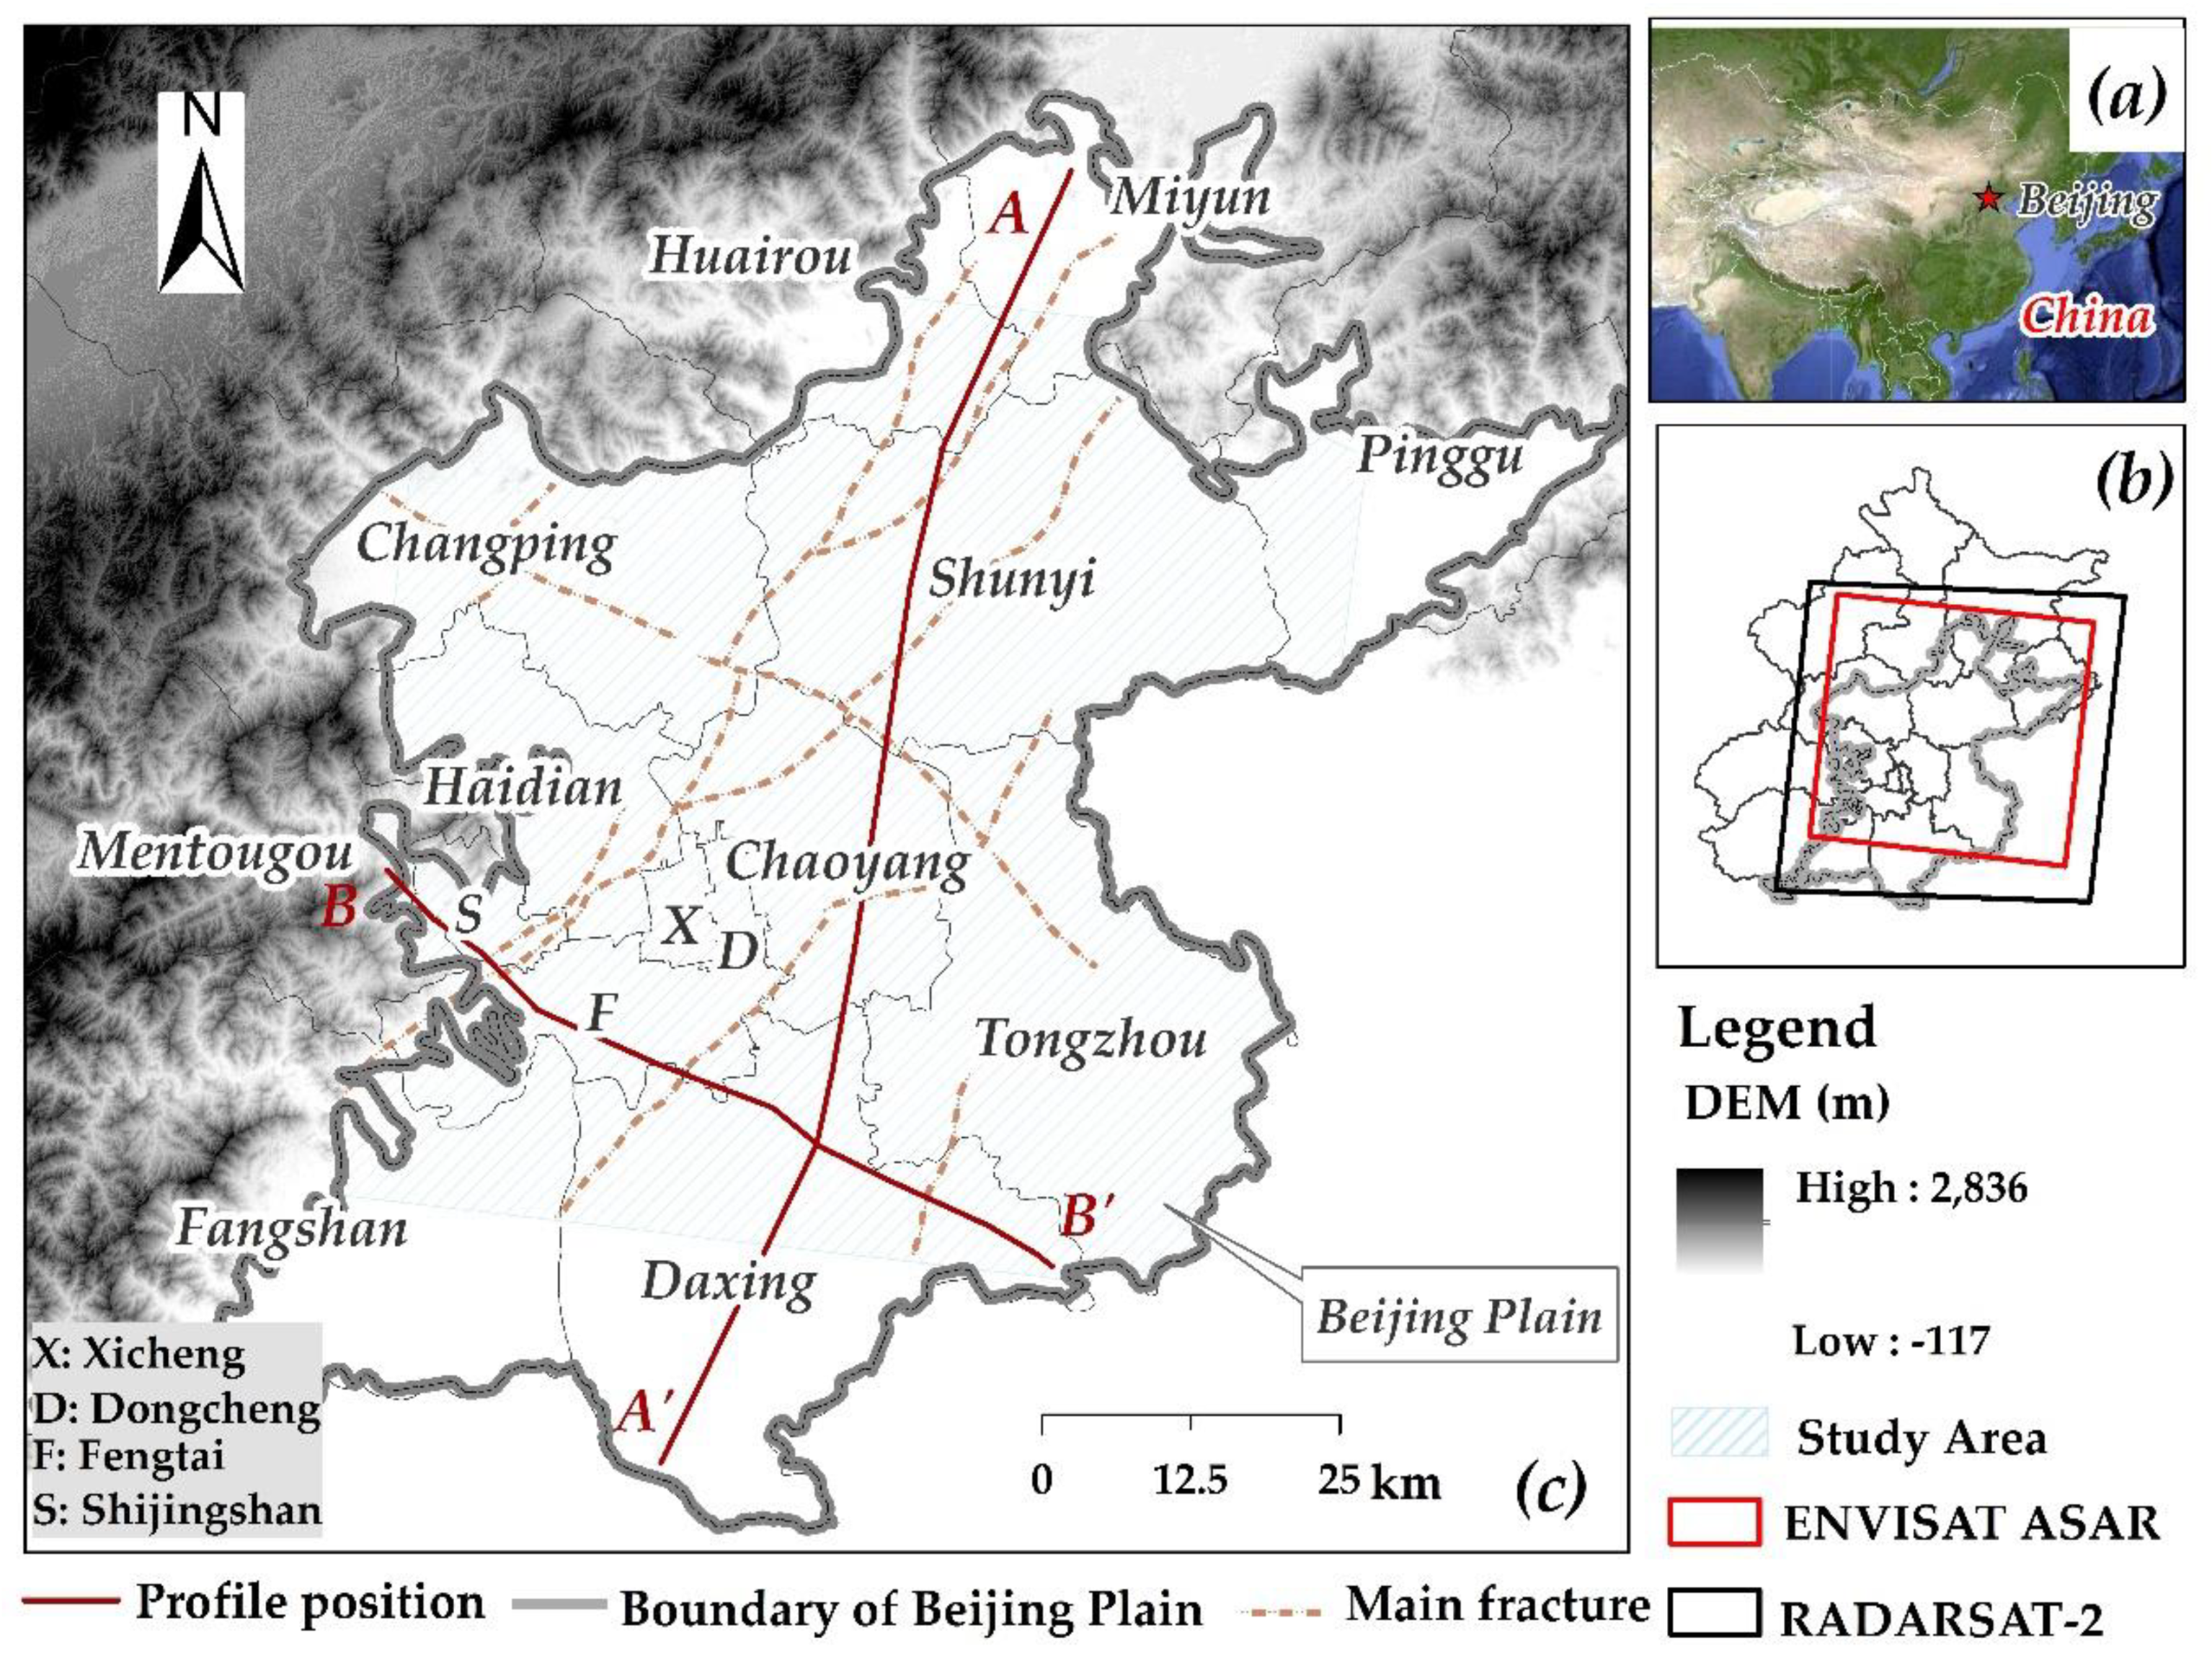
As the capital of China, Beijing is the centre of the national politics, economy, and culture, and it is an international metropolis with a population of nearly 20 million people. The area of Beijing is located on the north-western edge of the North China Plain and it occupies the region between 39.4° N, 115.7° E and 41.6° N, 117.4° E. In general, the topography is higher in the north-western region and lower in the south-eastern region. The geomorphologic features are divided into three parts: the western mountainous area, the northern mountainous area, and the south-eastern plain (Figure 1). The total area of Beijing is 1,680,780 km2 and the plain covers 38% of the total area. From 2000 to 2011, Beijing suffered a continual drought, with an average rainfall of only 459.11 mm.
The Beijing Plain is formed by the combination of five major water systems (i.e., the Juma River system, Yongding River system, Wenyu River system, Chaobai River system, and Jiyunhe River system) [3]. As shown in Figure 2, the Quaternary loose sediments in the study area are widely distributed. At the top of the alluvial fan, the Quaternary thickness is approximately 20~40 m; a single gravel layer or a thin viscous soil layer that is covered with gravel represents this thickness [19]. In the lower part of the alluvial fan, the Quaternary loose sediment thickness gradually increases, the gradation increases, and the particles gradually become smaller. The lithology gradually transitions to a point where sand, gravel, and viscous soil intersect with each other and viscous soil dominates it [36]. There are many fractures in the study area, and these fractures tend to mostly occur in the SE–NW and NE–SW directions.
Land subsidence, as a surface response to the development, utilization, and evolution of underground space, has become a global and multidisciplinary complex geological environmental problem [
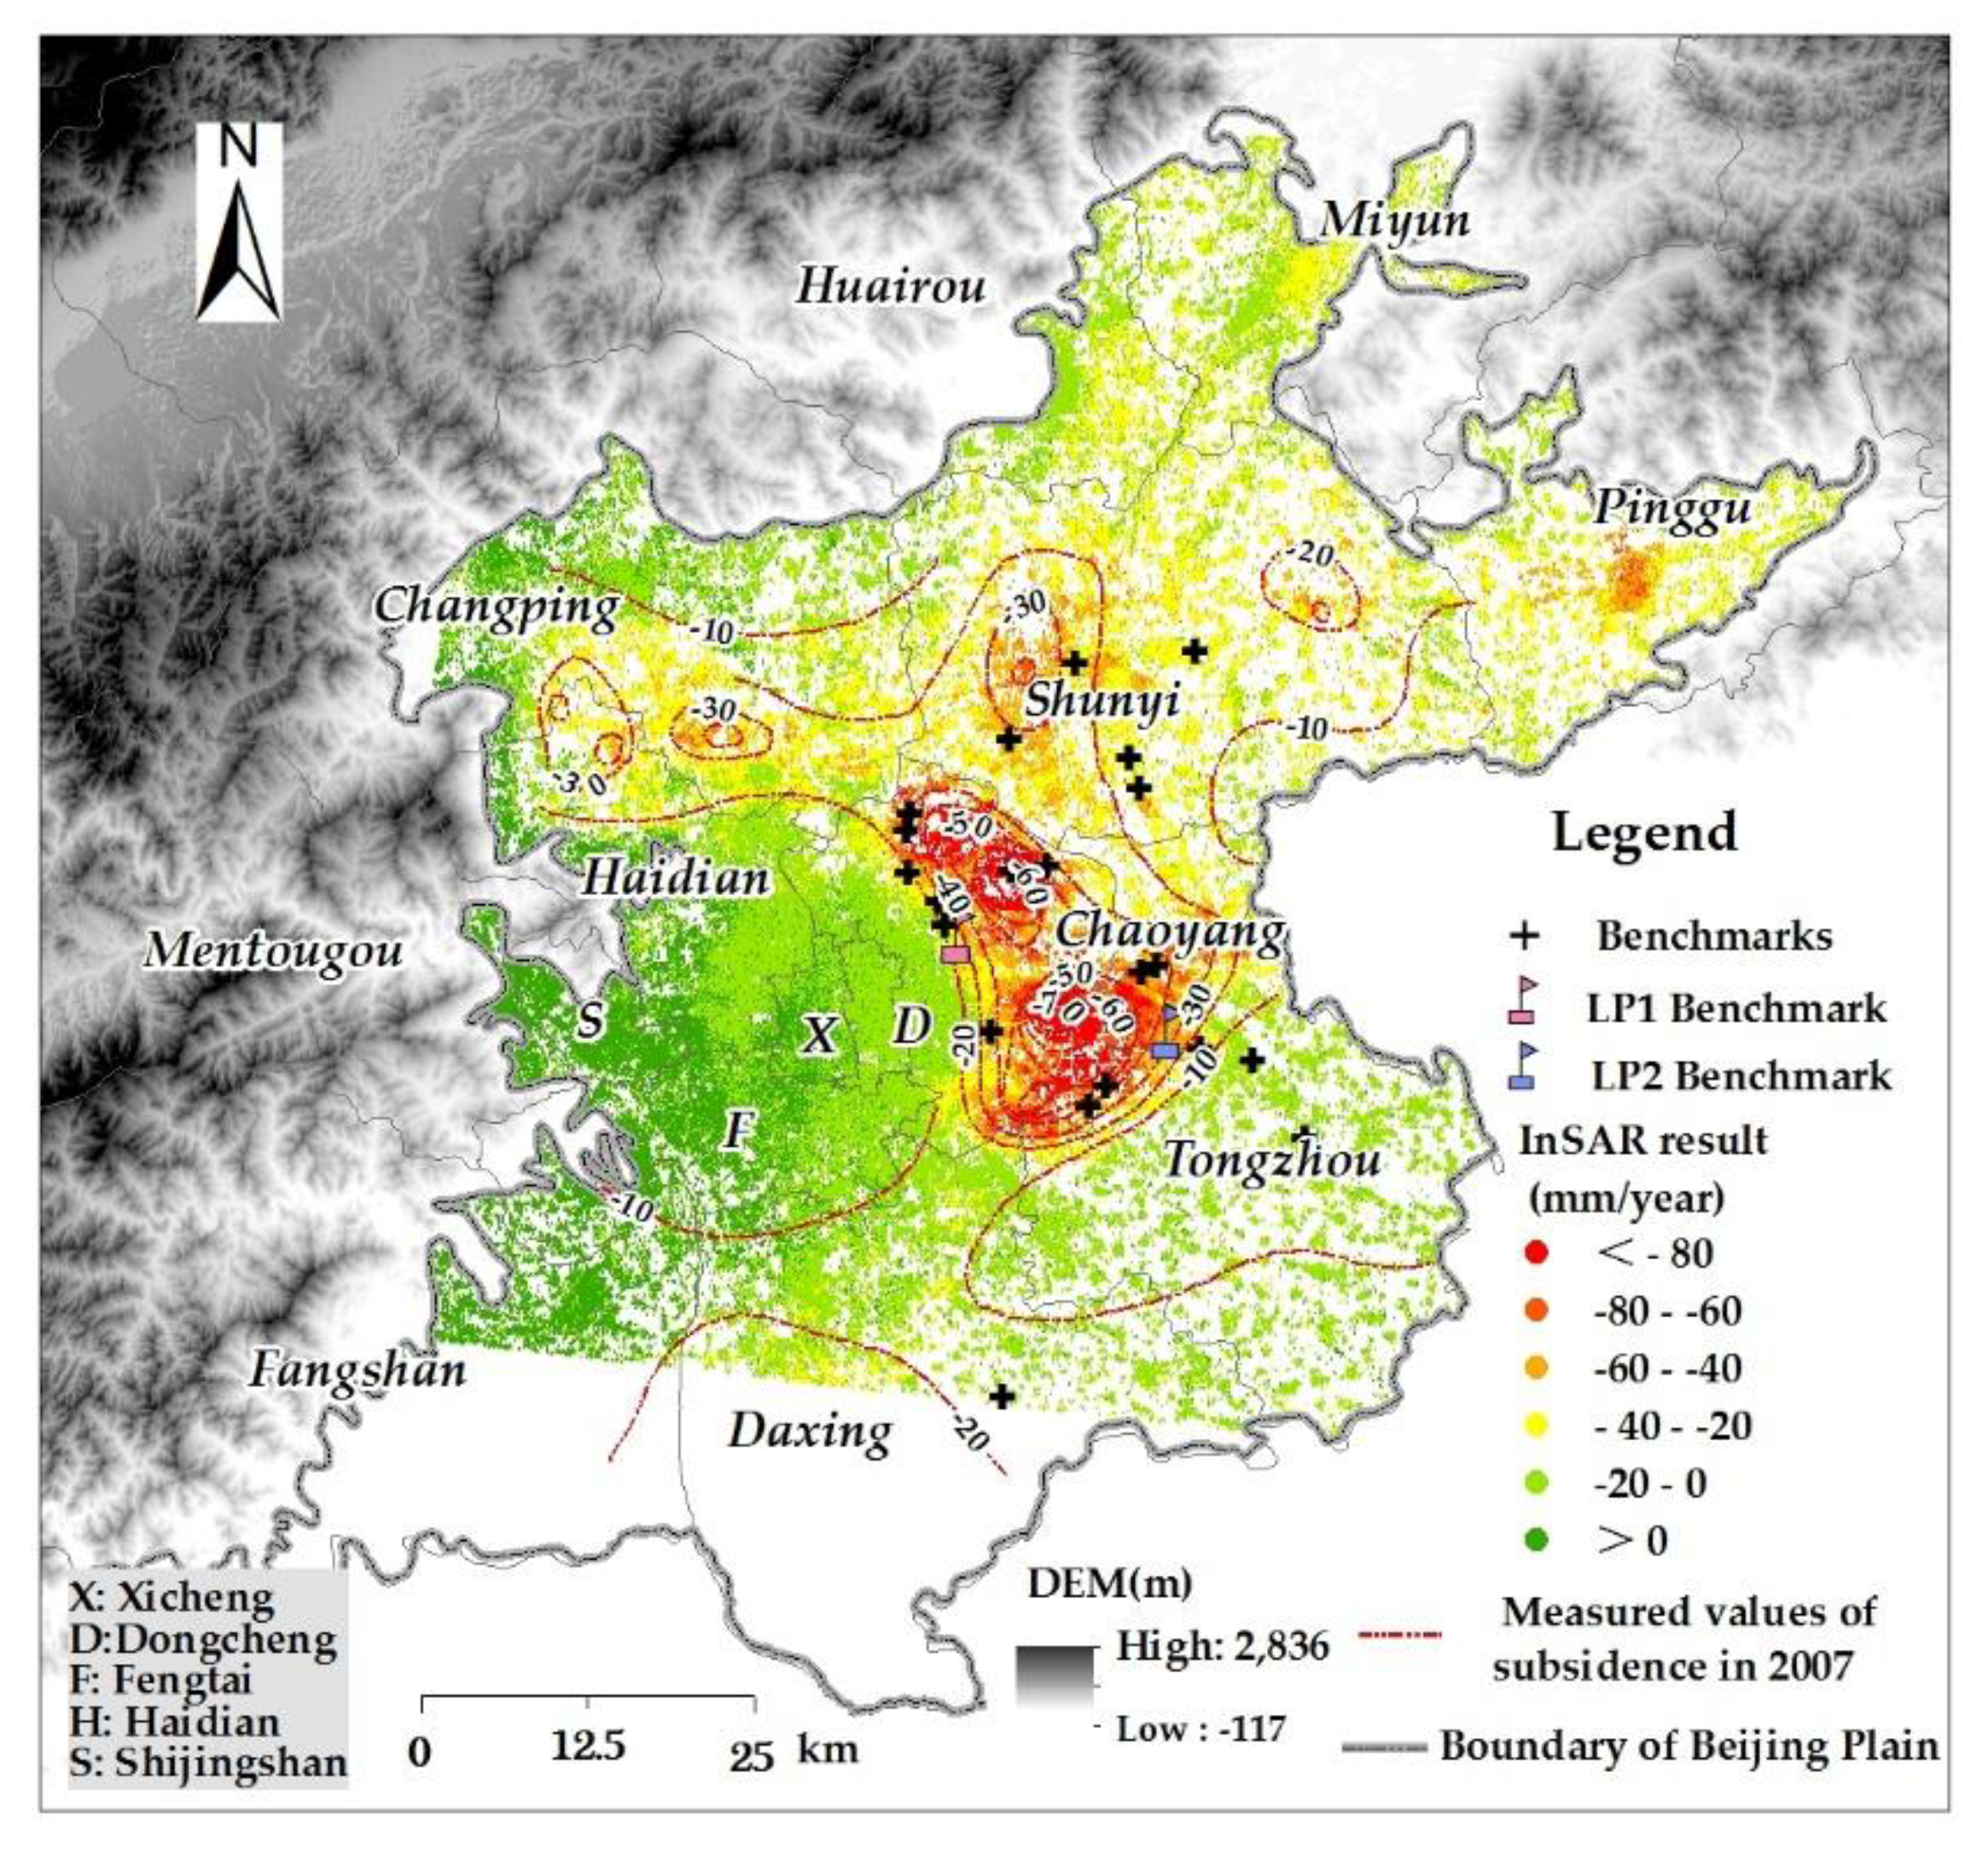
29]. Land subsidence first occurred in Beijing in 1935, and the main subsidence area was located in the area from Xidan to Dongdan. Since the 1970s, land subsidence on the Beijing Plain has entered a period of rapid development. In general, the subsidence area can be divided into two major areas (the northern and the southern areas) and it has seven subsidence centres [27]. The northern subsidence area is large and it includes six centres: Beiqijia in Changping; Xixiaoying in Haidian; JinZhan, Sanjianfang, Heizhuanghu in Chaoyang; and, urban Tongzhou. The southern subsidence area is small and it includes the Yufa subsidence centre in Daxing. By 2012, the cumulative settlement greater than 50 mm reached 4323 km2, the maximum historical settlement rate was 159.6 mm/year and the maximum cumulative settlement (1955–2012) was 1414 mm (Baxianzhuang Settlement Center) [29]. At of the end of 2015, the area of land subsidence in Beijing involved an area of 4842 km2, with an average annual subsidence of 21.6 mm/year and an annual maximum value of nearly 141 mm/year [36].

3. Methodology

3.1. Data Sources

In this study, ENVISAT ASAR data and RADARSAT-2 data were selected to obtain the surface deformation information of Beijing from June 2003 to December 2015. ENVISAT is a solar-synchronous polar orbiting satellite that was launched by the European Space Agency on 1 March 2002, and it has been out of contact since 8 April 2012; additionally, the largest sensor on it is synthetic aperture radar. The ENVISAT ASAR sensor has an orbital altitude of 799.8 km, its operating band is C-band with a wavelength of 5.6 cm, and its orbital repeat observation interval is 35 days. We employed 47 images of the ascending-orbit ASAR data from June 2003 to August 2010, and the images covered most of the Beijing Plain, except for the southernmost tip of Beijing. RADARSAT-2 is a radar satellite launched on 14 December 2007, by the Canadian Space Agency in collaboration with the MacDonald Dettwiler Associates (MDA). This satellite operates in the C-band with a wavelength of 5.6 cm and the orbital repeat observation interval is 24 days. We employed 48 RADARSAT-2 images from the descending-orbit data from November 2010 to October 2015 (Table 1).

3.2. Processing of SBAS-InSAR on the Basis of StaMPS

Small baseline interferometry (SBAS-InSAR), as originally proposed by Berardino and Lanari in 2002 and 2004, is a reliable method for studying long-term slow surface deformation [21,22]. The principle of this method is that the SAR image in the same study area is formed into several baseline pairs on the basis of the sizes of the spatial baseline and time baseline. Thus, the small baseline data are combined into several sets. Therefore, within a set, the baseline of the interference pair is small; between the sets, the interference pair is relatively large. Hooper initially proposed the method adopted in this paper in 2008, and this method differs by the identification of single-view slowly decorrelated filtered phase (SDFP) pixels in a single-view image [37]. In this study, on the basis of Delft object-oriented radar interferometric software (DORIS), we deduced that the time baseline threshold and the space baseline threshold of the ASAR images were 500 days and 500 metres, respectively, and the interference processing generated 46 interference images. The external Digital Elevation Model (DEM) that was applied to remove the topographic phase and flatten any effects that originated from the Shuttle Radar Topography Mission (SRTM), with a spatial resolution of 90 m (http://dds.cr.usgs.gov/srtm/).

3.3. Quasi-PS InSAR Processing Based on SARPROZ

Unlike traditional PS-InSAR, which can only process stable Persistent Scatter (PS) points, Quasi-PS InSAR technology (QPS) is an extension of PS-InSAR. The QPS method employs a spatial filtering method to improve the signal-to-noise ratio of the high-point target and selects interference pairs with high coherence in the time series data set to extract the elevation and deformation rate information of the target to involve more points in modelling and extract high-precision deformation information [38]. In the present study, the QPS technical method in SARPROZ software was selected to process the 48 RADARSAT-2 images. The RADARSAT-2 data resolution is 30 m and the time span ranged from 22 November 2010 to 20 November 2015. The time baselines and spatial baselines of the RADARSAT-2 images during 2010–2015 were 500 days and 500 metres, respectively. A total of 266 interferometric image pairs were generated during processing. The external DEM data were also retrieved from the STRM3 data (spatial resolution of 90 m).

3.4. Mann-Kendall Mutation Test

Also known as the non-distribution test, the Mann–Kendall test is a nonparametric statistical method. The advantage of this test is that it does not require samples to obey a certain distribution, and a few outliers do not affect the results [40]. The Mann–Kendall method has been used by many researchers to analyse the trend changes of various elements, such as precipitation, runoff, and temperature, in conjunction with time series [37,38,39]. In this paper, this test method was used to evaluate the change trend of land subsidence on the Beijing Plain. The method is summarized, as follows:
For time series X with n samples, an ordered list is constructed:
S k = i = 0 k r i c        r i = { 1 , x i > x j 0 , e l s e          j = 1 , 2 , , i
Sk represents the cumulative number of values greater at time i than at time j. Under the assumption of stochastic independence of time series, we define the following statistics:
UF K = S k E ( S k ) Var ( S k )                 k = 1 , 2 , , n
Among them, UF1 = 0 and E(Sk) and Var(Sk) are the mean and variance of the cumulative Sk, respectively. When X1, X2, ..., Xn are independent of each other and they present the same continuous distribution, the following formula is obtained:
E ( S k ) = k ( k 1 ) 4   Var ( s k ) = k ( k 1 ) ( 2 k + 5 ) 72
where UFk is a standard normal distribution. A statistical sequence is calculated in the order of time series X (x1, x2, ..., xn). The significance level is given as α , after which the normal distribution table can be queried. If | UF k | > U α the sequence exhibits an obvious trend change. Similarly, the inverse order of UFk is calculated as UBk. The significance level that was selected in this study was α = 0.05 and the critical value was U 0.025 = ± 1.96 .

4. Results

4.1. Acquisition of Ground Deformation Time Series Information

On the basis of the surface deformation information that was monitored by SBAS-InSAR and QPS, a displacement rate distribution map was obtained for the Beijing Plain. As shown in Figure 3, the spatial distribution of land subsidence on the Beijing Plain is widespread, and the spatial difference is dramatic. The areas with severe settlement are mainly in the eastern region of Chaoyang, the north-western region of Tongzhou, the southern region of Changping, the north-western region of Shunyi, and the southern region of Daxing. From 2004 to 2010, the number of PS points that were obtained on the basis of the ENVISAT ASAR data was 266,581 and the average deformation rate ranged from −114.4 mm/year to +18.2 mm/year. Among the PS points, the area whose settlement rate was greater than 25 mm/year reached 1078.5 km2, which accounted for 17.2% of the total area of the Beijing Plain. From 2011 to 2015, 100,515 PS points were obtained on the basis of the RADARSAT-2 data, and the average deformation rate ranged from −133.6 mm/year to +18.4 mm/year. The area whose settlement rate was greater than 25 mm/year reached 1139 km2, which accounted for 17.8% of the area of the Beijing Plain. By the end of 2015, the area whose cumulative settlement across the Beijing Plain exceeded 300 mm reached 1271 km2, which accounted for approximately 20% of the total area of the Beijing Plain.

4.2. InSAR Validation

This work was validated in two steps. First, the second-class level deformation isoline of 2007 was selected and the results of SBAS-InSAR were preliminarily tested as a whole. Figure 4 shows that the settlement of the PS points that were obtained by SBAS-InSAR in 2007 were sufficiently consistent with that of the level measurements across the overall spatial distribution.
Furthermore, the data of 25 levelling benchmarks from 2003 to 2013 were selected for validation. The levelling benchmarks were taken as the original points, and all of the monitoring points within a radius of 150 m were extracted. The mean value of the extracted PS points was taken as the settlement estimation value and then verified according to the settlement of the levelling benchmarks. As shown in Figure 5, the correlation coefficient of the InSAR monitoring results and the level monitoring results from 2003 to 2010 was 0.95, the maximum absolute error was 17.9 mm/year, the minimum absolute error was 0.1 mm/year, and the standard deviation was 4 mm/year. From 2011 to 2013, the correlation coefficient of the InSAR monitoring results and the level monitoring results was 0.99, with a maximum absolute error of 17.3 mm/year, a minimum absolute error of 0.6 mm/year, and a standard deviation of 3 mm/year. Although the PS points fail to coincide with the corresponding levelling points, they still reflect the high accuracy of the InSAR results.

4.3. Acquisition of Mutation Information of the Beijing Plain

The spatial distribution characteristics of settlement information cannot be intuitively revealed, owing to the different densities of PS points in different areas and the large number of PS points. Fishnet analysis is the basic method of geospatial statistics; this method combines various data with natural geographic element data to express the spatial distribution characteristics for each unit. Therefore, we used the Fishnet tool to subdivide the research area into grids and study the spatial distribution characteristics of land subsidence on the Beijing Plain. The grid scale starts at 30 m (a regular grid), after which it exponentially increases up to 15,360 m. The minimum scale is 30 m, because the spatial resolution of the remote sensing image is 30 m. In 2017, Luo, et al. [41] divided the land subsidence on the Beijing Plain into 37 units based on the hydrogeological conditions. The maximum scale of this study was 15,360 m to maintain consistency with their data. We obtained the number of PS points at different scales via statistical methods to determine the optimal grid scale (Table 2).
According to the information of the PS points from 2004 to 2015 that was acquired by InSAR technology, using the spatial join method, we subsequently calculated the corresponding PS points at different scales within the grid, and the settlement information of the corresponding grid in 2004–2015 was obtained. Finally, a grid of 960 m × 960 m was chosen, because it guaranteed that 88% of the grids had PS points from 2003–2015; moreover, the grid can be refined as much as possible to represent the research area. In total, 5575 grids were created. The Mann–Kendall mutation test was ultimately applied to each grid via Python, and the settlement mutation information in the Beijing Plain area was obtained (Figure 6).
In total, 4887 grids had settlement information from 2004 to 2015, of which 3792 grids passed the significance test (p = 0.05). Among them, 2744 grids had a single mutation and 1048 grids had multiple mutations. Among the single-mutation grids, 1344 grids only underwent mutation in 2015, 915 grids only underwent mutations in 2005, and 152 grids only underwent mutations in 2013; moreover, fewer single mutations occurred in other years (Table 3).
Among the 1048 grids with multiple mutation years of the settlement rate, the grids in which mutations occurred in 2015 contained the most mutations; in 2015, there were 768 grids with mutations. There were a large number of grids (238 in total) in which mutations occurred both in 2013 and 2015. In addition, there were 153 grid mutations from 2013 to 2015 and 63 grid mutations in both 2011 and 2015. For the grids in which mutations occurred in 2005, 127 grids underwent mutations. In addition, the number of grids in which multiple mutations occurred in other years was relatively small.

5. Discussion

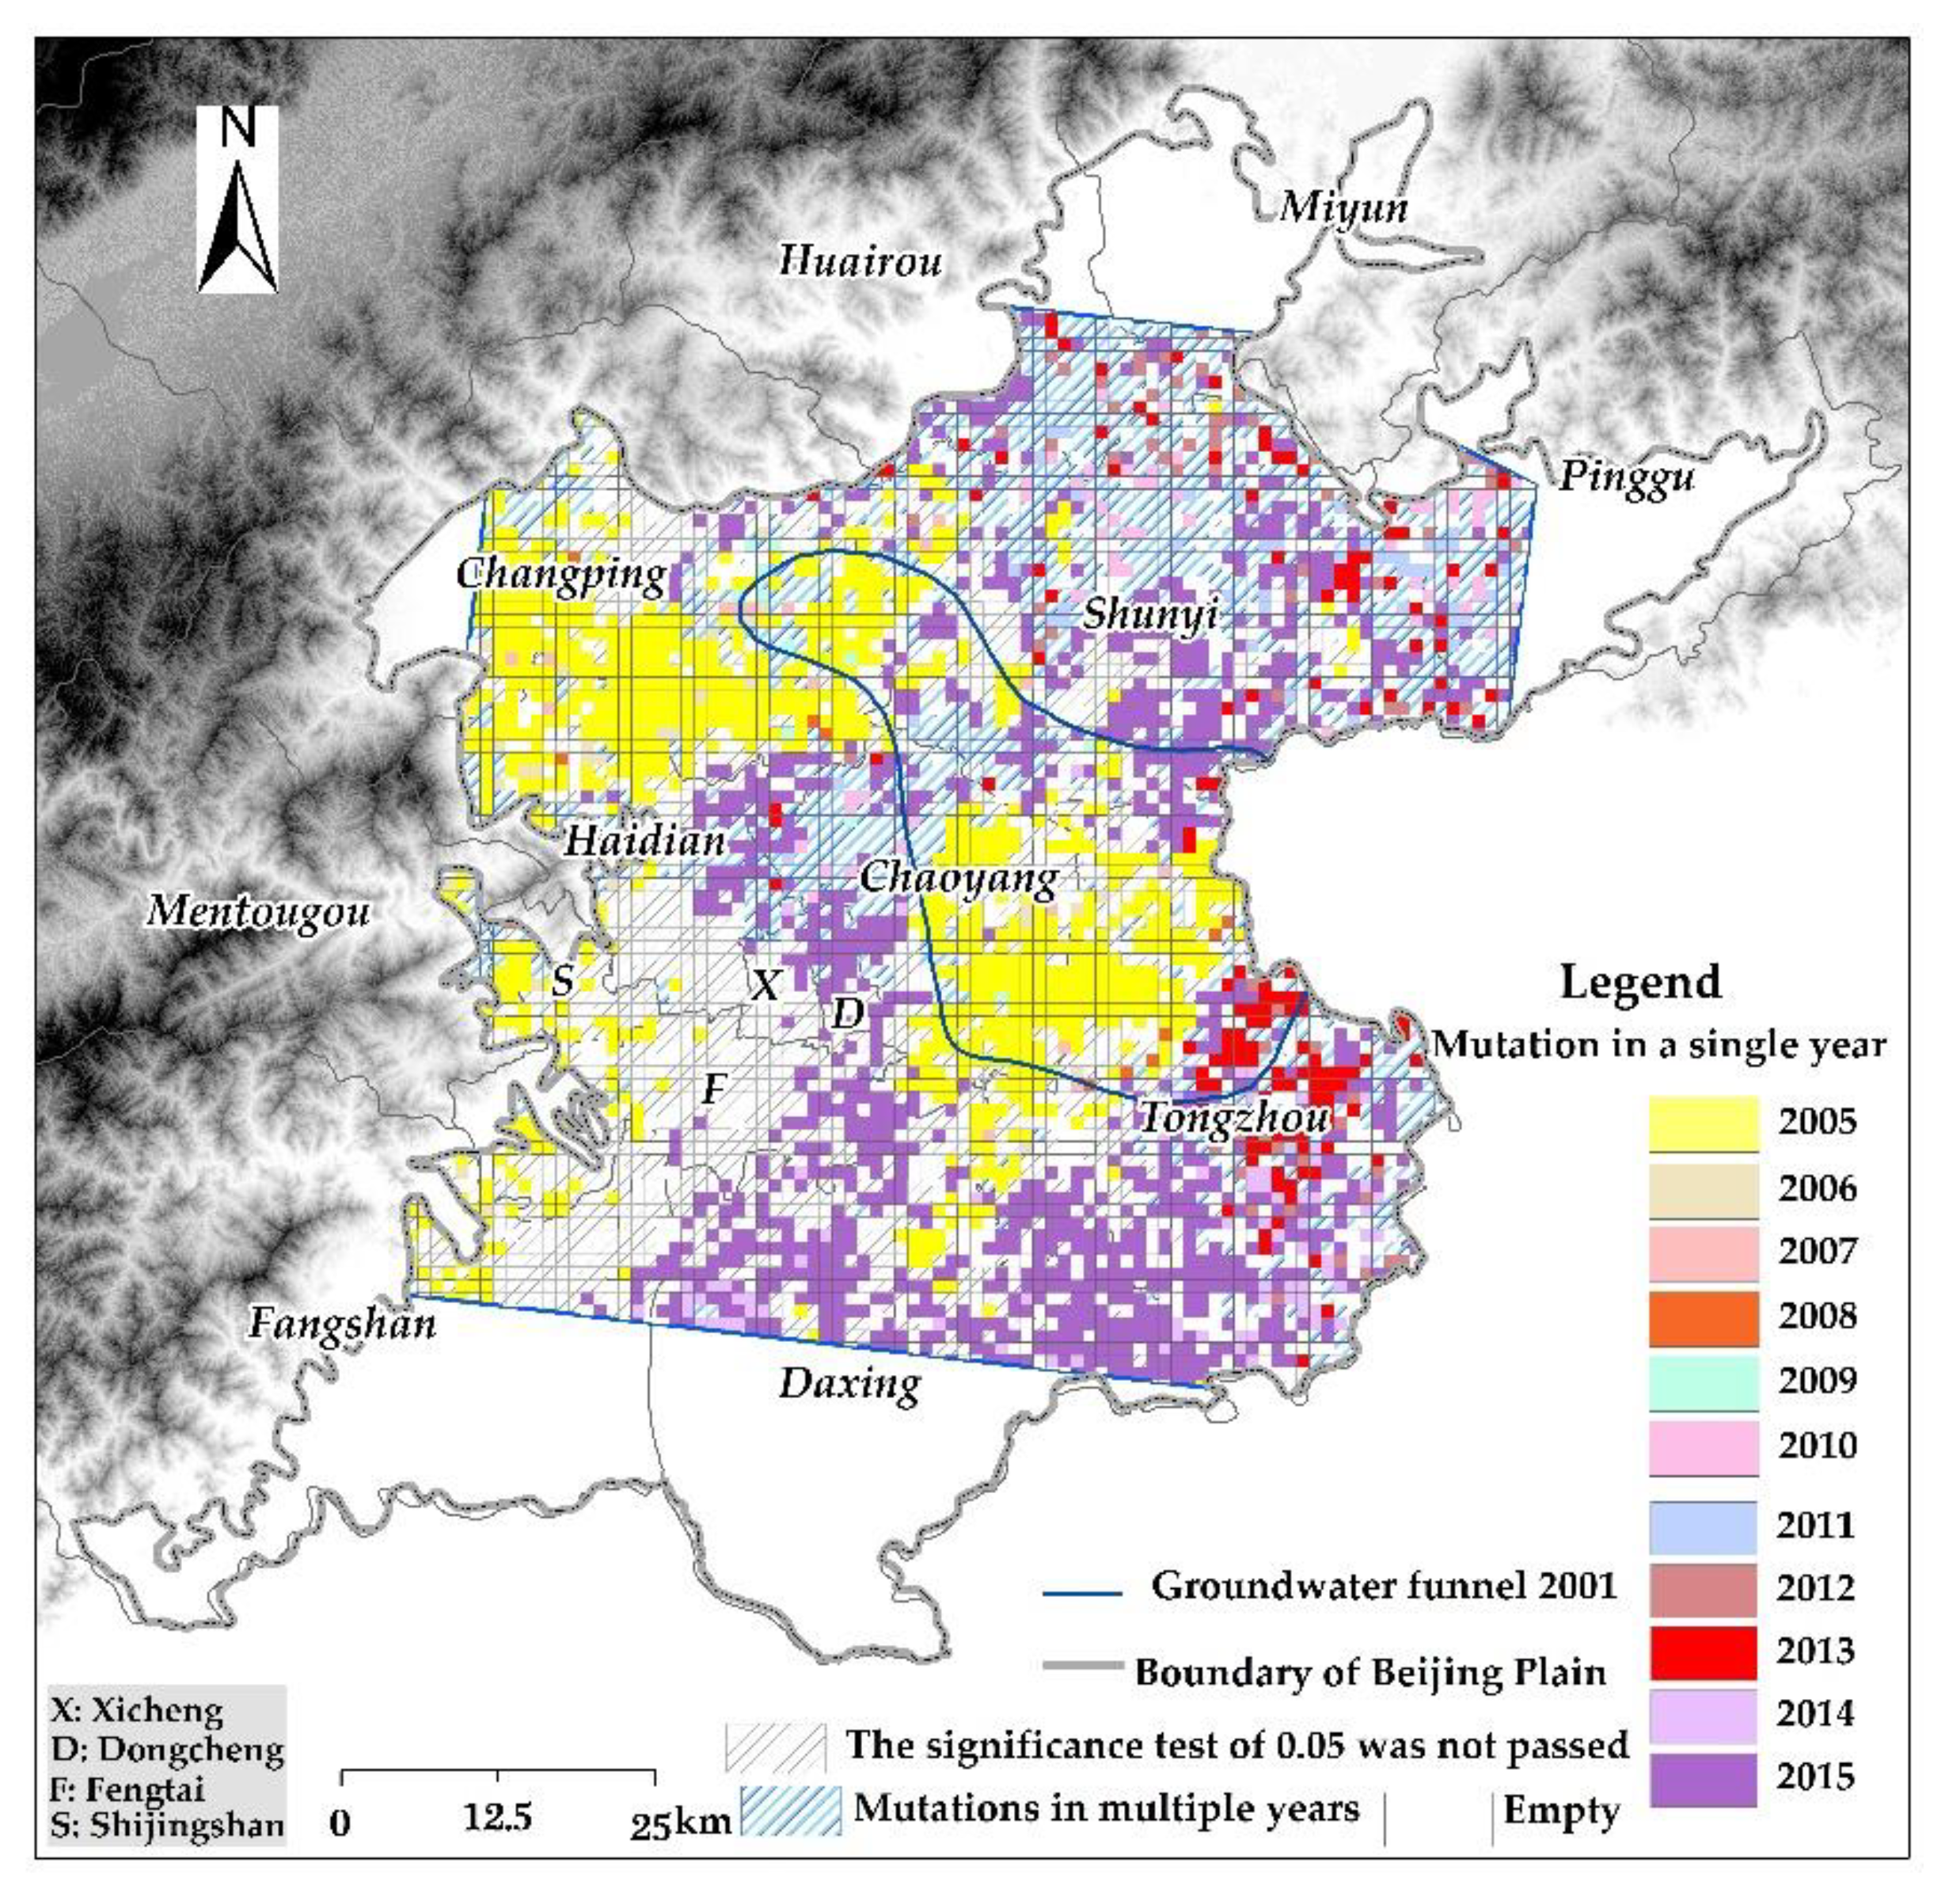
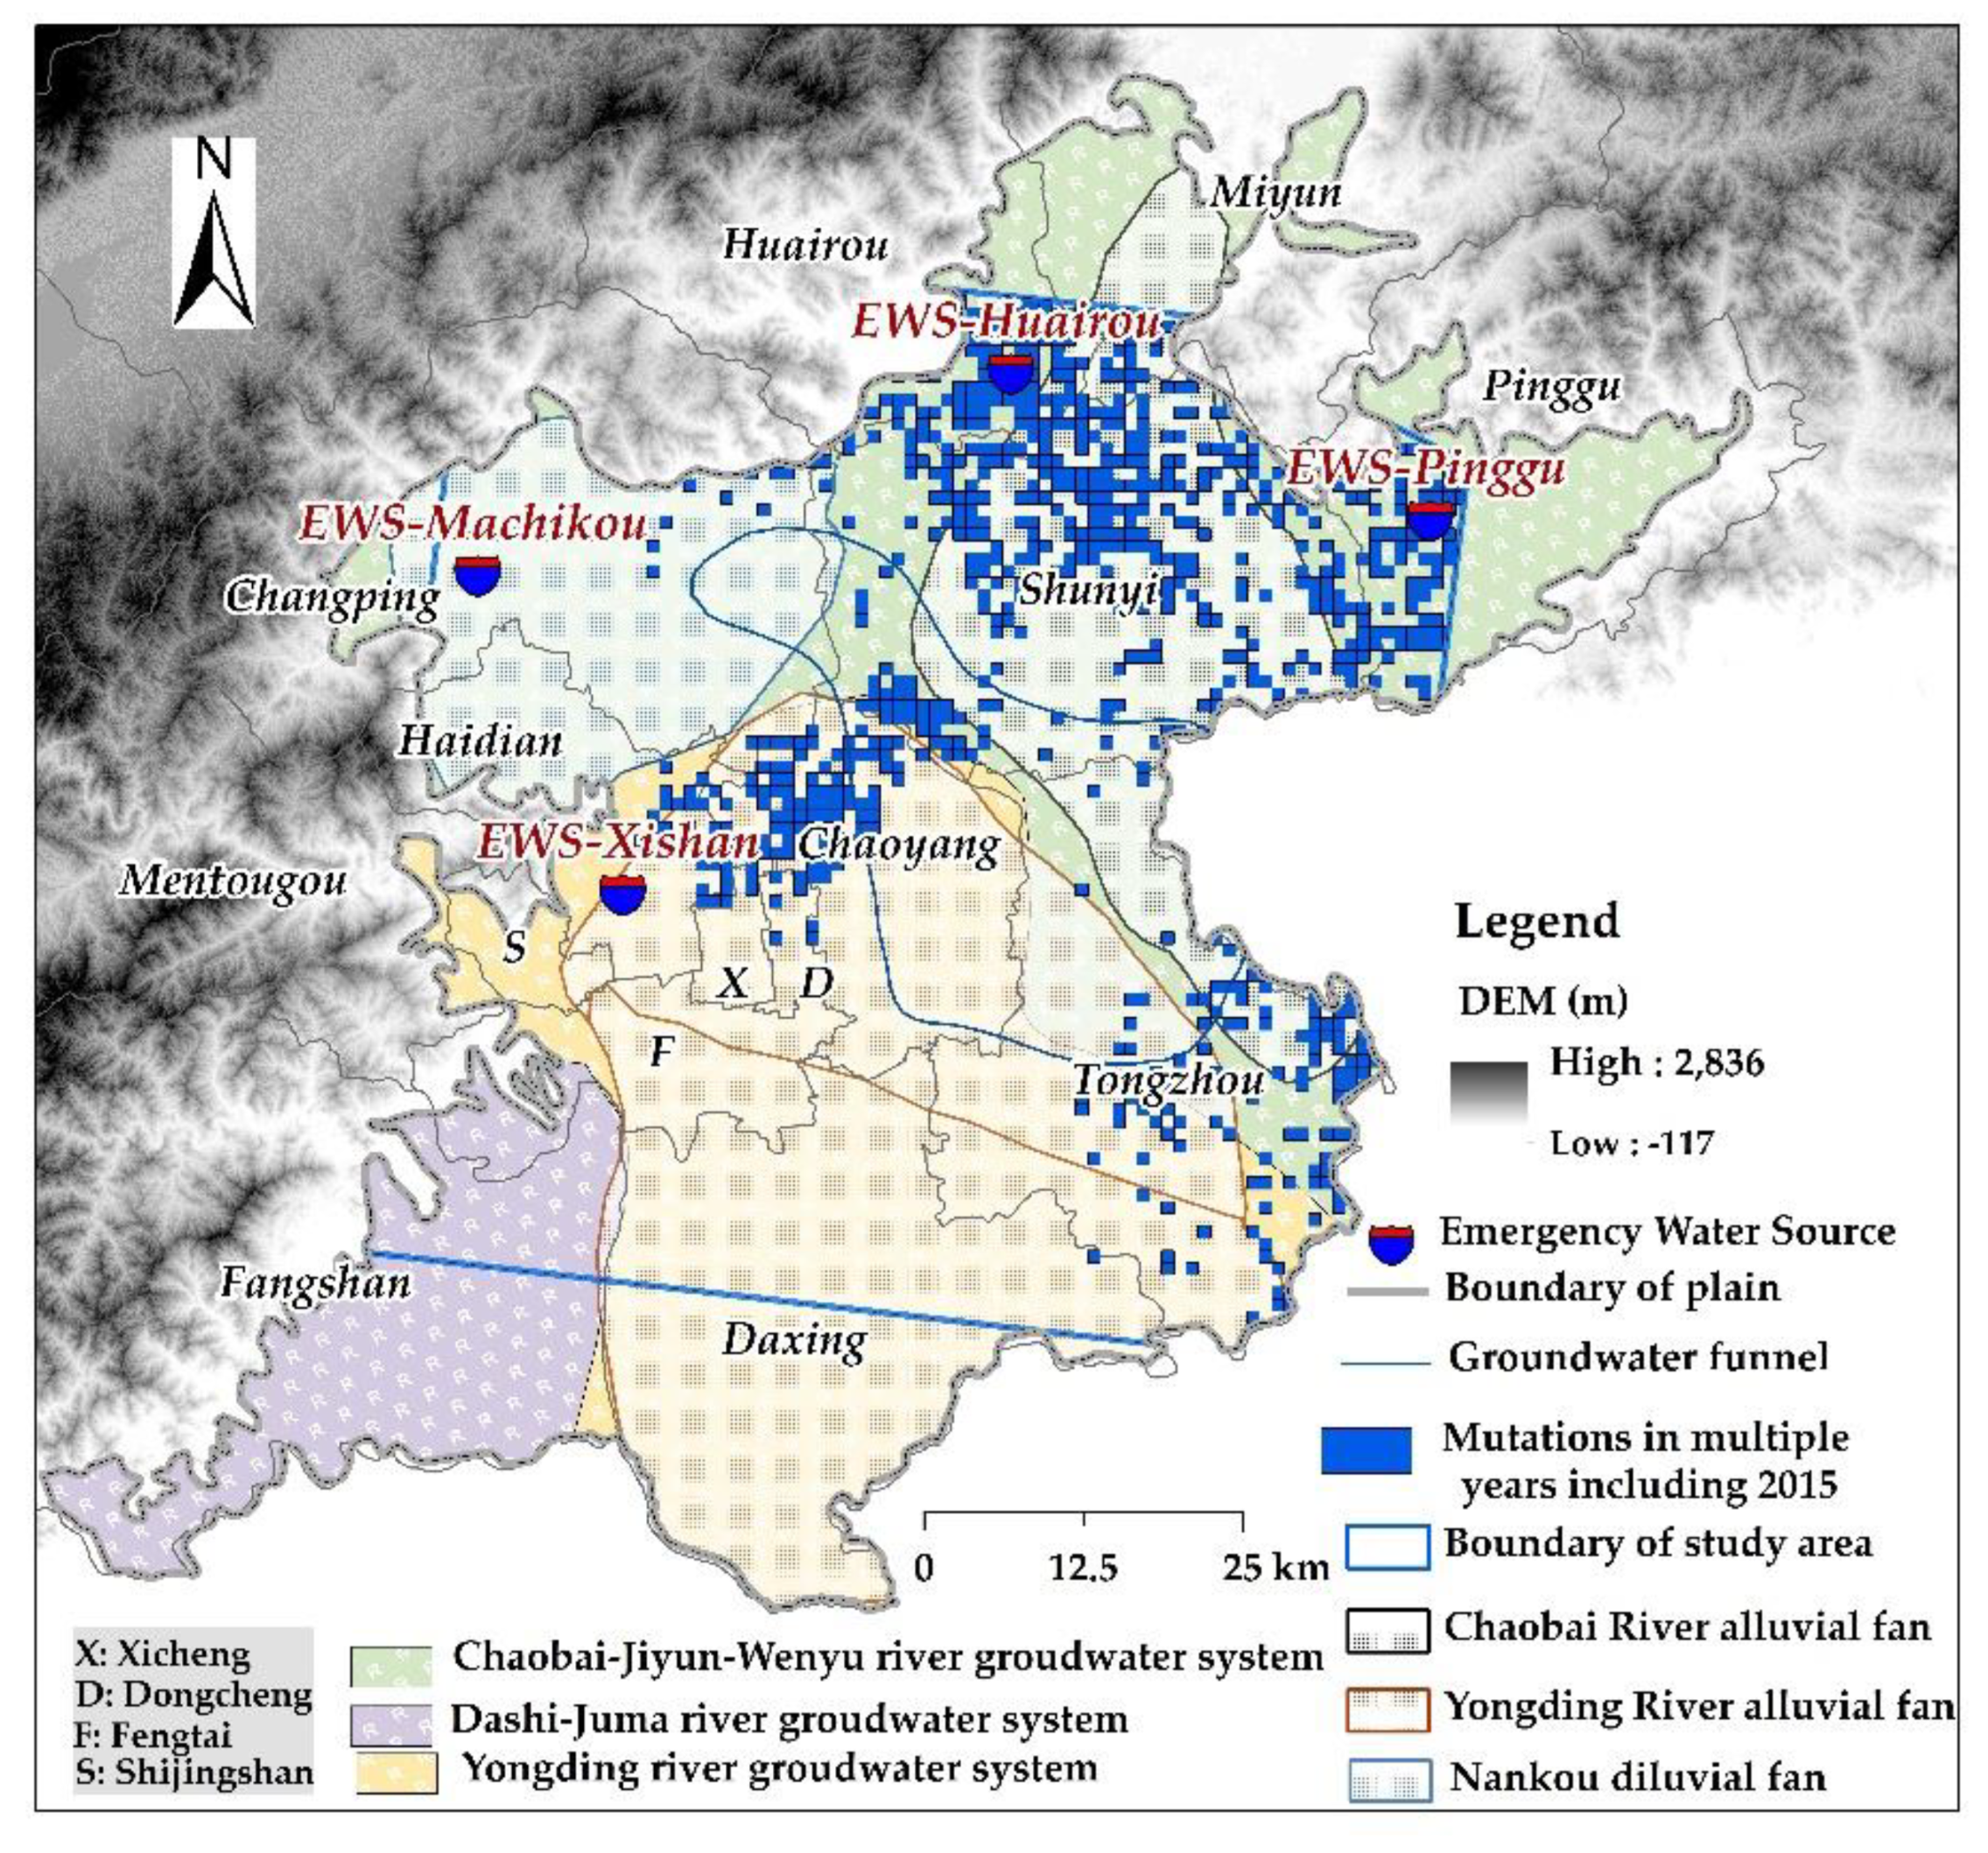
According to the map of the overall trend of the settlement mutation rate (Figure 6), grids with single-year mutations were mostly distributed in the middle and lower parts of the Chaobai River alluvial-diluvial fan and the Yongding River alluvial-diluvial fan, and the grids with multiple-year mutations were mostly distributed at the top of the alluvial-diluvial fan. The groundwater level of the Quaternary system has dropping drastically may be a reason for this distribution, which results in a decrease in pore water pressure in the overburdened layer and an effective stress increase between particles. However, in the middle and upper parts of the alluvial fan, most of the Quaternary diving or shallow confined water has good permeability, and the groundwater level greatly fluctuates due to the influence of precipitation. Rainfall quantity and the rainfall intensity are uneven in different seasons. These differences may cause the groundwater level in the middle and upper parts of the alluvial fan to experience relatively large fluctuations; thus, the grids with mutations may be more variable. On the other hand, the Huairou emergency water source, the Machikou emergency water source, the Xishan emergency water source, and the Pinggu emergency water source are in the middle and upper parts of the alluvial fan. The groundwater level has greatly changed, being affected by the distribution of exploitation, resulting in greater fluctuations of land subsidence. Figure 6 shows that, at the edge of the Quaternary groundwater drop funnel, the grids with mutations in the land subsidence rate greatly vary. In the following sections, by considering the hydrogeological conditions, we will attempt to discuss the causes of grid changes in a single year and the grid changes in multiple years.

5.1. Analysis of Single-Year Mutation Grids

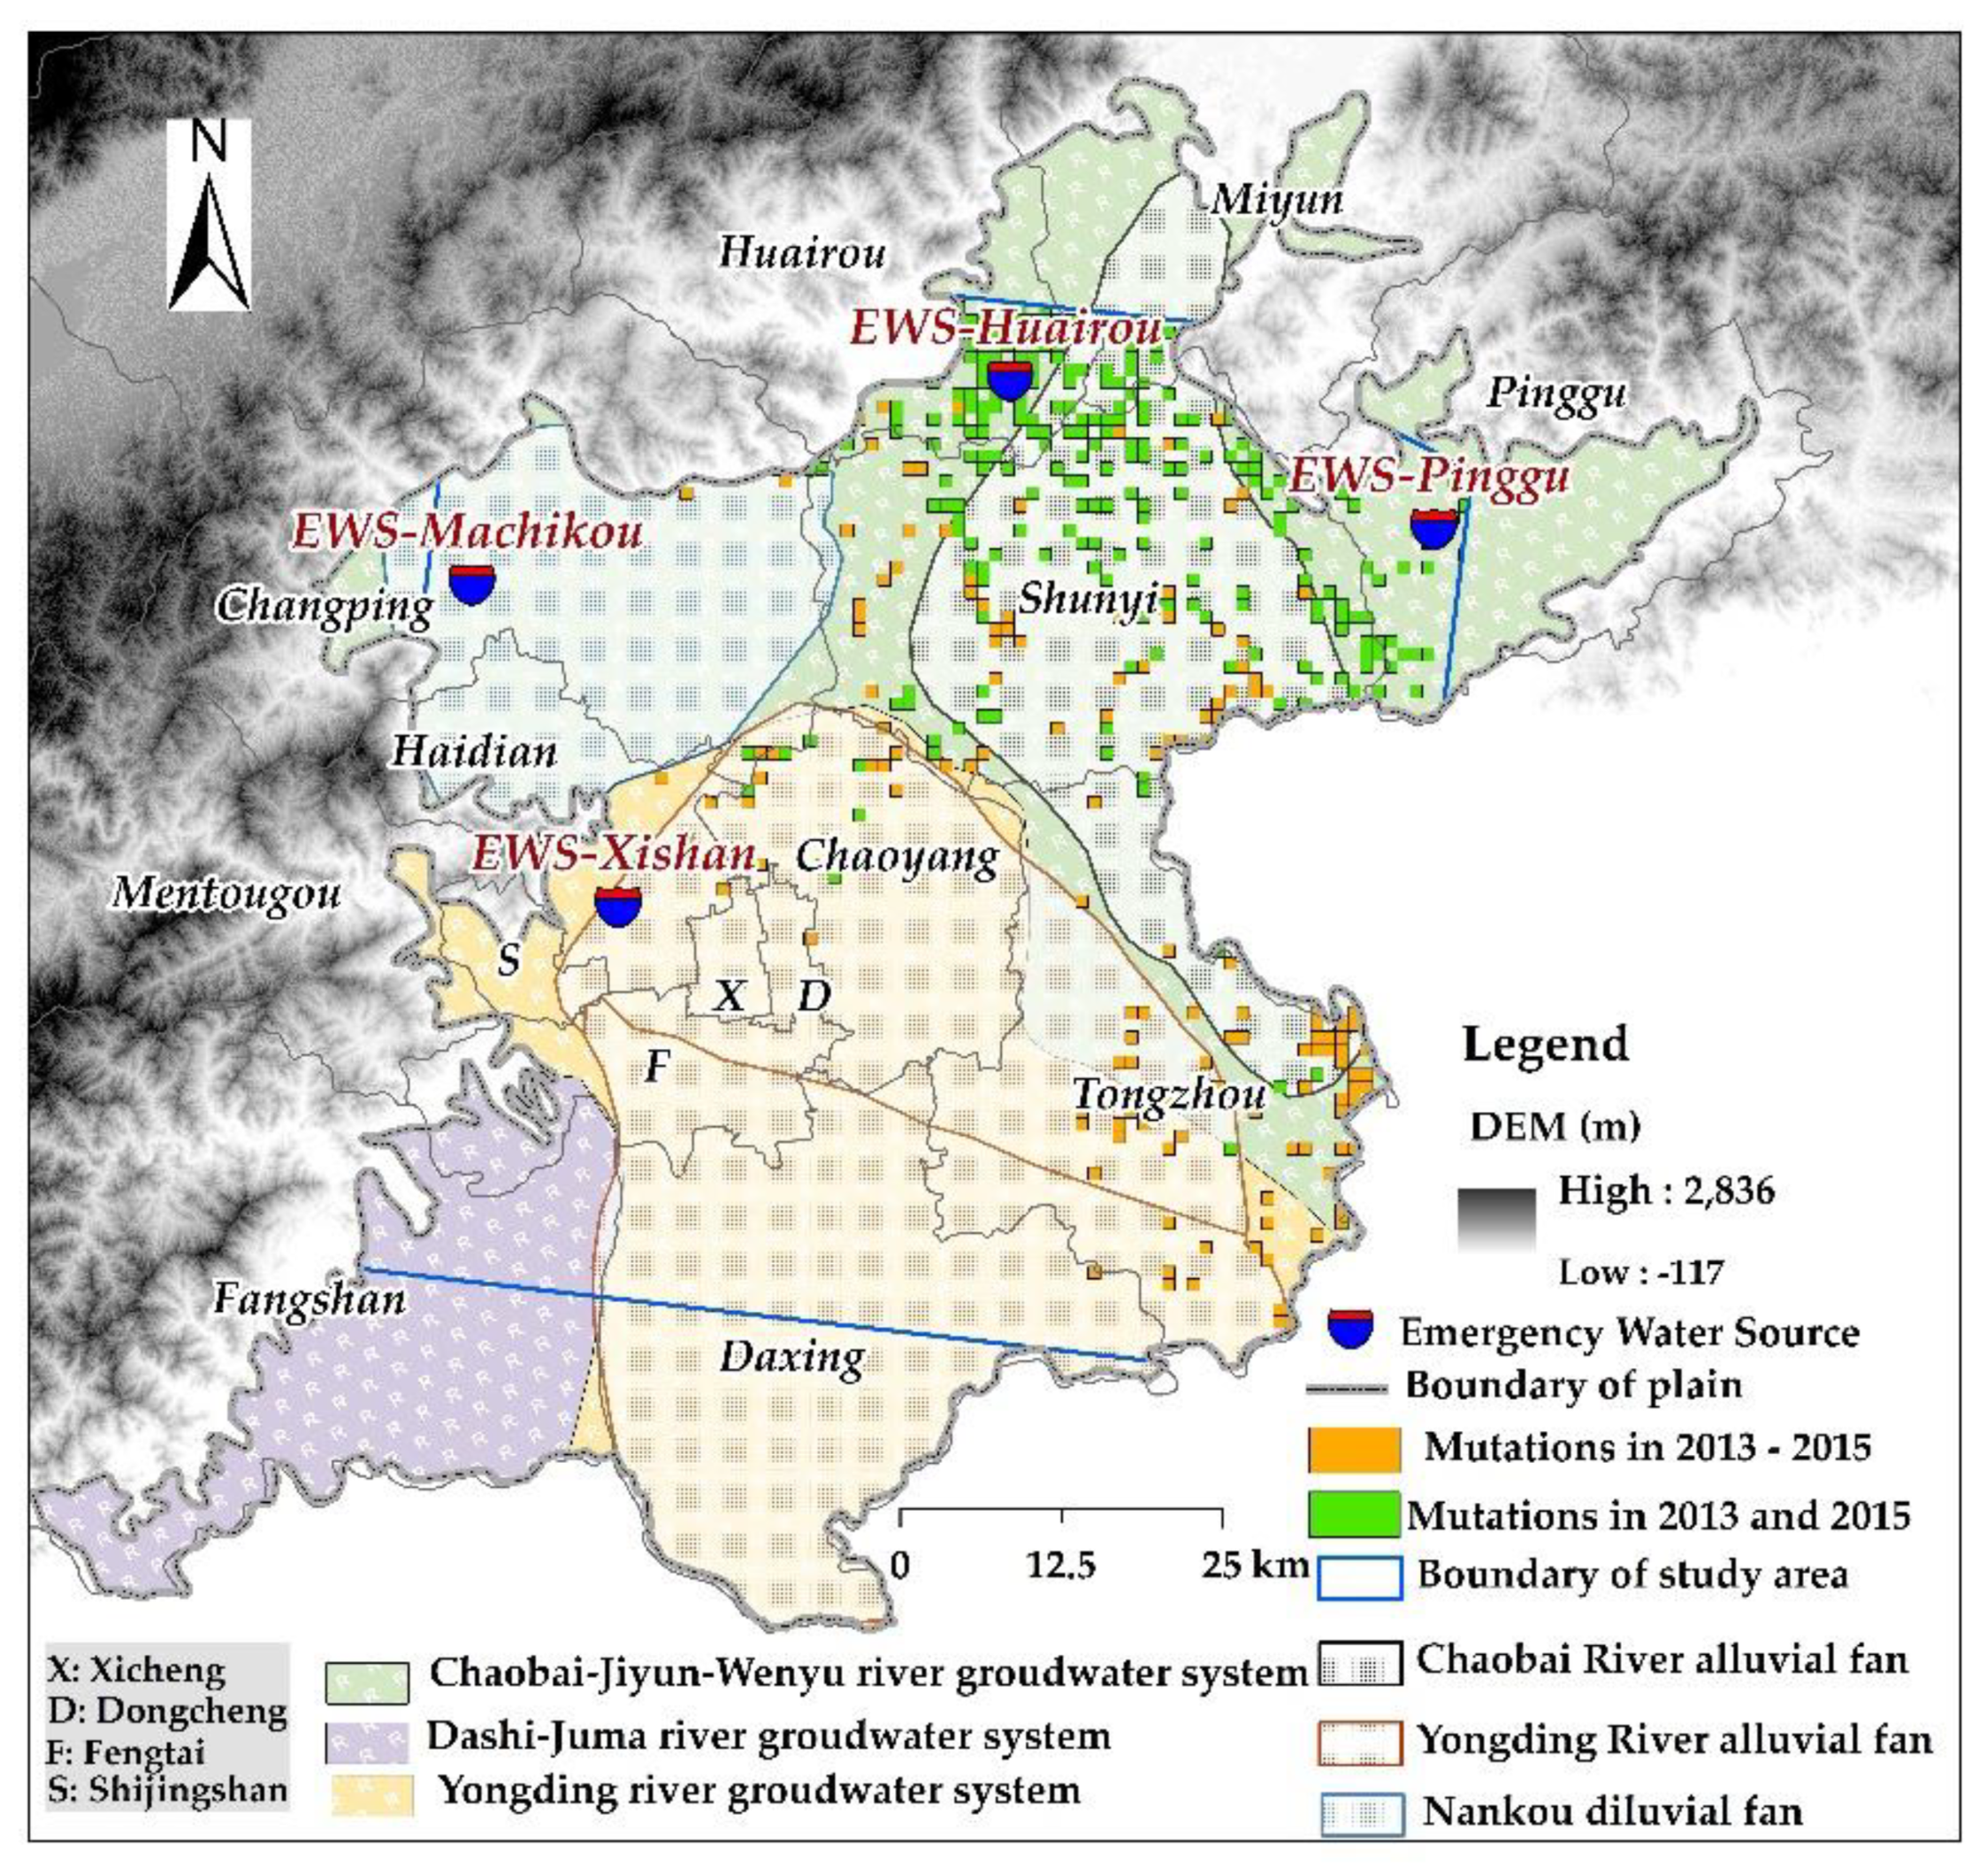
Among the 2744 land subsidence grids with a single mutation, 1344 grids occurred in 2015 (Figure 7). These grids are mainly distributed in the alluvial fans of the Chaobai River and Yongding River. The main reason is that the “South-to-North Water Transfer Middle Line” project was initiated beginning at the end of December 2014, and the water transfer year from 2014 to 2015 (the water transfer year refers to the annual water supply from November 1 to October 31) supplied 703 million cubic metres of water that was diverted to Beijing. Every day, eight water plants used more than 2.2 million cubic metres of the “southern water” (accounting for 70% of the total water supply in Beijing’s urban areas). Moreover, the Beijing municipal government has carried out a large-scale replacement project for self-provided wells, and the overall amount of groundwater extraction has decreased by 250 million cubic metres. This phenomenon not only reduces the amount of groundwater exploitation, but it also changes the distribution of groundwater exploitation, which may be one of the main reasons for the sudden change in the grids in 2015. The Water Resources Bulletin pointed that the average precipitation in Beijing in 2015 was 583 millimetres, which was 33% more than the 439 millimetres of precipitation recorded in 2014. In terms of the temporal precipitation distribution, the cumulative precipitation during the flood season (i.e., from June to September) was 447 millimetres, which accounted for 77% of the annual precipitation, and this value was 8% less than the annual average of 488 millimetres. This result means that the excessive rainfall is relatively lower and the effective supply of precipitation is relatively greater. The data of the Beijing Geological Environment Monitoring Station showed that 150 million cubic metres of water were recharged to the Beijing Plain every year from 2015 to 2020. Groundwater systems are interlinked, although the depth of recharge is typically approximately 50 metres, which may also be one of the reasons for the sudden change in the grids in 2015. Finally, dynamic load is one of the causes of land subsidence in Beijing. Three subways were opened in 2015, according to the official Beijing subway website. In addition, Chen et al. reported that, because subway construction severely disturbs the strata, the deformation rate changes markedly during construction [33] and that the groundwater level will be artificially lowered during the subway construction period. However, six subways were newly built in Beijing during 2015. These events may have caused some grids to mutate during that year.
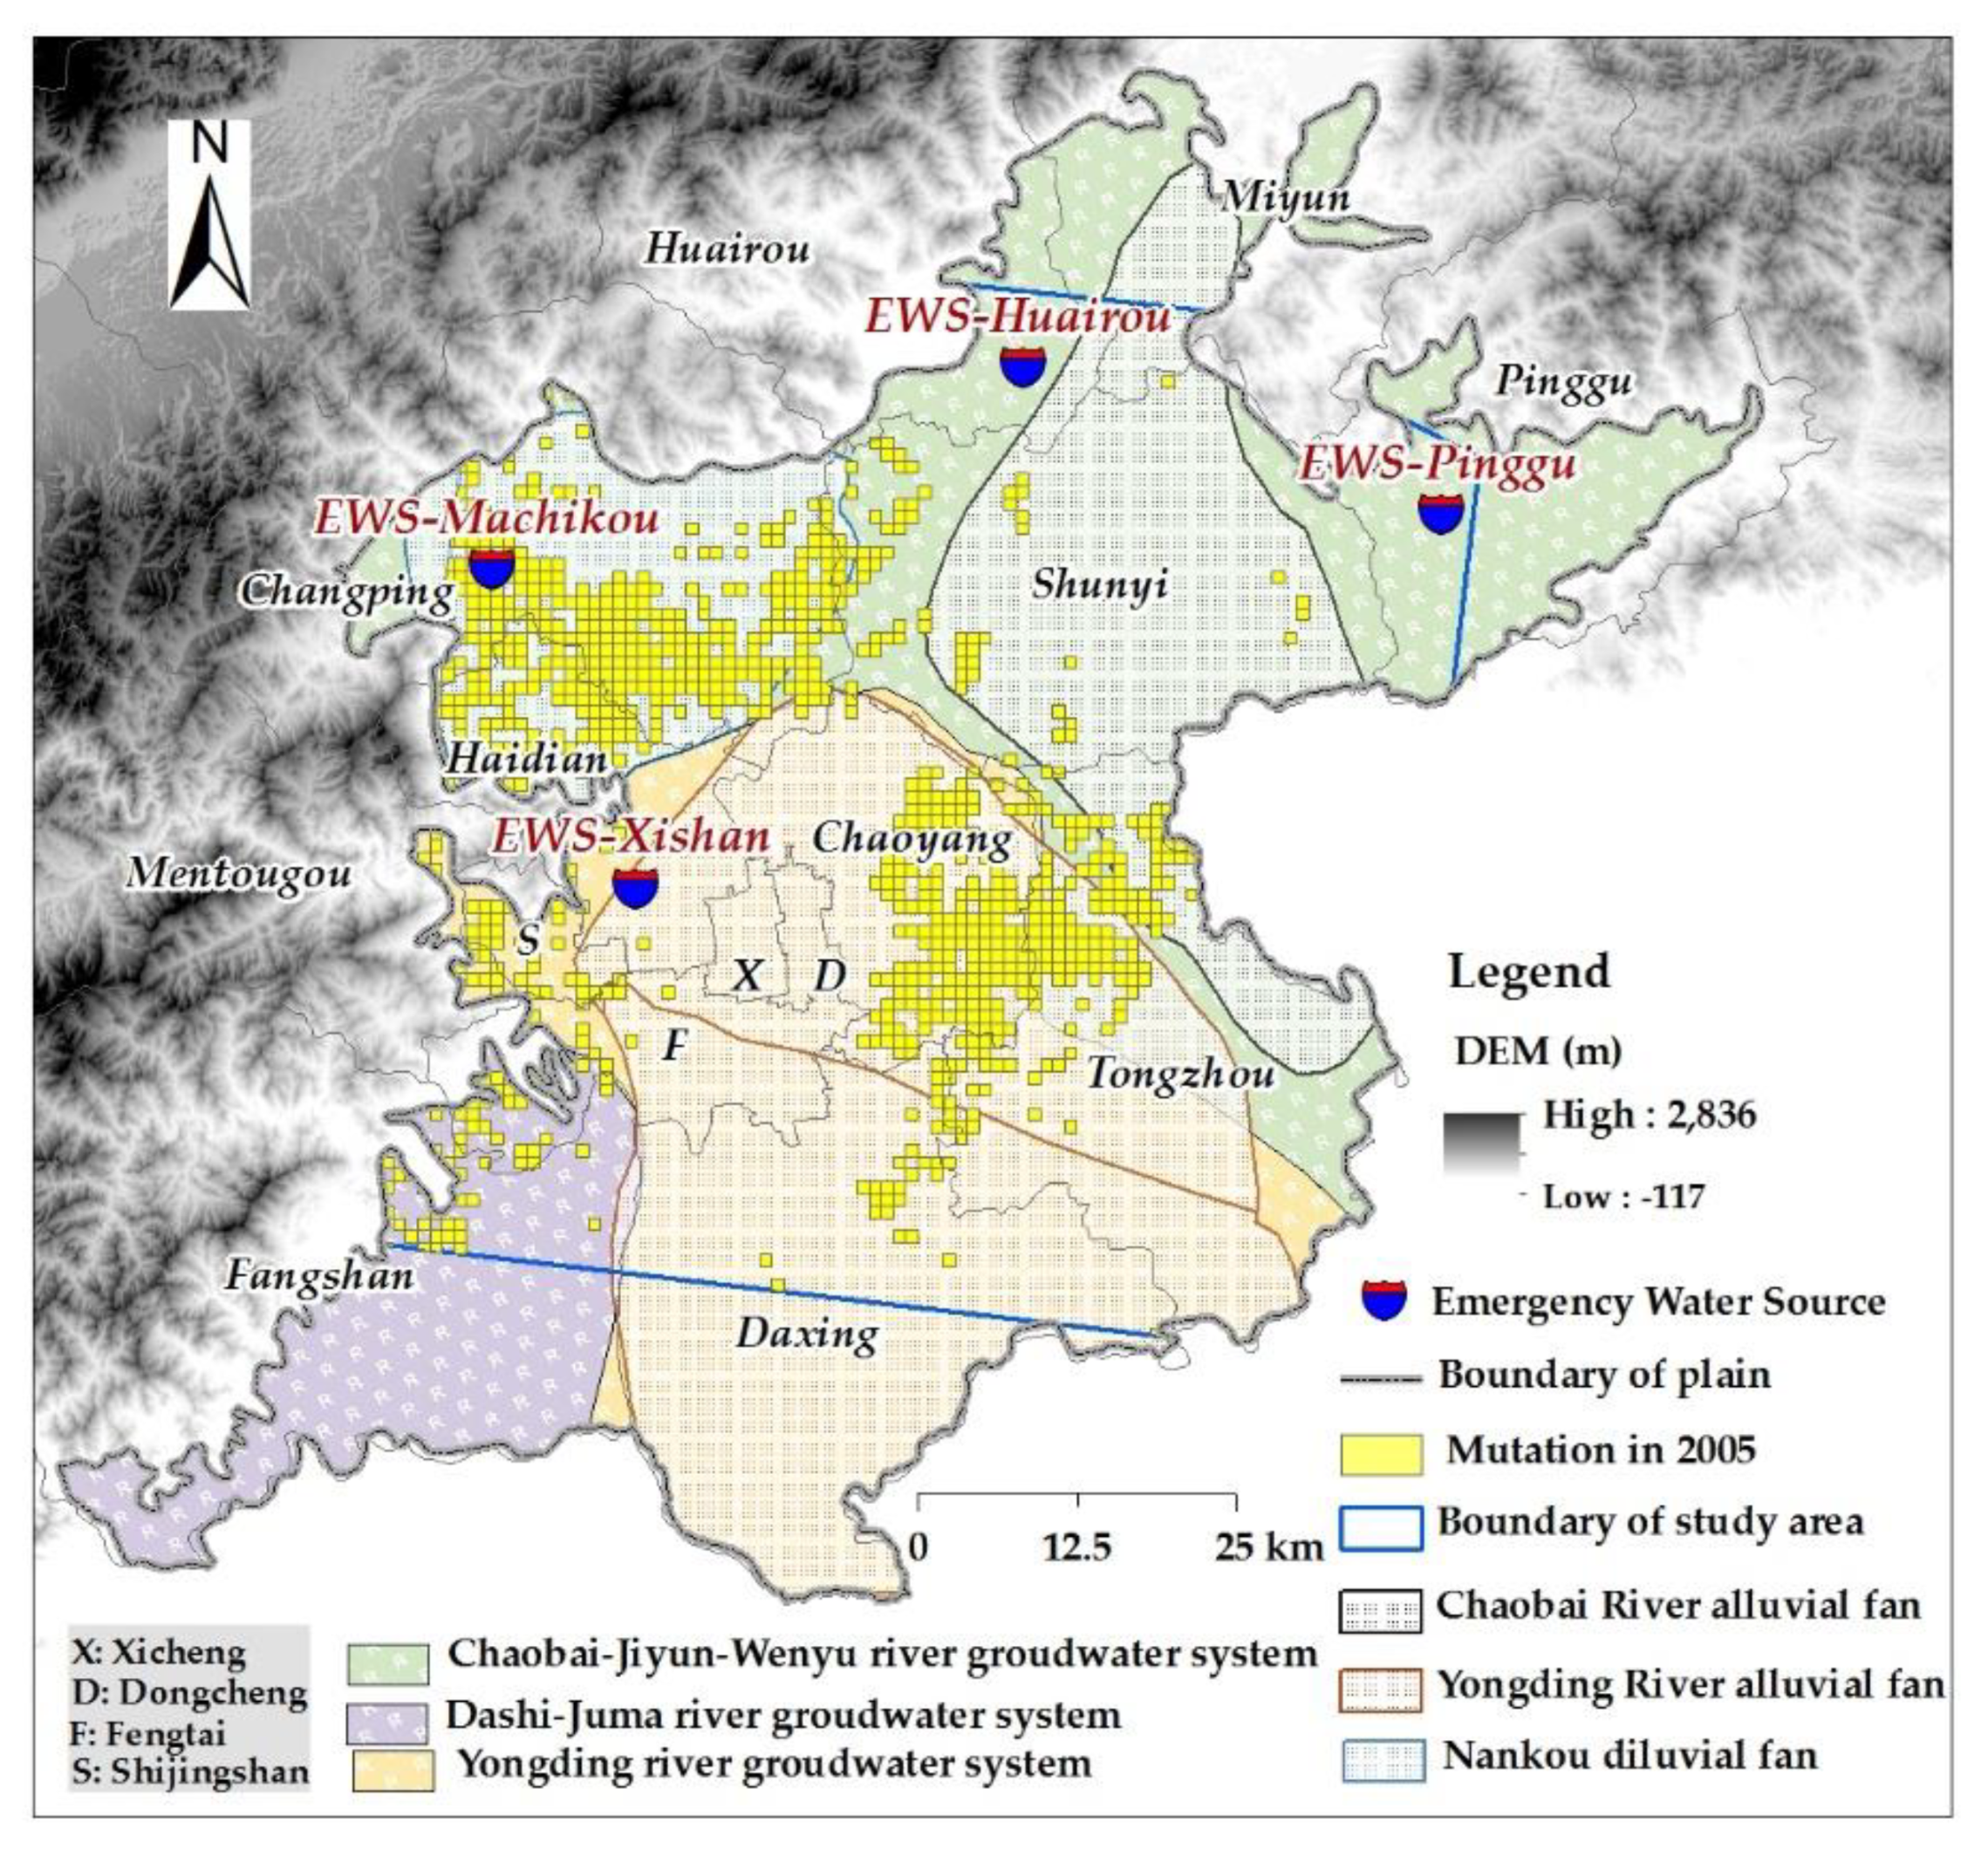
Figure 8 shows that single mutations occurred in 2005 in land subsidence, mostly in the upper and middle parts of the Yongding River alluvial fan, the Nankou alluvial fan, and the lower part of the Chaobai River alluvial fan. From the perspective of the district, most of these sites were located in south-eastern Haidian, south-eastern Changping, south-eastern Chaoyang, and north-eastern Tongzhou. With respect to the alluvial-diluvial fan of the Yongding River corresponding to the grid location, the reasons for the sudden change in 2005 may be as follows. First, the Xishan emergency water source area was built in 2005 in the area of groundwater exploitation. Quaternary groundwater is contained in the mining target layer of the emergency water source, which is located in the upper part of the alluvial fan of the Yongding River. This region is mainly composed of a single layer of sand and gravel with good permeability. A sudden increase in groundwater exploitation will lead to a sudden drop of the groundwater level, which may cause a sudden change in the corresponding grid land subsidence. In addition, according to the Water Resources Bulletin, the amount of precipitation of the Yongding River was the lowest, at only 386 mm. This result shows that the groundwater system of the Yongding River has little recharge, which may be one of the reasons for the sudden change in the land subsidence of the alluvial fan of the Yongding River in 2005.
The reason for the sudden change in the land subsidence in the Nankou alluvial fan in 2005 is that, on the one hand, the Wenyu River groundwater system (where the Nankou alluvial fan is located) and the Chaobai River groundwater system belong to a subsystem of the same groundwater system, which has certain boundaries and hydraulic connections. However, the Huairou emergency water source, which is located at the top of the Chaobai River groundwater system, started operating in August 2003. After a period of operation, the water source will destroy the balance of the groundwater system, and the nearby Wenyu River groundwater system will supply it, which may have led to the sudden change at the southern mouth diluvial fan area at the lower part in 2005. Second, in terms of groundwater recharge, from the perspective of precipitation, the depositional particles in the Nankou diluvial fan area were relatively larger and they had better permeability, and the groundwater level greatly fluctuated under the influence of precipitation. The average annual precipitation in Beijing was 468 millimetres in 2005, which was 13% less than that of the same period in 2004. From the regional distribution of precipitation, the precipitation in mountainous areas was greater than that in the plain areas, and the former mountainous areas in the north-western and south-western regions received increased amounts of precipitation. Part of the rainstorm centre was located in Nankou district. This result shows that, in 2005, the region not only supplied less water, but also supplied water less effectively. For a small portion of the grid in the lower part of the alluvial-diluvial fan of the Chaobai River, there may have been very little precipitation in that year. On the other hand, it is possible that water was released from the Huairou emergency water source in the upper part of the area (the water source was officially operated at the end of 2003) and from the Pinggu water source (the water source started operation in August 2004), and the exploitation of the emergency water sources will cause the rapid decline in nearby groundwater levels. Thus, the direction of the recharge-runoff-discharge of the groundwater system changes, which indirectly affects the groundwater level in the lower part of the alluvial fan. In summary, the reason for the mutation in land subsidence in 2005 may have been the increase in groundwater exploitation and the small amount of effective precipitation replenishment.
The 152 grids where land subsidence changed abruptly in 2013 were mainly distributed in the Chaobai River alluvial fan (as shown in Figure 9). In the administrative area, they are mainly distributed in the Tongzhou district. The reason is that, in September 2012, the Beijing municipal government announced the selection of Tongzhou district as a new city deputy centre. After 2013, Tongzhou rapidly developed. Second, the Tongzhou area became dramatically “higher” and “larger”. However, the increasing number of buildings and the growth in height constituted a single cause of Beijing’s land subsidence. Third, after 2013, the density of both roads and subways in the Tongzhou area dramatically increased. In summary, the above three reasons may explain the sudden change in land subsidence in some areas of Tongzhou in 2013.

5.2. Analysis of Grids with Multiple Land Subsidence Mutation Years

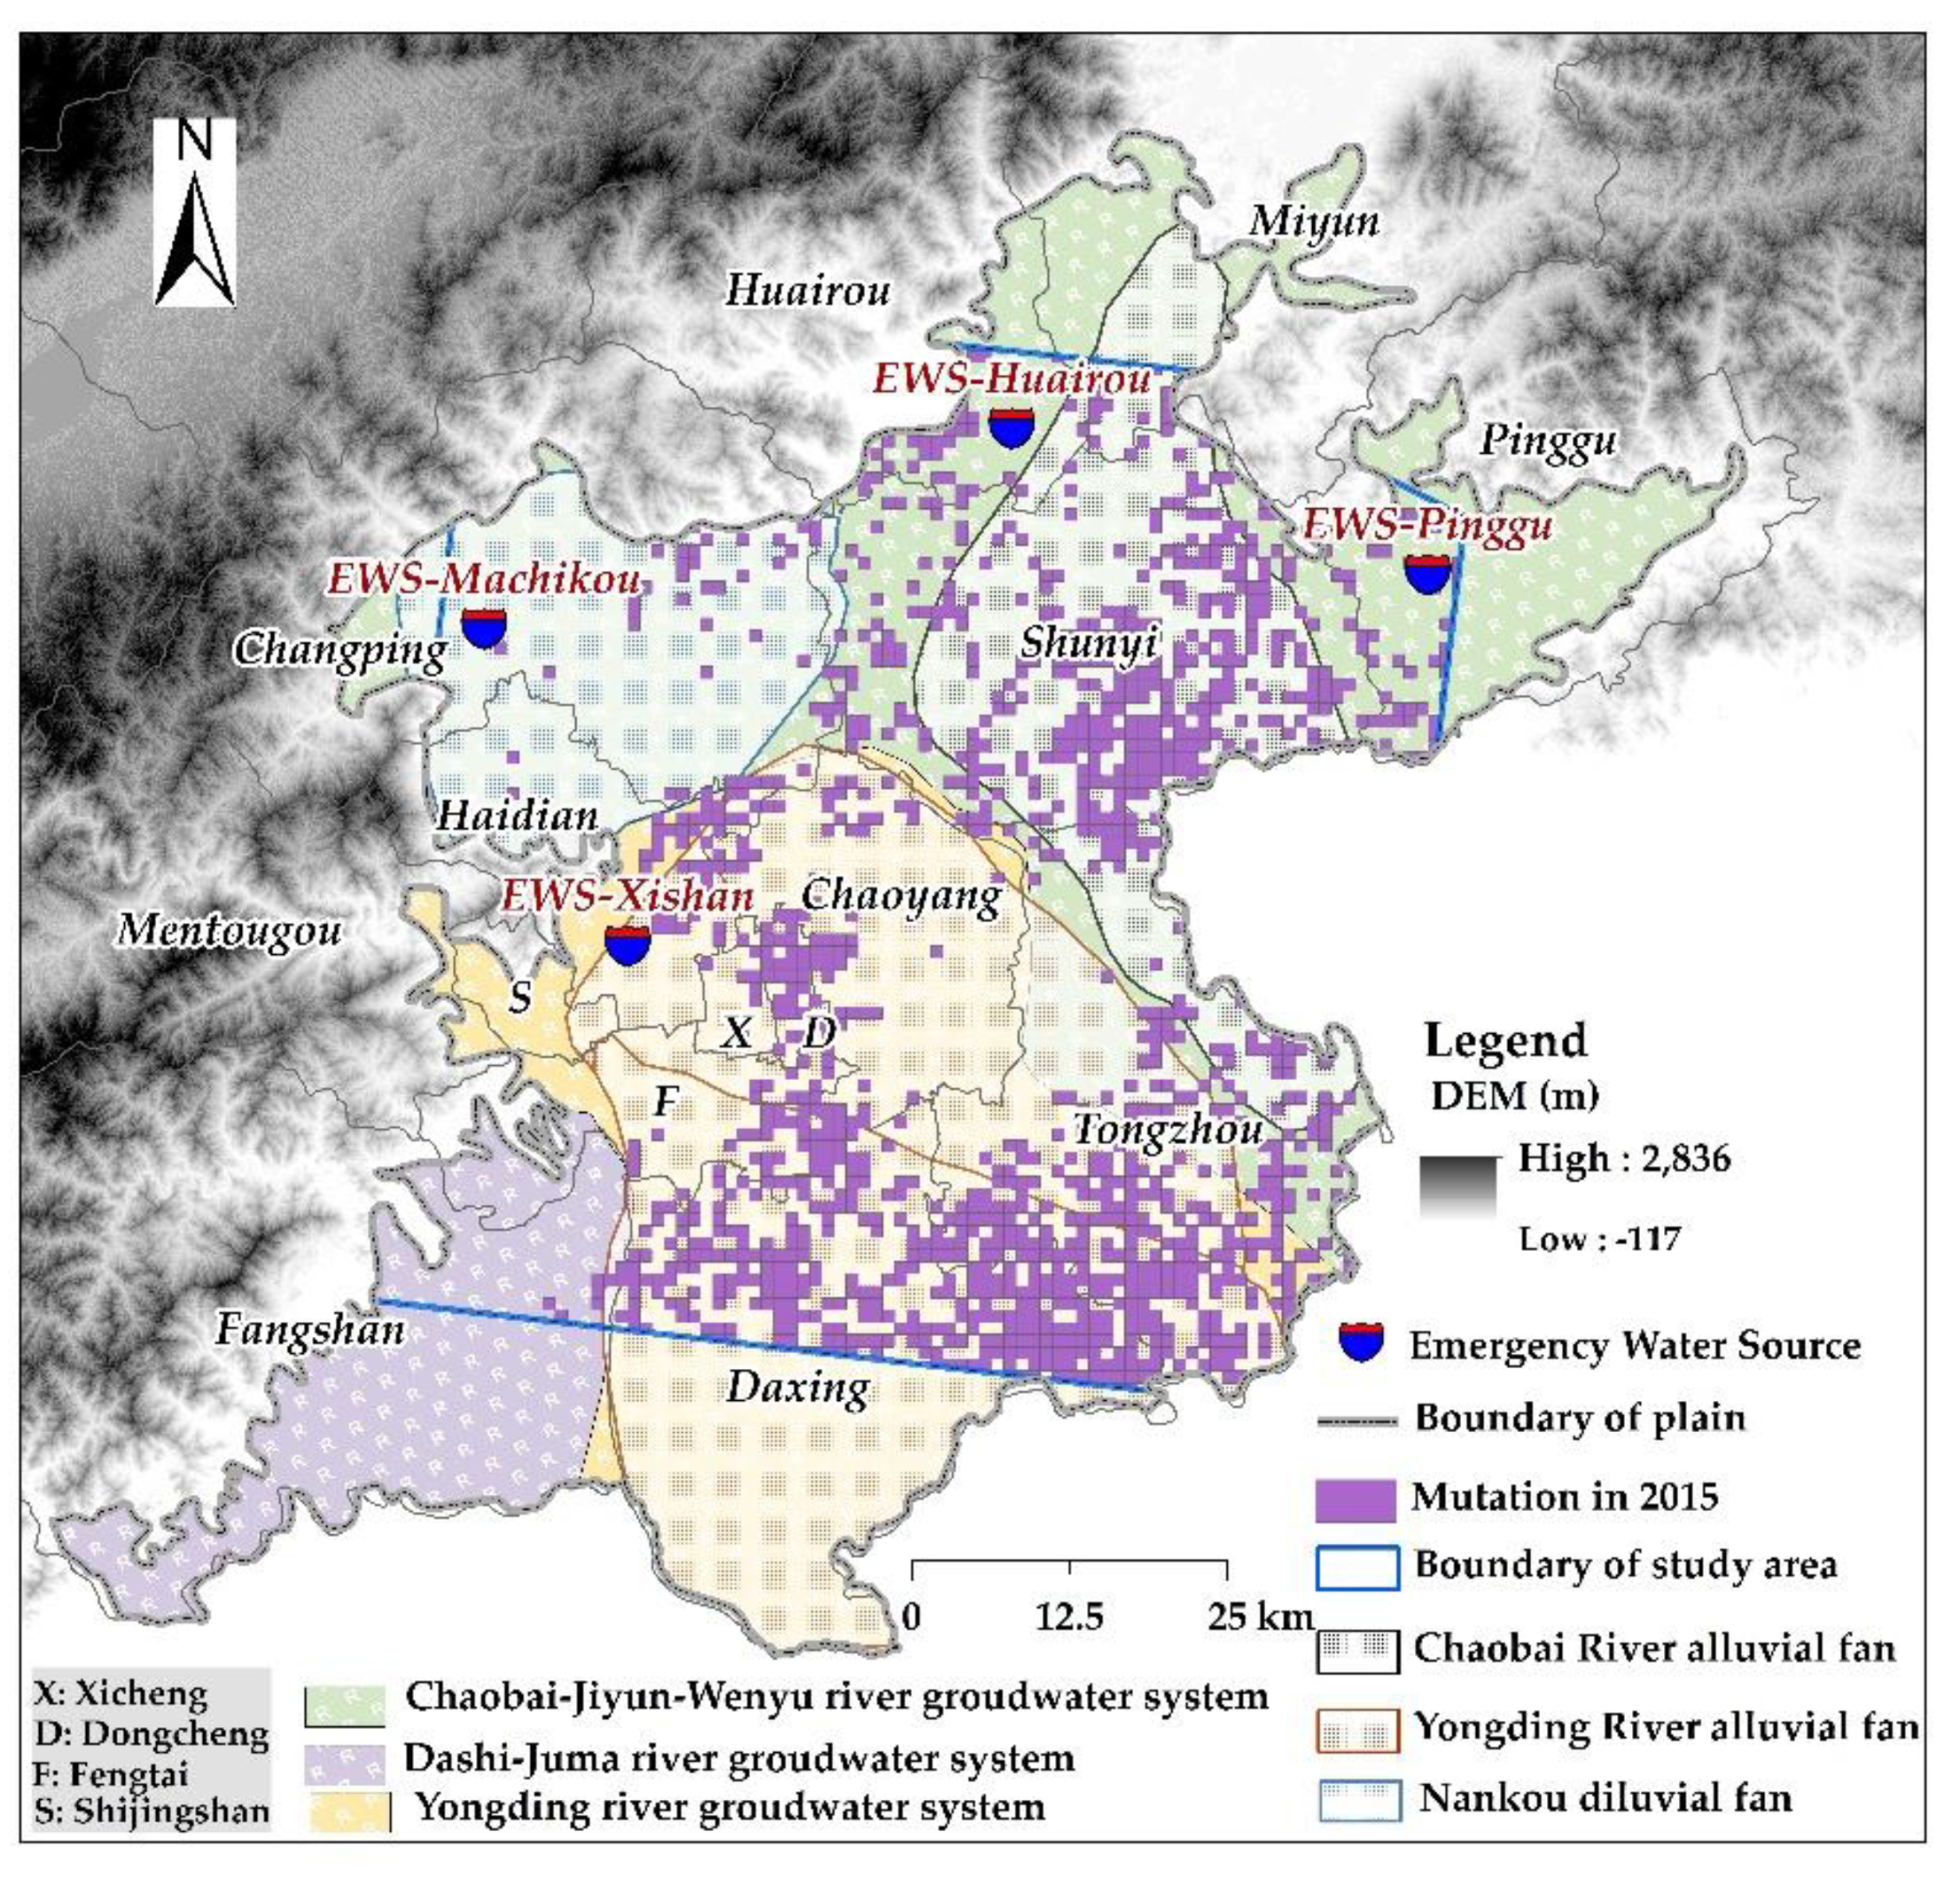
The 1048 grids with multiple mutation years were mainly distributed at the top of the alluvial fan, the boundary of the groundwater system, and the edge of the groundwater funnel. The largest number of grids containing mutations in 2015 was 768, followed by 152 grids that contained mutations in 2005. The grids that contained multiple mutations in years that included 2015 were mainly distributed at the top of the Chaobai River alluvial fan, near the Pinggu emergency water source, at the top of the Yongding River alluvial fan and at the bottom of the Chaobai River alluvial fan (as shown in Figure 10).
In terms of the administrative area, the sites were mainly distributed in southern Huairou, northern Shunyi, south-west Pinggu, and eastern Tongzhou. The reasons may be as follows. First, after the water diversion project of the south-to-north water transfer project at the end of 2014, the underground water was reduced in many places, such as the Huairou emergency source, Chaobai River greening water source well, and Pinggu emergency water source. The “southern water” was used to recharge groundwater in well-penetrated areas (such as in the Huairou emergency water source and Pinggu emergency water source area), and the relevant departments have completed the replacement of several self-providing wells, which not only reduces the amount of groundwater exploitation and optimizes the groundwater exploitation layout, but also effectively recharges and conserves the groundwater system. Second, the precipitation in this region was higher in 2015 than in the past 10 years, and the groundwater recharge was relatively sufficient. Third, the Beijing government has taken a series of measures to save water and strengthen the use of reclaimed water, which indirectly protects groundwater resources.
Among the grids with multiple mutations (including one during 2015), the number with simultaneous mutations was the highest in 2013 and 2015, at 238 (as shown in Figure 11). The spatial distribution almost completely encompassed the upper and middle parts of the alluvial-diluvial fan of the Chaobai River. From the perspective of administrative regions, most of the sites were distributed in the south-western region of Huairou, the southern region of Miyun, the western region of Pinggu, and Tongzhou district. The reason for the sudden change in 2013 may be the long-term overexploitation of emergency water sources, which led to the imbalance of the groundwater system.
Subsequently, there were 153 grids with multiple mutations in 2013–2015, and these grids were mainly distributed in the Tongzhou area. The reason may be that, after September 2012, Tongzhou was selected as the city deputy centre of Beijing. From 2013 to 2015, the Tongzhou area continuously expanded, the demand for water resources increased, and its dynamic and static load density increased. These reasons may explain the great change in land subsidence in Tongzhou during this period. The number of grids with multiple-year mutations in other years is very small; thus, they were not further analysed.

6. Conclusions

This study used InSAR technology to obtain the land subsidence rate of the Beijing Plain from 2004 to 2015, and its accuracy was verified. The Fishnet tool was used to divide the research area into different scales via the ArcGIS platform, and the unit of 960 m × 960 m was selected as the optimal research scale. The subsidence rate of each grid was then obtained from 2004 to 2015 by the use of spatial analysis technology. Via Python, the Mann–Kendall test was carried out for each grid, and the settlement mutations were obtained for the Beijing Plain. The reasons for the mutations were analysed, and the following conclusions were obtained.
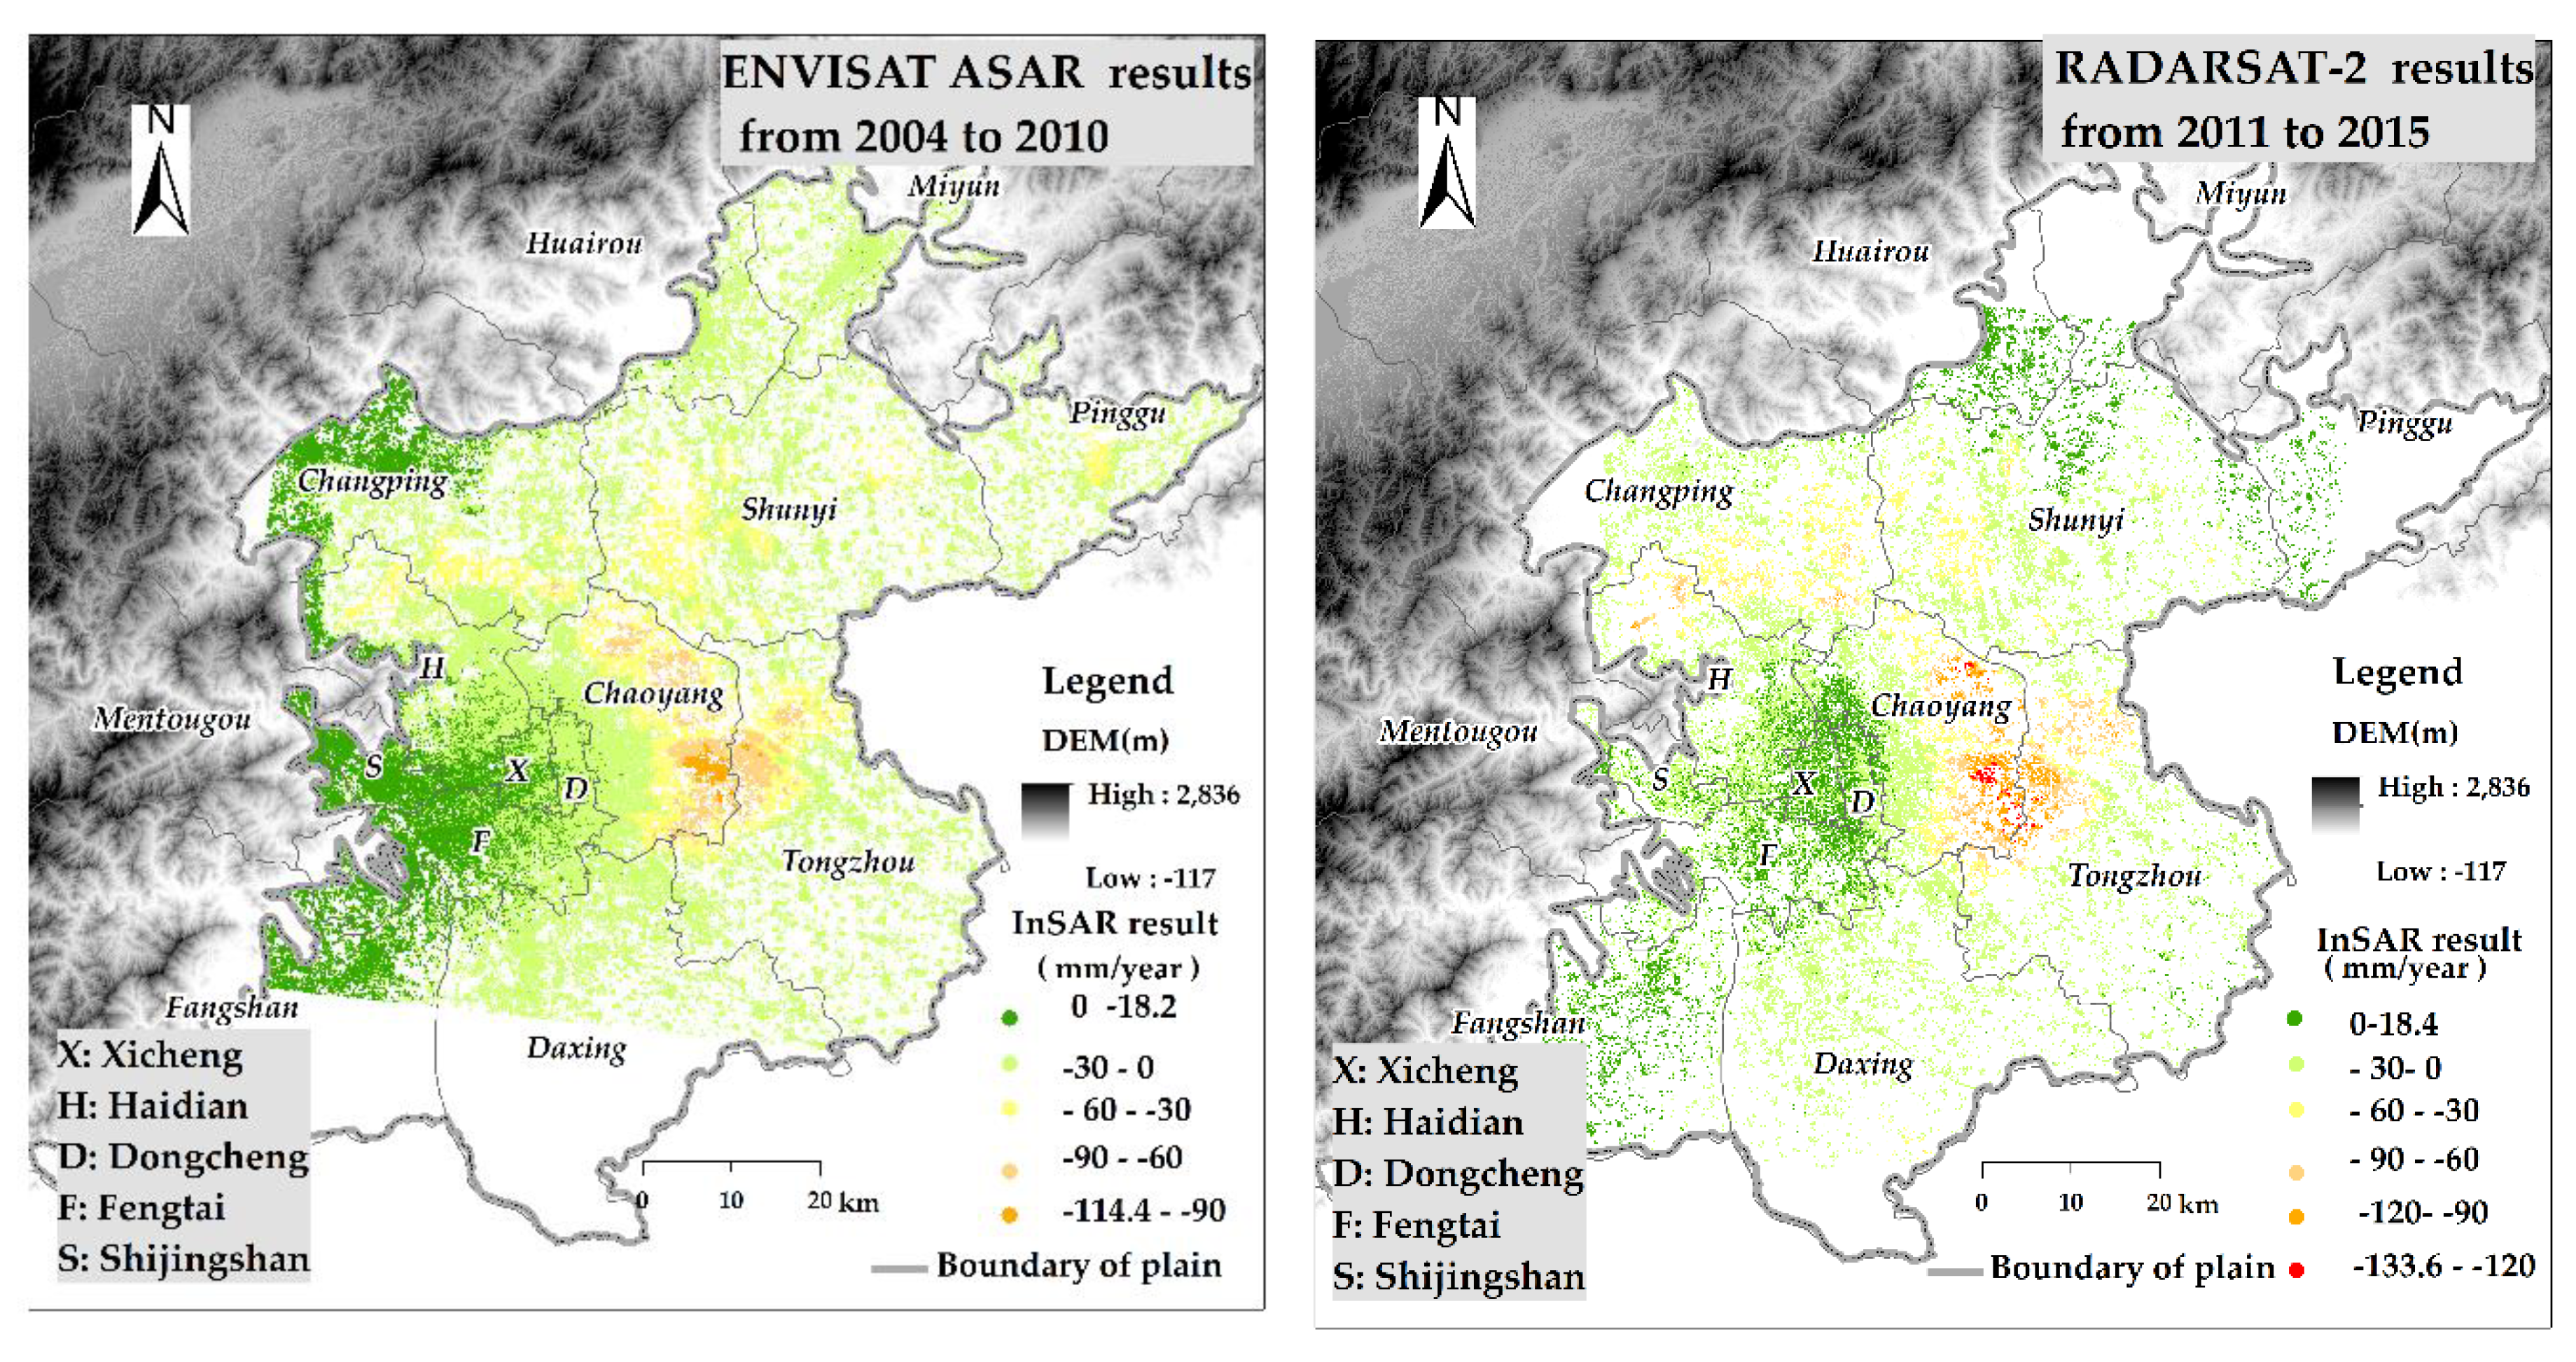
(1) From 2004 to 2010, the maximal settlement rate in the study area was −134 mm/year, and from 2010 to 2015, the maximal settlement rate was −141 mm/year. By the end of 2015, the cumulative settlement of the Beijing Plain area exceeded 300 mm and the area reached 1271 square kilometres, which accounted for approximately 20% of the total area of the Beijing Plain.
(2) There are two kinds of land subsidence mutation grids: single-year mutation grids and multiple-year mutation grids. Among them, the number of single-year grid changes was 2744, and they were mainly distributed in the middle and lower parts of the alluvial-diluvial fans of the Yongding River and Chaobai River. The number of multiple-year grid mutations was 1048, and they were mainly distributed in the middle and upper parts of the alluvial fan, near the emergency water source, and at the edge of the underground water funnel.
(3) Among the 4887 grids with ground settlement information from 2004 to 2015, 3792 grids passed the significance test. Among them, the number of grids containing settlement mutations in 2015 was the highest, reaching as high as 2112 grids, and accounting for 56% of the number of grids; this value was followed by 995 grids that contained mutations in 2005, which accounted for 27% of the grid number.
(4) The grids that contained mutations in 2015 were mainly distributed in the middle and lower parts of the alluvial-diluvial fans of the Chaobai River and Yongding River. The main reason may be that, after the “southern water” entered Beijing at the end of 2014, the amount of underground water was reduced, and the relevant departments carried out underground water recharges; thus, a large number of self-providing wells were replaced, and the distribution of underground water exploitation was optimized. In addition, the effective precipitation amount on the Beijing Plain was relatively large in 2015. Most of the grids underwent mutations in 2015, which also confirmed that the “southern water” entering Beijing had a certain role in alleviating land subsidence in Beijing.
(5) It cannot be ignored that, in 2013, the number of mutations in the single-year land subsidence grids was 152, while in 2013–2015, the number of sudden changes was 153, and they were mainly distributed in Tongzhou. The main reason for this difference may be that. after Tongzhou was selected as the sub-centre of Beijing in September 2012, the rapid development of Tongzhou in a short period was one of the main causes of the sudden change in land subsidence during 2013–2015. This phenomenon further supports that the density of dynamic loads and static loads sharply increased, which was one of the reasons for the uneven land subsidence on the Beijing Plain.
Finally, it should be added that, to some extent, the “southern water” in Beijing mitigates the trend of the rapid development of Beijing land subsidence, but the land subsidence phenomenon in Beijing is still not negligible. In our next steps, we will use additional multi-source SAR and GRACE data [42], optimize the algorithm, adopt different software platforms, improve the monitoring density and accuracy of land subsidence in Beijing, and analyse its evolutionary mode from different perspectives. Moreover, we will thoroughly combine the hydrogeological data, basic geological conditions, and geophysical exploration technologies; combine different mathematical methods; and, adopt interdisciplinary methods to further analyse the causal mechanisms of the formation of land subsidence on the Beijing Plain.

Author Contributions

L.G. performed the experiments, analysed the data and wrote the paper. H.G., L.Z. and Z.Z. provided crucial guidance and support throughout the research. F.Z., C.Z. and M.G. contributed significantly to the validation work and data interpretation. Y.S. made important suggestions on the data processing.

Funding

This work was supported by the National Natural Science Foundation of China (grant numbers D0107/41130744, D0107/4177010971, D0107/41171335 and D0106/41501380) and the National Basic Research Program of China (973 Program) (grant number 2012CB723403).

Acknowledgments

We thank both the European Space Agency (ESA) and the Canadian Space Agency for their great efforts in developing and distributing the remotely sensed SAR data. We also thank the China Geological Survey (CGS) for the levelling data released to the public. We also thank the National Aeronautics and Space Administration (NASA) for making the SRTM DEM data available. We also thank the creators of the Python computer language and ArcGIS software. Moreover, the provision of the DORIS/SARPROZ and StaMPS/QPS for data processing is gratefully acknowledged.

Conflicts of Interest

The authors declare that they have no conflicts of interest.

References

  1. Chaussard, E.; Wdowinski, S.; Cabral-Cano, E.; Amelung, F. Land subsidence in central Mexico detected by ALOS InSAR time-series. Remote Sens. Environ. 2014, 140, 94–106. [Google Scholar] [CrossRef]
  2. Gong, H.; Yun, P.; Zheng, L.; Li, X.; Lin, Z.; Chong, Z.; Huang, Z.; Li, Z.; Wang, H.; Zhou, C. Long-term groundwater storage changes and land subsidence development in the North China Plain (1971–2015). Hydrogeol. J. 2018, 26, 1417–1427. [Google Scholar] [CrossRef] [Green Version]
  3. Gao, M.; Gong, H.; Chen, B.; Li, X.; Zhou, C.; Min, S.; Yuan, S.; Zheng, C.; Duan, G. Regional Land Subsidence Analysis in Eastern Beijing Plain by InSAR Time Series and Wavelet Transforms. Remote Sens. 2018, 10, 365. [Google Scholar] [CrossRef]
  4. Ng, H.M.; Ge, L.; Li, X.; Abidin, H.Z.; Andreas, H.; Zhang, K. Mapping land subsidence in Jakarta, Indonesia using persistent scatterer interferometry (PSI) technique with ALOS PALSAR. Int. J. Appl. Earth Obs. Geoinf. 2012, 18, 232–242. [Google Scholar] [CrossRef]
  5. Strozzi, T.; Caduff, R.; Wegmüller, U.; Raetzo, H.; Hauser, M. Widespread surface subsidence measured with satellite SAR interferometry in the Swiss alpine range associated with the construction of the Gotthard Base Tunnel. Remote Sens. Environ. 2017, 190, 1–12. [Google Scholar] [CrossRef]
  6. Zhang, Y.; Wu, H.A.; Kang, Y.; Zhu, C. Ground Subsidence in the Beijing-Tianjin-Hebei Region from 1992 to 2014 Revealed by Multiple SAR Stacks. Remote Sens. 2016, 8, 675. [Google Scholar] [CrossRef]
  7. Castellazzi, P.; Arroyodomínguez, N.; Martel, R.; Calderhead, A.I.; Normand, J.C.L.; Gárfias, J.; Rivera, A. Land subsidence in major cities of Central Mexico: Interpreting InSAR-derived land subsidence mapping with hydrogeological data. Int. J. Appl. Earth Obs. Geoinf. 2016, 47, 102–111. [Google Scholar] [CrossRef]
  8. Albano, M.; Polcari, M.; Bignami, C.; Moro, M.; Saroli, M.; Stramondo, S. An innovative procedure for monitoring the change in soil seismic response by InSAR data: Application to the Mexico City subsidence. Int. J. Appl. Earth Obs. Geoinf. 2016, 53, 146–158. [Google Scholar] [CrossRef]
  9. Amighpey, M.; Arabi, S. Studying land subsidence in Yazd province, Iran, by integration of InSAR and levelling measurements. Remote Sens. Appl. Soc. Environ. 2016, 4, 1–8. [Google Scholar] [CrossRef]
  10. Dehghani, M.; Zoej, M.J.V.; Hooper, A.; Hanssen, R.F.; Entezam, I.; Saatchi, S. Hybrid conventional and Persistent Scatterer SAR interferometry for land subsidence monitoring in the Tehran Basin, Iran. Isprs J. Photogramm. Remote Sens. 2013, 79, 157–170. [Google Scholar] [CrossRef]
  11. Ge, L.; Ng, H.M.; Li, X.; Abidin, H.Z.; Gumilar, I. Land subsidence characteristics of Bandung Basin as revealed by ENVISAT ASAR and ALOS PALSAR interferometry. Remote Sens. Environ. 2014, 154, 46–60. [Google Scholar] [CrossRef]
  12. Da Lio, C.; Tosi, L. Land subsidence in the Friuli Venezia Giulia coastal plain, Italy: 1992–2010 results from SAR-based interferometry. Sci. Total Environ. 2018, 633, 752–764. [Google Scholar] [CrossRef] [PubMed]
  13. Solari, L.; Del Soldato, M.; Bianchini, S.; Ciampalini, A.; Ezquerro, P.; Montalti, R.; Raspini, F.; Moretti, S. From ERS 1/2 to Sentinel-1: Subsidence monitoring in Italy in the last two decades. Front. Earth Sci. 2018, 6, 149. [Google Scholar] [CrossRef]
  14. Liu, P.; Li, Q.; Li, Z.; Hoey, T.; Liu, Y.; Wang, C. Land Subsidence over Oilfields in the Yellow River Delta. Remote Sens. 2015, 7, 1540–1564. [Google Scholar] [CrossRef] [Green Version]
  15. Xue, Y.Q.; Yun, Z.; Ye, S.J.; Wu, J.C.; Li, Q.F. Land subsidence in China. Environ. Geol. 2005, 48, 713–720. [Google Scholar] [CrossRef]
  16. Ye, S.; Xue, Y.; Wu, J.; Yan, X.; Yu, J. Progression and mitigation of land subsidence in China. Hydrogeol. J. 2015, 24, 1–9. [Google Scholar] [CrossRef]
  17. Yin, J.; Yu, D.; Wilby, R. Modelling the impact of land subsidence on urban pluvial flooding: A case study of downtown Shanghai, China. Sci. Total Environ. 2016, 544, 744–753. [Google Scholar] [CrossRef] [Green Version]
  18. Zhang, Y.; Xue, Y.Q.; Wu, J.C.; Ye, S.J.; Wei, Z.X.; Li, Q.F.; Yu, J. Characteristics of aquifer system deformation in the Southern Yangtse Delta, China. Eng. Geol. 2007, 90, 160–173. [Google Scholar] [CrossRef]
  19. Lin, Z.; Gong, H.; Li, X.; Rong, W.; Chen, B.; Dai, Z.; Teatini, P. Land subsidence due to groundwater withdrawal in the northern Beijing plain, China. Eng. Geol. 2015, 193, 243–255. [Google Scholar]
  20. Ferretti, A.; Prati, C.; Rocca, F. Nonlinear subsidence rate estimation using permanent scatterers in differential SAR interferometry. IEEE Trans. Geosci. Remote Sens. 2000, 38, 2202–2212. [Google Scholar] [CrossRef]
  21. Berardino, P.; Fornaro, G.; Lanari, R.; Sansosti, E. A new algorithm for surface deformation monitoring based on small baseline differential SAR interferograms. IEEE Trans. Geosci. Remote Sens. 2002, 40, 2375–2383. [Google Scholar] [CrossRef]
  22. Lanari, R.; Mora, O.; Manunta, M.; Mallorquí, J.J.; Berardino, P.; Sansosti, E. A small-baseline approach for investigating deformations on full-resolution differential SAR interferograms. IEEE Trans. Geosci. Remote Sens. 2004, 42, 1377–1386. [Google Scholar] [CrossRef]
  23. Qu, F.; Zhang, Q.; Lu, Z.; Zhao, C.; Yang, C.; Zhang, J. Land subsidence and ground fissures in Xi’an, China 2005–2012 revealed by multi-band InSAR time-series analysis. Remote Sens. Environ. 2014, 155, 366–376. [Google Scholar] [CrossRef]
  24. Shviro, M.; Haviv, I.; Baer, G. High-resolution InSAR constraints on flood-related subsidence and evaporite dissolution along the Dead Sea shores: Interplay between hydrology and rheology. Geomorphology 2017, 293, 53–68. [Google Scholar] [CrossRef]
  25. Zhao, C.; Liu, C.; Zhang, Q.; Lu, Z.; Yang, C. Deformation of Linfen-Yuncheng Basin (China) and its mechanisms revealed by Π-RATE InSAR technique. Remote Sens. Environ. 2018, 218, 221–230. [Google Scholar] [CrossRef]
  26. Gong, H.; Pan, Y.; Xu, Y. Spatio-temporal variation of groundwater recharge in response to variability in precipitation, land use and soil in Yanqing Basin, Beijing, China. Hydrogeol. J. 2012, 20, 1331–1340. [Google Scholar] [CrossRef]
  27. Chen, B.; Gong, H.; Li, X.; Lei, K.; Zhu, L.; Gao, M.; Zhou, C. Characterization and causes of land subsidence in Beijing, China. Int. J. Remote Sens. 2017, 38, 808–826. [Google Scholar] [CrossRef]
  28. Zhou, C.; Gong, H.; Chen, B.; Zhu, F.; Duan, G.; Gao, M.; Lu, W. Land subsidence under different land use in the eastern Beijing plain, China 2005–2013 revealed by InSAR timeseries analysis. GISci. Remote Sens. 2016, 53, 671–688. [Google Scholar] [CrossRef]
  29. Zhou, C.; Gong, H.; Chen, B.; Li, J.; Gao, M.; Zhu, F.; Chen, W.; Liang, Y. InSAR time-series analysis of land subsidence under different land use types in the Eastern Beijing Plain, China. Remote Sens. 2017, 9, 380. [Google Scholar] [CrossRef]
  30. Gong, H.; Zhang, Y.; Li, X.; Lu, X.; Chen, B.; Gu, Z. Land subsidence research in Beijing based on the Permanent Scatterers InSAR technology. Prog. Nat. Sci 2009, 19, 1261–1266. [Google Scholar]
  31. Chen, B.; Gong, H.; Li, X.; Lei, K.; Gao, M.; Zhou, C.; Ke, Y. Spatial–temporal evolution patterns of land subsidence with different situation of space utilization. Nat. Hazards 2015, 77, 1765–1783. [Google Scholar] [CrossRef]
  32. Chen, M.; Tomás, R.; Li, Z.; Motagh, M.; Li, T.; Hu, L.; Gong, H.; Li, X.; Yu, J.; Gong, X. Imaging land subsidence induced by groundwater extraction in Beijing (China) using satellite radar interferometry. Remote Sens. 2016, 8, 468. [Google Scholar] [CrossRef]
  33. Chen, W.F.; Gong, H.L.; Chen, B.B.; Liu, K.S.; Gao, M.; Zhou, C.F. Spatiotemporal evolution of land subsidence around a subway using InSAR time-series and the entropy method. Mapp. Sci. Remote Sens. 2017, 54, 78–94. [Google Scholar] [CrossRef]
  34. Zhou, C.; Gong, H.; Zhang, Y.; Warner, T.A.; Wang, C. Spatiotemporal Evolution of Land Subsidence in the Beijing Plain 2003–2015 Using Persistent Scatterer Interferometry (PSI) with Multi-Source SAR Data. Remote Sens. 2018, 10, 552. [Google Scholar] [CrossRef]
  35. Yang, Q.; Ke, Y.; Zhang, D.; Chen, B.; Gong, H.; Lv, M.; Zhu, L.; Li, X. Multi-Scale Analysis of the Relationship between Land Subsidence and Buildings: A Case Study in an Eastern Beijing Urban Area Using the PS-InSAR Technique. Remote Sens. 2018, 10, 1006. [Google Scholar] [CrossRef]
  36. Chen, B.; Gong, H.; Lei, K.; Li, J.; Zhou, C.; Gao, M.; Guan, H.; Lv, W. Land subsidence lagging quantification in the main exploration aquifer layers in Beijing plain, China. Int. J. Appl. Earth Obs. Geoinf. 2019, 75, 54–67. [Google Scholar] [CrossRef]
  37. Danneberg, J. Changes in runoff time series in Thuringia, Germany–Mann-Kendall trend test and extreme value analysis. Adv. Geosci. 2012, 31, 49–56. [Google Scholar] [CrossRef]
  38. Ding, Y.; Wang, Z.; Sun, Y. Inter-decadal variation of the summer precipitation in East China and its association with decreasing Asian summer monsoon. Part I: Observed evidences. Int. J. Climatol. 2008, 28, 1139–1161. [Google Scholar] [CrossRef]
  39. Kahya, E.; Kalaycı, S. Trend analysis of streamflow in Turkey. J. Hydrol. 2004, 289, 128–144. [Google Scholar] [CrossRef]
  40. Hamed, K.H.; Rao, A.R. A modified Mann-Kendall trend test for autocorrelated data. J. Hydrol. 1998, 204, 182–196. [Google Scholar] [CrossRef]
  41. Luo, Y.; Hu, R.; Ye, C.; Lei, K.; Tian, F.; Cui, W. The study of preliminary division of land subsidence units. J. Eng. Geol. 2017, 25, 95–106. [Google Scholar]
  42. Pan, Y.; Zhang, C.; Gong, H.; Yeh, P.J.F.; Shen, Y.; Guo, Y.; Huang, Z.; Li, X. Detection of human-induced evapotranspiration using GRACE satellite observations in the Haihe River basin of China. Geophys. Res. Lett. 2017, 44, 190–199. [Google Scholar] [CrossRef]
Figure 1. The location of the study area. (a) shows the location of Beijing. (b) shows the range of the Beijing Plain. The red line represents the range of ENVISAT ASAR, and the black line represents the range of RADARSAT-2. (c) shows the geography of the study area. The brown line represents the approximate fracture distribution of Beijing, and the dark red line represents the location of the hydrogeological profile.
Remotesensing 11 01170 g001
Figure 2. Hydrogeological profiles.
Remotesensing 11 01170 g002
Figure 3. Map of the average land subsidence rate on the Beijing Plain. The (left figure) shows the average rate from 2004 to 2010 via ENVISAT ASAR, and the (right figure) shows the average rate from 2011 to 2015 via RADARSAT-2.
Remotesensing 11 01170 g003
Figure 4. Validation map of land subsidence on the Beijing Plain. The dark red line represents the land subsidence contour of the levelling survey in 2007, and the “+” symbol represents the positions of the benchmarks used for validation.
Remotesensing 11 01170 g004
Figure 5. Comparison of Interferometric Synthetic Aperture Radar (InSAR)-derived displacement rates and levelling benchmark rates from 2006–2013. (a) shows the validation from 2006 to 2010, (b) shows the validation from 2011 to 2013, and Figure (c,d) shows the comparison of benchmarks with PS points from 2006–2013.
Remotesensing 11 01170 g005
Figure 6. Land subsidence mutation information results on the Beijing Plain from 2004 to 2015. The dark blue line represents the 2001 groundwater funnel, the grey line represents the boundary of the Beijing Plain, the white plane indicates that there was no continuous land subsidence from 2004 to 2015, the grey slanted line areas indicate the grids that did not pass the significance test of 0.05, and the blue slanted line areas represent the grids in which multiple mutations were distributed. Other monochromatic symbols represent grids with a single year of mutation information.
Remotesensing 11 01170 g006
Figure 7. Spatial distribution of single-mutation grids in 2015. The blue-red dots represent the emergency water sources in the study area, the purple grids indicate the locations where the land subsidence rate was abrupt only in 2015, and the area of the brown dot pattern represents the Yongding River alluvial fan range. The area of the black point pattern represents the range of the Chaobai River alluvial fan.
Remotesensing 11 01170 g007
Figure 8. Spatial distribution of single-mutation grids in 2005. The yellow grids represent the locations where the land subsidence rate mutated only in 2005.
Remotesensing 11 01170 g008
Figure 9. Spatial distribution of single-mutation grids in 2013. The red grid represents the locations where the land subsidence rate mutated only in 2013.
Remotesensing 11 01170 g009
Figure 10. Spatial distribution of multiple-mutation grids in which mutations occurred in 2015. The blue area represents the grid locations where the land subsidence rate has mutated in more than one year (including the year 2015).
Remotesensing 11 01170 g010
Figure 11. Spatial distribution of multiple-mutation grids in which mutations occurred in 2013 and 2015. The orange fringe area represents the grid locations where the land subsidence rate has mutated from 2013 to 2015, and the green area represents the grid locations where the land subsidence rate mutated in both 2013 and 2015.
Remotesensing 11 01170 g011
Table 1. Parameters of the SAR Data Used.
ParameterENVISAT ASARRADARSAT-2
BandCC
Wavelength (cm)5.65.6
PolarizationVVVV
Orbit directionAscendingDescending
Repeat observation period (day)3524
Spatial resolution (m)3030
No. images4748
Date rangeJune 2003–October 2010November 2010–December 2015
Table 2. Points at Different Scale Grids.
Grid Size (m)Number of GridsGrids Containing PS PointsPercentage
305,384,31458140.1%
601,348,80819,0451.41%
120338,58338,13111.3%
24085,33328,76733.7%
48021,67513,58562.7%
9605575488787.7%
19201466131289.5%
384039738296.2%
768011310996.5%
15,3603535100%
Table 3. Beijing Plain Land subsidence Mutation Information.
NumberMutation YearsCountNumberMutation YearsCount
120151344182011–201320
22005915192005, 2007, 200818
32013, 2015238202010, 2012, 2013, 201518
42013–201515321200716
52013152222011, 2013, 201516
6201480232005–200815
7201272242010, 2012, 201515
82011, 201563252008, 200914
92012, 201558262005, 2006, 200913
10201055272006–200812
112011–2013, 20155128200812
1220114729200912
132012, 2014, 201540302010, 2012, 201312
14200639312013, 201412
152010, 201537322010, 2011, 201510
162005, 2008, 20093133empty1783
172005–20072034others<10
In total 5575

