Article

Estimating Dynamics of Terminal Lakes in the Second Largest Endorheic River Basin of Northwestern China from 2000 to 2017 with Landsat Imagery

1
Key Laboratory of Water Cycle and Related Land Surface Processes, Institute of Geographic Sciences and Natural Resources Research, Chinese Academy of Sciences, Beijing 100101, China
2
University of Chinese Academy of Sciences, Beijing 100049, China
*
Author to whom correspondence should be addressed.
Remote Sens. 2019, 11(10), 1164; https://doi.org/10.3390/rs11101164
Submission received: 16 March 2019 / Revised: 5 May 2019 / Accepted: 7 May 2019 / Published: 15 May 2019

Abstract

:
Quantifying terminal-lake dynamics is crucial for understanding water-ecosystem-economy relationship across endorheic river basins in arid environments. In this study, the spatio-temporal variations in terminal lakes of the lower Heihe River Basin were investigated for the first time since the Ecological Water Diversion Project commenced in 2000. The lake area and corresponding water consumption were determined with 248 Landsat images. Vital recovery of lakes occurred two years after the implementation of the project, and the total lake area increased by 382.6%, from 30.7 to 148.2 km2, during 2002–2017. East Juyan Lake (EJL) was first restored as a project target and subsequently reached a maximum area of 70.1 km2. Water dispersion was initiated in 2003, with the East river prioritized for restoration. Swan Lake in the East river enlarged to 67.7 km2 by 2017, while the other four lakes temporarily existed or maintained an area < 7 km2, such as West Juyan Lake. Water consumed by lakes increased synchronously with lake area. The average water consumption of the six lakes was 1.03 × 10⁸ m3/year, with 63% from EJL. The increasing terminal lakes; however, highlight the seasonal competition for water use between riparian vegetation and lake ecosystems in water-limited areas.

1. Introduction

Endorheic basins, which retain water and allow no outflow to other external water bodies, occupy approximately 21% of Earth’s land [1]. Northwestern China and Central Asia contain the most endorheic river basins in the world [2]. The ecosystems in the downstream areas of theses river basins are supported mainly by runoff generated from upper mountain regions because the precipitation in the downstream areas is very low [3]. The middle and lower reaches is a typical arid region with competing water requirements for human activities and natural ecosystems. Over the past decades, streamflow has been extensively reallocated for agricultural irrigation, population expansion and economic development in the upper and middle reaches of endorheic systems [4,5]. As a result, terminal lakes in mostly endorheic basins have receded or even vanished, such as the Aral Sea [6,7,8]. Terminal lakes play a vital role in desertification reduction, service provision, and diversity preservation [9,10]. The vast decline in both area and ecological condition of terminal lakes has led to efforts across the world to promote their protection or restoration [11]. River regulation by controlled water allocation has been carried out widely to restore the degraded lake ecosystems. To quantify the ecological restoration efforts, it is important to estimate the spatio-temporal dynamics of terminal lakes on the basin scale. Furthermore, a better understanding of water use of lakes is needed for better water allocation and conservation promotion in the water-deficient endorheic river basins [2,11].
Lake area (level) and lake fluctuations are commonly believed to have a great influence on the ecosystem functions of lakes [11]. Thus, lake area is often recognized as an intuitive and important indicator of lake recovery. Additionally, quantifying the changes in lake area is necessary to determine the water volume consumed by lakes. For the water-limited areas, evaporation is the predominant component of active water consumption and represents the largest component of the water balance of a lake [12,13]. Knowledge of the temporal variability in lake evaporation could facilitate the quantification of the water consumption and water demands and, thus, improve the allocation of water resources in these regions [2]. Therefore, determining lake area and lake evaporation (i.e., water consumption) is vitally important for the evaluation and improvement of water resources management in arid endorheic river basins [14,15,16].
The Heihe River is the second largest endorheic river in arid Northwestern China. It originates from the Qilian Mountains, flows through the middle irrigated farmland, and then enters the lower riparian ecosystems and Gobi Desert area [3]. Because of the large increase in water consumption in the midstream area, the discharge from this region decreased sharply between the 1950s and 1990s, which significantly reduced the water flow into the lower Heihe River Basin (HRB). Consequently, terminal lakes underwent catastrophic desiccation and triggered numerous environmental problems in the area [17]. For example, East Juyan Lake (EJL) and West Juyan Lake (WJL), the two most important terminal lakes of the HRB and renowned desert lakes with a long history in China, dried up in 1961 and 1992, respectively [18]. To rehabilitate the deteriorated ecosystem in the lower HRB, the Chinese government has conducted the Ecological Water Diversion Project (EWDP) in the HRB since 2000. The aim of the EWDP is to guarantee the delivery of a certain volume of river flow to the lower HRB from the middle reaches, and EJL is regarded as an important target of the project [19]. Therefore, many studies have been conducted on the restoration process or water consumption of EJL [19,20,21]. However, water resources management based on research on EJL may underestimate the actual water consumption by lakes, resulting in lower water use for natural vegetation in the lower HRB [22]. According to field investigations by the local water bureau, other lakes appeared as a result of the project. Despite the ecosystem services they provide, the unplanned water recovery may cause concerns in terms of superfluous water consumption in such water-limited environments [2,19]. The identification of those lakes has special implications for the management of precious water resources. For sustainable water management and ecosystem restoration, knowledge of both spatio-temporal variations in lake area and changes of water consumption of lakes in the lower HRB is needed urgently but has not yet been studied.
In most previously published studies, observations, and modeling of the evaporation rates of the lake in the lower HRB represented the key focuses of research on lake water consumption [23,24,25]. However, the harsh conditions in the lower HRB make it difficult to obtain long-series observation data or qualified estimated values from physical-process-based models. In this case, empirical modelling is often considered as the most suitable method to obtain reliable evaporation rate data. For example, Liu (2016) [25] measured daily lake evaporation rates using a floating E601 pan on a lake, and developed a practical evaporation model to quantify the open water evaporation rate in the lower HRB. The semi-empirical evaporation model has proved to be in accordance with other related studies in the study area [23,24]. Moreover, satellite remote sensing offers the only feasible approach for long-term systematic lake mapping and inventory in the data-gap areas such as the lower HRB [26]. Fine-resolution satellite imagery of a continuous time series (e.g., Landsat dataset) is needed for regional-scale lake mapping, which is characterized by abundant small-size lakes and small-amplitude shore changes [27]. Several methods, such as spectral indices exploiting the differences in reflectance of the spectrum and visual supervised classifier, were developed generally to enable rapid interpretation with high accuracy [28].
To fill the knowledge gap, the purpose of our study was to provide insights into appropriate water management strategies to promote ecosystem restoration in the arid endorheic basin. The specific objectives of this study were to (1) determine the spatio-temporal variations in lake area of the lower HRB during 2000–2017 using long-series Landsat images, (2) quantify the changes in lake water consumption (i.e., lake evaporation), and (3) discuss the effects of the EWDP on lake dynamics in the arid endorheic river system.

2. Materials and Methods
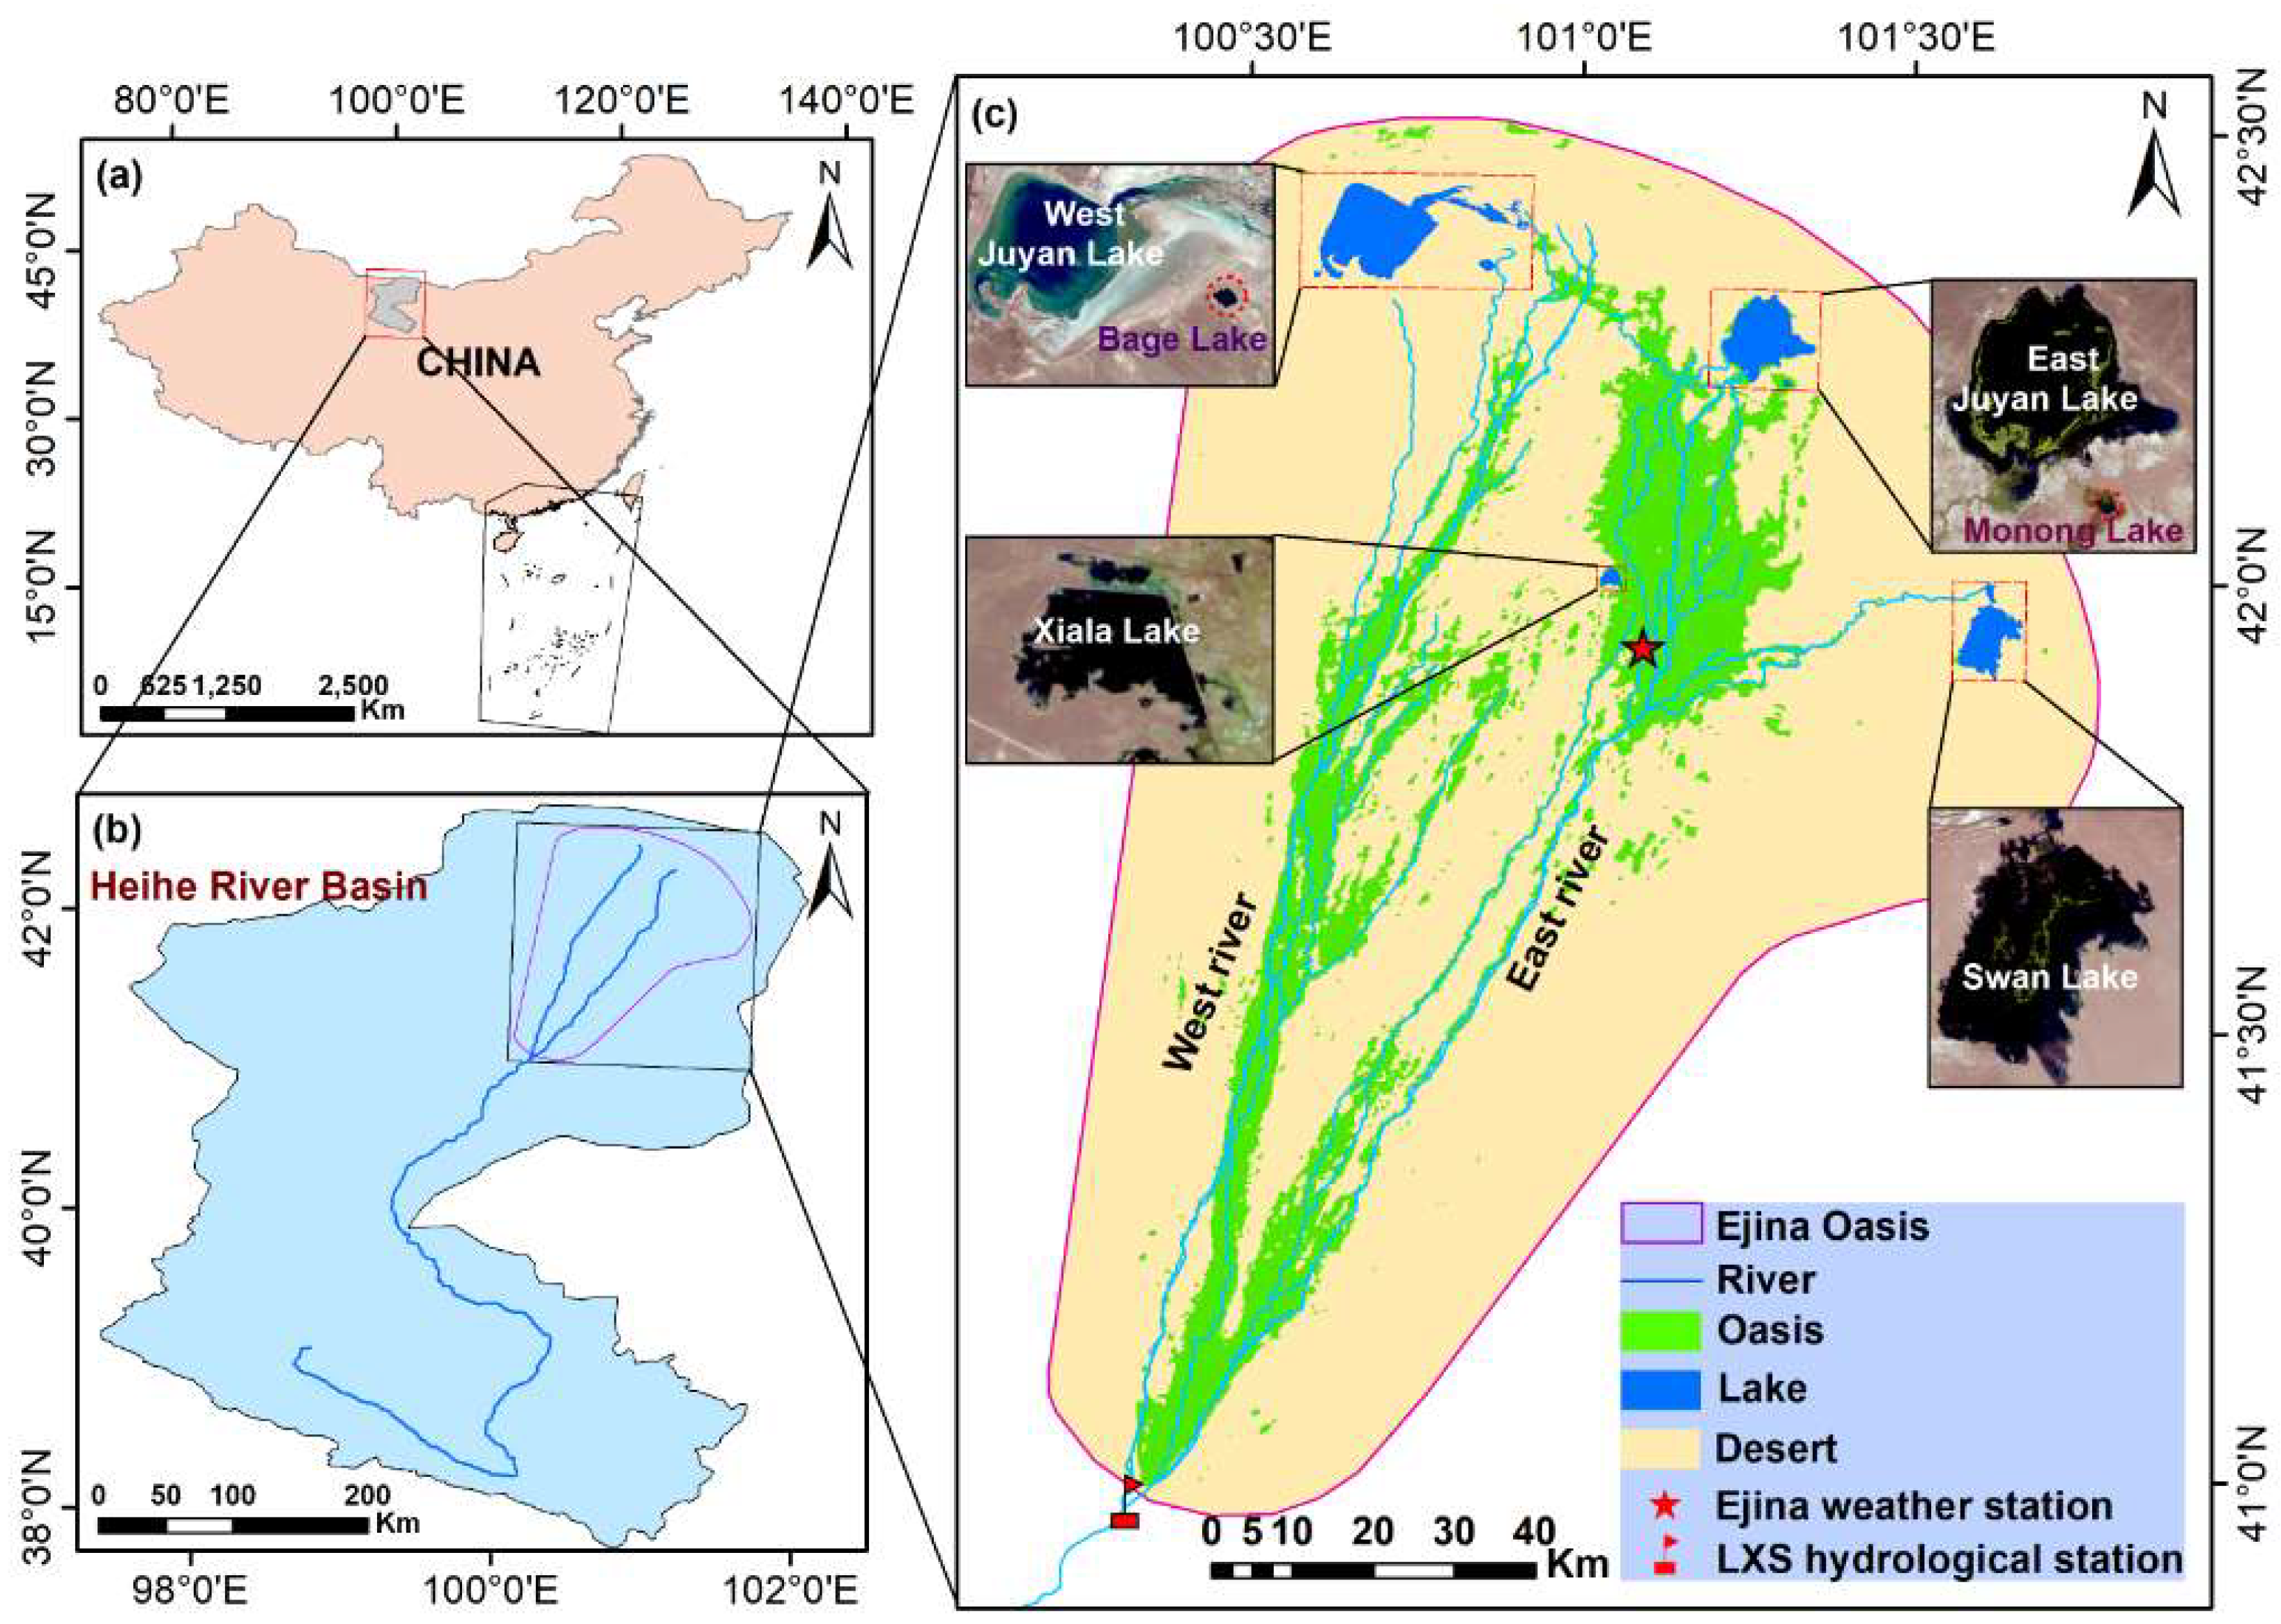
2.1. Study Area

The study area is located in the lower reaches of the HRB, Northwestern China, and is normally referred to as the Ejina Oasis (Figure 1). This region is characterized by a continental climate that is extremely hot in the summer and very cold in the winter. According to data from the Ejina weather station (1959–2017), the mean annual temperature was 9.1 °C, with the highest temperature of 43.7 °C in July and the lowest temperature of –35.3°C in January. The mean annual precipitation and potential evaporation were 35.2 mm (1959–2017) and 1500 mm [23,25], respectively. The Heihe River entering the lower HRB is the only runoff that flows through the Ejina Oasis and is divided into the East river and West river at the Langxinshan hydrological station. These rivers ultimately flow into EJL and WJL, respectively. The river flows from the Heihe River and groundwater is the main water sources used to sustain local residents and the surrounding ecosystems [29]. The natural vegetation in the lower HRB, which is predominated by phreatophytes (e.g., Populus euphratica, Tamarix ramosissima), is mainly distributed along the rivers and relies on shallow groundwater for survival [30]. The EWDP in the HRB was launched by the Chinese government in 2000. Currently, the runoff of the lower HRB and its spatial distribution in the area are determined by the project [31]. According to the project plan, the East river takes priority in terms of water diversion to maintain the core riparian oases and the terminal EJL located in its downstream area, while the West river takes second place. On the basis of remote sensing and field investigations by the local water bureau, in addition to EJL and WJL, Swan Lake (SL), Monong Lake (ML), Xiala Lake (XL) and Bage Lake (BL) appeared with the implementation of the EWDP.

2.2. Lake Area Determination

In this study, we used the core dataset of Landsat-5, Landsat-7, and Landsat-8 (30 m resolution) for the period of 2000–2017 to extract the lake area in the lower HRB. Monthly cloud-free composite scenes of the study area were generated using ArcGIS10.4.1 software on images taken during the ice-free period between April 1 and October 31. For months November–March, when surface water changes subtly during this frozen period, cloud-free scenes of the area were selected from the January Landsat collections on the measure of open water. For months with no single cloud-free images of the area, portions of multiple images were mosaicked to yield as cloud-free a view of the area as possible [32].
Lake mapping was performed using the ArcGIS10.4.1 software and Landsat collections (supplementary data Figure S1). Because the surface features of lake regions are distinguished in spectrum curves, a band ratio between blue and near-infrared bands was proposed by Li et al. (2017) [20] to incorporate the very different reflectance characteristics of water surface and other surface features in the area. Thresholding of each water index image was performed on the crosscheck with high-resolution (resolution of 0.5–1 m) satellite data [20]. In this way, thresholds of Landsat images were determined as constant values, and the error between Landsat and high-resolution images was less than 3% [20].
For each month, a water index was first calculated for the Landsat images. Then, the extracted lake boundaries were refined by visual interpretation to test the stable variation in thresholding. Ratio formulas and corresponding empirical thresholds for lake interpretation are shown in Table 1. Misclassification of pixels rarely occurred and was due mainly to contamination from clouds, cloud shadows, or transmission striping of Landsat-7. False water detection at these pixels can then be edited manually based on the water cover of time-adjacent images. Contamination within lakes was identified visually and reassigned as water cover to maintain the continuity of the time-series. Water extent with contamination crossing the boundaries of a lake was corrected by spatial interpolation of time-adjacent images. Based on linear interpolation, the median value was used as the lake area for a given month. Annual lake area refers to the maximum area of the year.

2.3. Water Consumption Calculation

Monthly water consumption was defined as the monthly lake area multiplied by corresponding lake evaporation rate, in which the monthly lake area was estimated from Section 2.2, and the calculations of monthly lake evaporation rate are given as follows. The annual water consumption was determined by the accumulation of monthly water consumption.
The lakes in the lower HRB are all shallow; thus, their evaporation rate is controlled mainly by atmospheric forcing [33]. Therefore, we used meteorological data obtained by the local weather station and semi-empirical evaporation model derived by Liu et al. (2016) [25] to calculate the monthly lake evaporation rate. For April to September and October to March, the lake evaporation rate was derived by Equation (1) and Equation (2), respectively:
E i = j = 1 k ( a + b · ( c · u i j d ) 0.5 ) ( e f · ( g · R H i j h ) 1.5 ) ( m + n · T a i j )
E i = θ · E p i
where subscripts i and j represent month i of a year and day j of a month, respectively; k is the actual number of days in month i; E is the monthly lake evaporation rate (mm/month); a, b, c, d, e, f, g, h, m, and n are parameters with values of 0.0345, 0.002, 0.943, 0.877, 42.6824, 0.0122, 1.065, 7.817, 2.73, and 0.078, respectively; u is wind speed (m/day); RH is relative humidity (%); Ta is air temperature at 2 m (°C); Ep is observed pan evaporation rate (mm/month); and θ is an empirical coefficient used to deduce the actual lake evaporation rate from the observed pan evaporation data. The values for Φ20 pan evaporation data (i.e., November to March) and E601 pan evaporation data (i.e., October) are 0.48 and 0.76, respectively, which are referred to the study in a similar arid environment by Hu et al. (2005) [34]. The detailed calculations of the parameters in Equation (1) can be seen in Liu et al. (2016) [25].

2.4. Data Sources

The data used in this study are listed in Table 2 and included meteorological data, remote-sensing images, and hydrological observations from 2000 to 2017.
Meteorological data were used to estimate the lake evaporation rate, which included daily mean air temperature, wind speed, and humidity data from April 1 to September 30 and the monthly observed pan evaporation rate from October to March. Meteorological data were obtained from the Ejina weather station (101.07°N, 41.95°N), which is the only national base weather station in the Ejina Oasis.
We determined lake area based on remote sensing images, and the sites of 6 lakes were covered by 2 freely available Landsat images. Clear sky subsets of 248 Landsat images with a resolution of 30 m along path 134, row 31, and row 30 were collected from the United States Geological Survey (https://glovis.usgs.gov/). The subsets consisted of 110 Landsat-5/TM images, 54 Landsat-7/ETM images, and 84 Landsat-8/OLI images. The Landsat images used in this study are shown in Figure S1.
Annual river discharge measured at the Langxinshan (LXS) hydrological station (Figure 1) was used to analyze the response of lake dynamics to the EWDP. The hydrological observations were obtained from the Wuhai water bureau.

3. Results

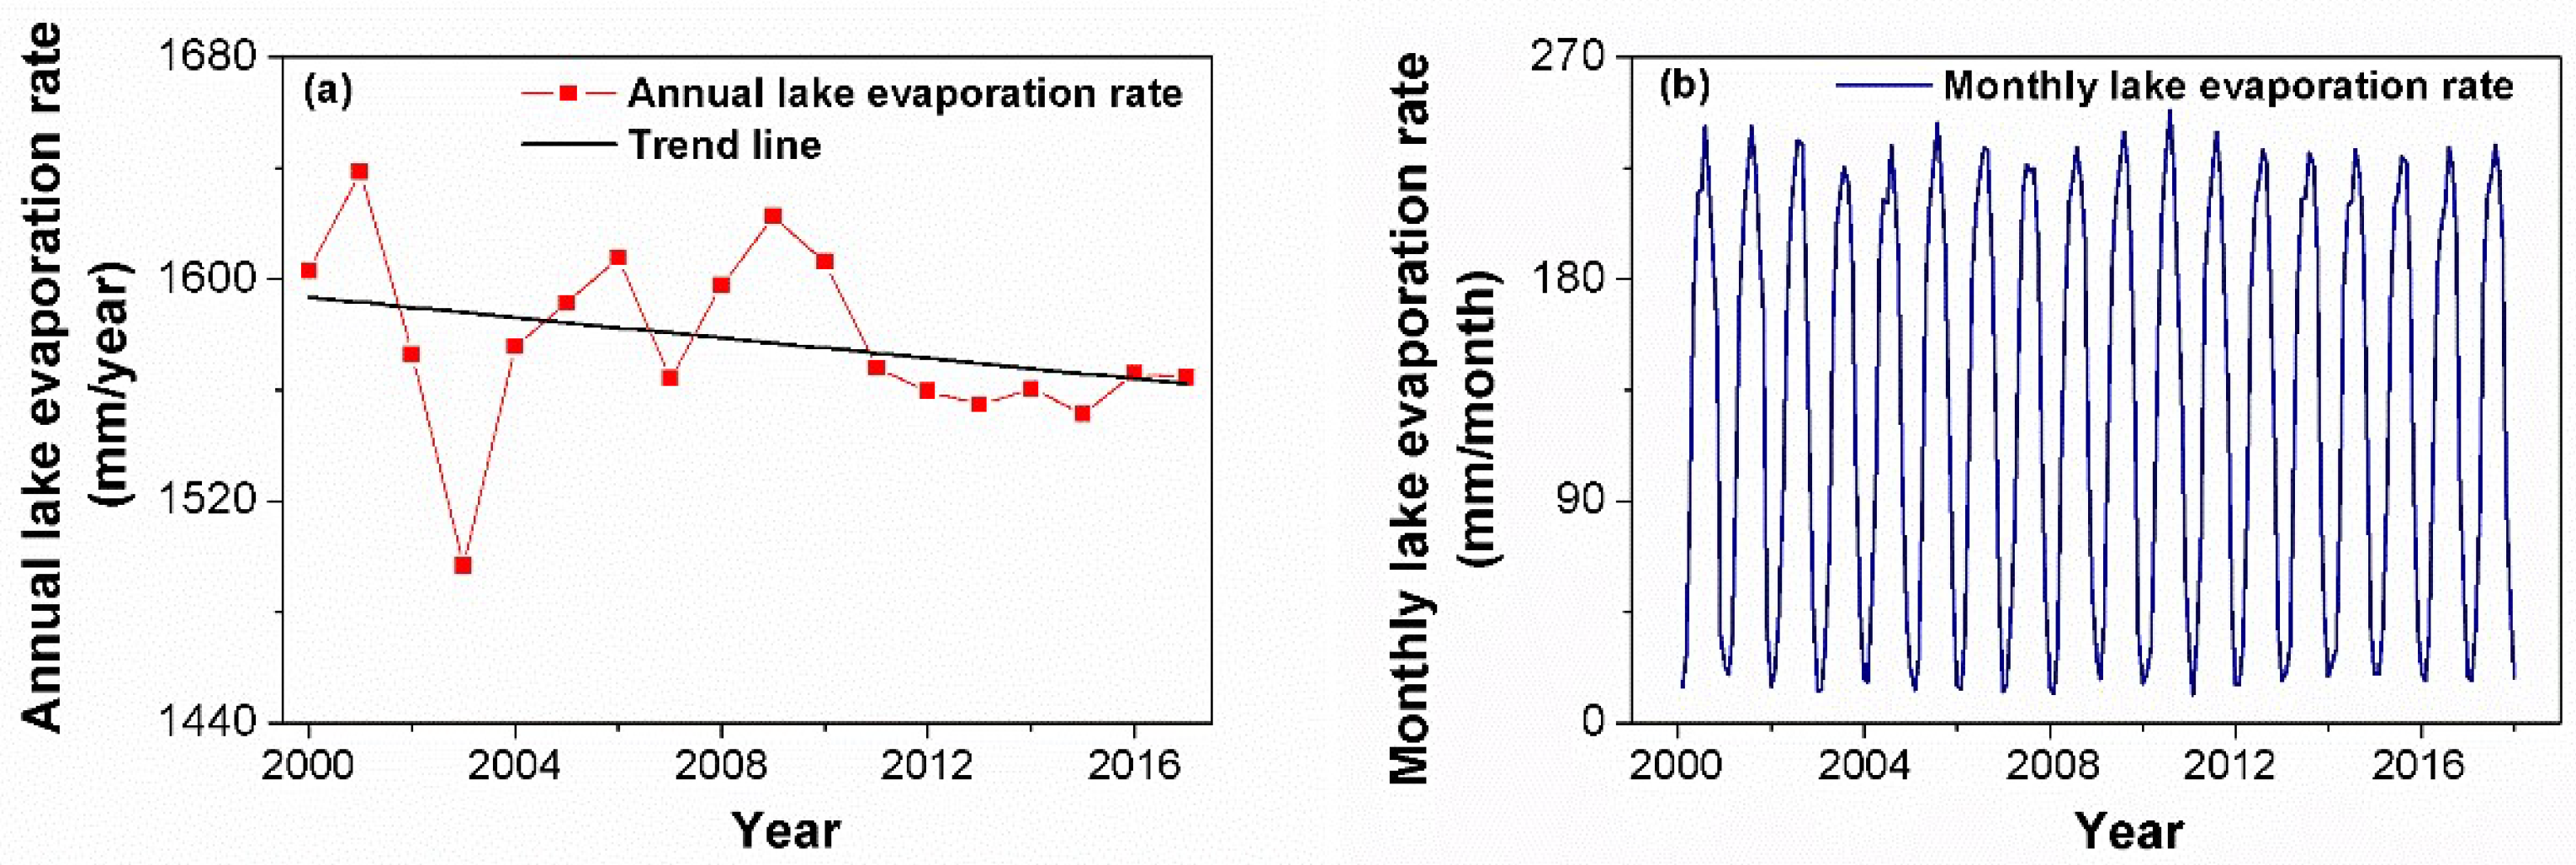
3.1. Changes in Lake Evaporation Rate

According to the variability in annual lake evaporation rate (Figure 2a), for 2000–2017, the estimated mean, maximum, and minimum evaporation rates of the lake were 1577.9, 1638.8, and 1496.5 mm/year, respectively. Generally, a slight decreasing trend in annual lake evaporation rate of 1.8 mm/year was observed, but this rate is not statistically significant at the level of 0.05 (p = 0.22).
The monthly lake evaporation rate showed an obvious seasonal pattern of variation (Figure 2b). The highest lake evaporation rate was observed in July or August, and the minimum lake evaporation rate emerged in January or December.

3.2. Lake Area Variation

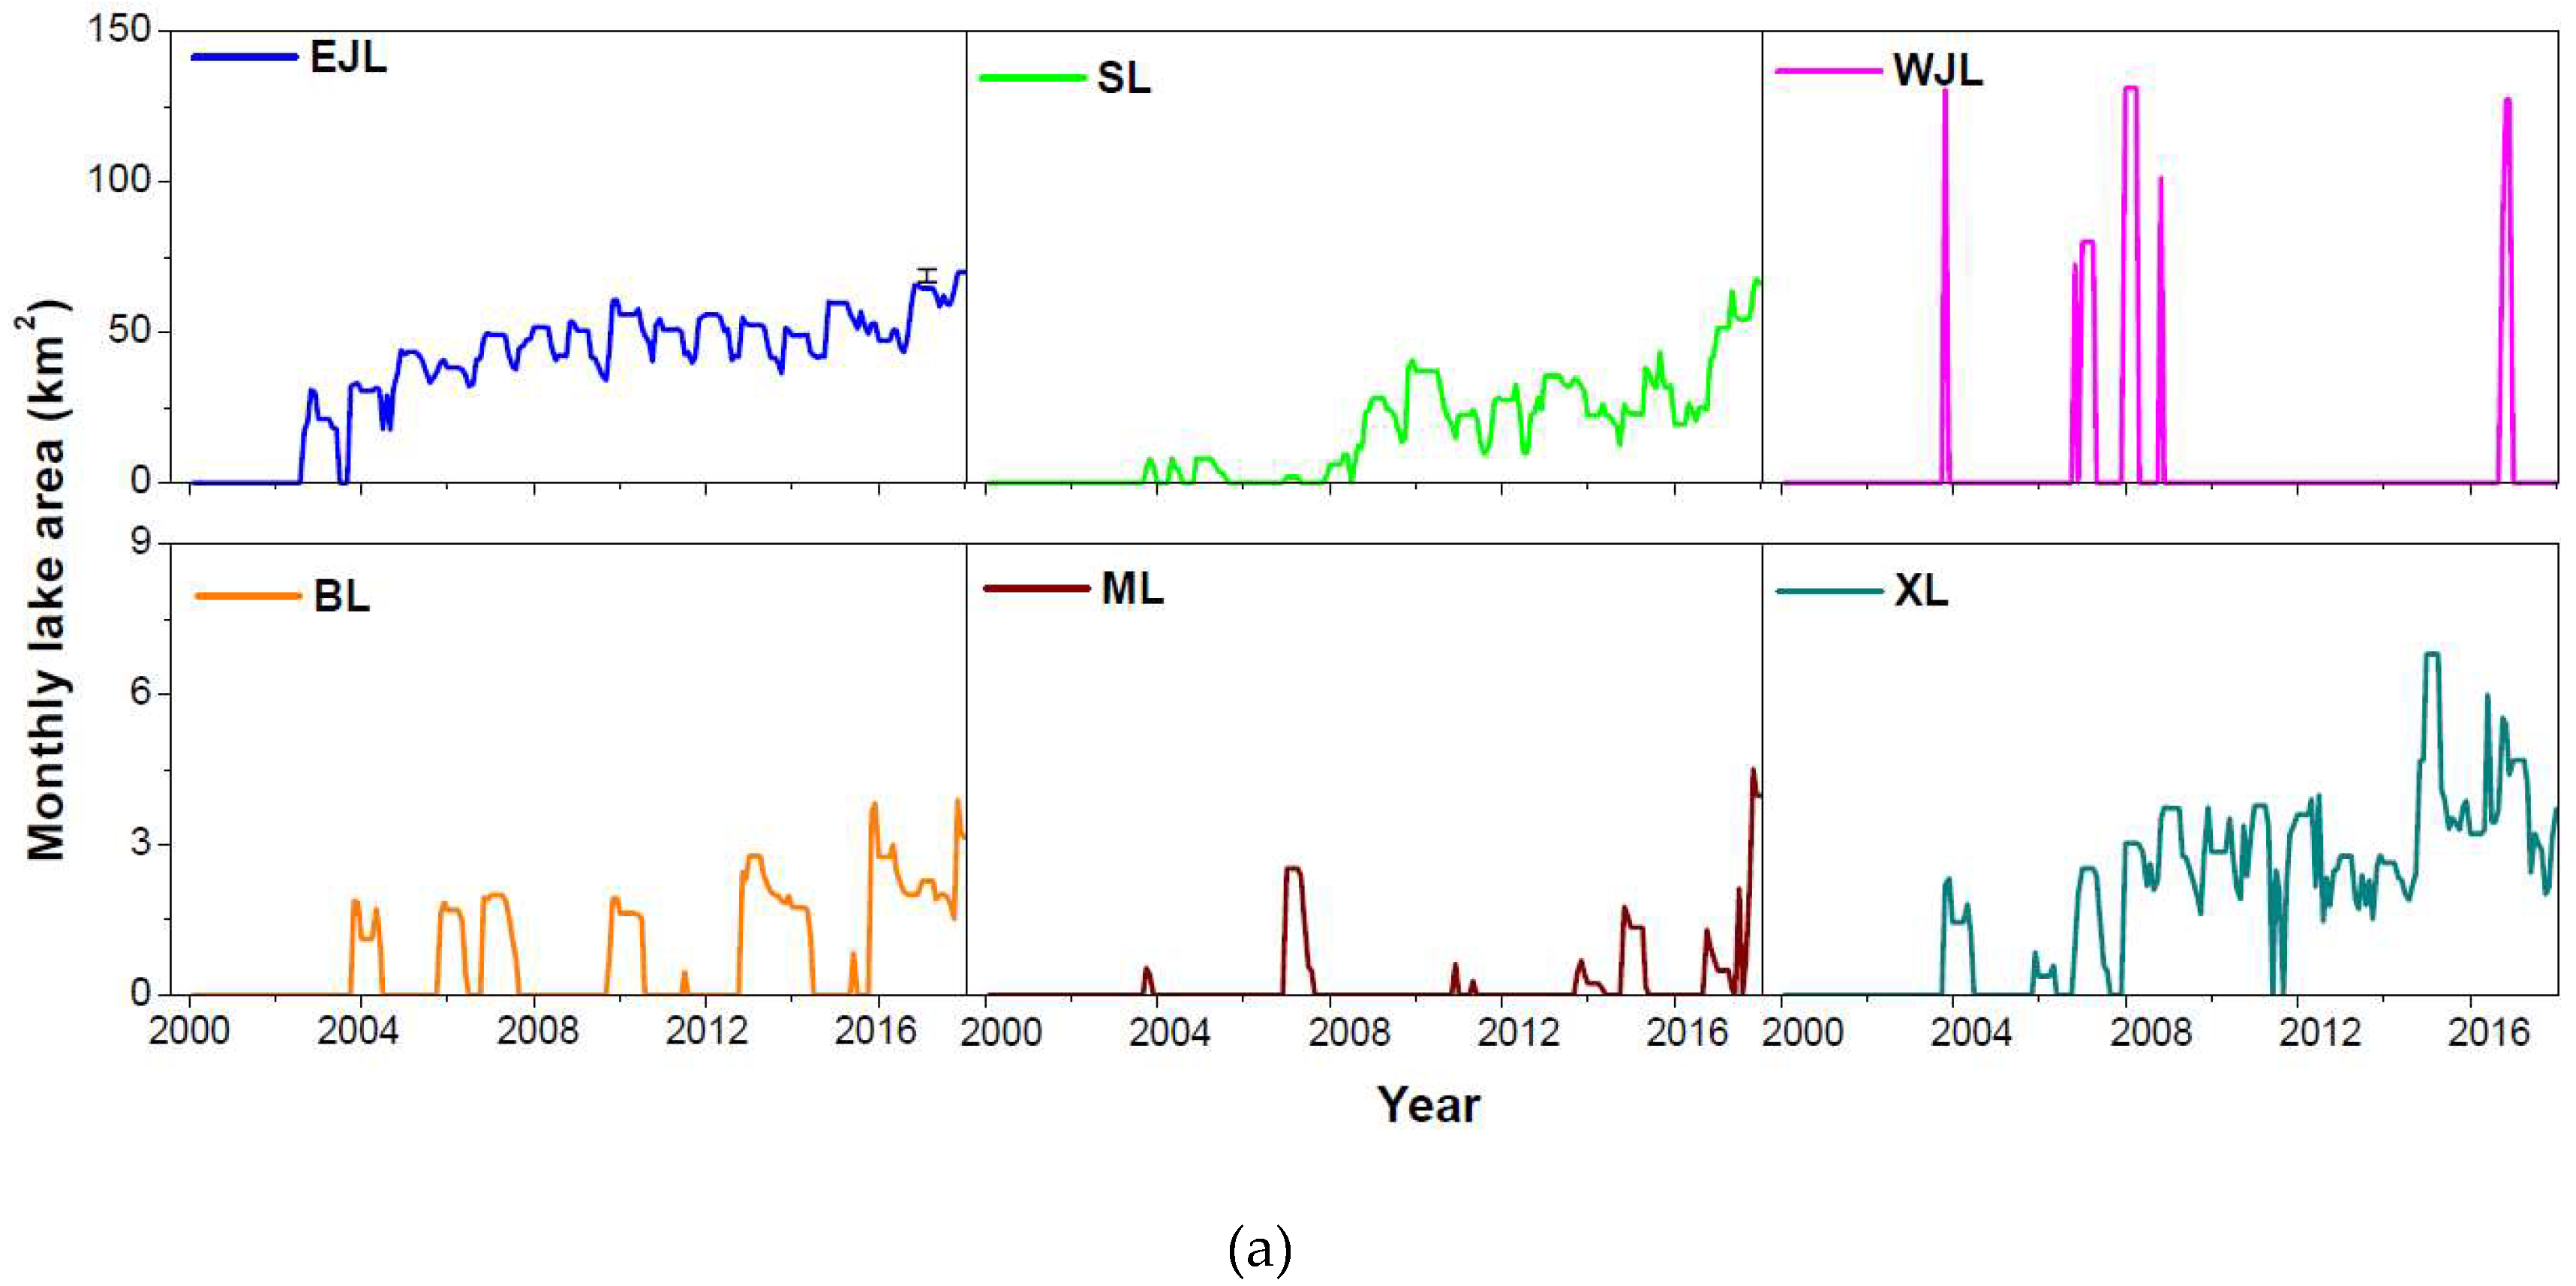
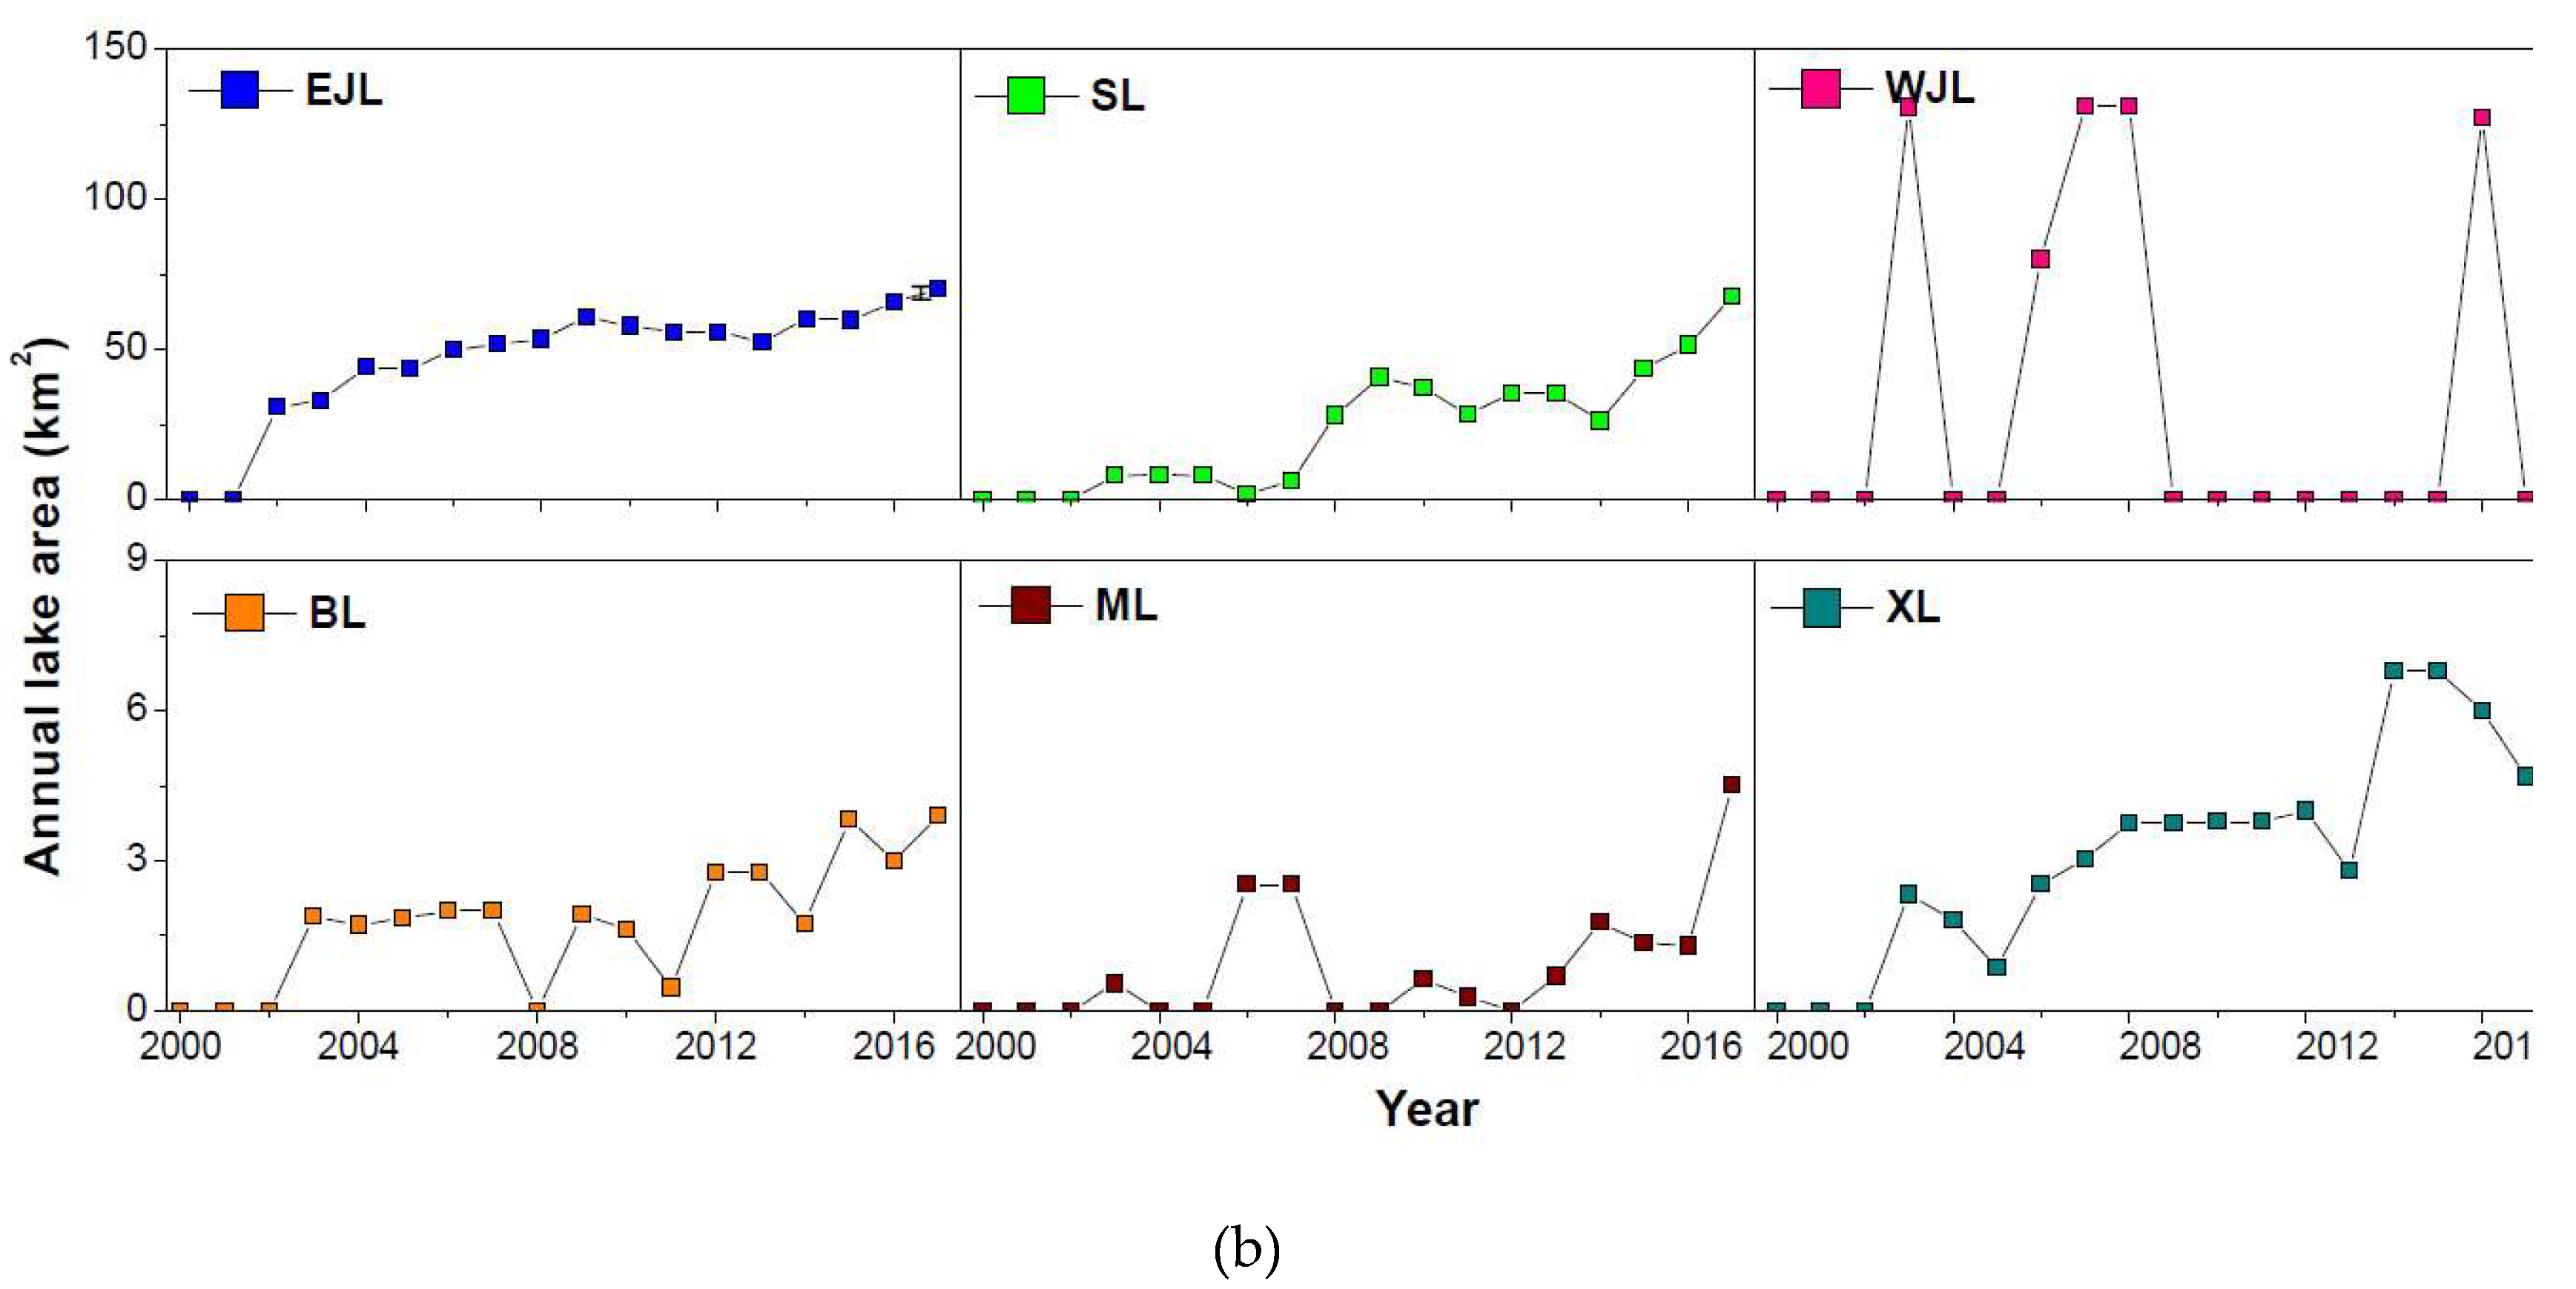
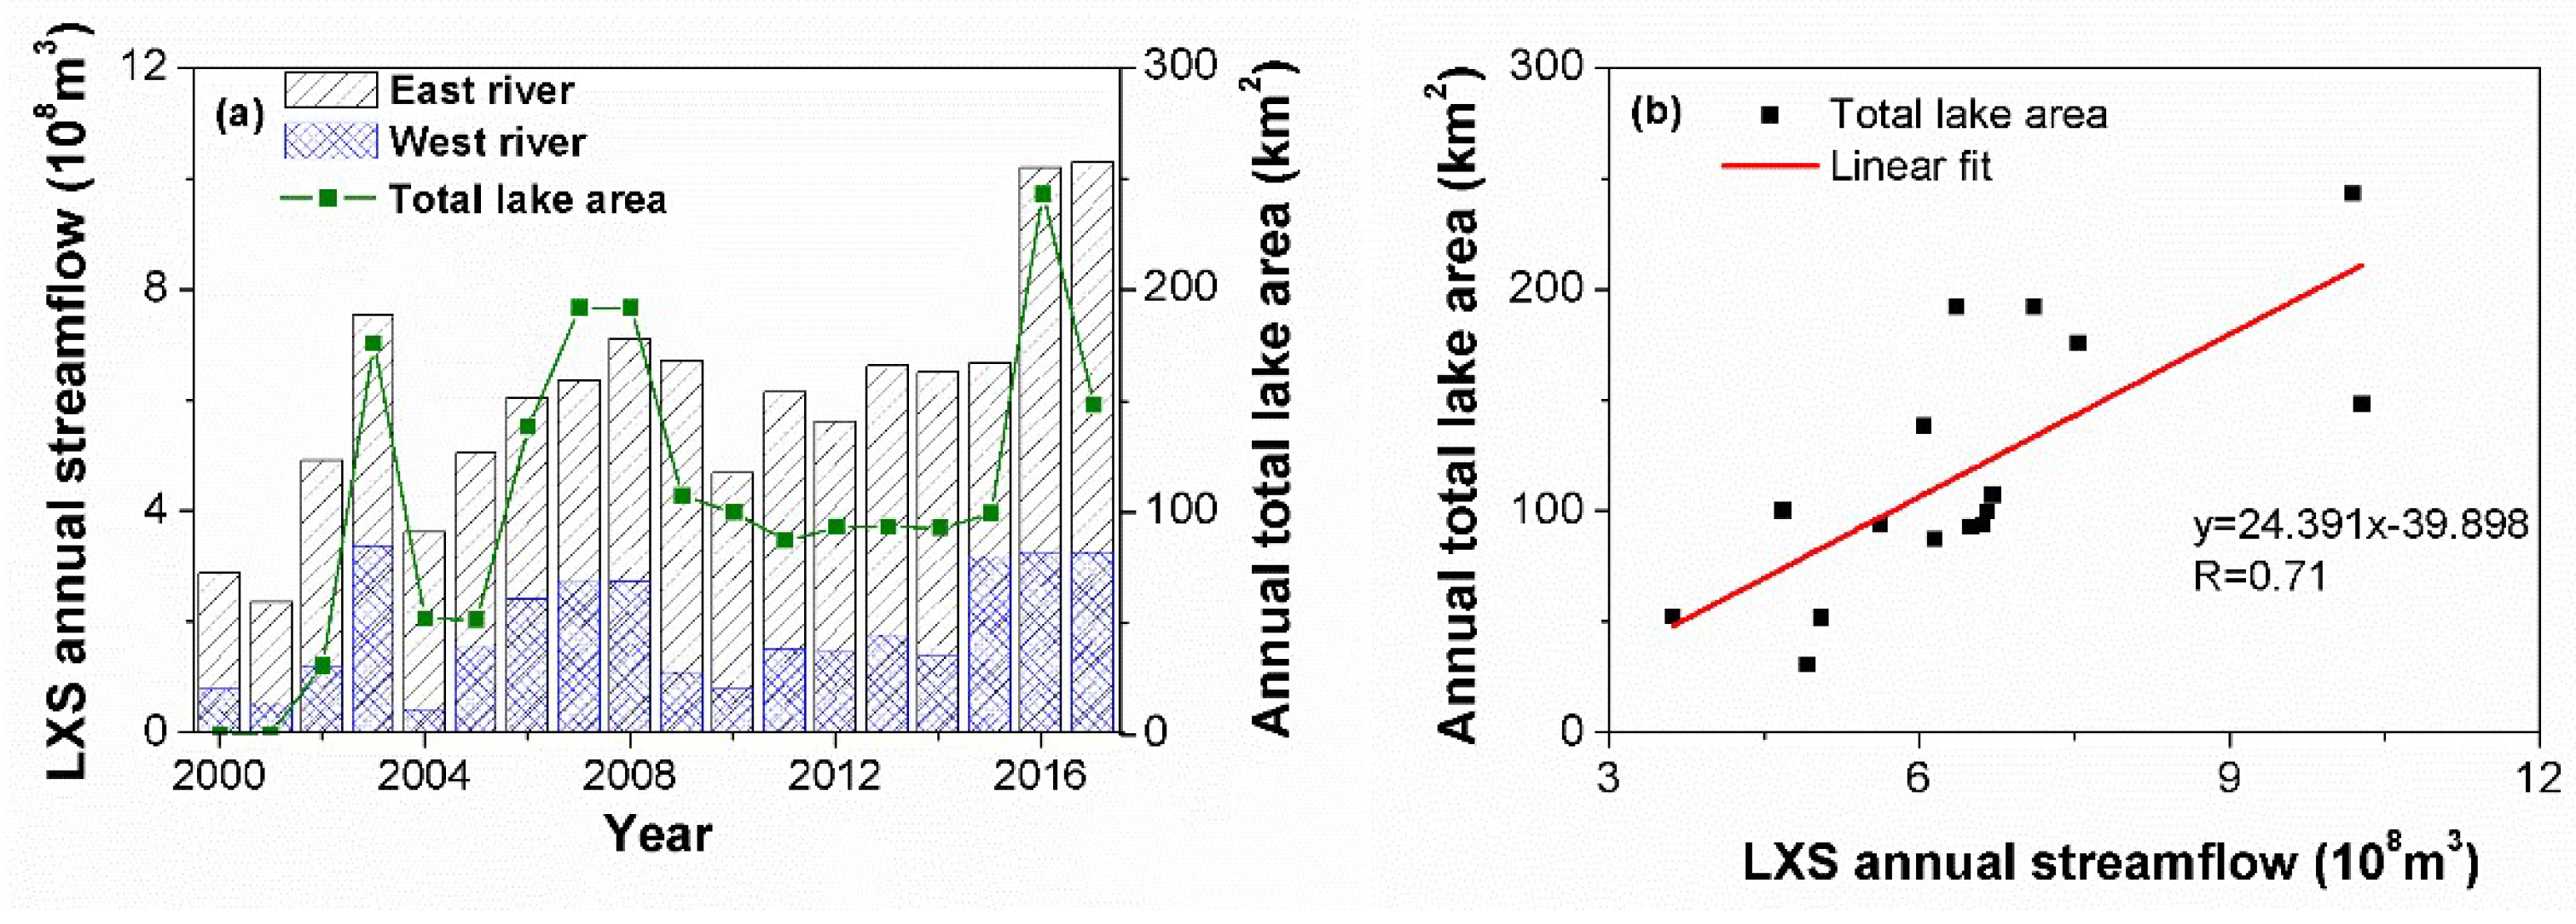
3.2.1. Temporal Dynamics in Lake Area

Figure 3a illustrates the temporal variations in the area of six lakes in the lower HRB from 2000 to 2017. Water from the EWDP first arrived in EJL on July 17, 2002 (Table 3). After 16 years of continuous water diversion transfer from the middle HRB, the surface area of EJL reached a maximum of 70.1 km2 in 2017, representing a 128.3% augmentation from 30.7 km2 in 2002 (Figure 3b and Table S1). An increasing trend in the area of EJL took place during the period. The expanding rate of EJL was an average of 4.1 km2/year from 2002 to 2009, and then decreased by 71% to an average of 1.2 km2/year.
More than one year later than the recovery of EJL, other lakes in the study area started to receive water from the Heihe River in September or October 2003. SL started to expand at an average rate of 2.5 km2/year in September 2003. After exceeding 28 km2 in 2008, the annual variation in the area of SL tended to remain stable at an average of 33 km2. Up to 2015, SL expanded dramatically again with an average rate of 13.2 km2/year and reached a maximum area greater than 67 km2 in 2017. Overall, the expansion rate of SL (3.7 km2/year) was greater than that of EJL (2.0 km2/year) during the recovery period.
An increasing trend also occurred in the variations in the area of ML, XL, and BL during 2003–2017. With average changes in area per year of 0.12, 0.31, and 0.13 km2, the area of ML, XL, and BL increased to a maximum of 4.5, 6.8, and 3.9 km2, respectively. WJL showed no obvious trend and remained dried up most of the time. Despite the short time of water storage, the area of WJL exceeded 80 km2 and reached a maximum of approximately 131 km2 in 2007 and 2008.
In general, lakes within the study area gradually expanded with the implementation of the EWDP (Table 4). The total lake area increased variably by 382.6%, from 30.7 to 148.2 km2, during the period of 2002–2017. The increasing trend exhibited a multiyear average lake area of 118.6 km2 and multiyear average lake area change of 7.8 km2/year over the past 16 years. The maximum total lake area was 243.2 km2 in 2016.

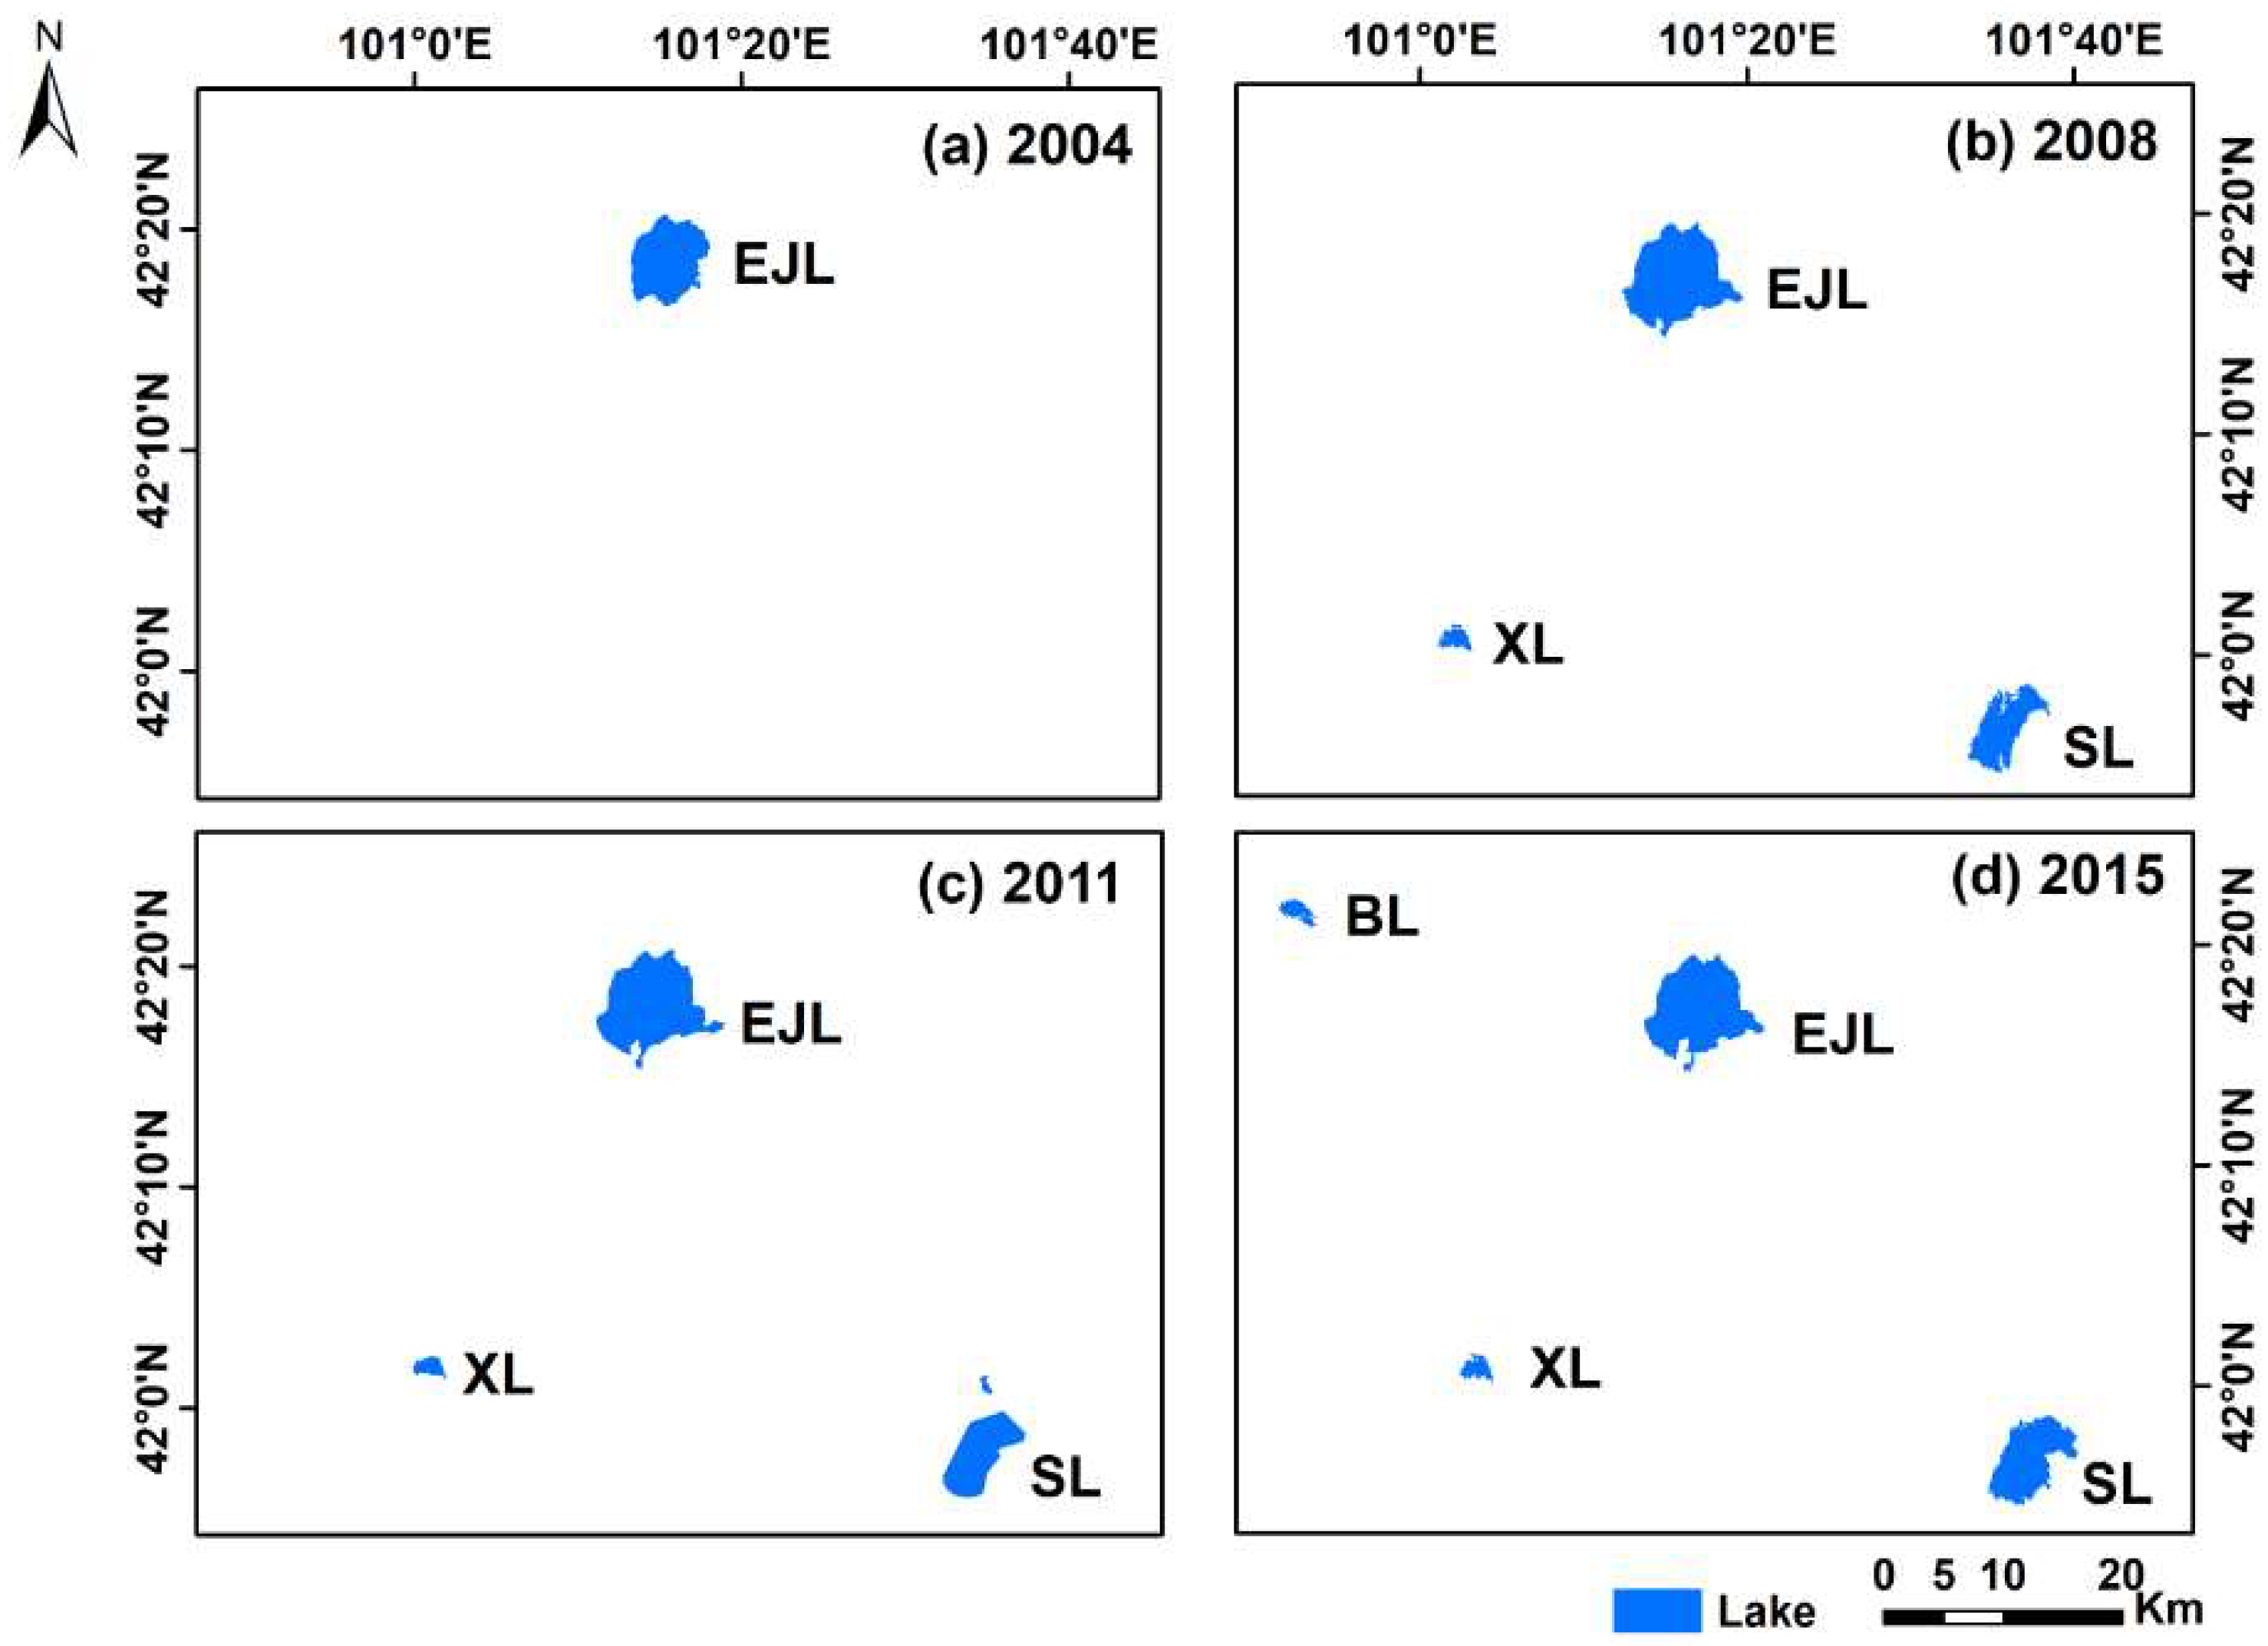
3.2.2. Spatial Patterns of Lake Changes

The spatial distribution of lakes in the study area is presented in Figure 1c. Lakes are located in the northern part of the Ejina Oasis and are distributed mainly at the ends of the East and West rivers. EJL, the terminal lake of the East river, is situated in the northeast of Ejina Oasis and was the first lake to receive water in 2002, while the EWDP was initiated in 2000. EJL developed to permanent water in September 2003 and retained this status for 182 months of the study period, with an average area of 55.8 km2 (Table 3 and Figure 3b). SL, a residual lake of the ancient Juyan Lake, is located at the end of a branch of the East river and in the farthest east portion of the area. As the second largest lake in the region after EJL, SL has maintained an average level of 40.7 km2 since water was perennially stored after July 2008, representing 140 months of the study period.
ML and XL are the other lakes located along the East river. ML is nearly adjacent to the southeast of EJL and is a small seasonal lake. The maximum area of ML was 4.5 km2, and its time with water storage was 41 months (Table 3). XL is the only artificial reservoir in the area and started to store water in September 2003 for the core oases (storage time of 143 months). XL remined at an extent of 5.0 km2 throughout the last seven years. WJL and BL were both situated in the end of the West river. WJL extended to as large as 131.4 km2 but held water only for an extremely limited time. During 2000–2017, the total storage time of WJL was only 15 months (< four months per storage period), which occurred in 2003, 2006–2008, and 2016. BL is an associated lake located in the southeast of WJL, and the lake area is less than 4 km2. However, for the total storage time of 85 months, BL was considered the main water body in the west of the region, and it maintained a multiyear average extent of 3.6 km2 after October 2015.
Over the past 18 years, the Ejina Oasis showed an increase in permanent water, and much of the increase was from the East river (Figure 4). Between 2008 and 2015, permanent surface water increased from eastern EJL to eastern SL and XL and western BL. Although the lake recovery in the East river was spatially superior to that in the West river, the spatial pattern of the changes in permanent lakes indicated the gradual development of lakes from the east to the west in the area.

3.3. Variation in Lake Water Consumption

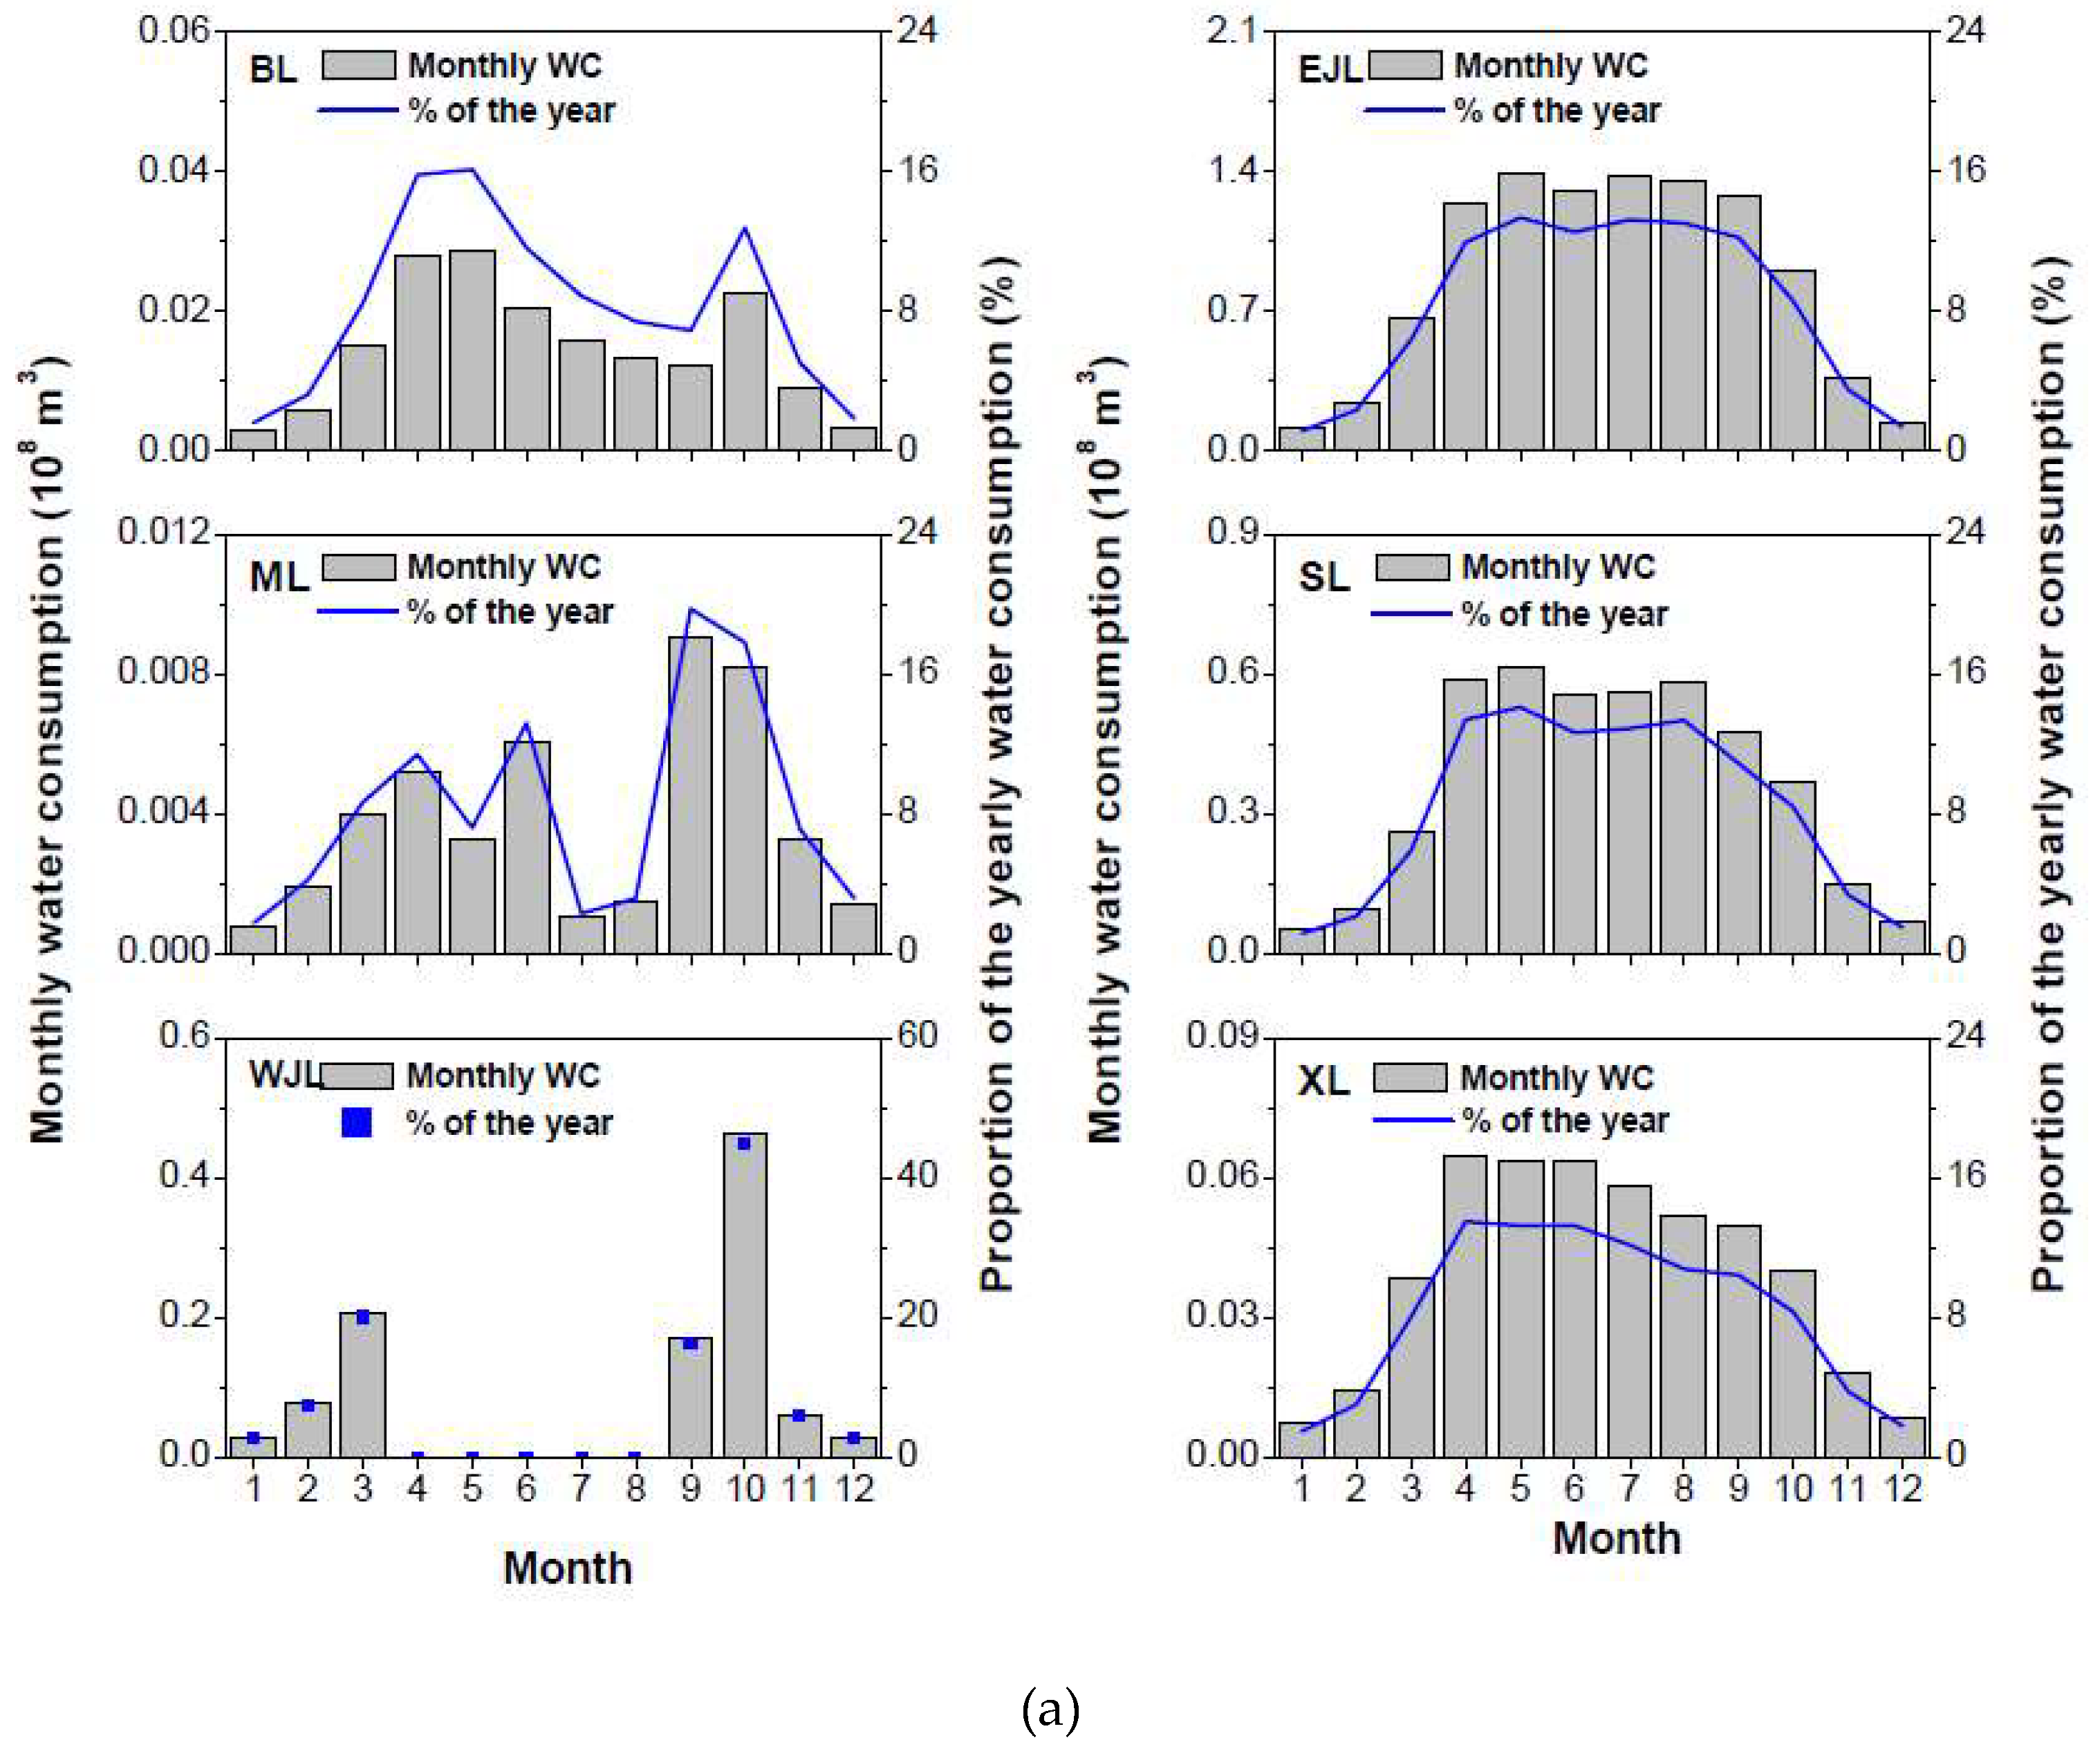
3.3.1. Seasonal Patterns of Water Consumption

Figure 5a shows the monthly distribution of water consumption over six lakes in the area. The seasonal allocation of water consumption of different lakes was acquired for 2000–2017. The seasonal variation in water consumption of EJL, SL, and XL followed a unimodal curve with the peaks in May to August, May to August, and April to June, respectively. The water consumption of BL and ML showed a seasonal variation in multimodal pattern, and the peaks occurred in April to May and October and in April, June and September, respectively.
It was obvious that the majority of water volume was consumed by lakes during the growing season (i.e., April to October), which accounted for 83.6% of the water consumed in a year on average in the study area. The water consumption of SL in the growing season accounted for 85.8% of its total water consumption in a year, followed by that of EJL at 85.1%; XL at 81.8% and ML at 75.0%; and BL and WJL at 79.6% and 61.2%, respectively.

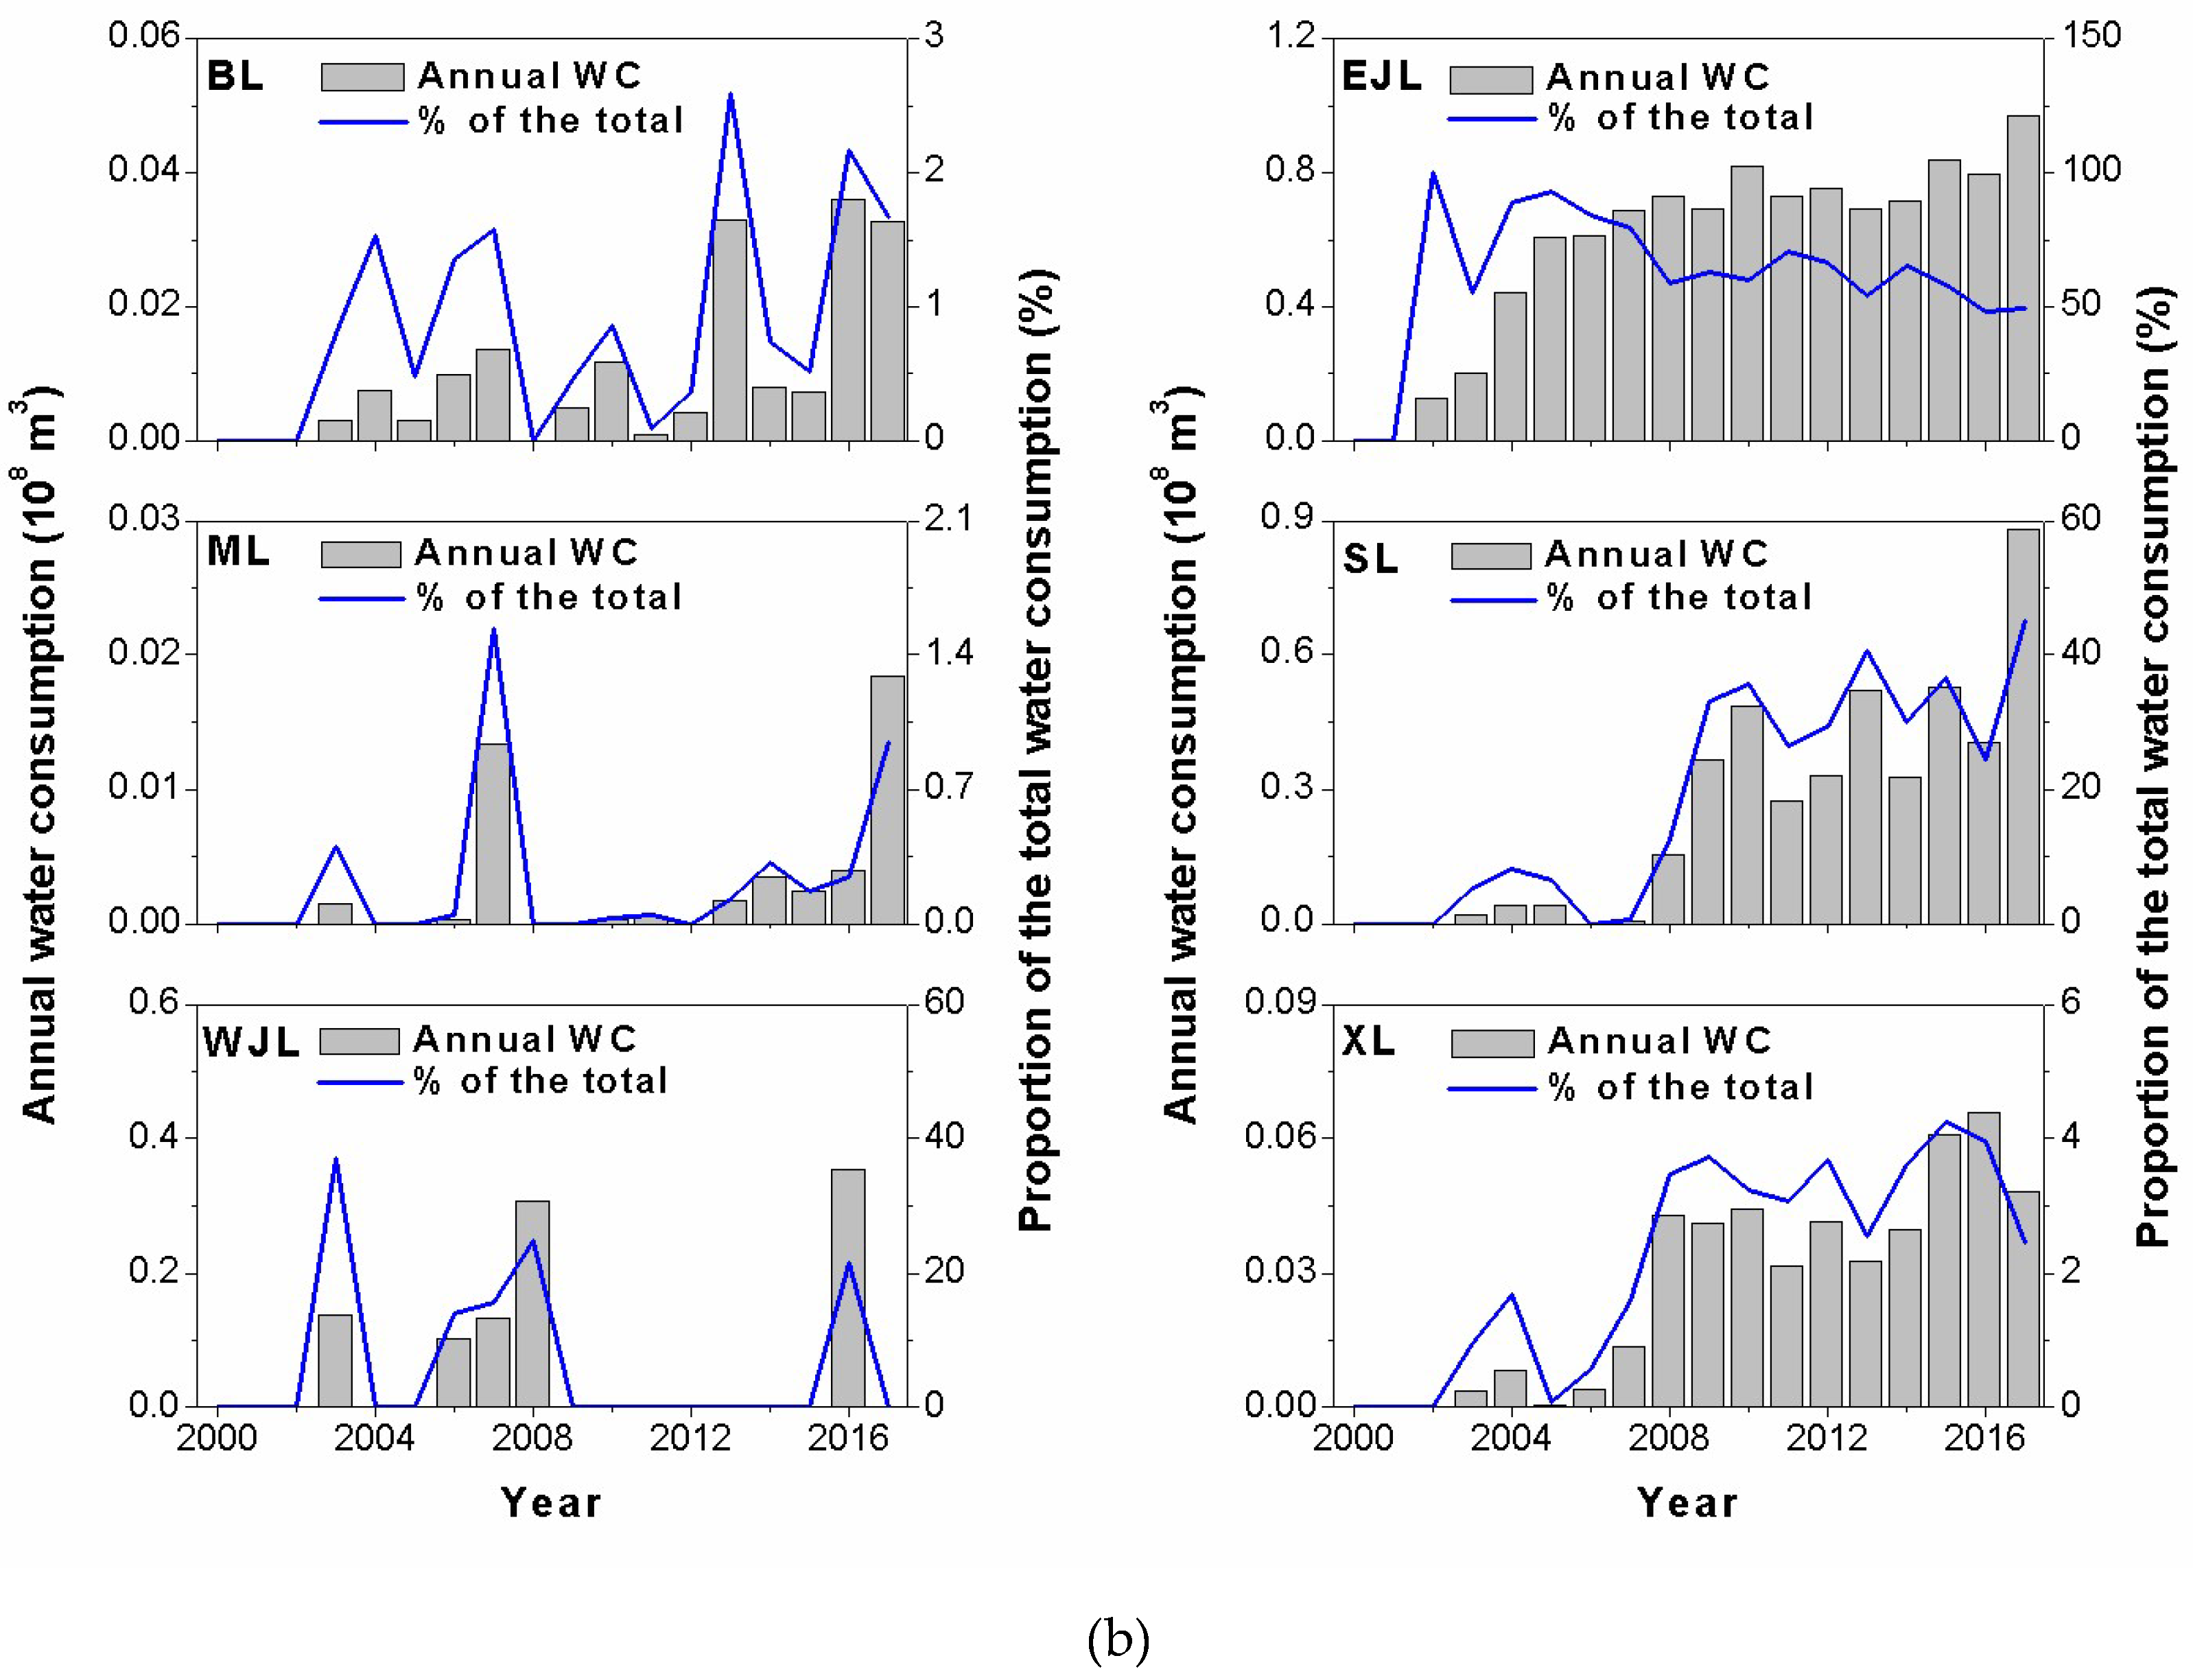
3.3.2. Inter-Annual Changes in Water Consumption

Table 4 indicates the total water consumption of all lakes, and the inter-annual changes in water consumption of different lakes during the period of 2000–2017 are shown in Figure 5b and Table S2. The total water consumption of the six lakes from 2002 to 2017 was 16.52 × 10 8 m 3 with a multiyear average value of 1.03 × 10 8 m 3 . The total water consumption and lake area in the study area exhibited a regular synchronous increasing trend for most of the past years but has been interrupted since 2008. After 2008, the total water consumption tended to remain stable with an average value of 1.21 × 10 8 m 3 per year. After 2016, with the total lake area expanding by more than 80% on average, the total water consumption of the site increased to a maximum of 1.95 × 10 8 m 3 in 2017. With the implementation of the EWDP, the total water consumption of lakes increased by 143.4% when compared to the level at the beginning of lake recovery.
The water consumption of different lakes was determined to explore the distribution. As the targeted object of the EWDP, EJL consumed 0.58 × 10 8 m 3 of water volume per year on average since the project was initiated, which accounted for 63.0% of the total water consumption. SL was another major component of water consumption in the area. The average water consumption of SL was 0.24 × 10 8 m 3 per year, representing 26.5% of the total. The proportion of the water consumption for EJL and SL reached a multiyear average of 89.5% of the total water consumption in the lower HRB, and other lakes accounted for only a small amount of the water consumption. BL, ML, and XL consumed 0.04 × 10 8 m 3 of water volume per year on average during 2000–2017, which accounted for 4.2% of the total value. The water consumption of WJL varied distinctly from year to year, and the maximum annual water consumption and proportion were 0.36 × 10 8 m 3 in 2016 and 37.1% in 2003. Among the changes, the proportion of water consumption of EJL showed a declining trend, while that in other lakes (except WJL) showed an increasing trend.

3.4. Sources of Uncertainty

Our analysis was subject to two primary sources of error: lake area determination and water consumption calculation. Both of these are mainly dependent on the lake-interpretation by remote sensing. In this study, clear-sky subsets of Landsat images were carefully selected, but a few images of low contamination had to be used due to limited image availability for some time periods. Although the adaptive method performs well and mitigates the effects of most interfering factors, cloud, cloud shadows, and transmission striping can obscure the spectral response of lake water and impose challenges to unambiguous lake interpretation [26,27]. Therefore, subsequent editing efforts based on time-adjacent images are necessary to ensure the optimal product quality. Manual editing of lake boundaries can certainly improve the accuracy of lake interpretation, but it does not guarantee properly delineated lakes in the images and may cause minor errors due to lake interpretation.
Moreover, lake evaporation rate is also affected by the uncertainty of water consumption calculation in this study. For the study site, Liu et al. (2016) [25] conducted an in-site experiment and obtained the only observed data of lake evaporation rate of which we are aware. The semi-empirical model used in the study was derived based on these short-term experimental results, and requires meteorological data inputs from Ejina weather station. As regulated by lakes, micro-meteorological conditions around the lakes are different from those in the weather station and it might cause some errors. However, as small lakes in the study region could only have limited effects [9], meteorological conditions are similar between the lakes and the weather station [25]. Therefore, it is reliable to derive lake evaporation rate by using the semi-empirical model, which is confirmed by the determination coefficient of the model of 0.94 [25]. In addition, meteorological differences in short observation period and long estimation period might also contribute non-negligible errors in lake evaporation rate. Since meteorological conditions in the study region have proved stable over time during recent years [23,24,25], the semi-empirical model is suited to obtain long time series used in this study.

4. Discussion

4.1. Ecological Effects of the EWDP on Terminal-Lake Ecosystems

The EWDP was first launched in 2000 and aimed to restore the ecological environment of the Ejina Oasis, including the restoration of completely dried terminal lakes [35]. To achieve these target objectives, river flow was effectively transported to the downstream area of the HRB, especially in the East river [31]. However, due to the small amount of runoff at the LXS station during 2000–2001 (Figure 6a), the river flow went dry before entering the terminal lake. Thus, EJL recovered two years after the project commenced. As described above (Figure 3), EJL expanded to 30.7 km2 in 2002 after 10 years of being dried up, and the lake has continued to hold free water since September 2003. By 2017, the area of EJL was twice as large as its historical level observed in 1958 (35 km2) [36]. The expansion of EJL also brought about the apparent formation of oases surrounding the lake [37]. Field investigations and remotely sensed observations have confirmed significant increases in native vegetation growth and species diversity around EJL [20,38], which were attributed to the increased groundwater recharge and soil moisture content caused by the increased water volume in EJL [39]. The natural oases of the terminal-lake ecosystem also played a role as an important ecological defense against sandstorms in Northwestern China [31]. The strong sandstorms that broadly affected environmental health at the beginning of the 21st century, were reported to drop in frequency following water reallocation [3]. This result was due to the conservation of surface water and groundwater, the promotion of natural oases, and the consequent decrease in the quantity of sand sources [40]. Moreover, an adjacent ML has also been replenished with the improved hydrological environment caused by the increased river flow into the downstream area of the East river and the augmented surface area of EJL.
Furthermore, the river regulation by artificial water diversion also enabled the reallocation of water for ecological storage by other un-targeted lakes in the lower HRB (Table 3). It was found that, by an increase of 53.2% in LXS runoff from 2002 to 2003, the eastern SL, western WJL and BL, and an artificial Xiala reservoir in the core oases appeared in the area. Along with the EWDP, ecological protection and restoration measures have been carried out in this area, and anthropogenic water use of lakes is strictly restricted [40]. Lakes in the study area gradually expanded after the project was launched, reaching a maximum of 243.2 km2 in 2016 and an average area of 118.6 km2 over the last 16 years. The area of terminal lakes may vary largely among years (Figure 6a), which was dependent on the total runoff into the Ejina Oasis. As shown in Figure 6b, the total area of the lakes was positively and strongly correlated with the LXS runoff, with a correlation coefficient of 0.71. Significant increases in lake area were found during the periods of 2002–2008 and 2016–2017, in particular; however, the spatial expansion of lakes was more evident after 2008 due to the dispersity of ecological water attribution and the persistent water runoff from the upstream area. SL, XL, and BL have developed and maintained certain scales since July 2008, September 2011, and October 2015, respectively. Additionally, lake recovery processes along the East and West river showed spatially distinct consistency with the water reallocation provided by the project.

4.2. Implications for Sustainable Water Management

The implementation of the water diversion project since 2000 has led to not only a significant increase in water surface area but also the restoration of surrounding vegetation and possibly a slight recovery of shallow groundwater in the terminal-lake regions of the lower HRB [37,41]. Although these positive outcomes have been achieved by the current water diversion project, potential problems have also arisen. One of the most striking problems of the project was the competitive water use between lakes and natural oases during the growing season. To effectively transport water to the downstream area of the HRB and the terminal EJL, the natural river was replaced by artificial main canals as a result of the EWDP [31]. The artificial canal along the East river cut off the hydrological relationship between the river flow and groundwater, which caused some degradation of vegetation along the East river [37]. In addition, EJL and other major lakes consumed water mainly during the growing season, which might occupy the water use of natural oases growing throughout the region. The small water reserves at the end of the West river might indicate a deficiency of water for oasis development in the West river, which was evidenced by the decline in groundwater in the lower reaches of the West river after the EWDP [42].
Another serious problem was the growing contradictions between increasing the lake area to support the tourism economy and sustaining wetland ecology and reducing water losses to improve water storage with a lesser amount of water discharge [40]. The increased availability of water resulted in the expansion of EJL and accompanying surface water and development of the tourist industry, which produces wealth and attracts people, leading to increased demands for water [39]. Our results showed that the lower reaches of the HRB experienced a continuous increase in lake water consumption (Figure 5b), of which 37% was consumed by un-targeted water use, especially in the East river. Furthermore, the area of EJL recovered and reached up to 70.1 km2 due to the efficient water supply, and the large-sized scale in EJL resulted in extensive water consumption as a result of hyper-arid climate conditions, accounting for nearly 48% of the ecological water demand of the terminal lake [36]. The smaller changes in EJL area with ever-increasing water supply to the lake after 2010 also highlighted the significant contribution of un-targeted lakes to the total water consumption in the lower HRB. Therefore, it is essential to quantify the appropriate lake area and satisfy the water requirements of the surrounding ecosystems.
For sustainable water resource allocation and ecosystem management in the study area, it is of great importance to optimize the water distribution scheme with a detailed water resources management project. Priority should be assigned to ecological restoration areas (i.e., riparian oases of the East and West rivers, and EJL). The distribution of water resources for EJL should be determined on demand, and the water diversions to the West river should be improved based on the current scale of riparian oases in the lower HRB. Additionally, adequate water should be delivered within a suitable time to guarantee that the water requirements of vegetation are being met at critical growth stages [43]. Joint restoration of surface-groundwater should be conducted on natural canals to ensure higher conductivity and should be carried out mainly during the non-growing season due to the lag in groundwater replenishment and high evaporation of free water surface in the area during the growing period [37]. Overall, this study provides an integrated approach combining remote-sensing techniques and in situ measures for determining lake area and lake water consumption. In this way, much longer time series of simulation data can be obtained to reveal the actual restoration process of lake ecosystems in the study area, and the study can also provide important implications for sustainable water resources management on the basin scale in other arid endorheic basins.

5. Conclusions

The results of this study indicated that the EWDP in the HRB has effectively reallocated the surface water resources, replenished the targeted EJL, and facilitated the recovery of five other lakes in the area. EJL has gradually expanded since 2002, and the area increased by 128.3%, from 30.7 to 70.1 km2, by 2017. With the recovery of un-targeted lakes in 2003, the total lake area of the lower HRB increased to 148.2 km2 by 2017, representing a 382.6% increase. However, the project has directly led to an imbalance in the spatial distribution of lakes between the East and West rivers, resulting in approximately 90% of water volume consumed in the East river, and the terminal Swan Lake has recently increased to as large as EJL. Although administrative measures have ensured the efficient implementation of EJL, these measures have generated an increase in water consumption by the over-enlargement of the lake area, and an excess 37% of water volume has been consumed by the expansion of other un-targeted lakes, especially during the growing season. Hence, the water management strategies should be improved by integrating the East and West rivers as an integrated entity based on the current scale of the oases and the appropriate area of EJL. Moreover, water allocation should be coordinated by considering the distinguished characteristics of water used for vegetation development and for surface-water and groundwater restoration.

Supplementary Materials

The following are available online at https://www.mdpi.com/2072-4292/11/10/1164/s1, Figure S1: Coverage of Landsat data used. Table S1: Summary of annual area of each lake (km2) during 2000–2017 in the lower HRB, Table S2: Summary of annual water consumption of each lake (108 m3) during 2000–2017 in the lower HRB.

Author Contributions

Conceptualization, J.-J.Y.; methodology, Y.-C.Z. and C.-Y.D.; validation, P.W. and Y.-C.Z.; data curation, B.L.; writing—original draft preparation, B.L.; writing—review and editing, P.W. and Y.-C.Z.; supervision, P.W. and J.-J.Y.; funding acquisition, J.-J.Y.

Funding

This research was funded by the National Natural Science Foundation of China (No. 41877165, No. 41371059, No. 41671023).

Acknowledgments

We appreciate the constructive comments from two anonymous reviewers and the editor.

Conflicts of Interest

The authors declare no conflicts of interest.

References

  1. Lehner, B.; Grill, G. Global river hydrography and network routing: Baseline data and new approaches to study the world’s large river systems. Hydrol. Process. 2013, 27, 2171–2186. [Google Scholar] [CrossRef]
  2. Zhou, Y.; Li, X.; Yang, K.; Zhou, J. Assessing the impacts of an ecological water diversion project on water consumption through high-resolution estimations of actual evapotranspiration in the downstream regions of the Heihe River Basin, China. Agric. For. Meteorol. 2018, 249, 210–227. [Google Scholar] [CrossRef]
  3. Cheng, G.; Li, X.; Zhao, W.; Xu, Z.; Feng, Q.; Xiao, S.; Xiao, H. Integrated study of the water-ecosystem-economy in the Heihe River Basin. Natl. Sci. Rev. 2014, 1, 413–428. [Google Scholar] [CrossRef]
  4. Li, X.; Cheng, G.D.; Ge, Y.C.; Li, H.Y.; Han, F.; Hu, X.L.; Tian, W.; Tian, Y.; Pan, X.D.; Nian, Y.Y.; et al. Hydrological Cycle in the Heihe River Basin and Its Implication for Water Resource Management in Endorheic Basins. J. Geophys. Res. Atmos. 2018, 123, 890–914. [Google Scholar] [CrossRef]
  5. Torabi Haghighi, A.; Fazel, N.; Hekmatzadeh, A.A.; Klöve, B. Analysis of Effective Environmental Flow Release Strategies for Lake Urmia Restoration. Water Resour. Manag. 2018, 32, 3595–3609. [Google Scholar] [CrossRef]
  6. Raymond, P.A.; Hartmann, J.; Lauerwald, R.; Sobek, S.; McDonald, C.; Hoover, M.; Butman, D.; Striegl, R.; Mayorga, E.; Humborg, C.; et al. Global carbon dioxide emissions from inland waters. Nature 2013, 503, 355. [Google Scholar] [CrossRef]
  7. Wang, J.; Song, C.; Reager, J.T.; Yao, F.; Famiglietti, J.S.; Sheng, Y.; MacDonald, G.M.; Brun, F.; Schmied, H.M.; Marston, R.A.; et al. Recent global decline in endorheic basin water storages. Nat. Geosci. 2018, 11, 926–932. [Google Scholar] [CrossRef]
  8. Wurtsbaugh, W.A.; Miller, C.; Null, S.E.; DeRose, R.J.; Wilcock, P.; Hahnenberger, M.; Howe, F.; Moore, J. Decline of the world’s saline lakes. Nat. Geosci. 2017, 10, 816–821. [Google Scholar] [CrossRef]
  9. Wong, C.P.; Jiang, B.; Bohn, T.J.; Lee, K.N.; Lettenmaier, D.P.; Ma, D.; Ouyang, Z. Lake and wetland ecosystem services measuring water storage and local climate regulation. Water Resour. Res. 2017, 53, 3197–3223. [Google Scholar] [CrossRef] [Green Version]
  10. Jin-Ming, Y.; Li-Gang, M.; Cheng-Zhi, L.; Yang, L.; Jian-li, D.; Sheng-Tian, Y. Temporal-spatial variations and influencing factors of Lakes in inland arid areas from 2000 to 2017: A case study in Xinjiang. Geomat. Nat. Hazards Risk 2019, 10, 519–543. [Google Scholar] [CrossRef]
  11. Reis, V.; Hermoso, V.; Hamilton, S.K.; Ward, D.; Fluet-Chouinard, E.; Lehner, B.; Linke, S. A Global Assessment of Inland Wetland Conservation Status. BioScience 2017, 67, 523–533. [Google Scholar] [CrossRef]
  12. McJannet, D.; Hawdon, A.; Van Niel, T.; Boadle, D.; Baker, B.; Trefry, M.; Rea, I. Measurements of evaporation from a mine void lake and testing of modelling approaches. J. Hydrol. 2017, 555, 631–647. [Google Scholar] [CrossRef]
  13. Shilo, E.; Ziv, B.; Shamir, E.; Rimmer, A. Evaporation from Lake Kinneret, Israel, during hot summer days. J. Hydrol. 2015, 528, 264–275. [Google Scholar] [CrossRef]
  14. Guerschman, J.P.; Van Dijk, A.I.J.M.; Mattersdorf, G.; Beringer, J.; Hutley, L.B.; Leuning, R.; Pipunic, R.C.; Sherman, B.S. Scaling of potential evapotranspiration with MODIS data reproduces flux observations and catchment water balance observations across Australia. J. Hydrol. 2009, 369, 107–119. [Google Scholar] [CrossRef]
  15. Huang, L.; Liu, J.; Shao, Q.; Liu, R. Changing inland lakes responding to climate warming in Northeastern Tibetan Plateau. Clim. Chang. 2011, 109, 479–502. [Google Scholar] [CrossRef] [Green Version]
  16. Pekel, J.-F.; Cottam, A.; Gorelick, N.; Belward, A.S. High-resolution mapping of global surface water and its long-term changes. Nature 2016, 540. [Google Scholar] [CrossRef] [PubMed]
  17. Jingjie Yu, P.W. Relationship between Water and Vegetation in the Ejina Delta. Bull. Chin. Acad. Sci. 2012, 26, 87–93. [Google Scholar]
  18. Wang, P.; Yu, J.; Zhang, Y.; Liu, C. Groundwater recharge and hydrogeochemical evolution in the Ejina Basin, northwest China. J. Hydrol. 2013, 476, 72–86. [Google Scholar] [CrossRef]
  19. Gao, G.; Shen, Q.; Zhang, Y.; Pan, N.; Ma, Y.; Jiang, X.; Fu, B. Determining spatio-temporal variations of ecological water consumption by natural oases for sustainable water resources allocation in a hyper-arid endorheic basin. J. Clean. Prod. 2018, 185, 1–13. [Google Scholar] [CrossRef]
  20. Li, B.; Yu, J.; Du, C.; Wang, P. Research on wetland restoration process of the East Juyan Lake. Geogr. Res. 2017, 36, 1223–1232. [Google Scholar] [CrossRef]
  21. Xiao, S.; Peng, X.; Tian, Q. Climatic and human drivers of recent lake-level change in East Juyan Lake, China. Reg. Environ. Chang. 2015, 16, 1063–1073. [Google Scholar] [CrossRef]
  22. Zhou, S.; Yu, B.; Zhang, Y.; Huang, Y.; Wang, G. Water use efficiency and evapotranspiration partitioning for three typical ecosystems in the Heihe River Basin, northwestern China. Agric. For. Meteorol. 2018, 253–254, 261–273. [Google Scholar] [CrossRef]
  23. Du, C.; Sun, F.; Yu, J.; Liu, X.; Chen, Y. New interpretation of the role of water balance in an extended Budyko hypothesis in arid regions. Hydrol. Earth Syst. Sci. 2016, 20, 393–409. [Google Scholar] [CrossRef] [Green Version]
  24. Li, Y.; Zhou, J.; Kinzelbach, W.; Cheng, G.D.; Li, X.; Zhao, W.Z. Coupling a SVAT heat and water flow model, a stomatal-photosynthesis model and a crop growth model to simulate energy, water and carbon fluxes in an irrigated maize ecosystem. Agric. For. Meteorol. 2013, 176, 10–24. [Google Scholar] [CrossRef]
  25. Liu, X.; Yu, J.; Wang, P.; Zhang, Y.; Du, C. Lake Evaporation in a Hyper-Arid Environment, Northwest of China—Measurement and Estimation. Water 2016, 8, 527. [Google Scholar] [CrossRef]
  26. Sheng, Y.; Song, C.; Wang, J.; Lyons, E.A.; Knox, B.R.; Cox, J.S.; Gao, F. Representative lake water extent mapping at continental scales using multi-temporal Landsat-8 imagery. Remote Sens. Environ. 2016, 185, 129–141. [Google Scholar] [CrossRef]
  27. Frohn, R.C.; Hinkel, K.M.; Eisner, W.R. Satellite remote sensing classification of thaw lakes and drained thaw lake basins on the North Slope of Alaska. Remote Sens. Environ. 2005, 97, 116–126. [Google Scholar] [CrossRef]
  28. Mueller, N.; Lewis, A.; Roberts, D.; Ring, S.; Melrose, R.; Sixsmith, J.; Lymburner, L.; McIntyre, A.; Tan, P.; Curnow, S.; et al. Water observations from space: Mapping surface water from 25years of Landsat imagery across Australia. Remote Sens. Environ. 2016, 174, 341–352. [Google Scholar] [CrossRef]
  29. Wang, P.; Yu, J.; Pozdniakov, S.P.; Grinevsky, S.O.; Liu, C. Shallow groundwater dynamics and its driving forces in extremely arid areas: A case study of the lower Heihe River in northwestern China. Hydrol. Process. 2014, 28, 1539–1553. [Google Scholar] [CrossRef]
  30. Wang, P.; Zhang, Y.; Yu, J.; Fu, G.; Ao, F. Vegetation dynamics induced by groundwater fluctuations in the lower Heihe River Basin, northwestern China. J. Plant Ecol. 2011, 4, 77–90. [Google Scholar] [CrossRef] [Green Version]
  31. Zhang, Y.; Yu, J.; Wang, P.; Fu, G. Vegetation responses to integrated water management in the Ejina basin, northwest China. Hydrol. Process. 2011, 25, 3448–3461. [Google Scholar] [CrossRef] [Green Version]
  32. Ward, E.M.; Gorelick, S.M. Drying drives decline in muskrat population in the Peace-Athabasca Delta, Canada. Environ. Res. Lett. 2018, 13, 124026. [Google Scholar] [CrossRef]
  33. Tan, S.; Wu, B.F.; Yan, N.N.; Zeng, H.W. Satellite-Based Water Consumption Dynamics Monitoring in an Extremely Arid Area. Remote Sens. 2018, 10. [Google Scholar] [CrossRef]
  34. Hu, S.; Pan, Y.; Kang, S.; Song, Y.; Tian, C. Comparison of the ref erence crop evapotranspiration estimated by the Penman-Monteith and Penman methods in Tarim River Basin. Trans. Csae 2005, 21, 30–35. [Google Scholar]
  35. Yao, Y.; Zheng, C.; Tian, Y.; Li, X.; Liu, J. Eco-hydrological effects associated with environmental flow management: A case study from the arid desert region of China. Ecohydrology 2018, 11, e1914. [Google Scholar] [CrossRef]
  36. Si, J.; Feng, Q.; Yu, T.; Zhao, C. Inland river terminal lake preservation: Determining basin scale and the ecological water requirement. Environ. Earth Sci. 2015, 73, 3327–3334. [Google Scholar] [CrossRef]
  37. Shen, Q.; Gao, G.; Lu, Y.; Wang, S.; Jiang, X.; Fu, B. River flow is critical for vegetation dynamics: Lessons from multi-scale analysis in a hyper-arid endorheic basin. Sci. Total Environ. 2017, 603–604, 290–298. [Google Scholar] [CrossRef]
  38. Miao, L.; Liu, P.; Su, S.; Jiang, G.; Shi, T.; Shi, F.; Wang, J. Inland desert lake in recent years, Juyanhai change course and water after fish invesigation and protection measures. J. Inner. Mongolia. Agric. Univ. 2013, 34, 9–13. [Google Scholar]
  39. Zhang, M.; Wang, S.; Fu, B.; Gao, G.; Shen, Q. Ecological effects and potential risks of the water diversion project in the Heihe River Basin. Sci. Total Environ. 2018, 619–620, 794–803. [Google Scholar] [CrossRef]
  40. Zhu, Y.; Chen, Y.; Ren, L.; Lü, H.; Zhao, W.; Yuan, F.; Xu, M. Ecosystem restoration and conservation in the arid inland river basins of Northwest China: Problems and strategies. Ecol. Eng. 2016, 94, 629–637. [Google Scholar] [CrossRef]
  41. Xiao, S.C.; Xiao, H.L.; Peng, X.M.; Song, X. Hydroclimate-driven changes in the landscape structure of the terminal lakes and wetlands of the China’s Heihe River Basin. Environ. Monit. Assess. 2015, 187, 14. [Google Scholar] [CrossRef] [PubMed]
  42. Yao, Y.; Tian, Y.; Andrews, C.; Li, X.; Zheng, Y.; Zheng, C. Role of Groundwater in the Dryland Ecohydrological System: A Case Study of the Heihe River Basin. J. Geophys. Res. Atmos. 2018, 123, 6760–6776. [Google Scholar] [CrossRef]
  43. Yu, T.; Feng, Q.; Si, J.; Xi, H.; O’Grady, A.P.; Pinkard, E.A. Responses of riparian forests to flood irrigation in the hyper-arid zone of NW China. Sci. Total Environ. 2019, 648, 1421–1430. [Google Scholar] [CrossRef] [PubMed]
Figure 1. The location of the study area and distribution of lakes (i.e., East Juyan Lake (EJL), Swan Lake (SL), Monong Lake (ML), Xiala Lake (XL), West Juyan Lake (WJL) and Bage Lake (BL)) in the lower reaches of the Heihe River Basin (HRB), China. Note that LXS means Langxinshan.
Remotesensing 11 01164 g001
Figure 2. (a) Annual and (b) monthly variations in lake evaporation rate during 2000–2017.
Remotesensing 11 01164 g002
Figure 3. (a) Monthly and (b) annual variations in the area of each lake in the study area during 2000–2017.
Remotesensing 11 01164 g003aRemotesensing 11 01164 g003b
Figure 4. The spatial change in permanent lakes in 2004 (a), 2008 (b), 2011 (c), and 2015 (d).
Remotesensing 11 01164 g004
Figure 5. (a) Seasonal and (b) inter-annual variations in water consumption (WC) of each lake in the study area during 2000–2017.
Remotesensing 11 01164 g005aRemotesensing 11 01164 g005b
Figure 6. Temporal variations in annual streamflow at the Langxinshan (LXS) station and total lake area (a), and relationships between the variables (b).
Remotesensing 11 01164 g006
Table 1. Description of data types (i.e., Landsat-5 Thematic Mapper (TM), Landsat-7 Enhanced Thematic Mapper (ETM) and Landsat-8 Operational Land Imager (OLI)), band ratios, and corresponding thresholds for lake interpretation.
Data typesBand ratioThreshold
Landsat-5/TMTM1/TM43.0
Landsat-7/ETMETM1/ETM43.0
Landsat-8/OLIOLI2/OLI51.1
Table 2. Summary of data used. Available periods and data sources are given.
Data typesDetailed descriptionPeriodsData sources
Meteorological dataDaily mean air temperature, wind speed, humidityApril 1 to September 30, 2000–2017Ejina weather station
Monthly observed pan evaporation rateOctober to March, 2000–2017
Remote sensing dataLandsat-5/TM
Landsat-7/ETM
Landsat-8/OLI
2000–2017United States Geological Survey (https://glovis.usgs.gov/)
Hydrological observationRunoff at the LXS hydrological station2000–2017Wuhai water bureau
Table 3. Summary of the largest area, recovery time, perennial period (defined as ≥12 months) and storage time of all the lakes in the study area during 2000–2017. Note that storage time is the total months with lake area > 0 km2 since the commencement of the Ecological Water Diversion Project (EWDP).
RiverLakeLargest area(km2)Recovery timePerennial periodsStorage time (months)
East riverEJL70.17/20029/2003–12/2017182
SL67.79/20037/2008–12/2017140
ML4.59/2003\41
XL6.810/200312/2007–4/2011,
9/2011–12/2017
143
West riverWJL131.410/2003\15
BL3.910/200310/2012–5/2014, 10/2015–12/201785
Table 4. Summary of total annual lake area and water consumption during 2000–2017 in the study area.
YearTotal lake area (km2)Total water consumption (108 m3)
200000
200100
200230.70.13
2003175.80.37
200452.40.50
200551.70.65
2006138.50.73
2007192.00.87
2008192.01.23
2009107.21.10
2010100.01.36
201187.21.04
201293.51.13
201393.51.28
201492.91.09
201599.51.43
2016243.11.66
2017148.21.95
Average
(2002–2017)
118.61.03

