Article

How Well Can IMERG Products Capture Typhoon Extreme Precipitation Events over Southern China?

1
Key Laboratory of Environment Change and Resources Use in Beibu Gulf, Guangxi Teachers Education University, Ministry of Education, Nanning 530011, China
2
Cooperative Institute for Mesoscale Meteorological Studies, The University of Oklahoma, Norman, OK 73072, USA
3
School of Atmospheric Sciences, and Guangdong Province Key Laboratory for Climate Change and Natural Disaster Studies, Guangzhou 510275, China
4
State Key Laboratory of Hydrology-Water Resources and Hydraulics Engineering, Hohai University, Nanjing 210098, China
*
Authors to whom correspondence should be addressed.
Remote Sens. 2019, 11(1), 70; https://doi.org/10.3390/rs11010070
Submission received: 3 October 2018 / Revised: 20 December 2018 / Accepted: 21 December 2018 / Published: 2 January 2019
(This article belongs to the Special Issue Remote Sensing of Precipitation)

Abstract

:
This study assesses the performance of the latest version 05B (V5B) Integrated Multi-Satellite Retrievals for Global Precipitation Measurement (GPM) (IMERG) Early and Final Runs over southern China during six extremely heavy precipitation events brought by six powerful typhoons from 2016 to 2017. Observations from a dense network composed of 2449 rain gauges are used as reference to quantify the performance in terms of spatiotemporal variability, probability distribution of precipitation rates, contingency scores, and bias analysis. The results show that: (1) both IMERG with gauge calibration (IMERG_Cal) and without gauge correction (IMERG_Uncal) generally capture the spatial patterns of storm-accumulated precipitation with moderate to high correlation coefficients (CCs) of 0.57–0.87, and relative bias (RB) varying from −17.21% to 30.58%; (2) IMERG_Uncal and IMERG_Cal capture well the area-average hourly series of precipitation over rainfall centers with high CCs ranging from 0.78 to 0.94; (3) IMERG_Cal tends to underestimate precipitation especially the rainfall over the rainfall centers when compared to IMERG_Uncal. The IMERG Final Run shows promising potentials in typhoon-related extreme precipitation storm applications. This study is expected to give useful feedbacks about the latest V5B Final Run IMERG product to both algorithm developers and the scientific end users, providing a better understanding of how well the V5B IMERG products capture the typhoon extreme precipitation events over southern China.

1. Introduction

Extreme weather events are more and more frequent in recent decades [1,2,3,4]. In 2016, there were 12 typhoons that brought tremendous precipitation to China. In 2017, both China and United States were successively hit by a couple of tropical cyclones. In 15 days from 22 August to 5 September 2017, southern China were severely hit by three successive powerful typhoons, including the super typhoon Hato, the most violent cyclone since 1949 with maximum wind speed about 66.9 m/h above wind scale 17 (http://www.mca.gov.cn/article/yw/jzjz/zqkb/201708/20170800005628.shtml). The typhoon Hato not only brought tremendous rainfall to Guangdong province but also induced a severe storm surge to the coastal region in Guangdong province. Five adjacent provinces (i.e., Guangdong, Guangxi, Fujian, Guizhou, and Yunnan) in southern China as well as Macao and Hong Kong were affected by typhoon Hato. The typhoon Hato led to 16 deaths and $6.82 billion in direct damages over China.
Tropical cyclone usually forms over tropical and sub-tropical oceans and grows gradually with diameters ranging from 100 km to 2000 km [5,6]. It is difficult to observe such a big weather system with traditional instruments like gauge and ground-based radar. With the development of remote sensing technology, satellite has become an important platform to provide high resolution continuous observations of precipitation at large regional scale or global scale. Satellite-based quantitative precipitation estimation (QPE) products emerged in recent decades. The popular satellite QPE products include Precipitation Estimation from Remotely Sensed Information using Artificial Neural Networks (PERSIANN) [7] based on infrared (IR) sensor observations, PERSIANN-Cloud Classification System (PERSIANN-CCS) [8], the Climate Prediction Center morphing method (CMORPH) [9] based on passive microwave (PMW) sensor observations, the Tropical Rainfall Measurement Mission (TRMM) Multi-satellite Precipitation Analysis (TMPA) [10,11] based on IR and PWM sensor measurements, and Global Satellite Mapping of Precipitation project (GSMaP) [12,13,14,15] derived from IR and PMW sensor observations. These products were built upon the success of Tropical Rainfall Measuring Mission (TRMM) launched on 28 November 1997, and have been widely used in various applications like hydrology, meteorology, climate change, and other precipitation-related researches [16,17,18,19,20,21,22].
After the retirement of TRMM in 15 April 2015, satellite-based QPE entered the Global Precipitation Measurement (GPM) era. GPM was initiated by U.S. National Aeronautics and Space Administration (NASA) and Japan Aerospace Exploration Agency (JAXA) with an aim to improve the accuracy of QPE and tocover a larger area than those of TRMM [23]. Upon the success of TRMM, a new QPE product, i.e., Integrated Multi-satellitE Retrievals for GPM (IMERG), was developed and released recently. IMERG takes the advantage of PERSIANN, CMORPH, and TMPA. It provides the public with a suite of QPE products with high resolution of 10 km/30 min, including Early (Late) run multi-satellite products ~4 (12) hours after observation time, and Final Run multi-satellite product ~2.5 months after the observation month once the monthly gauge analysis is received. The latest version of IMERG is 05B (V5B) released on 1 December 2017. Lots of reports have been found to investigate the performance of PERSIANN, CMORPH, TMPA, and GSMaP in the past decade [17,21,24,25,26,27]. Recently, a lot of studies have been reported in assessing the performance of the IMERG products in previous versions [28,29,30,31,32,33,34,35,36]. Most of previous studies focused on annual, seasonal, and diurnal characteristics of IMERG products over large regions like China and Continuous United States (CONUS), or small watershed basins. Recently, a few studies evaluated the performance of latest V5B IMERG products [37,38,39,40,41]. The study by Omranian et al. (2018) investigates the error characteristics of V5B IMERG Final Run product during the historical devastating hurricane Harvey [38]. Zhang et al. (2018) evaluated the performance of V5B IMERG final run products and Version 4 (V4) Global Satellite Mapping of Precipitation (GSMaP) products during a 60-year return extreme precipitation storm on 7 May 2017 over southern China [40]. However, to our best knowledge, few efforts have been reported in assessing the performance of the V5B IMERG during typhoon-related extreme precipitation events over China.
The objective of this study is to assess the performances of V5B IMERG Early Run and Final Run products during six typhoon-related extreme precipitation events over southern China in 2016 and 2017 (Figure 1). The detailed information of these events are given in Table 1. The assessment was carried out at hourly scale with spatial resolution of 0.1 ° × 0.1 ° using graphical and statistical methods. The hourly observations from 2449 rain gauges were used as reference to quantify the performance in terms of spatiotemporal variability, probability distribution of precipitation rates, and contingency scores. In order to investigate the error source of IMERG, three types of bias (i.e., hit bias (HB), miss bias (MB), and false bias (FB)) are examined to quantify the contribution of different error sources, thus providing useful information for IMERG users and algorithm developers.
The rest of this paper is organized as follows: Section 2 describes the study region, tracks of six typhoons in this study, and available precipitation products to be evaluated. Section 3 focuses on analyzing IMERG performances characterized by spatial distribution of precipitation, hourly precipitation time-series analysis, probability of detection of precipitation, agreement and disagreement analysis. A brief summary and conclusions are given in Section 4.

2. Study Region, Data and Method
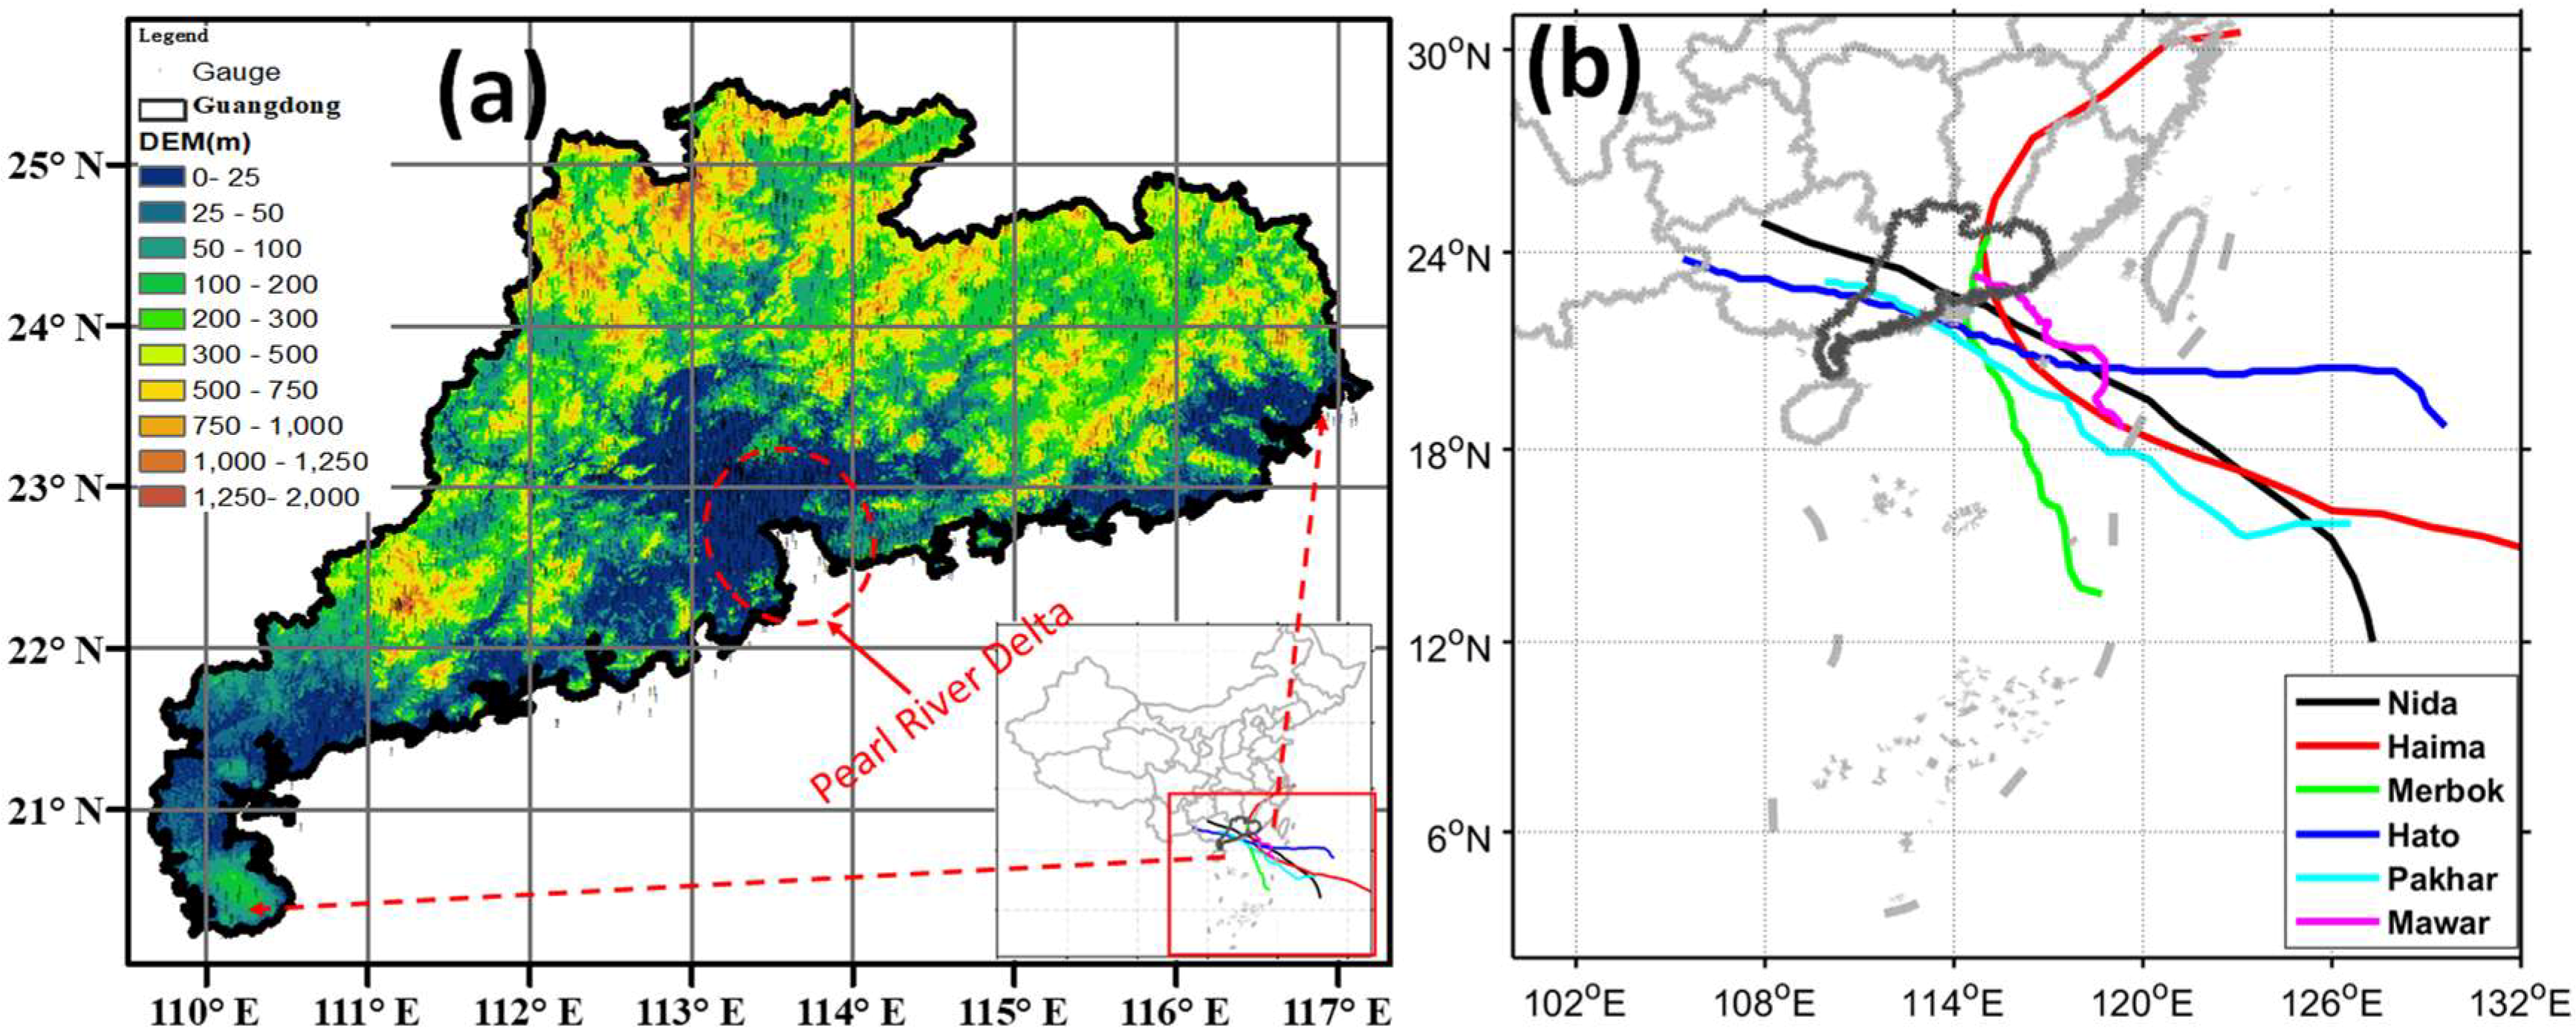
2.1. Study Region

The study region is Guangdong province located in southern China with longitude ranging from 109.66°E to 117.19°E and latitude varying between 20.30°N and 25.52°N (Figure 1a). The study region features with complex mountains and hills in the north, the northeast and the southwest, encompassing Pearl River Delta (PRD) indicated by red circle in Figure 1a. The flat PRD looks like a horn and is located in the central study region, which benefits the formation of precipitation in this area. Small flat plains scatter in coastal regions in the southwest and the northeast. Climatologically, this region is warm and humid, and suffers from massive rainfall brought by monsoon and tropical cyclones. Economically, Guangdong is the most prosperous province whose Gross Domestic Product (GDP) ranks the first among provinces in China. Guangdong, Hong Kong, and Macao composes a Greater Bay Area whose GDP exceeds 1.24 trillion USD, twice of San Francisco Bay Area. The landfall of severe typhoons, typhoon-related extreme precipitation events and storm surges usually lead to tremendously direct loss of property and lives. The economic loss in Guangdong province contributes an important share of annual cost in China due to typhoons [42]. Massive typhoons can result in employment increase and a periodic features to typhoons’ impacts on employment [43]. The tropical cyclone strikes would cause significant (negative) impact on the economic in Guangdong province [44].

2.2. Data

Observations from a dense gauge network composed of 2449 rain gauges are used as reference (Figure 1). To investigate how well the IMERG captured the spatial pattern of precipitation during six typhoon events, the hourly gauge observations were interpolated into regular gridded analysis (hereafter referred to as “GGKRIG”) using a Kriging interpolation algorithm embedded in Version 8.2 Interactive Data Language (IDL). The spherical covariance function was used to model the variogram function in the Kriging interpolation algorithm. It needs to be kept in mind that the interpolation process may add uncertainties to the gridded gauge analysis, but these uncertainties were not considered in this study. Besides, the average rain gauge measurements within an individual pixel of IMERG data are used to compare against the measurements of IMERG pixel by pixel in order to mitigate the evaluation uncertainty raised by the inhomogeneity of precipitation that may cause a non-uniform beam filling (NUBF) problem for the space-born instruments onboard satellites [45].
The publically available latest version of IMERG algorithm is V5B. The V5B IMERG Final Run product was released on 30 November 2017, and the Early and Late Runs were released on 1 December 2017. The IMERG algorithm is a unified U.S. QPE algorithm that takes advantage of three U.S. satellite-based precipitation algorithms, i.e., PERSIANN-CCS [8], CMORPH [9], and the TMPA [10,11]. It integrates precipitation measurements derived from a numbers of PMW and IR sensors onboard the satellites to produce the quasi-global satellite-only QPE products provided in the Early and Late Runs, and combines the gauge analysis to yield gauge-corrected post research product in the Final Run [46]. The IMERG system runs twice in near-real-time to produce Early (Late) Run multi-satellite products after ~4 h (12 h) observation time. Once monthly gauge analysis is received in around 2.5 months after the observation month, the Final Run product will be produced by adjusting the half-hourly multi-satellite product to the monthly gauge analysis. Two kinds of gauge analysis products were used in the adjustment, i.e., the GPCC V7 full Data Analysis from 1998 to 2013 and the GPCC V5 Monitoring Product from 2014 to present. The adjustment approach is the legacy of the gauge calibration algorithm used in TMPA for infusing monthly gauge information into the fine-scale precipitation estimates [11]. Specifically, the ratio of monthly satellite-gauge field to multi-satellite-only field is used to multiply half hourly multi-satellite-only estimates to produce gauge-corrected half hourly QPE products. The differences between the Early Run and the Final Run algorithms include: (1) the Early Run only has forward propagation primarily for extrapolation, while the Final Run has both forward and backward propagation that allows interpolation; (2) the Final Run has ~2.5 months of latency that allows lagging data to be used in the Final run, even if these were not available for the Early Run; (3) the Early Run adopts trailing approach of rotation calibration of PMW with GPM Combined Radar-Radiometer (CORRA, using GMI and DPR), while the Final Run utilizes the centered approach; (4) surface pressure, surface temperature, and related humidity provided by Japan Meteorological Agency (JMA) forecasts are used in Early Run while those provided by European Centre for Medium-range Weather Forecasting (ECMWF) analysis are used in the Final Run; (5) the Early Run is calibrated to the Final Run with climatological coefficients that vary by month and location, while the Final Run is adjusted to the monthly gauge analysis following the TMPA approach; (6) different error functions for the individual satellite estimates are calculated using data over a three-month period, the trailing for the Early Run but centered on the target month for the Final Run. More details can be found in the IMERG Technical Documentation [47] and the release notes in V5B IMERG Final Run Release Notes at https://pmm.nasa.gov/sites/default/files/document_files/IMERG_FinalRun_V05_release_notes-rev3.pdf.
In this study, the Early Run satellite-only IMERG products (IMERG_ERUncal, hereafter) and the Final Run satellite-only and gauge-corrected IMERG products (IMERG_FRUncal and IMERG_FRCal, respectively, hereafter) are evaluated by comparing against the gauge observations. For fair comparison, the half hourly IMERG products were accumulated to hourly rainfall to match the temporary resolution of gauge observations. The readers need to keep in mind that the change of temporal resolution from half hourly to hourly may affect the accuracy of satellite data. Thus the results in this study are of hourly scale. Additionally, the gauges used in this study may not be completely independent from the gauges used in IMERG, because there are approximately 25 out of the total 2449 gauges used in the GPCC.

2.3. Statistics Metrics

To quantitatively assess the performance of IMERG products, several commonly used skill scores are used for quantitative analysis. These skill scores include Bias, Relative Bias (RB), Root-Mean-Squared Error (RMSE), Correlation Coefficient (CC), Probability of Detection (POD), False Alarm Ratio (FAR), Critical Success Index (CSI), Hit Bias (HB), Miss Bias (MB), False Bias (FB), standard deviation (SD) of difference (SDD) between IMERG and gauge observations, relative SD (RSD), agreement index (AI) (Gebregiorgis et al., 2018). The Bias is the deviation of IMERG from gauge observations. The RB is dimensionless and used to measure the deviation of IMERG from gauge observations in percentage when it is multiplied by 100. The POD, CSI and FAR can be computed based on the number of hits (H), false alarms (F), and misses (M) shown in the contingency Table 2. The POD, CSI and FAR are used to measure IMERG’ contingency scores. The AI measures the magnitude of agreement between IMERG and gauge observations. Additionally, HB, MB and FB are defined as the components of bias between gauge and IMERG. More detailed definition of these metrics can be found in Table 3.

3. Results

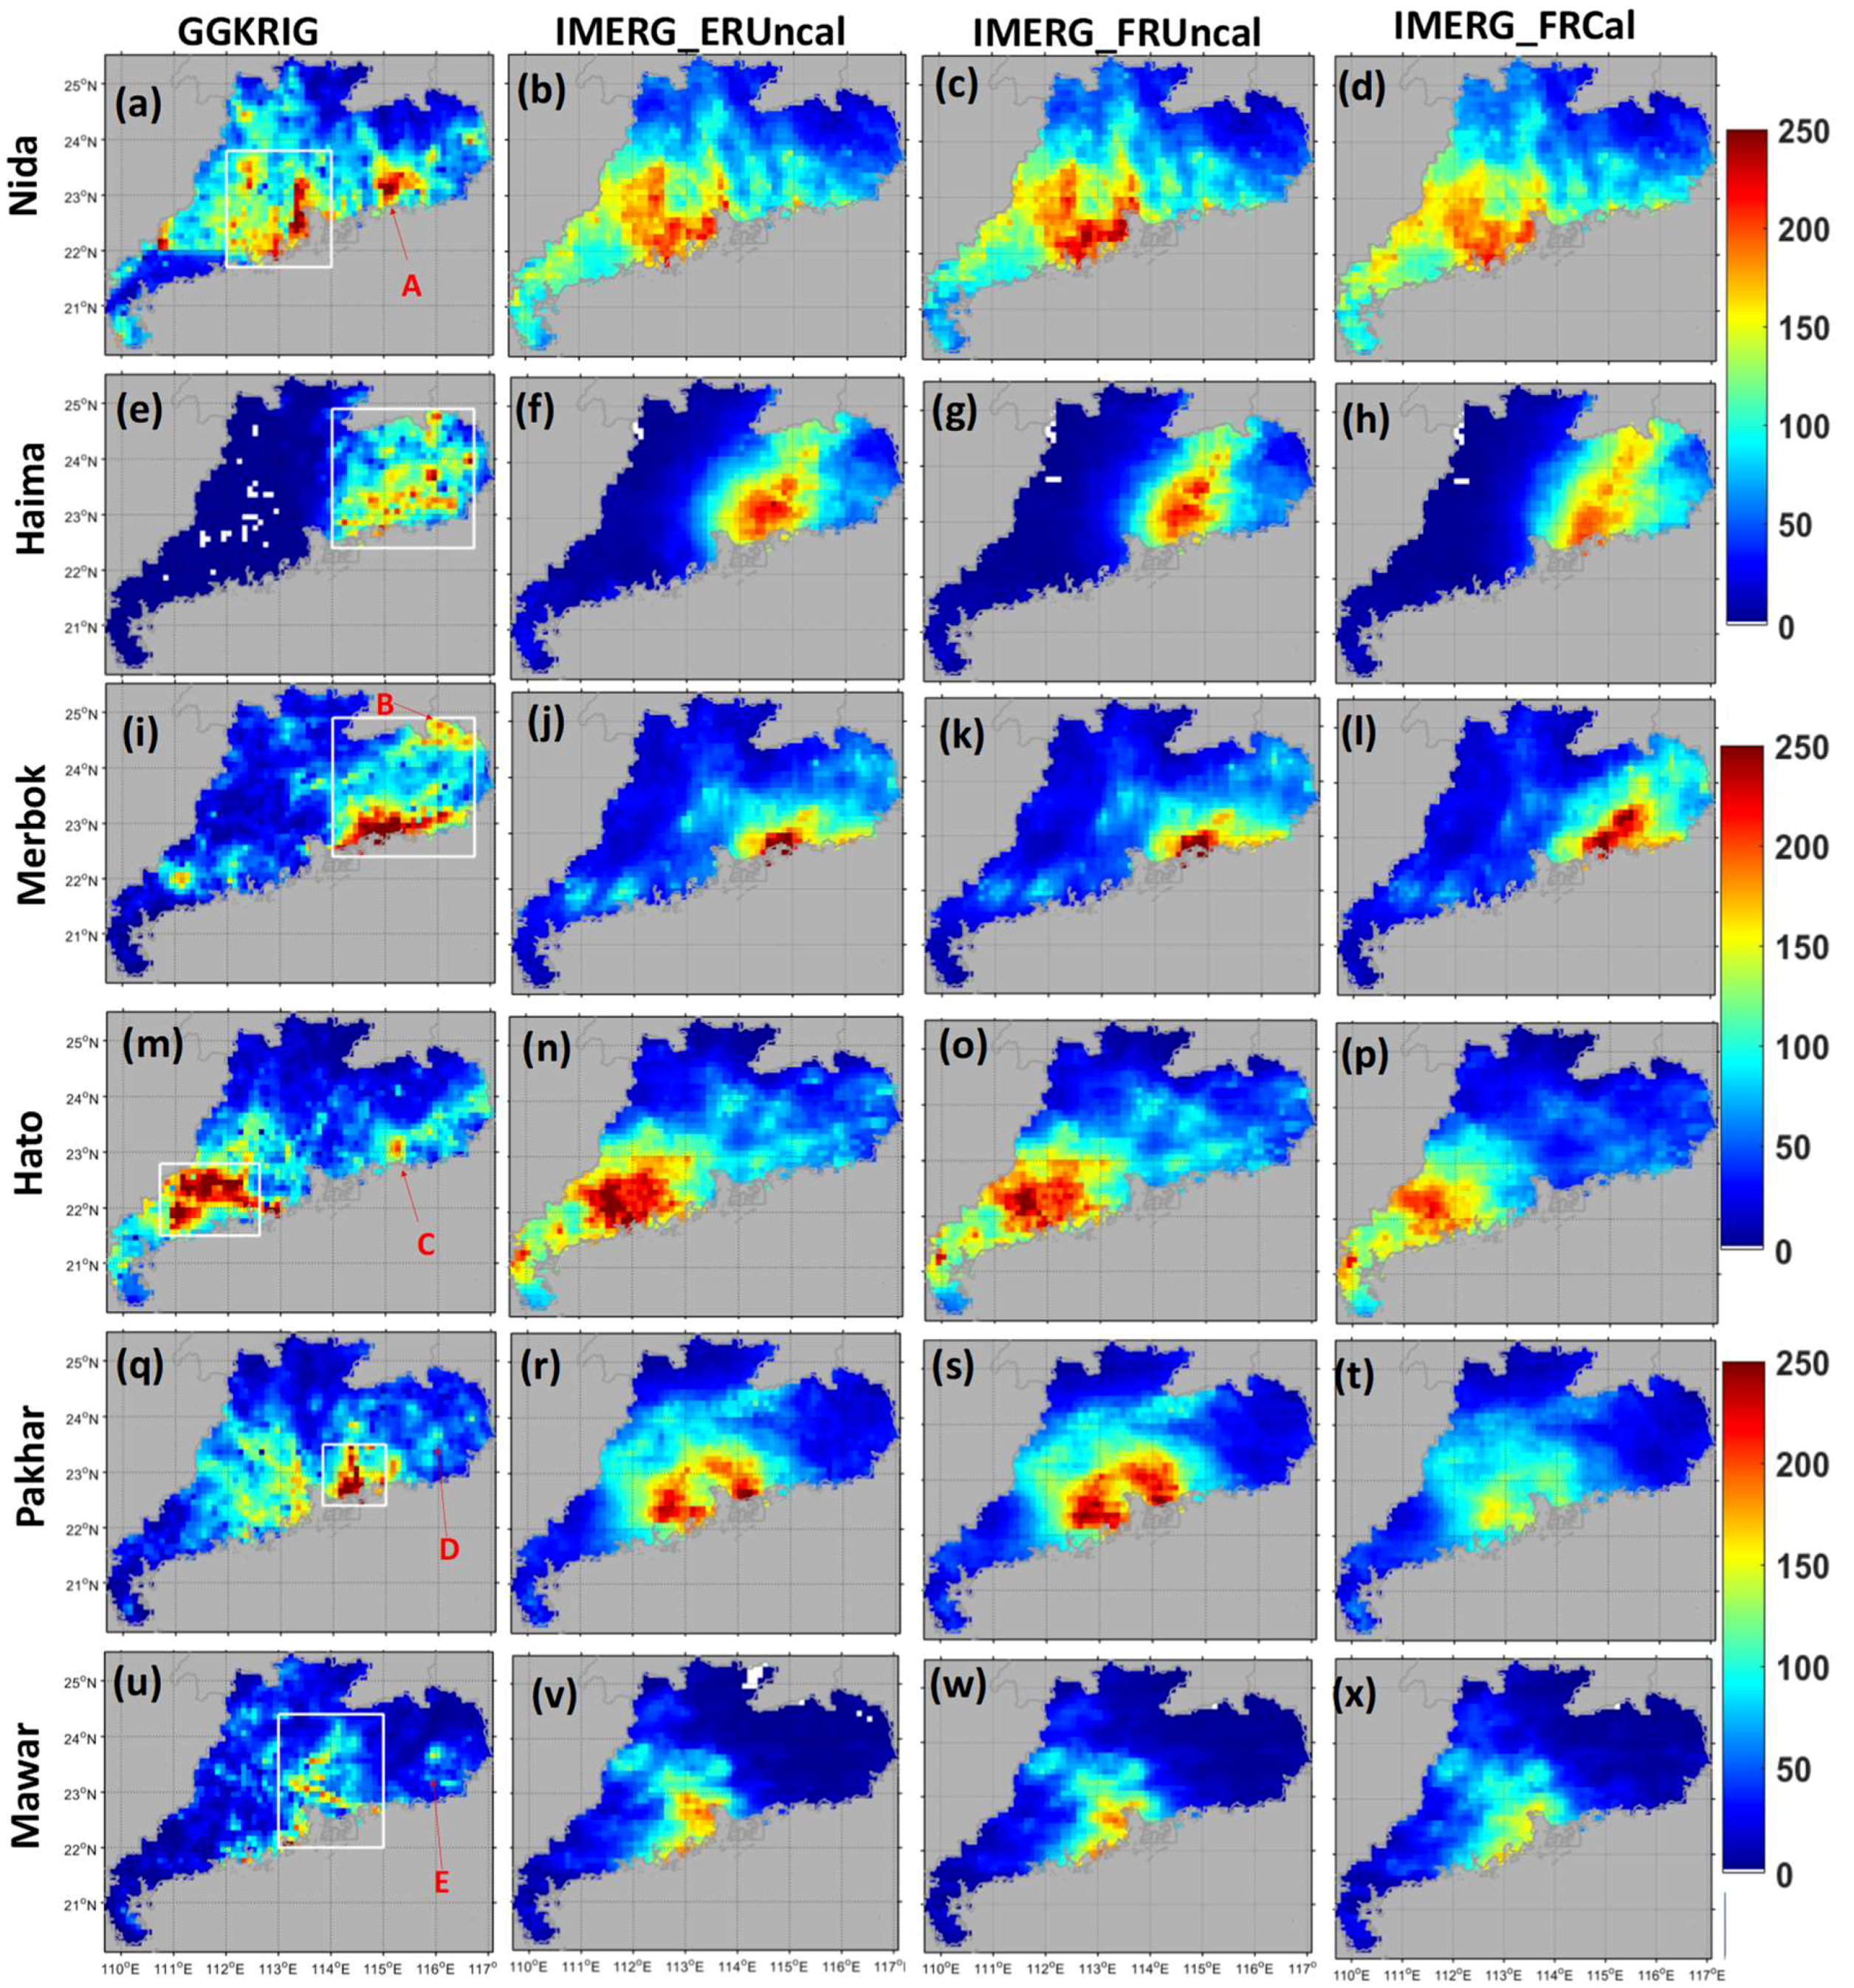
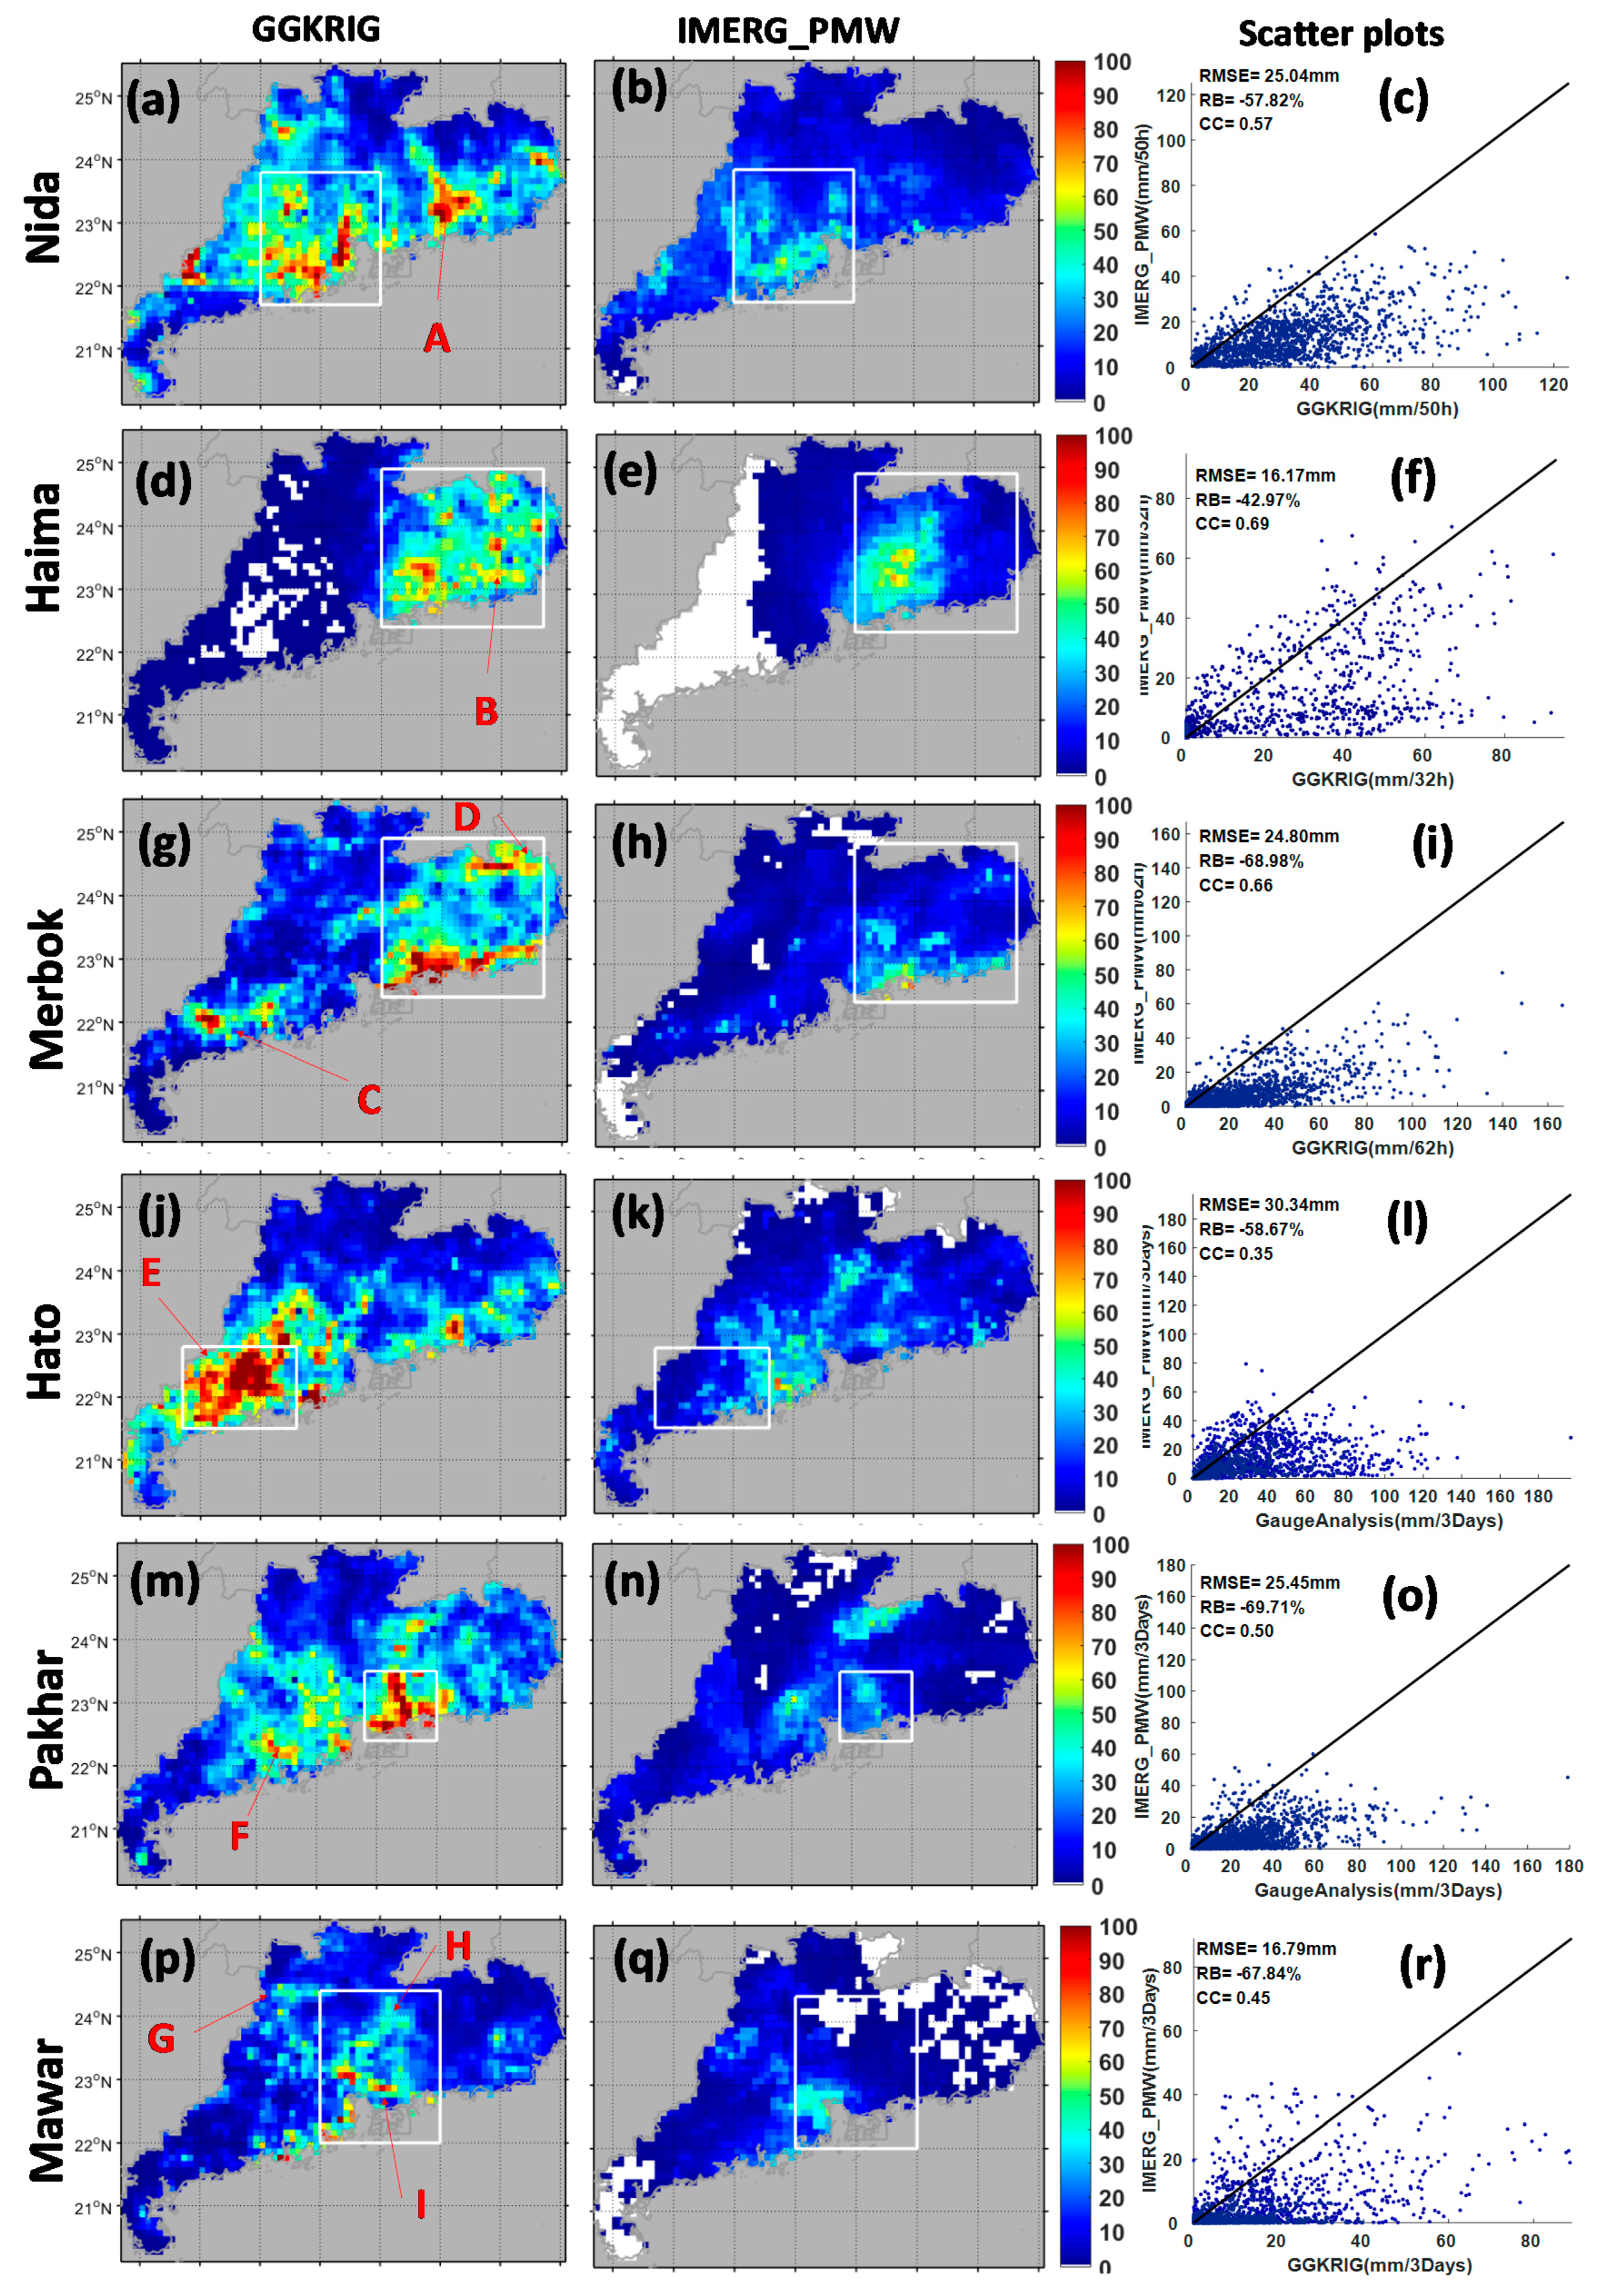
3.1. Spatial Analysis

Figure 2 shows the spatial distributions of accumulated rainfall from GGKRIG, IMERG_ERUncal, IMERG_FRUncal and IMERG_FRCal during six typhoon events. Spatially, GGKRIG shows pronouncedly detailed texture alignment of precipitation while the precipitation of IMERG products varies smoothly from low precipitation area to intensive precipitation area. Overall, all three IMERG products generally capture the spatial pattern of the precipitation depicted by GGKRIG over Guangdong province, but fail to capture some local orographic maxima indicated by red letter A in Figure 2a, B in Figure 2i, C in Figure 2m, D in Figure 2q. Compared with the typhoon tracks and the terrains as shown in Figure 1, this could be explained as follows. Firstly, warm rain accretion process dominates typhoon rainfall after landfall in China [48]. Secondly, the tremendous wet air masses brought by typhoons interacted with the local mountains in the upward side to produce shallow orographic rainfall. This type of rainfall system tends to be underestimated by PWM algorithm due to weak ice scattering signature [49]. As for IMERG_ERUncal, it shows similar spatial patterns and a little lower precipitation intensities when compared to IMERG_FRCal. After careful investigation, it is found that the Early Run and the Final Run IMERG products contain the same sources of PMW sensors, identical high quality (HQ, i.e., PMW-only) precipitation and IR-only precipitation, but have different IR Kalman filter weights during the six typhoon-related precipitation events. This indicates that the calibration of PMW with CORRA and the auxiliary data like JMA and ECMWF have no impact on the PMW-only and IR-only precipitation. Therefore, the differences between IMERG_ERUncal and IMERG_FRUncal are likely due to the fact that backward propagation algorithm was not used in IMERG_ERUncal and thus no weighting average between two consecutive microwave overpasses is applied. In contrast, IMERG_FRUncal utilizes both backward and forward propagation components at the expense of a little larger data latency (~8 h). This suggests that location and intensity of the precipitation events could be more accurately captured with additional measurements from the next microwave overpass. It is noted that IMERG_FRCal demonstrates lower accumulated rainfall than the other two IMERG satellite-only QPE products, especially during typhoon Pakhar and Mawar. Previous studies by [25,50,51] report that the gauge correction approach used in TMPA often fails to produce compatible rainfall intensities with local gauge observations during extreme precipitation events, indicating that the gauge correction approach used in IMERG still suffers from similar limitations and shortcomings. Similar findings about this gauge correction algorithm over complex topography during heavy rainfall events can be found in studies by Dinku et al. and other literatures [25,27,50,52].
Quantitatively, the scatter plots in Figure 3 show that both IMERG_ERUncal and IMERG_FRUncal tend to overestimate the accumulated precipitation except for typhoon Merbok and Mawar. The statistic indexes indicate that IMERG products, either Early Run or Final Run, have different behaviors. This is likely due to complicated typhoon structures, atmospheric structures, different paths, inherent spatio-temporal inhomogeneity of precipitation, and the complicated terrains in Guangdong province. Generally, IMERG_FRUncal has similar but better performance than IMERG_ERUncal with higher CC (0.59~0.82), smaller RMSE (44.83 mm~33.95 mm), and smaller absolute RB (−17.34%~17.33%). In particular, during typhoon Haima, IMERG_FRUncal shows better skills in estimating rainfall with distinctly higher CC (0.77 vs. 0.72), lower RB (15.32% vs. 30.97%), and smaller RMSE (37.34 mm vs. 42.33 mm). This confirms the positive merits of backward propagation algorithm used in IMERG Final Run process. For the gauge-corrected IMERG_FRCal, it demonstrates similar skills of CC and RMSE with IMERG_FRUncal, but generally tends to underestimate the storm-accumulated precipitation with RB ranging from −7.21% to 30.58%. It is noted that the absolute RBs of IMERG_FRCal are overall smaller than IMERG_ERUncal and IMERG_FRUncal, suggesting the effectiveness of gauge-correction in reducing deviation of satellite-only rainfall estimates from the observations. Besides, this also confirms the limitation of gauge-correction algorithm during extreme precipitation events using monthly gauge analysis in IMERG Final Run as the aforementioned.
To better understand the comprehensive performance of these three products, Figure 4 shows Taylor diagrams to visualize the statistics summary of how well the three IMERG products agree with the observations (GGKRIG) in terms of CC, RMSE, and standard deviation. The Taylor diagram was proposed by Taylor to provide a visual framework of summarizing multiple aspects of model performance related to reference (observations) [53]. The closer the model to the reference, the better the model. It is found that IMERG_FRCal has the best performance during typhoon Haima, Hato, Pakhar, and Mawar, and shows a little worse but close performance with IMERG_ERUnal and IMERG_FRUncal. IMERG_FRUncal performs better than IMERG_ERUncal in all typhoons except for typhoon Pakhar in which IMERG_FRUncal shows very close performance with IMERG_ERUncal.
To further investigate the error sources of IMERG products, Figure 5 shows the spatial distribution of accumulated PMW-only estimates for IMERG (IMERG_PMW) and corresponding GGKRIG as well as the scatter plots between IMERG_PMW and GGKRIG during six typhoon-related rainfall events. It is noted that the IMERG_PMW significantly underestimated the precipitation, especially the rainfall center denoted by white rectangles (e.g., the center of rainfall during typhoon Hato shown in Figure 5j–k). Additionally, some local precipitation maxima related to orographic effects as arrowed by red letter A-I in Figure 5 are poorly detected and estimated by IMERG_PMW. In particular, IMERG_PMW shows no precipitation in southwestern Guangdong province while the gauges do during typhoon Haima. The scatter plots imply that the IMERG_PMW underestimated rainfall to a great extend from 42.97% to 69.71%, and poorly correlated with gauge observations with low CC less than 0.6 except typhoon Haima and Merbok. Figure 6 shows the hourly availability of PMW sensor observations over Guangdong province. It can be seen that most of the time (Nida: 54%; Haima: 43.75%; Merbok: 46.77%; Hato: 45.83%; Pakhar: 40.28%; Mawar: 45.83%) there is no precipitation derived from microwave sensor observations for IMERG for all six events. According to the IMERG algorithm, the IR-based precipitation is used to fill the area where there is no high quality PMW precipitation during these time slots. Thus it can be included that the lack of PMW sensor observations, the limitation of PMW-based precipitation as well as the shortcomings of IR-based precipitation are attributed to the performances of IMERG_ERUncal and IMERG_FRUncal during these six typhoon-related events.
Figure 7 illustrates the spatial distribution of IR-based precipitation used in the IMERG Early and Final runs. It is noted that the IR precipitation component used in the Final Run estimated much less than that in the Early Run especially during typhoon Mawar. As aforementioned, both the Early and Final Runs have identical PMW-only estimates and IR- based precipitation estimates, but have different IR Kalman filter weights. This indicates that: (1) different axillary data (JMA and ECMWF) and different approaches of calibration of PMW with CORRA did not exert any impact on the PMW-only and IR-only precipitation estimates; (2) the IR Kalman filter weights yielded by the forward propagation in Early Run are different from those produced by the forward and backward propagation in the Final run. In other words, IMERG_FRUncal integrated more PMW-only precipitation than IMERG_ERUncal during these typhoon-related precipitation events.

3.2. Hourly-Series Rainfall

Hydrologic cycle is greatly affected by temporal variation of precipitation. Flash flooding, landslides, and other hydro-related hazards are usually triggered by heavy precipitation over a short time period. Figure 8 and Figure 9 show the plots of area-average hourly-series rainfall over Guangdong province and rainfall centers denoted in white rectangles in Figure 2 during six typhoon-related precipitation events. It needs to be kept in mind that only the grids that are overlapped with at least one gauge are taken into account to compute the hourly-series precipitation. It is noted that different typhoons have different number of precipitation peaks, which is likely attributed to the complicated typhoon structures and atmospheric environments. Generally, both the Early Run and the Final Run IMERG product are able to capture the temporal variation of rainfall with gauge observations in all events with high CC > 0.7. Additionally, the temporal variation patterns of IMERG_ERUncal (IMERG_FRUncal, IMERG_FRCal) over the rainfall centers are similar to those over the whole Guangdong province. This indicates the precipitation over rainfall centers is the primary contribution to the total precipitation over Guangdong province. It is worth noticing that IMERG significantly overestimated the peak precipitation than gauge observations in all events except Typhoon Merbok. This is likely attributed to the fact that the half-hourly IMERG does not actually present half-hourly average rain rates, but rather a kind of quasi-instantaneous precipitation rate at some instantaneous moment during the half hour period when the satellite overpasses. Besides, it can be seen that IMERG_FRCal generally shows better agreement with the gauge observations during the rainfall peaks by significantly reducing the overestimations over rainfall centers especially during typhoon Hato and Pakhar. But IMERG_FRCal shows significant overestimation during typhoon Haima. This indicates that the gauge-correction algorithm with monthly gauge analysis in the Final Run still has limitations to conduct bias adjustment to the satellite-only QPE products.

3.3. Probability Distribution by Occurrence

Figure 10 depicts the Probability Distribution as a Function (PDF) of rain rates by occurrence for gauge observations and the IMERG products during six heavy rainfall events. Only the grids that were overlapped with at least one gauge are used to compute PDF. Overall, all IMERG products underestimated the light precipitation (<0.6 mm/h) and overestimated the light to moderate precipitation in 0.6–6 mm/h. IMERG_ERUncal has close PDF with IMERG_FRUncal, and detected more light precipitation occurrences that IMERG_FRUncal. This is likely attributed to the fact that both forward and backward morphing algorithms were applied in the Final Run while only forward morphing algorithm was implemented in the Early Run.

3.4. Analysis of Bias

The bias between IMERG products and the gauge observations is quantified in terms of arithmetic difference, and relative bias (difference) as shown in Figure 11. All of the IMERG products show underestimation and overestimation in different typhoon events. The Final Run gauge-corrected product IMERG_FRCal show smaller magnitude of RB ranging from −10.75% to 32.45%, and its counterpart satellite-only product IMERG_FRUncal has RB varying from −14.79% to 20.28%. The Early Run satellite-only product IMERG_ERUncal shows larger magnitude of RB ranging from −14.79% to 34.39%, indicating higher bias levels than the Final Run IMERG products.
To further investigate the sources of bias, the total bias was decomposed into three components: HB, MB, and FB. As shown in Figure 12, the FB is the primary component that contributes most to the total bias during all events. It is noted that the MB and FB are significantly reduced in the Final Run when compared to the Early Run for all events. This suggests the positive effectiveness of the backward morphing algorithm applied in the Final Run data processing. In addition, it can be seen that IMERG_FRCal tends to have negative HB, and both IMERG_FRCal and IMERG_FRUncal are inclined to have larger magnitude of HB than IMERG_FRCal. This implies that the success of forward and backward morphing algorithm in the Final Run may be at the expense of increasing HB.

3.5. Contingency Analysis

Contingency analysis usually uses POD, FAR and CSI to quantify the performance of QPE products and precipitation forecast (QPF) products. Figure 13 shows the overall contingency scores for rainy event detection with 0 mm/h to separate rainy and non-rainy events. The IMERG_FRUncal and IMERG_FRCal have the same POD, FAR and CSI. This is because the IMERG_FRCal is obtained by multiplying IMERG_FRUncal with a scale factor which does not change IMERG_FRUncal’s capability of detecting rainy events. Additionally, it is noted that both of them have higher POD and CSI but lower FAR than IMERG_ERUncal does. This once again confirms the positive effectiveness of forward and backward morphing algorithm in the Final Run on improving the rainy event detection.
For further contingency analysis, Figure 14 shows the contingency scores of different precipitation products as a function of different precipitation rates with interval of 1 mm/h. It is clearly shown that both IMERG_FRUncal and IMERG_FRCal have higher POD and CSI than IMERG_ERUncal when rain rates are less than 10 mm/h, and IMERG_ERUncal and IMERG_FRUncal demonstrate higher POD and CSI than IMERG_FRCal when rain rates are greater than 10 mm/h. Also, it can be found that IMERG_FRUncal and IMERG_FRCal demonstrate distinctly lower FAR than IMERG_ERUncal when rain rates are less than 35 mm/h, and IMERG_FRCal has higher FAR than other two satellite-only products. This indicates these IMERG products have different skills in detecting precipitation. Also, this confirms that the gauge-correction with monthly gauge analysis in the Final Run processing leads to reducing high rain rates. Overall, the Final Run IMERG products outperform the Early Run IMERG product IMERG_ERUncal.

3.6. Analysis of Agreement and Disagreement Statistics

The agreement between IMERG and the gauge observations is quantified using Pearson’s Correlation Coefficient (CC) and agreement Index (AI) (Figure 15). Both IMERG_FRUncal and IMERG_FRCal show close CC ranging from ~0.4 to 0.63, and moderate to high AI (0.6 to 0.75), and demonstrate pronouncedly higher CC and AI than IMERG_ERUncal. Low CC and AI values are reported during typhoon Mawar and Merbok. This re-confirms that the Final Run IMERG products benefit from the forward and backward morphing algorithm which can help improve precipitation estimation over the forward-only morphing algorithm applied in the Early Run.
The disagreement between IMERG and the gauge observations is assessed using standard deviation of differences (SDD) between IEMRG and gauge observations and relative SDD (RSD) (Figure 15c,d). It is noted that IMERG_ERUncal has evidently higher SDD than the Final Run IMERG products whose SDD are close to each other for most of events except Hato and Pakhar. Overall, IMERG_FRCal shows a little lower SDD than IMERG_FRUncal except Nida and Merbok. Regarding of RSD, Figure 15d depicts that the range of RSD is 2 to 5 times of the average rain rate during each storm. Both of IMERG_FRUncal and IMERG_FRCal demonstrates close RSD to each other, and lower RSD than IMERG_ERUncal does. Generally, in terms of RSD, IMERG_FRCal performs best, IMERG_ERUncal is ranked second, and IMERG_ERUncal performs worst. This may be likely linked to the forward and backward morphing algorithm and the gauge-correction algorithm implemented in the Final Run.

4. Summary and Conclusions

This study evaluated the V5 IMERG precipitation products during six typhoon extreme rainfall events aiming to provide the IMERG end users and algorithm developers with further insights on their accuracies when compared to the ground gauge observations. Both the Early Run and the Final Run IMERG products were selected for evaluations: the Early Run satellite-only IMERG_ERUncal, the Final Run satellite-only IMERG_FRUncal and gauge-corrected IMERG_FRCal. Due to the high spatio-temporal resolution which is expected to have great potentials of hydrologic utilization, the evaluation was conducted at the native spatial resolution of 0.1 ° × 0.1 ° at hourly scale during six typhoon extreme precipitation events over Guangdong province in southern China. The observations from the dense gauge network composed of 2449 gauges were used as independent reference for evaluating the IMERG products. Spatial distribution of storm-accumulated precipitation, time series rainfall, probability distribution, and contingency scores, bias decomposition, and the degree of agreement are analyzed in this study. The main conclusions based on the six typhoon-related storm cases are summarized as follows:
(1).
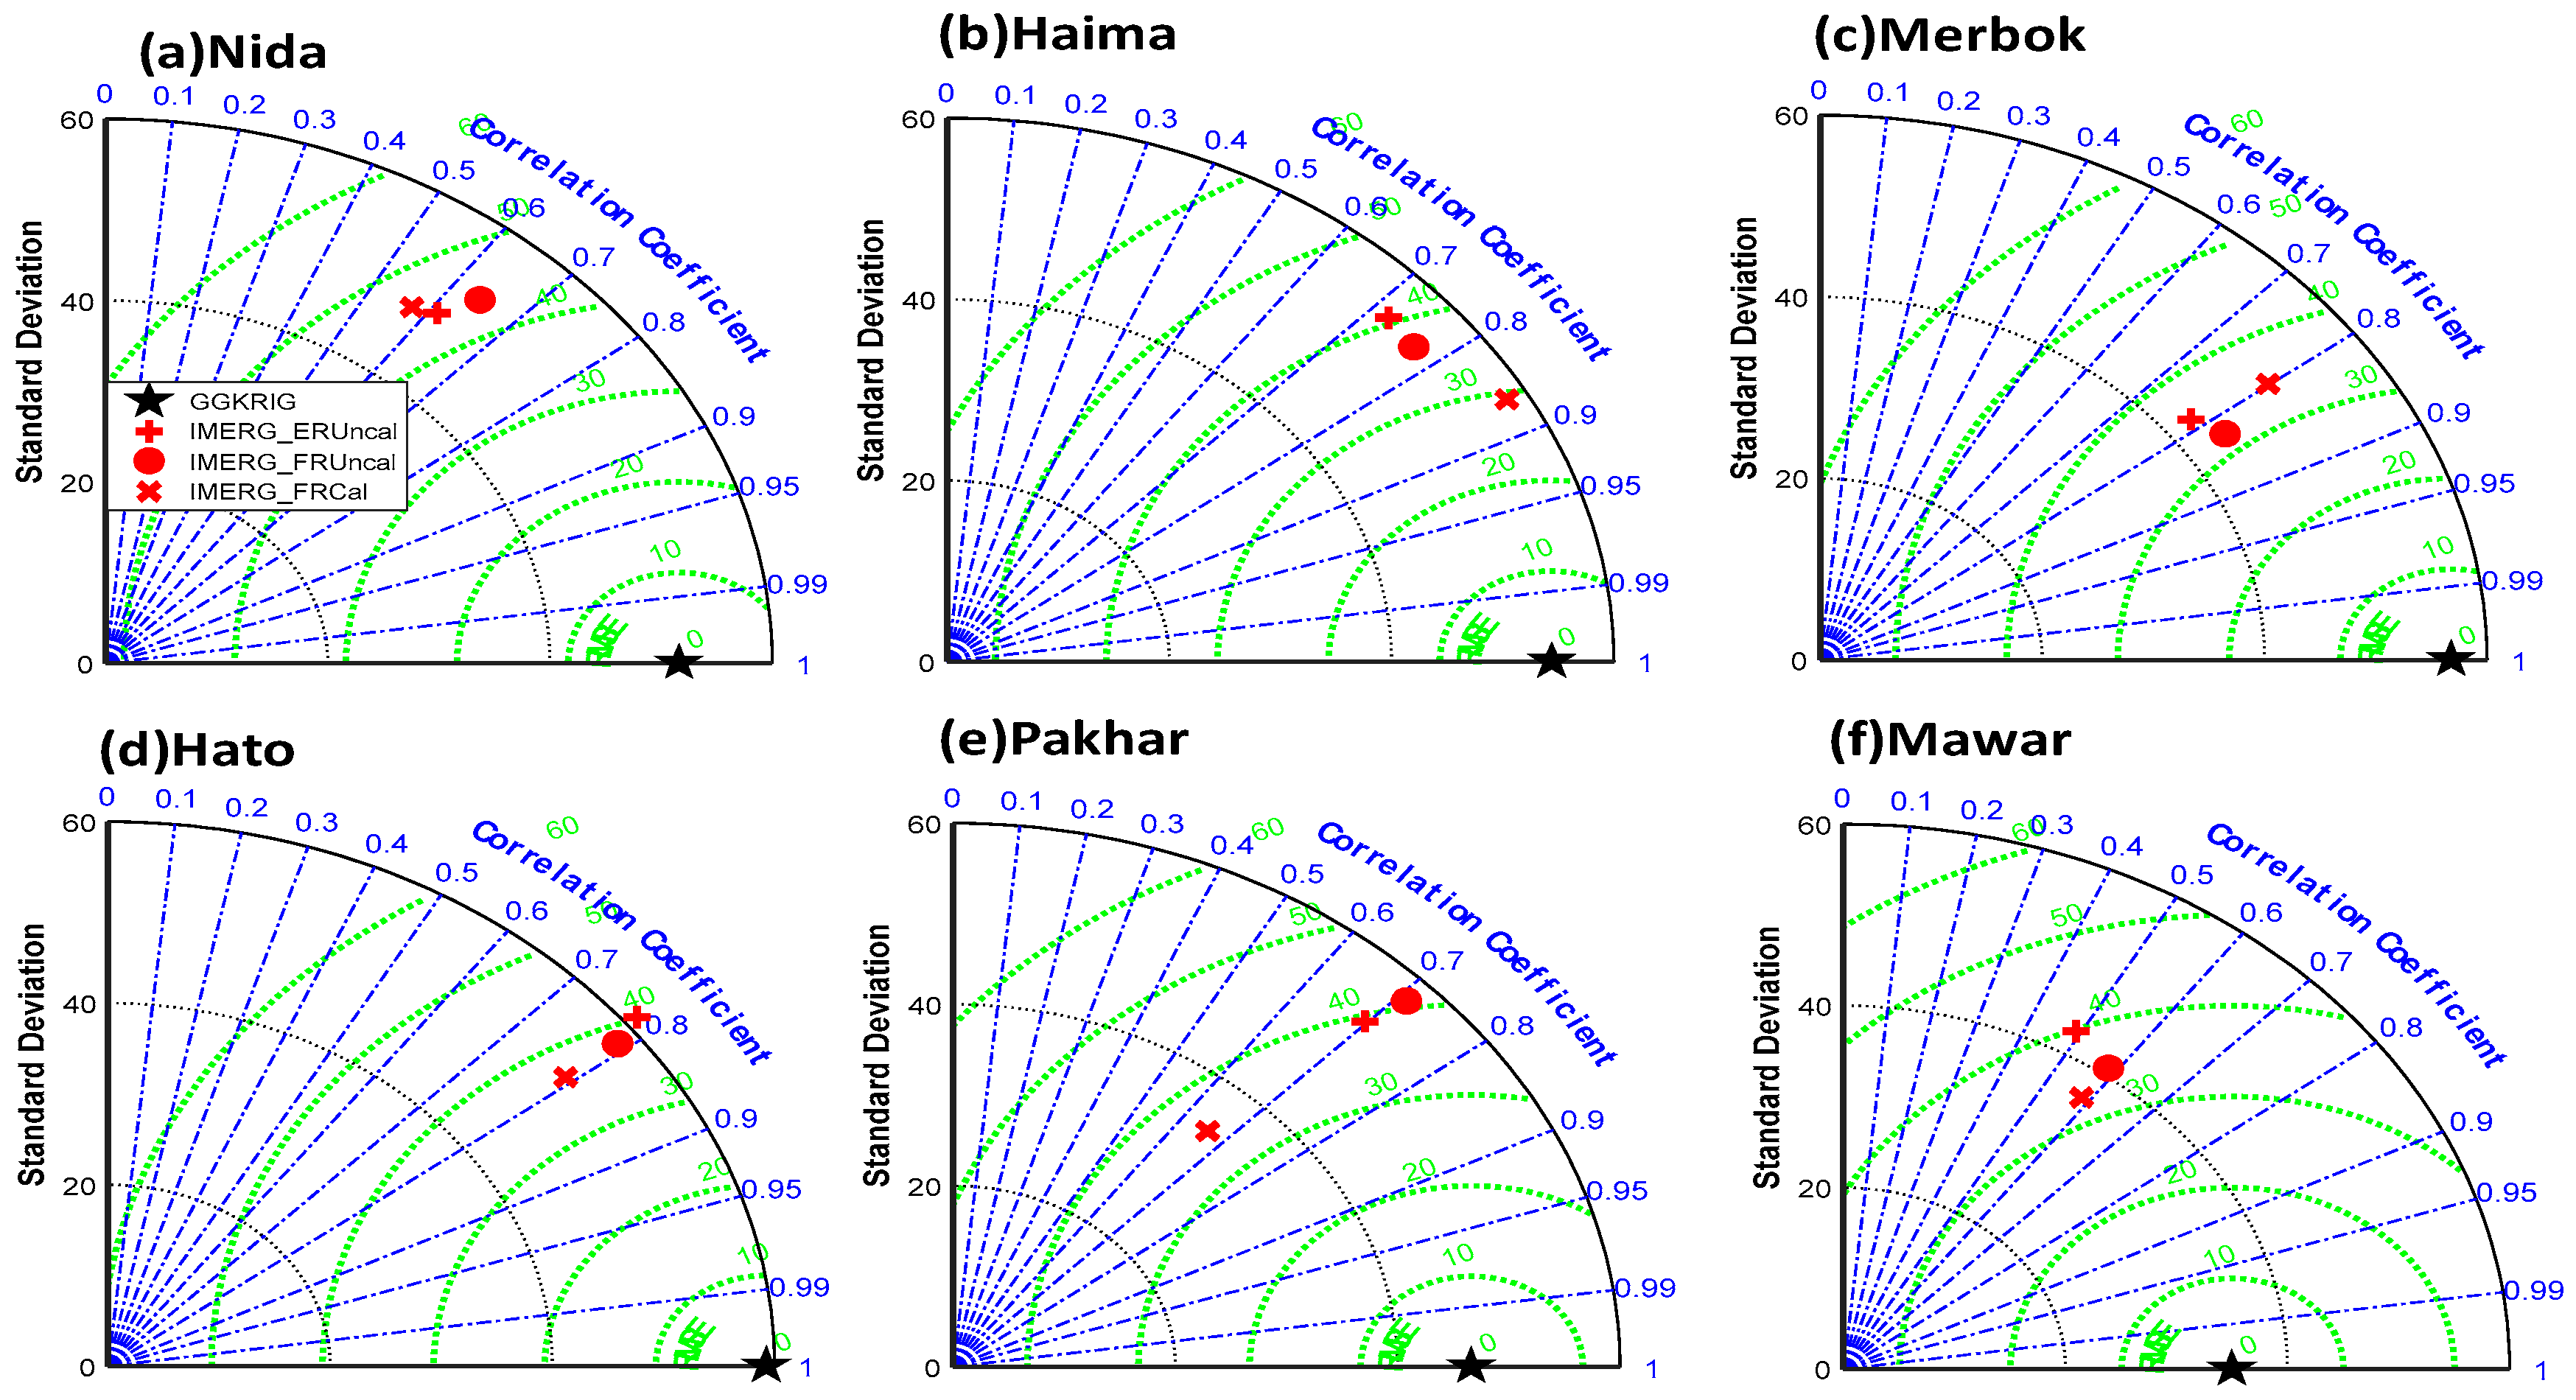
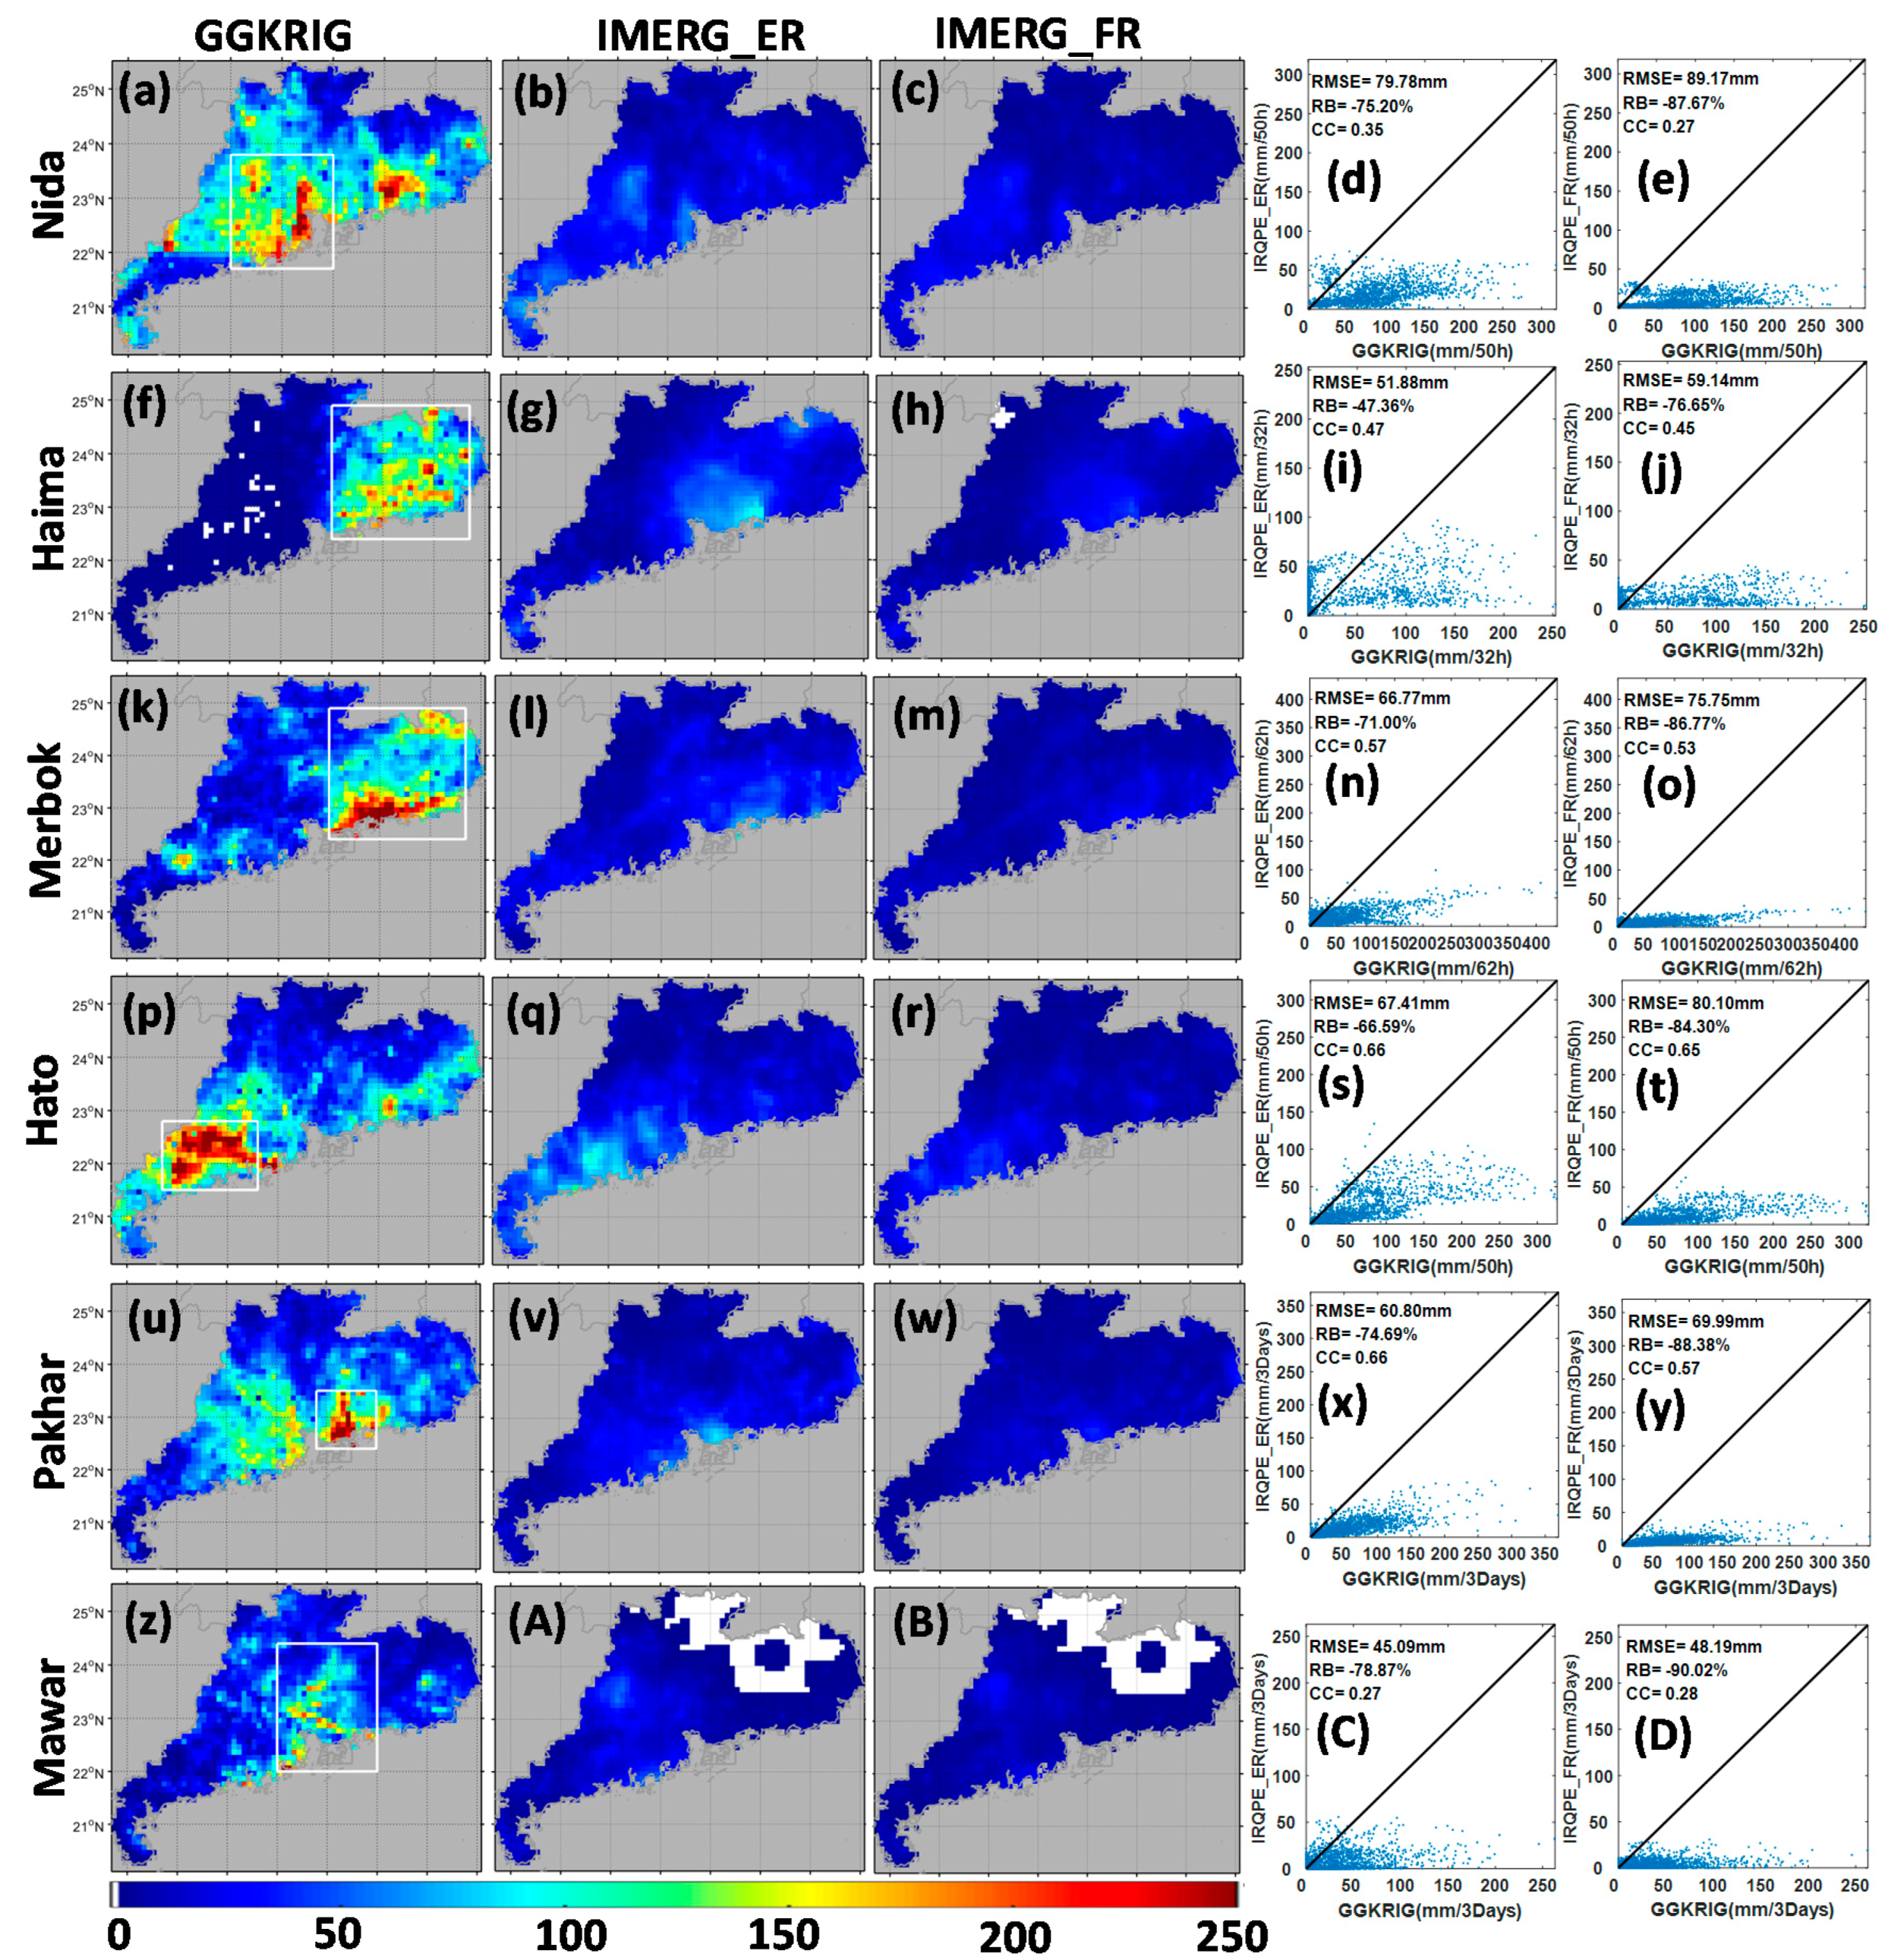
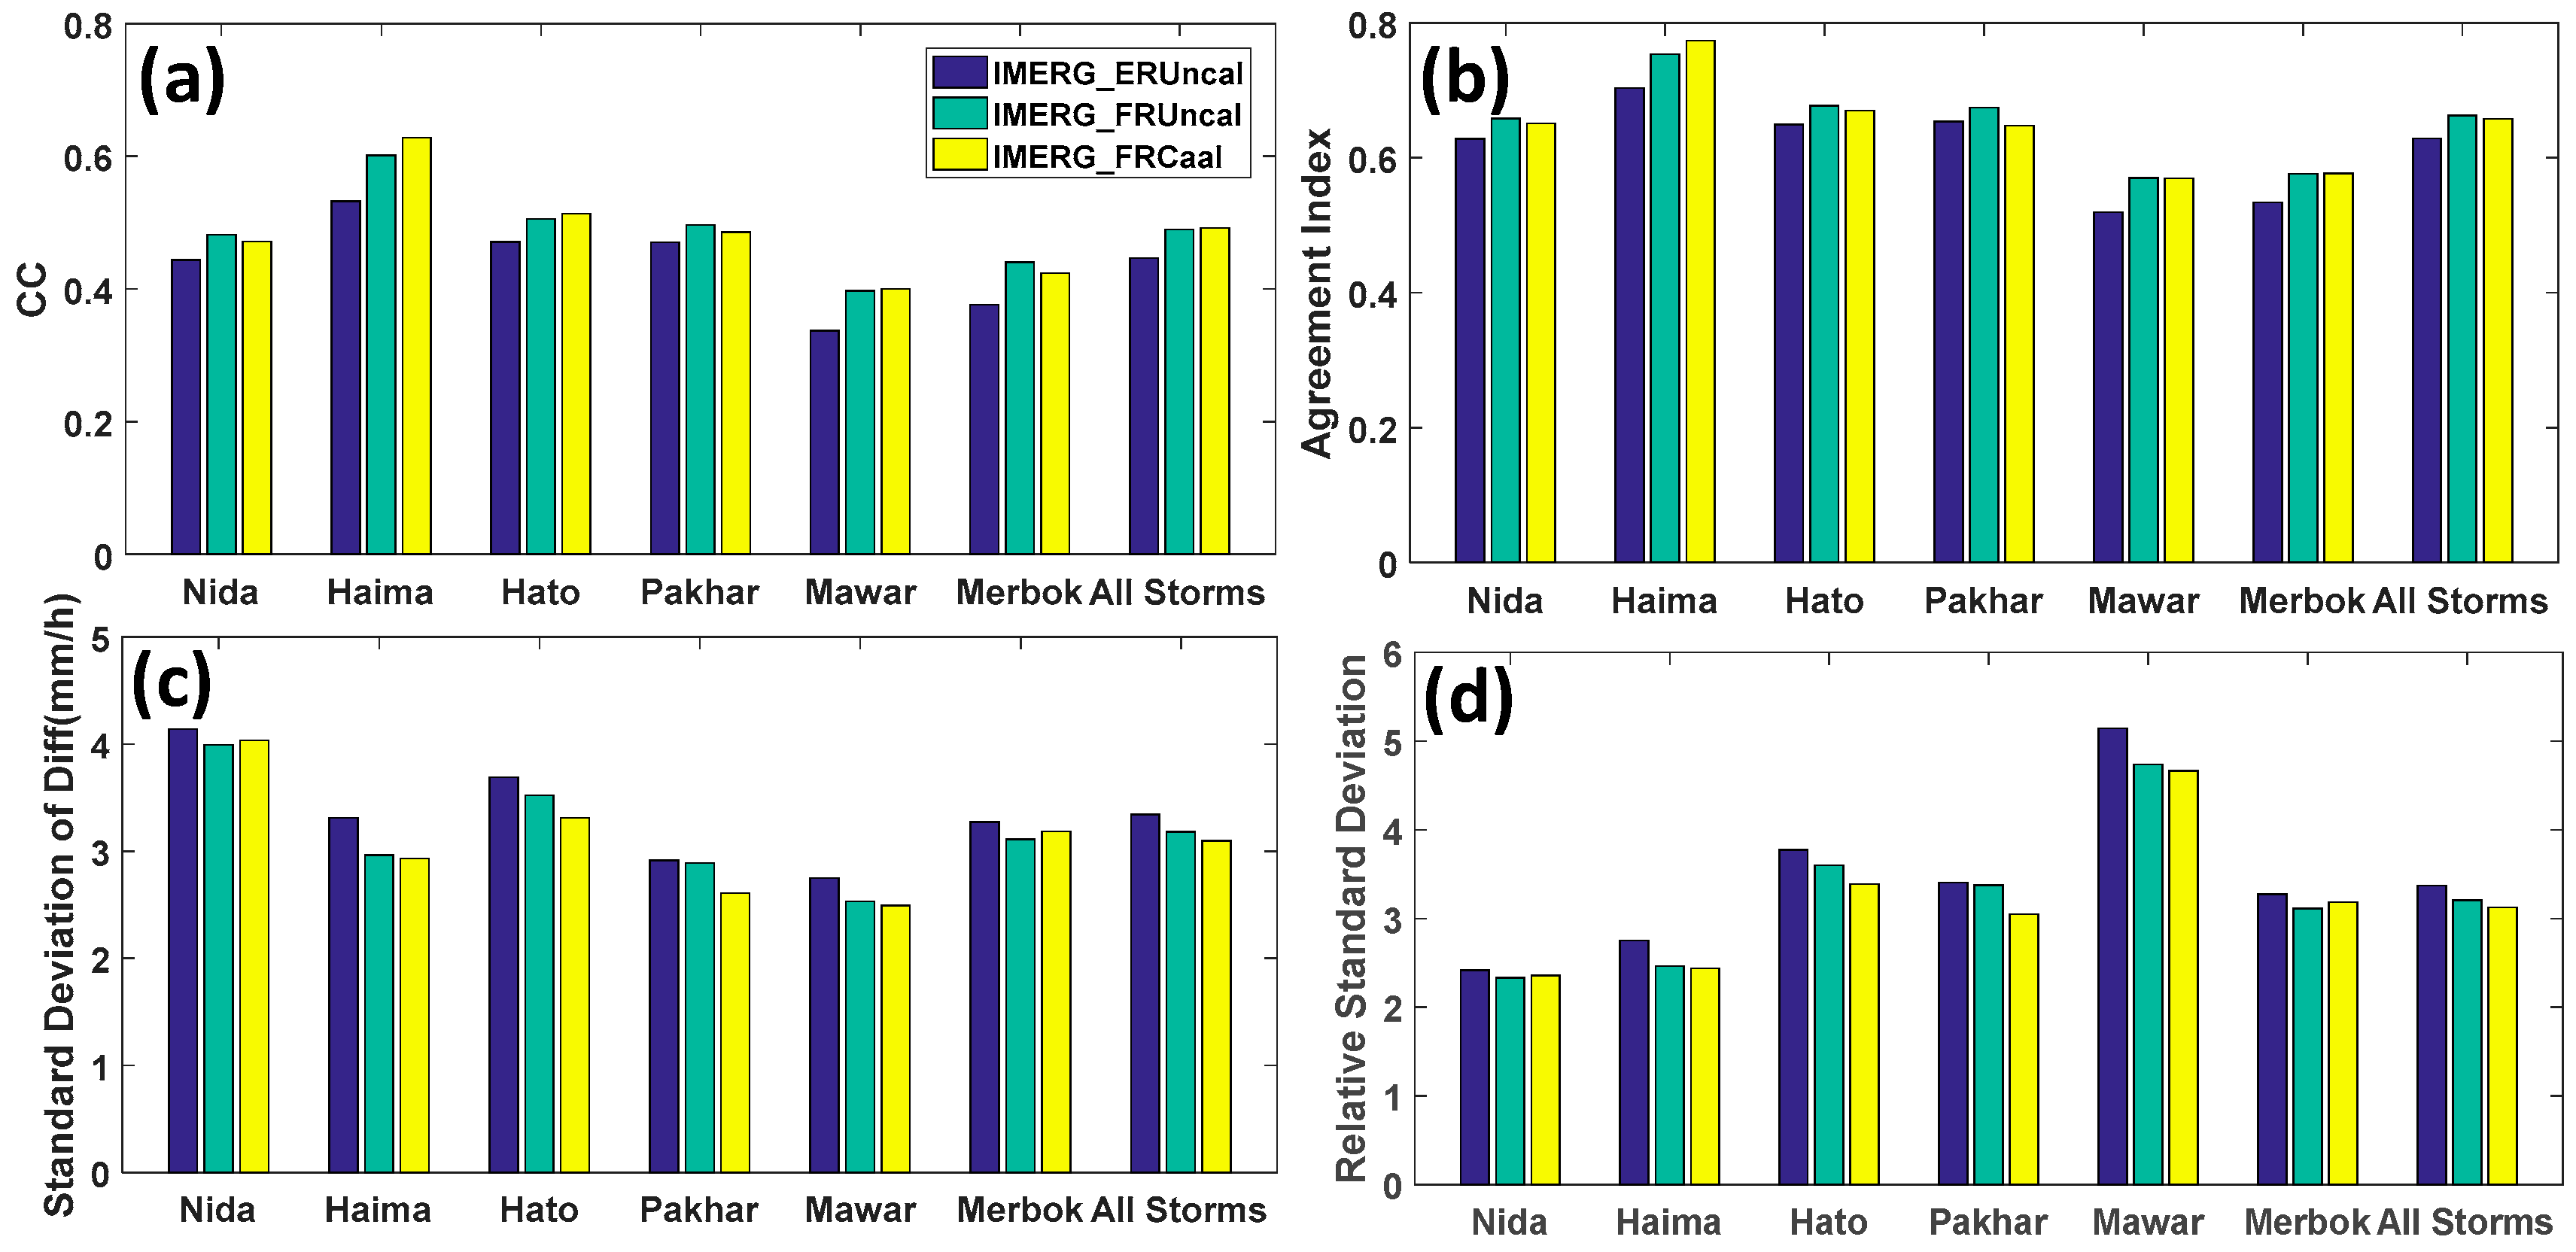
IMERG products, either the Early Run or the Final Run, generally capture the spatiotemporal variability of precipitation with moderate to high CCs (0.6 to 0.87) for most of events except Mawar in which IMERG_ERUncal has low CC about 0.49 (Figure 2), and with RB ranging from −15.27% to 42.55%, and RMSE ranging from 31.58 mm to 47.50 mm (Figure 1).
(2).
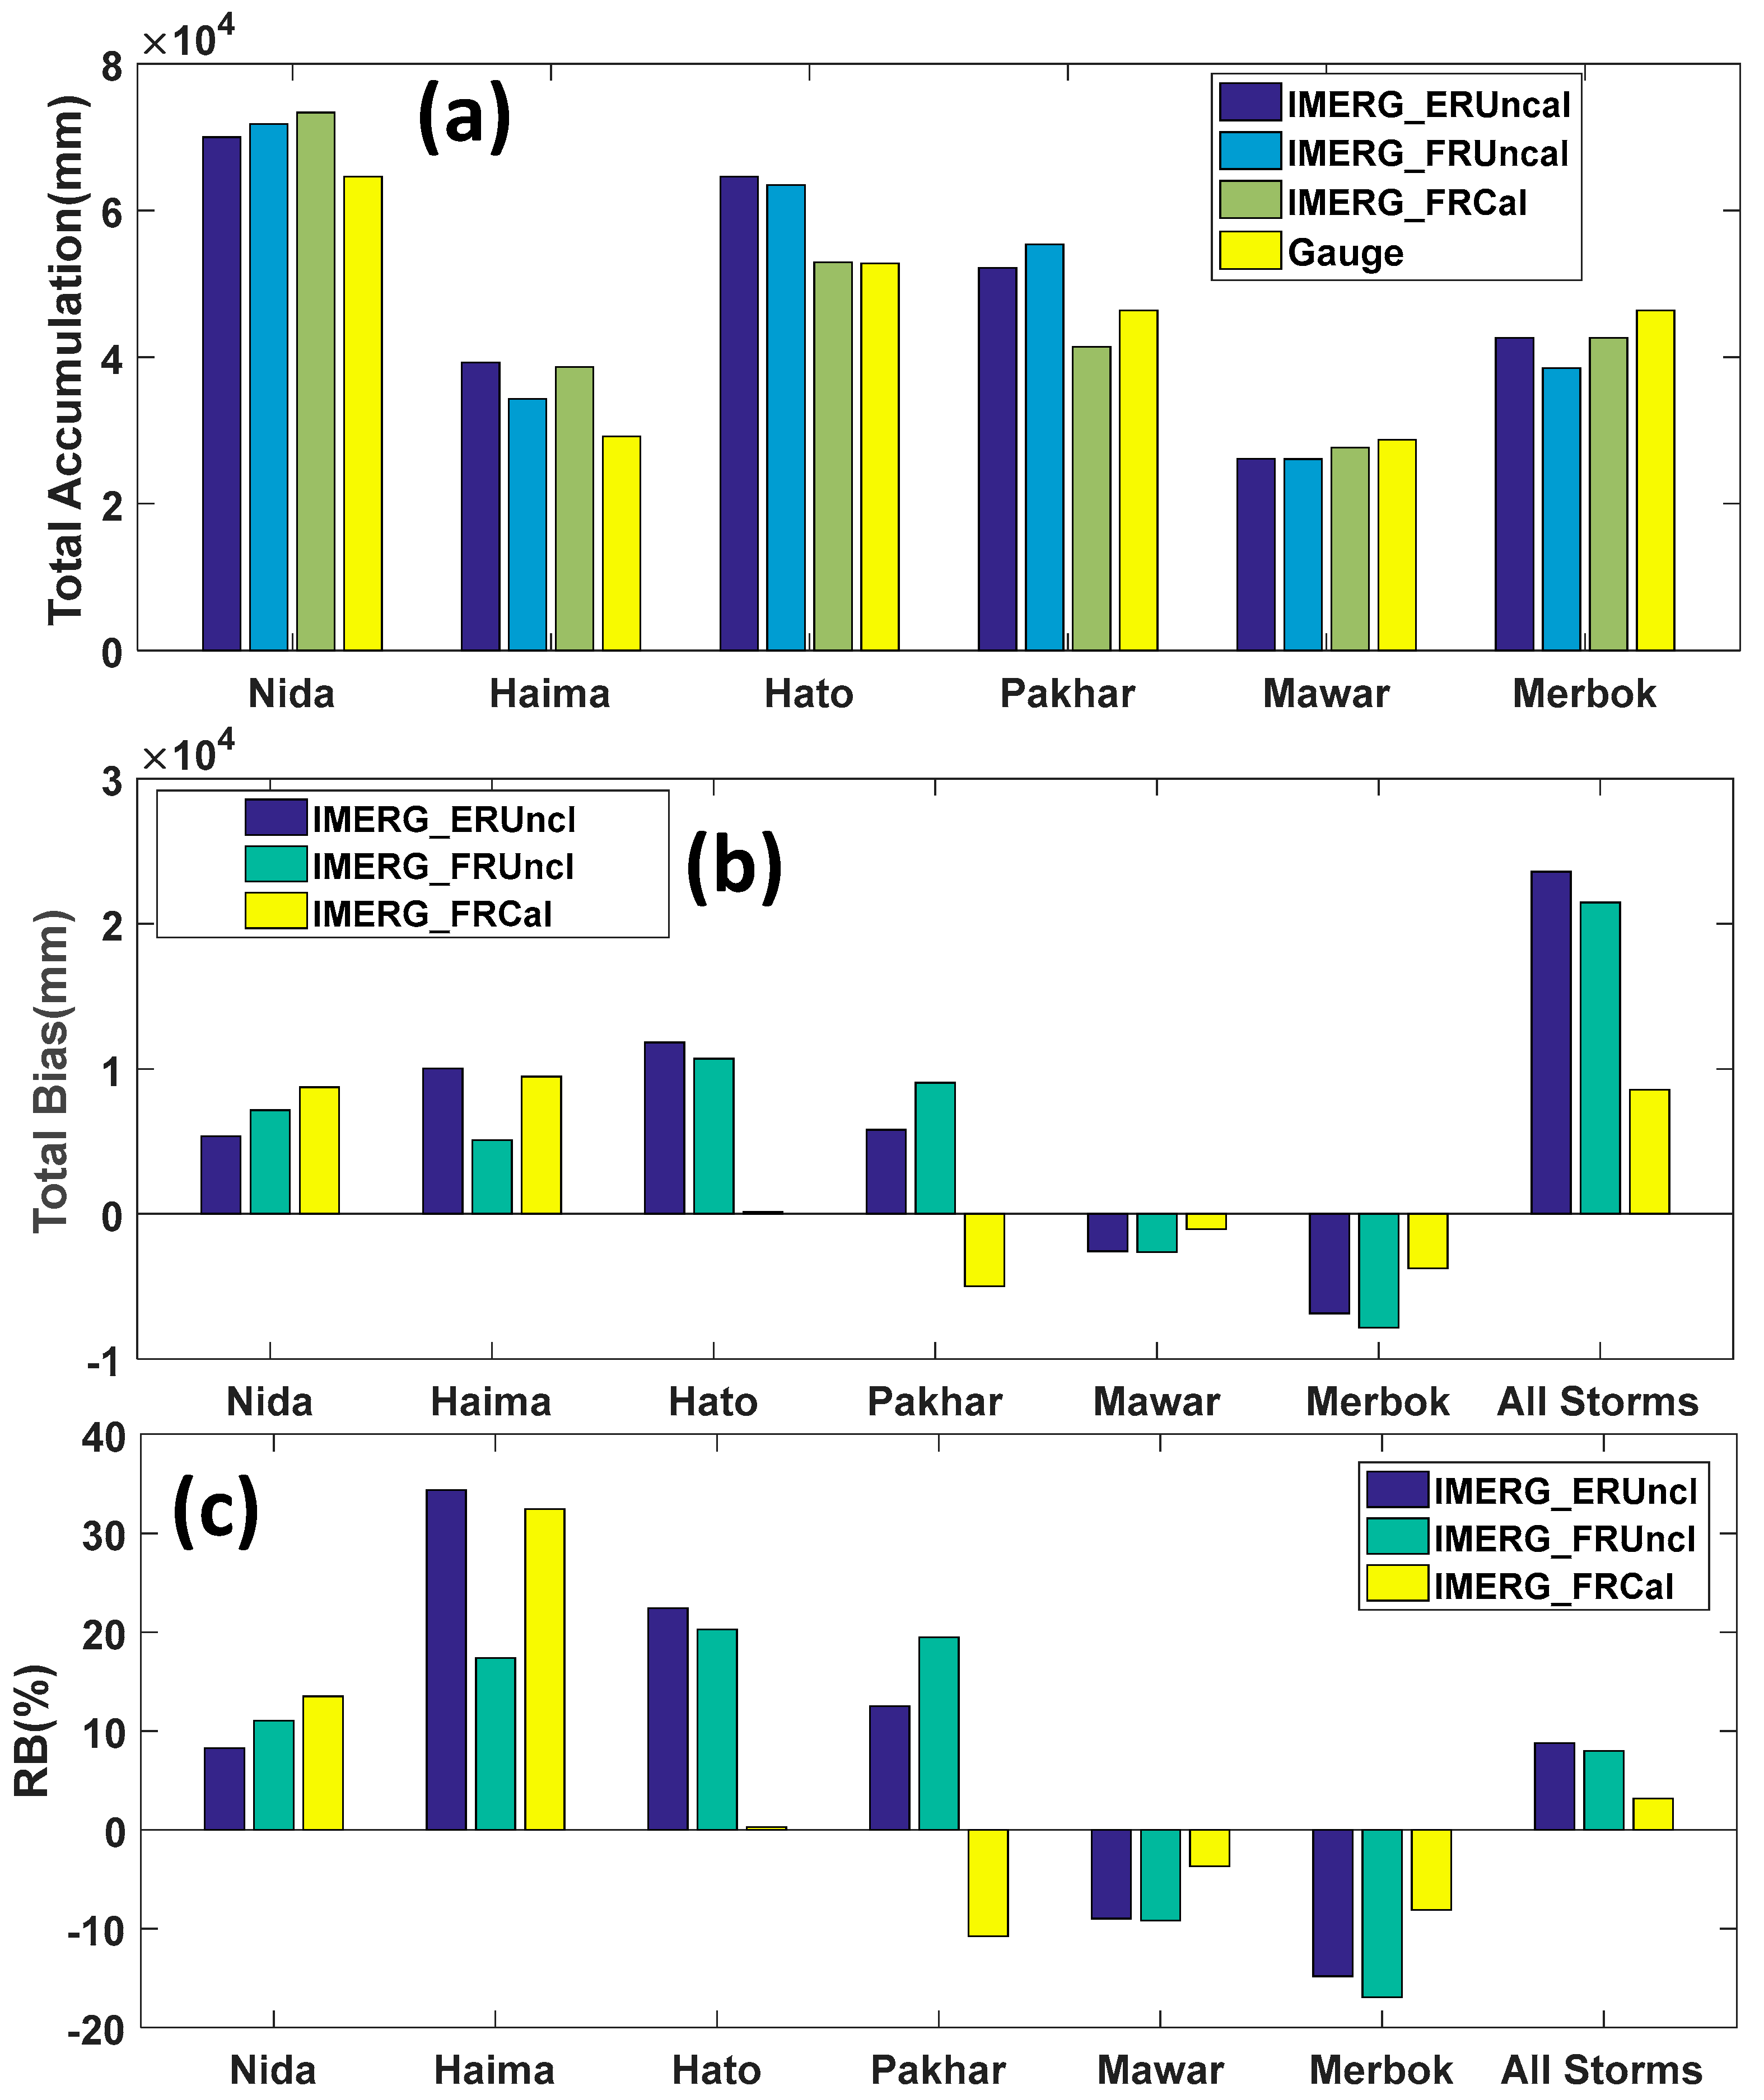
Overall, the IMERG products track reasonably well the temporal variation of the area-average hourly precipitation over Guangdong (with high CCs from 0.78 to 0.93) and rainfall centers (with high CCs from 0.74 to 0.94) during six typhoon-related events. All IMERG products tend to overestimate the peak rainfall especially IMERG_ERUncal overestimates the most. IMERG_FRUncal overestimated less than IMERG_ERUncal. IMERG_FRCal shows best agreement with gauge observations (Figure 7 and Figure 8).
(3).
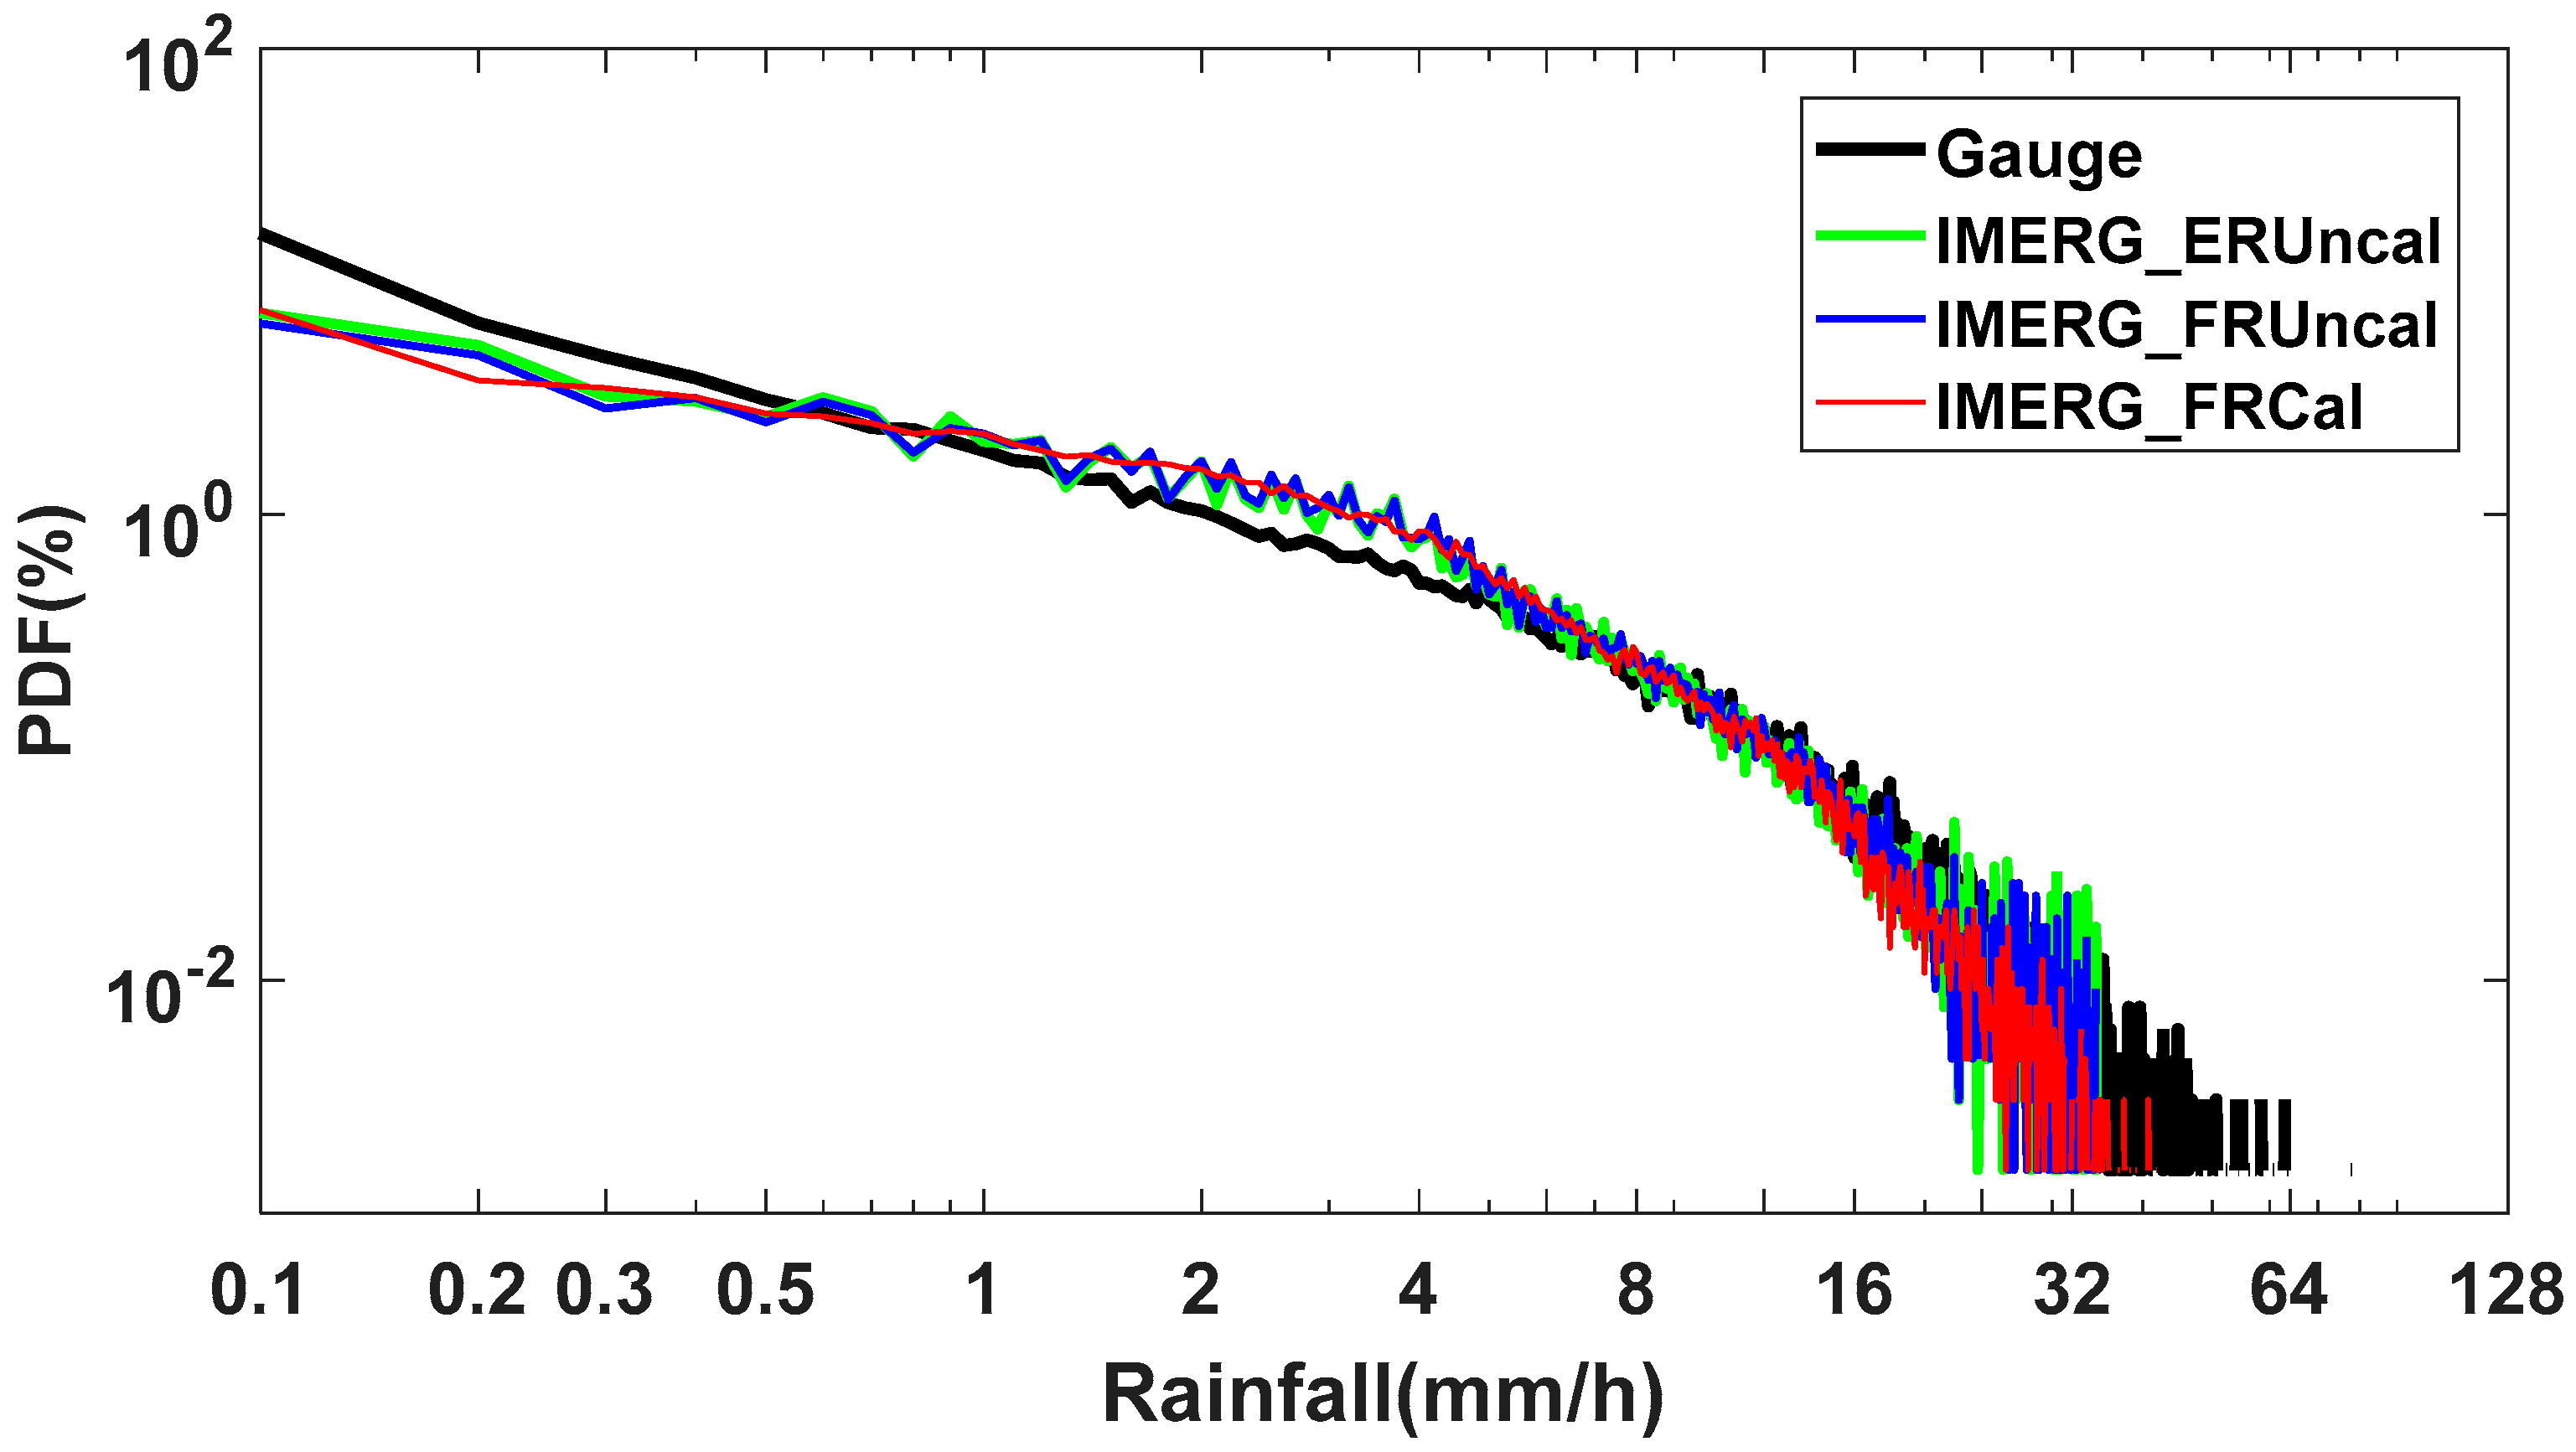
All IMERG products underestimate the light precipitation (<0.6 mm/h) and overestimate the light to moderate precipitation in 0.6–6 mm/h (Figure 9).
(4).
The FB is the primary component that contributes most to the total bias during all events. IMERG_FRCal tends to have negative HB, and both IMERG_FRCal and IMERG_FRUncal are inclined to have larger magnitude of HB than IMERG_FRCal does.
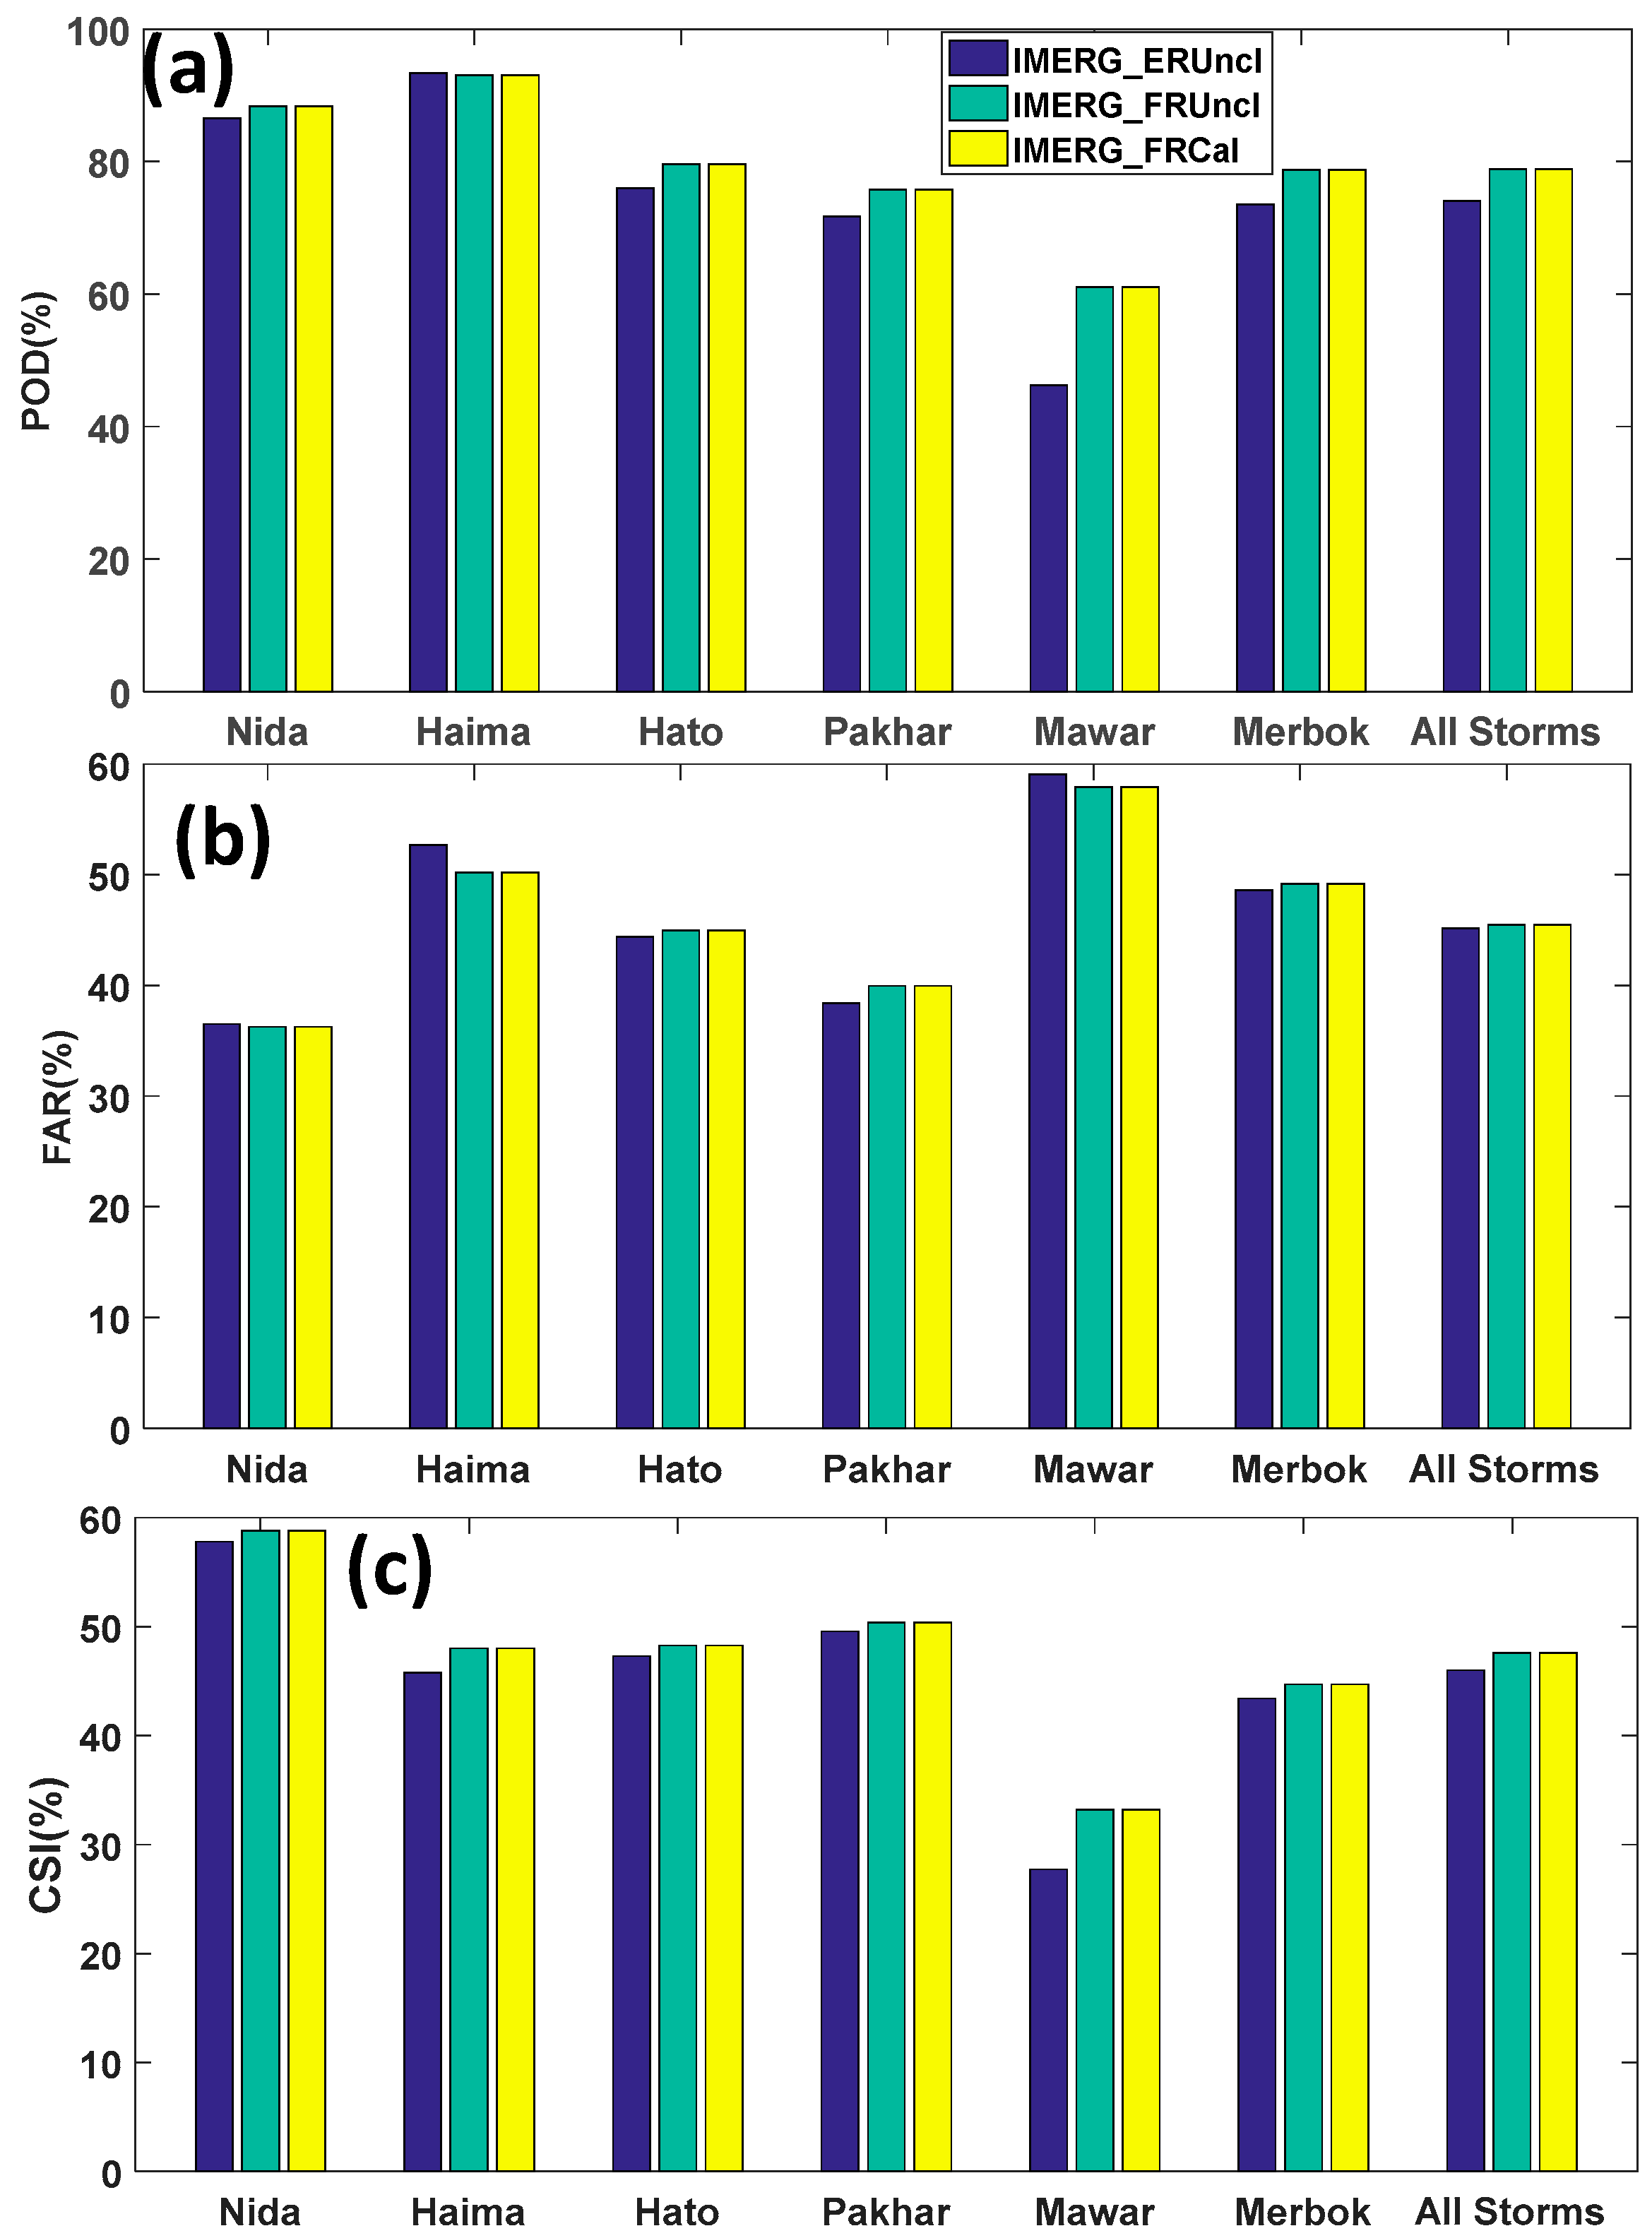
(5).
IMERG_FRUncal and IMERG_FRCal have the same capability of detecting rainy events, showing higher POD and CSI, and lower FAR than IMERG_ERUncal. IMERG_FRUncal and IMERG_FRCal have higher POD and CSI than IMERG_ERUncal when rain rates are less than 10 mm/h. IMERG_ERUncal and IMERG_FRUncal demonstrate higher POD and CSI than IMERG_FRCal when rain rates are greater than 10 mm/h (Figure 13).
(6).
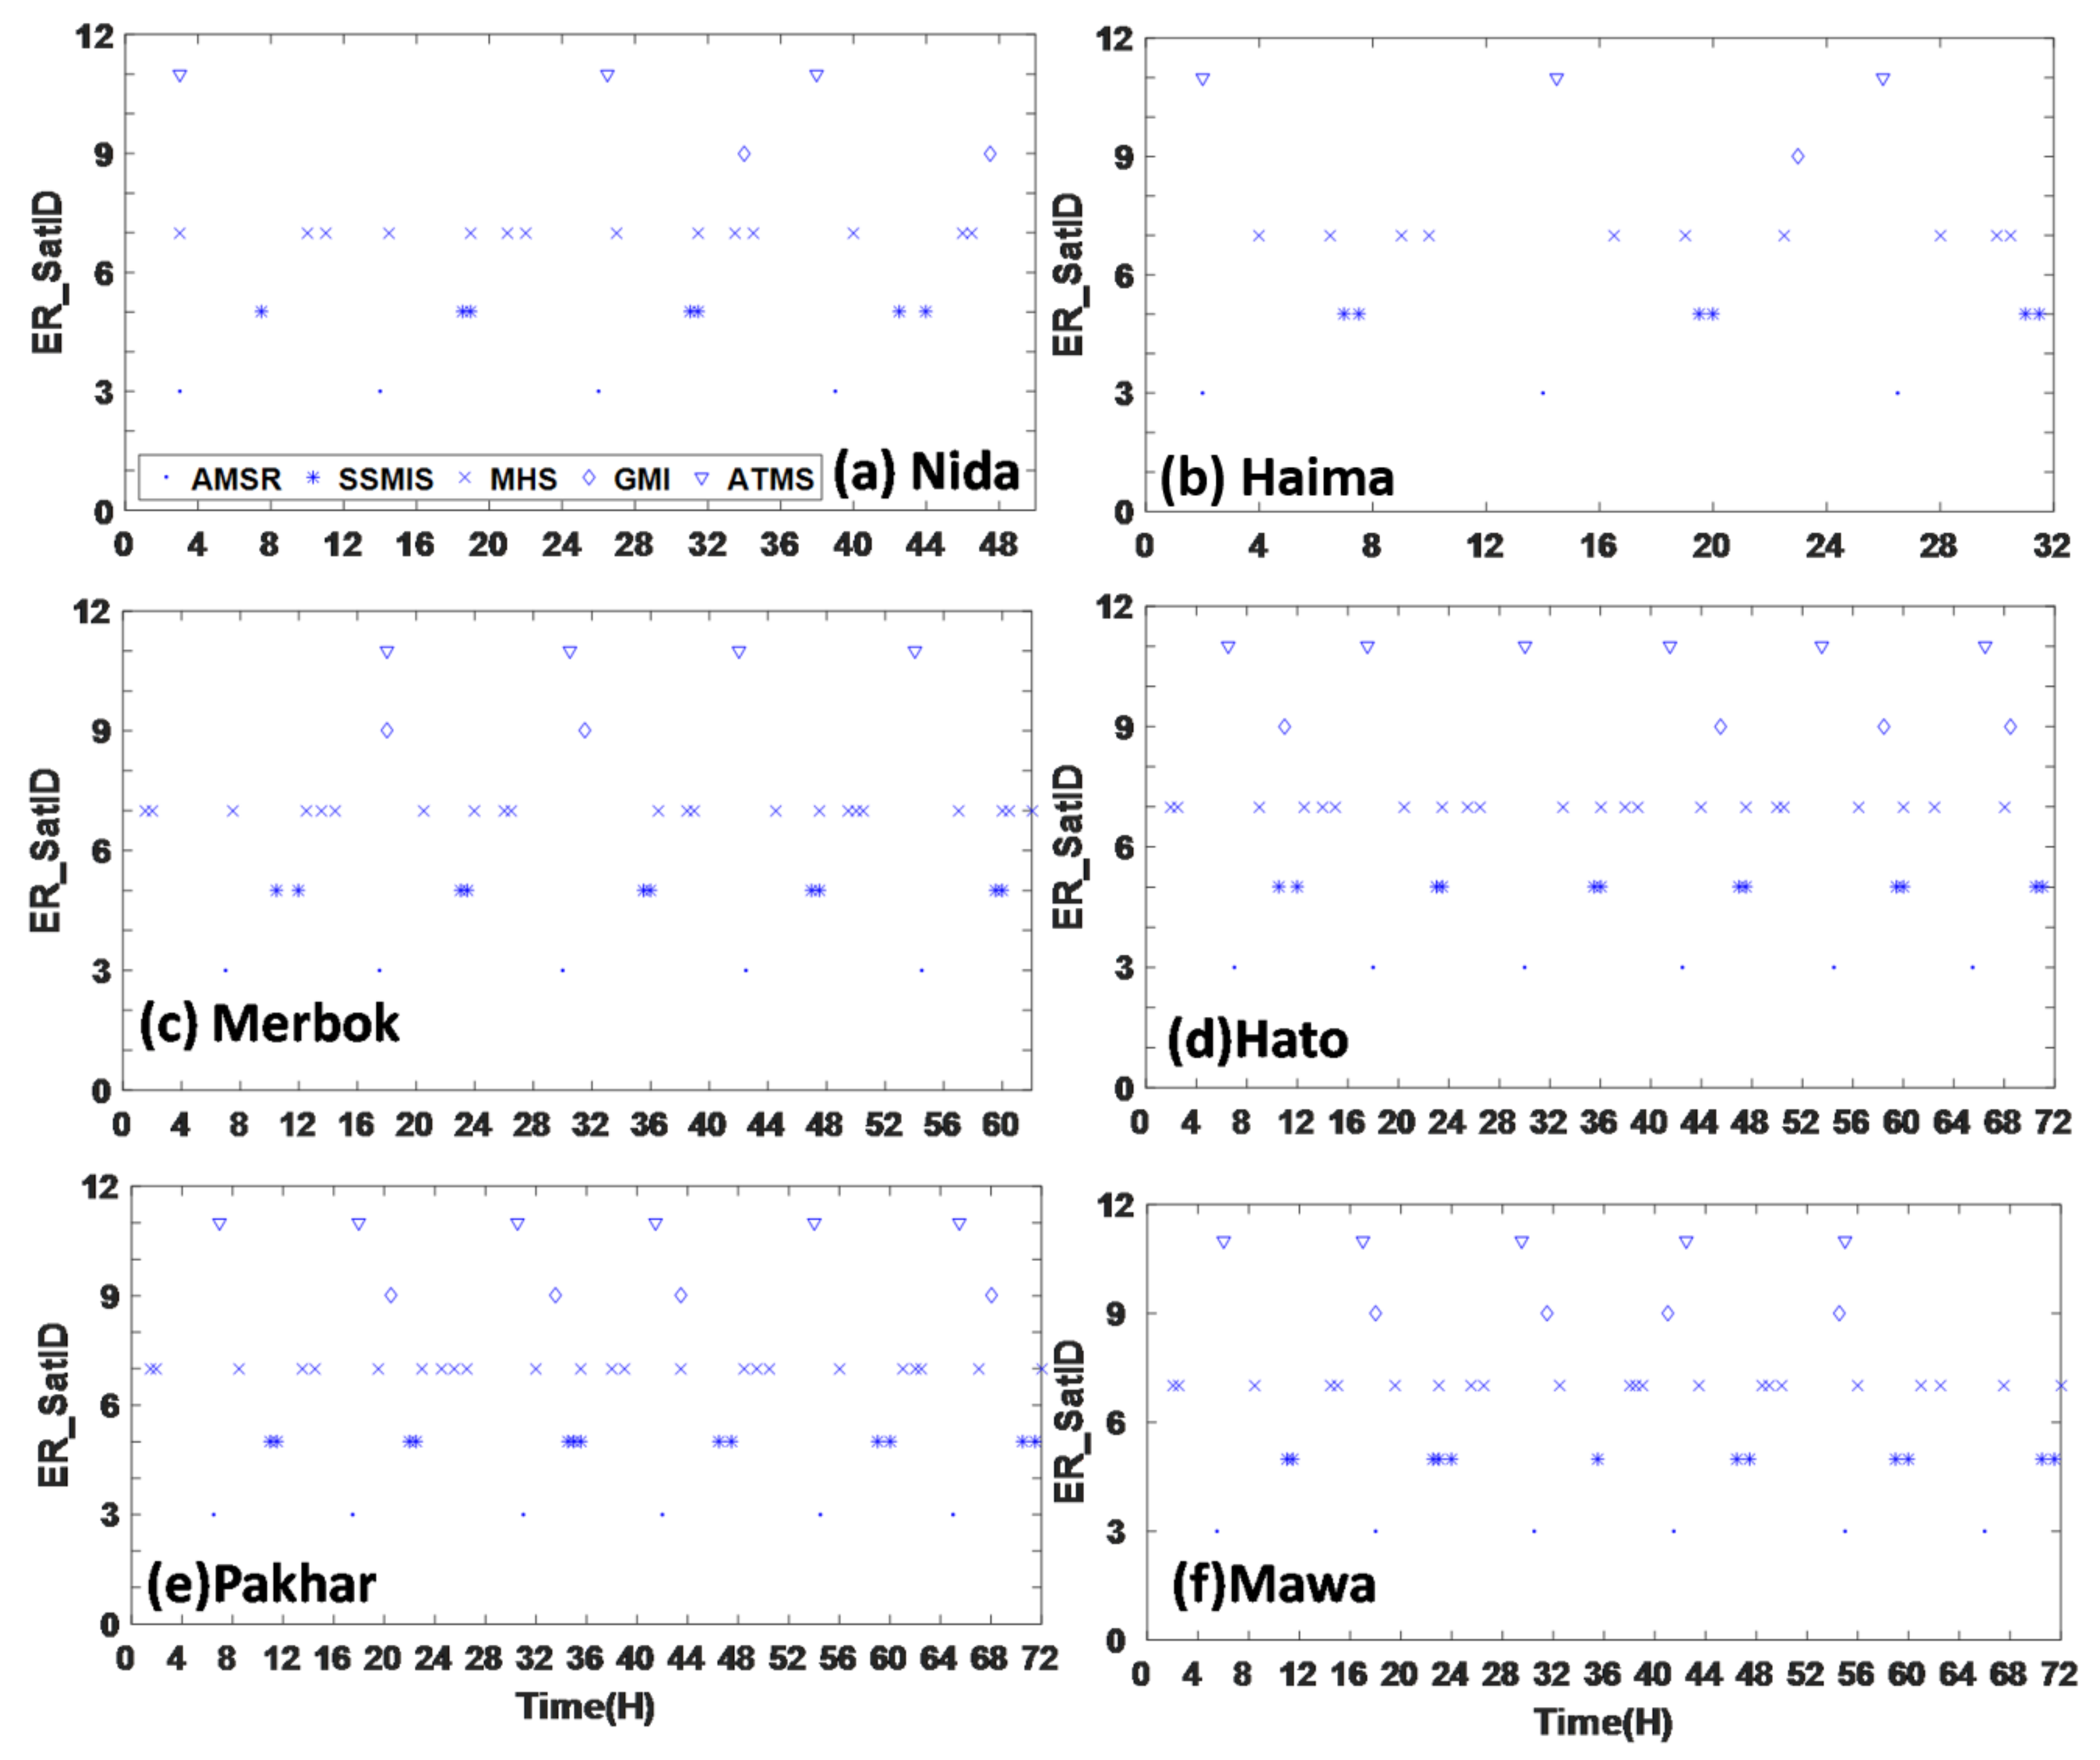
The large magnitude of underestimation and overestimation of the heavy rainfall regions by satellite-only IMERG is primarily linked to the lack of microwave sensor observations. The limitations of IR-based and PMW-based rainfall estimation over complex terrains are attributed to the large bias of IMERG products when compared to gauge observations.
The V5B IMERG is state-of-the-art high resolution QPE products. It makes full use of advanced morphing algorithms and utilizes all available observations from IR and PMW sensors, the space-born dual-pol precipitation radar, and gauge observations over globe. This study suggests that IMERG products show promising performance in capturing the spatial and temporal patterns of very powerful typhoon extreme rainfall events like Nida, Haima, and Hato over Guangdong province in southern China, but still demonstrate large magnitude of overestimation for the satellite-only IMERG products from both the Early Run and the Final Run. The Final Run gauge-corrected IMERG_FRCal shows better performance than the satellite-only IMERG_ERUncal and IMERG_FRUncal, but it tends to underestimate the overall precipitation and still has considerable bias in estimating the hourly area-average precipitation. It is expected that the upcoming upgraded version of IMERG that uses daily gauge analysis for gauge correction will greatly improve the Final Run research product. Besides, these results are based only on six extreme typhoon-related precipitation storm, and more and further analysis are needed to investigate the sources of IMERG bias and its behaviors in different events. For example, there is a significant difference between the sample volumes of rain gauge and GPM sensors, and the one-dimension gauge measurement can’t reflect the inhomogeneity of precipitation that causes a non-uniform beam filling (NUBF) problem for the space-born sensors [54]. Such NUBF problem could be further investigated with observations from local ground-based dual-pol weather radar and phase array radar network in Guangdong province. This work is undergoing.

Author Contributions

S.C. and J.H. conceived and designed the experiments; C.H. and A.Z. performed the experiments and analyzed the data; Z.L., L.X. and C.M. prepared the data and proofread the paper; X.T. and Z.Z. helped analysis the results; C.H. and S.C. wrote the paper.

Funding

This work was partially supported by “100 Top Talents Program” (74110-52601108) at Sun Yat-Sen University, Guangzhou, Guangdong, China, High-level Talents Training and Teacher Qualities and Skills Promotion Plan for Guangxi Colleges and Universities (8844), and by the National Natural Science Foundation of China (51579162, 41661021, 41875182), Guangxi Natural fund of Innovative Team Project (2016JJF15001).

Conflicts of Interest

The authors declare no conflict of interest.

References

  1. Fischer, E.M.; Knutti, R. Anthropogenic contribution to global occurrence of heavy-precipitation and high-temperature extremes. Nat. Clim. Chang. 2015, 5, 560. [Google Scholar] [CrossRef]
  2. Rahmstorf, S.; Coumou, D. Increase of extreme events in a warming world. Proc. Natl. Acad. Sci. USA 2011, 108, 17905–17909. [Google Scholar] [CrossRef] [PubMed] [Green Version]
  3. Duffy, P.; Tebaldi, C. Increasing prevalence of extreme summer temperatures in the US. Clim. Chang. 2012, 111, 487–495. [Google Scholar] [CrossRef]
  4. Kunkel, K.E.; Karl, T.R.; Brooks, H.; Kossin, J.; Lawrimore, J.H.; Arndt, D.; Bosart, L.; Changnon, D.; Cutter, S.L.; Doesken, N. Monitoring and understanding trends in extreme storms: State of knowledge. Bull. Am. Meteorol. Soc. 2013, 94, 499–514. [Google Scholar] [CrossRef]
  5. Rudeva, I.; Gulev, S.K. Climatology of Cyclone Size Characteristics and Their Changes during the Cyclone Life Cycle. Mon. Weather Rev. 2007, 135, 2568–2587. [Google Scholar] [CrossRef]
  6. Clifton, H.E. Sedimentologic relevance of convulsive geologic events. Geol. Soc. Am. Abstr. Progr. 1985, 17, 1–6. [Google Scholar]
  7. Sorooshian, S.; Hsu, K.L.; Gao, X.; Gupta, H.V.; Imam, B.; Braithwaite, D. Evaluation of PERSIANN system satellite-based estimates of tropical rainfall. Bull. Am. Meteorol. Soc. 2000, 81, 2035–2046. [Google Scholar] [CrossRef]
  8. Hong, Y.; Hsu, K.L.; Sorooshian, S.; Gao, X. Precipitation estimation from remotely sensed imagery using an artificial neural network cloud classification system. J. Appl. Meteorol. 2004, 43, 1834–1853. [Google Scholar] [CrossRef]
  9. Joyce, R.J.; Janowiak, J.E.; Arkin, P.A.; Xie, P. CMORPH: A method that produces global precipitation estimates from passive microwave and infrared data at high spatial and temporal resolution. J. Hydrometeorol. 2004, 5, 487–503. [Google Scholar] [CrossRef]
  10. Huffman, G.J.; Bolvin, D.T.; Nelkin, E.J.; Adler, R.F. Highlights of Version 7 TRMM Multi-satellite Precipitation Analysis (TMPA). In Proceedings of the 5th International Precipitation Working Group Workshop, Workshop Program and Proceedings, Hamburg, Germany, 11–15 October 2010; Klepp, C., Huffman, G., Eds.; Reports on Earth Sys. Sci. 100/2011. Max-Planck-Institut für Meteorologie: Hamburg, Germany, 2011; pp. 109–110. [Google Scholar]
  11. Huffman, G.J.; Bolvin, D.T.; Nelkin, E.J.; Wolff, D.B.; Adler, R.F.; Gu, G.; Hong, Y.; Bowman, K.P.; Stocker, E.F. The TRMM multisatellite precipitation analysis (TMPA): Quasi-global, multiyear, combined-sensor precipitation estimates at fine scales. J. Hydrometeorol. 2007, 8, 38–55. [Google Scholar] [CrossRef]
  12. Kubota, T.; Shige, S.; Hashizume, H.; Aonashi, K.; Takahashi, N.; Seto, S.; Takayabu, Y.N.; Ushio, T.; Nakagawa, K.; Iwanami, K. Global precipitation map using satellite-borne microwave radiometers by the GSMaP Project: Production and validation. IEEE Trans. Geosci. Remote Sens. 2007, 45, 2259–2275. [Google Scholar] [CrossRef]
  13. Aonashi, K.; Awaka, J.; Hirose, M.; Kozu, T.; Kubota, T.; Liu, G.; Shige, S.; Kida, S.; Seto, S.; Takahashi, N. GSMaP passive microwave precipitation retrieval algorithm: Algorithm description and validation. J. Meteorol. Soc. Jpn. 2009, 87, 119–136. [Google Scholar] [CrossRef]
  14. Ushio, T.; Sasashige, K.; Kubota, T.; Shige, S.; Okamota, K.; Aonashi, K.; Inoue, T.; Takahashi, N.; Iguchi, T.; Kachi, M. A Kalman Filter Approach to the Global Satellite Mapping of Precipitation (GSMaP) from Combined Passive Microwave and Infrared Radiometric Data. J. Meterorol. Soc. Jpn. Ser. II 2009, 87, 137–151. [Google Scholar] [CrossRef] [Green Version]
  15. Shige, S.; Yamada, T.; Tsukiyama, T.; Kida, S. The GSMaP precipitation retrieval algorithm for microwave sounders. Part I: Over-ocean algorithm. IEEE Trans. Geosci. Remote Sens. 2009, 47, 5. [Google Scholar] [CrossRef]
  16. Chen, S.; Hu, J.; Zhang, Z.; Behrangi, A.; Hong, Y.; Gebregiorgis, A.S.; Cao, J.; Hu, B.; Xue, X.; Zhang, X. Hydrologic Evaluation of the TRMM Multisatellite Precipitation Analysis Over Ganjiang Basin in Humid Southeastern China. IEEE J. Sel. Top. Appl. Earth Obs. Remote Sens. 2015, 8, 4568–4580. [Google Scholar] [CrossRef]
  17. Chen, S.; Hong, Y.; Cao, Q.; Kirstetter, P.-E.; Gourley, J.J.; Qi, Y.; Zhang, J.; Howard, K.; Hu, J.; Wang, J. Performance evaluation of radar and satellite rainfalls for Typhoon Morakot over Taiwan: Are remote-sensing products ready for gauge denial scenario of extreme events? J. Hydrol. 2013, 506, 4–13. [Google Scholar] [CrossRef]
  18. Chen, Y.; Ebert, E.E.; Walsh, K.J.; Davidson, N.E. Evaluation of TRMM 3B42 precipitation estimates of tropical cyclone rainfall using PACRAIN data. J. Geophys. Res. Atmos. 2013. [Google Scholar] [CrossRef]
  19. Shen, Y.; Zhao, P.; Pan, Y.; Yu, J. A high spatiotemporal gauge-satellite merged precipitation analysis over China. J. Geophys. Res. Atmos. 2014, 119. [Google Scholar] [CrossRef]
  20. Jiang, H.; Zipser, E.J. Contribution of tropical cyclones to the global precipitation from eight seasons of TRMM data: Regional, seasonal, and interannual variations. J. Clim. 2010, 23, 1526–1543. [Google Scholar] [CrossRef]
  21. Gourley, J.J.; Hong, Y.; Flamig, Z.L.; Wang, J.; Vergara, H.; Anagnostou, E.N. Hydrologic Evaluation of Rainfall Estimates from Radar, Satellite, Gauge, and Combinations on Ft. Cobb Basin, Oklahoma. J. Hydrometeorol. 2011, 12, 973–988. [Google Scholar] [CrossRef]
  22. Ruin, I.; Lutoff, C.; Creton-Cazanave, L.; Anquetin, S.; Borga, M.; Chardonnel, S.; Creutin, J.; Gourley, J.; Gruntfest, E.; Nobert, S. Toward a Space-Time Framework for Integrated Water and Society Studies. Bull. Am. Meteorol. Soc. 2012. [Google Scholar] [CrossRef]
  23. Hou, A.Y.; Kakar, R.K.; Neeck, S.; Azarbarzin, A.A.; Kummerow, C.D.; Kojima, M.; Oki, R.; Nakamura, K.; Iguchi, T. The global precipitation measurement mission. Bull. Am. Meteorol. Soc. 2014, 95, 701–722. [Google Scholar] [CrossRef]
  24. Chen, S.; Liu, H.; You, Y.; Mullens, E.; Hu, J.; Yuan, Y.; Huang, M.; He, L.; Luo, Y.; Zeng, X. Evaluation of High-Resolution Precipitation Estimates from Satellites during July 2012 Beijing Flood Event Using Dense Rain Gauge Observations. PLoS ONE 2014, 9, e89681. [Google Scholar] [CrossRef] [PubMed]
  25. Huang, Y.; Chen, S.; Cao, Q.; Hong, Y.; Wu, B.; Huang, M.; Qiao, L.; Zhang, Z.; Li, Z.; Li, W. Evaluation of Version-7 TRMM Multi-Satellite Precipitation Analysis Product during the Beijing Extreme Heavy Rainfall Event of 21 July 2012. Water 2013, 6, 32–44. [Google Scholar] [CrossRef] [Green Version]
  26. Chen, S.; Hu, J.; Zhang, A.; Min, C.; Huang, C.; Liang, Z. Performance of near real-time Global Satellite Mapping of Precipitation estimates during heavy precipitation events over northern China. Theor. Appl. Climatol. 2018, 1–15. [Google Scholar] [CrossRef]
  27. Habib, E.; Henschke, A.; Adler, R.F. Evaluation of TMPA satellite-based research and real-time rainfall estimates during six tropical-related heavy rainfall events over Louisiana, USA. Atmos. Res. 2009, 94, 373–388. [Google Scholar] [CrossRef]
  28. Guo, H.; Chen, S.; Bao, A.; Behrangi, A.; Hong, Y.; Ndayisaba, F.; Hu, J.; Stepanian, P.M. Early assessment of Integrated Multi-satellite Retrievals for Global Precipitation Measurement over China. Atmos. Res. 2016, s176–s177, 121–133. [Google Scholar] [CrossRef]
  29. Zhao, H.; Yang, S.; You, S.; Huang, Y.; Wang, Q.; Zhou, Q. Comprehensive Evaluation of Two Successive V3 and V4 IMERG Final Run Precipitation Products over Mainland China. Remote Sens. 2017, 10, 34. [Google Scholar] [CrossRef]
  30. Ning, S.; Wang, J.; Jin, J.; Ishidaira, H. Assessment of the Latest GPM-Era High-Resolution Satellite Precipitation Products by Comparison with Observation Gauge Data over the Chinese Mainland. Water 2016, 8, 481. [Google Scholar] [CrossRef]
  31. Ning, S.; Song, F.; Udmale, P.; Jin, J.; Thapa, B.R.; Ishidaira, H. Error Analysis and Evaluation of the Latest GSMap and IMERG Precipitation Products over Eastern China. Adv. Meteorol. 2017, 2017, 1–16. [Google Scholar] [CrossRef] [Green Version]
  32. Tang, G.; Ma, Y.; Long, D.; Zhong, L.; Hong, Y. Evaluation of GPM Day-1 IMERG and TMPA Version-7 legacy products over Mainland China at multiple spatiotemporal scales. J. Hydrol. 2016, 533, 152–167. [Google Scholar] [CrossRef]
  33. Sahlu, D.; Nikolopoulos, E.I.; Moges, S.A.; Anagnostou, E.N.; Hailu, D. First Evaluation of the Day-1 IMERG over the Upper Blue Nile Basin. J. Hydrometeorol. 2016, 17, 2875–2882. [Google Scholar] [CrossRef]
  34. Chen, F.; Li, X. Evaluation of IMERG and TRMM 3B43 monthly precipitation products over mainland China. Remote Sens. 2016, 8, 472. [Google Scholar] [CrossRef]
  35. Oliveira, R.; Maggioni, V.; Vila, D.; Morales, C. Characteristics and diurnal cycle of GPM rainfall estimates over the central Amazon region. Remote Sens. 2016, 8, 544. [Google Scholar] [CrossRef]
  36. Oliveira, R.; Maggioni, V.; Vila, D.; Porcacchia, L. Using Satellite Error Modeling to Improve GPM-Level 3 Rainfall Estimates over the Central Amazon Region. Remote Sens. 2018, 10, 336. [Google Scholar] [CrossRef]
  37. Omranian, E.; Sharif, H.O. Evaluation of the Global Precipitation Measurement (GPM) Satellite Rainfall Products over the Lower Colorado River Basin, Texas. J. Am. Water Resour. Assoc. 2018, 54, 882–898. [Google Scholar] [CrossRef]
  38. Omranian, E.; Sharif, H.; Tavakoly, A. How well can global precipitation measurement (GPM) capture hurricanes? case study: Hurricane Harvey. Remote Sens. 2018, 10, 1150. [Google Scholar] [CrossRef]
  39. Wang, C.; Tang, G.; Han, Z.; Guo, X.; Hong, Y. Global intercomparison and regional evaluation of GPM IMERG Version-03, Version-04 and its latest Version-05 precipitation products: Similarity, difference and improvements. J. Hydrol. 2018, 564, 342–356. [Google Scholar] [CrossRef]
  40. Zhang, A.; Xiao, L.; Min, C.; Chen, S.; Kulie, M.; Huang, C.; Liang, Z. Evaluation of latest GPM-Era high-resolution satellite precipitation products during the May 2017 Guangdong extreme rainfall event. Atmos. Res. 2019, 216, 76–85. [Google Scholar] [CrossRef]
  41. Khan, S.; Maggioni, V.; Kirstetter, P.E. Investigating the Potential of Using Satellite-Based Precipitation Radars as Reference for Evaluating Multisatellite Merged Products. J. Geophys. Res. Atmos. 2018, 123, 8646–8660. [Google Scholar] [CrossRef]
  42. Elliott, R.J.R.; Strobl, E.; Sun, P. The local impact of typhoons on economic activity in China: A view from outer space. J. Urban Econ. 2015, 88, 50–66. [Google Scholar] [CrossRef]
  43. Wu, X.; Zhou, L.; Guo, J.; Liu, H. Impacts of Typhoons on Local Labor Markets based on GMM: An Empirical Study of Guangdong Province, China. Weather Clim. Soc. 2017, 9, 255–266. [Google Scholar] [CrossRef]
  44. Del Valle, A.; Elliott, R.J.R.; Strobl, E.; Tong, M. The Short-Term Economic Impact of Tropical Cyclones: Satellite Evidence from Guangdong Province. Econ. Disasters Clim. Chang. 2018, 2, 225–235. [Google Scholar] [CrossRef]
  45. Durden, S.L.; Haddad, Z.; Kitiyakara, A.; Li, F. Effects of nonuniform beam filling on rainfall retrieval for the TRMM precipitation radar. J. Atmos. Ocean. Technol. 1998, 15, 635–646. [Google Scholar] [CrossRef]
  46. Huffman, G.J.; Bolvin, D.T.; Braithwaite, D.; Hsu, K.; Joyce, R.; Kidd, C.; Nelkin, E.J.; Sorooshian, S.; Tan, J.; Xie, P. NASA Global Precipitation Measurement (GPM) Integrated Multi-Satellite Retrievals for GPM (IMERG). Available online: https://pmm.nasa.gov/sites/default/files/document_files/IMERG_doc.pdf (accessed on 10 January 2018).
  47. Huffman, G.J.; Bolvin, D.T.; Nelkin, E.J. Integrated Multi-satellitE Retrievals for GPM (IMERG) Technical Documentation; Project, G., Ed.; NASA: Greenbelt, MD, USA, 2018.
  48. Gebregiorgis, A.S.; Kirstetter, P.E.; Hong, Y.E.; Gourley, J.J.; Huffman, G.J.; Petersen, W.A.; Xue, X.; Schwaller, M.R. To What Extent is the Day 1 GPM IMERG Satellite Precipitation Estimate Improved as Compared to TRMM TMPA-RT? J. Geophys. Res. Atmos. 2018, 123, 1694–1707. [Google Scholar] [CrossRef]
  49. Wen, L.; Zhao, K.; Chen, G.; Wang, M.; Zhou, B.; Huang, H.; Hu, D.; Lee, W.C.; Hu, H. Drop Size Distribution Characteristics of Seven Typhoons in China. J. Geophys. Res. Atmos. 2018, 1–20. [Google Scholar] [CrossRef]
  50. Kubota, T.; Ushio, T.; Shige, S.; Kida, S.; Kachi, M.; Okamoto, K.i. Verification of high-resolution satellite-based rainfall estimates around Japan using a gauge-calibrated ground-radar dataset. J. Meteorol. Soc. Jpn. 2009, 87, 203–222. [Google Scholar] [CrossRef]
  51. Liao, L.; Meneghini, R. A Study on the Feasibility of Dual-Wavelength Radar for Identification of Hydrometeor Phases. J. Appl. Meteorol. Climatol. 2010, 50, 449–456. [Google Scholar] [CrossRef]
  52. Dinku, T.; Connor, S.J.; Ceccato, P. Comparison of CMORPH and TRMM-3B42 over Mountainous Regions of Africa and South America; Springer: New York, NY, USA, 2010. [Google Scholar]
  53. Taylor, K.E. Summarizing multiple aspects of model performance in a single diagram. J. Geophys. Res. Atmos. 2001, 106, 7183–7192. [Google Scholar] [CrossRef] [Green Version]
  54. Chen, H.; Chandrasekar, V. Validation of NASA’s Global Precipitation Measurement mission with a high-resolution ground radar network. In Proceedings of the URSI Asia-Pacific Radio Science Conference (URSI AP-RASC), Seoul, Korea, 21–25 August 2016; pp. 836–839. [Google Scholar]
Figure 1. (a) Terrain and gauge distribution over Guangdong province in southern China. (b) Tracks of six typhoons. The typhoon paths data can be found on the link: http://tcdata.typhoon.org.cn/zjljsjj_zlhq.html.
Remotesensing 11 00070 g001
Figure 2. Spatial distribution of precipitation derived from gauge observations and IMERG Final Run products during typhoon (ad) Nida, (eh) Haima, and (il) Merbok, (mp) Hato, (qt) Pakhar, and (ux) Mawar. The white rectangles in the first column denote the rainfall centers observed by gauge during different events.
Remotesensing 11 00070 g002
Figure 3. Scatter plots of gridded gauge observations versus IMERG Early Run (1st column), and Final Run (2nd and 3rd columns) products during typhoon (ac) Nida, (df) Haima, (gi) Merbok, (jl) Hato, (mo) Pakhar, and (pr) Mawar. RMSE is short for root-mean-squared error, RB for relative bias, CC for correlation coefficient.
Remotesensing 11 00070 g003
Figure 4. Taylor diagrams showing correlation coefficients, standard deviation (mm), and RMSE (mm) of storm-scale accumulated precipitation between the IMERG Early (Final) Run precipitation product and the reference data during typhoon (a) Nida, (b) Haima, (c) Merbok, (d) Hato, (e) Pakhar, (f) Mawar. The radical coordinate is the magnitude of satellite precipitation and standard deviation (mm), the concentric green semi-circles mean RMSE values, and the angular coordinate denotes the correlation coefficient.
Remotesensing 11 00070 g004
Figure 5. Spatial distribution of gridded gauge observations (1st column) versus satellite-based precipitation(2nd column), and the corresponding scatter plots (3rd column) under conditions in which passive microwave sensor observations were used by both IMERG Early and Final Run during typhoon (ac) Nida, (df) Haima, (gi) Merbok, (jl) Hato, (mo) Pakhar, and (pr) Mawar. The red letters “AI” denote the rain belts. Note that the subfigures in the 1st and 2nd columns are different from Figure 2 in which no filtering is applied to the precipitation dataset, whereas subfigures in the 1st and 2nd columns only illustrate the precipitation under conditions in which passive microwave sensor observations were both used by IMERG Early and Final Run.
Remotesensing 11 00070 g005
Figure 6. Hourly availability of passive microwave sensor observations over Guangdong province during typhoon (a) Nida, (b) Haima, (c) Merbok, (d) Hato, (e) Pakhar, and (f) Mawar. Here AMSR is short for Advanced Microwave Scanning Radiometer, SSMIS for Special Sensor Microwave Imager/Sounder, MHS for Microwave Humidity Sounder, GMI for GPM Microwave Imager, and ATMS for Advanced Technology Microwave Sounder.
Remotesensing 11 00070 g006
Figure 7. Spatial distribution of gridded gauge observations (1st column) versus satellite-based precipitation (2nd and 3rd columns), and the corresponding scatter plots (4th and 5th columns) under conditions in which infrared sensor observations were used by both IMERG Early (2nd column) and Final Run (3rd column) during typhoon (ae) Nida, (fj) Haima, (ko) Merbok, (pt) Hato, (uy) Pakhar, and (zD) Mawar. The white rectangles in the 1rd column denote the rainfall centers in six typhoon extreme events.
Remotesensing 11 00070 g007
Figure 8. Area-average hourly rainfall over Guangdong province during typhoon (a) Nida, (b) Haima, (c) Merbok, (d) Hato, (e) Pakhar, and (f) Mawar.
Remotesensing 11 00070 g008
Figure 9. Area-mean hourly rainfall over rainfall centers denoted by white rectangles in Figure 2 during typhoon (a) Nida, (b) Haima, (c) Merbok, (d) Hato, (e) Pakhar, and (f) Mawar.
Remotesensing 11 00070 g009
Figure 10. Probability distribution as a function of rain rates by occurrence with rainfall interval as 0.1 mm/h and log scale for x- and y-axis.
Remotesensing 11 00070 g010
Figure 11. Summary statistics of the six typhoon extreme precipitation events: (a) total accumulated rainfall, (b) total accumulated bias, (c) relative bias.
Remotesensing 11 00070 g011
Figure 12. Decomposition of the total bias of the IMERG products for (a) IEMRG_ERUncal, (b) IEMRG_FRUncal, and (c) IEMRG_ERCal. Bias values are computed based on the pixel where there at least one gauge is located.
Remotesensing 11 00070 g012
Figure 13. (a) Probabilities of detection (POD); (b) false alarm ratio (FAR); (c) critical success index (CSI). POD, FAR, and CSI were computed with 0 mm/h to separate rainy and non-rainy events.
Remotesensing 11 00070 g013
Figure 14. (a) Conditional probability of detection; (b) conditional probability of false detection; (c) conditional critical success index.
Remotesensing 11 00070 g014
Figure 15. (a) Correlation coefficient; (b) standard deviation of differences (mm/h); (c) relative; (d) standard deviation of differences.
Remotesensing 11 00070 g015
Table 1. Specific information of six typhoon events.
No.Typhoon NameStart Time (UTC)End Time (UTC)Total Duration (h)Max Accumulated Gauged Rainfall (mm)Max Gauged Rain Rate (mm/h)
1Nida2016-08-01 04:002016-08-03 06:0050333.8106.9
2Haima2016-10-20 16:002016-10-21 23:0032244.576.5
3Merbok2017-06-12 00:002017-06-14 14:0062361103.6
4Hato2017-08-22 00:002017-08-25 00:0072391.3126.3
5Pakhar2017-08-26 00:002017-08-29 00:0072417.3151.3
6Mawar2017-09-03 00:002017-09-06 00:007228497.6
Table 2. Contingency table of gauge and satellite estimates.
Gauge ≥ ThresholdGauge < Threshold
Satellite ≥ ThresholdHits(H)False alarms (F)
Satellite < ThresholdMisses(M)Correct negative (C)
Table 3. Definition of statistic metrics to compare IMERG (S) QPE and gauge (G) observed QPE.
MetricsEquationsPerfect Value
CC CC = Cov ( S , G ) σ S σ G 1
Bias Bias = ( S G ) 0
RB (%) RB = ( S G ) G × 100 % 0
HB HB = ( S ( S > 0   &   G > 0 ) G ( G > 0 ) ) 0
MB MB = S ( S = 0   &   G > 0 ) 0
FB FB = S ( S > 0   &   G = 0 ) 0
POD POD = H H + M 1
CSI CSI = H H + M + F 1
FAR FAR = F H + F 0
SDD SD = i = 1 N ( x i x ¯ ) N 1 0
RSD RSD = σ ( S i G i ) G ¯ 0
AI AI = 1 i = 1 N ( S i G i ) i = 1 N ( | S i G ¯ | + | G i G ¯ | ) 2 1
Note: N denotes the number of samples. In the formula of CC, “Cov()” represents the covariance, and “ σ ” the standard deviation. In the formula of SDD, x ¯ denotes the average of differences between IMERG and gauge observed QPE, x i represents the difference between IMERG and gauge observed precipitation for a grid where there is at least one valid gauge observation exists at ith hour.

