Article

Utilization of a C-band Polarimetric Radar for Severe Rainfall Event Analysis in Complex Terrain over Eastern China

1
Hangzhou Meteorological Bureau, Hangzhou 310051, China
2
Zhejiang Institute of Meteorological Sciences, Hangzhou 321000, China
3
State Key Laboratory of Hydroscience and Engineering, Department of Hydraulic Engineering, Tsinghua University, Beijing 100084, China
4
Cooperative Institute for Research in the Atmosphere, Colorado State University, Fort Collins, CO 80523, USA
5
NOAA/Earth System Research Laboratory, Boulder, CO 80305, USA
6
Department of Geoscience and Remote Sensing, Delft University of Technology, Stevinweg 1, 2628 CN Delft, The Netherlands
*
Author to whom correspondence should be addressed.
Remote Sens. 2019, 11(1), 22; https://doi.org/10.3390/rs11010022
Submission received: 29 October 2018 / Revised: 19 December 2018 / Accepted: 20 December 2018 / Published: 23 December 2018
(This article belongs to the Special Issue Radar Polarimetry—Applications in Remote Sensing of the Atmosphere)

Abstract

:
Polarimetric radar measurements and products perform as the cornerstones of modern severe weather warning and nowcast systems. Two radar quantitative precipitation estimation (QPE) frameworks, one based on a radar-gauge feedback mechanism and the other based on standard rain drop size distribution (DSD)-derived rainfall retrieval relationships, are both evaluated and investigated through an extreme severe convective rainfall event that occurred on 23 June 2015 in the mountainous region over eastern China, using the first routinely operational C-band polarimetric radar in China. Complex rainstorm characteristics, as indicated by polarimetric radar observables, are also presented to account for the severe rainfall field center located in the gap between gauge stations. Our results show that (i) the improvements of the gauge-feedback-derived radar QPE estimator can be attributed to the attenuation correction technique and dynamically adjusted Z–R relationships, but it greatly relies on the gauge measurement accuracy. (ii) A DSD-derived radar QPE estimator based on the specific differential phase (KDP) performs best among all rainfall estimators, and the interaction between the mesocyclone and the windward slope of the mountainous terrain can account for its apparent overestimation. (iii) The rainstorm is mainly dominated by small-sized and moderate-sized raindrops, with the mean volume diameter being less than 2 mm, but its KDP column (KDP > 3°·km−1) has a liquid water content that is higher than 2.4815 g·m−3, and a high raindrop concentration (Nw) with log10(Nw) exceeding 5.1 mm−1m−3. In addition, small hailstones falling and melting are also found in this event, which further aggregates Nw upon the severe rainfall center in the gap between gauge stations.

1. Introduction

Compared with the traditional single polarization Doppler weather radars that produce horizontal reflectivity (ZH), radial velocity (Vr), and spectrum measurements, the polarimetric radar system can provide additional variables, including differential reflectivity (ZDR), copolar correlation coefficient (ρHV), differential propagation phase (ФDP), and specific differential phase (KDP) [1], and these polarimetric radar measurements have been demonstrated to be very useful in meteorological and hydrological applications. Therefore, all of the operational weather radars in the U.S. (i.e., Next-Generation Radar—NEXRAD) and some weather radar sites in Europe have been upgraded with dual-polarization capability. In China, over 200 single-polarization weather radars have been deployed nationwide for severe weather warning and nowcast operations. Most of these radar systems deployed in eastern China are S-band, and those deployed in western China are C-band. Recently, several S-band radar in Guangdong and Fujian provinces have followed the trend of dual-polarization upgrade, and a larger scale upgrade has been planned over the next few years. In addition, a C-band polarimetric radar for the gap-filling of current operational S-band weather radar networks has been deployed and put into routine meteorological operation in Hangzhou, China, since 2015. However, the efficient and comprehensive utilization of these polarimetric radars for severe weather diagnosis, warning, and decision-making based on the derived numerical products is still a major task of the Chinese Meteorological Administration (CMA). To this end, this paper reports on some of the first and detailed polarimetric radar observations and utilizations of radar quantitative precipitation estimation (QPE) through a severe rainfall event in the complex mountainous area over eastern China.
Early research about polarimetric radar mainly concentrated on data quality issues. For example, the iterative filtering algorithm was designed to remove non-monotone increasing behaviors along the radial range profile of the total differential propagation phase (ΨDP), to obtain accurate KDP [2,3,4]. This also indirectly boosted the partial beam blockage (PBB) correction method based on KDP [5,6]. The ground clutter identification based on polarimetric radar variables could present a better performance than that without any polarimetric capability [7,8]. The attenuation effect is not significant for the S-band radar with a larger antenna, and the whole system is larger in size, compared to the C-band and the X-band radar; however, it is serious for the C-band and X-band radars, which have a smaller-sized antennas and higher frequencies. To solve this issue, the insensitive characteristics for the attenuation effects of ФDP were utilized, and the self-consistency constrained attenuation correction method (i.e., the ZPHI method) was proposed as an efficient way to estimate the attenuation factor (AH, dB·km−1) [9,10] for C-band and the X-band radar, and the S-band radar can perform as an objective reference for the verification aim. These studies on polarimetric variables play a basic role for meteorological and hydrological applications, such as radar QPE applications, which are important for severe rainfall warning and nowcast operations.
Traditional radar QPE algorithms used ZH as the main source for rainfall field retrieval [11] and the feedback-derived radar QPE algorithm, mainly based on the radar-gauge fitted Z–R relationships [12], were also developed recently, because single polarization weather radar is still the primary cornerstone for CMA. Considering that ZDR can provide additional information about raindrop shape and distribution, a radar QPE algorithm based on ZH and ZDR is a better choice if both measurements are both well calibrated and attenuation-corrected [13,14]. Utilizing the immunity of KDP to hardware calibration, PBB, attenuation, and wet radome effects, a more accurate rain rainfall rate (R) field can be estimated if a robust R(KDP) relationship can be established according to the regional rainfall climatology [15,16,17]. With similar physical attributes of KDP, a radar QPE algorithm based on AH is also proposed and verified in recent years [5]; however, KDP in a light rain scenario is seriously affected by the noisy signals involved in ФDP fluctuations, whereas a high-frequency radar may perform better [18]. Also, the composite utilization of these polarimetric measurements may render better QPE performance than that based on a single variable [19,20,21], but long-term radar and drop size distribution (DSD) observations and analyses are always needed to derive optimal rainfall retrieval relationships in different rain-type scenarios for these DSD-derived radar QPE approaches [16,17,18,19,20,21,22,23,24,25,26]. Contamination from hailstones and melting layers should be also carefully preprocessed before the polarimetric radar variables are integrated into a radar QPE algorithm. The utilization of polarimetric radar variables for hydrometeor classification [27,28] is useful in this aspect, especially when mixed-phase hydrometeors coexist in the same precipitation system. Although significant progress in X-band polarimetric radar QPE research has been achieved, X-band radar signal loss due to the wet radome effect is too serious to be neglected in real experiments and applications that are related to severe rainfall events. Furthermore, no matter whether single or composite radar QPE algorithms are used, their verifications both rely on surface gauge measurements. However, severe rainfall centers at the gap between the surface stations need reasonable explanations, and polarimetric radar measurements are indispensable for the analysis of the complex microphysical process.
Nevertheless, the effective use of polarimetric radar systems and products for operational warning applications in China is still immature. In addition, extreme convective rainstorms are becoming increasingly frequent in recent years, which is the main source that accounts for disastrous weather events in complex mountainous terrain [12,17,29,30], such as torrential flood and debris flow. Polarimetric radar observations of severe convective rainstorms are indispensable in severe rainfall scenarios. In this study, traditional gauge feedback-derived and standard DSD-derived radar QPE algorithms are both evaluated and exploited, taking the opportunity to use the first operational C-band polarimetric radar in China to characterize an extreme severe convective rainfall event in the northwestern mountainous area of Hangzhou from 0800–1000 UTC, 23 June 2015, which caused a torrential flood upon this area. Section 2 introduces the dataset in the study area, and the data processing methods involved. Section 3 surveys the results of different radar QPE algorithms in this severe rainfall event, with detailed rainstorm microphysical properties. Section 4 summarizes and concludes this study.

2. Study Domain, Dataset, and Rainfall Methodology

2.1. Study Area

As per the digital elevation model information depicted in Figure 1a, high mountains located along the border of Anhui and Zhejiang provinces form a natural windward slope with sharp elevation changes (above 1.4 km). Small-scale—but severe—convective rainstorms are often triggered over this area, due to the enhancement of the windward slope. Additionally, it is reported that the deterioration of the river slope environment, overcultivation, and overmining of large stones in this area are serious, which makes it unable to hold shape under the erosion of short-time heavy rainfall rates. The rainfall during 0800–1000 UTC 23 June 2015 was a typical extreme severe rainfall event, and a torrential flood accompanied the event on this day, where seven villages of Changhua town (see Figure 1b,d) were seriously affected, as marked by the red flags in Figure 1d. The C-band polarimetric (CPOL) radar located at Da Ming Mountain (DMM) is the nearest radar from this mountainous area. It is the third highest radar site featured with little blockage in eastern China, and it is also the first polarimetric C-band radar for operational severe weather warning and nowcast applications in China. It has been put into operational use since January 2015 in simultaneous transmitting and receiving mode, and its radial range resolution and azimuthal beam resolution are configured as 125 m and 0.98°, respectively, which can produce much finer radar measurements than the current operational S-band Doppler weather radar. During this extreme severe rainfall event, DMM radar was configured as the standard volume coverage pattern (VCP) scan strategy, with its elevation angles being set as 0.5°, 1.4°, 2.5°, 3.5°, 4.5°, 6°, 7.5°, 14.5°, and 19.5°. A radar volume scan data can be generated every 6 min, according to this VCP mode.
As the most important surface instrument for rainfall monitoring, four meteorological gauge stations have been deployed around this mountainous area, as depicted in Figure 1b,d, including Qiaomaitang (QMT), Daochangping (DCP), Miwukou (MWK), and Dengcun (DC), which are 27 km, 36.84 km, 39.5 km, and 43.97 km from the DMM radar site, respectively. They are all located to the north of the disaster area, which can provide direct rainfall measurements for the meteorological warning operations, and for the validation of different radar QPE algorithms. Additionally, eight Parsivel-II (Particle Size and Velocity) disdrometer units, which are all one-dimensional devices, have been deployed around Hangzhou (see Figure 1c) to collect DSD datasets since January 2016, for the efficient utilization of polarimetric radar variables and the development of DSD-derived polarimetric radar rainfall estimates. The DSD dataset is an important surface observation dataset that can be used to simulate dual-polarization radar measurements and derive appropriate radar rainfall relationships [18,20,31,32]. In this study, the temporal resolution of all the disdrometers is configured to one minute; they are supported with municipal electric power. They are well-maintained to ensure the data quality of the DSD measurements, and the data series are transported by special wires to the server machine at the Hangzhou meteorological bureau.

2.2. Radar Data Processing

A series of the latest polarimetric radar data processing procedures are implemented before posterior analysis and quantitative applications. The key aspects regarding radar data processing and quality control are summarized as follows:
(i) The “birdbath” scan method is used for ZDR calibration, and it is performed in a light rain scenario through the vertically pointing observations (elevation of 90°) in a full azimuthal rotation [1]. The ZDR offset is obtained below the melting layer, with light rain or drizzle characteristics. The offset is then applied to the radar digital acquisition (RDA) system to ensure a low bias of ZDR in the subsequent scans. Such a ZDR calibration is conducted every year before the monsoon season. Figure 2 shows just one “birdbath” example at 1835 UTC 24 April 2015, and a ZDR offset of −0.6 dB is deduced and fed back to the RDA system.
(ii) The clutter mitigation decision algorithm described by Hubbert et al. (2009) [8] is implemented and integrated into the RDA software for real-time ground clutter (GC) identification and suppression. In particular, a fuzzy logic scheme is designed to identify the GC signals through incorporating the spatial texture and spin change of ZH, the standard deviation of ZDR and ΨDP, and the clutter phase alignment that was extracted from the radar I and Q (in-phase and quadrature-phase) data as the input parameters. ZH, ZDR, and Vr were recalculated after filtering the GC signals from the raw measurements.
(iii) The dealiasing procedure is followed and executed if the measured total ΨDP exceeds 360° according to the monotonous increasing characteristics of the ΨDP profile. The initial phase of ΨDP is determined by using a linear regression method and then removed. The ΨDP measurements are then preprocessed with the iterative filtering method proposed by Hubbert and Bringi [3], to separate the backscatter differential phase and ФDP from the ΨDP radial profiles. KDP is estimated by using the linear fitting approach detailed by Wang and Chandrasekar [4].
(iv) The ZPHI method proposed by Testud et al. [33] and Bringi et al. [9] is improved with a non-negative constraint on AH, a ρHV constraint on the range gates partition, and a convergence constraint on the calculation stopping condition; however, the detailed discussion is beyond the scope of this paper. It is then implemented in every partitioned range interval [r0,rm] to estimate the specific attenuation AH in Equation (1a) along each radial profile, by assuming a constant parameter b (0.78). Then, the optimal parameter of αopt is searched in [0.03, 0.18] until the difference between the filtered ФDP ( Φ DP filtered ) and the reconstructed ФDP ( Φ DP constructed ) is minimized, according to Equations (1b) and (1c). Finally, the measured ZH can be corrected by Equation (1d), based on the optimally estimated AH:
A H ( r ) = [ Z H measured ] b [ 10 0.1 ( b α ) Δ Φ ( r 0 , r m ) 1 ] I ( r 0 , r m ) + [ 10 0.1 ( b α ) Δ Φ ( r 0 , r m ) 1 ] I ( r , r m )
r 0 r m | Φ DP constructed ( s , α ) Φ DP filtered ( s ) | d s
Φ DP constructed ( r 0 , r m ) = 2 r 0 r m A H ( s ; α ) α d s
Z H corrected ( r ) = Z H measured ( r ) + 2 0 r A H ( s , α opt ) d s
(v) The linear ZDRZH relationship in the previous ZPHI method [9] is replaced with an exponential relationship, as in Equation (2a), which is fitted from the DSD-simulated ZH and ZDR dataset (see the black line on Figure 3a) from June of 2016 and 2017 using the T-matrix method. The differential attenuation factor (ADP) is then derived through searching for the optimal βopt according to Equation (2b) until the differences between ZDR estimated using the ZDRZH relationship and ZDR corrected by potential optimal ADP according to Equation (2c) are minimized. In this way, ZDR can be easily corrected using ADP related to βopt according to (2c), along the radial range profiles.
Z DR ( r ) = 0.00012 Z H corrected ( r ) 2.5515
A DP ( r ; β ) = β opt α opt A H ( r , α opt )
Z DR corrected ( r ) = Z DR measured ( r ) + 2 0 r A DP ( s ; β opt ) d s

2.3. Feedback-Derived Radar Rainfall Estimation Approach

Before the deployment of disdrometer units for the DMM radar, the feedback-derived radar QPE algorithm is used to obtain the radar hourly rainfall accumulation field for the meteorological operations, which is mainly based on the feedback from the surface gauge measurements [12]. The radar QPE algorithm, initially applied here, combines ZH (0.5° elevation sweep) and rain gauge measurements to obtain optimally fitted Z–R relationships, which are dynamically adjusted for the rainstorm. In particular, the ZH field is divided into different rainy areas utilizing the storm cell identification and tracking algorithm [12,34]. Different Z–R relations are applied for partitioned ZH subregions to better represent the precipitation differences. Then, the optimal Z–R relationships are fitted independently into each partitioned ZH subregion, by minimizing the target Equation (3) as follows,
δ = min ( i = 1 n [ ( G i R i ) 2 + | G i R i | ] )
where δ is the objective function value that needs to be minimized and Gi and Ri are gauge rainfall measurements and radar rainfall estimates, respectively. Equation (3) is a quadratic function, and the partitioned ZH areas at different times use independent Z–R relations for rainfall rate retrievals. The first term in Equation (3) includes G2, R2, and G*R, which are all quadratic terms, and they will increase quickly and dominate Equation (3) if Gi and Ri are both larger than 1 mm. The second term is the first-order term factor, and it dominates Equation (3) when Gi and Ri are both less than 1 mm. The absolute bracket is used to avoid the possible cancellation of positive and negative values. After obtaining the instantaneous radar rainfall rates at each observational time frame, a pixel-to-pixel time linear average accumulation scheme is used to calculate the radar-based hourly rainfall field.

2.4. The Standard DSD-Derived Radar Rainfall Estimation Approach

Utilizing the DSD dataset around Hangzhou collected during June of 2016 and 2017, the regionally optimal and standard radar rainfall rate relationships based on ZH, ZDR, KDP, and AH can be obtained for CPOL rainfall applications, using the standard weighted least squares nonlinear fitting method. In particular, DSD-derived R(ZH), R(ZH,ZDR), R(KDP), and R(AH) relationships are established, respectively, taking into account into the DSD measurement density distributions (see Figure 2e,f) as
R ( Z H ) = 0.0496 × Z H 0.6153    Z H < 40 dBZ
R ( Z H ) = 0.0644 × Z H 0.6295    Z H 40 dBZ
R ( Z H , Z DR ) = 0.0109 × Z H 0.8365 Z DR 1.87
R ( K DP ) = 25.169 K DP 0.7974
R ( A H ) = 151.6693 A H 0.6172
Both ZH and ZDR are in linear scales in Equations (4a)–(4c). Two Z–R relationships are derived here; Equation (4a) is for light and moderate rain rates, but Equation (4b) is for heavy rain rate.
The pixel-to-pixel time linear average accumulation scheme is also used for the DSD-derived radar hourly accumulation field, and they are evaluated independently by using hourly measurements from gauges during the severe rainfall events. In addition, no advection techniques like the Tracking Radar Echo by Correlations (TREC) method are used in the current data processing, because it may introduce additional uncertainties in temporal sampling caused by the errors in the TREC advection field, and the current rainfall-filled textures of each of the radar QPE estimators in this event seem not to be distorted due to the temporal sampling issue in Section 3.3.

3. Results

3.1. Weather Background

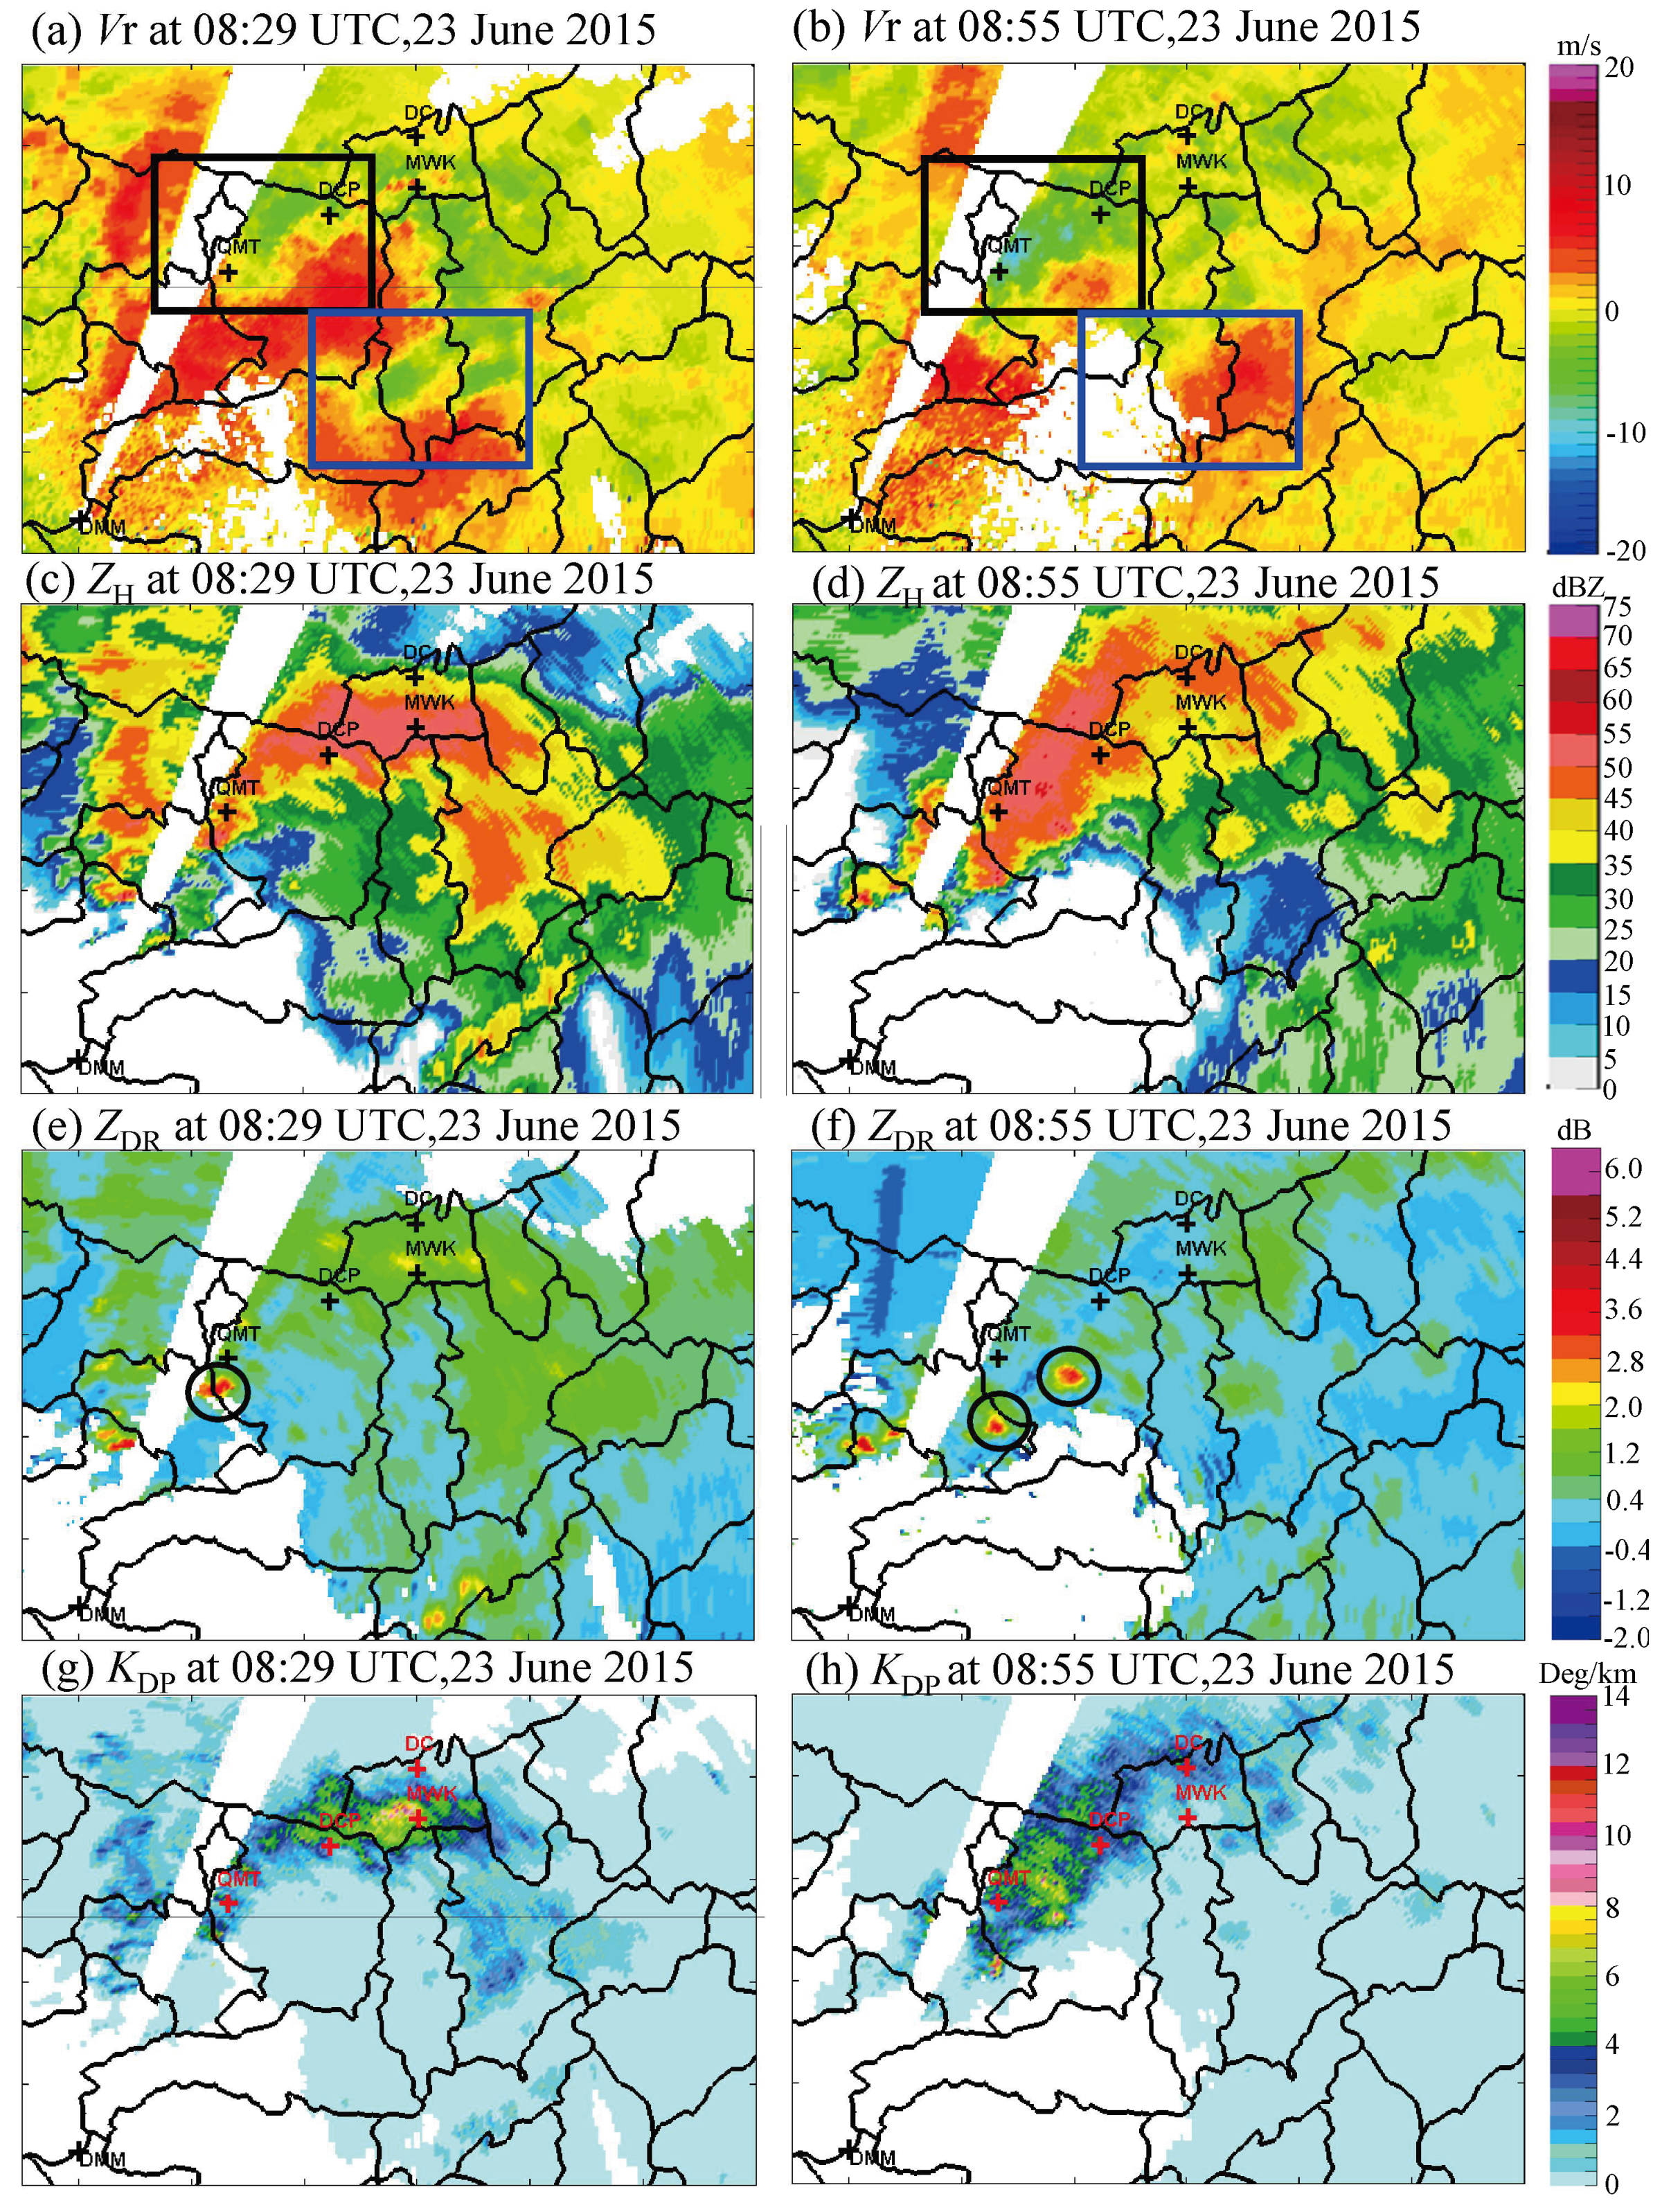
The severe rainfall event that occurred during 0800–1000 UTC, 23 June 2015 (only time will be mentioned afterwards) was mainly caused by a severe convective rainstorm, accompanied by a significant interaction of a mesocyclone with the northwestern mountainous terrain of Hangzhou. The mesocyclone, as shown by the radial velocity (Vr) data on Figure 4a, presents obvious positive and negative 
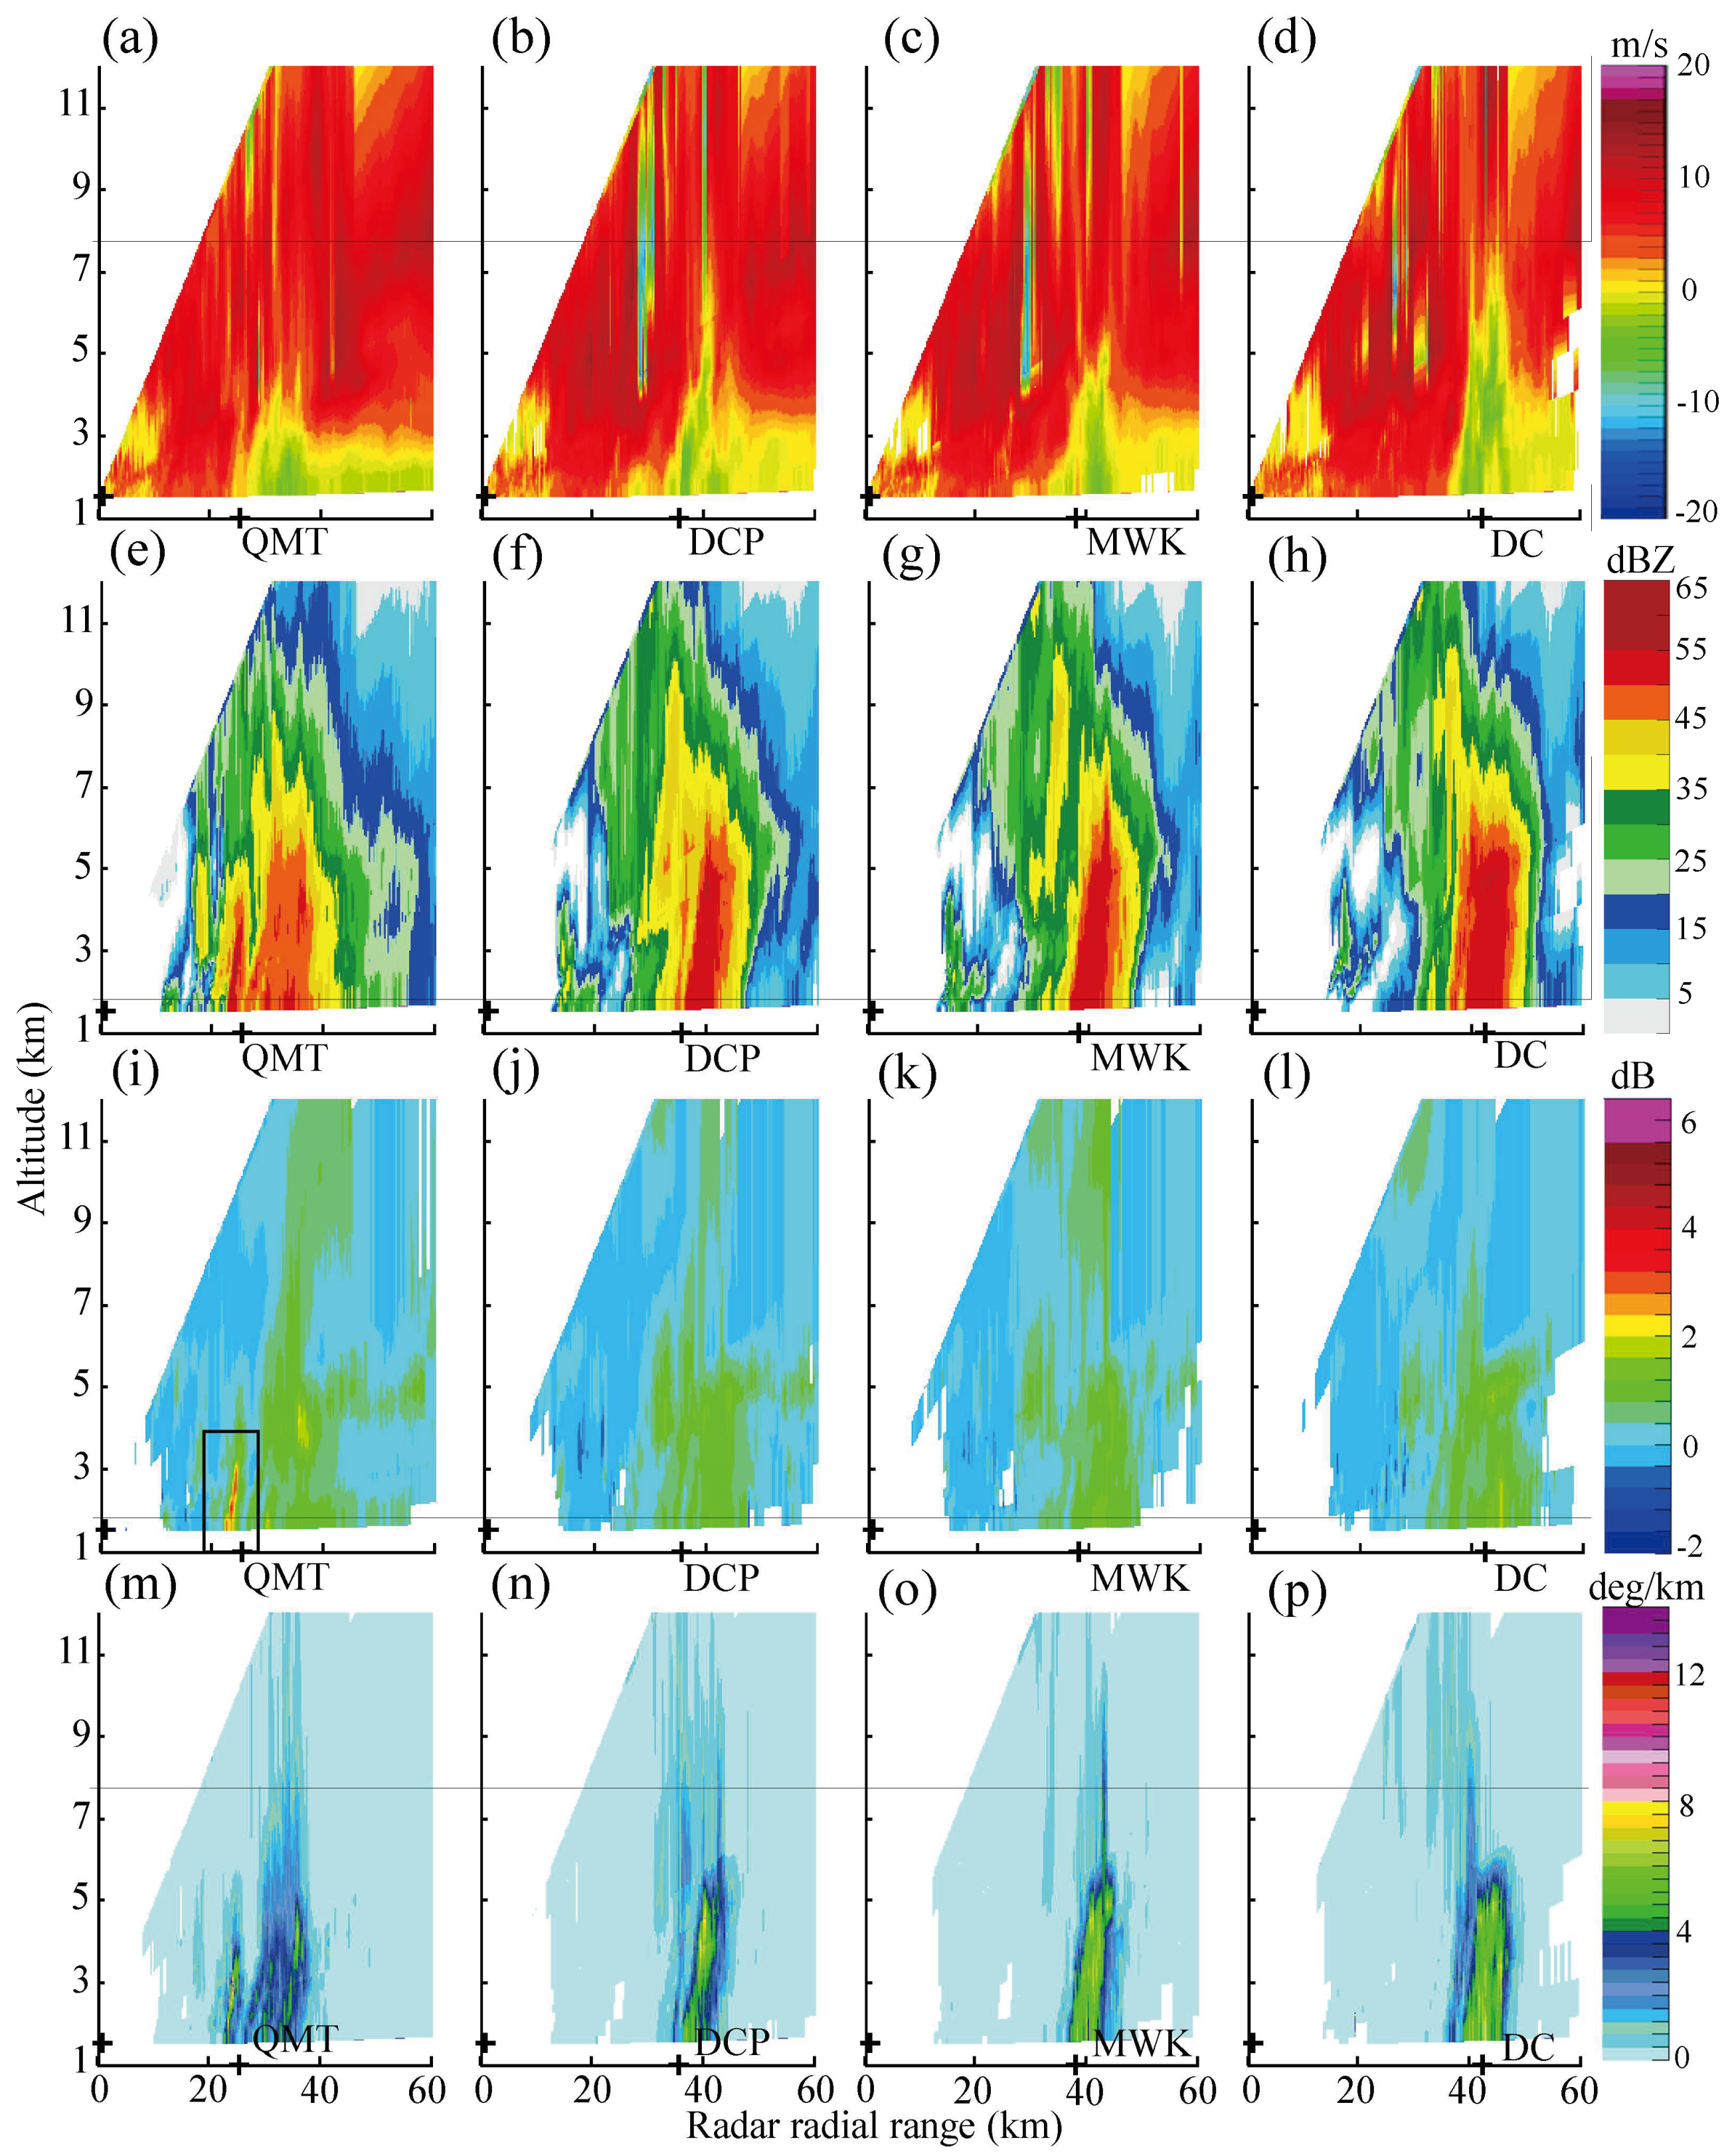
Vr pairs near gauge stations at 0829 UTC. These gauge stations began observations of rainfall at that time, and they were all located to the edge of the convergence line of the mesocyclone, which can be seen from the vertical cross-section (VCS) structures of Vr in Figure 5a–d. The updrafts within this rainstorm were also quite intense, with the mesocyclone moving towards the mountainous area.
Similar positive and negative Vr values were distributed around the black and blue rectangular areas on Figure 4a; the air flow within the blue rectangle evolved quickly afterwards, in comparison with the Vr spatial structures in Figure 4b. The negative Vr values in the black rectangle on Figure 4b became much larger than that in 
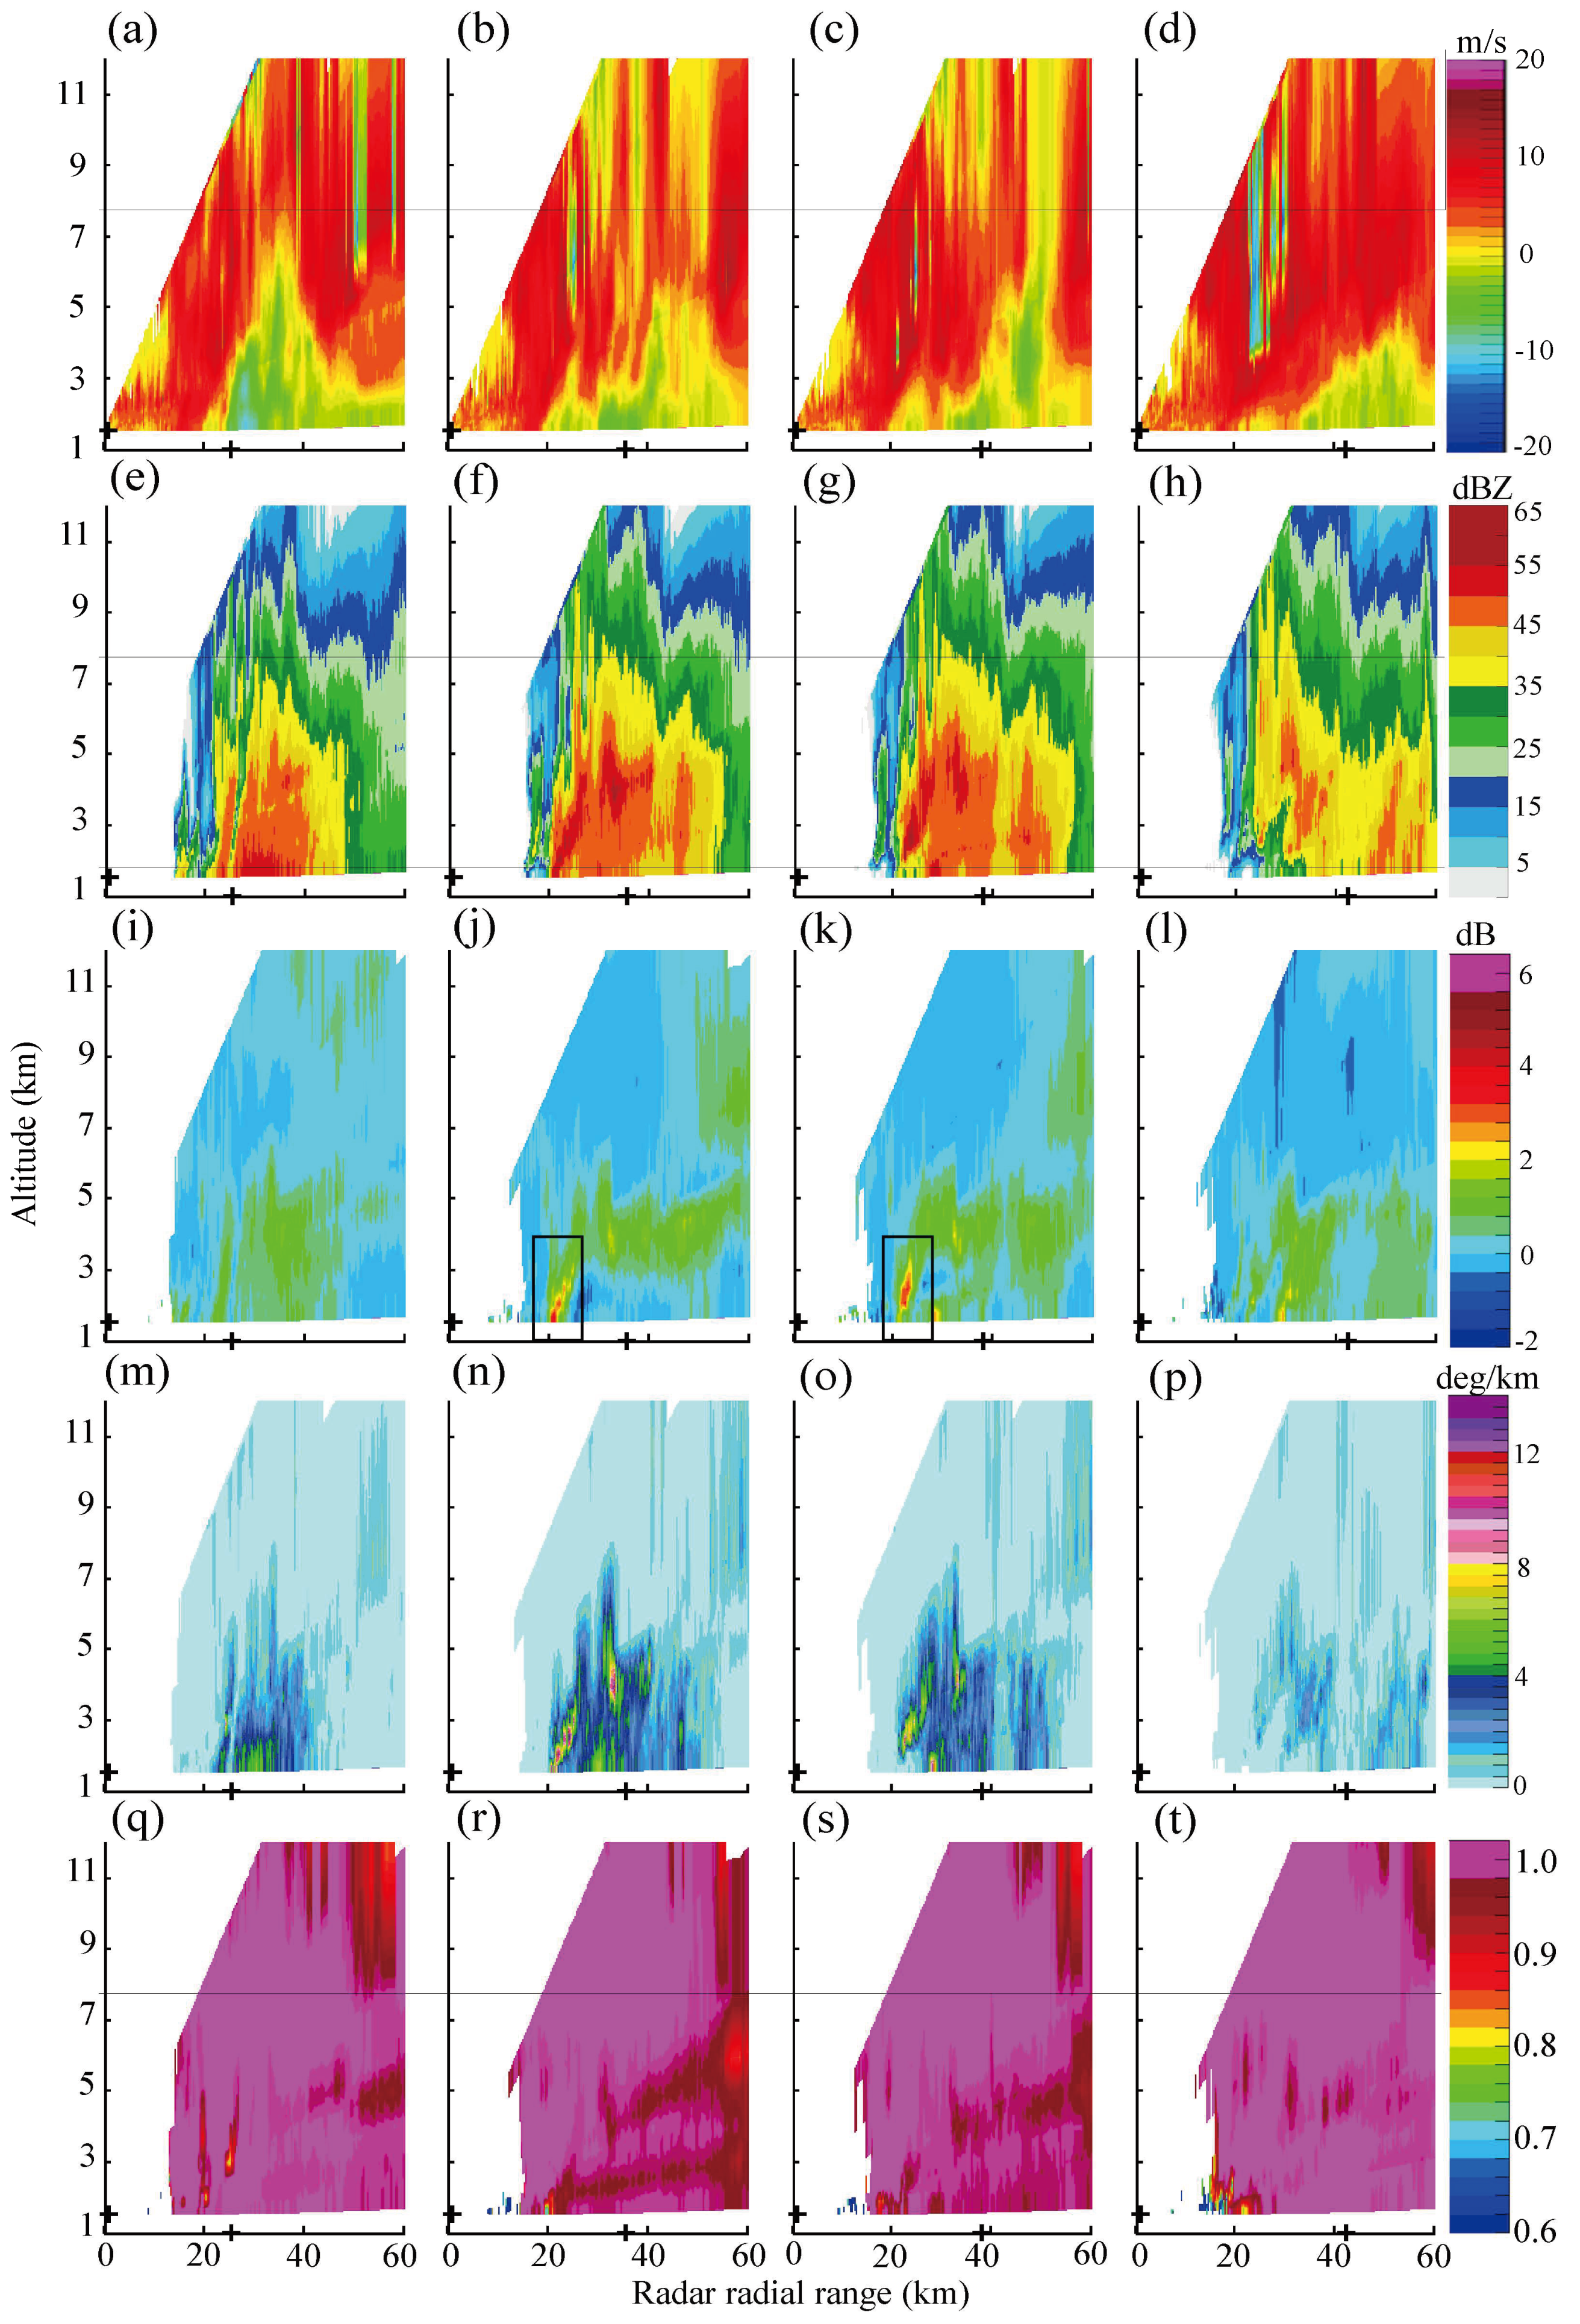
Figure 4a, which implied that the mesocyclone was further enhanced since 0855 UTC, due to the lifting effect of the northwestern mountainous terrain. The VCS structures of Vr were oriented to the gauge stations (see details on Figure 6a–d), all presenting more severe convective characteristics than that at 0829 UTC, except that orienting to DC (on Figure 5a–d). The updraft flow upon MWK extended to an altitude of 12 km, as depicted by Figure 6c, although this state only lasted for a very short amount of time. The downdraft played a dominant role for posterior surface rainfall accumulation, and some hydrometeors above 5 km altitude may have been dragged down to the lower layers after this moment, which aggravated the heavy rain shower upstream of the flood area.
The severe convective rainfall was followed by the mesocyclone. The total rainfall at DCP station was recorded as 33.5 mm over 18 min from 0818 to 0836 UTC, and this accumulated to 48.2 mm in 42 min. The other three stations had similar trends; the rainfall accumulation at QMT station recorded 61.5 mm in 42 min from 0836 to 0906 UTC, the MWK station recorded 60.6 mm in 30 min from 0824 to 0854 UTC, and the DC station recorded 49.6 mm rainfall in 30 min from 0836 to 0906 UTC. However, it is still challenging to accurately analyze the precipitation structure by using this sparse rain gauge network, and it is not sufficient to issue an early flood warning according to these measurements. Therefore, polarimetric radar measurements and QPE products play an indispensable role for severe rainfall diagnosis and analysis.

3.2. Evaluation Metrics

Rather than evaluating radar instantaneous rainfall rates with short-time gauge measurements, radar-derived hourly rainfall estimations are compared with gauge hourly measurements, which are aggregated and utilized to reduce the random errors associated with gauge sampling in very short-time periods, especially in the light rainfall scenarios. Three statistical scores, including the normalized mean absolute error (ENMA), root mean square error (ERMS), and correlation coefficient (ECC), are used to evaluate each radar-derived hourly rainfall estimation, respectively, which are defined as
E NMA = i = 1 n | r i g i | i = 1 n g i
E RMS = 1 n i = 1 n | r i g i | 2
E CC = i = 1 n ( r i r ¯ ) ( g i g ¯ ) i = 1 n ( r i r ¯ ) 2 i = 1 n ( g i g ¯ ) 2
where ri and gi are radar-estimated and gauge-observed hourly rainfall accumulations; respectively, r ¯ and g ¯ stand for their average values. Better radar QPE performance is associated with lower ENMA and ERMS scores, but larger ECC scores, which can be directly used for the comparison of the evaluation results. These evaluation scores usually assume the surface gauge measurements as the “ground truth” in some verification work; however, horizontal wind effects on gauge measuring accuracy should be considered during the comparison and the analysis process in the extreme rainfall event [35].

3.3. Comparison of Different Radar QPE Approaches

Before establishing the DSD-derived radar rainfall retrieval relationships, the traditional feedback-derived rainfall methodology described in Section 2.3 was put into the routine meteorological operations. Different from the standard DSD-derived approaches, surface gauge measurements are used as feedback source to merge with ZH to obtain adaptive radar QPE estimators. Using ZHM and ZHC to represent the measured ZH and the attenuation-corrected ZH, R(ZHM,G) and R(ZHC,G) can be estimated from ZHM and ZHC, respectively. Through utilizing the DSD—simulated dataset, standard DSD-derived polarimetric radar QPE estimators can also be obtained, as described in Section 2.4, and represented as R(ZHC), R(ZHC,ZDR), R(KDP), and R(AH). Here, ZDR in R(ZHC,ZDR) stands for attenuation-corrected ZDR. These radar hourly rainfall estimators are evaluated with hourly gauge measurements, respectively, and then their evaluation score results are compared with each other.
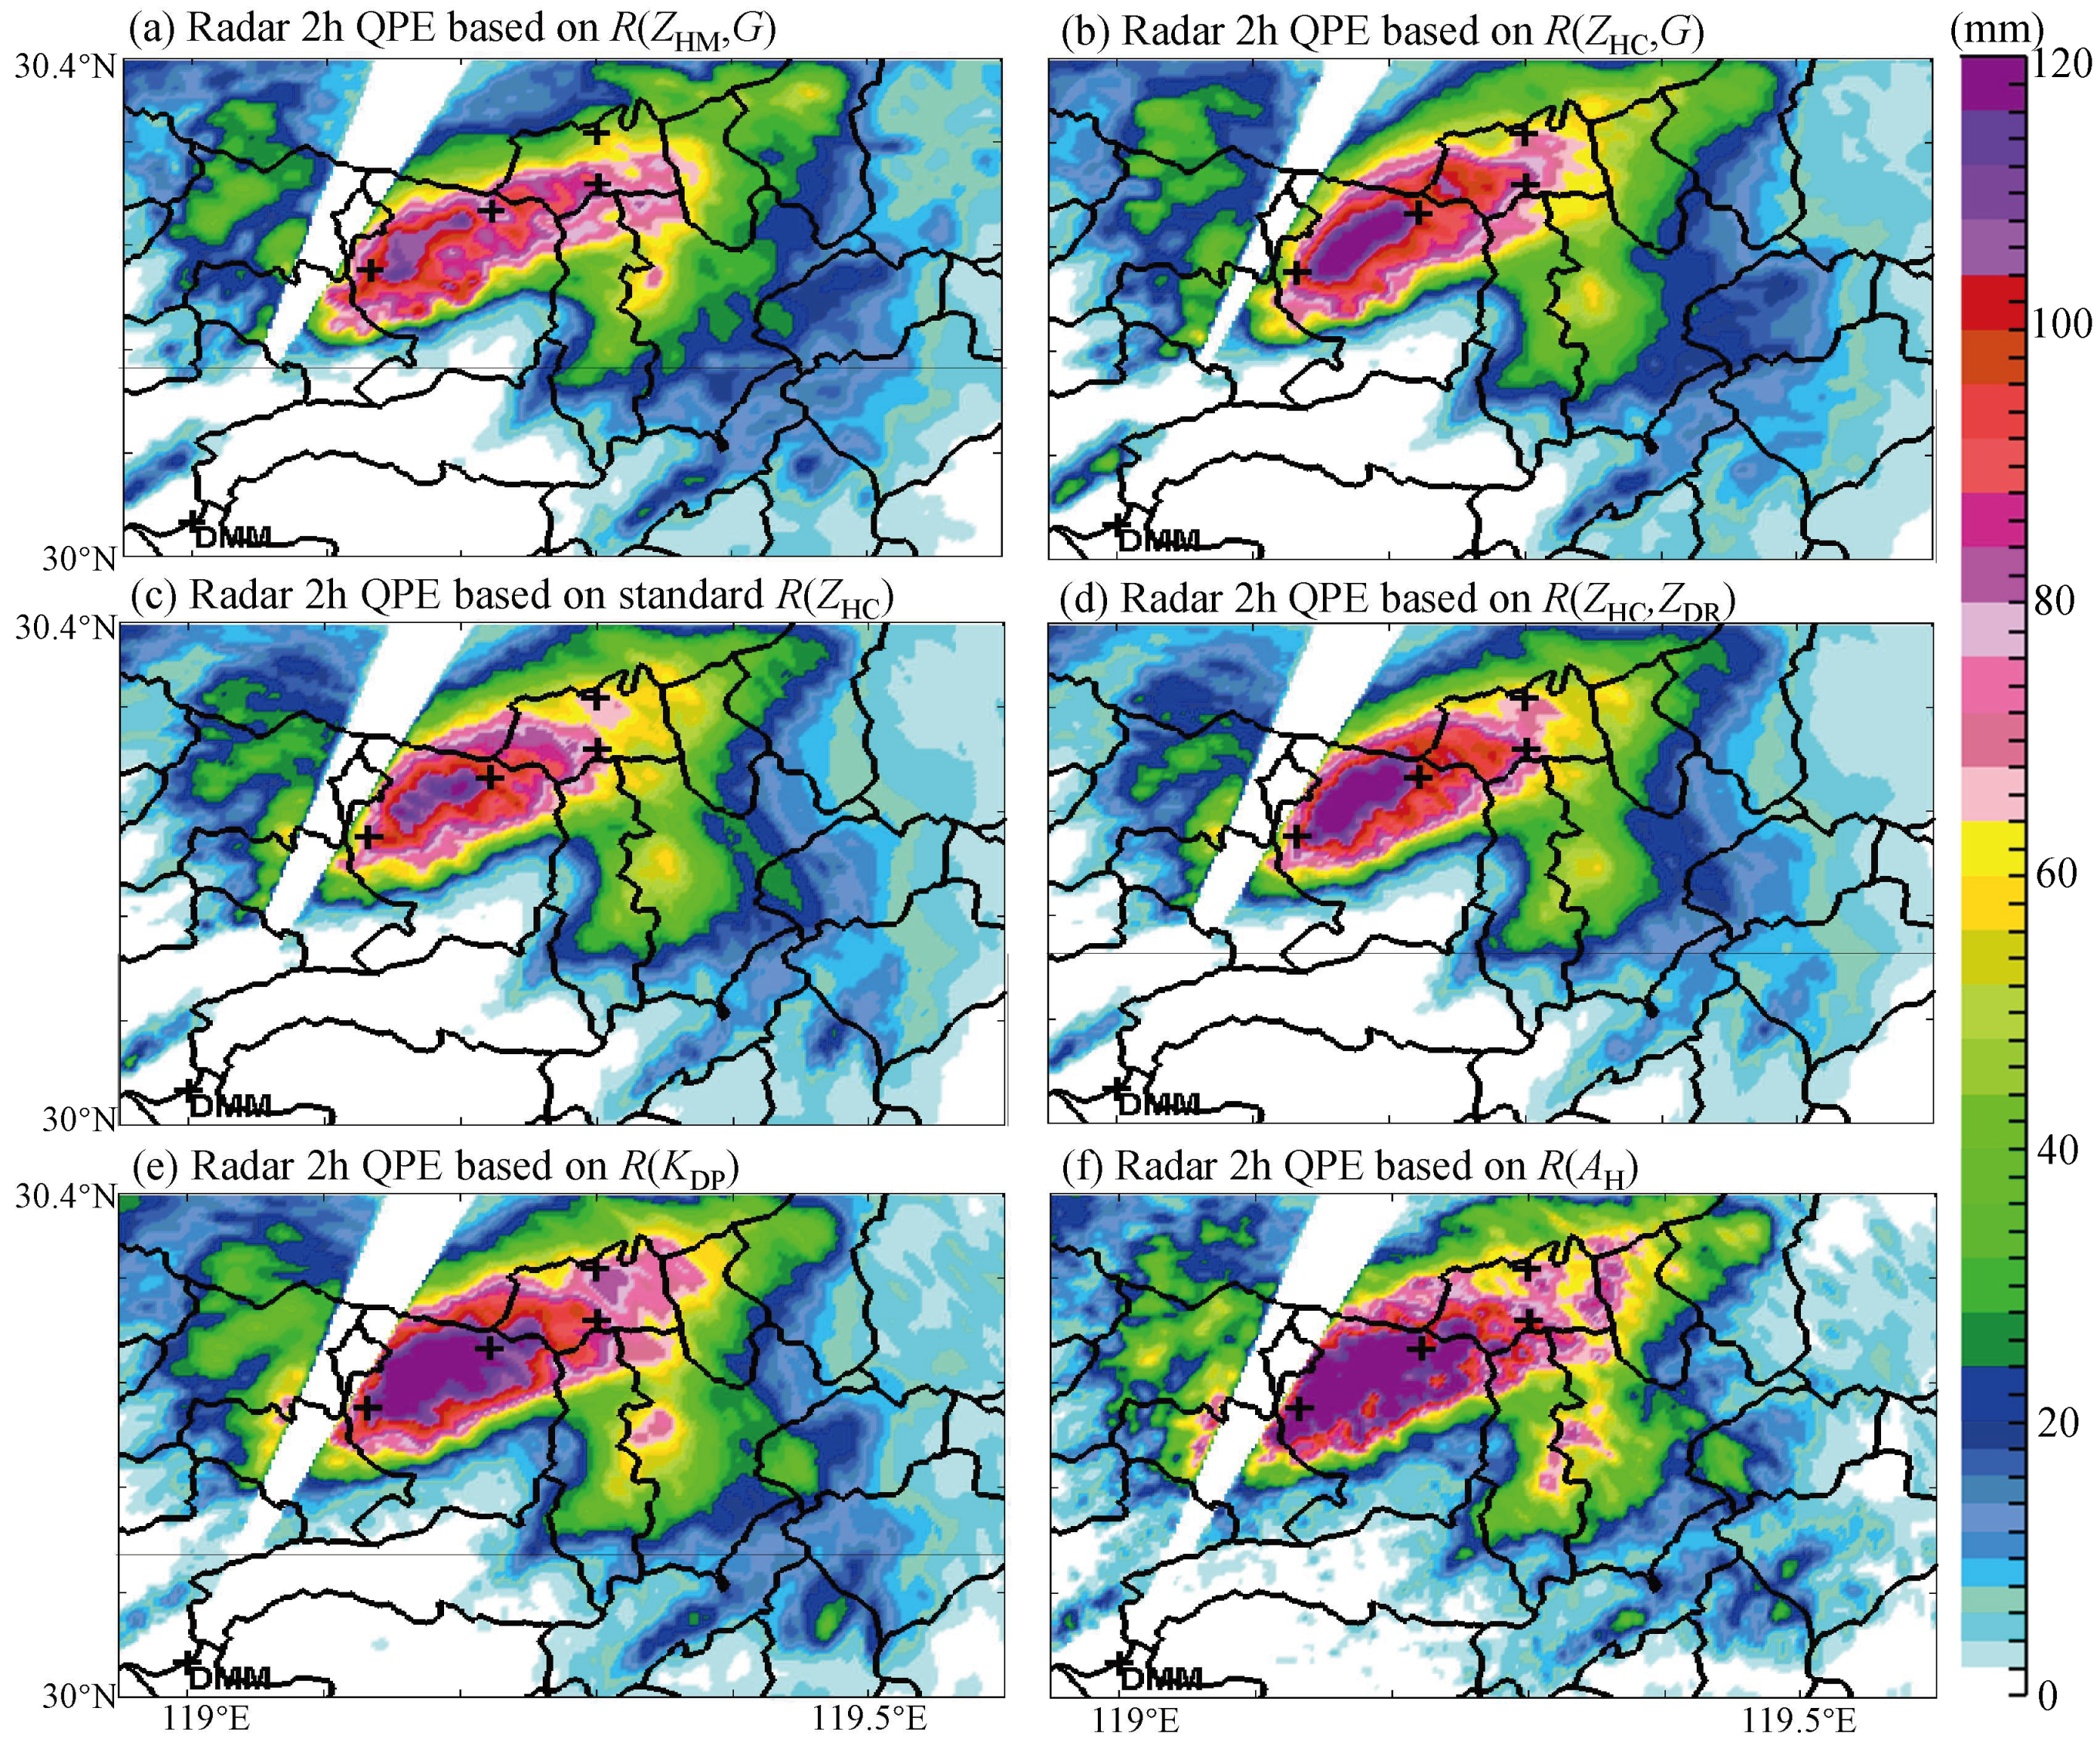
Accordingly, radar 2 h rainfall accumulation fields derived from six radar QPE estimators are depicted in Figure 7, with four “+” marks representing gauge locations. Similar rainfall spatial distributions can be easily perceived in Figure 7, except those derived by R(ZHM,G) in Figure 7a, in which the distortion of the rainfall field is mainly caused by the attenuation effects on ZH. In contrast to the results derived from standard R(ZHC) and R(ZHC,G) on Figure 7b,c both show very clear rainfall textures that gradually extend from the severe rainfall center to its surrounding areas.
R(ZHC) and R(ZHC,G) both performed better than R(ZHC,G), from a comparison of the statistical scores in Table 1, and their ERMS sores were reduced by 55.7% and 74.9%, respectively. ENMA was reduced by 52.7% and 74.1%, and ECC was enhanced by 2.3% and 3.7%, respectively. R(ZHC,G) also performed better than R(ZHC), and ERMS, ENMA, and 
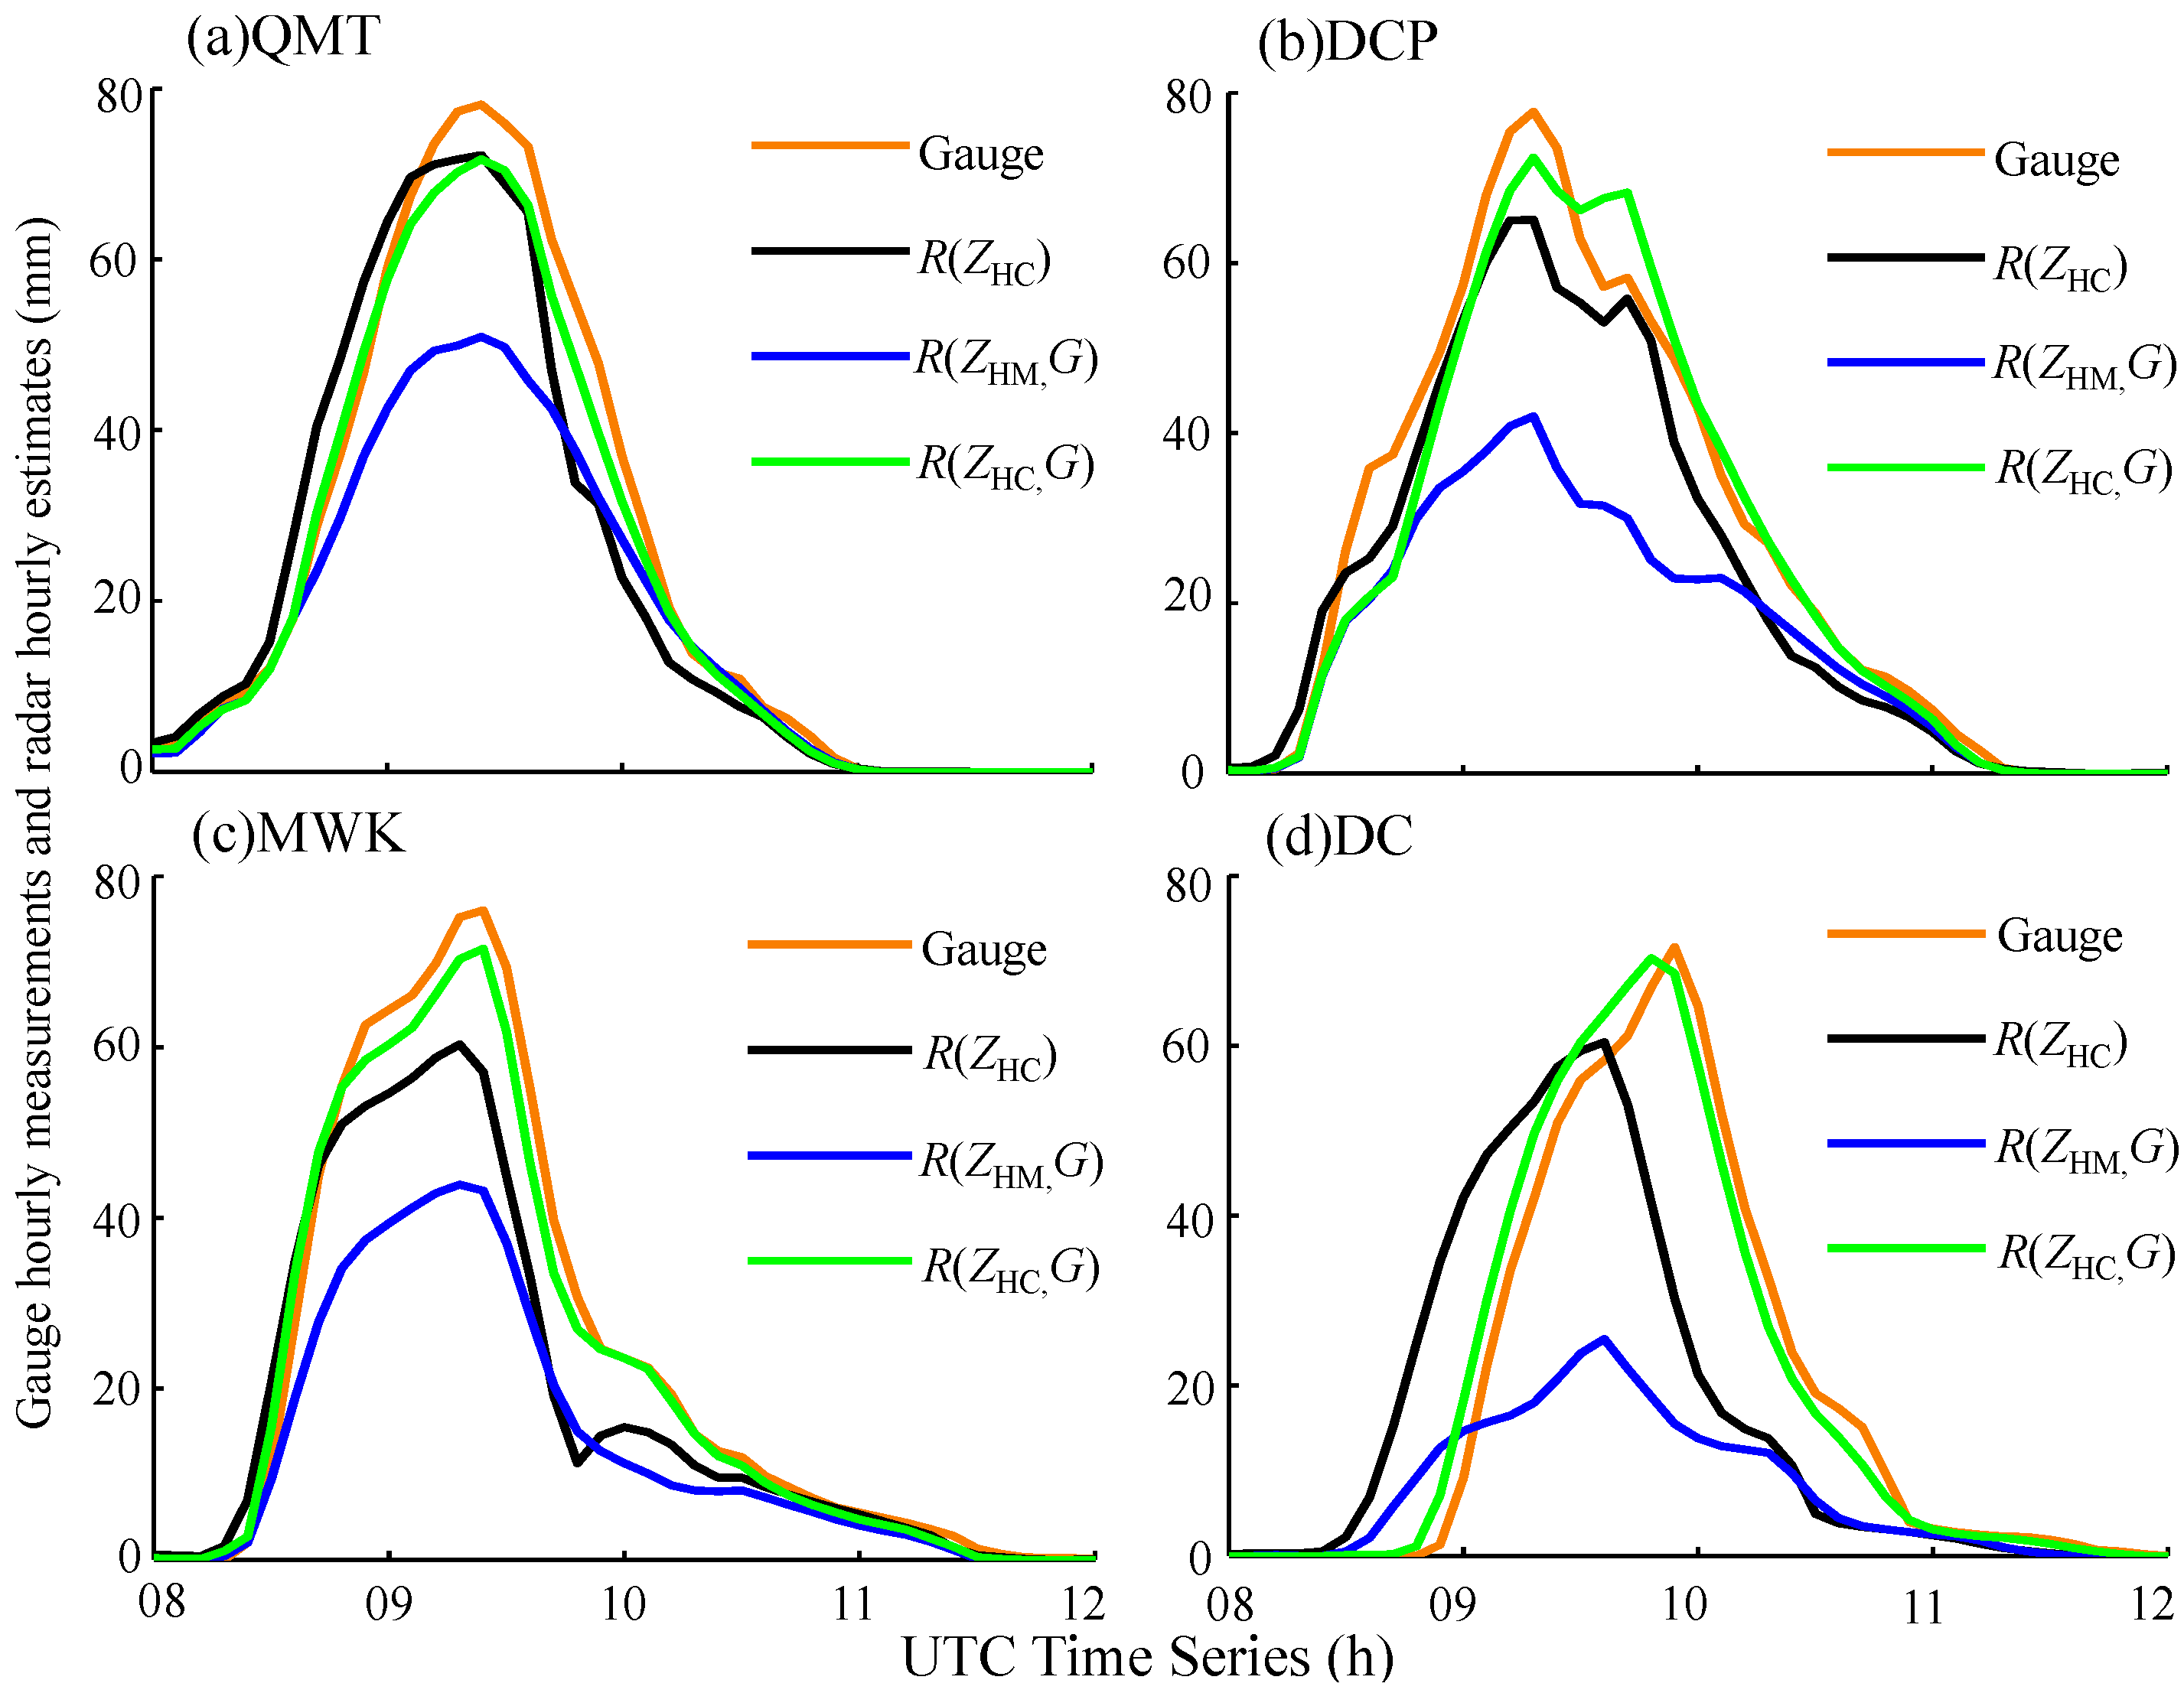
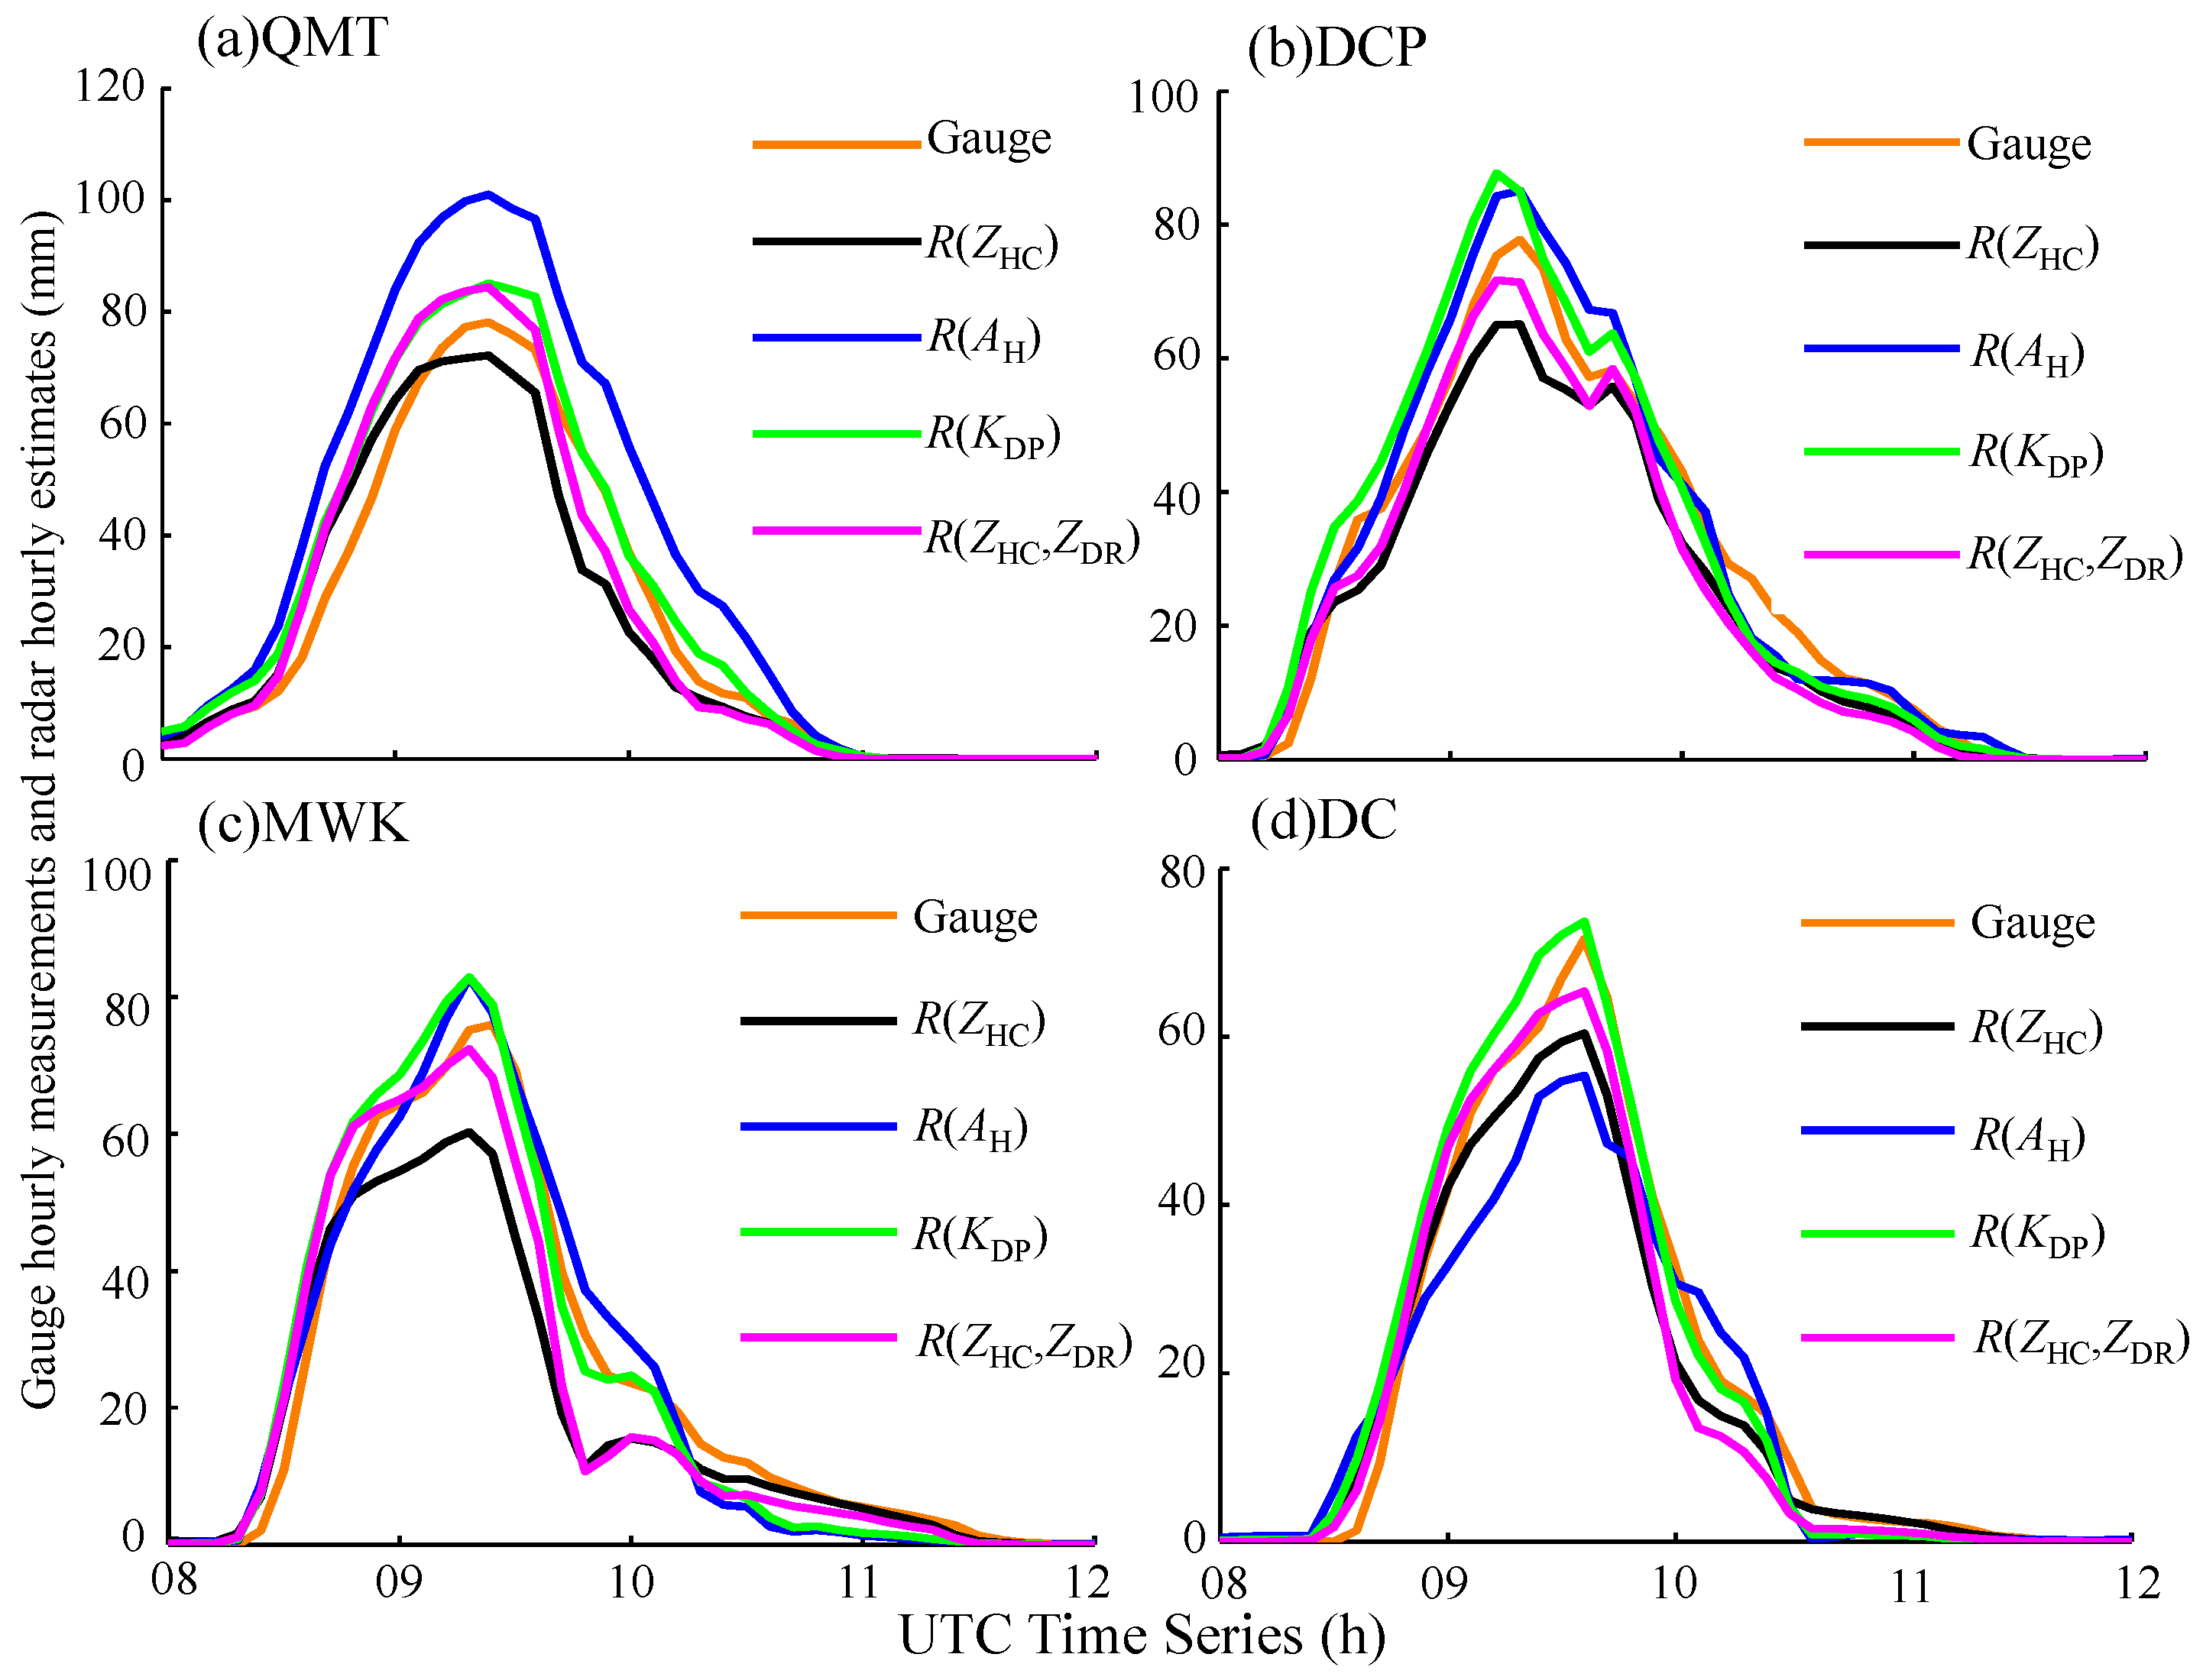
ECC scores were improved by 43.4%, 45.3%, and 1.4%, respectively. The rainfall time series in Figure 8 presents another similar view: R(ZHM,G) presented obvious underestimations at all gauge stations; the R(ZHC) and R(ZHC,G) time series were similar to each other, and to gauge measurements at QMT and MWK (see Figure 8a,c), but R(ZHC,G) was closer to the gauge measurements than R(ZHC) at DCP and DC (see Figure 8b,d).
The improvements of R(ZHC) to R(ZHM,G) can be attributed to the utilization of the improved ZPHI method and the DSD-derived Z–R relationships. Instead, the superiority of R(ZHC,G) to R(ZHM,G) is mainly attributed to the former factor, because the same fitting scheme as R(ZHM,G) was used, but R(ZHC,G) to R(ZHC) benefited from the dynamically adjusted Z–R relationships. DSD-derived R(ZHC) uses climatically optimal but two fixed ZR relationships, which may fail if they are not exactly suitable for the special weather events. The ZH threshold in Equations (4a) and (4b) for differentiating rain regimes relies on the assumption that the multiple coexisting rainstorms with similar radar echoes have the same rainfall rates, which are not always in favor if the covering terrain or the underlying surface of the different rainstorms have different environmental characteristics. Instead, R(ZHC,G) adjusts the ZR relationships dynamically, according to the feedback from the gauge measurements, and it is expected that the spatiotemporal characteristics of the rainstorms can be effectively captured. It appears that R(ZHC,G) benefits more from representative Z–R relationships than R(ZHC) in this severe rainfall event, which implies that it is just not well represented by the DSD-derived ZR relationships.
As depicted in Figure 7d–f, the radar 2 h rainfall accumulation field retrieved from the DSD-derived R(ZHC,ZDR), R(KDP), and R(AH) presented similar rainfall field textures to those of Figure 7b. R(ZHC,ZDR) and R(KDP) both presented better scores than R(ZHC) in Table 1. Comparing with R(ZHC), the ERMS scores of R(ZHC,ZDR) and R(KDP) were reduced by 14.5% and 23.8%, their ENMA scores are reduced by 13.2% and 17.6%, and the ECC scores were enhanced by 0.2% and 1.3%, respectively. This shows the superiority of the composite utilization of ZH and ZDR, and the better representativeness of KDP than ZH in the severe rainfall scenarios.
According to the statistical scores comparison in Table 1, R(KDP) performed the best among four DSD-derived polarimetric radar QPE estimators, and R(ZHC,G) indeed performed the best among all of the radar QPE estimators; its ERMS and ENMA scores were 26.4% and 33.6% less than R(KDP), respectively, and the ECC score was 0.1% larger than R(KDP). However, for R(ZHM,G) and R(ZHC,G) both used all four gauge measurements without dataset partition for cross-validation, their scores in Table 1 reflect more about the degree to which radar estimates approximate gauge measurements according to Equation (3). Besides, these scores assume that gauge measurements are always the truth, but their measurements may be not accurate enough, especially if the horizontal and vertical wind effects are taken into account, which obviously accompanies the development of the mesocyclone during this extreme rainfall event, and makes the gauge measurements much less than its potential truth. These gauges are all tipping buckets without any wind fences; furthermore, no correction of gauge measurement is routinely done in the meteorological operations, which means that their real values are possibly larger than the current recordings. Therefore, the apparent overestimation of radar QPE estimators would likely be reduced if the wind effects are considered with regard to gauging measurement accuracy. Although the radar rainfall time series of R(ZHC,G) and R(ZHC,ZDR) on Figure 8 and Figure 9 were both more consistent with gauge measurements than R(KDP), R(ZHC,G) slightly underestimated rainfall at QMT, MWK, and DC stations, and R(ZHC,ZDR) slightly underestimated at DCP, MWK, and DC stations at the peak of the rainfall time series. Instead, R(KDP) overestimated at all four stations, especially when the gauge hourly rainfall measurements exceeded 20 mm. Taken in this sense, R(KDP) seems more reasonable than R(ZHC,G).
However, three statistical scores of R(AH) seemed not to have improved, but were reduced in contrast to R(ZHC), and its ERMS, ENMA, and ECC scores became worse by 27.9%, 27.1%, and 1.4%, respectively, which was inconsistent with previous research results [5]. R(AH) tended to be consistent with R(KDP) at DCP and MWK (see Figure 9b,c), and R(AH) overestimated seriously at QMT station on Figure 9a, which was located on the near side of the rainstorm relative to DMM radar, but it underestimated slightly at DC station on Figure 9d, which was located on the far side of the rainstorm. To address this issue, the normalized concentration of raindrops Nw (mm−1·m−3) can be represented as in Equation (6):
N w = 4 4 π ρ w LWC D m 4
where ρw is the water density (1 g·cm−3 at 4°C), and LWC (g·m−3) and Dm (mm) stand for the liquid water content and the mean volume diameter of the drop size distribution. As for the deduction in Section 3.3, ZDR within this rainstorm was nearly the same in 0.5–2dB; namely, Dm was not very different. However, its near and far sides of the rainstorm were different in LWC, and this phenomenon implied that more raindrops concentrated on the near side between QMT and DCP than that on the far side of the rainstorm. Furthermore, considering that AH = αKDP, but that R(AH) does not perform the same as R(KDP), their performance differences can be attributed to the coefficient α, which depends on temperature and is prone to DSD variability [5], and it also can be concluded that KDP may be superior to AH in such a scenario. At last but not least, little melting hailstones may exist, accompanying the rainstorm, as in the deduction in Section 3.3, which are also responsible for the performance reduction of R(AH).
Another important phenomenon worth noting is that radar 2 h rainfall field centers of different radar QPE estimators were all above 100 mm (see Figure 7 and Max(R2H) in Table 1), but these rainfall centers were nearly all located within the gap between surface gauge stations. Namely, the gauge network failed to capture the subsequent storm evolution states within the rainfall center area. A reasonable explanation was necessary to demonstrate the confidence of the radar rainfall retrieval results, which was important for the posterior disaster investigation.

3.4. Microphysical Characteristics of the Rainstorm

More microphysical information can be deduced from the spatial and vertical structures of polarimetric radar variables in Figure 4, Figure 5 and 
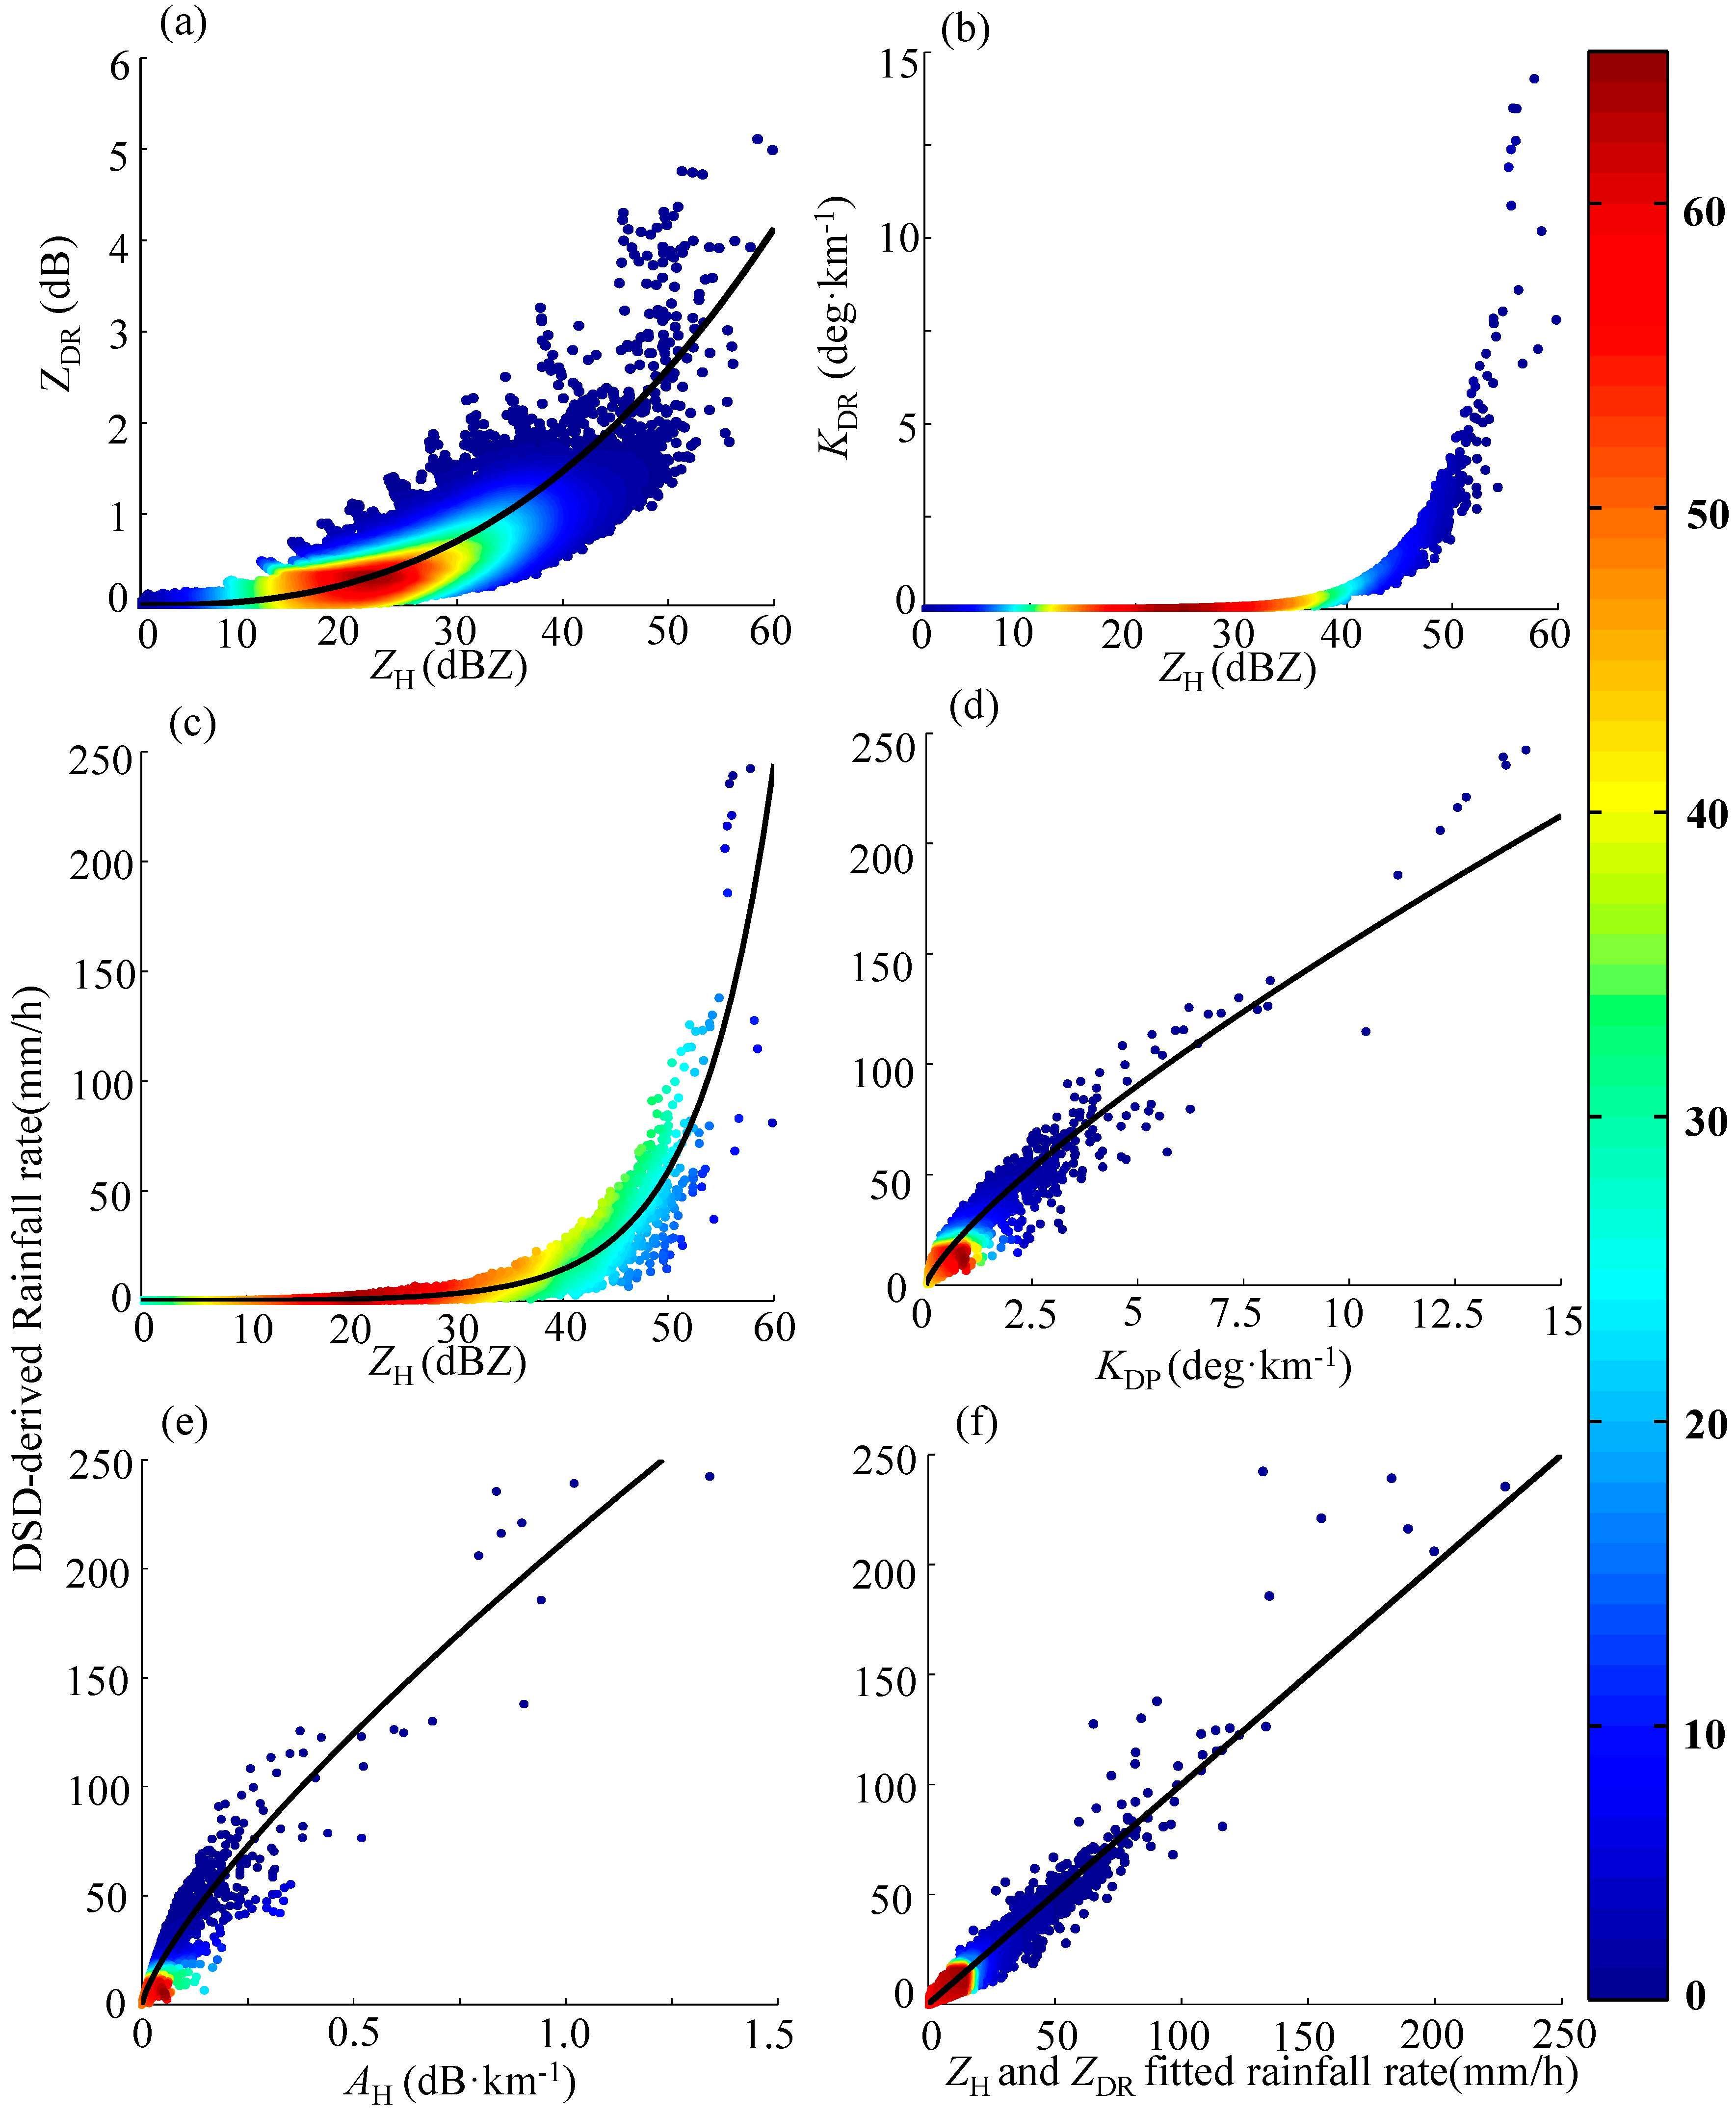
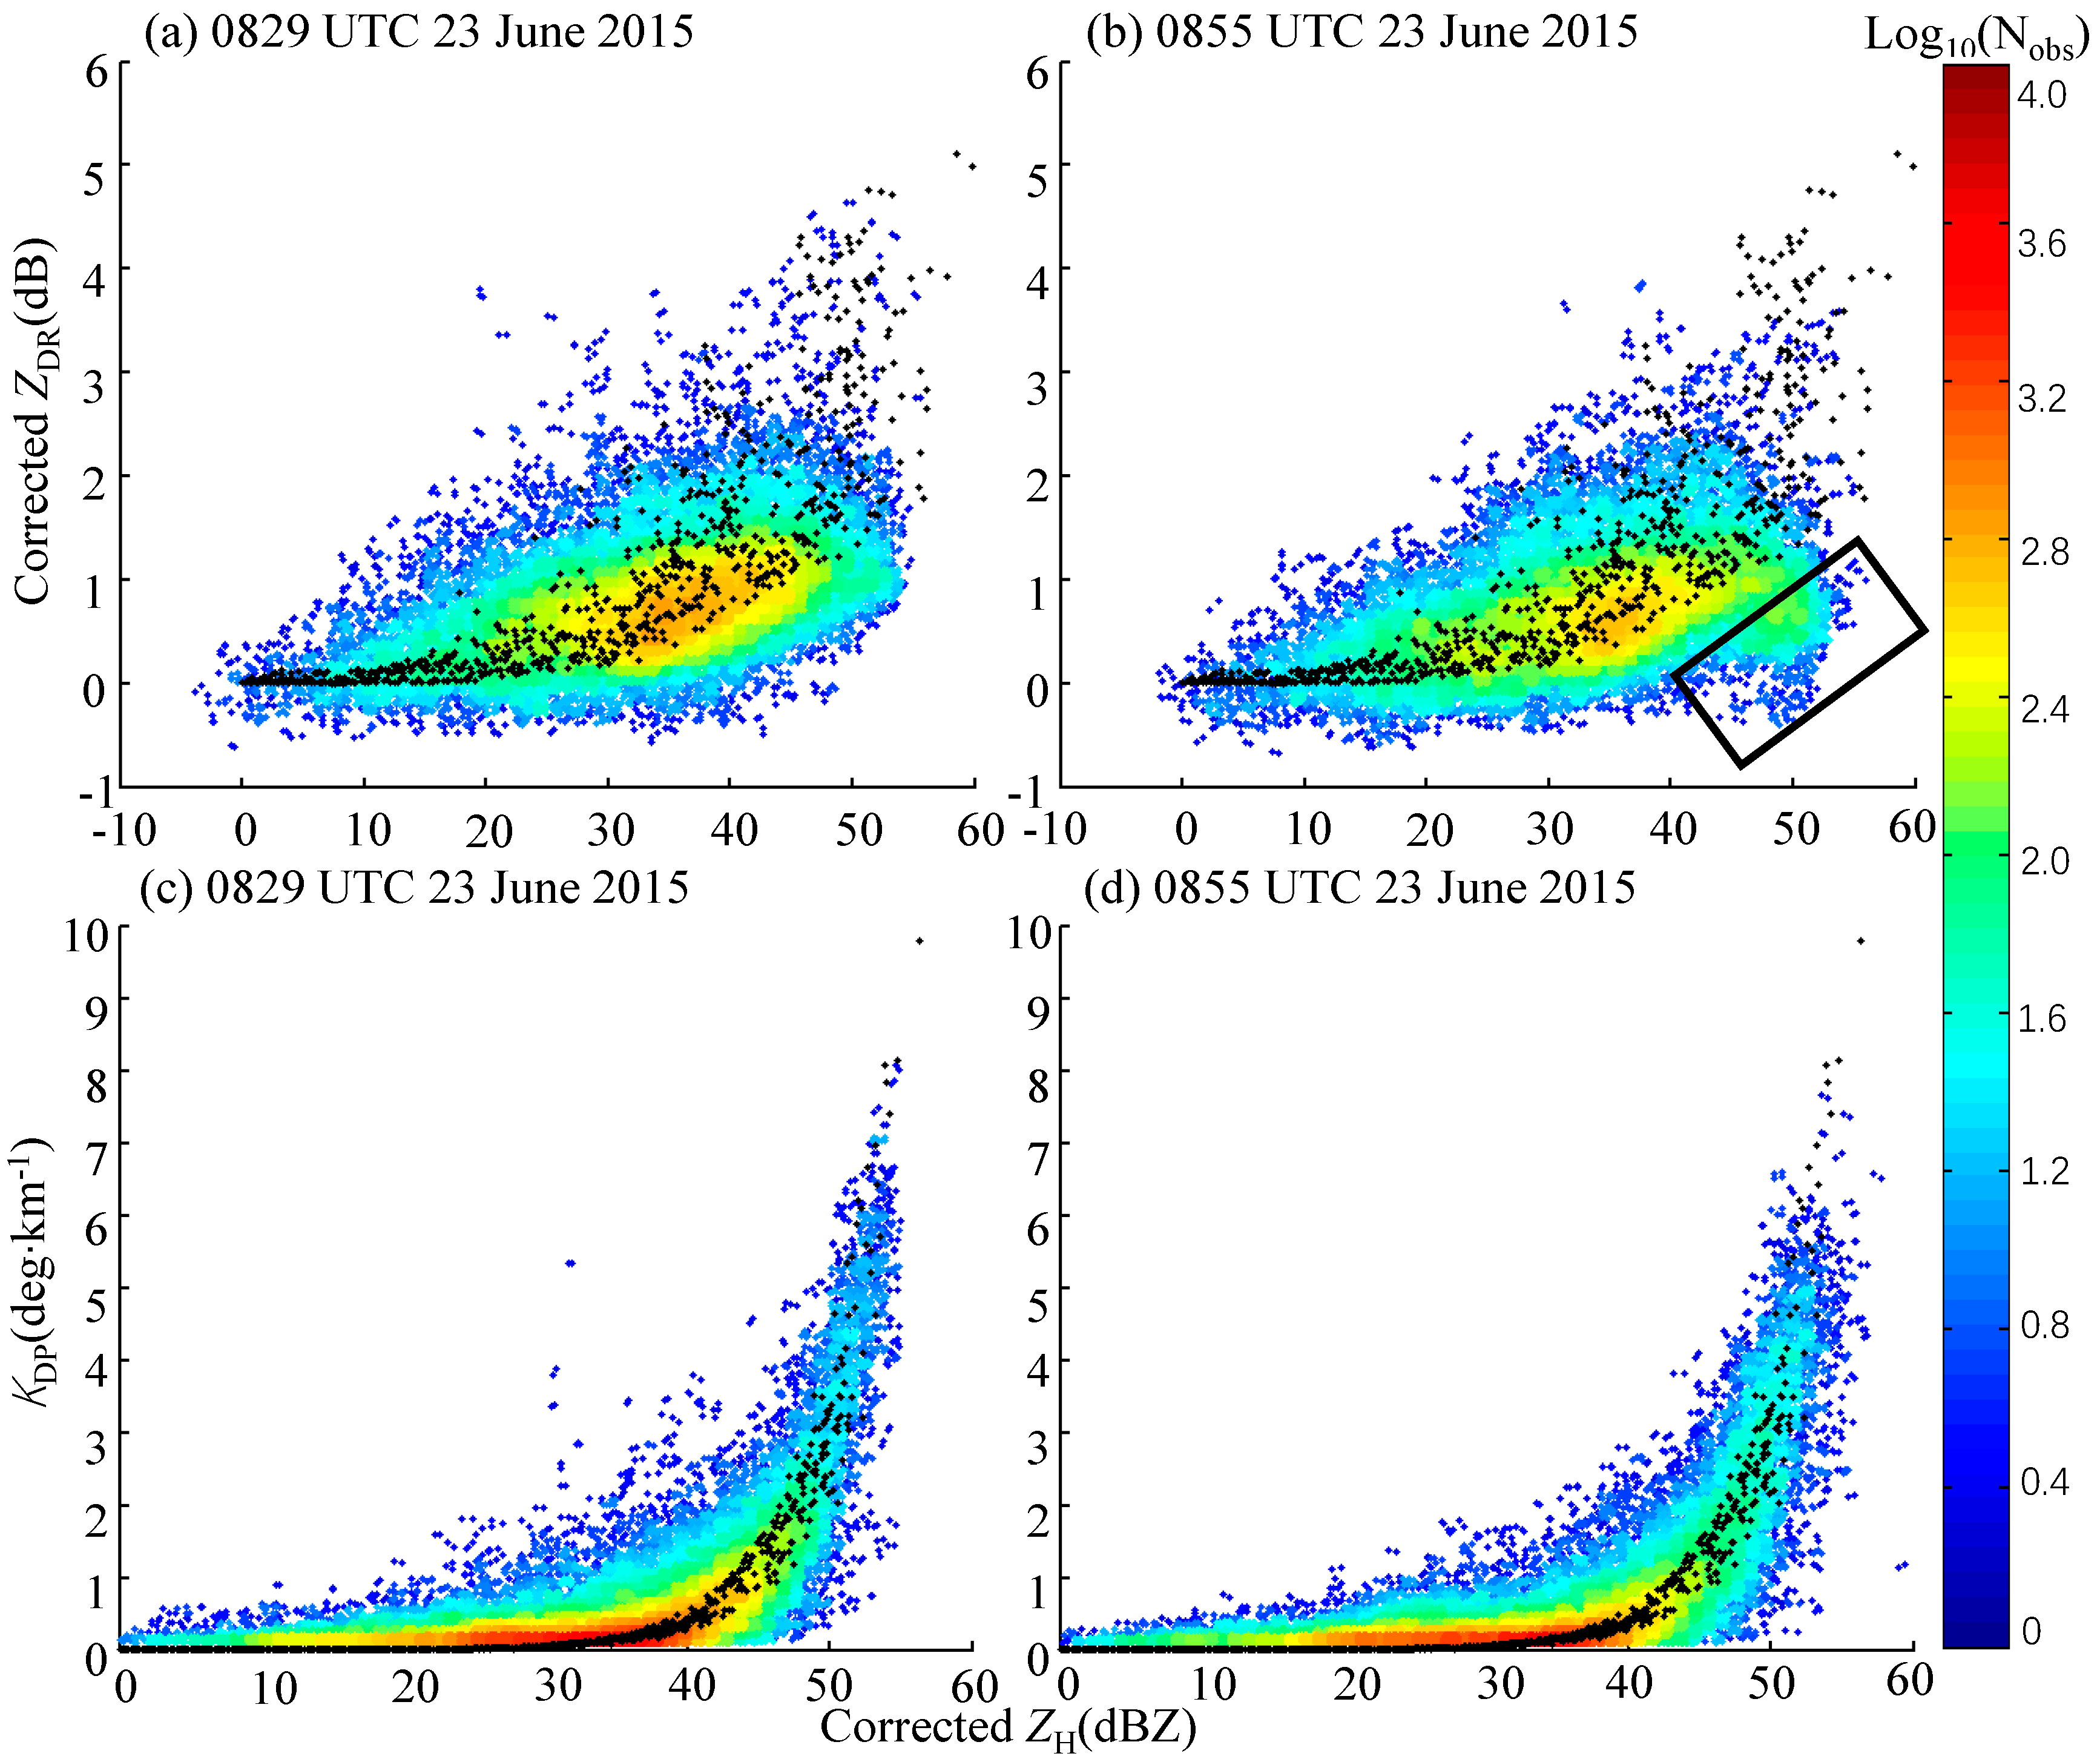
Figure 6 of the rainstorm and its severe rainfall centers. Before the data analysis, consistency between ZH, ZDR, and KDP was first verified through the scattergram on Figure 10, in which scatters of 743 DSD-simulated ZH, ZDR, and KDP pairs were overlaid for intercomparison. It can be seen that the scattergram of ZDRZH agreed well with the DSD-simulated ZDRZH distributions on Figure 10a,b. ZDR presented a similar tendency, with ZH increasing, which obeyed the classical liquid raindrops model. The scattergram of KDP and ZH was also consistent with DSD-simulated distributions. Figure 10c,d shows that ZH increase tends to be consistent with KDP increase, which is immune to attenuation and miscalibration. The consistency between ZH, ZDR, and KDP is to ensure their creditability, and to enhance the confidence of these polarimetric variables, as seen in Figure 4, Figure 5 and Figure 6, for subsequent applications.
As shown in Figure 4c, the plan position indicator (PPI) of ZH exhibited dense storm structures at 0829 UTC. QMT, DCP, and MWK were just located on the edge of the storm cells at this moment, and they had just begun recording intense rainfall measurements near the convergence line of the mesocyclone. The VCS of ZH oriented to the four stations presented severe convective structures (see Figure 5e–h), and ZH within the storm core area exceeded 60 dBZ, which indicates that the storm cell was strongly developing at 0829 UTC. These were consistent with the significant increasing measurements of the hourly rainfall time series illustrated in Figure 8 and Figure 9. The rainstorm is more convective in Figure 4d than that in Figure 4c, and the updraft flow was more severe, as described in Section 3.1. The shape of the rainstorm upon the rainfall center area between QMT and DCP appeared as an effusive eruption structure along the mountainous terrain with a ZH hotspot. More complex microphysical processes may exist within the rainstorm, which can be further analyzed by using ZDR, KDP, and ρHV.
An important phenomenon accompanying the rainstorm is that big raindrops exist along the mesoscale convergence line, with large ZDR values (exceeding 2dB) near QMT on Figure 4e, and at the south of QMT and DCP on Figure 4f (marked with black circles). As depicted in the rectangle on Figure 5i and Figure 6j,k, the large ZDR columns are obviously related to the large ZH columns in Figure 5e and Figure 6f,g, which are all consistent with the convergence structures of Vr in Figure 5a and Figure 6b,c. These ZDR columns are caused by the sustaining updraft flow along the convergence line of the mesocyclone [35,36]. However, this rainstorm does not present big ZDR values within most of its parts; conversely, it is mainly composed of small ZDR values (less than 2dB), which can be seen from both the ZDR PPI scans and the VCS structures of ZDR, as illustrated by Figure 5i–l and Figure 6i–l.
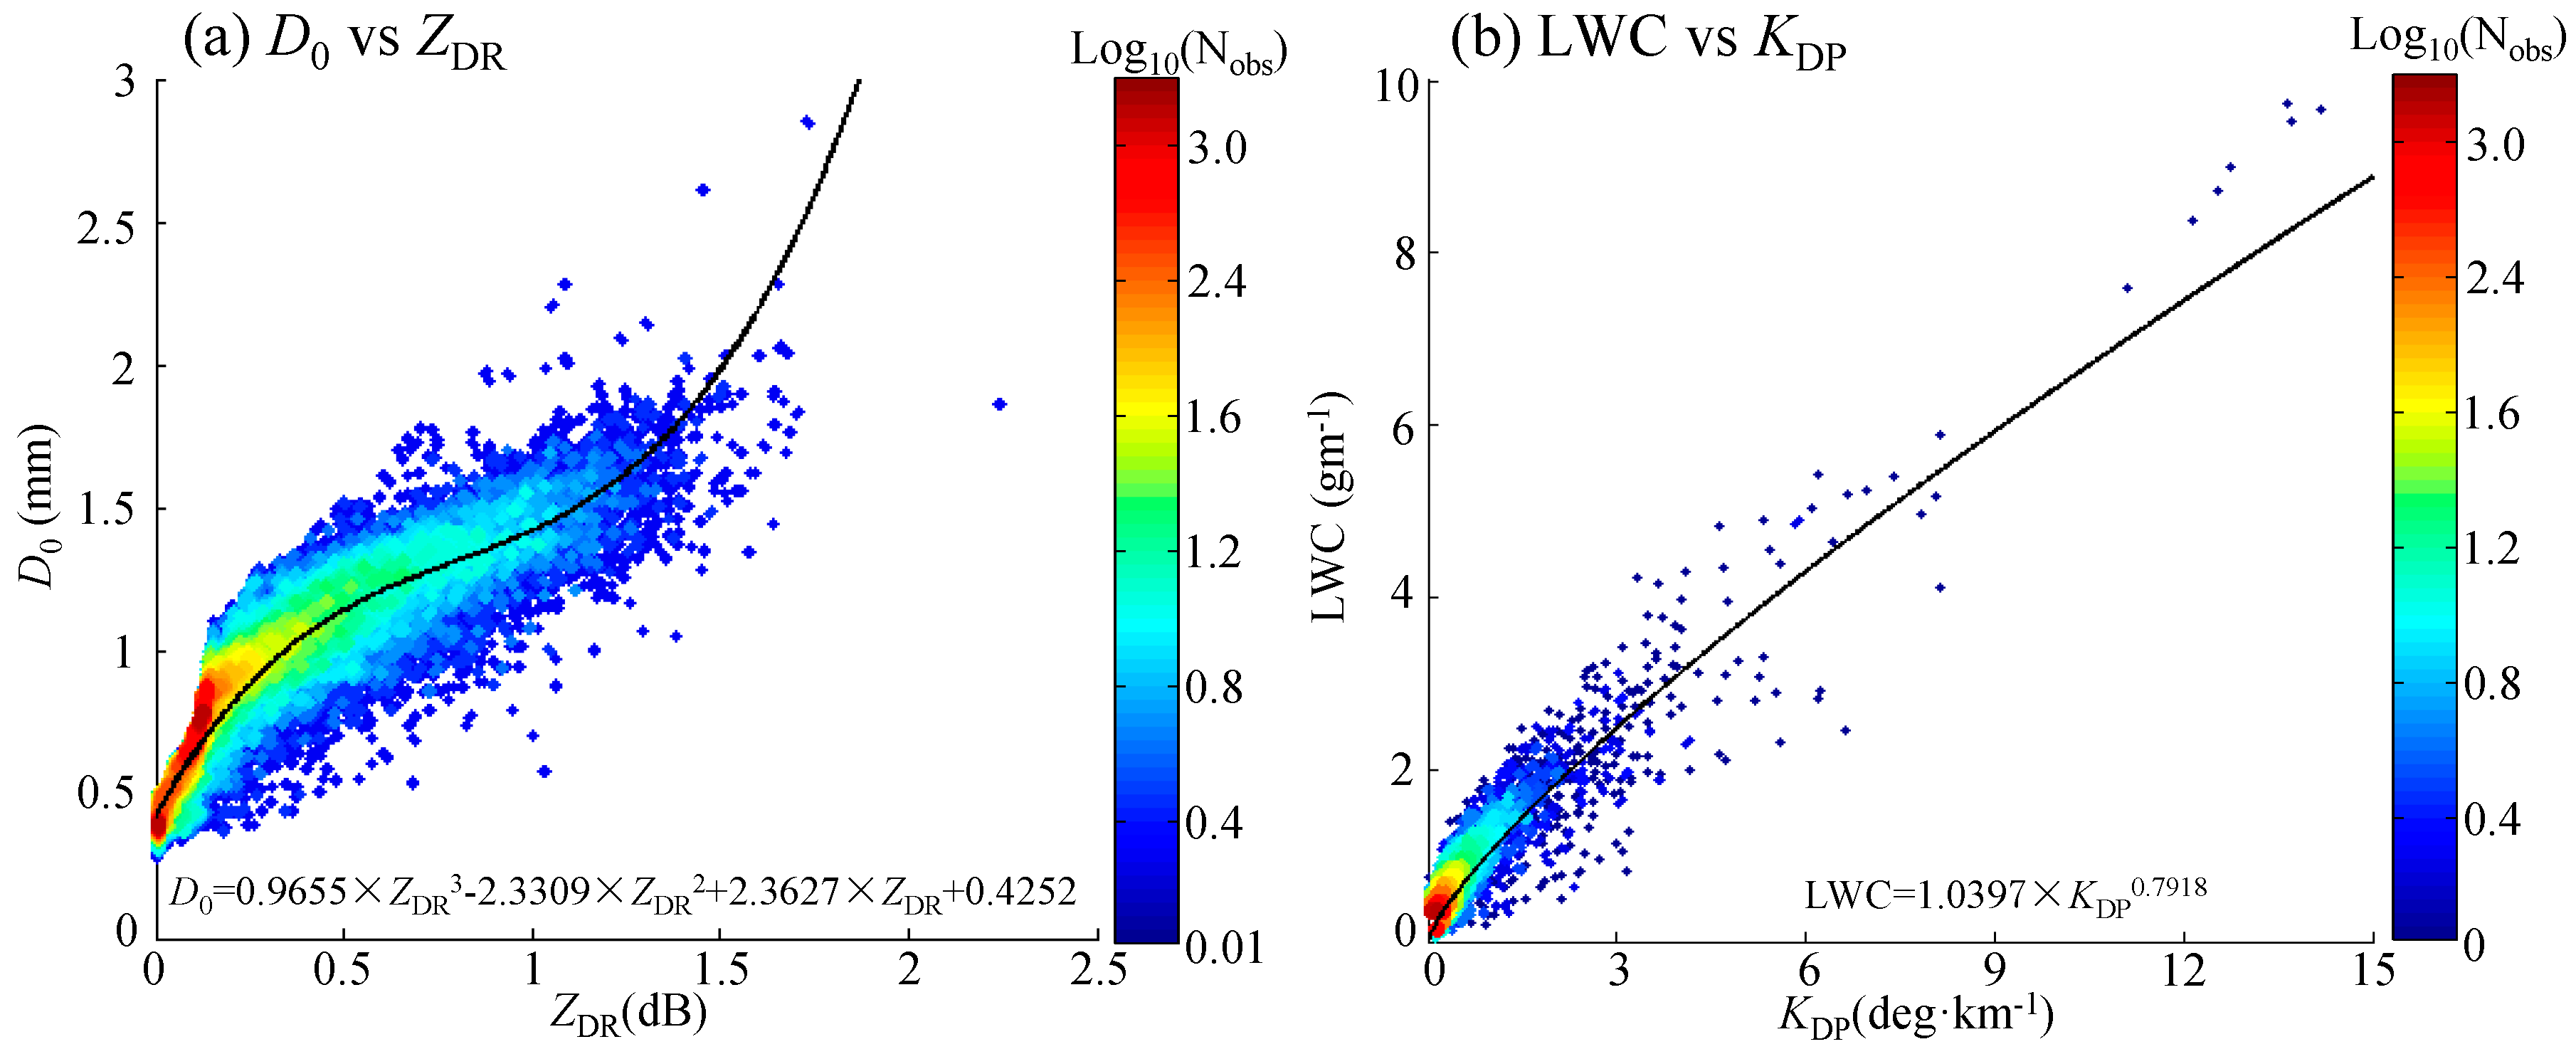
The scattergram of the median volume diameter D0 and ZDR is depicted in Figure 11a, where Equation (7) is fitted to represent the empirical relation between D0 and ZDR. Equation (7) is similar to that in Brandes et al. (2004) [37], and it works well for 0.25 dB ≤ ZDR ≤ 2 dB.
D 0 = 0.9655 × Z DR 3 2.3309 × Z DR 2 + 2.3627 × Z DR + 0.4252
Small and moderate raindrops with 0.25 mm ≤ D0 ≤ 2 mm may be the dominant hydrometers within the rainstorm. According to the classical cloud microphysics stating that a big raindrop is equivalent to many small-sized raindrops for the same ZH value within a radial volume, a high LWC and Nw can account for the big ZH, but not the small ZDR areas of the rainstorm, which can be deduced, starting from the exponential relations between LWC and KDP:
LWC = 1.0397 × K DP 0.9718
It can be clearly seen from Figure 11b that KDP > 3 deg·km−1 with LWC > 2 g·m−3 is rare. However, the VCS structure of KDP columns on Figure 5m–p and Figure 6m–p are clearly characterized by high KDP values that are larger than 3 deg·km−1. With KDP > 3 deg·km−1 and Dm < 2 mm (maximum of D0), LWC is higher than 2.4815 g·m−3, and log10(Nw) is higher than 5.1 mm−1m−3 within the rainstorm. This provides obvious evidence that the vertical layers of the rainstorm below 7 km are abundant, with the high liquid raindrop concentrations upon the severe rainfall center.
Melting hailstones may be also accompanied within this rainstorm, and it can be obviously seen at 0855 UTC on Figure 6n,o that a slight KDP gap column with small KDP values (less than 1 deg·km−1) between the storm cores is featured, with a ZH above 45 dBZ (see Figure 6f,g), and ZDR tending to be near-zero and negative values within this KDP column. It can also be found in Figure 6r,s that ρHV is obviously less than 0.98 on the VCS structures of ρHV. Both the possibilities of big raindrops or dense little raindrops can be excluded. Small ZDR and ρHV values are both important microphysical characteristics of hailstones; furthermore, the scatter density in the rectangular area on Figure 10b shows an incompatible ZDRZH distribution with the classical liquid raindrop model. This convective updraft flow lasts for very long; little hailstones may be the most reasonable hydrometers within the KDP gap column, and some solid water content from the upper layers above the freezing level may also be falling in this process. In addition, the temperature is usually high during the monsoon season, so that the little hailstones are easy to melt into liquid raindrops during their falling process, which further aggravates the raindrop concentration upon the rainfall center area.
The microphysical composition and the evolving process of the rainstorm can effectively account for the high rainfall rates upon the severe rainfall field center area in the gap between gauge stations. It further highlights the importance of the comprehensive utilization of polarimetric radar measurements for small-scale extreme severe convective rainfall events.

3.5. Discussion

Six radar QPE estimators, including two feedback-derived and four DSD-derived rainfall algorithms, were evaluated and compared using an extreme severe rainfall event in the mountainous area over eastern China. The complex microphysical process within the rainstorm is also investigated to show creditability and to enhance the confidence of the severe rainfall center between gauge stations. Apparently, feedback-derived R(ZHC,G) obtains the best statistical scores among all of the radar rainfall estimators, which mainly benefit from the improved ZPHI method for the attenuation processing of ZH and the dynamically-adjusted Z–R relationships. This feedback-derived mechanism strongly relies on the assumption that gauge measurements are completely immune to environmental factors; however, the horizontal and vertical flow may degrade the accuracy of the gauge measurements.
The standard DSD-derived rainfall estimators are mainly based on the long-term regional DSD observations. In addition, R(KDP) performs best among all standard DSD-derived polarimetric radar QPE estimators, and the negative effects from the horizontal and vertical flows accompanying the mesocyclone can account for its apparent overestimation of the rainfall time series derived from R(KDP). However, several issues are still necessary for exploration with the polarimetric radar in the future:
(i) DSD-derived rainfall retrieval relationships are all regionally and climatically dependent on the precipitation characteristics. Fixed R(KDP), R(AH), or R(ZHC,ZDR) relationships cannot be representative and generalized for all potential rain regimes, and they should also be adjusted monthly, daily, or hourly to represent the intrinsic changes for different rainstorms in real operational applications. Even if all single potential relationships or their composite utilizations are established, the optimally matching scheme such as the blended approach described by Chen et al. [20] may be required for the practical implementations.
(ii) High spatiotemporal hydrological modeling in complex terrain is challenging, due to the sparse surface station network. Extreme severe rainfall events related to flash flood and debris flow are reported every year in the mountainous areas of China. Furthermore, not all streamflow records are available, partly because some daily streamflow measurements, they are usually unimpressively few. Some special work on such flash floods is necessary for improved warnings.
(iii) Considering that the gap between the lowest elevations of different radar sites, short-range X-band polarimetric radar collaboration and network techniques are also indispensable for radar QPE and nowcast operations. The comprehensive utilization of ground-based and satellite-based radar provides another efficient way to construct the three-denominational view of severe convective rainstorms and to mitigate the complete blockage issue, the vertical cone issue, and the bright band contamination issue. These issues may also affect the performances of R(KDP), R(AH), and R(ZHC,ZDR) if ZH, ZDR, KDP, and AH are not processed carefully.
(iv) The signal loss due to the wet radome effect and inappropriate signal processing techniques cannot be neglected for the C-band and X-band polarimetric radar. For some experimental radar with no radome, the signal loss issue can be more serious when heavy rain is falling on the radar antenna. This phenomenon degrades the capability of the current short-range radar network around the metropolis area, especially in the large-scale precipitation system, because all of the short-range weather radar sites can be simultaneously affected under such weather conditions. If there are no signals obtained in the RDA software, posterior data quality control and radar QPE implementation will not be carried out as usual, and R(ZH), R(KDP), R(AH), and R(ZH,ZDR) will all fail in this scenario.
(v) Even with accurate radar and gauge data, it should be noticed that radar samples hydrometeors in the air and estimates rainfall indirectly, but gauge directly measures rainfall near the ground. Their samplings are intrinsically at different altitudes of the atmosphere. In the stratiform, precipitation, and the winter snowfall scenarios with little negative wind effects, the falling hydrometeor in the air may experience complex microphysical processes, especially when the melting layer is captured by radar beams, but (light) liquid rain is the main precipitation type near the surface. The vertical remote sensing devices, such as satellite-based or ground-based Ka-band and Ku-band radar [25], are promising for relating such radar measurements with gauge measurements more adequately if their temporal resolutions are the same.

4. Summary

With more and more polarimetric radars being deployed and planned in China, efficient utilization of the polarimetric radar variables and products is critical for timely nowcasts and severe weather warnings. Unfortunately, such research is still immature, and only few studies have been reported for polarimetric radar applications in China. This paper exploits the first operational C-band polarimetric radar (managed by the Hangzhou Meteorological Bureau) in China. In particular, an innovative radar QPE methodology based on the feedback mechanism and the standard polarimetric radar QPE estimators are investigated for an extreme rainfall event occurring in the mountainous areas over eastern China. The spatial and vertical distributions of polarimetric observables are detailed for resolving the microphysical structure and the evolution of the rainstorm within the gap between gauge stations. The main findings are summarized as follows.
(i) Feedback-derived R(ZHC,G) performs the best among all radar QPE estimators, according to the evaluation scores. This is mainly due to the improved attenuation correction of ZH, and the dynamically adjusted Z–R relationships.
(ii) R(KDP) performs the best among the standard DSD-derived radar QPE estimators. The horizontal and vertical flows accompanied with the mesocyclone can account for the slight overestimation of R(KDP). We found that KDP is more robust than AH in this severe rainfall event, mainly because the DSD variability is only noteworthy at the near side or the far side of the rainstorm.
(iii) Although the convective rainstorm is accompanied by big raindrops along the updraft flow of the convergence line, the hydrometeors characterized by highly dense raindrops dominate the rainstorm, resulting in a rainfall peak center between the gauge stations. The falling of small melting hailstones further enhances the rainfall rates upon the rainfall center area.
Although significant progress in radar QPE has been achieved, several issues are still challenging and need to be addressed in future, including the adaptive dual-polarization radar rainfall relationships accounting for regional precipitation microphysics and multisource precipitation data fusion in complex terrain. In addition, rainstorm-based cloud resolving models and cloud microphysics are critical for interpreting the evolution of precipitation systems, which can be used to further enhance the radar-derived rainfall product.

Author Contributions

Y.G. carried out the data collection and detailed analysis. Y.G. was also involved in developing the polarimetric radar data processing and product generation systems. H.C. supervised the work and provided critical comments. Y.M. conducted the detailed literature review. Y.G. and H.C. prepared the first draft of this manuscript, with revisions provided by Y.M. and J.Y.

Funding

This research was primarily supported by the National Natural Science Foundation of China (NSFC) under grants 41705018, 41601065, & 41675029, Zhejiang Provincial Natural Science Fund, through award LY17D050005, and Zhejiang Major Science and Technology Special Projects, through award 2017C03035.

Acknowledgments

The C-band polarimetric radar and gauge data were provided by the Hangzhou Meteorological Bureau (HMB). The authors would like to thank the forecasters at HMB for discussions of this severe weather event.

Conflicts of Interest

The authors declare no conflicts of interest.

References

  1. Bringi, V.N.; Chandrasekar, V. Polarimetric Doppler Weather Radar: Principles and Applications; Cambridge University Press: Cambridge, UK, 2001; 648p. [Google Scholar]
  2. Hubbert, J.; Bringi, V.N.; Chandrasekar, V. Processing and Interpretation of Coherent Dual-polarized Radar Measurements. J. Atmos. Ocean. Technol. 1993, 10, 155–164. [Google Scholar] [CrossRef]
  3. Hubbert, J.; Bringi, V.N. An Iterative Filtering Technique for The Analysis of Copolar Differential Phase and Dual Frequency Radar Measurements. J. Atmos. Ocean. Technol. 1995, 12, 643–648. [Google Scholar] [CrossRef]
  4. Wang, Y.; Chandrasekar, V. Algorithm for Estimation of The Specific Differential Phase. J. Atmos. Ocean. Technol. 2009, 26, 2565–2578. [Google Scholar] [CrossRef]
  5. Ryzhkov, A.V.; Diederich, M.; Zhang, P.; Simmer, C. Potential Utilization of Specific Attenuation for Rainfall Estimation, Mitigation of Partial Beam Blockage, and Radar Networking. J. Atmos. Ocean. Technol. 2014, 31, 599–619. [Google Scholar] [CrossRef]
  6. Wang, Y.; Zhang, P.; Ryzhkov, A.V.; Zhang, J.; Chang, P. Utilization of Specific Attenuation for Tropical Rainfall Estimation in Complex Terrain. J. Hydrometeorol. 2014, 15, 2250–2266. [Google Scholar] [CrossRef]
  7. Gourley, J.J.; Tabary, P.; Jacques, P.D.C. A Fuzzy Logic Algorithm for the Separation of Precipitating from Nonprecipitating Echoes Using Polarimetric Radar Observations. J. Atmos. Ocean. Technol. 2007, 24, 1439–1451. [Google Scholar] [CrossRef]
  8. Hubbert, J.; Dixon, M.; Ellis, S. Weather Radar Ground Clutter. Part II: Real-Time Identification and Filtering. J. Atmos. Ocean. Technol. 2009, 26, 1181–1197. [Google Scholar] [CrossRef]
  9. Bringi, V.N.; Keenan, T.D.; Chandrasekar, V. Correcting C-band Radar Reflectivity and Differential Reflectivity Data for Rain Attenuation: A Self-consistent Method with Constraints. IEEE Trans. Geosci. Remote Sens. 2001, 39, 1906–1915. [Google Scholar] [CrossRef]
  10. Park, S.-G.; Bringi, V.; Chandrasekar, V.; Maki, M.; Iwanami, K. Correction of Radar Reflectivity and Differential Reflectivity for Rain Attenuation at X band. Part II: Evaluation and Application. J. Atmos. Ocean. Technol. 2005, 22, 1633–1655. [Google Scholar] [CrossRef]
  11. Krajewski, W.F.; Villarini, G.; Smith, J.A. Radar-Rainfall Uncertainties. Bull. Am. Meteorol. Soc. 2010, 91, 87–94. [Google Scholar] [CrossRef]
  12. Gou, Y.B.; Ma, Y.; Chen, H.; Wen, Y. Radar-derived Quantitative Precipitation Estimation in Complex Terrain over The Eastern Tibetan Plateau. Atmos. Res. 2018, 203, 286–297. [Google Scholar] [CrossRef]
  13. Ryzhkov, A.V.; Giangrande, S.E.; Schuur, T.J. Rainfall Estimation with A Polarimetric Prototype of WSR-88D. J. Appl. Meteorol. 2005, 44, 502–515. [Google Scholar] [CrossRef]
  14. Bringi, V.N.; Rico-Ramirez, M.A.; Thurai, M. Rainfall Estimation with An Operational Polarimetric C-Band Radar in the United Kingdom: Comparison with A Gauge Network and Error Analysis. J. Hydrometeorol 2010, 12, 935–954. [Google Scholar] [CrossRef]
  15. Chandrasekar, V.; Wang, Y.; Chen, H. The CASA Quantitative Precipitation Estimation System: A Five Year Validation Study. Nat. Hazards Earth Syst. Sci. 2012, 12, 2811–2820. [Google Scholar] [CrossRef]
  16. Chen, H.; Lim, S.; Chandrasekar, V.; Jang, B.-J. Urban Hydrological Applications of Dual-Polarization X-Band Radar: Case Study in Korea. J. Hydrol. Eng. 2017, 22, E5016001. [Google Scholar] [CrossRef]
  17. Cifelli, R.; Chandrasekar, V.; Chen, H.; Johnson, L.E. High Resolution Radar Quantitative Precipitation Estimation in the San Francisco Bay Area: Rainfall Monitoring for the Urban Environment. J. Meteorol. Soc. Jpn. 2018, 96A, 141–155. [Google Scholar] [CrossRef]
  18. Chen, H.; Chandrasekar, V. Estimation of Light Rainfall using Ku-band Dual-Polarization Radar. IEEE Trans. Geosci. Remote Sens. 2015, 53, 5197–5208. [Google Scholar] [CrossRef]
  19. Cifelli, R.; Chandrasekar, V.; Lim, S.; Kennedy, P.C.; Wang, Y.; Rutledge, S.A. A New Dual-Polarization Radar Rainfall Algorithm: Application in Colorado Precipitation Events. J. Atmos. Ocean. Technol. 2011, 28, 352–364. [Google Scholar] [CrossRef]
  20. Chen, H.; Chandrasekar, V.; Bechini, R. An Improved Dual–polarization Radar Rainfall Algorithm (DROPS2.0): Application in NASA Ifloods Field Campaign. J. Hydrometeorol. 2017, 18, 917–937. [Google Scholar] [CrossRef]
  21. Thurai, M.; Mishra, K.V.; Bringi, V.N.; Krajewski, W.F. Initial Results of a New Composite-Weighted Algorithm for Dual-Polarized X-Band Rainfall Estimation. J. Hydrometeorol. 2017, 18, 1081–1100. [Google Scholar] [CrossRef]
  22. Anagnostou, M.N.; Kalogiros, J.; Marzano, F.S.; Anagnostou, E.N.; Montopoli, M.; Piccioti, E. Performance Evaluation of a New Dual-polarization Microphysical Algorithm Based on Long-term X-band Radar and Disdrometer Observations. J. Hydrometeorol. 2013, 14, 560–576. [Google Scholar] [CrossRef]
  23. Yoshikawa, E.; Chandrasekar, V.; Ushio, T.; Matsuda, T. A Bayesian Approach for Integrated Raindrop Size Distribution (DSD) Retrieval on an X-Band Dual-Polarization Radar Network. J. Atmos. Ocean. Technol. 2016, 33, 377–389. [Google Scholar] [CrossRef]
  24. Seo, B.-C.; Krajewski, W.F. Investigation of the scale-dependent variability of radar-rainfall and rain gauge error correlation. Adv. Water Resour. 2011, 34, 152–163. [Google Scholar] [CrossRef]
  25. Beauchamp, R.M.; Chandrasekar, V.; Chen, H.; Vega, M. Overview of the D3R Observations during the IFloodS Field Experiment with Emphasis on Rainfall Mapping and Microphysics. J. Hydrometeorol. 2015, 16, 2118–2132. [Google Scholar] [CrossRef]
  26. Wen, G.; Chen, H.; Zhang, G.; Sun, J. An Inverse Model for Raindrop Size Distribution Retrieval with Polarimetric Variables. Remote Sens. 2018, 10, 1179. [Google Scholar] [CrossRef]
  27. Liu, H.; Chandrasekar, V. Classification of Hydrometeors Based on Polarimetric Radar Measurements: Development of Fuzzy Logic and Neuro-Fuzzy Systems, and In-Situ Verification. J. Atmos. Ocean. Technol. 2000, 17, 140–164. [Google Scholar] [CrossRef]
  28. Bechini, R.; Chandrasekar, V. A Semisupervised Robust Hydrometeor Classification Method for Dual-Polarization Radar Applications. J. Atmos. Ocean. Technol. 2015, 32, 22–47. [Google Scholar] [CrossRef]
  29. Boodoo, S.; Hudak, D.; Ryzhkov, A.; Zhang, P.; Donaldson, N.; Sills, D. Quantitative Precipitation Estimation from a C-band Dual-polarized Radar for the 8 July 2013 Flood in Toronto, Canada. J. Hydrometeorol. 2015, 16, 2027–2044. [Google Scholar] [CrossRef]
  30. Vulpiani, G.; Montopoli, M.; Passeri, L.D.; Gioia, A.G.; Giordano, P.; Marzano, F.S. On the Use of Dual-Polarized C-Band Radar for Operational Rainfall Retrieval in Mountainous Areas. J. Appl. Meteorol. Climatol. 2012, 51, 405–425. [Google Scholar] [CrossRef]
  31. Thurai, M.; Huang, G.J.; Bringi, V.N.; Randeu, W.L.; Schönhuber, M. Drop Shapes, Model Comparisons, and Calculations of Polarimetric Radar Parameters in Rain. J. Atmos. Ocean. Technol. 2007, 24, 1019–1032. [Google Scholar] [CrossRef]
  32. Thurai, M.; Bringi, V.N. Application of the Generalized Gamma Model to Represent the Full Rain Drop Size Distribution Spectra. J. Appl. Meteorol. Climatol. 2018, 57, 1197–1210. [Google Scholar] [CrossRef]
  33. Testud, J.; Bouar, E.L.; Obligis, E.; Ali-Mehenni, M. The Rain Profiling Algorithm Applied to Polarimetric Weather Radar. J. Atmos. Ocean. Technol. 2000, 17, 332–356. [Google Scholar] [CrossRef]
  34. Johnson, J.T.; MacKeen, P.L.; Witt, A.; Mitchell, E.D.; Stumpf, G.J.; Eilts, M.D.; Thomas, K.W. The Storm Cell Identification and Tracking Algorithm: An Enhanced WSR-88D Algorithm. Weather Forecast. 1998, 13, 263–276. [Google Scholar] [CrossRef]
  35. Snyder, J.C.; Ryzhkov, A.V.; Kumjian, M.R.; Khain, A.P.; Picca, J. A ZDR Column Detection Algorithm to Examine Convective Storm Updrafts. Weather Forecast. 2015, 30, 1819–1844. [Google Scholar] [CrossRef]
  36. Carlin, J.T.; Gao, J.; Snyder, J.C.; Ryzhkov, A.V. Assimilation of ZDR Columns for Improving the Spinup and Forecast of Convective Storms in Storm-Scale Models: Proof-of-Concept Experiments. Mon. Weather Rev. 2017, 145, 5033–5057. [Google Scholar] [CrossRef]
  37. Brandes, E.A.; Zhang, G.; Vivekanandan, J. Drop size Distribution Retrieval with Polarimetric radar: Model and Application. J. Appl. Meteorol. 2004, 43, 461–475. [Google Scholar] [CrossRef]
Figure 1. Basic information around the Da Ming Mountain (DMM) radar and Hangzhou: (a) Digital Elevation Model (DEM) information around Hangzhou; (b) gauge stations in the mountainous area; (c) the Parsivel-II network around Hangzhou; and (d) villages seriously affected during the flood event. The county lines in (ac) indicate the border between the Anhui and Zhejiang provinces of China, Hangzhou City, and Changhua town in Zhejiang province. DCP, MWK, QMT, and DC in (b,d) indicate the validation gauge locations; the villages seriously affected by the flood are marked with red dots.
Remotesensing 11 00022 g001
Figure 2. Vertical distribution of radar measurements from a “birdbath” scan at 1835 UTC, 24 April 2015: (a) ZDR; (b) ρHV; and (c) ZH.
Remotesensing 11 00022 g002
Figure 3. Scatter density plots of radar moments simulated by using the drop size distribution (DSD) data collected during June 2016 and 2017: (a) ZDR vs. ZH; (b) KDP vs. ZH; (c) R vs. ZH; (d) R vs. KDP; (e) R vs. AH; and (f) DSD-simulated R vs. ZH, and ZDR-fitted R. The black line in (a) represents the ZDRZH relation in Equation (2a); the black lines in (cf) are for Equations (4a), (4c)–(4e), respectively. The color bar stands for the number of points.
Remotesensing 11 00022 g003
Figure 4. Radar plan position indicator (PPI) scan at 0.5° elevation angle: (a,b) are Vr measurements at 0829 UTC and 0855 UTC, June 2015, respectively; (cd), (ef), and (gh) are ZH, ZDR, and KDP at the same time, respectively. Four gauge locations are marked with “+”. The black and blue rectangles respectively refer to the enhancing and dissipating areas of the mesocyclone, and the black circles refer to the horizontal locations of the ZDR columns.
Remotesensing 11 00022 g004
Figure 5. (ad) are the vertical cross-section (VCS) of Vr along radial directions from the DMM radar to QMT, DCP, MWK, and DC at 0829 UTC, 23 June 2015. (eh), (il), and (mp) are the VCS of ZH, ZDR, KDP, respectively, at the same time. DMM radar is marked with “+” at the y-axis, and the distances of four gauge stations are marked with “+” along the x-axis. The rectangle in (i) refers to the ZDR column near the convergence line.
Remotesensing 11 00022 g005
Figure 6. (ad) are the vertical cross-section (VCS) of Vr along radial directions from the DMM radar to QMT, DCP, MWK, and DC at 0855 UTC, 23 June 2015. (eh), (il), (mp), and (q–t) are the VCS of ZH, ZDR, KDP, and ρHV, respectively, at the same time. DMM radar is marked with “+” at the y-axis, and the distances of four gauge stations are marked with “+” along the x-axis. The rectangles in (j,k) refer to the ZDR column near the convergence line.
Remotesensing 11 00022 g006
Figure 7. Radar 2 h rainfall accumulation fields at 1000 UTC, 23 June 2015. (a,b) are based on R(ZHM,G) and R(ZHC,G), respectively; (cf) are based on DSD-derived R(ZH), R(ZH,ZDR), R(KDP), and R(AH), respectively.
Remotesensing 11 00022 g007
Figure 8. Gauge hourly rainfall measurements and corresponding radar estimates using R(ZHC), R(ZHM,G), and R(ZHC,G) at each gauge station during 08:00–12:00 UTC, 23 June 2015: (a) station QMT; (b) station DCP; (c) station MWK; and (d) station DC.
Remotesensing 11 00022 g008
Figure 9. Gauge hourly rainfall measurements and corresponding radar estimates using R(ZHC), R(ZHC,ZDR), R(KDP), and R(AH) at each gauge station during from 08:00–12:00 UTC, 23 June 2015: (a) station QMT; (b) station DCP; (c) station MWK; and (d) station DC.
Remotesensing 11 00022 g009
Figure 10. Scatter density plots of radar variables at 0829 and 0855 UTC, 23 June 2015: (a) and (b) are corrected ZDR vs. corrected ZH and (c) and (d) are KDP vs. corrected ZH. The black dots represent the simulated moments from DSD data.
Remotesensing 11 00022 g010
Figure 11. Scatter density plots of simulated variables based on DSD data: (a) D0 vs. ZDR and (b) LWC vs. KDP.
Remotesensing 11 00022 g011
Table 1. Information of six radar quantitative precipitation estimation (QPE) estimators.
ScoresRadar QPE Estimators
R(ZHM,G)R(ZHC,G)R(ZHC)R(ZHC,ZDR)R(KDP)R(AH)
ERMS(mm)15.5073.8856.8635.7125.2758.776
ENMA41.6110.7719.69117.09716.22925.036
ECC0.9530.9890.9750.9770.9880.961
Max(R2H)(mm)115.2131.6119.1142.6142.9158.1

