Article

Analyzing the Effect of Fluorescence Characteristics on Leaf Nitrogen Concentration Estimation

1
Faculty of Information Engineering, China University of Geosciences, Wuhan 430074, Hubei, China
2
Wuhan Institute of Physics and Mathematics, Chinese Academy of Sciences, Wuhan 430071, Hubei, China
3
State Key Laboratory of Information Engineering in Surveying, Mapping and Remote Sensing, Wuhan University, Wuhan 430079, Hubei, China
4
Collaborative Innovation Center of Geospatial Technology, Wuhan 430079, Hubei, China
*
Author to whom correspondence should be addressed.
Remote Sens. 2018, 10(9), 1402; https://doi.org/10.3390/rs10091402
Submission received: 24 July 2018 / Revised: 23 August 2018 / Accepted: 30 August 2018 / Published: 3 September 2018
(This article belongs to the Special Issue Remote Sensing for Precision Nitrogen Management)

Abstract

:
Leaf nitrogen concentration (LNC) is a significant indicator of crops growth status, which is related to crop yield and photosynthetic efficiency. Laser-induced fluorescence is a promising technology for LNC estimation and has been widely used in remote sensing. The accuracy of LNC monitoring relies greatly on the selection of fluorescence characteristics and the number of fluorescence characteristics. It would be useful to analyze the performance of fluorescence intensity and ratio characteristics at different wavelengths for LNC estimation. In this study, the fluorescence spectra of paddy rice excited by different excitation light wavelengths (355 nm, 460 nm, and 556 nm) were acquired. The performance of the fluorescence intensity and fluorescence ratio of each band were analyzed in detail based on back-propagation neural network (BPNN) for LNC estimation. At 355 nm and 460 nm excitation wavelengths, the fluorescence characteristics related to LNC were mainly located in the far-red region, and at 556 nm excitation wavelength, the red region being an optimal band. Additionally, the effect of the number of fluorescence characteristics on the accuracy of LNC estimation was analyzed by using principal component analysis combined with BPNN. Results demonstrate that at least two fluorescence spectral features should be selected in the red and far-red regions to estimate LNC and efficiently improve the accuracy of LNC estimation.

Graphical Abstract

1. Introduction

Chlorophyll is an essential factor in crop photosynthesis, and nitrogen (N), a main element in chlorophyll, can favorably affect the growth and quality of crops. Leaf nitrogen concentration (LNC) is a key indicator of the N nutrition in crops, and scientific N fertilization measurements can be obtained by monitoring the LNC [1,2]. Thus, estimating leaf nitrogen concentration (LNC) accurately and nondestructively is important for the accurate diagnosis and quality evaluation of plant growth status [3,4]. The development of remote sensing has made it a significant tool for monitoring plant growth at the leaf, canopy, and landscape levels [5,6,7,8]. Many researchers have investigated hyperspectral remote sensing and found a certain difference among the sensitive bands of the LNC for different crops [9,10,11]. Moreover, the optimal bands will vary at different growth stages of the same crops [12]. Therefore, chlorophyll fluorescence was proposed and utilized for monitoring crop growth status. Chlorophyll fluorescence has shown to be a promising technology for monitoring crop growth status.
Variable chlorophyll fluorescence (or Kautsky kinetics) posits that fluorescence intensity changes with time at a certain wavelength. These fluorescence characteristics are mainly used to monitor the photosynthesis of crops [13,14,15]. However, Kautsky kinetics are seldom utilized in the monitoring of N status or other agricultural application due to limitations such as the requirement of a fixed distance of measurement and the need for dark-adaption 15 min before measurement [16]. Thus, Tartachnyk and Rademacher [17] suggested that laser-induced chlorophyll fluorescence (LICF) is more conducive to monitoring the N status of crops compared with Kautsky kinetics. Laser-induced fluorescence (LIF) spectra contain abundant spectral information. Fluorescence intensity will be related to different nutrient stresses [14]. Owing to its rapid, non-destructive, and high sensitivity properties, LICF has been widely utilized in monitoring N fertilizer levels in crops [8,18,19,20].
Subhash and Mohanan [21] pointed out that the fluorescence intensity ratios F690/F725nm and F690/F705nm have great potential for remote sensing-based monitoring of the effect of nutrient stress on paddy rice growth status. Some research analyzed the monitoring ability of LICF for crop nutrition stress and proposed that the fluorescence ratio F685/F730 is mainly related to foliar chlorophyll concentration when no significant reduction in chlorophyll concentration has occurred [22,23]. Gu et al. [24] analyzed the fluorescence characteristics of rice, which has suffered flooding and waterlogging, and demonstrated that LICF can also be used to analyze water stress in crops. Anderson et al. attempted to estimate the cowpea (Vigna unguiculata (L.) Walp) yield based on the LICF characteristics and found that the fluorescence characteristics were sensitive to change in photosynthetic activity [25]. Yang et al. [26,27] discussed the performance of the LICF for LNC estimation in paddy rice with the support vector machine and back-propagation neural network (BPNN) models. However, studies about the performance of chlorophyll fluorescence intensity or fluorescence ratios of each band for LNC estimation are still sparse. In addition, LIF contains large amounts of spectral information, and studies are lacking on the correct number of fluorescence characteristics that should be selected from the fluorescence spectrum to estimate LNC. Thus, the main target of the present study is to analyze the performance of the fluorescence intensity and fluorescence ratio of each band for LNC estimation in paddy rice with different excitation light wavelengths. Additionally, the effect of the number of fluorescence characteristics on the accuracy of LNC estimation was discussed by using principal component analysis (PCA) combined with BPNN.

2. Materials and Methods

2.1. Materials and Experimental Design

The paddy rice variety Yangliangyou 6 was cultivated in Huazhong Agricultural University, Wuhan City in the province of Hubei, China (Figure 1). The rice was seeded on 30 April 2018, and transplanted to the field on 27 May 2015. Four levels of urea fertilizer (0, 120, 180, 240 kg/ha) were used and divided into three splits (60% at seeding, 20% at tillering and 20% at shooting). In addition, the experimental field had a randomized complete block design with three replications for each treatment under the same cultivation conditions. In each plot, nine fully expanded second leaves from the top were gathered randomly with three replicates for each experimental field on 26 July 2018, providing a total of 324 samples. The fresh leaf samples were sealed in plastic bags, stored in ice chests, and then transported to the laboratory for fluorescence measurement. During the fluorescence measurement, the samples were held on a black paperboard, which is a non-fluorescent material [28].

2.2. Measurement of Fluorescence Spectra

The system utilized for LIF measurement consists of three main parts (Figure 2), including the laser emission, optical receiver, and fluorescence signal detection [26]. Generally, the fluorescence is emitted in a longer wavelength region than the excitation wavelength and chlorophyll fluorescence is mainly located in 600–800 nm region [29]. Therefore, 355 nm (ultraviolet), 460 nm (blue), and 556 nm (red) excitation lights were used in the present study to induce plant fluorescence. The 355 nm excitation light source is a neodymium-doped yttrium aluminum garnet laser. The 460 nm and 556 nm lasers used were made by Spectra-Physics. The excitation light was irradiated on the surface of the samples at a near 90° angle, and the emitted fluorescence was collected using the convex lens at a near 90° angle on the same side. In addition, a long-pass filter (Semrock BLP01-355R-25 with the edge of 361 nm and the 93% transmittance at 364.9–900 nm for 355 nm excitation light; and LP02-633RE-25 with the edge of 633 nm and the 93% transmittance at 636.9–1427.4 nm for 460 and 556 nm excitation light sources) was placed before the optical fiber probe and was utilized to reduce the reflected light from the laser entering system. Then, the fluorescence signal entered the spectrometer (Princeton Instrument SP2500i with the spectral resolution of 0.5 nm) by using the single-mode optical fiber with a diameter of 200 µm and was detected by an intensified charge-coupled device camera. Fluorescence data was stored in a personal computer for subsequent analysis.
The fluorescence spectral regions were 360–800 nm, 640–790 nm, and 640–800 nm for the 355 nm, 460 nm and 556 nm excitation lights. The sample interval was 0.5 nm. After the fluorescence spectra was measured, all samples were immediately carried to the Wuhan Academy of Agricultural Science and Technology for LNC analysis. The standard Kjeldahl method was utilized to determine LNC in the present study [3]. Firstly, these samples were cut into pieces and oven-dried at 105 °C for 30 min and then at 80 °C until constant weight for chemical analysis. Then, those pigments soluble in organic solvents were extracted from leaves in acetone for 12 h in the dark at room temperature. The detailed description of standard Kjeldahl method can be found in reference [30].

2.3. Back-Propagation Neural Network

BPNN is a kind of feedforward network with the advantage of self-adaption and self-learning with good performance and has been widely utilized in solving various nonlinear problems. A BPNN model usually consists of three layers, namely, input, hidden, and output layers. The weight of the neurons can be adjusted based on the errors between the target output values and measured values. The training process of BPNN model involves updating the weights until the average sum squared error of the training dataset is minimized within the specified tolerance. A brief introduction about BPNN can be referred to in a previous study [31,32]. The fluorescence characteristics of each excitation light were randomly divided into two datasets, namely, 70% as the training dataset and another 30% as the validation set for LNC prediction [32,33]. In the BPNN model, the fluorescence characteristics served as the input parameter to train the model, and the LNC responded to the output parameters. The coefficient of determination (R2) between the predicted and measured LNC, the root mean square error (RMSE), and the relative error (RE) were utilized in this study to assess the performance of fluorescence characteristics for LNC estimation. Each characteristic setting was repeated 100 times based on the BPNN model, and the average was obtained.

2.4. Principal Component Analysis

The fluorescence spectra contain spectral information with hundreds of bands that provide high dimensionality that is usually much higher than the number of available training samples. Furthermore, the high-dimensional fluorescence spectra have significant redundancy, because large autocorrelation between adjacent variables is observed. PCA as a tool for dimensionality analysis can efficiently extract the main characteristic variables without any notable loss of information from hundreds or thousands spectral bands [34]. In the process of spectral analysis by using the PCA, the eigen values and eigen vectors of covariance matrix composed of fluorescence spectra were first calculated. Then, multi-dimensional data vectors were mapped from the spectral space to a new orthogonal space using the principal components (PCs). The new variables were calculated based on the combination of the original spectra [35].
w i = j = 1 k p 2   ( X j , Y i )
where, Xj is the PC, Yi represents the original values at ith bands, w i corresponds to the sum of the kth PC for the ith wavelength, and P is the loading weight of the latent variables. Thus, the analysis can be efficiently simplified using fewer calculated variables than the original ones [33].

3. Results

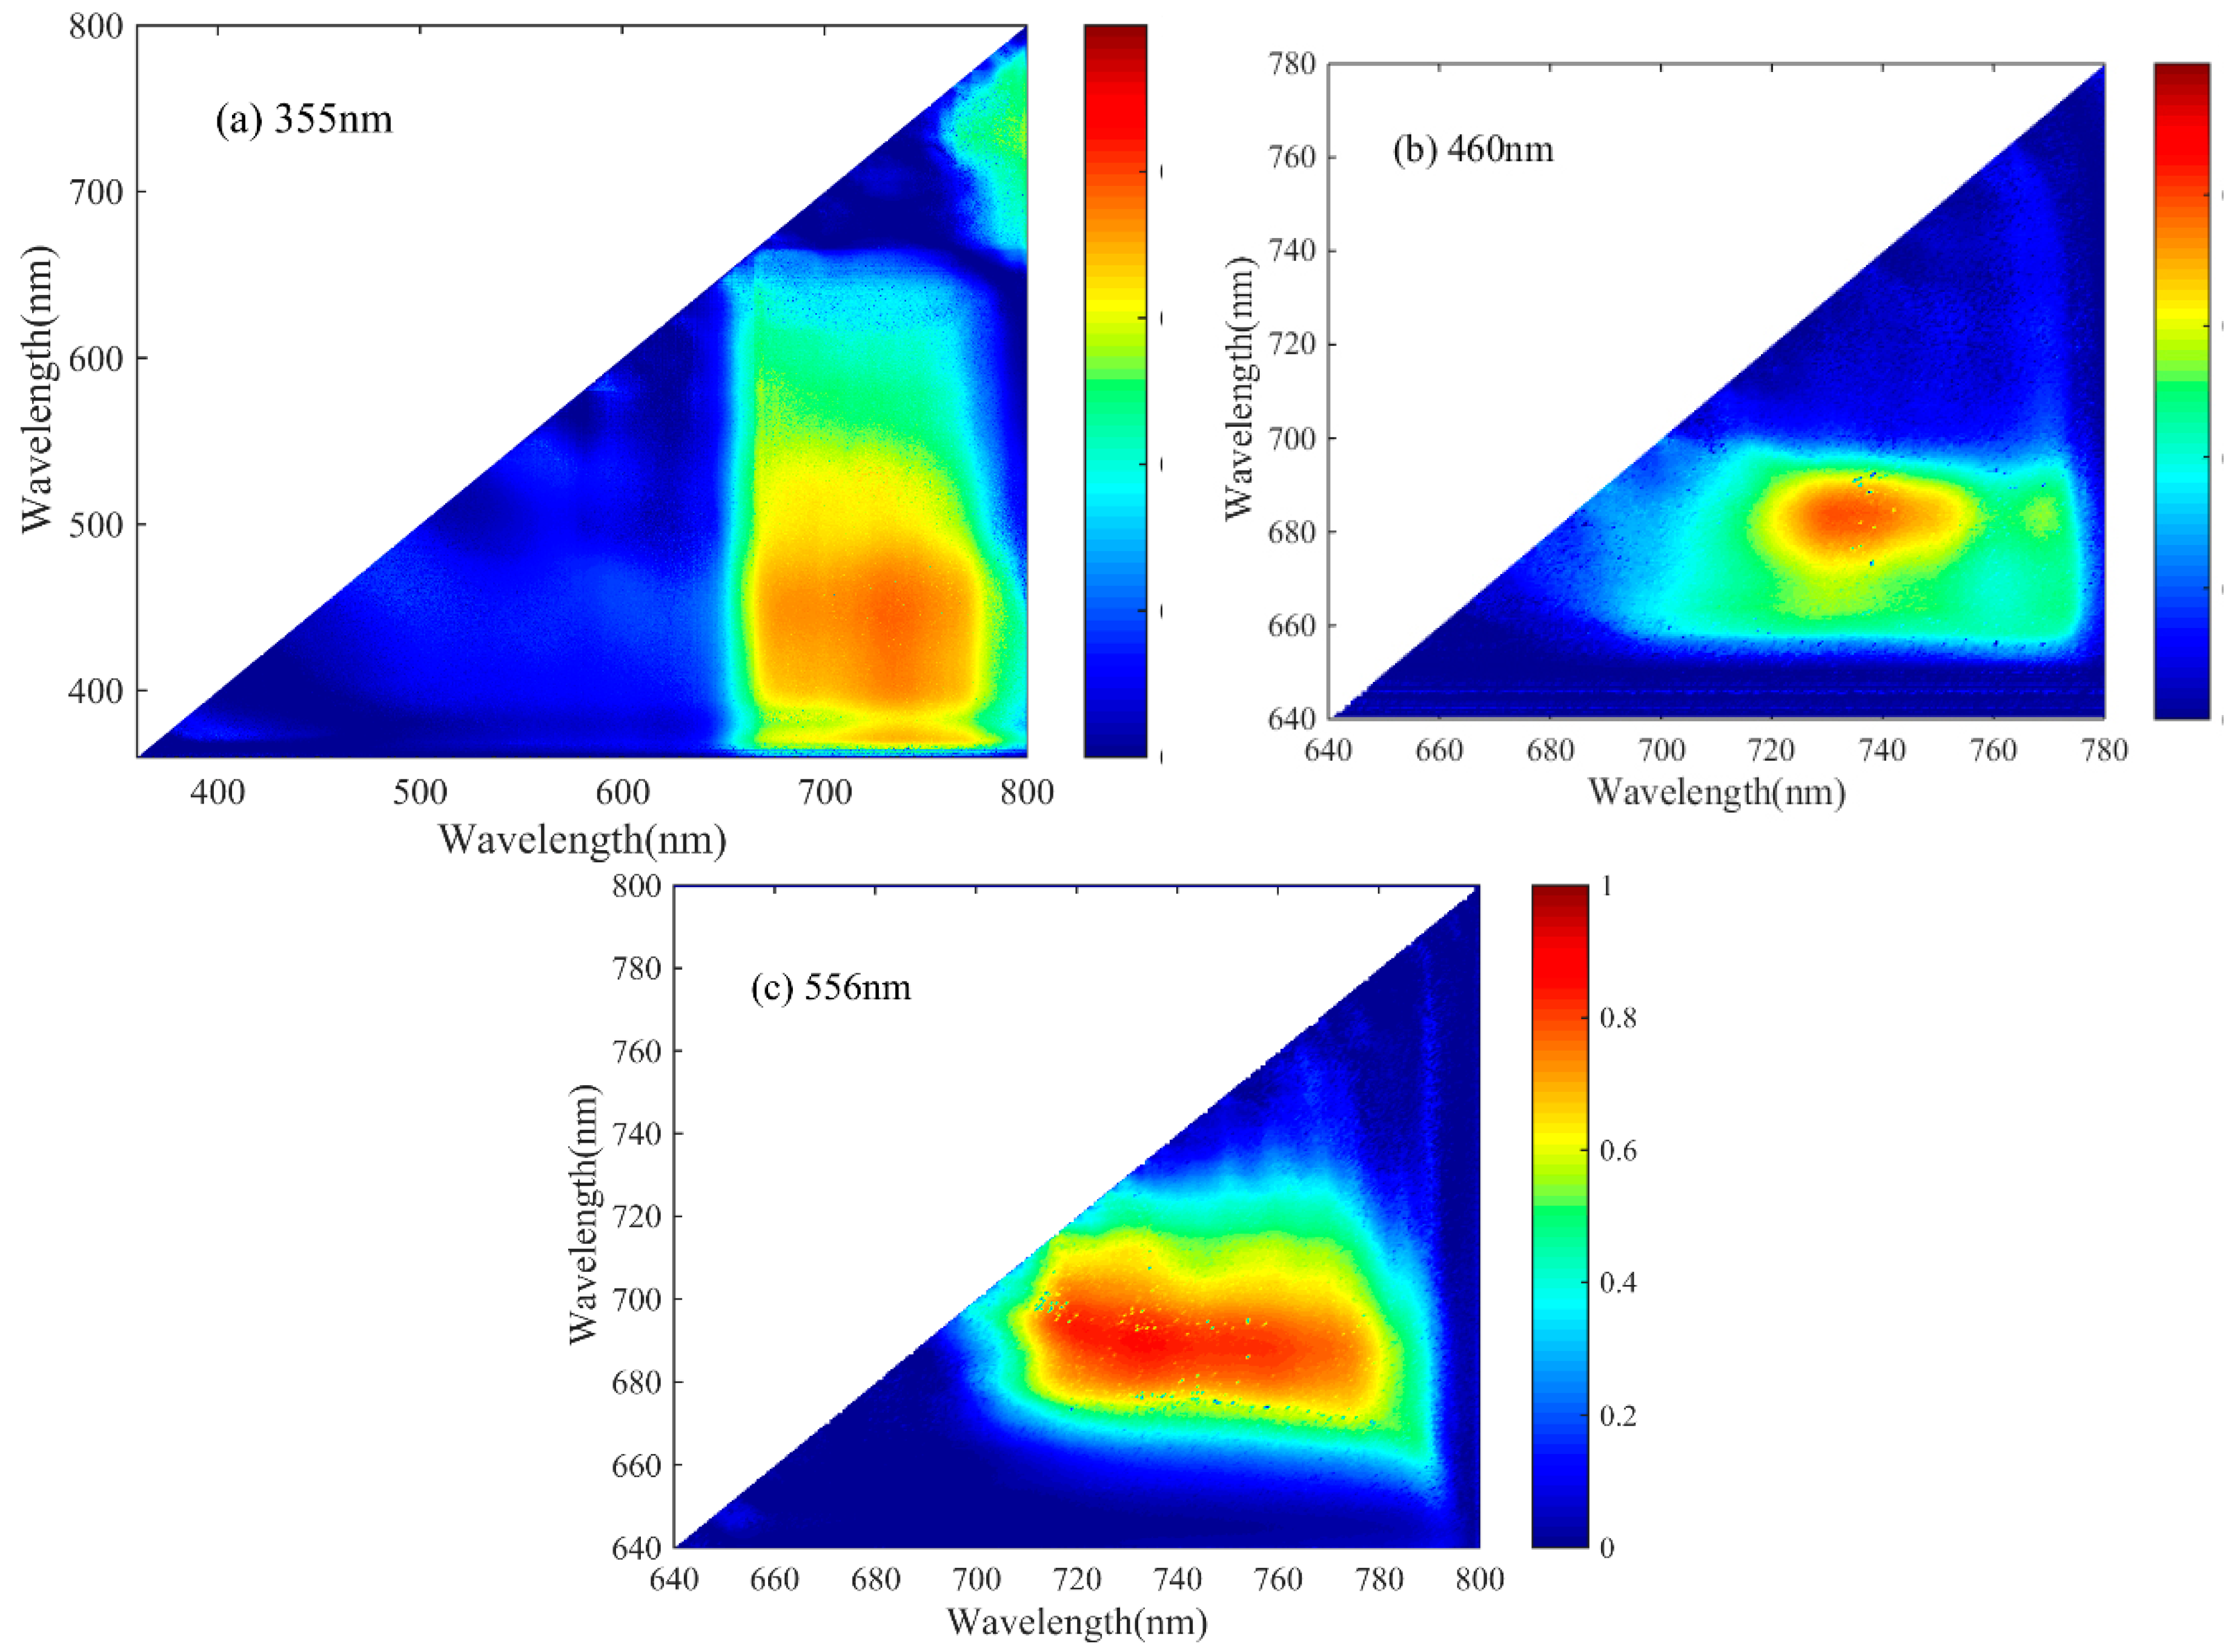
3.1. Fluorescence Spectrum

Figure 3 shows the fluorescence spectrum of paddy rice leaf excited by 355 nm laser.
The fluorescence spectrum displayed three main fluorescence peaks at 460, 685, and 740 nm, and a peak shoulder at 525 nm (Figure 3). According to previous research works, chlorophyll fluorescence mainly focuses on the wavelength ranges from 600 and 800 nm and peak centering at 685 and 740 nm. The fluorescence peak at 740 nm is attributed to the antenna chlorophyll of Photosystems I and II. Another fluorescence peak at 685 nm corresponds to Chlorophyll a, which is associated with Photosystem II [36]. The fluorescence peak shoulder at 525 nm and the peak at 460 nm are attributed to riboflavin and nicotinamide adenine dinucleotide, respectively [37,38]. Figure 3 also shows that the chlorophyll fluorescence at 685 nm is lower than that at 740 nm [18,39]. As the chlorophyll fluorescence is related to the biochemical content of the leaf, it can be applied to remote sensing monitoring and has been identified as a promising technology in the quantitative monitoring of remote sensing.

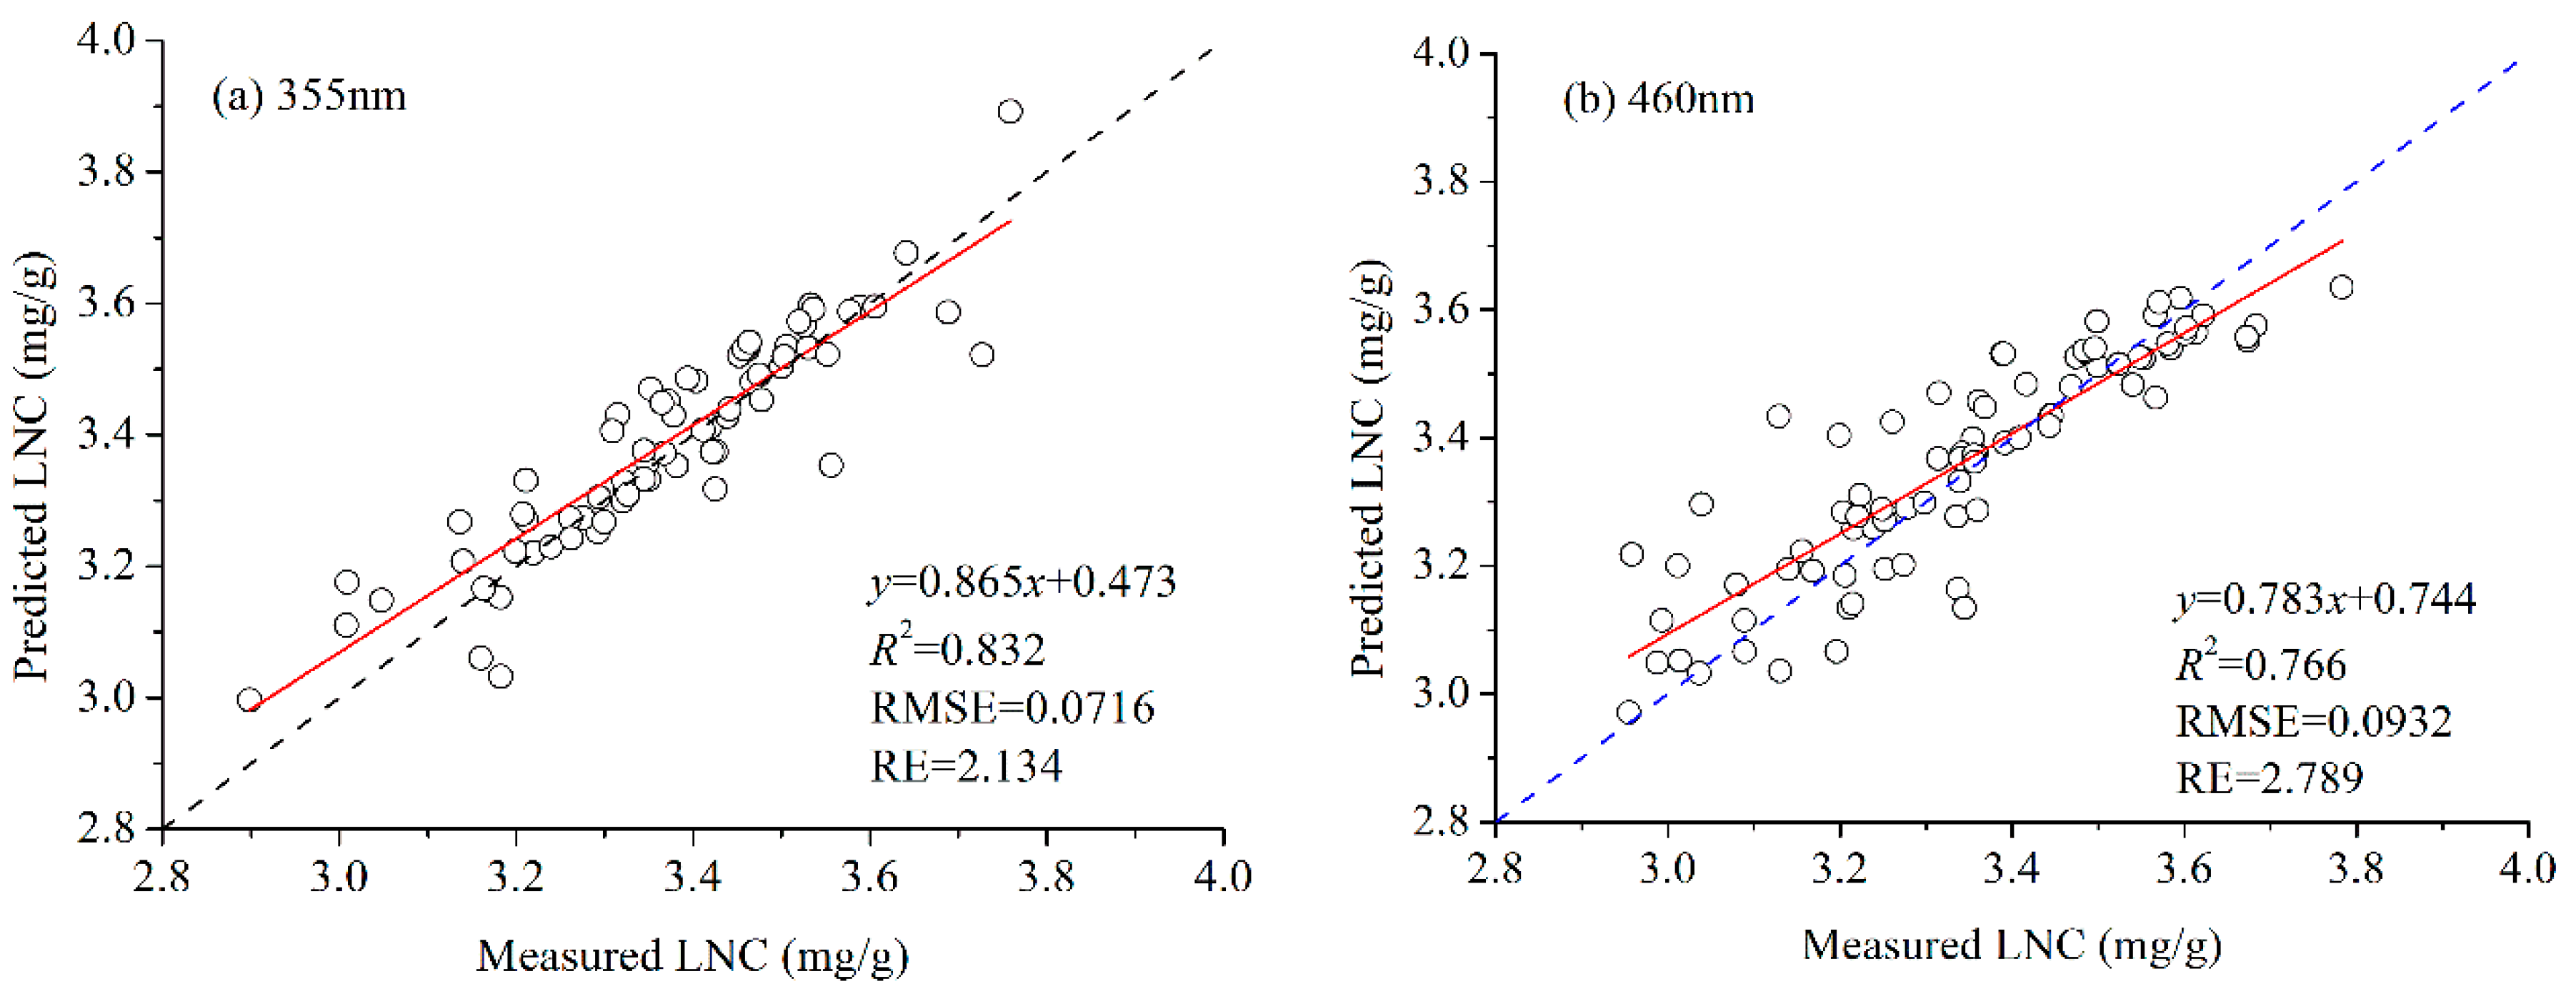
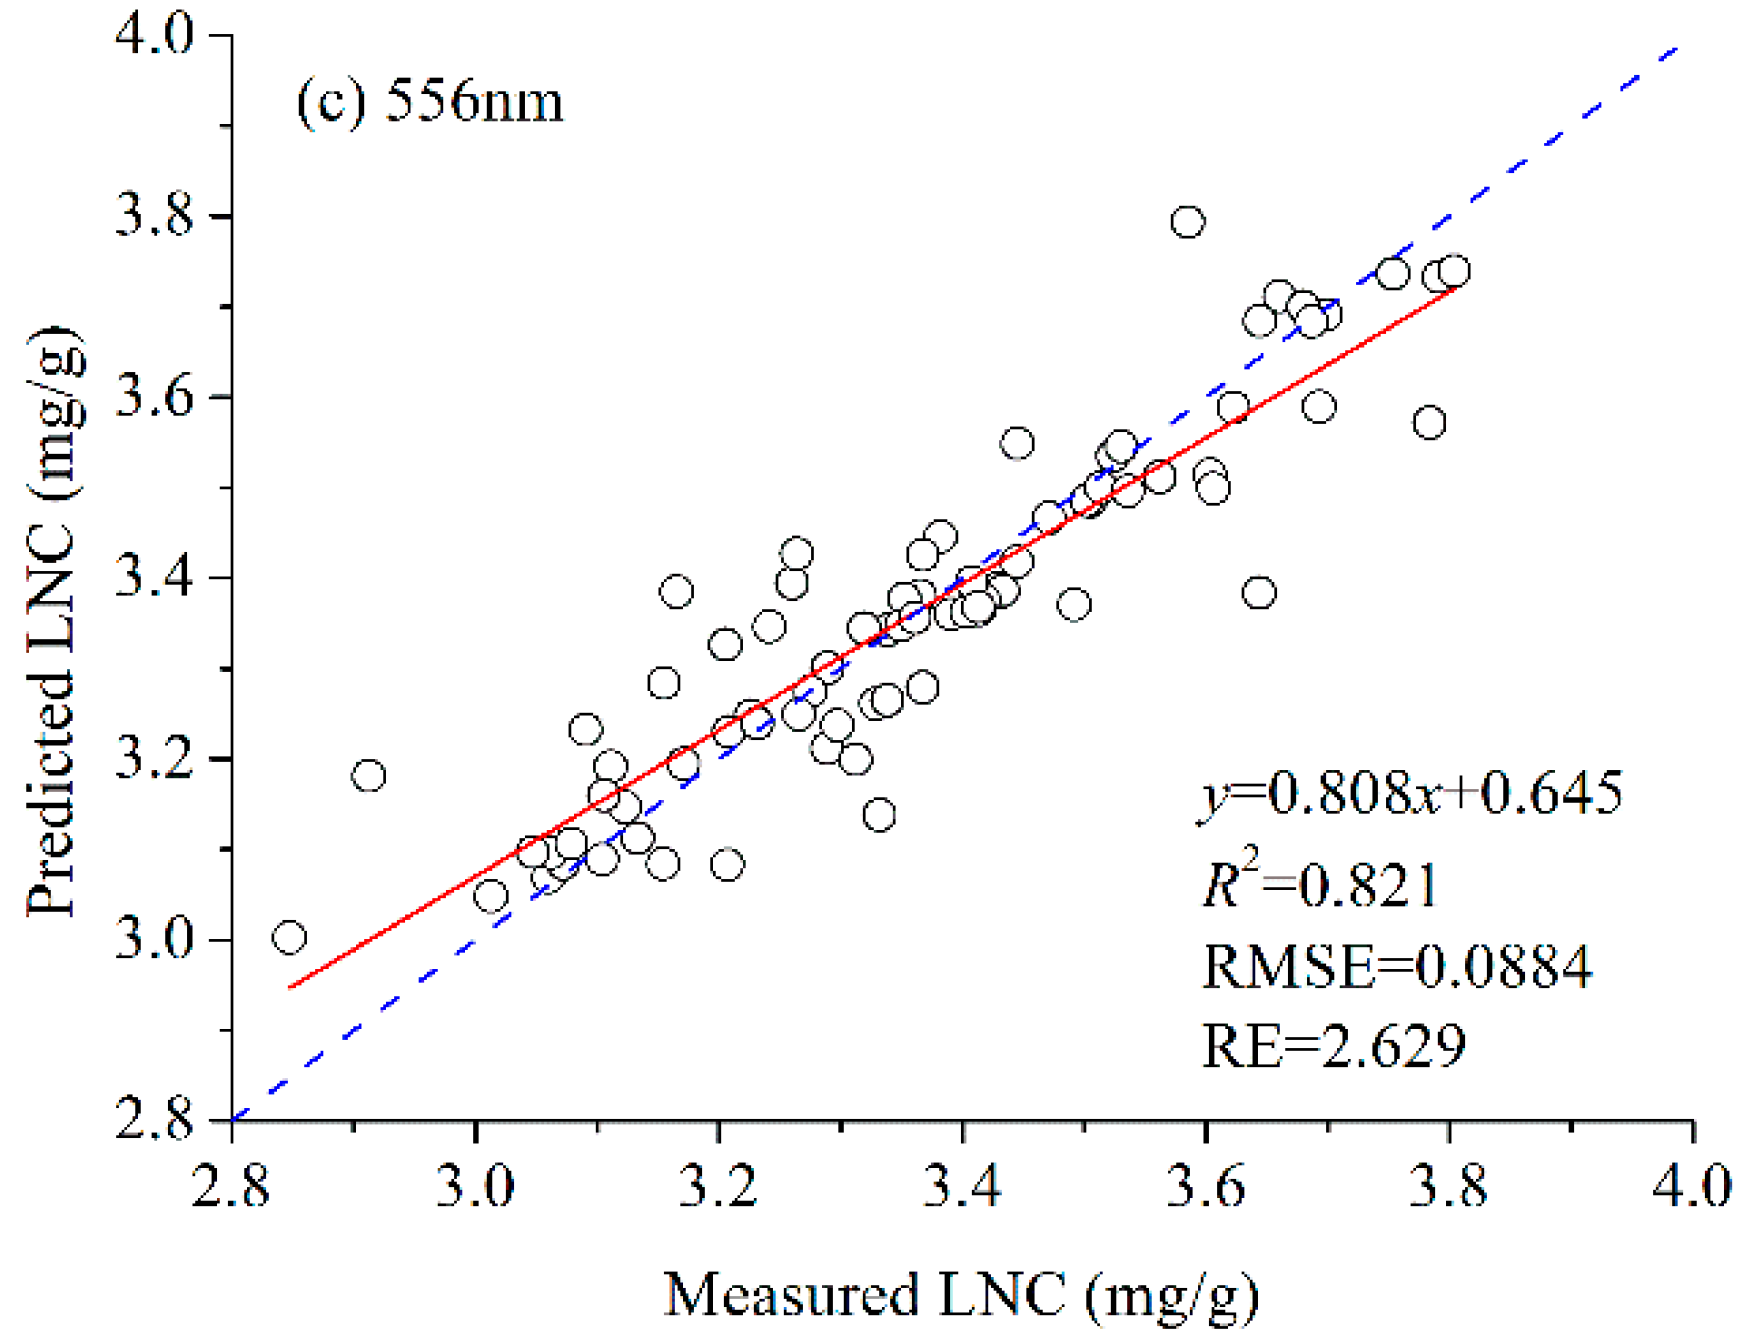
3.2. LNC Estimation Based on Fluorescence Spectra

To analyze the predictive ability of the fluorescence spectra for monitoring LNC in paddy rice, the BPNN algorithm was used to inversely predict LNC based on the fluorescence spectra. The relationship between the measured and predicted LNC were established and illustrated in Figure 4.
The results of the comparison among the R2 values in Figure 4 shows that the fluorescence spectra exhibit a promising potential for revising LNC, and the overall R2 exceeds 0.76. The red solid line denotes the linear regression analysis results between the predicted and measured LNC. For 355 nm (R2 = 0.832) and 556 nm (R2 = 0.821) excitation lights, the inversion results show better predictive performance, having higher R2 and lower RMSE and RE than those for 460nm (R2 = 0.766) excitation light.

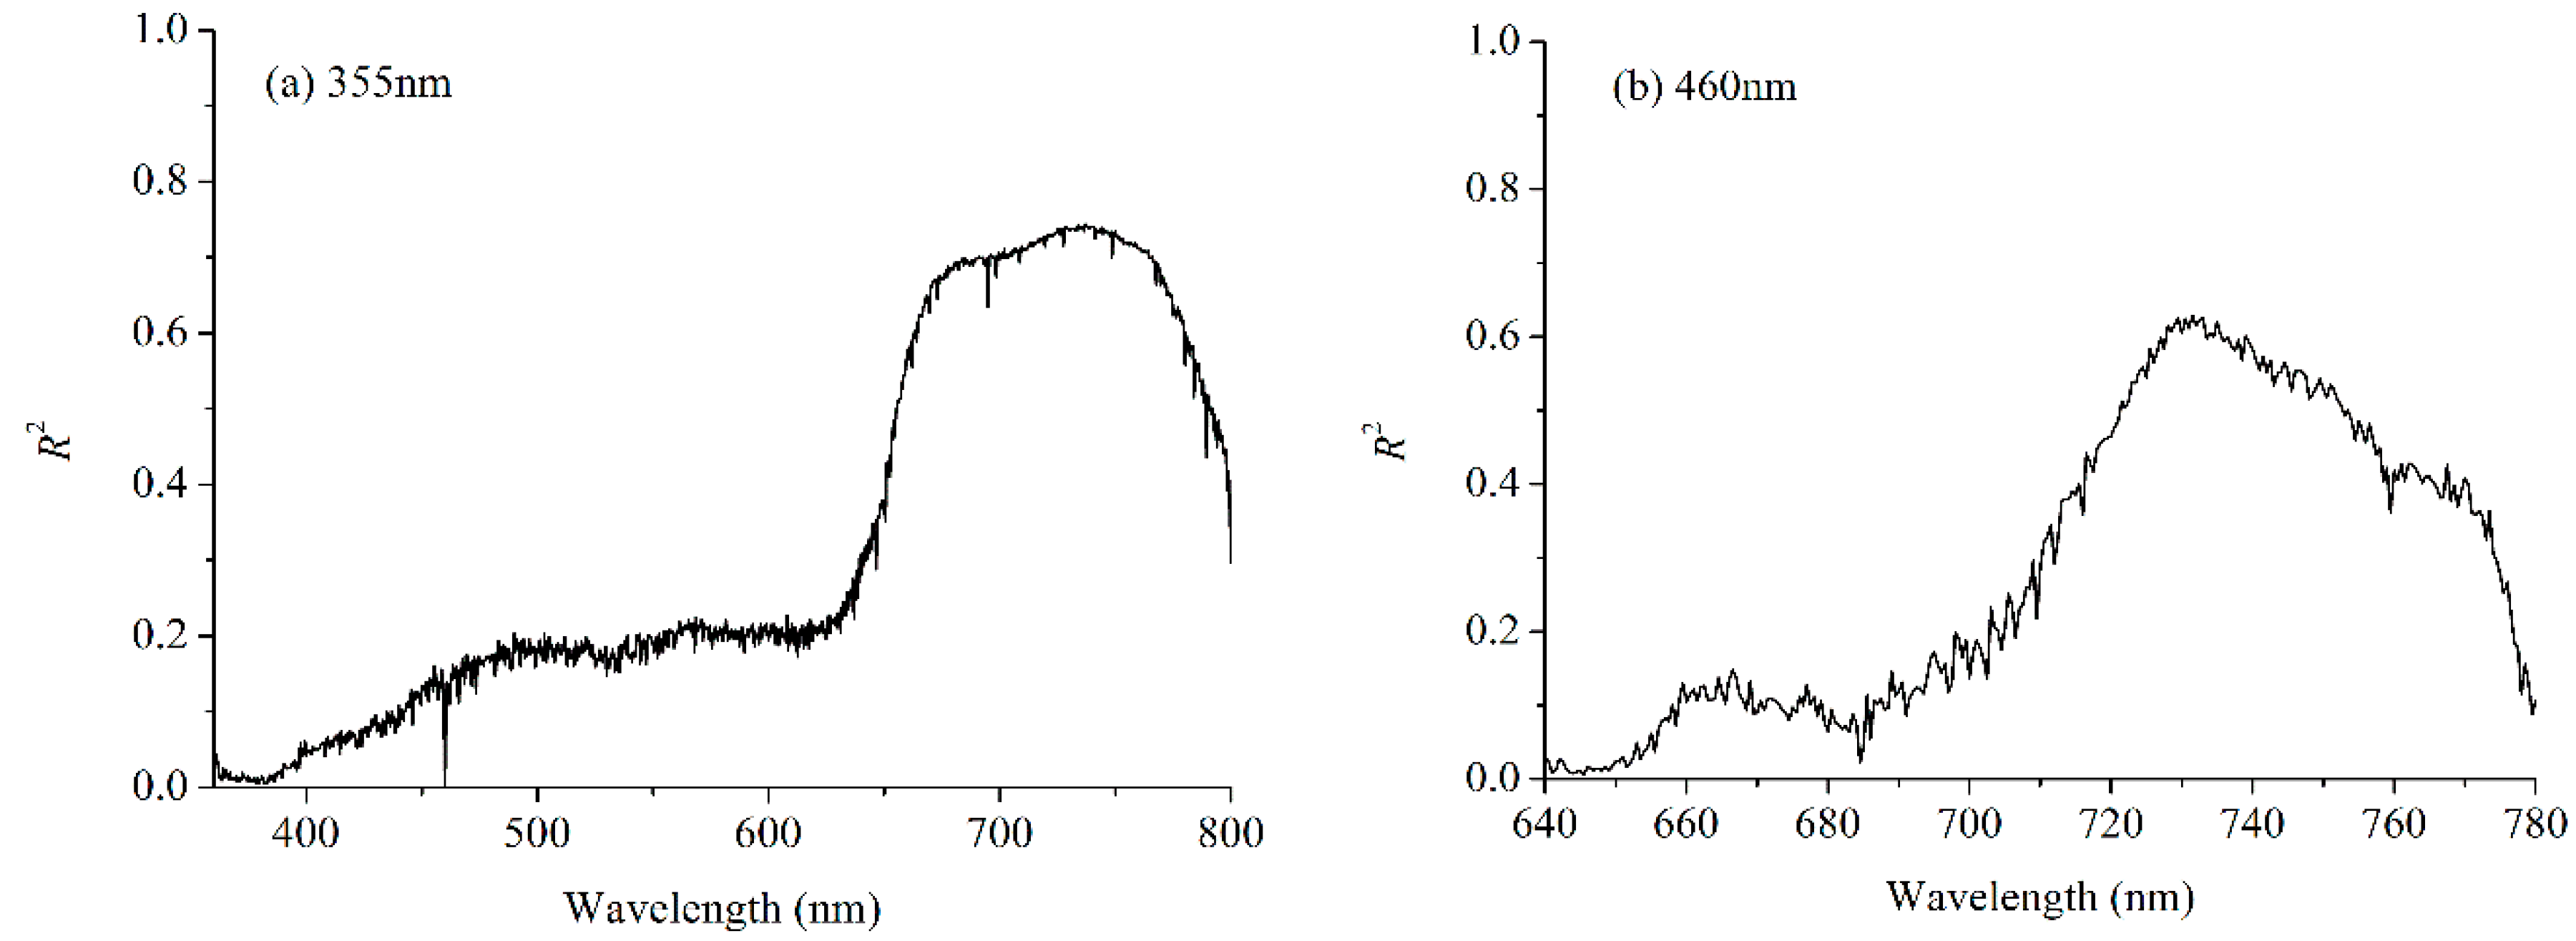
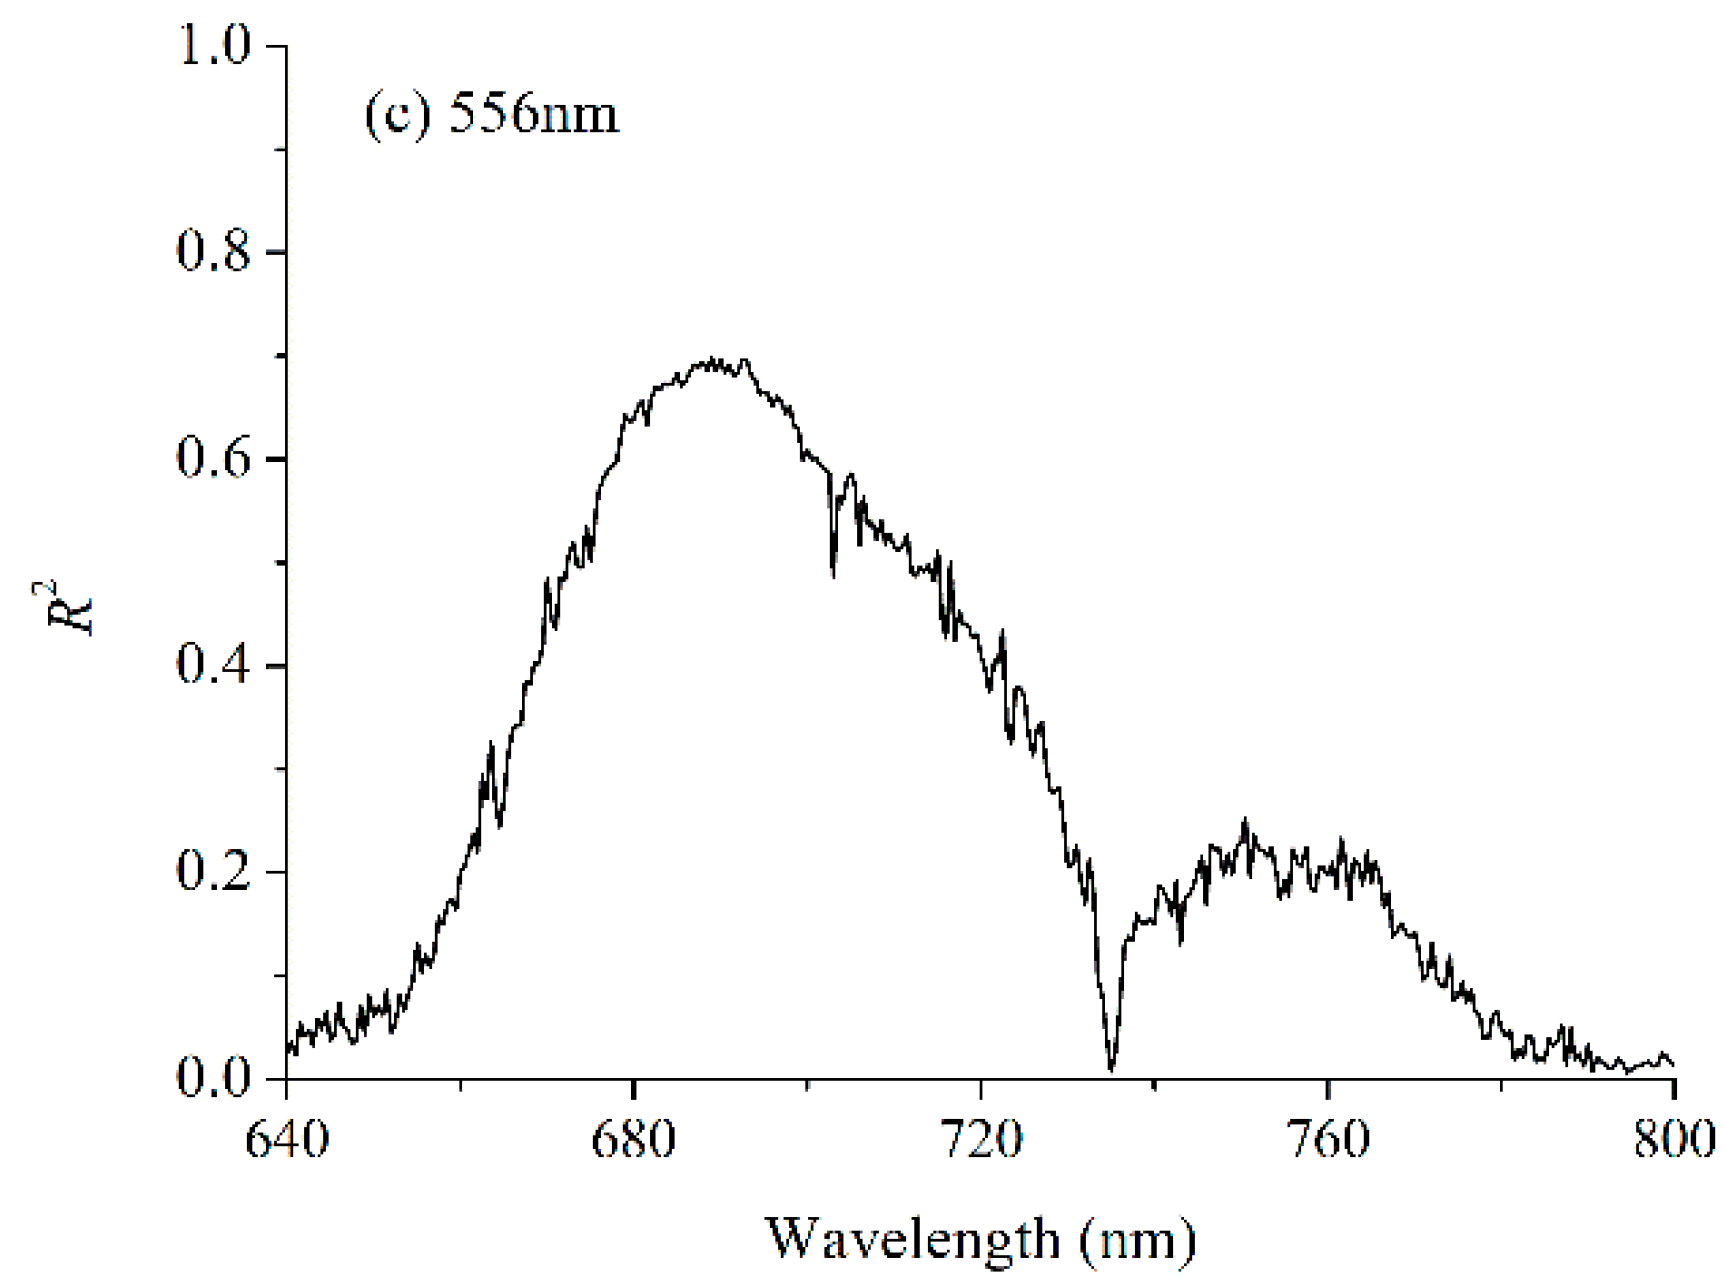
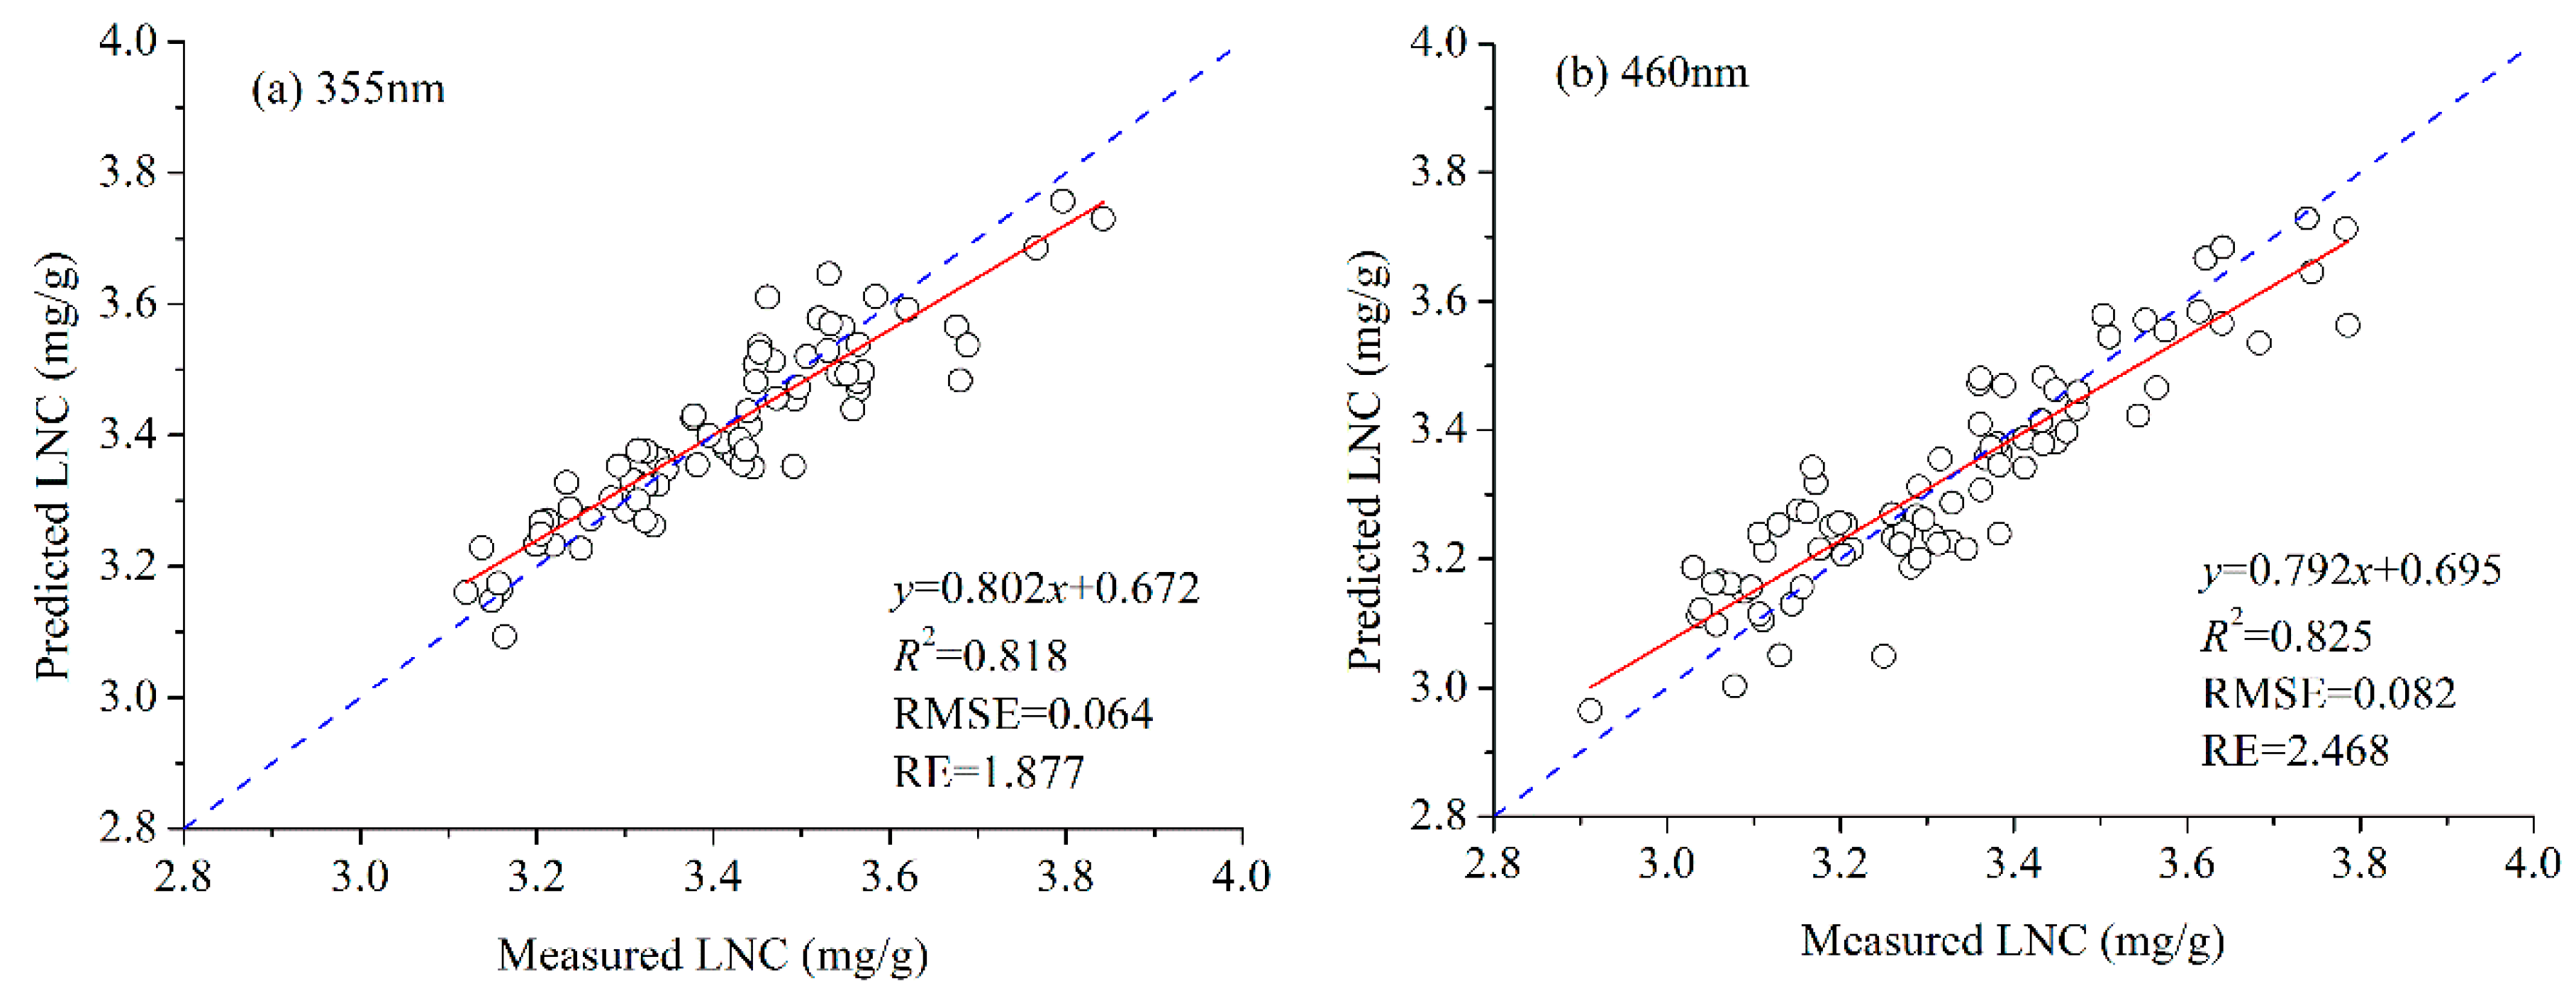
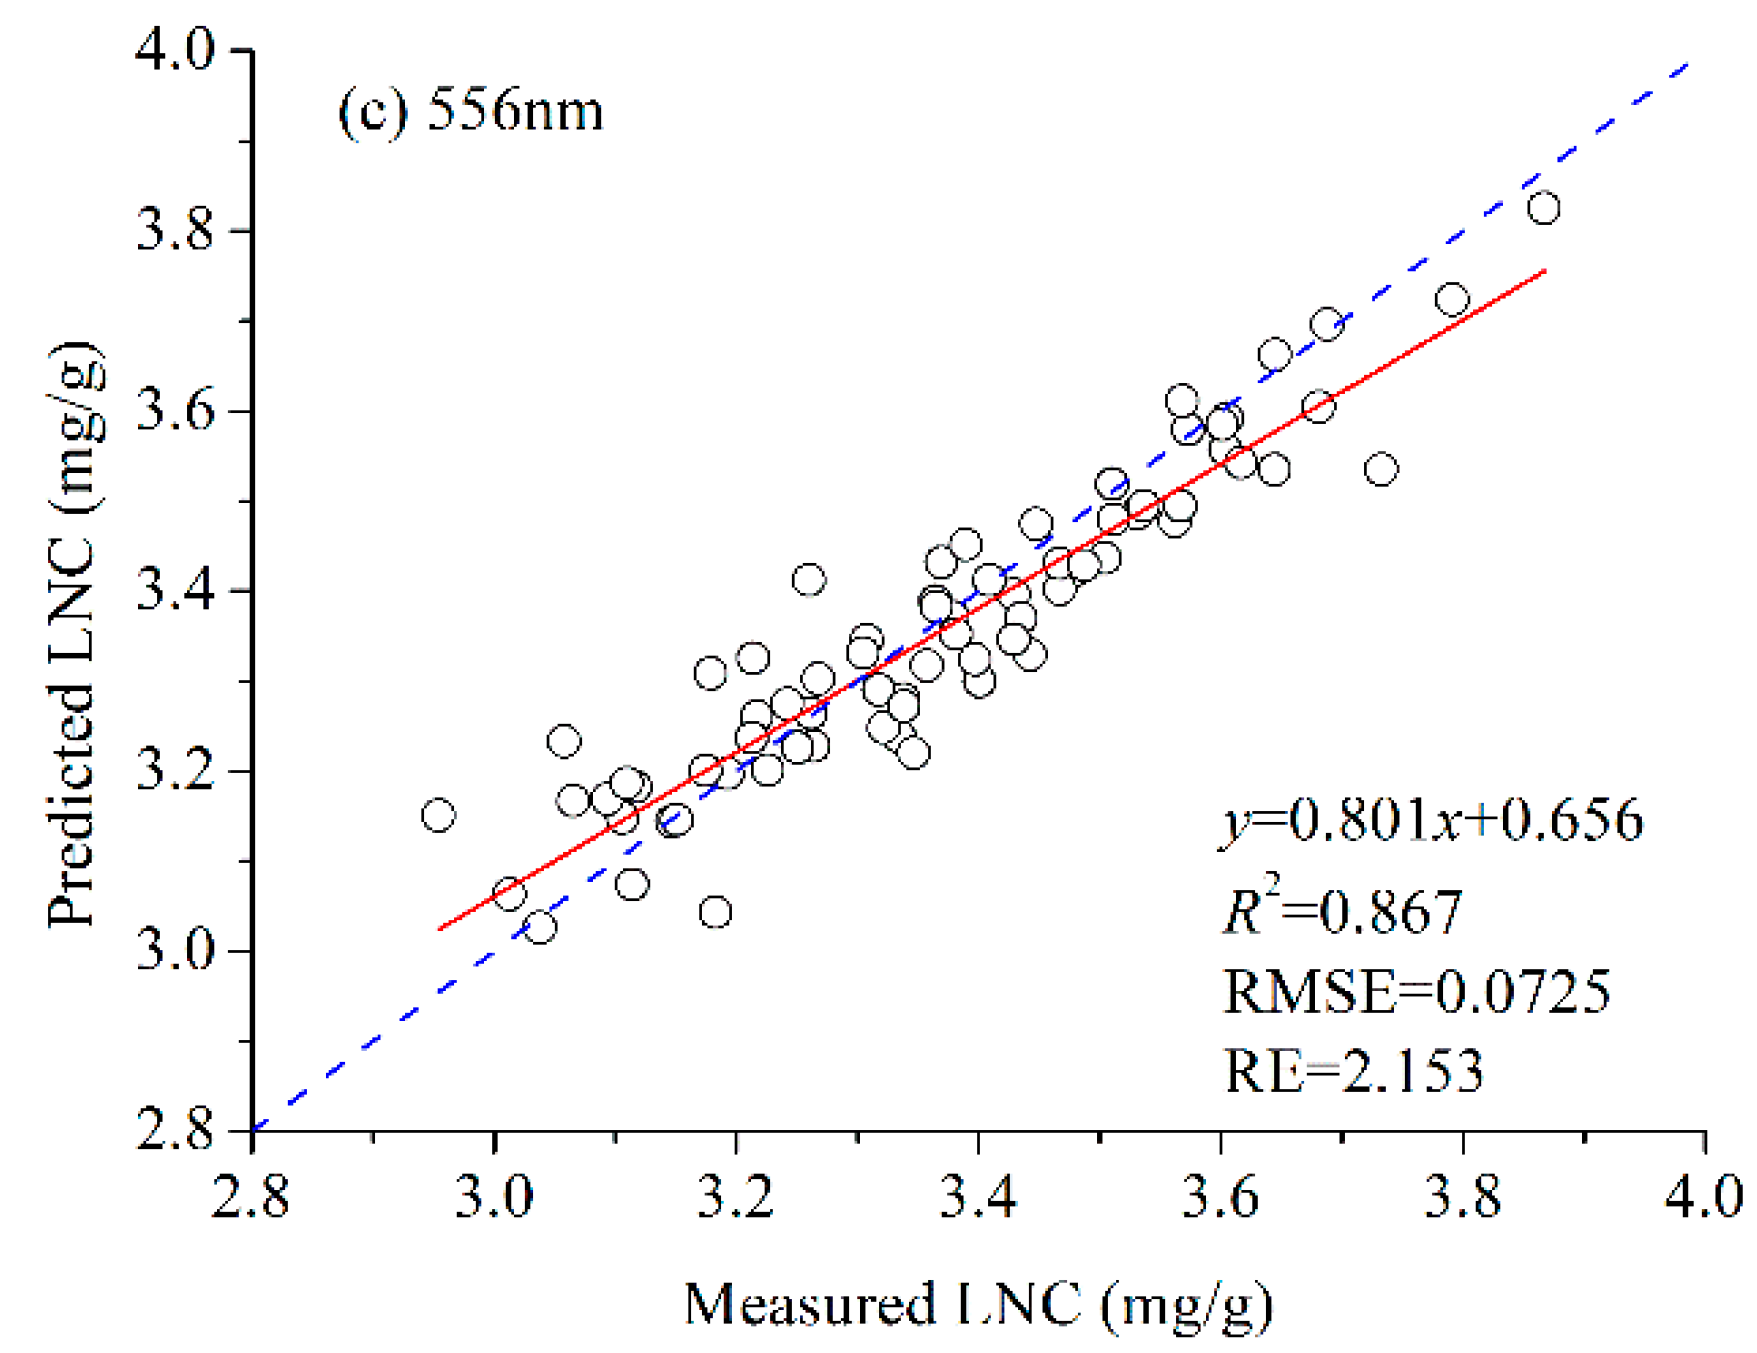
3.3. Performance of Each Band’s Fluorescence Intensity for LNC Estimation

The sampling interval of the fluorescence spectrum is 0.5 nm for the three excitation light wavelengths. The fluorescence spectra contain a large number of spectral bands, which may be autocorrelated between adjacent bands. To discuss the performance of the fluorescence intensity of each band for estimating LNC, the fluorescence characteristics of each band were used as the input parameter to train the BPNN model to estimate LNC. Each setting was repeated 100 times and the average of R2 was obtained for every band performance assessment in the LNC estimation. This method can eliminate the local optimum effect of the internal parameters on the BPNN model. The R2 between the measured and predicted LNC based on the fluorescence characteristic of a single wavelength with different excitation light wavelengths is shown in Figure 5.
As shown in Figure 5, different bands exhibited different performances in the LNC estimation. For 355 nm excitation light, the chlorophyll fluorescence from 670 nm to 750 nm displayed better performance (R2 > 0.70) in LNC estimation based on the BPNN model than the other bands. For 460 nm excitation light, the optimal fluorescence bands mainly focus on the near 735 nm with the R2 more than 0.65. For 556 nm excitation light, the optimal fluorescence bands are located near 685 nm, and the R2 is more than 0.7. Thus, the fluorescence characteristics of paddy rice, which can be used to estimate LNC, were mainly located in the red and far-red fluorescence spectral regions.

3.4. Performance of Fluorescence Ratio for LNC Estimation

To analyze the optimal fluorescence characteristics band ratios for estimating paddy rice LNC, further analysis was done on the performance of fluorescence ratios for LNC estimation based on the BPNN model by using datasets with different excitation light wavelengths (Figure 6).
Figure 6 shows the equipotential graphs of R2 between the measured and predicted LNC with the two wavelengths on the vertical axis and the abscissa with different excitation light wavelengths. An overview of the statistical consequence for the performance of all fluorescence ratios was also provided. For 355 nm excitation light, the fluorescence ratio between red and blue wavelengths displayed higher R2 than other ratios for estimating LNC. For the 460 and 556 nm excitation lights, the fluorescence ratios between far-red and red wavelengths exhibited higher R2 than other ratios for estimating LNC. Thus, the chlorophyll fluorescence characteristics ratio located at the red and far-red regions showed better performance for LNC estimation than other regions.

3.5. LNC Estimation Based on PCA

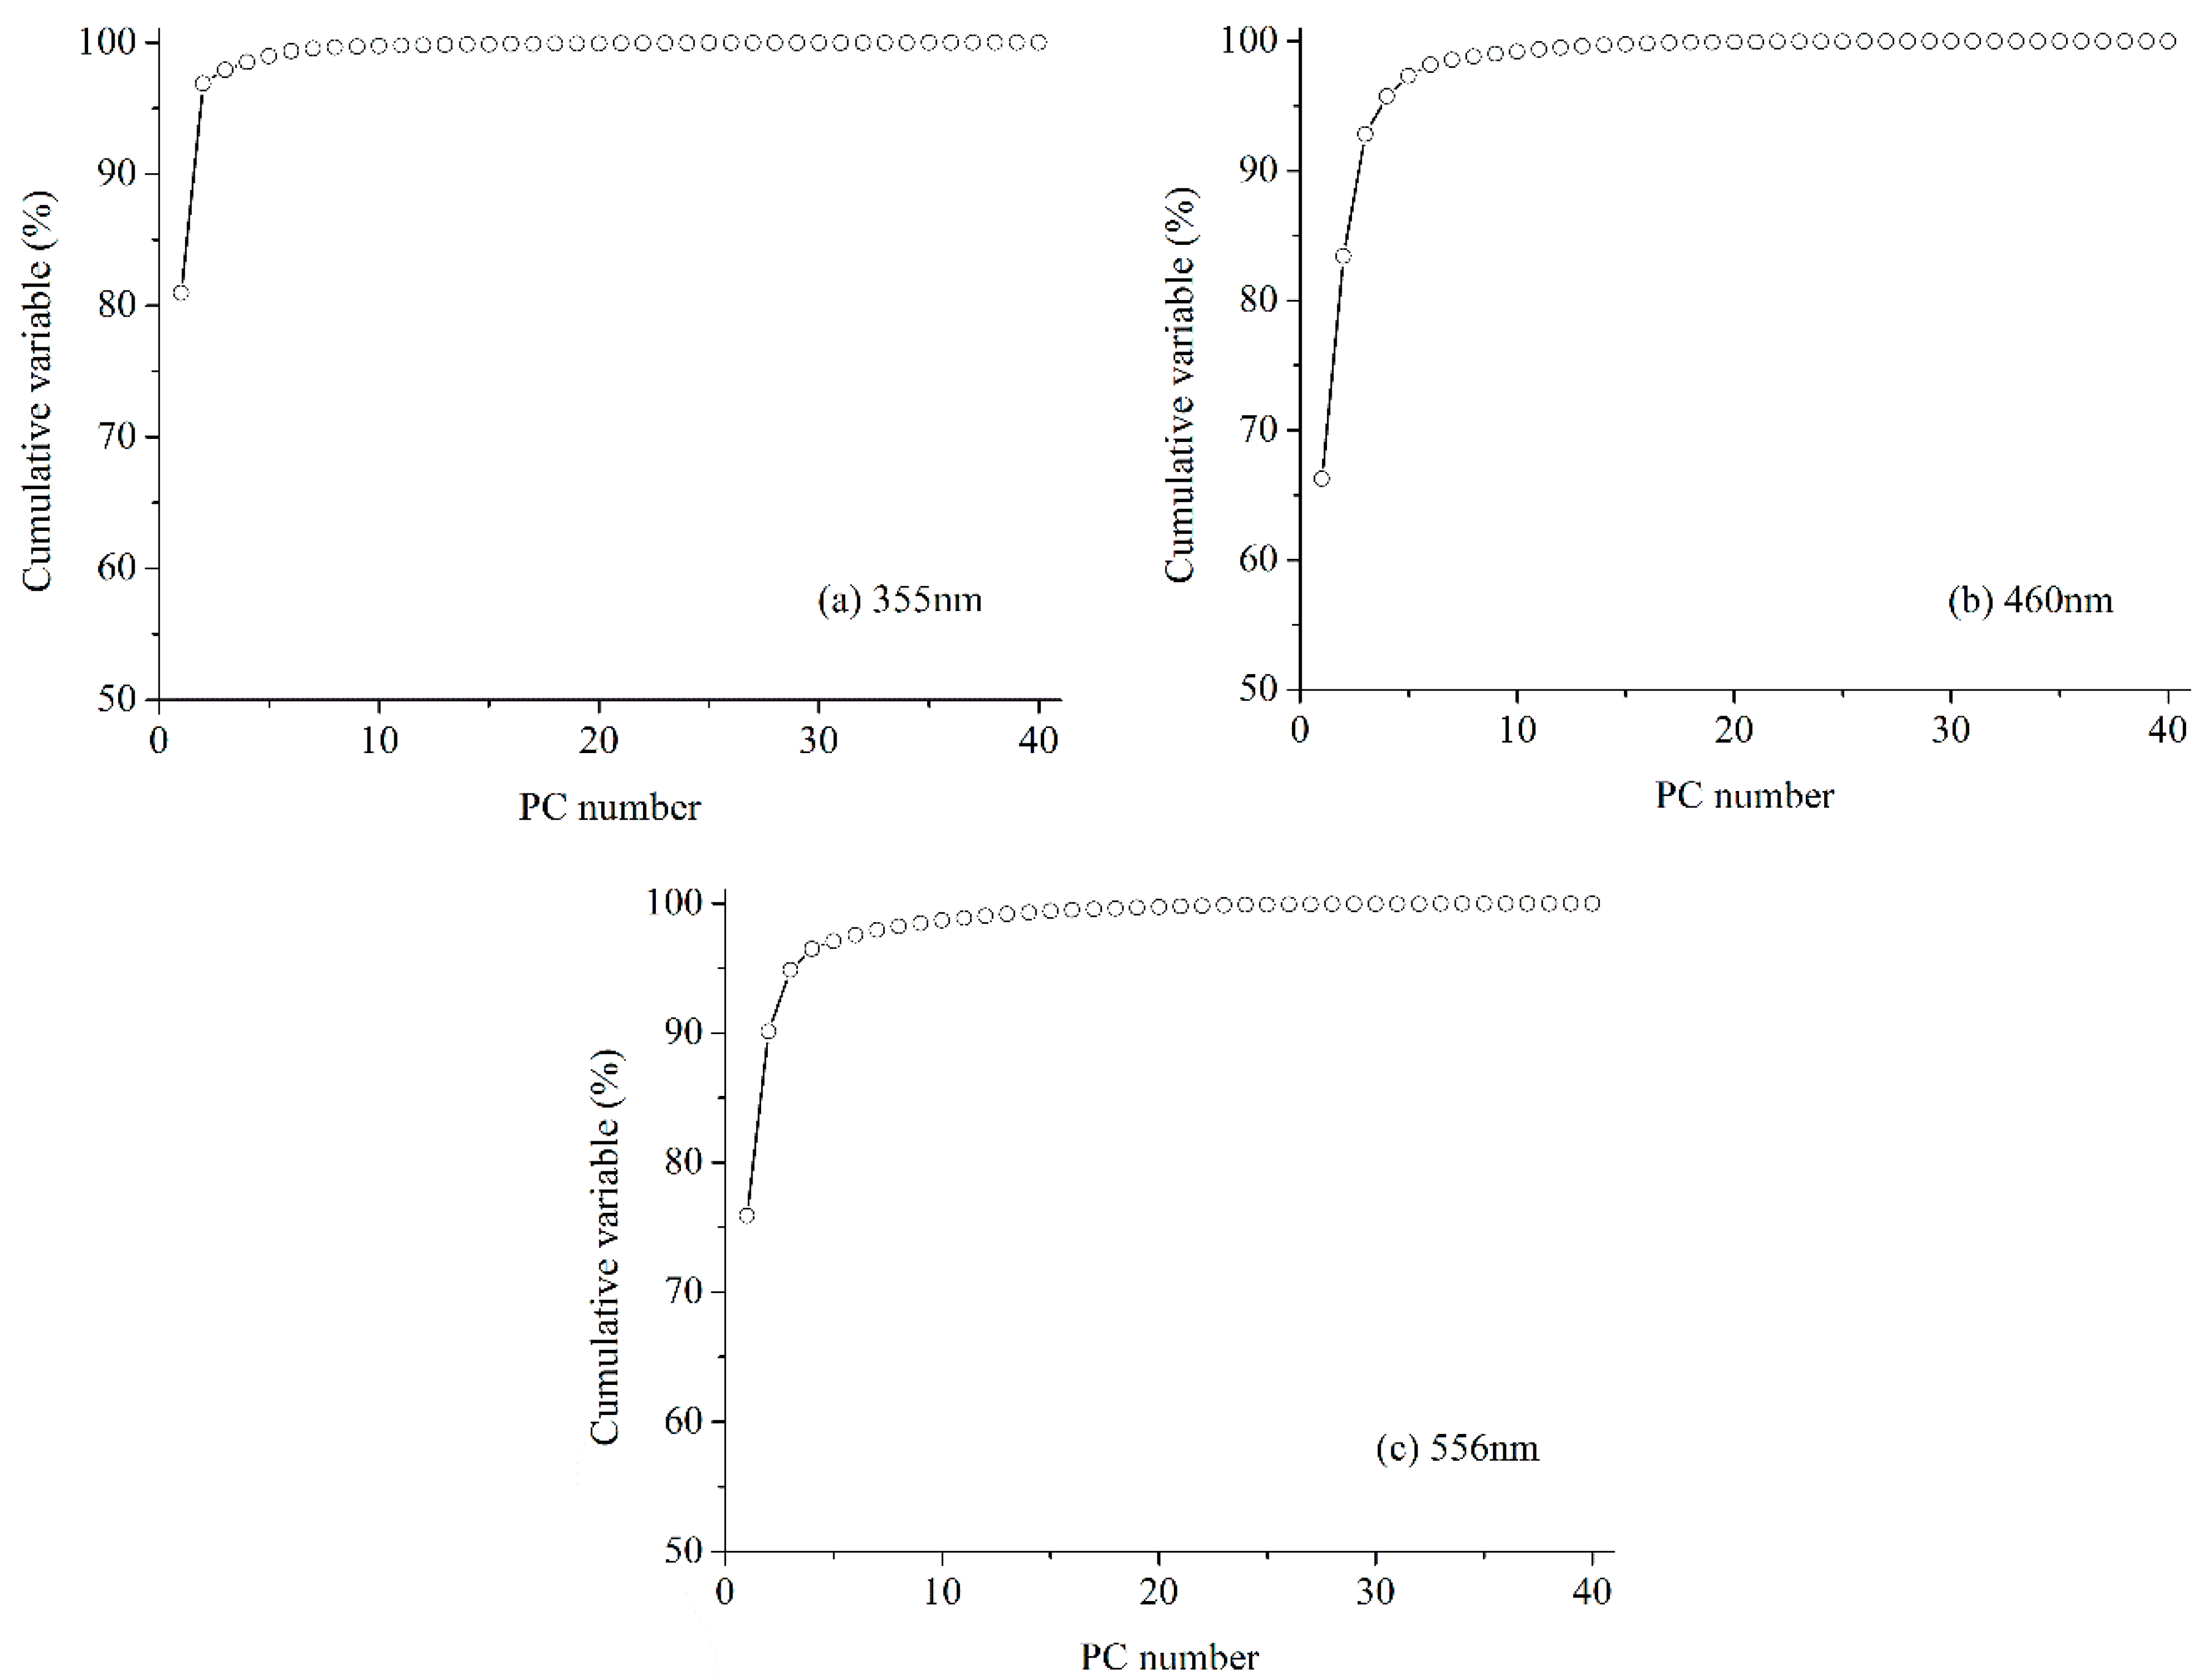
3.5.1. Accumulative Variance Analysis

PCA was utilized for the analysis of the internal correlation and reduction of dimensionality of the fluorescence spectra. The most significant characteristic variables were extracted, because the fluorescence spectra contain large amounts of information, which may influence its performance in the LNC estimation. The cumulative variance changes with PC are shown in Figure 7. Apparently, the cumulative variance with additional PC was increased slightly when the number of PCs exceeded four (Table 1).
According to previous research, the first four PCs were mainly attributed to the red and far-red regions [26]. For 355 nm excitation light, the PC3 contains the blue region, but the rate of contribution was less than 2%. Additionally, other PCs contained less spectral information, which is related to LNC that can be ignored and will not influence the performance of the extracted characteristics for estimating LNC.

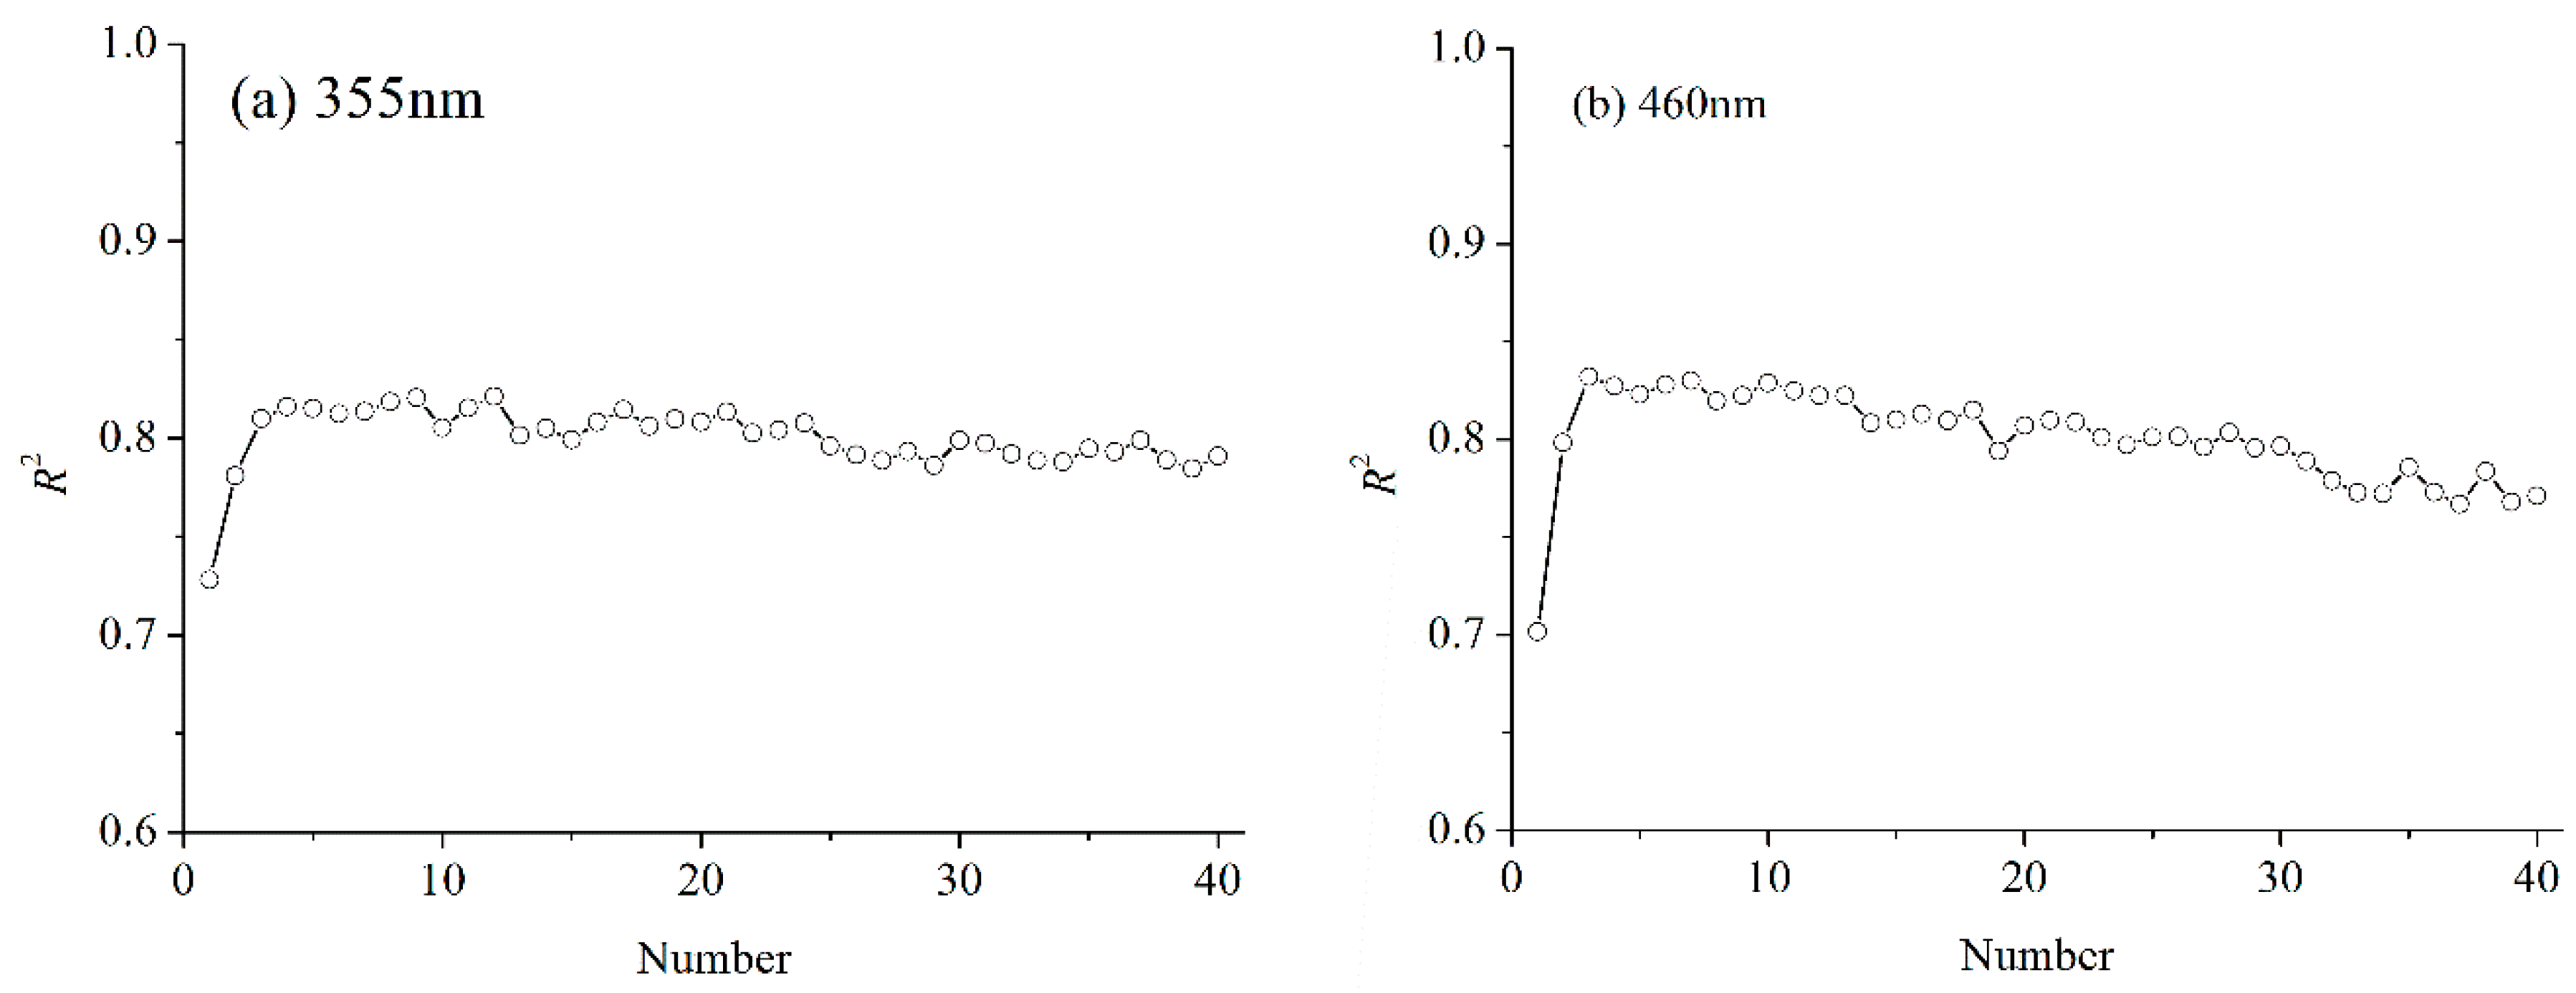
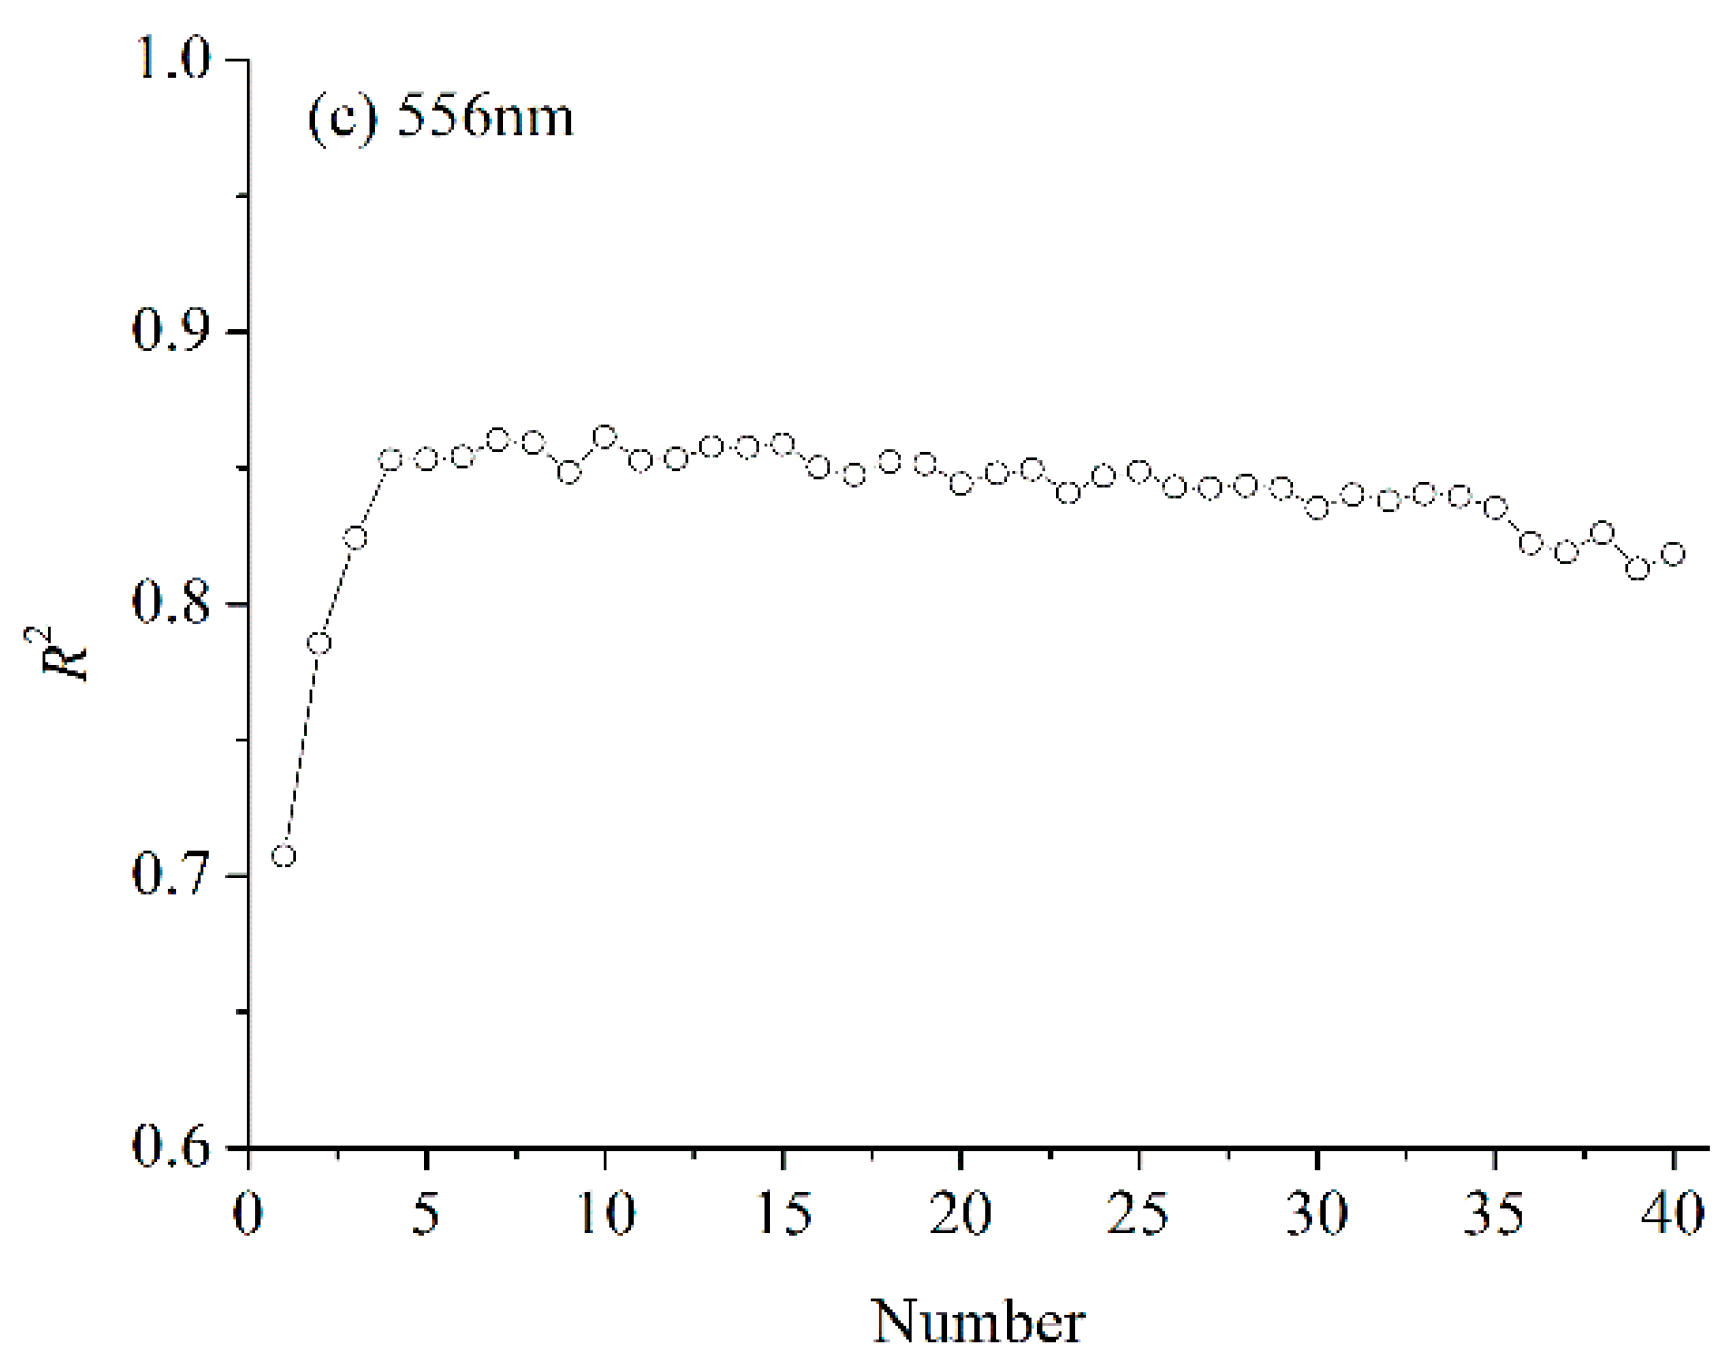
3.5.2. Performance of New Variables for LNC Estimation

Then, the new variables were calculated based on each PC and used to estimate LNC based on the BPNN model. The R2 between the measured and predicted LNC changed with the number of new variables (Figure 8).
As shown in Figure 8, the trend in R2 changes consistently with the number of variables at different excitation light wavelengths. R2 first increased with increasing the number of variables, and then decreased when the number of variables was over four or five. For 355 nm excitation light, the variable number is four when the R2 reached maximum. For 460 nm and 556 nm excitation light, the R2 exhibited the same tendency. Thus, the increase of explained variance with additional PC will be reduced to less than 1%, which means that the new calculated variable contains less spectral information than the raw variables. In addition, the results also demonstrated that the fluorescence spectra contain a large amount of information, which will influence the LNC estimation.

3.5.3. Estimation of LNC Based on Calculated Variables

The first four PCs were utilized for further study. The new variables calculated based on PC were provided as input parameters for training the BPNN model. The scatter plots between the measured and predicted LNC were established via linear regression analysis (Figure 9).
As shown in Figure 9, the performance of new variables calculated through PCA for monitoring LNC was analyzed for different excitation light wavelengths. The solid line represents the linear regression analysis that denotes the correlation between the predicted and measured LNC. The inversion results demonstrated that PCA can efficiently extract the fluorescence spectral characteristics for LNC estimation with high R2 and low RMSE, and RE values. All the R2 values exceed 0.80 and can reach up to 0.86. Therefore, the extracted fluorescence characteristics located at red and far-red region can be effectively utilized to estimate LNC.

4. Discussion

LNC is a significant indicator for estimating crop growth status. A large number of correlational studies have been done by using passive and active remote sensing technologies. Plant fluorescence emitted by the chlorophyll in the leaf, which is related to photosynthetic pigments, can be affected by LNC. In addition, the molecular structure of chlorophyll contains a porphyrin ring structure which is consisted of carbon©, oxygen (O), and N. Thus, fluorescence can be utilized in the estimation of the biochemical content of the leaf [40,41]. Most recently, related studies have been conducted on the application of LIF [42] to monitor the biochemical content of crops. In the present study, we mainly discussed the effect of fluorescence characteristics on the LNC estimation and provided a guide for the selection of fluorescence characteristics.
Chlorophyll fluorescence displayed two main fluorescence peaks, and the fluorescence peak at 685 nm is less intensive than that at 740 nm (Figure 3). The reason is that the fluorescence emitted between 680 and 695 nm was more strongly reabsorbed by the chlorophyll pigment in the upper layer leaf cells than the fluorescence emitted between 730 and 750 nm. Thus, chlorophyll pigment had little influence on the fluorescence peak at 740 nm [39]. The fluorescence spectra excited by different excitation light wavelengths exhibited different performance for the LNC estimation (Figure 4). The results showed that 355 nm and 556 nm excitation lights are superior to 460 nm excitation light in the LNC estimation. The possible interpretation may be that fluorescence spectrum excited by 355 nm excitation light contains more fluorescence characteristics (360–800 nm), and that excited by 556 nm excitation light can penetrate deeper in the leaf than other excitation lights [26,43]. Furthermore, the absorption of foliar pigment may also influence the excitation light in the inner leaf influencing the performance of fluorescence characteristics for the LNC estimation.
The fluorescence spectrum contained large amounts of spectral information, and the red and far-red regions exhibited good performance in estimating LNC (Figure 5). This result is mainly because a large autocorrelation between different bands exists, and the two adjacent bands carry similar fluorescence information. Thus, fluorescence characteristics can be selected from the near fluorescence peaks at 685 nm and 740 nm to estimate LNC and are not just limited to the fluorescence characteristics peaks. For 355 nm and 460 nm excitation lights, the fluorescence can be chosen from the far-red region for LNC estimation, and for 556 nm excitation light, the red region may be the optimal band. The results of PCA showed that the first three PCs can explain more than 90% of the spectral information with different excitation light wavelengths (Figure 7). However, the trend of R2 changes with variable number by increasing and then decreasing when the number of fluorescence characteristics was over four or five (Figure 8). PCA can extract significant spectral information, and the increase of explained variance will be small with an increase of PC number. In addition, when additional PCs cannot provide more information than raw spectral information, the performance of the extracted fluorescence characteristics will decrease in their ability to estimate LNC. Thus, when the number of PCs exceeded four or five, the R2 will decrease with an increase of variable number. However, to improve the inversion accuracy of the LNC, selecting at least two fluorescence spectral features in the red and far-red region, respectively, is necessary. Related investigation showed that the extracted fluorescence characteristics were mainly located at the red and far-red regions, which can be effectively applied to LNC estimation (Figure 9) [26]. In addition, the selection of fluorescence characteristics is not just limited in the fluorescence characteristic peaks at 685 nm and 740 nm for LNC estimation. The fluorescence characteristics, which are located in the red and far-red regions (660–770 nm), can be also efficiently applied to LNC estimation [44].
In this study, a detailed analysis of the performance of the fluorescence spectral characteristics of each band for LNC estimation was conducted based on BPNN. However, some limitations should be considered for further studies. For the BPNN, although each setting was repeated one hundred times and the average was obtained to eliminate the local optimum effect of the internal parameters of the BPNN model, the optimal network architecture also needs to be analyzed. Furthermore, the effect of the number of fluorescence characteristics on the reversion performance was discussed in detail. Selecting the number of optimal fluorescence characteristics for LNC estimation also needs to be addressed in further studies. In addition, the effect of the spectral sampling interval and the type of crops on the performance of fluorescence characteristics for estimating LNC will be a promising study direction.

5. Conclusions

In this study, the performance of the fluorescence characteristics and fluorescence ratio of each band for the LNC estimation were analyzed in detail based on the BPNN model combined with PCA. Furthermore, the effect of the number of fluorescence characteristics on the accuracy of LNC estimation was also analyzed. The results demonstrated that the fluorescence characteristic, which is related to the LNC, is mainly located in the red and far-red regions, and the latter is superior to the former for LNC monitoring. For 355 nm and 460 nm excitation lights, the fluorescence characteristics can be chosen from the far-red region for LNC estimation, and for 556 nm excitation light, the red region is optimal. Thus, the selection of fluorescence characteristics is not just limited in the fluorescence peaks for LNC estimation. What’s more, this study found that selecting at least two fluorescence spectral features in the red and far-red regions is necessary for LNC estimation. Additional research will be conducted to extend the results to different crop varieties.

Author Contributions

This experiment was conducted and designed by J.Y., W.G., S.S. (Shalei Song), L.D., S.S. (Shuo Shi), J.S. and B.C. The data processing was performed by J.Y. The manuscript written by J.Y. In addition, S.S. (Shalei Song) has provided significant contributions for manuscript preparation. All authors reviewed the manuscript.

Funding

This research was funded by the National Key Research and Development Program of China (Grant No. 2018YFB0504500), the National Natural Science Foundation (Grant No. 41571370), the Natural Science Foundation of Hubei Province (Grant No. 2018CFB272), the Open Fund of State Laboratory of Information Engineering in Surveying, Mapping and Remote Sensing, Wuhan University (Grant No. 17R05), Fundamental Research Funds for the Central Universities, China University of Geosciences (Wuhan) (Grant No. CUG170661).

Acknowledgments

The authors wish to thank College of Plant Science & Technology of Huazhong Agricultural University for providing the experimental samples and wish to thank Wuhan Academy of Agricultural Science & Technology for providing the LNCs of samples.

Conflicts of Interest

The authors declare no conflict of interest.

References

  1. Li, F.; Mistele, B.; Hu, Y.; Chen, X.; Schmidhalter, U. Reflectance estimation of canopy nitrogen content in winter wheat using optimised hyperspectral spectral indices and partial least squares regression. Eur. J. Agron. 2014, 52, 198–209. [Google Scholar] [CrossRef]
  2. Gameiro, C.; Utkin, A.; Cartaxana, P.; da Silva, J.M.; Matos, A. Rapid and nondestructive estimation of the nitrogen nutrition index in winter barley using chlorophyll measurements. Agric. Water Manag. 2016, 164, 127–136. [Google Scholar] [CrossRef]
  3. Tian, Y.C.; Yao, X.; Yang, J.; Cao, W.X.; Hannaway, D.B.; Zhu, Y. Assessing newly developed and published vegetation indices for estimating rice leaf nitrogen concentration with ground- and space-based hyperspectral reflectance. Field Crop. Res. 2011, 120, 299–310. [Google Scholar] [CrossRef]
  4. Feng, W.; Yao, X.; Zhu, Y.; Tian, Y.; Cao, W. Monitoring leaf nitrogen status with hyperspectral reflectance in wheat. Eur. J. Agron. 2008, 28, 394–404. [Google Scholar] [CrossRef]
  5. Cecchi, G.; Mazzinghi, P.; Pantani, L.; Valentini, R.; Tirelli, D.; De Angelis, P. Remote sensing of chlorophyll a fluorescence of vegetation canopies: 1. Near and far field measurement techniques. Remote Sens. Environ. 1994, 47, 18–28. [Google Scholar] [CrossRef]
  6. Zarco-Tejada, P.J.; Rueda, C.A.; Ustin, S.L. Water content estimation in vegetation with modis reflectance data and model inversion methods. Remote Sens. Environ. 2003, 85, 109–124. [Google Scholar] [CrossRef]
  7. Stroppiana, D.; Boschetti, M.; Brivio, P.A.; Bocchi, S. Plant nitrogen concentration in paddy rice from field canopy hyperspectral radiometry. Field Crop. Res. 2009, 111, 119–129. [Google Scholar] [CrossRef]
  8. Cendrero-Mateo, M.P.; Moran, M.S.; Papuga, S.A.; Thorp, K.; Alonso, L.; Moreno, J.; Ponce-Campos, G.; Rascher, U.; Wang, G. Plant chlorophyll fluorescence: Active and passive measurements at canopy and leaf scales with different nitrogen treatments. J. Exp. Bot. 2016, 67, 275–286. [Google Scholar] [CrossRef] [PubMed]
  9. Song, S.; Gong, W.; Zhu, B.; Huang, X. Wavelength selection and spectral discrimination for paddy rice, with laboratory measurements of hyperspectral leaf reflectance. ISPRS J. Photogramm. 2011, 66, 672–682. [Google Scholar] [CrossRef]
  10. Diacono, M.; Rubino, P.; Montemurro, F. Precision nitrogen management of wheat. A review. Agron. Sustain. Dev. 2013, 33, 219–241. [Google Scholar] [CrossRef]
  11. He, L.; Song, X.; Feng, W.; Guo, B.B.; Zhang, Y.S.; Wang, Y.H.; Wang, C.Y.; Guo, T.C. Improved remote sensing of leaf nitrogen concentration in winter wheat using multi-angular hyperspectral data. Remote Sens. Environ. 2016, 174, 122–133. [Google Scholar] [CrossRef]
  12. Osborne, S.L.; Schepers, J.S.; Francis, D.D.; Schlemmer, M.R. Detection of phosphorus and nitrogen deficiencies in corn using spectral radiance measurements. Agron. J. 2002, 94, 1215–1221. [Google Scholar] [CrossRef]
  13. Kalaji, H.M.; Oukarroum, A.; Alexandrov, V.; Kouzmanova, M.; Brestic, M.; Zivcak, M.; Samborska, I.A.; Cetner, M.D.; Allakhverdiev, S.I.; Goltsev, V. Identification of nutrient deficiency in maize and tomato plants by in vivo chlorophyll a fluorescence measurements. Plant Physiol. Biochem. 2014, 81, 16–25. [Google Scholar] [CrossRef] [PubMed]
  14. Živcak, M.; Olsovska, K.; Slamka, P.; Galambošová, J.; Rataj, V.; Shao, H.; Brestič, M. Application of chlorophyll fluorescence performance indices to assess the wheat photosynthetic functions influenced by nitrogen deficiency. Plant Soil Environ. 2014, 60, 210–215. [Google Scholar] [CrossRef] [Green Version]
  15. Zivcak, M.; Brestic, M.; Kunderlikova, K.; Olsovska, K.; Allakhverdiev, S.I. Effect of photosystem I inactivation on chlorophyll a fluorescence induction in wheat leaves: Does activity of I photosystem play any role in OJIP rise? J. Photochem. Photobiol. B Biol. 2015, 152, 318–324. [Google Scholar] [CrossRef] [PubMed]
  16. Mauromicale, G.; Ierna, A.; Marchese, M. Chlorophyll fluorescence and chlorophyll content in field-grown potato as affected by nitrogen supply, genotype, and plant age. Photosynthetica 2006. [Google Scholar] [CrossRef]
  17. Tartachnyk, I.; Rademacher, I. Estimation of nitrogen deficiency of sugar beet and wheat using parameters of laser induced and pulse amplitude modulated chlorophyll fluorescence. J. Appl. Bot. 2003, 77, 61–67. [Google Scholar]
  18. Apostol, S.; Viau, A.A.; Tremblay, N. A comparison of multiwavelength laser-induced fluorescence parameters for the remote sensing of nitrogen stress in field-cultivated corn. Can. J. Remote Sens. 2007, 33, 150–161. [Google Scholar] [CrossRef]
  19. Yang, J.; Gong, W.; Shi, S.; Du, L.; Sun, J.; Ma, Y.Y.; Song, S.L. Accurate identification of nitrogen fertilizer application of paddy rice using laser-induced fluorescence combined with support vector machine. Plant Soil Environ. 2015, 61, 501–506. [Google Scholar] [CrossRef]
  20. Kalaji, H.M.; Schansker, G.; Brestic, M.; Bussotti, F.; Calatayud, A.; Ferroni, L.; Goltsev, V.; Guidi, L.; Jajoo, A.; Li, P. Frequently asked questions about chlorophyll fluorescence, the sequel. Photosynth. Res. 2017, 132, 13–66. [Google Scholar] [CrossRef] [PubMed]
  21. Subhash, N.; Mohanan, C.N. Laser-induced red chlorophyll fluorescence signatures as nutrient stress indicator in rice plants. Remote Sens. Environ. 1994, 47, 45–50. [Google Scholar] [CrossRef]
  22. Günther, K.; Dahn, H.G.; Lüdeker, W. Remote sensing vegetation status by laser-induced fluorescence. Remote Sens. Environ. 1994, 47, 10–17. [Google Scholar] [CrossRef]
  23. Campbell, P.K.E.; Middleton, E.M.; Corp, L.A.; Kim, M.S. Contribution of chlorophyll fluorescence to the apparent vegetation reflectance. Sci. Total Environ. 2008, 404, 433–439. [Google Scholar] [CrossRef] [PubMed]
  24. Gu, X.; Xu, P.; Qiu, H.; Feng, H. Monitoring the Chlorophyll Fluorescence Parameters in Rice under Flooding and Waterlogging Stress Based on Remote Sensing; IEEE: Waikoloa, HI, USA, 2014. [Google Scholar]
  25. Anderson, B.; Buah-Bassuah, P.K.; Tetteh, J.P. Using violet laser-induced chlorophyll fluorescence emission spectra for crop yield assessment of cowpea (Vigna unguiculata (L.) walp) varieties. Meas. Sci. Technol. 2004, 15, 1255–1265. [Google Scholar] [CrossRef]
  26. Yang, J.; Sun, J.; Du, L.; Chen, B.; Zhang, Z.; Shi, S.; Gong, W. Effect of fluorescence characteristics and different algorithms on the estimation of leaf nitrogen content based on laser-induced fluorescence lidar in paddy rice. Opt. Express 2017, 25, 3743–3755. [Google Scholar] [CrossRef] [PubMed]
  27. Yang, J.; Gong, W.; Shi, S.; Du, L.; Sun, J.; Song, S.; Chen, B.; Zhang, Z. Analyzing the performance of fluorescence parameters in the monitoring of leaf nitrogen content of paddy rice. Sci. Rep. 2016. [Google Scholar] [CrossRef] [PubMed]
  28. Saito, Y.; Kanoh, M.; Hatake, K.I.; Kawahara, T.D.; Nomura, A. Investigation of laser-induced fluorescence of several natural leaves for application to lidar vegetation monitoring. Appl. Opt. 1998, 37, 431–437. [Google Scholar] [CrossRef] [PubMed]
  29. Krause, G.H.; Weis, E. Chlorophyll fluorescence as a tool in plant physiology. Photosynth. Res. 1984, 5, 139–157. [Google Scholar] [CrossRef] [PubMed]
  30. Kjeldahl, J. Neue methode zur bestimmung des stickstoffs in organischen körpern. Z. Anal. Chem. 1883, 22, 366–382. [Google Scholar] [CrossRef]
  31. Keiner, L.E.; Yan, X.H. A neural network model for estimating sea surface chlorophyll and sediments from thematic mapper imagery. Remote Sens. Environ. 1998, 66, 153–165. [Google Scholar] [CrossRef]
  32. Samborska, A.I.; Alexandrov, V.; Sieczko, L.; Kornatowska, B.; Goltsev, V.; Magdalena, D.C.; Kalaji, H.M. Artificial Neural Networks and Their Application in Biological and Agricultural Research. Available online: http://signpostejournals.com/ejournals/Portals/12/v22.pdf (accessed on 3 September 2018).
  33. Yi, Q.X.; Huang, J.F.; Wang, F.M.; Wang, X.Z.; Liu, Z.Y. Monitoring rice nitrogen status using hyperspectral reflectance and artificial neural network. Environ. Sci. technol. 2007, 41, 6770–6775. [Google Scholar] [CrossRef] [PubMed]
  34. Galvão, L.S.; Pizarro, M.A.; Epiphanio, J.C.N. Variations in reflectance of tropical soils: Spectral-chemical composition relationships from aviris data. Remote Sens. Environ. 2001, 75, 245–255. [Google Scholar] [CrossRef]
  35. Bro, R.; Smilde, A.K. Principal component analysis. Anal. Methods 2014, 6, 2812–2831. [Google Scholar] [CrossRef] [Green Version]
  36. Chappelle, E.W.; McMurtrey, J.E.; Kim, M.S. Identification of the pigment responsible for the blue fluorescence band in the laser induced fluorescence (lif) spectra of green plants, and the potential use of this band in remotely estimating rates of photosynthesis. Remote Sens. Environ. 1991, 36, 213–218. [Google Scholar] [CrossRef]
  37. Tremblay, N.; Wang, Z.; Cerovic, Z.G. Sensing crop nitrogen status with fluorescence indicators. A review. Agron. Sustain. Dev. 2012, 32, 451–464. [Google Scholar] [CrossRef]
  38. Chappelle, E.W.; Wood, F.M.; Wayne Newcomb, W.; McMurtrey, J.E. Laser-induced fluorescence of green plants. 3: LIF spectral signatures of five major plant types. Appl. Opt. 1985, 24, 74–80. [Google Scholar] [CrossRef] [PubMed]
  39. Malenovsky, Z.; Mishra, K.B.; Zemek, F.; Rascher, U.; Nedbal, L. Scientific and technical challenges in remote sensing of plant canopy reflectance and fluorescence. J. Exp. Bot. 2009, 60, 2987–3004. [Google Scholar] [CrossRef] [PubMed] [Green Version]
  40. Pieruschka, R.; Klimov, D.; Kolber, Z.S.; Berry, J.A. Monitoring of cold and light stress impact on photosynthesis by using the laser induced fluorescence transient (LIFT) approach. Funct. Plant Biol. 2010, 37, 395–402. [Google Scholar] [CrossRef]
  41. Kalaji, H.M.; Jajoo, A.; Oukarroum, A.; Brestic, M.; Zivcak, M.; Samborska, I.A.; Cetner, M.D.; Łukasik, I.; Goltsev, V.; Ladle, R.J. Chlorophyll a fluorescence as a tool to monitor physiological status of plants under abiotic stress conditions. Acta Physiol. Plant 2016, 38, 1–11. [Google Scholar] [CrossRef]
  42. Hoge, F.E.; Swift, R.N.; Yungel, J.K. Feasibility of airborne detection of laser-induced fluorescence emissions from green terrestrial plants. Appl. Opt. 1983, 22, 2991–3000. [Google Scholar] [CrossRef] [PubMed]
  43. Schweiger, J.; Lang, M.; Lichtenthaler, H.K. Differences in fluorescence excitation spectra of leaves between stressed and non-stressed plants. J. Plant Physiol. 1996, 148, 536–547. [Google Scholar] [CrossRef]
  44. Meroni, M.; Rossini, M.; Guanter, L.; Alonso, L.; Rascher, U.; Colombo, R.; Moreno, J. Remote sensing of solar-induced chlorophyll fluorescence: Review of methods and applications. Remote Sens. Environ. 2009, 113, 2037–2051. [Google Scholar] [CrossRef]
Figure 1. Location of experimental fields, Huazhong Agricultural University in Wuhan, Hubei province, China.
Remotesensing 10 01402 g001
Figure 2. The schematic of the LIF system. BE, beam expander (5 times at 355 nm, 460 nm and 556 nm); ICCD, intensified charge-coupled device.
Remotesensing 10 01402 g002
Figure 3. Paddy rice foliar fluorescence spectrum excited by 355 nm excitation light.
Remotesensing 10 01402 g003
Figure 4. Relationship between the measured and predicted LNC by using BPNN based on fluorescence spectra with different excitation light wavelengths. (a) 355 nm, (b) 460 nm, (c) 556 nm. The blue dotted line is the 1:1 line. The red solid line is the linear regression.
Remotesensing 10 01402 g004aRemotesensing 10 01402 g004b
Figure 5. R2 between the measured and predicted LNC with single wavelength fluorescence served as the input parameter to train the BPNN model for different excitation light wavelengths. (a) 355 nm, (b) 460 nm, (c) 556 nm.
Remotesensing 10 01402 g005aRemotesensing 10 01402 g005b
Figure 6. Equipotential graphs of R2 between the measured and predicted LNC based on the BPNN model with fluorescence ratio of each band for different excitation light wavelengths. (a) 355 nm, (b) 460 nm, (c) 556 nm.
Remotesensing 10 01402 g006
Figure 7. Cumulative explained variances of PC for different excitation light wavelengths. (a) 355 nm, (b) 460 nm, (c) 556 nm.
Remotesensing 10 01402 g007
Figure 8. R2 between the measured and predicted LNC changes with PC number based on the BPNN model at different excitation light wavelengths. (a) 355 nm, (b) 460 nm, (c) 556 nm.
Remotesensing 10 01402 g008aRemotesensing 10 01402 g008b
Figure 9. Relationship between the predicted LNC by using PCA combined with BPNN and the measured LNC for different excitation light wavelengths. (a) 355 nm, (b) 460 nm, (c) 556 nm. The blue dotted line is the 1:1 line. The red solid line is the linear regression.
Remotesensing 10 01402 g009aRemotesensing 10 01402 g009b
Table 1. Percentages of explained variance for the first four principal components (PCs) with different excitation wavelengths.
355 nm460 nm556 nm
Eigen ValuesExplained VarianceEigen ValuesExplained VarianceEigen ValuesExplained Variance
PC111.0580.95%4.0866.24%4.9875.88%
PC21.2615.94%1.0817.18%0.5214.24%
PC30.131.02%0.589.37%0.284.71%
PC40.080.61%0.182.94%0.121.64%

