Article

Greening and Browning of the Hexi Corridor in Northwest China: Spatial Patterns and Responses to Climatic Variability and Anthropogenic Drivers

Key Laboratory of Western China’s Environmental Systems, Ministry of Education, College of Earth and Environmental Sciences, Lanzhou University, Lanzhou 730000, China
*
Author to whom correspondence should be addressed.
Qingyu Guan and Liqin Yang equally contributed to this work as co-first authors.
Remote Sens. 2018, 10(8), 1270; https://doi.org/10.3390/rs10081270
Submission received: 3 June 2018 / Revised: 24 July 2018 / Accepted: 10 August 2018 / Published: 12 August 2018
(This article belongs to the Special Issue Monitoring Agricultural Land-Use Change and Land-Use Intensity)

Abstract

:
The arid region of northwest China provides a unique terrestrial ecosystem to identify the response of vegetation activities to natural and anthropogenic changes. To reveal the influences of climate and anthropogenic factors on vegetation, the Normalized Difference Vegetation Index (NDVI), climate data, and land use and land cover change (LUCC) maps were used for this study. We analyzed the spatiotemporal change of NDVI during 2000–2015. A partial correlation analysis suggested that the contribution of precipitation (PRE) and temperature (TEM) on 95.43% of observed greening trends was 47% and 20%, respectively. The response of NDVI in the eastern section of the Qilian Mountains (ESQM) and the western section of the Qilian Mountains (WSQM) to PRE and TEM showed opposite trends. The multiple linear regressions used to quantify the contribution of anthropogenic activity on the NDVI trend indicated that the ESQM and oasis areas were mainly affected by anthropogenic activities (26%). The observed browning trend in the ESQM was attributed to excessive consumption of natural resources. A buffer analysis and piecewise regression methods were further applied to explore the influence of urbanization on NDVI and its change rate. The study demonstrated that urbanization destroys the vegetation cover within the developed city areas and extends about 4 km beyond the perimeter of urban areas and the NDVI of buffer cities (counties) in the range of 0–4 km (0–3 km) increased significantly. In the range of 5–15 (4–10) km (except for Jiayuguan), climate factors were the major drivers of a slight downtrend in the NDVI. The relationship of land use change and NDVI trends showed that construction land, urban settlement, and farmland expanded sharply by 171.43%, 60%, and 10.41%, respectively. It indicated that the rapid process of urbanization and coordinated urban-rural development shrunk ecosystem services.

Graphical Abstract

1. Introduction

Vegetation, as an essential portion of terrestrial ecosystems, plays a pivotal role in regulating the carbon cycle, climate change, and energy exchange through photosynthesis, evapotranspiration, and surface albedo [1,2,3,4]. Changes in vegetation activity were mainly affected by biogeochemical effects and socio-economic factors on a global scale [5,6]. Among them, the biogeochemical effects mainly include the “fertilization effects” of CO2, regional climatic change, and nitrogen deposition [7,8]. Anthropogenic activities especially include land use change and socio-economic factors [9,10]. Thus, changes in vegetation activities often serve as powerful indicators of the response to climate variability and anthropogenic activities [4,11]. On a regional scale, changes in vegetation greenness are affected by climate variability and anthropogenic factors [12,13]. Even anthropogenic disturbances on a small-scale and at low intensity can induce long-term changes in vegetation patterns and land use [14].
A Normalized Difference Vegetation Index (NDVI) could monitor and estimate vegetation activities over different spatiotemporal scales without damaging or altering vegetation [15,16]. Therefore, it is widely used to study vegetation activities, such as greening and browning [8,17]. Considering the differences in responses of vegetation activities to climate variability under various eco-environmental conditions [18,19], some authors have established correlations between an NDVI and the main climate factors to study vegetation changes at global and regional scales, especially in arid and semi-arid regions [12,20,21,22,23]. Recently, the disturbance of anthropogenic activities, such as urbanization [24,25], agricultural activities [26], and implementation of ecological management policies [27] in vegetation, is becoming increasingly prominent. The impact of socio-economic factors on vegetation in small areas or even a wider range cannot be ignored [6,9,10,25]. Thus, the relationship among the spatiotemporal distribution of vegetation, climate, and anthropogenic factors has currently become a popular topic in the study of changes in vegetation trends [4,11,28]. Furthermore, vegetation trends are disturbed by the process of urbanization and industrialization, where land use change has caused the degradation of vegetation that has caught the attention of the scholars [14,24,29,30]. Relatively large-scale anthropogenic disturbances across major regions have been caused by urbanization, while currently, most studies are focused on arctic regions [14,29,31,32]. The large-scale effects posed by anthropogenic disturbance on vegetation trends in China are still poorly understood [24,30]. Hence, this study aimed to reveal the apparent vegetation trends in the Hexi Corridor, which is disturbed by urbanization and industrialization.
The Hexi Corridor is located in the arid region of northwest China. The oasis only occupies 4–5% of the total study area, but anthropogenic activities in this area are the most intensive. Due to the population explosion, especially the accelerating process of urbanization and industrialization, the oasis vegetation has been subjected to varying degrees of anthropogenic disturbance [33,34]. Anthropogenic activities and climate variations have caused serious damage to the ecological environment, vegetation growth, and land resources in the Hexi Corridor in recent years [35,36]. The government and scholars have paid greater attention to understand the driving mechanisms deeply and control degradation development [13,35,36,37,38]. The previous studies about vegetation in the arid region of northwestern China focused on a larger scale (mostly at the global and national scales) [39,40] or a local scale [35,36,41]. Several studies mainly focus on the single impact of climate change [13], desertification [11], water management [41], and sparse alpine vegetation [36]. However, a spatial analysis and quantitative research about the trends of inner vegetation change, its change rate, and driver factors in the study area is relatively scarce.
Within this context, the main objective of this study was to determine the spatiotemporal changes of vegetation activities and their response to climatic and anthropogenic drivers by using spatial quantitative expressions of climate and anthropogenic factors and to verify whether arid areas will experience a temporal shift in greening as temperature increases. In view of the disturbance of urbanization and industrialization, further studies were conducted to research the influence of anthropogenic disturbance on vegetation variations. In addition, this study aimed to provide the scientific basis for determining future patterns of water availability and the ecological environment of oases and to promote regional social-economic sustainable development. Based on the hypothesis that the main contents of this article are as follows: (1) to investigate the spatiotemporal variation characteristics of vegetation greening or browning trends in the Hexi Corridor from 2000 to 2015; (2) to use the remote sensing and meteorological data of the growing season to explore the relationship between climatic factors and NDVI, and then use the adjusted multiple coefficients of determination (adj-R2) to quantitatively analyze the contribution of climate and anthropogenic factors to vegetation trends; and (3) to quantitatively study the effect of anthropogenic disturbance on vegetation activities within the study area.

2. Study Area and Data Sources

2.1. Study Area

The Hexi Corridor (37°15′–42°49′N, 92°44′–104°14′E) is located in northwest Gansu province. It starts from Wushao Mountain in the east and stretches to Jade Gate Pass to the west and is surrounded by the Qilian Mountains, Mazong Mountain, Heli Mountain, and Longshou Mountain. It is approximately 1000 km long from east to west, and the whole area is approximately 276,000 km2, which includes the five prefecture-level cities of Wuwei, Jinchang, Zhangye, Jiuquan, and Jiayuguan (Figure 1). The mean annual precipitation (PRE) of the Hexi Corridor is 111.0 mm (maximum 353.1 mm and minimum 15.1 mm); the mean annual temperature (TEM) is 14.7 °C (maximum 20.1 °C and minimum 0.9 °C). The total annual solar radiation approximately is 5500–6400 MJ/m2. The elevation of the study area ranges from 798 m to 5662 m (Figure 1). The vegetation of this area shows unique vertically zonality characteristics because of the combined effects of complex topography and atmospheric circulation (Figure 2b). The north of the Hexi Corridor is adjacent to the Badain Jaran Desert and mainly consists of sparse desert and temperate grassland drought-tolerant vegetation. The southern area, adjacent to the north piedmont of Qilian Mountains, is cold and damp and mainly contains meadow and alpine vegetation; the western area, adjacent to Kumtag Desert, contains mainly desert and meadow vegetation; the eastern area, adjacent to the Tengger Desert, mainly contains desert, grassland, and cultivated plants (Figure 2b). There is 1334.75 km2 of alpine glaciers in the southern high altitudes of the study area, and it is the source of three inland rivers, such as the Shiyang River, Heihe River, and Shule River. There are also oasis areas with developed irrigation agriculture (the area of farmland is approximately 6853.3 km2) in the midstream of those three inland rivers, which make this area an important grain-base of northwestern China. The natural and social features provide a distinct terrestrial ecosystem for exploring the responses of vegetation activities to the climate variability and anthropogenic change.

2.2. Data Sources and Processing

2.2.1. NDVI Dataset

A monthly maximum-value MODIS (MODerate Resolution Imaging Spectroradiometer) NDVI dataset at 500 m spatial resolution during the period of 2000–2015 was derived from the MODIS NDVI data set provided by the International Scientific & Technical Data Mirror Site, Computer Network Information Center, and Chinese Academy of Sciences (http://www.gscloud.cn). This study used MODIS datasets because several studies demonstrated that the differences and shifts of National Oceanic and Atmospheric Administration the Advanced Very High Resolution Radiometer (NOAA AVHRR) and Système Pour l’Observation de la Terre VEGETATION (SPOT-VGT) sensors caused temporal inconsistency and thus affecting the trend analysis [42,43]. Therefore, there are uncertainties in the analysis of vegetation trends based on these NDVI datasets. NDVImax is often applied in long-term and large-scale climate changes in environmental studies [29]. This study used the Maximum Value Composite (MVC) method to obtain time-series NDVImax data of the growing season (defined as April to October months), which could weaken the effect of residual clouds, atmospheric perturbations, shadows, the solar zenith angle, and aerosol scattering in the ENVI environment [44]. To avoid a spurious NDVI trend induced by winter snow and bare and sparsely vegetated grids, the pixels with growing season NDVImax < 0.1 were marked as non-vegetated area and masked out. Coded Python scripts in the ArcGIS environment were used in the above NDVI extraction processes.

2.2.2. Climate Datasets

The climate data sets from 38 meteorological stations in and around the Hexi Corridor (including 15 in the study area and 23 in surrounding areas) during 2000–2015 were provided by the China meteorological data sharing service system (http://cdc.cma.gov.cn). We hypothesized that the effect of climate factors (TEM, PRE, solar radiation, relative humidity, wind speed, and so on) on vegetation activities is stronger. The Pearson’s correlation analysis was applied to analyze the correlations between NDVI, TEM, PRE, solar radiation, relative humidity, wind speed, and so on. The results showed that the cumulative precipitation and mean temperature in the growing season had a significant effect on vegetation dynamics. A co-kriging interpolation method based on the Geostatistical Analyst module in arcGIS 10.3 was applied to obtain the monthly interpolated PRE and TEM data sets. The elevation and latitude, significantly correlated with PRE and TEM in meteorological elements respectively, were introduced into the climate data interpolation to improve the interpolation accuracy. After cross-validation, the precision of spatial interpolation basically met the analysis requirements (the root mean squared error of interpolated PRE and TEM data sets was 1.05 mm and 0.85 °C, respectively). To maintain consistency with the temporal and spatial resolution of the NDVI data, this study applied an accumulate algorithm and average algorithm for growing season PRE and TEM, respectively. The PRE and TEM datasets for the growing season with 500 m spatial resolution in the Hexi Corridor were obtained to spatial match the growing season NDVI datasets.

2.2.3. Other Geospatial Ancillary Data

The digital elevation model (DEM) data set with a spatial resolution of 30 m was provided by the International Scientific & Technical Data Mirror Site, Computer Network Information Center, and Chinese Academy of Sciences (http://www.gscloud.cn). Land use and land cover change (LUCC) maps (digitized 1:100,000) in 2000, 2010, and 2015, vegetation types (scale: 1:1,000,000), and population datasets were provided by the Data Center for Resources and Environmental Sciences, Chinese Academy of Sciences (RESDC) (http://www.resdc.cn), and LUCC, vegetation type, and population datasets in 2010 were considered as the average state in 2000–2015 (Figure 2). The originally LUCC datasets were made by visual interpretation based on a Landsat-8 remote sensing image and were divided into six major types (including farmland, forested land, grassland, water area, unused land, and urban and rural settlement) and 25 sub-classes. To describe the land use change of the Hexi Corridor better and emphasis on land use types derived by urbanization, this study added several sub-classes such as urban settlement, rural settlement, and other construction land. The LUCC was reclassified into eight types on the raster maps accordingly based on the physical-geographical conditions and land use status of the study area: (1) farmland, (2) forested land, (3) grassland, (4) water area, (5) urban settlement, (6) rural settlement, (7) other construction land, and (8) unused land (mainly includes Gobi, bare rocky land and sandy land) (Figure 3).

3. Methods

3.1. Time-Series Analysis Method

The least squares linear regression model was used in this study to obtain the spatial change trend of the growing season NDVImax during 2000–2015 (Formula (1)). A positive slope value indicates an increasing trend of NDVI. A negative slope value indicates a decreasing trend of NDVI, and a slope of zero shows that NDVI is steady and has no change trend. Simultaneously, the significance of the NDVImax trend was examined by an F test at a confidence level of 95%, which was divided into an insignificant trend (p > 0.05), a significant trend (p ≤ 0.05), and a highly significant trend (p ≤ 0.001) accordingly. For evaluating the state of vegetation better, the slope was divided into five levels: a significantly negative trend (slope < 0, p ≤ 0.05), a slightly negative trend (slope < 0, p > 0.05), slightly positive trend (slope > 0, p > 0.05), a significant positive trend (slope > 0, 0.001 < p ≤ 0.05), and a highly positive trend (slope > 0, p ≤ 0.001). To detect the long-term change in vegetation trends, the change rate (Si) was used to describe the relative change in NDVI pixel-by-pixel, as calculated by Formula (2).
Slope = n × Σ i = 1 n ( i × N D V I i ) Σ i = 1 n i × Σ i = 1 n NDVI i n × Σ i = 1 n i 2 ( Σ i = 1 n i ) 2
S i = slope i ( 1 / n ) × Σ i = 1 n NDVI i
where Slope is the trend in vegetation changes, n is equal to 16, i is the order of the year from 1 to 16 in the study period, and NDVIi is the mean growing season NDVI in the ith year.

3.2. Relationship Analysis of Climate Factors and NDVI

A partial correlation analysis is an effective method to study the sensitivity of vegetation greenness to TEM and PRE [4]. It can exclude the influence of a third factor and only estimate the correlation between the two variables when the two variables are associated with the third variable at the same time [45]. The significance level of the correlations of NDVI with PRE and TEM was examined by a t-test. Based on the results of the significance test and the partial correlation analysis, the correlations were classified according to values of r and p: significantly positive correlation (r ≥ 0 and p ≤ 0.05), insignificantly correlation (r > 0 or r < 0 and p > 0.05), and significantly negative correlation (r < 0 and p ≤ 0.05).

3.3. Multiple Regression Analysis of Anthropogenic Factors and NDVI

To quantify the impact of anthropogenic factors on the NDVI trend, the multiple linear regression analysis of climate factors and NDVI was first used to evaluate the total effects of PRE and TEM on NDVI activities. Because it is usually interpreted as the percentage of the total variation of the dependent variable (herein, NDVI), adj-R2 could be explained by all independent variables (herein, PRE and TEM) adjusted to the number of variables used [45]. Thus, adj-R2climate was used to show the effect of total climate factors on NDVI trends in this study. The remaining fraction (i.e., subtract adj-R2climate from one) was preliminarily applied to explore the impacts of anthropogenic factors on NDVI trends [4]. The smaller adj-R2 means that more NDVI trends can be interpreted with anthropogenic factors and vice versa. An F-test at the confidence level of 95% was introduced to examine the significance of the adj-R2.

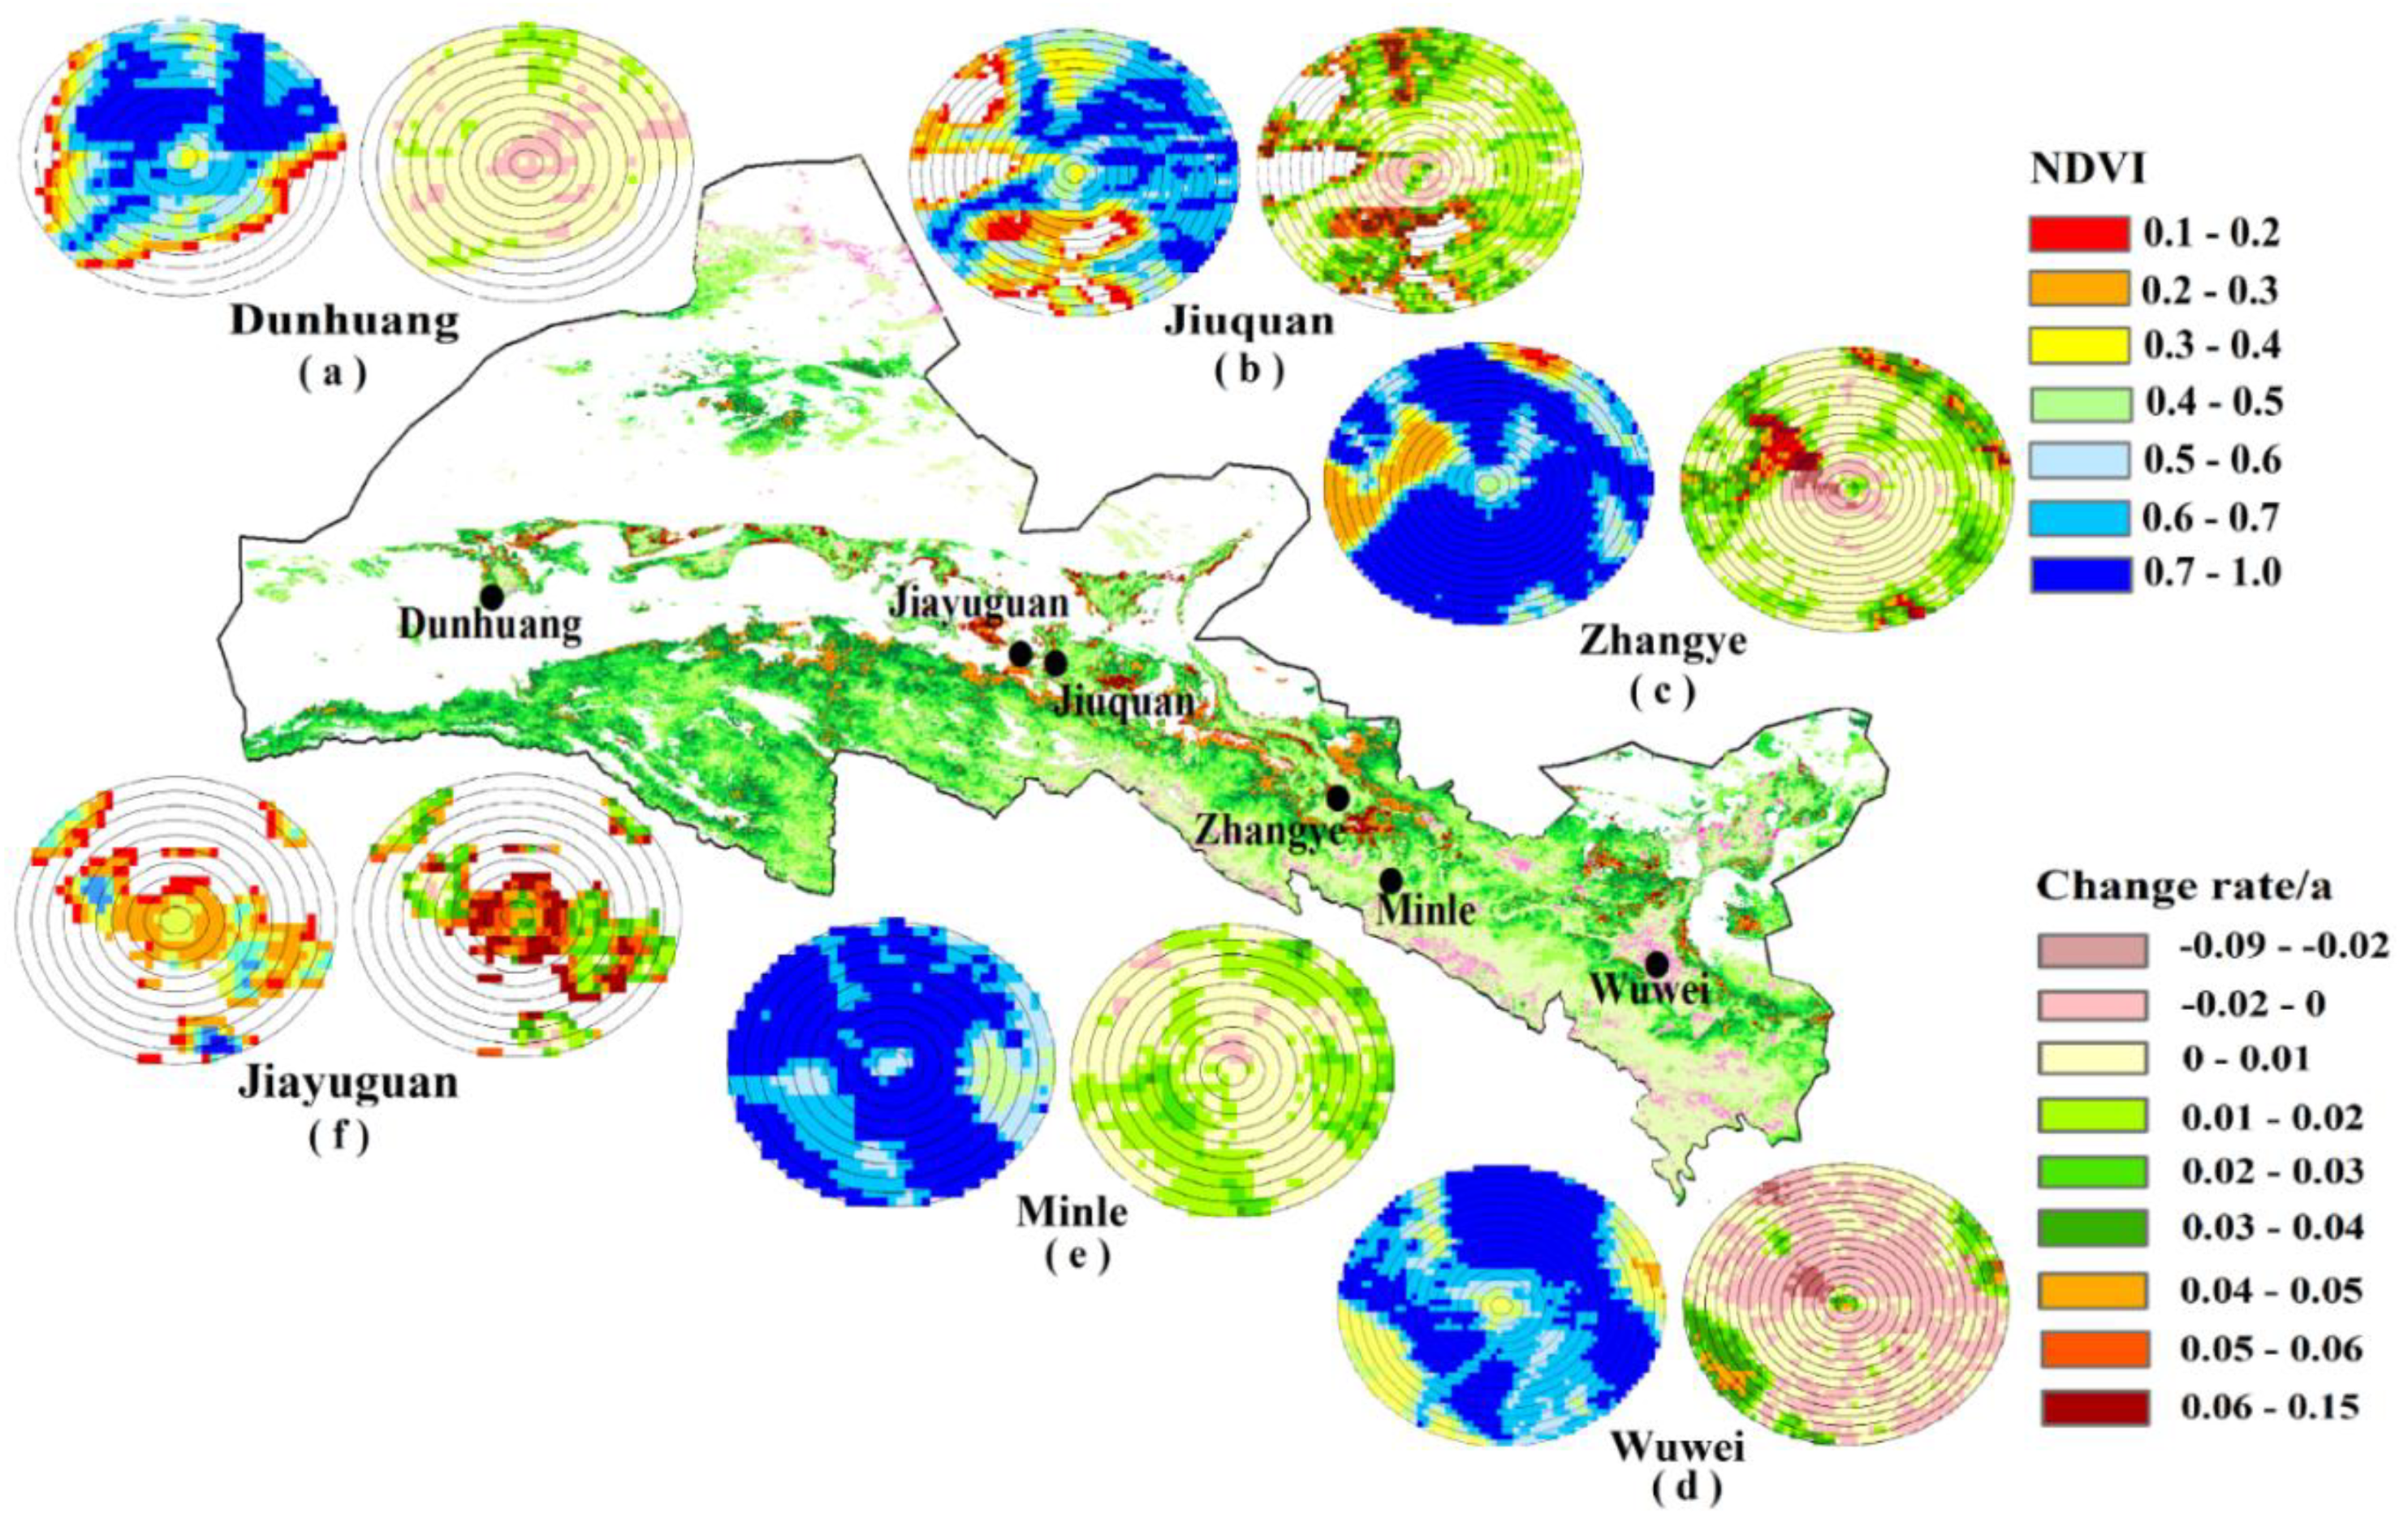
3.4. Buffer Analysis Method

Anthropogenic activities have the characteristics of uncertainty and complexity. Therefore, screening some reasonable indices and then forming a system is the premise and is pivotal for the study of influence of anthropogenic factors on vegetation. The selection method of the buffer zone is the same as the one applied in Zhang et al. [31] and Esau et al. [29]. To make the selection of the buffer zone more reasonable, based on population, two new indices of urban inhabitants and rural population and population density were introduced into the article. The specific selected principles were: (1) buffer zone was distinguished by city (county), where each city (county) buffer zone was broken into 15 (10) rings of 1-km width centered at the city (county) center zone; (2) the areas of urban settlement, rural settlement, other construction land ≥ 20 km2; (3) population quantity ≥ 6000 inhabitations; and (4) population density ≥ 200 people per km2. According to the above principles, Jiuquan, Zhangye, and Wuwei were extracted as city buffer zones, and the county buffer zones were Dunhuang, Minle, and Jiayuguan (Figure 3). Jiayuguan, as a prefecture-level city in terms of its administrative divisions, has relatively advanced industrial and economic development. While considering the small population and the population is mainly concentrated within a distance of 4 km range from the city center, it was classified as a county-level buffer zone. This study intuitively hypothesized that the city core (the ring i = 1) with the strongest disturbance to vegetation cover and hypothesized that the rings i = 2…15 (10) where the area of disturbances progressively decreased with the distance from the city (county) center.
A piecewise regression model [46] was used to detect the potential turning points of the distance and magnitude of the NDVI trend and the change rate in buffer cities and counties. Considering its ability to detect a turning point in noisy time-series data, it has been generally used in the relationship between NDVI changes and climate [47,48].
y = β 0 + β 1 t + ε
y = { β 0 + β 1 t + ε ( t α ) β 0 + β 1 t + β 2 ( t α ) + ε ( t > α )
where y is growing season NDVI, t is the buffer distance, α is the turning point (TP) of the NDVI time-series, β 0 , β 1 , and β 2 are regression coefficients ( β 0 : intercept; β 1 : magnitude of the NDVI trend before the TP; and β 1 + β 2 : magnitude of NDVI trend after the TP), and ε is the residual random error. The NDVI and its change rate were extracted in different buffer distances to discuss the change trends of vegetation with increased distance from the city (county) center.

3.5. Transition Matrix for Land Cover Change Detection

A transition matrix, as the most classical method of detecting the land use change, has been widely used to study the dynamics of LUCC. The basic method and calculation of the transition matrix used were consistent with those published by Li et al. [49]. This study overlaid the land cover maps of 2000 and 2015 in ArcGIS 10.3 to produce a matrix that provided the categorical transition of land use areas. The units of transition areas in land use are calculated by the number of pixels measuring 1 km × 1 km. The extended transitional matrix (Table 1), wherein the rows (columns) mean the results of the LUCC categories of 2000 (2015); the on-diagonal entries (in bold) display a persistence of categories. The Loss column and the Gain row indicate the gross loss and gross gain by category in each land type during 2000–2015, respectively. Meanwhile, this study used an approach proposed by Braimoh [50], the loss-to-persistence ratio ( l p = loss persistence ) and gain-to-persistence ratio ( g p = gain persistence ) were also applied to evaluate the trend of each LUCC category to lose to and to gain from other categories. The net change-to-persistence ratios (np, np = gplp) was applied to assess the net transition trend of each LUCC category.

4. Results

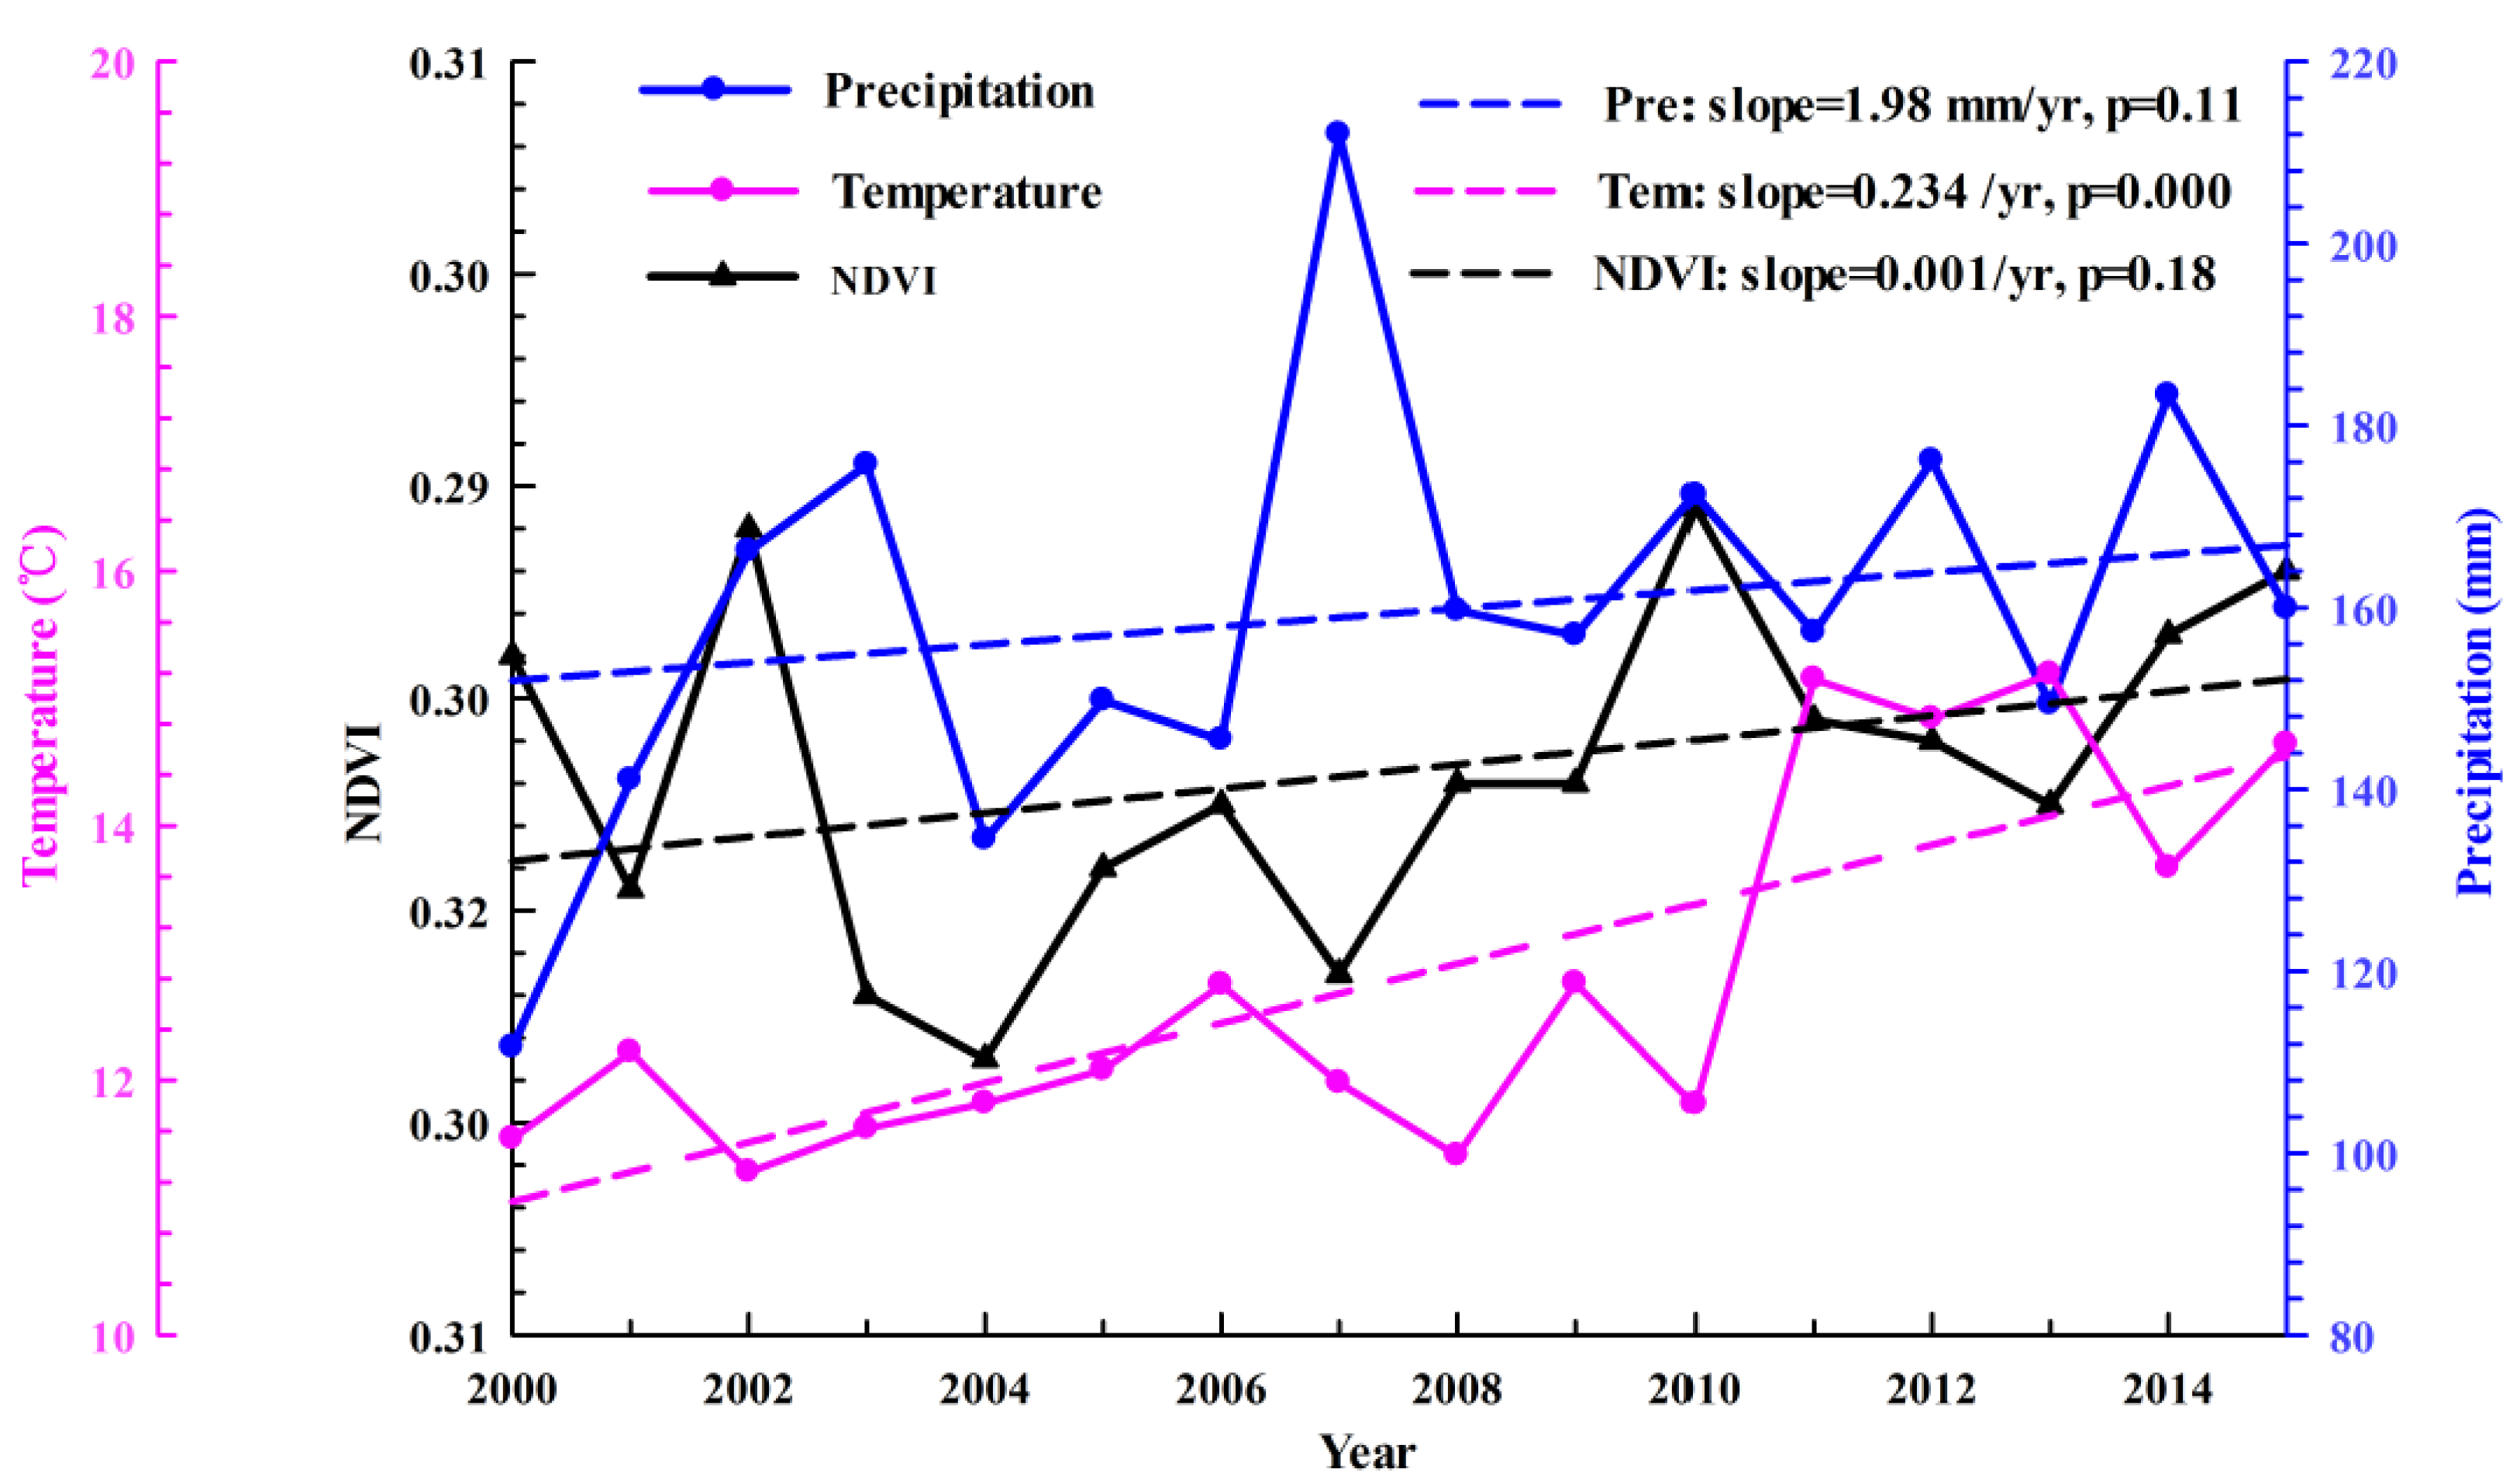
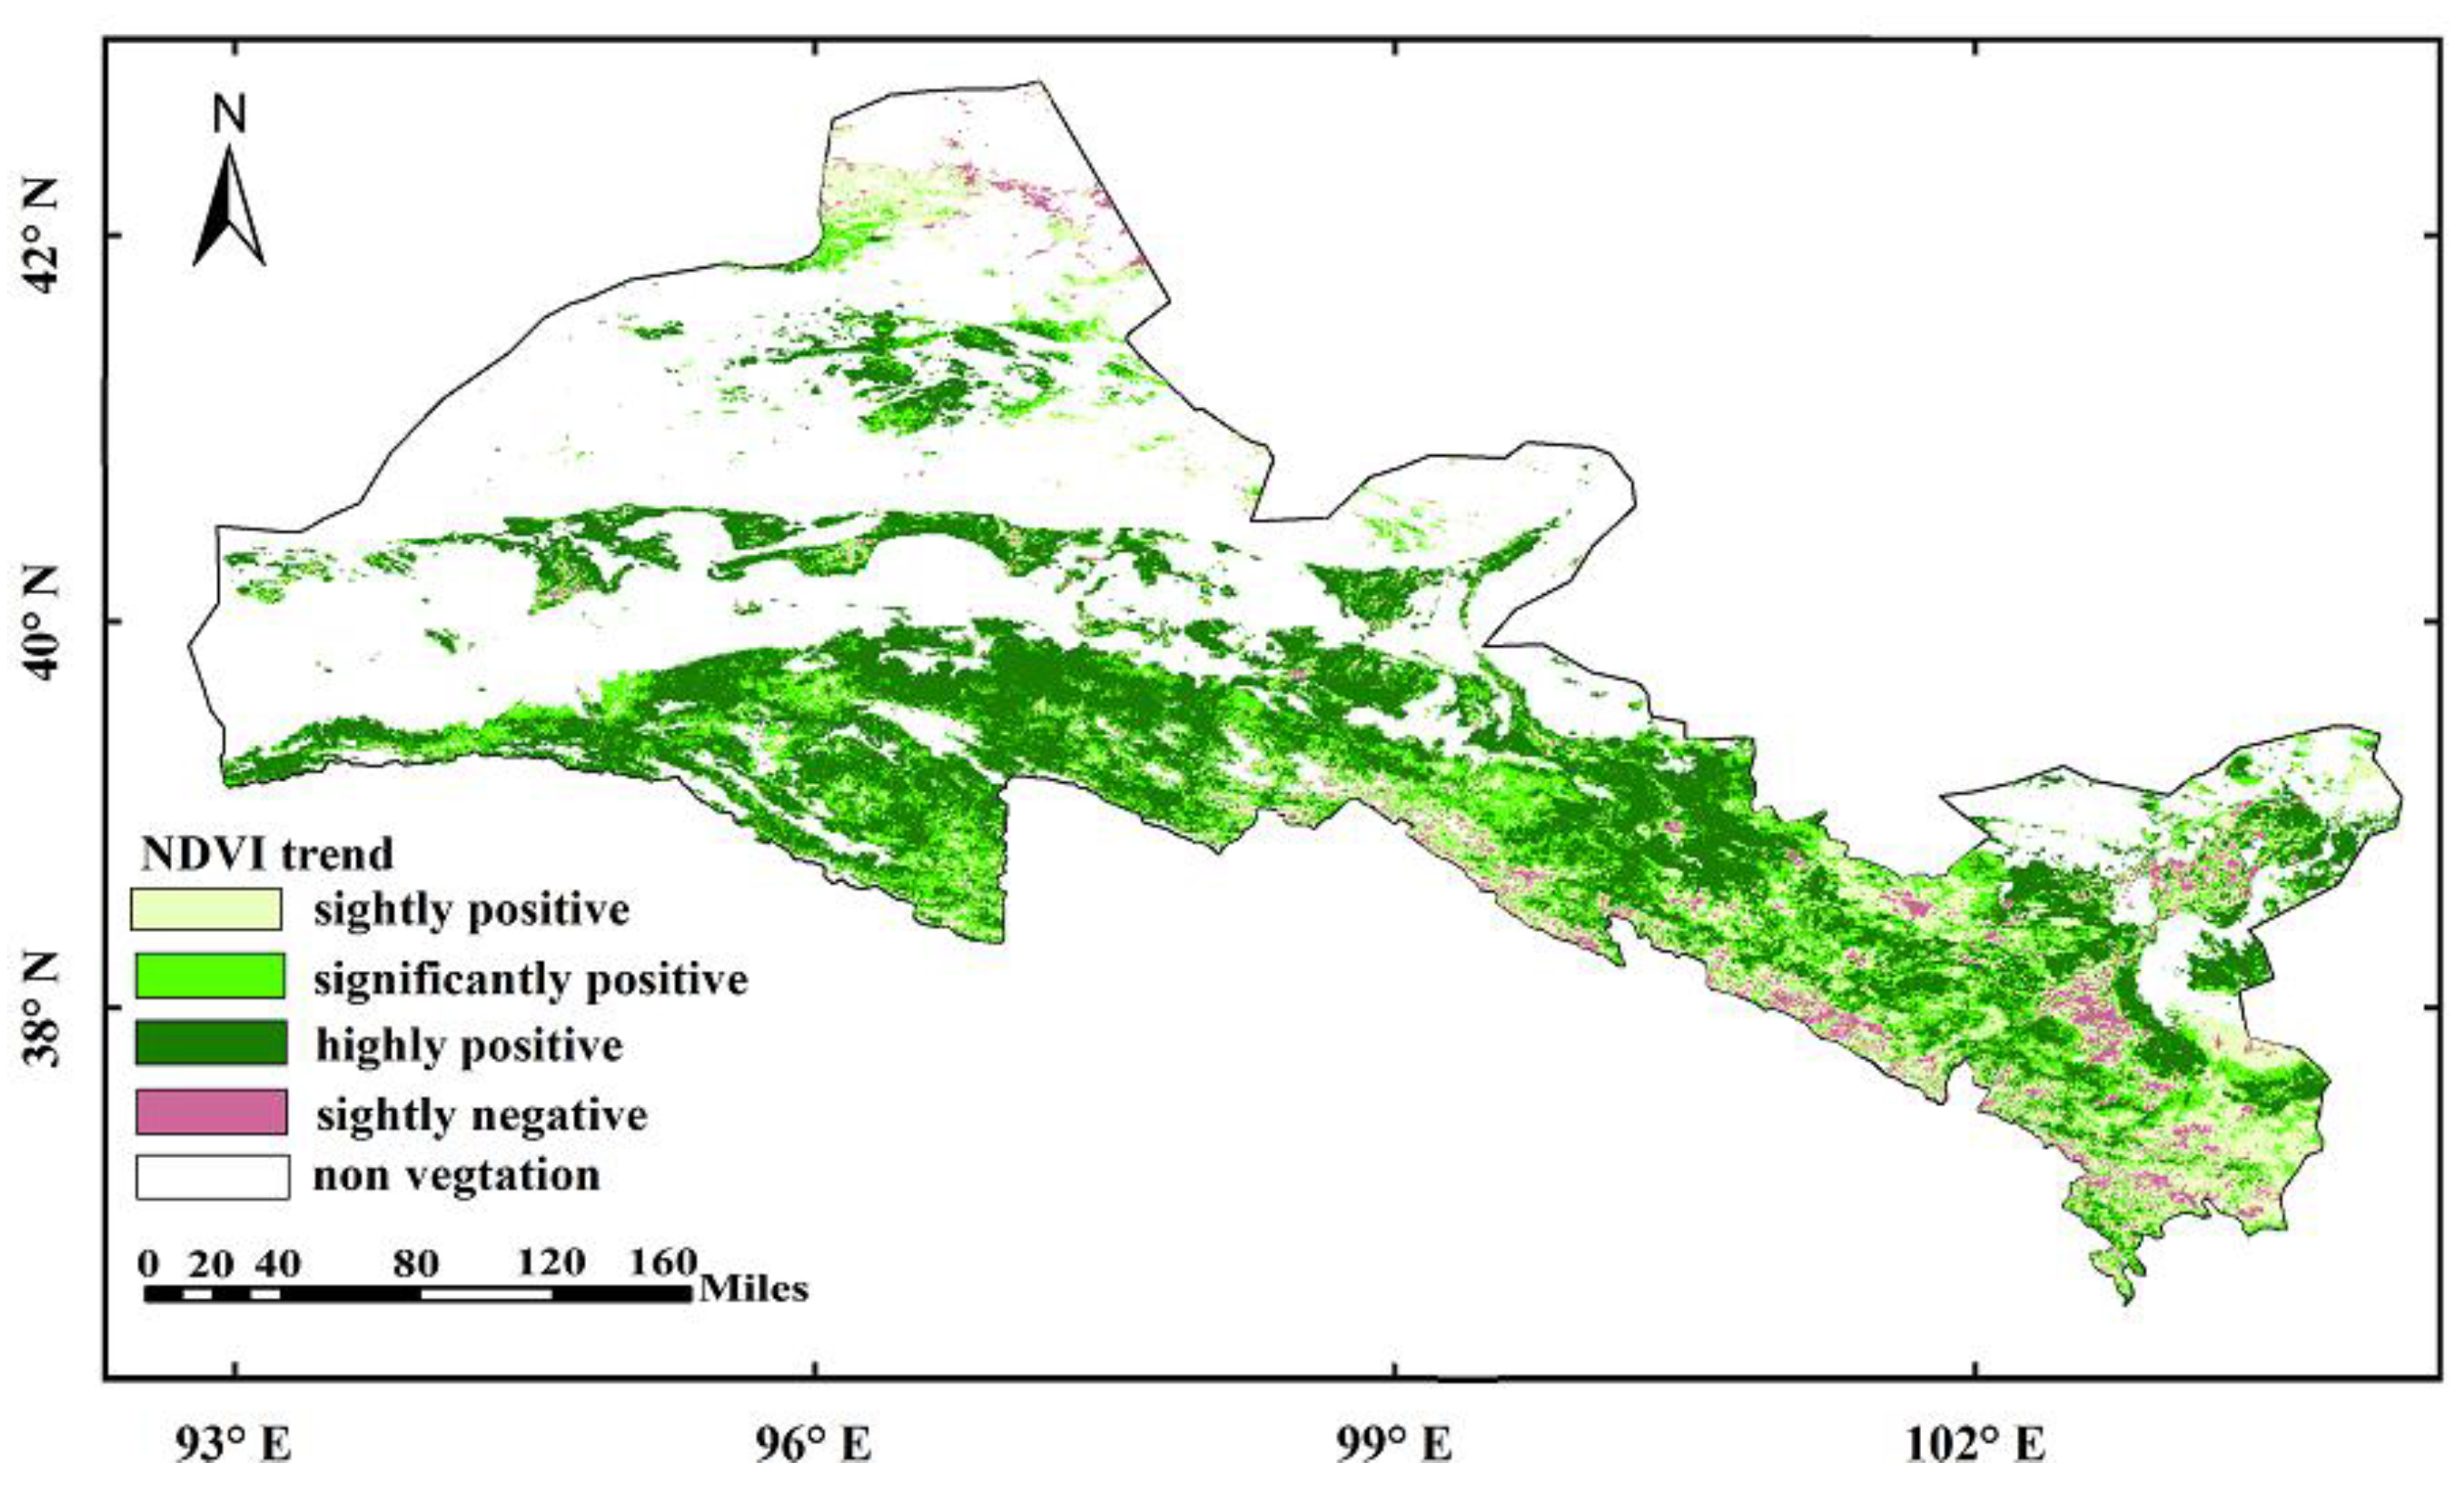
4.1. Spatial and Temporal Variations in the Growing Season NDVImax Trend

The interannual variation of the NDVI in the Hexi Corridor showed an overall increased trend and obvious fluctuation during 2000–2015 (slope = 0.001/yr, Figure 4). Meanwhile, the interannual variation of PRE and TEM also showed increased trends (1.98 mm/yr and 0.23 °C/yr, respectively) from 2000 to 2015. The result demonstrated that more arid area’s vegetation experienced a temporal shift in greening as temperature significantly increased (Figure 4). The spatial distributions of the NDVI trend changes and change rates in the growing season were analyzed for each pixel during 2000–2015 (Figure 5 and Figure 6). The overall trend of the growing season NDVI was upward in the Hexi Corridor and accounted for 95.43% (only the area of NDVI > 0.1 were considered, the same below). Among them, the areas of highly (p < 0.001) and significantly (p < 0.05) greening occupied 49.30% and 24.56%, respectively (Figure 5). The trend primarily occurred in the oasis in the central and eastern of study area and the WSQM, and the main land types were farmland, urban settlement, unused land, and grassland (Figure 1 and Figure 3). The areas of slight greening (slope > 0, p > 0.05) and slight browning (slope < 0, p > 0.05) in the growing season NDVI were found in the ESQM (forested land and bare rocky land), Mazong Mountain and the oasis districts of Wuwei and Minqin were occupied 21.57% and 4.56%, respectively (Figure 1, Figure 3 and Figure 5). The fluctuation states of slight change areas could be summarized as two cases. One was the areas with sparse vegetation (desert and Gobi near Mazong Mountain), grassland, and higher vegetation cover areas (mainly ESQM). The vegetation cover did not change clearly (the change rate fluctuated at −0.02–0.01/year, Figure 2b and Figure 6). The other was urban settlement, rural settlement, other construction land, and farmland within the oasis of Wuwei, Minqin, and other oases in the central and eastern of study area that were directly affected by anthropogenic activities. The vegetation cover in these areas fluctuated drastically around the cities and counties (the change rate was fluctuated at 0.04–0.146/a, Figure 3 and Figure 6).

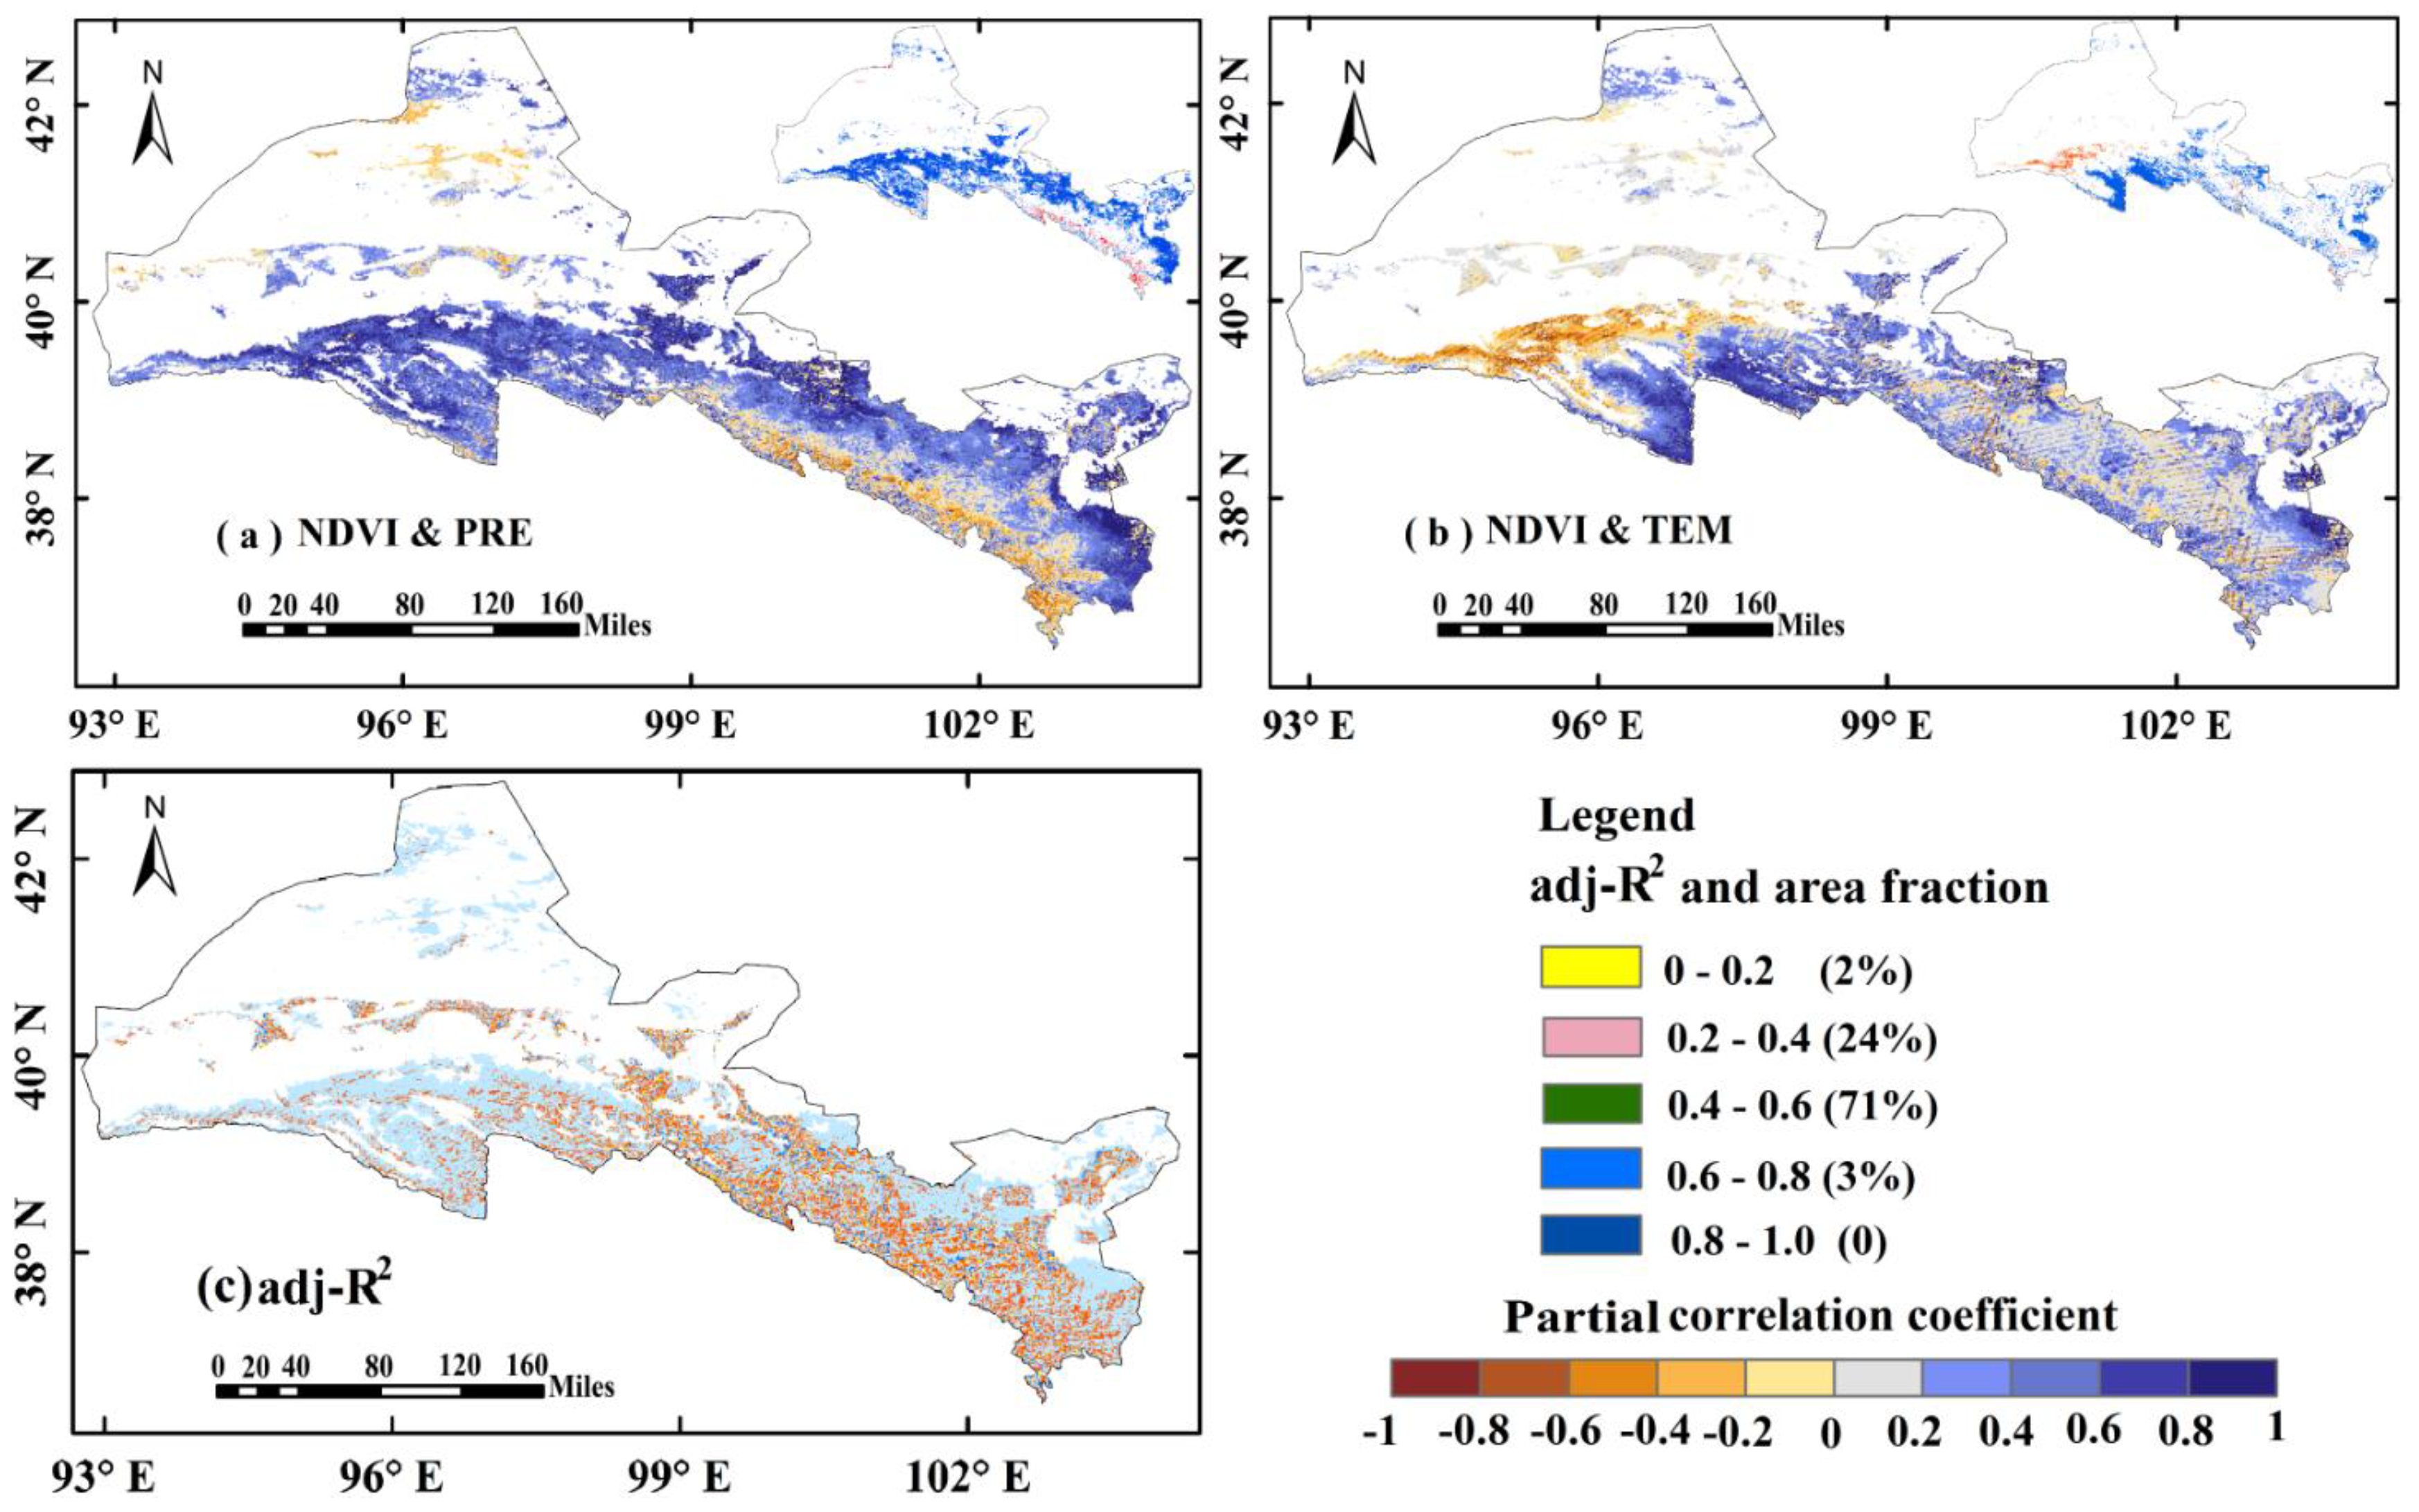
4.2. Relationships between NDVImax and Climate Factors

To trace the sensitivity of vegetation to climate variability, a partial correlation coefficient between the main climate factors (PRE and TEM) and NDVI was determined. PRE and TEM had significantly positive effects on the interannual variation of NDVI in the Hexi Corridor, and the distribution was spatially heterogeneous (Figure 7a,b). PRE (held 51% of the total study area), as the most important climate factor, significantly and positively (0.6–1.0) impacted NDVI changes in 2000–2015, followed by TEM (held 23% of the total study area) (Figure 7a,b). A significantly positive correlation (occupied 47% of the total study area) between NDVI and PRE was observed in the oasis areas (farmland was the main land use type) and WSQM (mainly grassland, Gobi, and bare rocky land). Four percent of significantly negative correlation between NDVI and TEM was found in forested land of ESQM (Figure 3 and Figure 7a). Twenty percent of the pixels showed significant positive correlations between TEM and NDVI in the high coverage grassland and alpine desert of the WSQM, forested land, and alpine desert of ESQM and oasis in the eastern part of the study areas. In contrast, only the minimum area fraction (3%) showed a significant negative correlation in the low coverage grassland of Akesai and Subei of WSQM and few farmlands in oases (Figure 3 and Figure 7b). Overall, the insignificant effects of PRE and TEM on NDVI were mainly observed in the northwestern, central, and eastern regions of the study areas (mainly grassland and farmland). Nevertheless, the areas of NDVI that were both significantly and positively influenced by PRE and TEM were detected at the WSQM and the central and eastern oasis of the Hexi Corridor. The impact of PRE and TEM on NDVI trends of forested land in the ESQM and the low coverage grassland that adjoined the Akesai and Subei areas in the WSQM were opposite of each other (Figure 3 and Figure 7a,b).

4.3. Analysis of Anthropogenic Factors Impact on NDVI Trends

The relative contribution of anthropogenic activity on NDVI trends was quantified by using multiple linear regression (MLR). The spatial distribution of adj-R2 showed a remarkable spatial heterogeneity, indicating the interactive effect of the impact of climate variability and anthropogenic activities on vegetation activities. Only 3.5% of the adj-R2 did not pass the test at a significance level of 0.05 (Figure 7c). The adj-R2 distributed over the range of 0.4–0.8 (accounted for 74% of the total study area), indicating that NDVI changes were mainly induced by climate factors (Figure 7c). Those areas were far away from town areas, located in the northern (mainly Gobi and sandy land) and eastern parts (mainly bare rocky land) of the Hexi Corridor, WSQM, and Mazong Mountain (Figure 1 and Figure 3). The adj-R2 driven by anthropogenic factors mainly distributed over the range of 0.6–0.8 and 0.8–1.0 (occupied 26% of the total area). It was mainly observed in central and eastern of study area and ESQM. Among them, the adj-R2 of the oasis and forested land and grassland of the ESQM were more significant, demonstrating that the NDVI of those areas was disturbed by stronger anthropogenic influence (Figure 2b, Figure 3 and Figure 7c).
Urbanization and industrialization would generate relatively large-scale anthropogenic disturbances to the vegetation greening trends. Therefore, this study analyzed the spatial distributions of the growing season NDVI and its change rate in the anthropogenic active zone of selected cities and counties during 2000–2015 (Figure 7a–f). This study found that NDVImax at 15 km (10 km) around the city’s (county’s) center still showed spatial heterogeneity (Figure 7a–f). Among them, the NDVI value in Jiayuguan was relative low (mainly in 0.2–0.3), and the fluctuation of the vegetation in the closest 3 km range was the largest due to anthropogenic disturbance (0.05–0.1/yr, occupied 36%; Figure 3f and Figure 7f). The NDVI high-value (0.6–0.9) areas in other cities (counties) are dominated by farmland, urban settlement, rural settlement, and other construction land, which were mainly affected by anthropogenic activities (Figure 3a–e and Figure 7a–f). There was a small fluctuation in the high vegetation cover areas of Jiuquan, Zhangye, Wuwei, Dunhuang, and Minle (change rate mainly focused at 0–0.02/year, occupied 55%, 69%, 41%, 88%, and 89% of each buffer zone area, respectively). The slight downtrend of NDVI (change rate was-0.02–0/year, occupied 5%, 5%, 47%, 12%, and 3% of each buffer zone area, respectively), and was only observed in vicinity areas within the city (county) center (the land types mainly urban settlement, rural settlement, and other construction land), especially in Wuwei, which exhibited the largest browning trend within the closest 15 km range from the city center, followed by Jiayuguan (Figure 7a–e). The vegetation in low vegetation cover areas of Jiuquan, Zhangye, and Wuwei fluctuated greatly (change rate from 0.04 to 0.15/yr), whereas the vegetation change in Dunhuang and Minle was insignificant (change rate mainly in range of 0–0.02/yr).
To step towards a better exploration of the influence of anthropogenic activities on vegetation greenness, this study analyzed the relationship between the growing season NDVI and its change rate within the range of anthropogenic activities during 2000–2015 (Figure 8). The NDVI and its change rate in the selected cities (counties) can be divided into two sections: 0–4 (0–3) km and 5–15 (4–10) km (Figure 8). In the range of 0–4 (0–3) km, except for the vegetation of Jiayuguan, which showed a significantly declining trend, other cities (counties) showed significantly increasing trends with increasing buffer distance. Furthermore, we observed that buffer counties (Dunhuang and Minle were rapidly increased by 0.108/km and 0.104/km, respectively) had slightly higher trends than those of buffer cities (Jiuquan, Zhangye, and Wuwei increased by 0.068/km, 0.079/km, and 0.086/km, respectively). For the NDVI change rate, there were entirely different linear trends of buffer cities and counties, and the degree of fluctuation of vegetation cover of the former was weaker than that of the latter with increasing buffer distance. The variation amplitude of NDVI and its change rate within the scope of 0–4 (0–3) km were greater than in the range of 5–15 (4–10) km. In the range of 5–15 (4–10) km, a slight downtrend of NDVI with increasing distance was observed in the selected cities and counties (except Jiayuguan), but the change rate showed a significantly (p < 0.05) increasing trend. The trend of the change of vegetation of the scope of 5–15 (4–10) km was small with increasing distance (increasing rate was mainly between-0.001/km and 0.001/km) relative to the scope of 0–4 (0–3) km. The change trend of the NDVI in Jiayuguan was insignificant in the range of 4–10 km, while fluctuations of the NDVI increased as the distance increased.

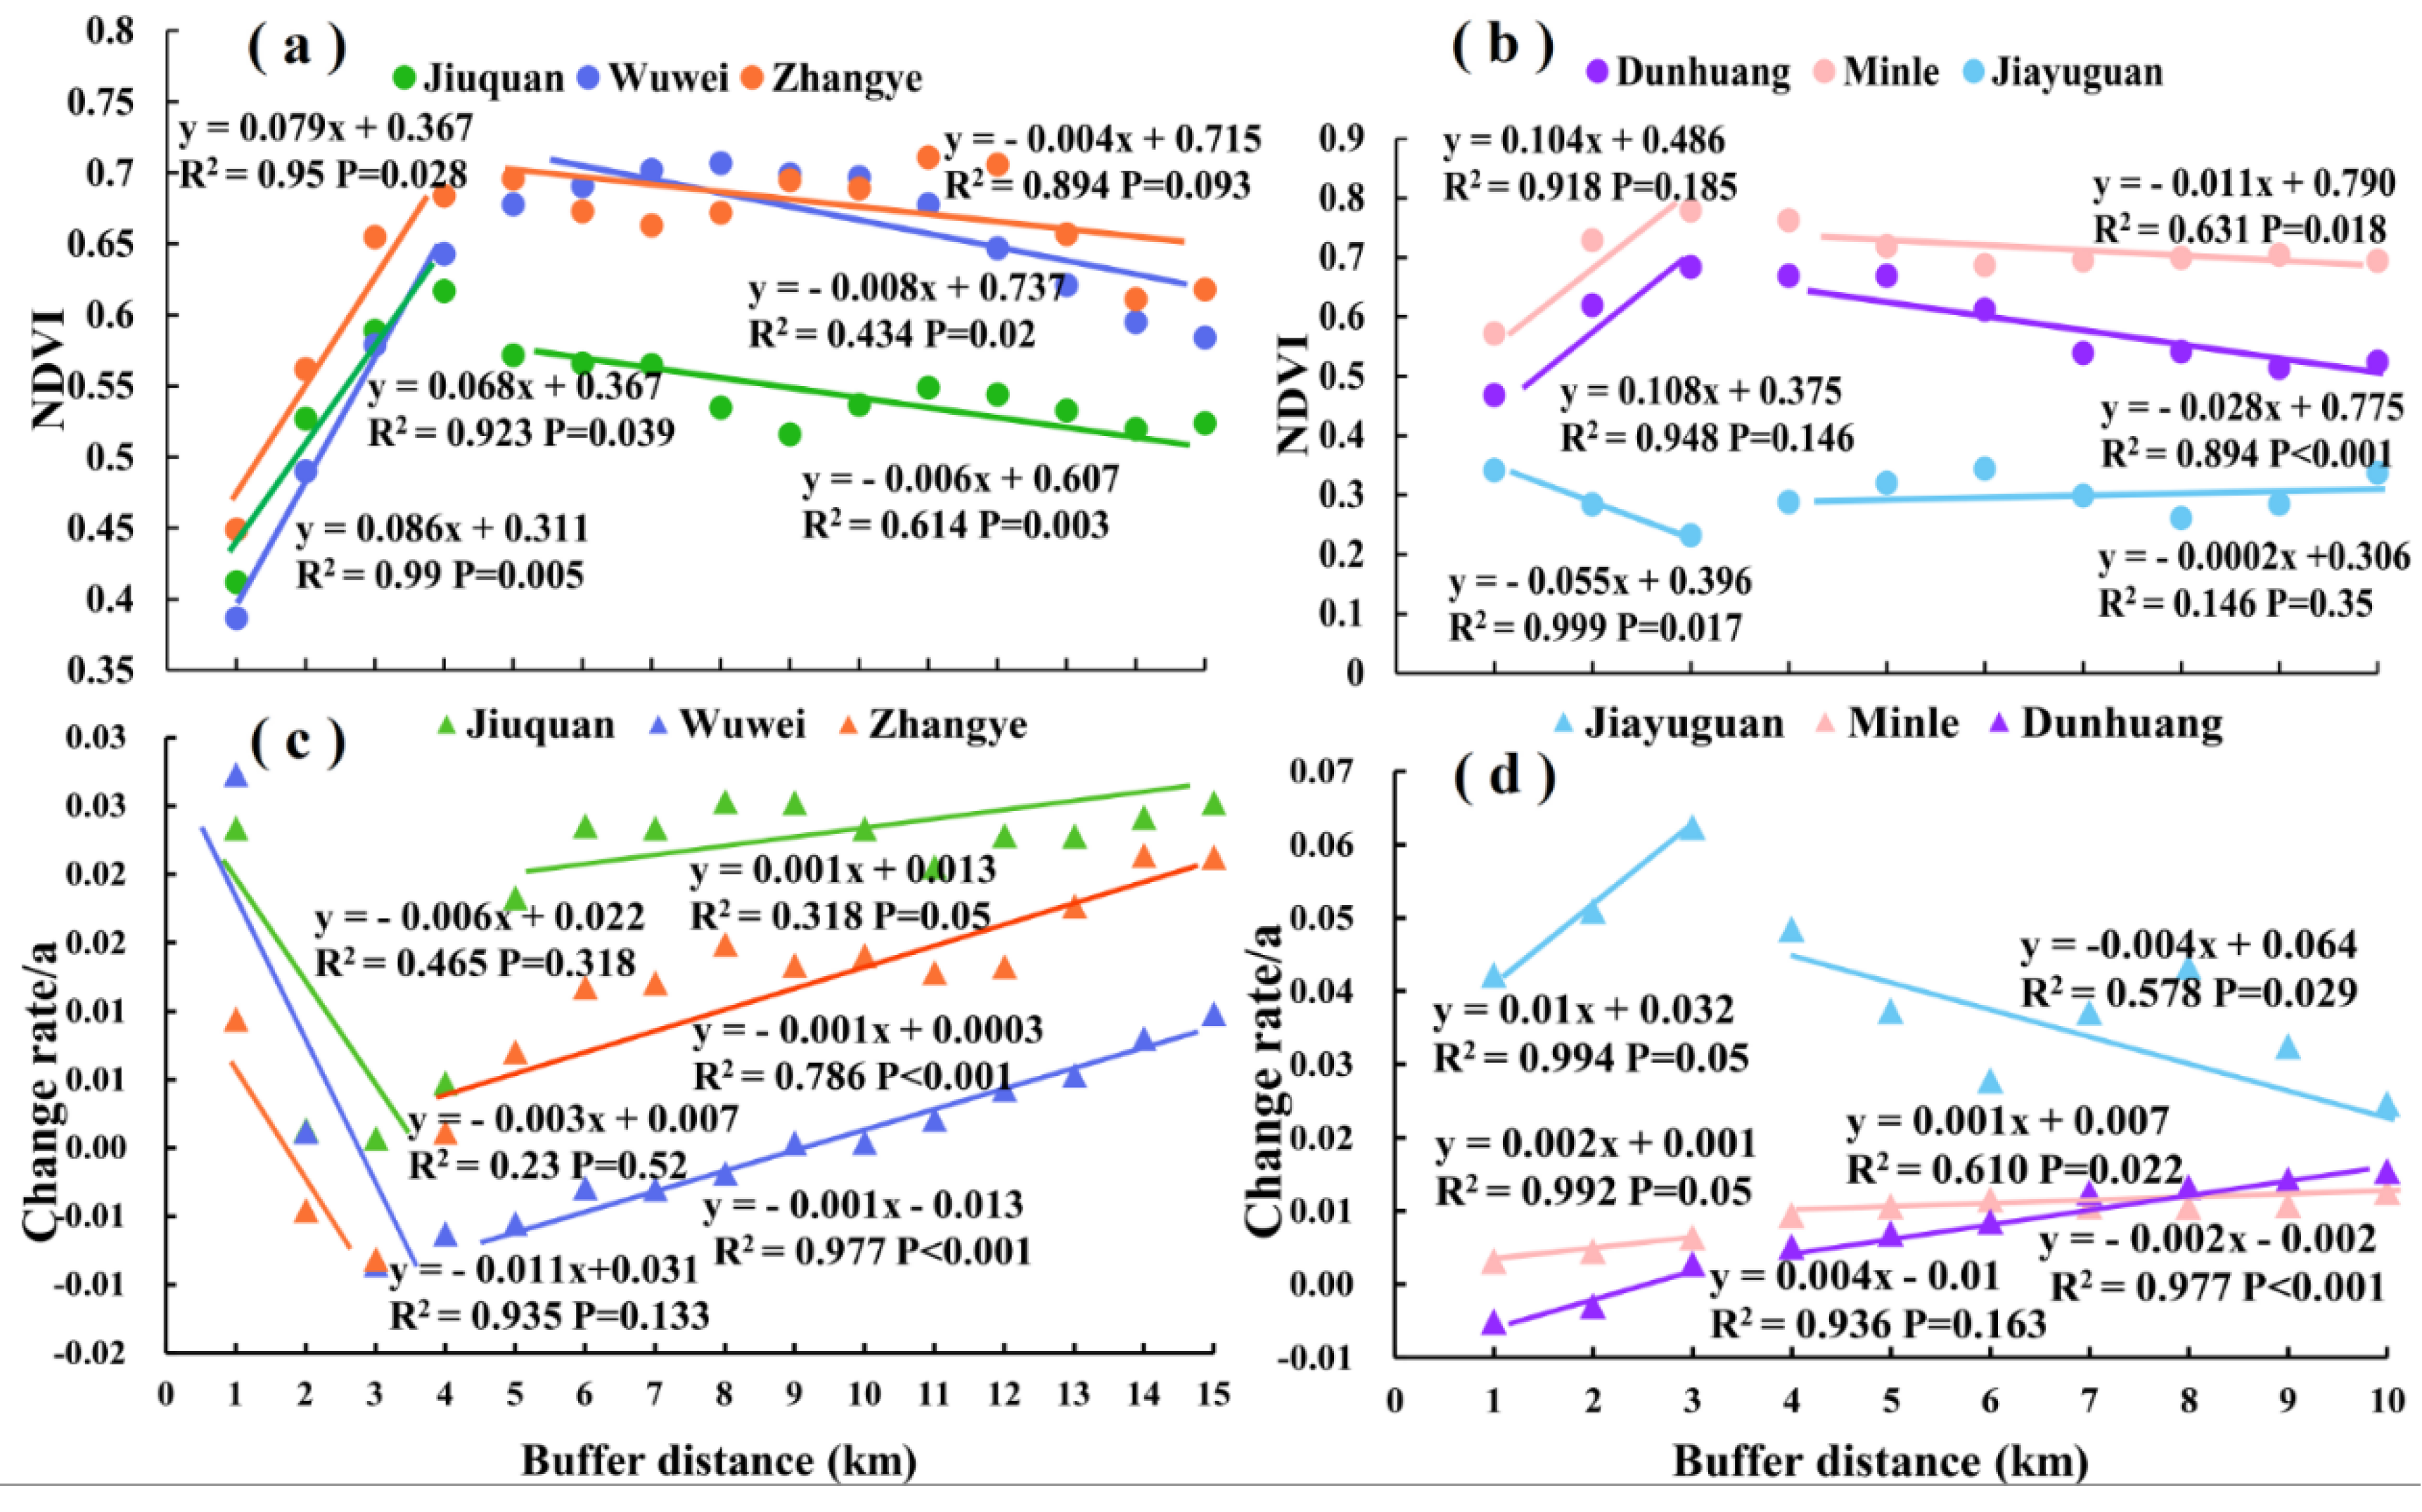
4.4. Combined Analysis of the Influence of Land Cover Change on NDVI Trends

To better understand the relationship of the regional land cover change and NDVI trends in the Hexi Corridor, a combined analysis of NDVI trends and land cover was carried out further. The extended transitional matrix for 2000 and 2015 showed that the largest category was unused land, followed by grassland at both points in time (Table 1). Land use change mainly occurred in the inner of the oasis area. Unused land and grassland accounted for 65.88% and 22.07% respectively of study area in 2000 and 65.92% and 22.28% in 2015 (Table 1). The land cover of the Hexi Corridor experienced moderate conversion of 1.21% during 2000–2015. In other words, landscapes were dominated by persistent forms of vegetation (98.79%). From 2000 to 2015, forested land showed no conversion, while unused land and grassland decreased by 1.17% and 0.27%, respectively. In contrast, other construction land, urban settlement and farmland expanded sharply by 171.43%, 60%, and 10.41%, respectively, followed by rural settlement and water area (5.71% and 3.85%, respectively) (Table 1). The scale of agriculture in arid regions is developing rapidly.
This study used an approach proposed by Braimoh [50], which was applied to evaluate the trend of each LUCC category to lose to and to gain from other categories and assess the net transition trend of each LUCC category. In Table 2, the loss-to-persistence ratio (lp) for all land types was less than 1, which means that all the land types had a higher trend to persist than transition to other land types. The gain-to-persistence ratio (gp) for all the land types was less than 1 (except other construction land), indicating that the land types had a higher tendency to persist than to gain from other land types. The urban settlement, rural settlement, and other construction land only experienced an expanding trend, and the lp were all zero. The gp of 1.71 for other construction land indicates that the expanded area was much more (approximately 171%) than that of persistence. The gp of farmland was almost 12 times than its lp, whereas the lp of forested land and grassland was about equal to its gp. The np of unused land was negative, indicating a decreased trend of unused land (Table 2).

5. Discussion

5.1. NDVI and Climate Variability at the Pixel Scale

A significant greening trend was observed over the arid areas of northwest China, which includes the Hexi Corridor since 2000 (Figure 5) and PRE and TEM have also exhibited significant increasing trends over the same period [13,39,40,51]. PRE (47%) and TEM (20%) are important driving factors of the significant greening trend in the Hexi Corridor during 2000–2015 (Figure 5 and Figure 7a,b). PRE played a crucial role in vegetation growth in arid and semi-arid areas by regulating soil moisture, which affected the root’s vigor and the water status of vegetation [47,52]. The rising TEM could slow the degradation velocity of leaf chlorophyll, thereby prolonging the vegetation growth season and enhancing photosynthesis in temperature-limited regions [53]. Based on the partial correlation analysis, the research found that PRE (TEM) and NDVI exhibited a significant positive (negative) correlation over the areas of Akesai and Subei of the WSQM. This is because the alpine grassland is more sensitive to climate variability than artificial vegetation in arid and semi-arid areas [16]. Due to the lack of water resources (average annual precipitation is 83–116 mm), PRE became the main limiting factor for the growth of alpine grassland ecosystems in this region. The significant greening trend is directly attributed to increasing PRE with global warming, while rising TEM can reduce leaf conductance and enhance vegetation dark respiration and expedite evapotranspiration, thereby inhibiting grassland vegetation growth [54,55]. In fact, the growth of vegetation interacted with multiple factors. The NDVI in the low coverage grassland of the Akesai and Subei district showed a significant greening trend (Figure 3 and Figure 5), revealing that PRE as the dominant factor had stronger positive effects than TEM on vegetation growth. Li et al. [56] also confirmed that accumulated precipitation in the growing season was a dominant factor affecting grass growth. Meanwhile, in addition to direct PRE, the melt of permanent glaciers and snow induced by increasing temperatures in alpine grasslands also replenish additional water for vegetation growth [57]. All of those jointly promote vegetation growth. A significant negative (positive) correlation between the NDVI and PRE (TEM) was detected in the ESQM (Figure 1, Figure 2b, and Figure 7a,b). It is shown that the results are highly consistent with that of the findings of Zeng et al. [36] in alpine sparsely vegetated areas over the eastern Qilian Mountains. Vegetation showed slight browning (mainly forested land), which is mainly attributed to the combined effects of climate and anthropogenic factors (Figure 7c). Forested land with massive root systems can use groundwater that is 0.5–3 m below the surface to ensure its normal growth [58]. Meanwhile, the ESQM has abundant rainfall (annual mean rainfall is 247–350 mm). Furthermore, the response of vegetation to PRE has a threshold, so excessive PRE is not conducive to vegetation growth. The reason why there is a positive correlation between the NDVI and TEM is mainly due to the stronger photosynthesis of forest ecosystems than grassland and the intermittently plowed agricultural ecosystem [59]. In addition, the warming climate enhances photosynthesis in temperature-limited regions, thereby promoting vegetation growth [53]. Several studies also found that the higher summer temperature and a mass of snow cover favor tundra and forest-tundra vegetation growth [60,61,62].
Multiple natural characteristics, including the arid environment, insufficient rainfall, strong evaporation, and impoverished soil co-impact the sparse vegetation condition in the Mazong Mountain area, in the northwest Hexi Corridor. The insignificant positive correlation relationship of NDVI and PRE in the oasis area was mainly a result of anthropogenic irrigation (Figure 7a), which provided most of the water for vegetation growth, causing it be insensitive to natural rainfall [57]. The correlation of the NDVI and TEM was insignificant and possessed great spatial heterogeneity (Figure 7b). This was mainly because the rising TEM was unfavorable for the growth of rain-fed agriculture, but it was beneficial to the growth of irrigated agriculture [63]. The cultivated vegetation in the oasis area showed a significant increasing trend, which might have been due to anthropogenic factors (e.g., fertilization, irrigation) that contributed more to the greenness trend [26]. Therefore, although vegetation in the oasis areas had the combined effects of natural and anthropogenic factors, the latter was the dominant factor (Figure 7c).

5.2. Disturbance of Anthropogenic Factors on Vegetation Greening Trends

In addition to the influence of climate change on the distribution status of vegetation, anthropogenic activities (urbanization and industrialization) could also change the distribution and induced disturbance [29]. The spatial pattern of the greening and browning driven by climatic change and anthropogenic disturbance made it pretty difficult to quantify the contributions of each driving factor [64]. Previous studies used MLR to detect the influence of anthropogenic factors on vegetation [4]. Therefore, the method was applied in the Hexi Corridor and it was observed that the response of the NDVI on long-term anthropogenic activities had a great spatial heterogeneity (Figure 7c). The effect of anthropogenic factors of oasis areas in central and eastern of study area and the ESQM was more obvious (Figure 1, Figure 3 and Figure 7c).
Urbanization and industrialization can impose considerable anthropogenic disturbances on vegetation trends. The vegetation growth within the range of the closest 1 km from the buffer zone center suffered the largest anthropogenic disturbance (the NDVI was mainly distributed between 0.3–0.4 and changed stably, except for Jiayuguan; Figure 6a–f). This was to some extent different from the Arctic area findings where the NDVI is the highest in the closest 5 km where the area of disturbances is the largest [29]. Because town areas have less green space and are mostly ornamental plants, anthropogenic supplements of water and nutrients could prolong the vegetation growing season. It causes the growth of vegetation to be relatively stable [65]. Meanwhile, several studies demonstrated that anthropogenic disturbances can assist in the selection of more productive ecosystems [32]. Jiayuguan is an important industrial city in the Hexi Corridor, with rapid socioeconomic growth, and a considerable portion of the rural population moves to the city and primarily focuses on the range of 0–4 km from the city center (Figure 2a and Figure 3f). Hence, the immigration of the rural population caused great vacancies in rural areas (Figure 3 and Figure 5) [66]. In addition, the transformation of unused land to urban settlement and rural settlement induced by urbanization and industrialization generated strong anthropogenic disturbance on vegetation, and the NDVI fluctuated drastically (0.05–0.1/yr; Table 1; Figure 6f). Similar results were obtained by Easul et al. [29] that cities and industrial installations were built in unused land. The higher vegetation-cover area of farmland in buffer cities (counties) has strong adaptability to climate change, because of the measures such as anthropogenic reasonable fertilization, irrigation, etc. Hence, the vegetation growth is high and stable.
The breaking point of the disturbance range of anthropogenic activities in buffer cities (counties) is 4 km (3 km). The effective disturbance range that anthropogenic activity impacts on vegetation is different. It is primarily controlled by the level of economic development, infrastructure construction, and agricultural production, and the population size and the degree of concentration of its distribution. Anthropogenic disturbance proportionally decreases with the distance to city (county) center within the effective radiation range of anthropogenic activities [67,68,69]. Therefore, the NDVI was improved with the increasing buffer distance (Figure 8a). The change rate of the NDVI in buffer cities decreased with the increasing buffer distance (Figure 8c). It mainly decreased because the intensity and patterns of anthropogenic disturbance were affected by the population size of the adjacent buffer zones [70,71]. Meanwhile, the disturbance of anthropogenic activities proportionally weakened with the increasing distance and the decreasing population density. Therefore, vegetation growth was prone to be stable. The vegetation showed a slight decrease trend in the range of 5–15 km (4–10 km), while the change rate showed a significant increasing trend (except for Jiayuguan). This was chiefly because of the limited irrigation condition and the vegetation transition from irrigation agriculture to rain-fed agriculture. The land types affected by climate factors were mainly dominated by unused land (mainly Gobi rare rocky land and sandy land), grassland, and rain-fed agriculture in this range. The intensity of the anthropogenic activity’s disturbance on vegetation growth was extremely weak in this range, and vegetation was basically in a natural growth state. However, Jiayuguan’s population is distributed within the circle at a range of 4 km, and there is mainly Gobi, bare land, and rarely distributed vegetation in the range of 5–10 km (only occupied 22% of the buffer area). Therefore, the strong adaptation and tolerance to the growth environment weakened the vegetation fluctuation.
The objective reason that results in vegetation browning in the ESQM is climate warming. This result is highly consistent with that of Zeng et al. [36] found alpine sparsely vegetated areas in the eastern Qilian Mountains shrank with climate warming. However, anthropogenic disturbance may have a deeper effect on it. As the population grows, anthropogenic activities are enhanced and more frequent. A host of new mining and hydropower facilities was created in protected areas, coupled with the failure of the local government to exercise supervision effectively on the Qilian Mountain National Nature Reserve ecological environment monitoring. Over-exploitation and utilization of natural resources, dam building reservoir to artificially change the flow direction of inland rivers, and hydropower stations ignore Chinese environmental laws and regulations and require no discharge of eco-water, which leads to the deterioration of the local ecological environment [38]. In July 2017, the Chinese central government announced the establishment of an integrated ecological monitoring system through integrated policy implementation to tackle both the symptoms and root causes. In addition, the policy will carry out research on the demarcation of ecologic red lines, accelerate the improvement of ecological compensation mechanisms, and strengthen the application of ecologic restoration technologies. The aim above is to comprehensively promote the ecological restoration and protection of the Qilian Mountains District.

5.3. Response of the Growing Season NDVI to Land Use Change

LUCC is the most direct interaction between anthropogenic activities and the natural environment, and it is closely connected with the active degree of anthropogenic socio-economic activities [72]. Humans could directly interact with ecosystems surrounding them, having a profound influence on ecosystem changes [73]. Other construction land and farmland of the Hexi Corridor sharply expanded, and unused land and grassland remained on a decreasing trend (especially the former), while forested land and water area turned from decreasing to increasing trends during 1988–2015 (Table 1) [74]. Other construction land, urban settlement, rural settlement, and farmland expanded rapidly during 2000–2015 (Table 1). Among them, the expansion rate of other construction land and farmland during 2000–2015 reached 17-fold and 10-fold greater, respectively, than that in 1988–2000 (expanded 10.53% and 1.61%, respectively; Table 1) [74]. The influence of urbanization and reclamation of farmland is considerable. Other construction land only constitutes 0.19% of the total area in 2015, but it almost tripled the area of other construction land in 2000 and contributes a substantial ecological footprint [75]. Land conversion areas of other construction land, urban settlement, and rural settlement increased at the expense of farmland, unused land, and grassland, indicating the rapid process of urbanization and the coordinated urban-rural development, while shrinking ecosystem services [72]. The farmer prefers to translate grassland and unused land into farmland because grassland and unused land have stronger operations and clear more easily than forested land [50], which is also the more reason the newly reclaimed farmland is mainly converted from unused land and grassland (0.47% and 0.21%, respectively), while forested land only occupied 0.02% (Table 1). The area of forested land and water area decreased 0.56% and 2.37% respectively in 1988–2000, while forested land showed no substantial change in 2000–2015; on the contrary, water area increased by 3.85% (Table 1) [74]. The trends of grassland and unused land during 2000–2015 have improved slightly compared with those in 1988–2000 (decreased by 0.91% and 0.14% during 1988–2000; decreased by 0.27% and 1.17% during 2000–2015, respectively). With the explosive urbanization and economic development, unused land has accumulated losses (mainly Gobi, bare rocky land, and sandy land), which directly resulted in this expansion in built-up area and the reclamation of farmland. The vegetation of each land type within the study area basically shows a significantly increasing trend (Figure 5). This illustrates that under the combination of optimum climatic conditions and a series of implemented ecological restoration projects since 2000, the ecological environment and vegetation growth of the Hexi Corridor have improved [27,76]. The utilization of water resources is the basis for the development of land resources and social economy in arid regions. The scale of agriculture in arid areas is developing rapidly, and land use change mainly occurs in the inner of oasis area. Large-scale development and utilization of surface water and groundwater are generally used in various basins in arid regions. The artificial oases in inland watersheds are developing rapidly, thereby the area of irrigated cultivated land has mushroomed [13]. The development of oases is also based on the large-scale development and utilization of water resources. Therefore, the sustainable coordination of the economic and ecological environment in arid regions of northwest China is a reasonable way to seek the transformation of natural oases in the arid regions into efficient artificial oases.

6. Conclusions

The vegetation of the Hexi Corridor showed an overall significant uptrend of about 95.43% in 2000–2015. Furthermore, more arid area’s vegetation experienced a temporal shift in greening as temperature significantly increased. Spatially, only a small fraction of browning areas occurred on Mazong Mountain, Wuwei oasis, and the ESQM regions. There was no obvious characteristic change in those sparse vegetation areas (mainly desert and Gobi) and the higher vegetation-cover area of the Qilian Mountains. However, anthropogenic activities have a great effect on vegetation of the inner oasis area.
The significantly positive contribution of PRE and TEM on NDVI greening trend occupied 47% and 20% of the total study area respectively and there was a large spatial-temporal heterogeneity. Due to the massive root system of forest vegetation in the ESQM, it can not only gain the deeper groundwater, but also absorb the abundant natural rainfall. It could be that vegetation growth was suppressed by excessive water. Increasing TEM enhanced the forest vegetation photosynthesis. Hence, the NDVI was significantly negatively (positive) correlated with PRE (TEM) in this region. In contrast, there were significant and positive (negative) correlations between the NDVI and PRE (TEM) in the low coverage grassland of the WSQM. PRE is one of the main limiting factors on the growth of alpine grasslands, which is conducive to the growth of grassland vegetation. The rising TEM could enhance the dark respiration of vegetation and expedite evapotranspiration. The climate factors were the main variables controlling the vegetation of those far away town areas in the north, central, eastern, and WSQM of the study area.
The vegetation activities of ESQM and oasis regions experienced a significant disturbance from anthropogenic activities. Over-exploitation of natural resources was a fundamental reason for the observed browning of vegetation in the ESQM. Urbanization and industrialization created more considerable anthropogenic disturbances on NDVI trends in development cities than in counties. Urbanization destroyed the vegetation cover within the developed city areas and extended about 4 km beyond the perimeter of urban areas. In the range of 5–15 km (4–10 km) of the buffer zone, the vegetation growth was mainly affected by climate factors.
The land cover of the Hexi Corridor experienced slight conversion during 2000–2015. All the land types had a higher trend to persist than to decrease. Unused land, forested land, and water area improved slightly, which suggested that a restoration ecology project has obtained some positive results. Urban settlement, rural settlement, and other construction land experienced sharp expansion at the expense of farmland, unused land, and grassland, which indicated the rapid process of urbanization and coordinated urban-rural development and shrank ecosystem services. The scale of agriculture in arid areas is developing rapidly. This should determine future patterns of water availability and ecological environment of oases and to promote regional social-economic sustainable development.

Author Contributions

All authors contributed significantly to this manuscript. Specifically, the contributions include data curation, L.Y. and N.P.; formal analysis, J.L.; investigation, L.Y., J.L. and C.X.; methodology, L.Y., N.P., F.W. and Z.L.; project administration, Q.G.; supervision, Q.G.; writing—original draft, L.Y.; writing—review & editing, Q.G.

Funding

This research was funded by [the National Natural Science Foundation of China] grant number [41671188].

Acknowledgments

We would like to express our sincere gratitude to the editors and reviewers, who have put considerable time and effort into their comments on this paper. We are grateful to the professional editing service (Elsevier Language Editing Services) for improving the language in our manuscript.

Conflicts of Interest

The authors declare no conflict of interest.

References

  1. Law, B.E.; Falge, E.; Gu, L.; Baldocchi, D.D.; Bakwin, P.; Berbigier, P.; Davis, K.; Dolman, A.J.; Falk, M.; Fuentes, J.D.; et al. Environmental controls over carbon dioxide and water vapor exchange of terrestrial vegetation. Agric. For. Meteorol. 2002, 113, 97–120. [Google Scholar] [CrossRef] [Green Version]
  2. Potter, C.; Boriah, S.; Steinbach, M.; Kumar, V.; Klooster, S. Terrestrial vegetation dynamics and global climate controls. Clim. Dyn. 2008, 31, 67–78. [Google Scholar] [CrossRef]
  3. Bégué, A.; Vintrou, E.; Ruelland, D.; Claden, M.; Dessay, N. Can a 25-year trend in Soudano-Sahelian vegetation dynamics be interpreted in terms of land use change? A remote sensing approach. Glob. Environ. Chang. 2011, 21, 413–420. [Google Scholar] [CrossRef]
  4. Wen, Z.F.; Wu, S.J.; Chen, J.L.; Lü, M.Q. NDVI indicated long-term interannual changes in vegetation activities and their responses to climatic and anthropogenic factors in the Three Gorges Reservoir Region, China. Sci. Total Environ. 2017, 574, 947–959. [Google Scholar] [CrossRef] [PubMed]
  5. Donohue, R.J.; Roderick, M.L.; Mcvicar, T.; Farquhar, G.D. Impact of CO2 fertilization on maximum foliage cover across the globe’s warm, arid environments. Geophys. Res. Lett. 2013, 40, 3031–3035. [Google Scholar] [CrossRef]
  6. Zhu, Z.C.; Piao, S.L.; Myneni, R.B.; Huang, M.T.; Zeng, Z.Z.; Canadell, J.G.; Ciais, P.; Sitch, S.; Friedlingstein, P.; Arneth, A.; et al. Greening of the earth and its drivers. Nat. Clim. Chang. 2016, 6, 791–795. [Google Scholar] [CrossRef]
  7. Wang, X.H.; Piao, S.L.; Ciais, P.; Friedlingstein, P.; Myneni, R.B.; Cox, P.; Heimann, M.; Miller, J.; Peng, S.S.; Wang, T.; et al. A two-fold increase of carbon cycle sensitivity to tropical temperature variations. Nature 2014, 506, 212–215. [Google Scholar] [CrossRef] [PubMed]
  8. Piao, S.L.; Yin, G.; Tan, J.; Cheng, L.; Huang, M.; Li, Y.; Liu, R.; Mao, J.; Myneni, R.B.; Peng, S.S.; et al. Detection and attribution of vegetation greening trend in China over the last 30 years. Glob. Chang. Biol. 2015, 21, 1601–1609. [Google Scholar] [CrossRef] [PubMed] [Green Version]
  9. Rojstaczer, S.; Sterling, S.M.; Moore, N.J. Human appropriation of photosynthesis products. Science 2001, 294, 2549–2552. [Google Scholar] [CrossRef] [PubMed]
  10. Luck, G.W. The relationships between net primary productivity, human population density and species conservation. J. Biogeogr. 2007, 34, 201–212. [Google Scholar] [CrossRef]
  11. Zhou, W.; Gang, C.C.; Zhou, F.C.; Li, J.L.; Dong, X.G.; Zhao, C.Z. Quantitative assessment of the individual contribution of climate and human factors to desertification in northwest China using net primary productivity as an indicator. Ecol. Indic. 2015, 48, 560–569. [Google Scholar] [CrossRef]
  12. Zhong, L.; Ma, Y.M.; Salama, M.S.; Su, Z.B. Assessment of vegetation dynamics and their response to variations in precipitation and temperature in the Tibetan Plateau. Clim. Chang. 2010, 103, 519–535. [Google Scholar] [CrossRef]
  13. Chen, Y.; Li, Z.; Fan, Y.; Wang, H.; Deng, H. Progress and prospects of climate change impacts on hydrology in the arid region of northwest China. Environ. Res. 2015, 139, 11–19. [Google Scholar] [CrossRef] [PubMed]
  14. Forbes, B.C.; Ebersole, J.J.; Strandberg, B. Anthropogenic disturbance and patch dynamics in circumpolar Arctic ecosystems. Conserv. Biol. 2001, 15, 954–969. [Google Scholar] [CrossRef]
  15. Goetz, S.J.; Bunn, A.G.; Fiske, G.J.; Houghton, R.A. Satellite-observed photosynthetic trends across boreal North America associated with climate and fire disturbance. Proc. Natl. Acad. Sci. USA 2005, 102, 13521–13525. [Google Scholar] [CrossRef] [PubMed] [Green Version]
  16. Chen, B.Z.; Xu, G.; Coops, N.C.; Ciais, P.; Innes, J.L.; Wang, G.Y.; Myneni, R.B.; Wang, T.L.; Krzyzanowski, J.; Li, Q.L.; et al. Changes in vegetation photosynthetic activity trends across the Asia-Pacific region over the last three decades. Remote Sens. Environ. 2014, 144, 28–41. [Google Scholar] [CrossRef]
  17. Gao, Y.; Huang, J.; Li, S.; Li, S.C. Spatial pattern of non-stationarity and scale-dependent relationships between NDVI and climatic factors—A case study in Qinghai-Tibet plateau. China Ecol. Indic. 2012, 20, 170–176. [Google Scholar] [CrossRef]
  18. Raynolds, M.K.; Comiso, J.C.; Walker, D.A.; Verbyla, D. Relationship between satellite-derived land surface temperatures, Arctic vegetation types, and NDVI. Remote Sens. Environ. 2008, 112, 1884–1894. [Google Scholar] [CrossRef]
  19. Hou, W.J.; Gao, J.B.; Wu, S.H.; Dai, E. Interannual variations in growing-season NDVI and its correlation with climate variables in the southwestern karst region of China. Remote Sens. 2015, 7, 11105–11124. [Google Scholar] [CrossRef]
  20. Nemani, R.R.; Keeling, C.D.; Hashimoto, H.; Jolly, W.M.; Piper, S.C.; Tucker, C.J.; Myneni, R.B.; Running, S.W. Climate-driven increases in global terrestrial net primary production from 1982 to 1999. Science 2003, 300, 1560–1563. [Google Scholar] [CrossRef] [PubMed]
  21. Fensholt, R.; Langanke, T.; Rasmussen, K.; Reenberg, A.; Prince, S.D.; Tucker, C.; Scholes, R.J.; Le, Q.B.; Bondeau, A.; Eastman, R.; et al. Greenness in semi-arid areas across the globe 1981–2007—An earth observing satellite based analysis of trends and drivers. Remote Sens. Environ. 2012, 121, 144–158. [Google Scholar] [CrossRef]
  22. Bao, G.; Qin, Z.H.; Bao, Y.H.; Zhou, Y.; Li, W.J.; Sanjjav, A. NDVI-based long-term vegetation dynamics and its response to climatic change in the Mongolian plateau. Remote Sens. 2014, 6, 8337–8358. [Google Scholar] [CrossRef]
  23. Zhang, Y.L.; Song, C.H.; Band, L.E.; Sun, G.; Li, J.X. Reanalysis of global terrestrial vegetation trends from modis products: Browning or greening? Remote Sens. Environ. 2017, 191, 145–155. [Google Scholar] [CrossRef]
  24. Zhou, D.; Zhao, S.; Liu, S.; Zhang, L. Spatiotemporal trends of terrestrial vegetation activity along the urban development intensity gradient in China’s 32 major cities. Sci. Total Environ. 2014, 489, 136–145. [Google Scholar] [CrossRef] [PubMed]
  25. Tong, X.Y.; Brandt, M.; Hiernaux, P.; Herrmann, S.M.; Tian, F.; Prishchepov, A.V.; Fensholt, R. Revisiting the coupling between NDVI trends and cropland changes in the Sahel drylands: A case study in western Niger. Remote Sens. Environ. 2017, 191, 286–296. [Google Scholar] [CrossRef] [Green Version]
  26. Mishra, N.B.; Mainali, K.P. Greening and browning of the Himalaya: Spatial patterns and the role of climatic change and human drivers. Sci. Total Environ. 2017, 587, 326–339. [Google Scholar] [CrossRef] [PubMed]
  27. Qu, B.; Zhu, W.B.; Jia, S.F.; Lv, A.F. Spatio-temporal changes in vegetation activity and its driving factors during the growing season in China from 1982 to 2011. Remote Sens. 2015, 7, 13729–13752. [Google Scholar] [CrossRef]
  28. Ma, Z.M.; Kang, S.Z.; Zhang, L.; Tong, L.; Su, X.L. Analysis of impacts of climate variability and human activity on streamflow for a river basin in arid region of northwest China. J. Hydrol. 2008, 352, 239–249. [Google Scholar] [CrossRef]
  29. Esau, I.; Miles, V.; Davy, R.; Miles, M.; Kurchatova, A. Trends in normalized difference vegetation index (NDVI) associated with urban development in northern West Siberia. Atmos. Chem. Phys. 2016, 16, 9563–9577. [Google Scholar] [CrossRef] [Green Version]
  30. Zhou, D.C.; Zhao, S.Q.; Zhang, L.X.; Liu, S.G. Remotely sensed assessment of urbanization effects on vegetation phenology in China’s 32 major cities. Remote Sens. Environ. 2016, 176, 272–281. [Google Scholar] [CrossRef]
  31. Zhang, X.Y.; Friedl, M.A.; Schaaf, C.B.; Strahler, A.H.; Schneider, A. The footprint of urban climates on vegetation phenology. Geophys. Res. Lett. 2004, 31, 179–206. [Google Scholar] [CrossRef]
  32. Kumpula, T.; Pajunen, A.; Kaarlejärvi, E.; Forbes, B.C.; Stammler, F. Land use and land cover change in arctic Russia: Ecological and social implications of industrial development. Glob. Environ. Chang. 2011, 21, 550–562. [Google Scholar] [CrossRef]
  33. Su, Y.Z.; Zhao, W.Z.; Su, P.X.; Zhang, Z.H.; Wang, T.; Ram, R. Ecological effects of desertification control and desertified land reclamation in an oasis–desert ecotone in an arid region: A case study in Hexi corridor, northwest China. Ecol. Eng. 2007, 29, 117–124. [Google Scholar] [CrossRef]
  34. Liang, Y.J.; Liu, L.J. Modeling urban growth in the middle basin of the Heihe river, northwest China. Landsc. Ecol. 2014, 29, 1725–1739. [Google Scholar] [CrossRef]
  35. Yao, Z.Y.; Zhao, C.Y.; Yang, K.S.; Liu, W.C.; Yuan, L.; You, J.D.; Xiao, J.H. Alpine grassland degradation in the Qilian mountains, China—A case study in Damaying Grassland. CATENA 2016, 137, 494–500. [Google Scholar] [CrossRef]
  36. Zeng, B.; Zhang, F.G.; Yang, T.B.; Qi, J.; Ghebrezgabher, M.G. Alpine sparsely vegetated areas in the eastern Qilian mountains shrank with climate warming in the past 30 years. Prog. Phys. Geogr. 2018. [Google Scholar] [CrossRef]
  37. Jia, L.; Shang, H.L.; Hu, G.C.; Menenti, M. Phenological response of vegetation to upstream river flow in the Heihe Rive basin by time series analysis of MODIS data. Hydrol. Earth Syst. Sci. 2011, 15, 1047–1064. [Google Scholar] [CrossRef] [Green Version]
  38. CCTV. Available online: http://news.cctv.com/2017/01/16/ARTIbTCoIi0p3hNx43XpJBxd170116.shtml (accessed on 16 January 2017).
  39. Piao, S.L.; Ciais, P.; Huang, Y.; Shen, Z.H.; Peng, S.S.; Li, J.S.; Zhou, L.P.; Liu, H.Y.; Ma, Y.C.; Ding, Y.H.; et al. The impacts of climate change on water resources and agriculture in China. Nature 2010, 467, 43–51. [Google Scholar] [CrossRef] [PubMed]
  40. Liu, X.F.; Zhu, X.F.; Li, S.S.; Liu, Y.X.; Pan, Y.Z. Changes in growing season vegetation and their associated driving forces in China during 2001–2012. Remote Sens. 2015, 7, 15517–15535. [Google Scholar] [CrossRef]
  41. Zhang, Y.C.; Yu, J.J.; Wang, P.; Fu, G.B. Vegetation responses to integrated water management in the ejina basin, northwest China. Hydrol. Process. 2011, 25, 3448–3461. [Google Scholar] [CrossRef]
  42. Tarnavsky, E.; Garrigues, S.; Brown, M.E. Multiscale geostatistical analysis of AVHRR, SPOT-VGT, and MODIS global NDVI products. Remote Sens. Environ. 2008, 112, 535–549. [Google Scholar] [CrossRef]
  43. Tian, F.; Fensholt, R.; Verbesselt, J.; Grogan, K.; Horion, S.; Wang, Y. Evaluating temporal consistency of long-term global NDVI datasets for trend analysis. Remote Sens. Environ. 2015, 163, 326–340. [Google Scholar] [CrossRef]
  44. Telesca, L.; Lasaponara, R. Discriminating dynamical patterns in burned and unburned vegetational covers by using SPOT-VGT NDVI data. Geophys. Res. Lett. 2005, 32, 1–4. [Google Scholar] [CrossRef]
  45. Cohen, J.; Cohen, P.; West, S.; Aiken, L. Applied Multiple Regression/Correlation Analysis for the Behavioral Sciences; Lawrence Eribaum Associates, Inc.: Mahwah, NJ, USA, 2013. [Google Scholar]
  46. Toms, J.D.; Lesperance, M.L. Piecewise regression: A tool for identifying ecological thresholds. Ecology 2003, 84, 2034–2041. [Google Scholar] [CrossRef]
  47. Peng, S.S.; Chen, A.; Xu, L.; Cao, C.X.; Fang, J.Y.; Myneni, R.B.; Pinzon, J.E.; Tucker, C.J.; Piao, P.L. Recent change of vegetation growth trend in China. Environ. Res. Lett. 2011, 6, 044027. [Google Scholar] [CrossRef]
  48. Zhang, Y.L.; Gao, J.G.; Liu, L.S.; Wang, Z.F.; Ding, M.J.; Yang, X.C. NDVI-based vegetation changes and their responses to climate change from 1982 to 2011: A case study in the Koshi River Basin in the middle Himalayas. Glob. Planet. Chang. 2013, 108, 139–148. [Google Scholar] [CrossRef]
  49. Li, Y.R.; Cao, Z.; Long, H.L.; Liu, Y.S.; Li, W.J. Dynamic analysis of ecological environment combined with land cover and NDVI changes and implications for sustainable urban-rural development: The case of Mu Us Sandy Land. China J. Clean. Prod. 2017, 142, 697–715. [Google Scholar] [CrossRef]
  50. Braimoh, A.K. Random and systematic land-cover transitions in northern Ghana. Agric. Ecosyst. Environ. 2006, 113, 254–263. [Google Scholar] [CrossRef]
  51. Shi, Y.F.; Shen, Y.P.; Kang, E.; Li, D.L.; Ding, Y.J.; Zhang, G.W.; Hu, R.J. Recent and future climate change in northwest China. Clim. Chang. 2007, 80, 379–393. [Google Scholar] [CrossRef]
  52. Fay, P.A.; Kaufman, D.M.; Nippert, J.B.; Carlisle, J.D.; Harper, C.W. Changes in grassland ecosystem function due to extreme rainfall events: Implications for responses to climate change. Glob. Chang. Biol. 2008, 14, 1600–1608. [Google Scholar] [CrossRef]
  53. Piao, S.L.; Fang, J.Y.; Zhou, L.M.; Ciais, P.; Zhu, B. Variations in satellite-derived phenology in China’s temperate vegetation. Glob. Chang. Biol. 2010, 12, 672–685. [Google Scholar] [CrossRef]
  54. Midgley, G.F.; Aranibar, J.N.; Mantlana, K.B.; Macko, S.A. Photosynthetic and gas exchange characteristics of dominant woody plants on a moisture gradient in an African savanna. Glob. Chang. Biol. 2004, 10, 309–317. [Google Scholar] [CrossRef]
  55. Angert, A.; Biraud, S.; Bonfils, C.; Henning, C.C.; Buermann, W.; Pinzon, J.; Tucker, C.J.; Fung, I.; Field, C.B. Drier summers cancel out the CO2 uptake enhancement induced by warmer springs. Proc. Natl. Acad. Sci. USA 2005, 102, 10823–10827. [Google Scholar] [CrossRef] [PubMed]
  56. Li, Z.; Huffman, T.; Mcconkey, B.; Townley-Smith, L. Monitoring and modeling spatial and temporal patterns of grassland dynamics using time-series MODIS NDVI with climate and stocking data. Remote Sens. Environ. 2013, 138, 232–244. [Google Scholar] [CrossRef]
  57. Zhang, R.; Ouyang, Z.T.; Xie, X.; Guo, H.Q.; Tan, D.Y.; Xiao, X.M.; Qi, J.G.; Zhao, B. Impact of climate change on vegetation growth in arid northwest of China from 1982 to 2011. Remote Sens. 2016, 8, 364. [Google Scholar] [CrossRef]
  58. Li, A.; Wu, J.G.; Huang, J.H. Distinguishing between human-induced and climate-driven vegetation changes: A critical application of RESTREND in Inner Mongolia. Landsc. Ecol. 2012, 27, 969–982. [Google Scholar] [CrossRef]
  59. Cristiano, P.M.; Madanes, N.; Campanello, P.I.; Francescantonio, D.D.; Rodriguez, S.A.; Zhang, Y.J. High NDVI and potential canopy photosynthesis of south American subtropical forests despite seasonal changes in leaf area index and air temperature. Forests 2014, 5, 287–308. [Google Scholar] [CrossRef]
  60. Sturm, M.; McFadden, J.P.; Liston, G.E.; Chapin, F.S., II; Racine, C.H.; Holmgren, J. Snow–shrub Interactions in Arctic tundra: A hypothesis with climatic implications. J. Clim. 2001, 14, 336–343. [Google Scholar] [CrossRef]
  61. Elmendorf, S.C.; Henry, G.H.R.; Hollister, R.D.; Björk, R.G.; Boulanger-Lapointe, N.; Cooper, E.J.; Cornelissen, J.H.C.; Day, T.A.; Dorrepaal, E.; Elumeeva, G.T.; et al. Plot-scale evidence of tundra vegetation change and links to recent summer warming. Nat. Clim. Chang. 2012, 2, 453–457. [Google Scholar] [CrossRef]
  62. Bhatt, U.S.; Walker, D.A.; Raynolds, M.K.; Bieniek, P.A.; Epstein, H.E.; Comiso, J.C.; Pinzon, J.E.; Tucker, C.J.; Polyakov, I.V. Recent declines in warming and vegetation greening trends over pan-Arctic tundra. Remote Sens. 2013, 5, 4229–4254. [Google Scholar] [CrossRef]
  63. Wang, J.X.; Mendelsohn, R.; Dinar, A.; Huang, J.K.; Rozelle, S.; Zhang, L.J. The impact of climate change on China’s agriculture. Agric. Econ. 2010, 40, 323–337. [Google Scholar] [CrossRef]
  64. Hua, W.; Chen, H.; Zhou, L.; Xie, Z.; Qin, M.; Li, X.; Ma, H.; Huang, Q.; Sun, S. Observational quantification of climatic and human influences on vegetation greening in China. Remote Sens. 2017, 9, 425. [Google Scholar] [CrossRef]
  65. Leong, M.; Roderick, G.K. Remote sensing captures varying temporal patterns of vegetation between human-altered and natural landscapes. PeerJ 2015, 3, e1141. [Google Scholar] [CrossRef] [PubMed]
  66. Cai, H.Y.; Yang, X.H.; Wang, K.J.; Xiao, L.L. Is forest restoration in the southwest China karst promoted mainly by climate change or human-induced factors? Remote Sens. 2014, 6, 9895–9910. [Google Scholar] [CrossRef]
  67. Blom, A.; Zalinge, R.V.; Heitkönig, I.; Prins, H.H.T. Factors influencing distribution of large mammals within a protected Central African forest. Oryx 2005, 39, 381–388. [Google Scholar] [CrossRef]
  68. Christensen, M.; Heilmann-Clausen, J. Forest biodiversity gradients and the human impact in Annapurna Conservation Area. Nepal Biodivers. Conserv. 2009, 18, 2205–2221. [Google Scholar] [CrossRef]
  69. Thapa, S.; Chapman, D.S. Impacts of resource extraction on forest structure and diversity in Bardia National Park. Nepal For. Ecol. Manag. 2010, 259, 641–649. [Google Scholar] [CrossRef]
  70. Pattanavibool, A.; Dearden, P. Fragmentation and wildlife in montane evergreen forests, northern Thailand. Biol. Conserv. 2002, 107, 155–164. [Google Scholar] [CrossRef]
  71. Karanth, K.K.; Curran, L.M.; Reuning-Scherer, J.D. Village size and forest disturbance in Bhadra wildlife sanctuary, western Ghats, India. Biol. Conserv. 2006, 128, 147–157. [Google Scholar] [CrossRef]
  72. Lawler, J.J.; Lewis, D.J.; Nelson, E.; Plantinga, A.J.; Polasky, S.; Withey, J.C.; Helmers, D.P.; Martinuzzi, S.; Pennington, D.; Radeloff, V.C. Projected land-use change impacts on ecosystem services in the United States. Proc. Natl. Acad. Sci. USA 2014, 111, 7492–7497. [Google Scholar] [CrossRef] [PubMed] [Green Version]
  73. Beurs, K.M.; Henebry, G.M.; Owsley, B.C.; Sokolik, I. Using multiple remote sensing perspectives to identify and attribute land surface dynamics in Central Asia 2001–2013. Remote Sens. Environ. 2015, 170, 48–61. [Google Scholar] [CrossRef]
  74. Song, W.; Deng, X.Z. Land-use/land-cover change and ecosystem service provision in China. Sci. Total Environ. 2017, 576, 705–719. [Google Scholar] [CrossRef] [PubMed]
  75. Lambin, E.; Geist, H.; Lepers, E. Dynamics of land-use and land-cover change in tropical regions. Annu. Rev. Environ. Resour. 2003, 28, 205–241. [Google Scholar] [CrossRef]
  76. Yang, X.C.; Xu, B.; Jin, Y.X.; Qin, Z.H.; Ma, H.L.; Li, J.Y.; Zhao, F.; Chen, S.; Zhu, X.H. Remote sensing monitoring of grassland vegetation growth in the Beijing–Tianjin sandstorm source project area from 2000 to 2010. Ecol. Indic. 2015, 51, 244–251. [Google Scholar] [CrossRef] [Green Version]
Figure 1. The study area in northwest China. White dots represent study sites (AJ in this study represent Jade Gate Pass, Akesai, Dunhuang, Subei, Jiayuguan, Jiuquan, Zhangye, Minle, Jinchang, and Wuwei, respectively). Black triangles represent mountains (KN in this study represent Wushao Mountain, Mazong Mountain, Heli Mountain, and Longshou Mountain, respectively).
Remotesensing 10 01270 g001
Figure 2. Maps of population density (a) and vegetation types (b) of the Hexi Corridor in 2010.
Remotesensing 10 01270 g002
Figure 3. Spatial patterns of land use types of the Hexi Corridor and the selected cities and counties (af).
Remotesensing 10 01270 g003
Figure 4. Interannual variation trends of the growing season NDVI, precipitation, and temperature around the Hexi Corridor from 2000 to 2015.
Remotesensing 10 01270 g004
Figure 5. Spatial patterns of interannual variation trends of the growing season NDVI around the Hexi Corridor from 2000 to 2015.
Remotesensing 10 01270 g005
Figure 6. Spatial distributions of NDVI and linear change rate in the growing season NDVI around the Hexi Corridor and in the range of the buffer cities and counties (af) from 2000 to 2015.
Remotesensing 10 01270 g006
Figure 7. Spatial distribution of the partial correlation coefficients between NDVI and climate factors (a and b) and adj-R2 (c) in 2000–2015. The inset maps show significantly (p < 0.05) positive correlation between NDVI and climate (blue), and significantly (p < 0.05) negative correlation between NDVI and climate (red).
Remotesensing 10 01270 g007
Figure 8. The change process of the growing season mean NDVI (a and b) and the linear change rate (c and d) from 2000 to 2015, with the distance to city and county administration center in the range of human activities, respectively.
Remotesensing 10 01270 g008
Table 1. Transitions in percentages of the total LUCC observed during 2000–2015 (%).
Year 20002015Total (2000)LossNet gain in 2015Change in 2015
FaLFoLGLWLULUSRSCL
FaL6.080.000.030.010.010.010.010.006.150.070.6410.41
FoL0.023.550.000.000.000.000.000.003.570.020.000.00
GL0.210.0122.070.010.020.010.000.0122.340.27-0.06-0.27
WL0.010.000.010.750.010.000.000.000.780.030.033.85
UL0.470.010.170.0465.880.010.010.1166.700.82-0.78-1.17
US0.000.000.000.000.000.050.000.000.050.000.0360.00
RS0.000.000.000.000.000.000.350.000.350.000.025.71
CL0.000.000.000.000.000.000.000.070.070.000.12171.43
Total (2015)6.793.5722.280.8165.920.080.370.191001.21
Gain0.710.020.210.060.040.030.020.121.21
Notes: FaL, Farmland; FoL, Forested land; GL, Grassland; WL, Water area; US, Urban settlement; RS, Rural settlement; CL, Other construction land; UL, Unused land (mainly Gobi, bare rocky land and sandy land).
Table 2. Gain-to-persistence, loss-to-persistence, and net change-to-persistence ratios of the land types.
gplpnp
Farmland0.120.010.11
Forested land0.010.010.00
Grassland0.010.010.00
Water land0.080.040.05
Urban settlements0.600.000.60
Rural settlements0.060.000.06
Other construction land1.710.001.71
Unused land0.000.01-0.01

