Article

Multi-Year Analyses of Columnar Aerosol Optical and Microphysical Properties in Xi’an, a Megacity in Northwestern China

1
Key Lab of Aerosol Chemistry & Physics, Chinese Academy of Sciences (KLACP), Chinese Academy of Sciences, Xi’an 710061, China
2
State Key Laboratory of Loess and Quaternary Geology (SKLLQG), Institute of Earth Environment, Chinese Academy of Sciences, Xi’an 710061, China
3
Institute of Remote Sensing and Digital Earth, Chinese Academy of Sciences, Beijing 100101, China
4
Key Laboratory of Middle Atmosphere and Global Environment Observation (LAGEO), Institute of Atmospheric Physics, Chinese Academy of Sciences, Beijing 100029, China
*
Author to whom correspondence should be addressed.
Remote Sens. 2018, 10(8), 1169; https://doi.org/10.3390/rs10081169
Submission received: 21 June 2018 / Revised: 17 July 2018 / Accepted: 19 July 2018 / Published: 24 July 2018
(This article belongs to the Section Atmospheric Remote Sensing)

Abstract

:
A thorough understanding of aerosol optical properties and their spatio-temporal variability are required to accurately evaluate aerosol effects in the climate system. In this study, a multi-year study of aerosol optical and microphysical properties was firstly performed in Xi’an based on three years of sun photometer remote sensing measurements from 2012 to 2015. The multi-year average of aerosol optical depth (AOD) at 440 nm was about 0.88 ± 0.24 (mean ± SD), while the averaged Ångström Exponent (AE) between 440 and 870 nm was 1.02 ± 0.15. The mean value of single scattering albedo (SSA) was around 0.89 ± 0.03. Aerosol optical depth and AE showed different seasonal variation patterns. Aerosol optical depth was slightly higher in winter (0.99 ± 0.36) than in other seasons (~0.85 ± 0.20), while AE showed its minimum in spring (0.85 ± 0.05) due to the impact of dust episodes. The seasonal variations of volume particle size distribution, spectral refractive index, SSA, and asymmetry factor were also analyzed to characterize aerosols over this region. Based on the aerosol products derived from sun photometer measurements, the classification of aerosol types was also conducted using two different methods in this region. Results show that the dominant aerosol types are absorbers in all seasons, especially in winter, demonstrating the strong absorptivity of aerosols in Xi’an.

Graphical Abstract

1. Introduction

Atmospheric aerosol, a major component in the earth-atmosphere system, plays an important role in earth’s energy balance, global climate change, and even hydrological cycle [1]. It perturbs the radiation balance of the earth directly through the scattering and absorption of sunlight, and indirectly by serving as condensation nuclei in cloud formation, thus affecting clouds’ radiative properties and precipitation [2]. Further understanding of the complicated aerosol-cloud-radiation system requires comprehensive knowledge of aerosol optical and microphysical properties, such as aerosol optical depth (AOD), size distributions, and single scattering albedo (SSA) [3]. However, due to the short lifetime and complex composition, aerosol is highly variable in time and space, making itself the greatest source of uncertainty in climate change assessment and prediction [4]. In addition, aerosol has attracted more and more attention in recent years because of its remarkable effect on air quality. As one of the most important air pollutants, it greatly affects public health and traffic safety. To characterize air pollution events and assess their environmental effects, aerosol optical and microphysical properties are widely used in numerous studies [5,6,7,8,9,10], which show their unique advantages. In short, comprehensive understanding of aerosol optical properties is the foundation for the assessments of both their climate and environment effects.
Ground-based remote sensing using sun photometer has been validated as one of the best-suited methods for columnar aerosol detection [11]. High-quality datasets acquired by this method have been widely used to characterize aerosol optical properties [12,13,14], to study aerosol radiative forcing and its climate effects [15,16,17], and to evaluate aerosol products from satellites and models [18,19,20]. Since the beginning of 2000s, several international and regional networks, such as SKYNET (the Skyradiometer Network) [21], AERONET (the Aerosol Robotic Network) [22], CSHNET (the Chinese Sun Hazemeter Network) [23], CARSNET (the China Aerosol Remote Sensing Network) [12], and SONET (the Sun-Sky Radiometer Observation Network) [24] have successively taken observations using sun photometers in China, supporting many studies on column-integrated aerosol optical properties. Limited by the sites’ distribution, most of the early work was performed in North China, especially over the North China Plain [25,26,27]. Shortly afterwards, with the development of global and regional networks, column-integrated aerosol optical properties were intensively reported over more and more regions in China, such as Eastern China [28,29,30], Northeast China [31,32,33], Southwest China [34,35], Central China [36], and some western desert regions [37,38,39]. However, similar studies have rarely been conducted in Northwest China, especially in heavy polluted urban regions.
Xi’an, the capital of Shaanxi Province, is the largest city in Northwest China with a permanent population of 8.8 million in an area of 10,108 km2. Stimulated by the China Western Development policy, it has experienced a great economic boom in recent decades. According to the national statistical yearbook, the gross domestic product (GDP) of this city reached 628.2 billion Yuan by the end of 2016, of which the primary, secondary, and tertiary industry accounted for about 3.7%, 35.0%, and 61.3%, respectively. As one of the most popular tourist destinations in China, Xi’an received more than 150 million domestic and foreign tourists in 2016. The rapid progress of industrialization and urbanization, along with the thriving tourism, leads to substantial pollutant emission by human activities (e.g., industries, motor vehicles, residences, and thermal power-plants), and therefore the degradation of air quality [40]. Moreover, the geographical position and topographic features of Xi’an (Figure 1) also play important roles in the formation of heavy pollution. Xi’an lies in a basin surrounded by the Loess Plateau to the north and Qinling Mountains to the south. Near Asian dust source regions, Xi’an often suffers dust storms transported from western and northwestern Chinese deserts in spring due to the prevailing winter monsoonal winds [41]. In addition, the “block” and “breeze” effects of the Qinling Mountains usually aggravate the accumulation of air pollutants from both anthropogenic and natural sources [42] and result in heavy air pollution events.
During the past decades, severe air pollution in Xi’an has caused wide public concern. Numerous studies have been performed, but mainly focused on the aerosol chemical characteristics and sources apportionments [43,44,45]. In contrast, aerosol optical properties in this urban region have never been studied until several recent years ago. Based on the analyses of ground-level SSA and Ångström coefficients calculated from particle scattering and absorption coefficients, Zhu et al. [46] demonstrated the certain effects of the high black carbon (BC), brown carbon, and non-absorbing components on light attenuation over Xi’an, which was also confirmed by the variability in the light attenuation cross-section of BC [47]. Columnar aerosol optical properties over this area were firstly investigated by Su et al. [48] using sun photometer observations over six months. Additionally, as one of the regular sites in CARSNET and SONET, both Che et al. [12] and Li et al. [49] mentioned some results in Xi’an when presenting a climatology study of aerosol optical properties over the whole network. However, the former only analyzed one optical parameter (AOD), while the latter put emphasis on the spatial variability in aerosol optical properties over China. Detailed analyses of columnar aerosol optical and microphysical, as well as their seasonal variation, have never been conducted over this urban region in Northwest China.
In this study, the column-integrated aerosol optical and microphysical properties in Xi’an were investigated based on three years of sun photometer measurements. Monthly and seasonal variations of aerosol optical and microphysical properties, including AOD, Ångström Exponent (AE), SSA, refractive index (RI), and volume particle size distribution (VPSD) etc., were analyzed in detail. Based on the aerosol products derived from sun photometer measurements, the classification of aerosol types was also conducted in this urban region. This work aimed to give a sense of columnar aerosol optical properties in a typical semi-arid urban region in Northwest China, and provide essential parameters to increase the accuracy of climate simulations in this region.

2. Measurements and Methodology

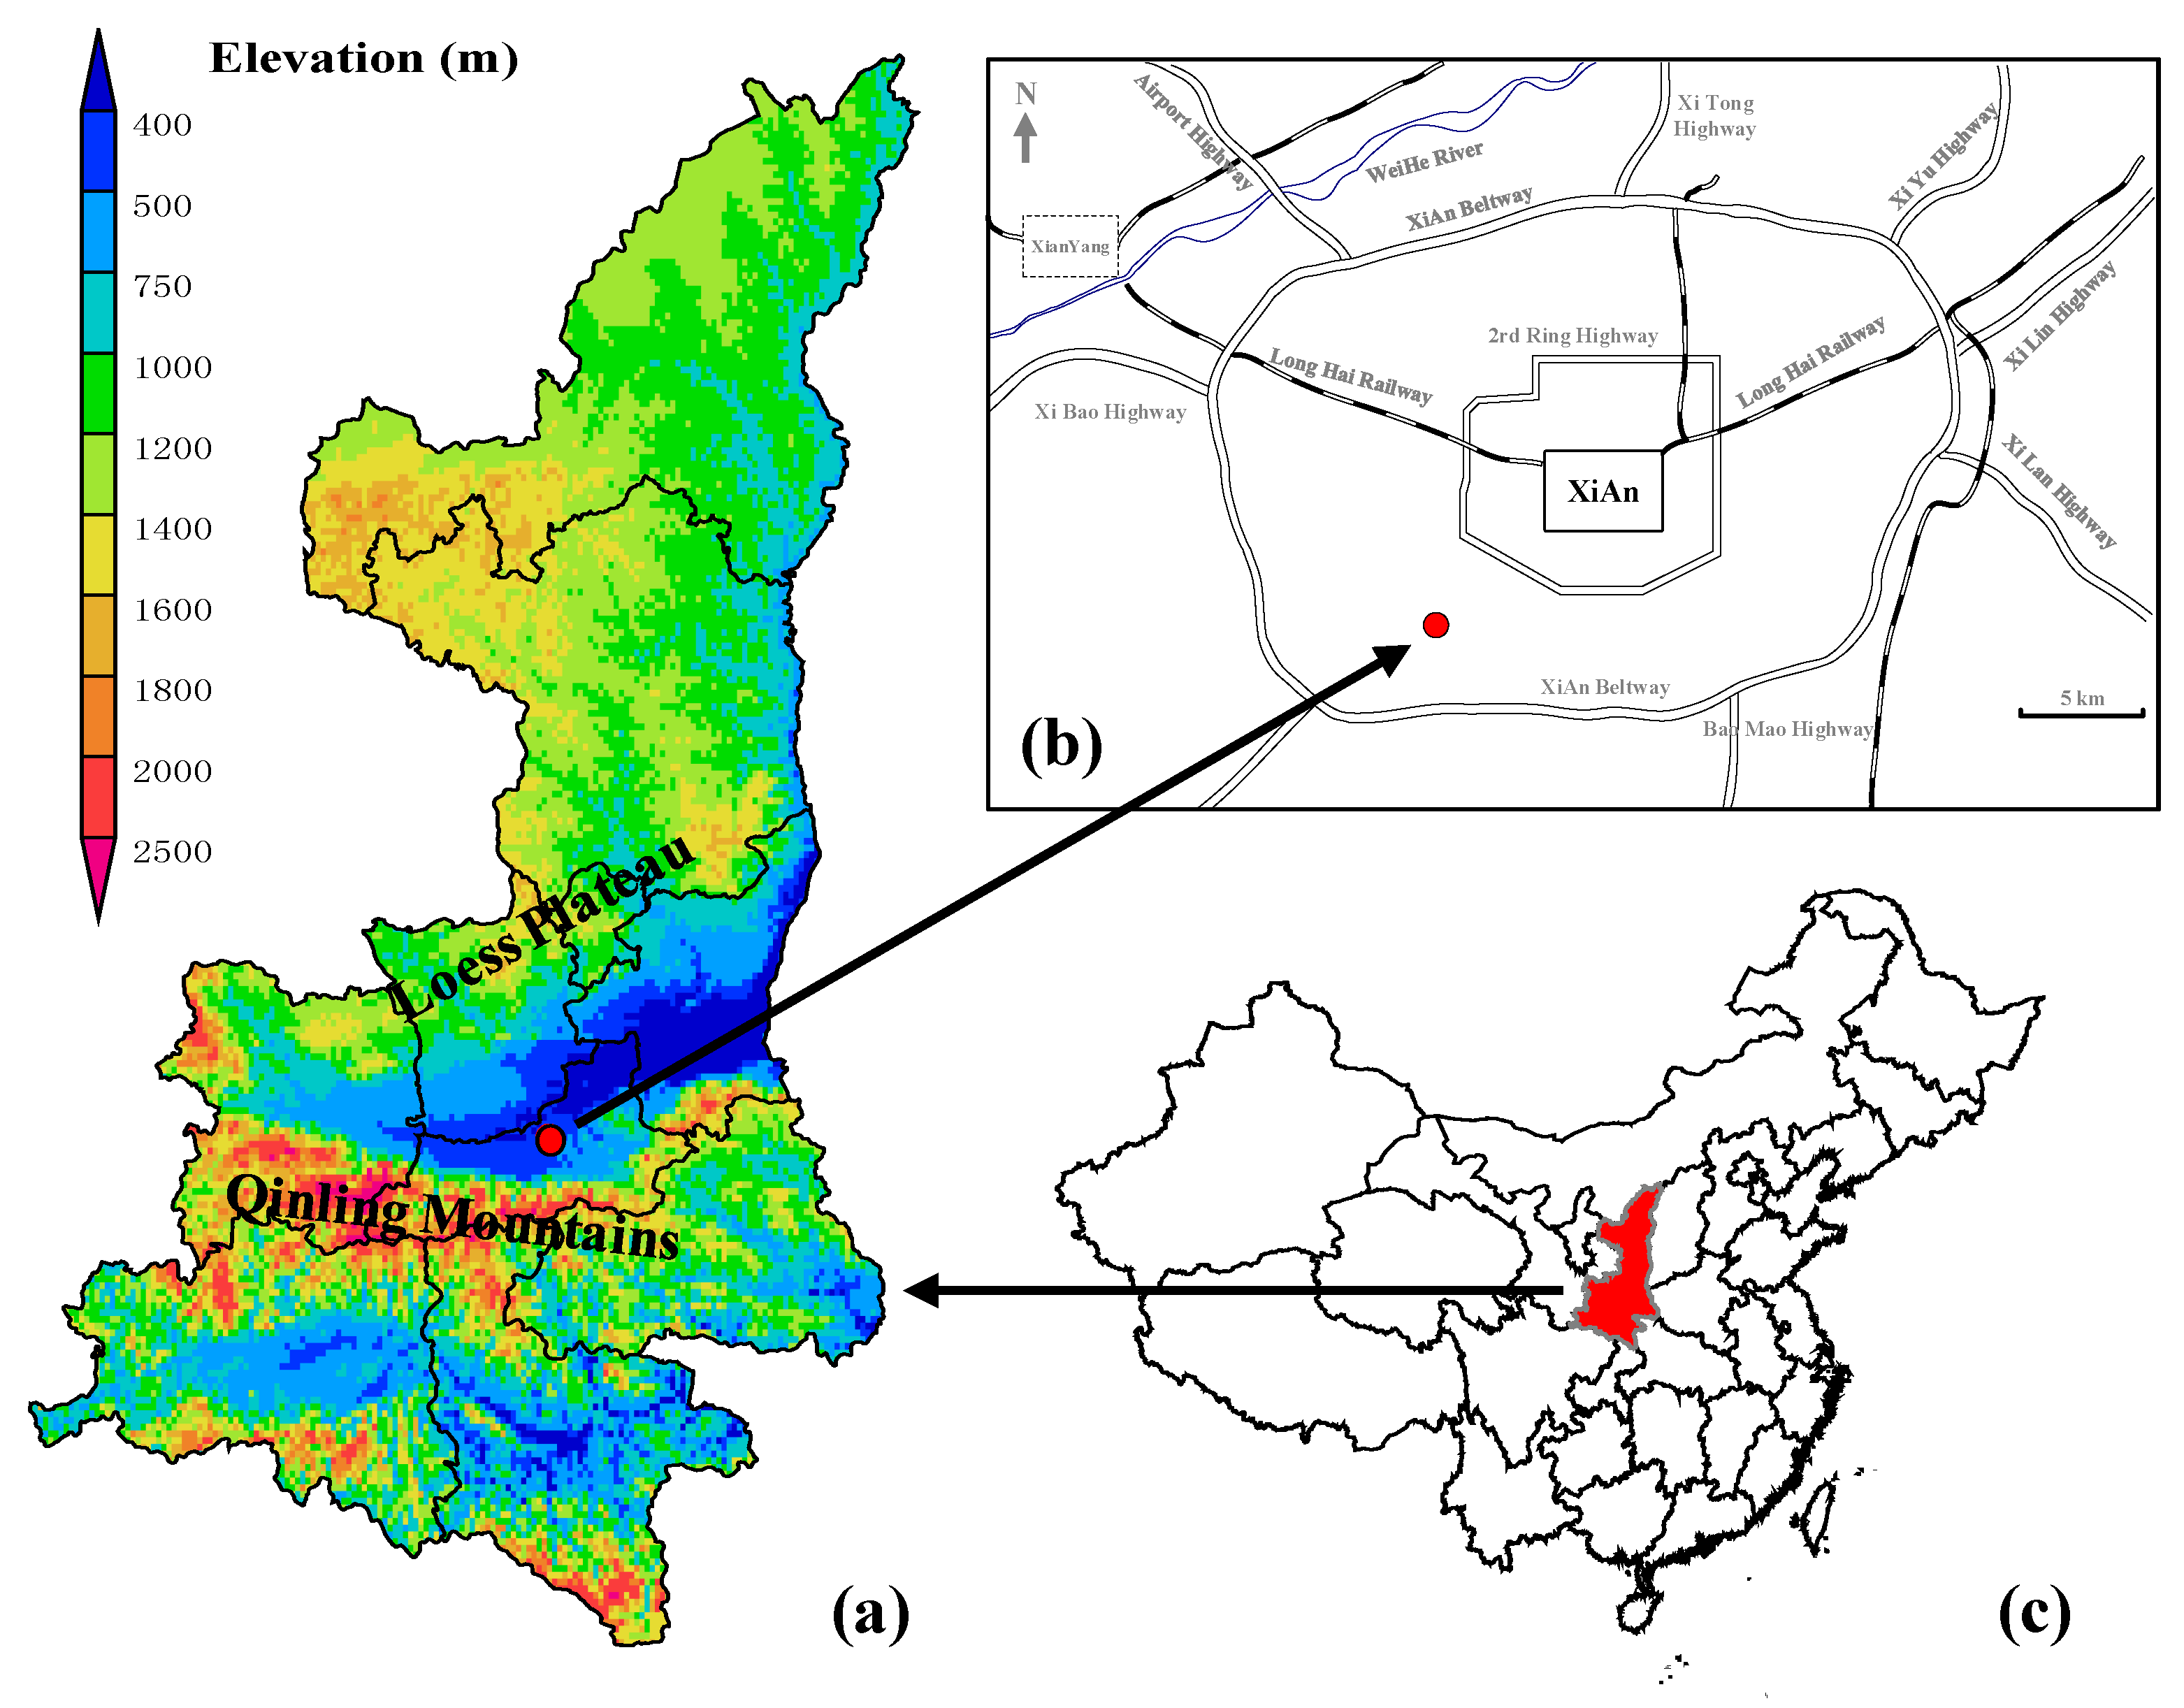
2.1. Site Description

As shown in Figure 1b, the Xi’an observation site is located in an urban-scale zone ~15 km southwest of the downtown, and it is mainly surrounded by residential and office buildings. The sun photometer was installed on the roof of the office building in the Institute of Earth Environment, Chinese Academy of Sciences (IEECAS: 34.22°N, 108.87°E; 389 m a.s.l) and joined the sun-sky radiometer Observation NETwork (SONET; www.sonet.ac.cn) in the May of 2012. After initial calibration and adjustment, it began to offer continuous aerosol measurements in the mid-May 2012, until the relocation of IEECAS in June 2015. Three years of aerosol optical and microphysical properties were recorded by the sun photometer and analyzed in this study.

2.2. Instrumentation, Calibration, and Retrieval Methods

As one of the regular sites in SONET, continuous observations were conducted at the Xi’an site using a new type of CE318 (CE318-NE) sun photometer (Cimel Electronique, Paris, France), which is also the standard instrument of a well-known global aerosol-monitoring network, AERONET. The CE318-NE automatic multi-wavelength sun photometer measures direct solar radiation across nine individual spectral channels (centered at 340, 380, 440, 500, 675, 870, 1020, 1640, and 940 nm) with a 1.2° full field of view. Measurements at the first eight channels were utilized to obtain highly accurate AOD from sunrise to sunset, with those at 940 nm used to retrieve columnar water vapor (CWV). It also provides the diffused sky radiation measurements in the almucantar (ALM) and principal plane (PP) configurations at 440, 675, 870, and 1020 nm. To ensure the data quality, the instrument was calibrated once a year using both field and laboratory calibration approaches. Direct sun measurements of the instrument were compared with that of a master instrument, which was regularly calibrated by Langley plot method at AERONET Izaña Observatory, during a field campaign (Ling Mountain site, ~1600 m a.s.l). For the sky radiance measurement calibration, a transferring calibration method [50] was developed based on the internal structure of the instrument. Uncertainty of the calibrated sky radiance was estimated to be 3–5%.
As the most important aerosol parameter provided by a sun photometer, AOD (τaer(λ)) can be derived from the direct sun measurements at each wavelength (340–1640 nm) based on the Beer–Bouguer–Lambert law:
τ t o t ( λ ) = τ a e r ( λ ) + τ R a y ( λ ) + τ g a s ( λ ) = 1 m ln F ( λ ) F 0 ( λ )
where F and F0 are the measured solar irradiance at the surface and the top of atmosphere (TOA), respectively. m is equivalent optical air mass (≈secθ0 with θ0 as the solar zenith angle) and τtot(λ) is the atmospheric total optical depth at wavelength λ. τRay(λ) denotes Rayleigh scattering optical depth, which can be obtained using an empirical model proposed by Frohlich and Shaw [51], while τgas(λ) is optical depth of gas absorption. It can be calculated from the effective absorbing coefficients of absorbing gas components, such as CO, O3, and NOx, based on the empirical equations and climatology statistical data offered in Holben et al. [22]. According to Equation (1), AOD can be easily derived by subtracting τRay(λ) and τgas(λ) from τtot(λ).
Based on the accurate AOD at two different wavelength (λ1 and λ2), AE is calculated according to the classical equation of Ångstrom [52]:
τ a e r ( λ 1 ) / τ a e r ( λ 2 ) = ( λ 1 / λ 2 ) A E
In this study, AE was calculated from AOD at 440 and 870 nm, the same as AERONET. Moreover, other aerosol optical and microphysical properties, such as SSA, volume particle size distribution (VPSD), real and imaginary parts of the refractive index (RI), and asymmetry factor, were simultaneously retrieved from the derived spectral AOD and sky radiance measurements using the standard inversion algorithm of AERONET products [53,54]. However, some different assumptions were utilized in the SONET retrieval scheme, which have have affected the accuracy of aerosol inversions. For example, the upper limit of the RI real part was extended to 1.7 from the value of 1.6 in AERONET. And the ground albedo was obtained from a five-year, half-monthly average MODIS climatology with the assumption of Lambertian surface reflectance.
In order to assess the accuracy of SONET products, AOD and inversions were produced in parallel by SONET and AERONET retrieval algorithms at six sites during the Dragon-Korus-AQ (2016) campaign [55]. Comparison of the joint datasets demonstrated that the two networks were quite comparable in both data acquisition capability and the accuracy of aerosol products [49]. Accordingly, the absolute uncertainty in SONET AOD was estimated to be about 0.01–0.02 [22] despite negligible difference (0.002 ± 0.001) from AERONET AOD. The uncertainties of other aerosol inversions, such as SSA, VPSD, and RI are presented in Table 1.
Besides the instrument performance, calibration procedure, and retrieval algorithm, cloud contamination can also affect the stability of sun and sky radiation measurements, and therefore impair the quality of aerosol products. To eliminate cloud contamination, an appropriate cloud-screening scheme was applied before inversion. For direct sun measurements, a threshold approach developed by Simirnov et al. [56] was utilized to identify clouds, while a asymmetry test was performed for the almucantar sky measurements. Considering the cloud identification information, AOD-related and inversion products were graded into three and two levels, respectively, following the AERONET criteria [57]. In this study, we utilized level 2.0 products with highest quality, which were not only cloud-screened but also quality-assured, to ensure the reliability of our statistical analyses. It meant that only almucantar retrievals (SSA and RI) with AOD at 440 nm (AOD440) > 0.4 were retained to avoid the large inversion errors. In addition, daily averages of all the aerosol products were calculated only when there were three or more available measurements for the given day, and then used to compute the seasonal averages.

3. Results and Discussions

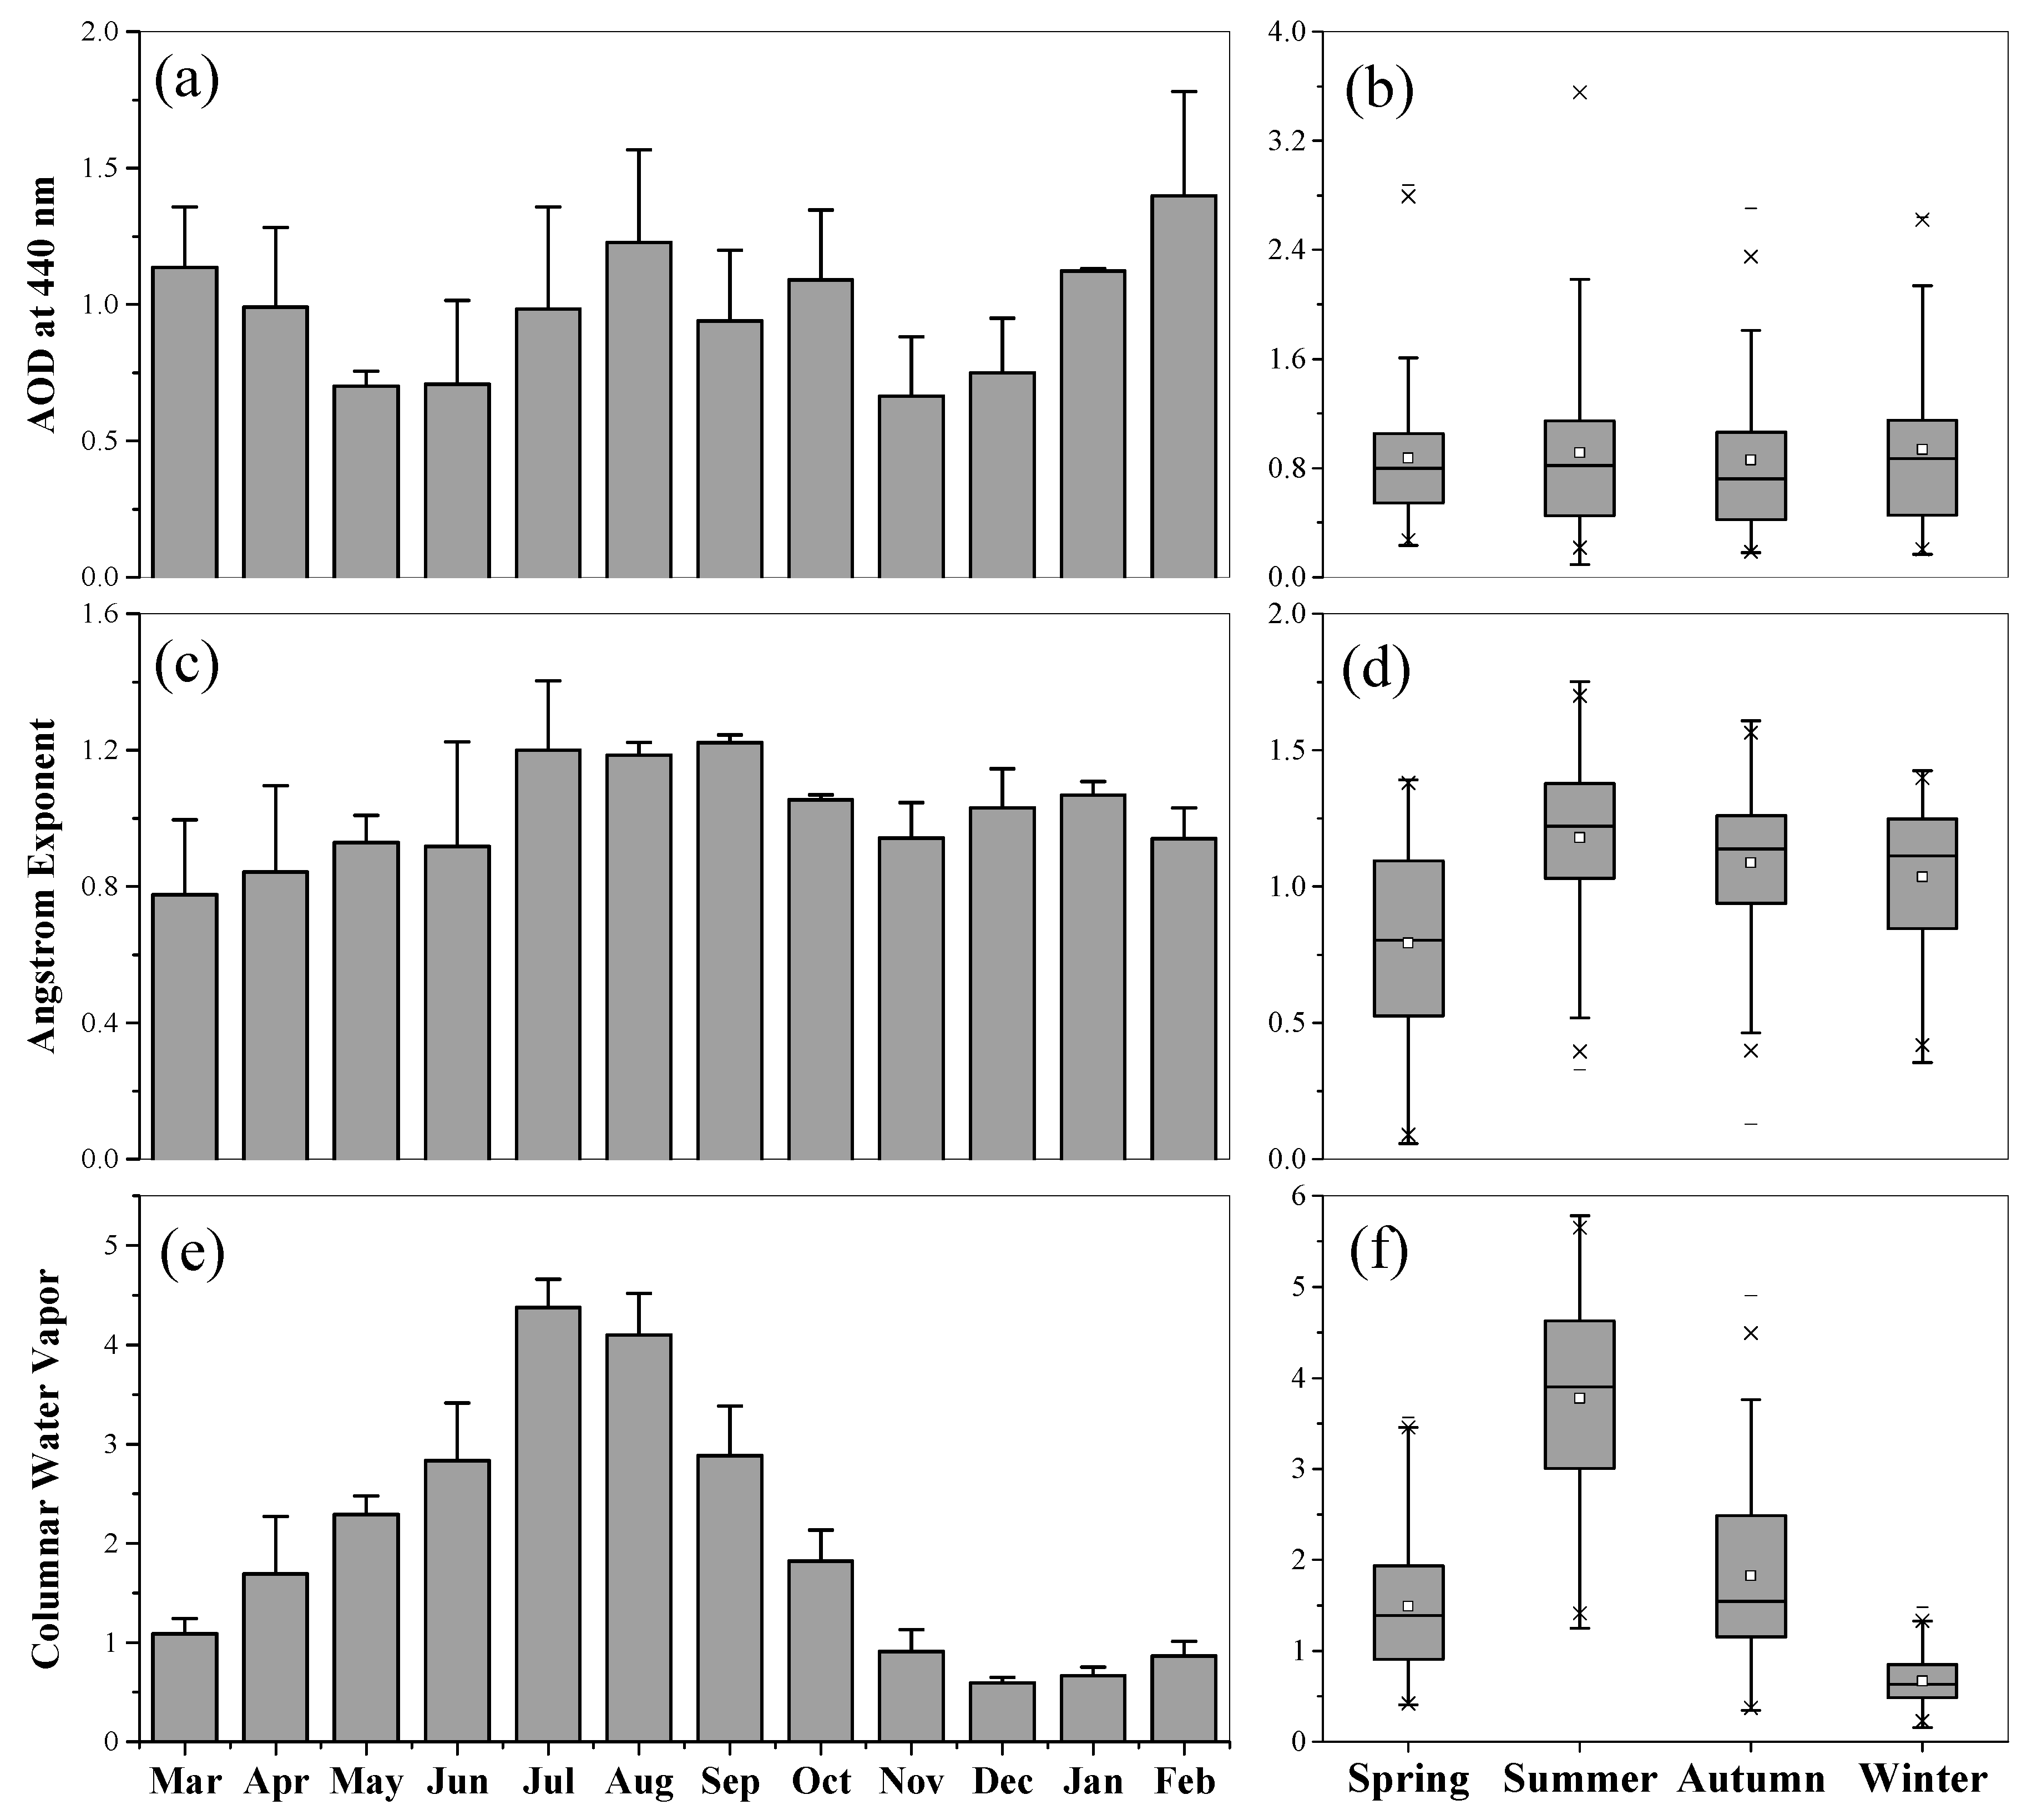
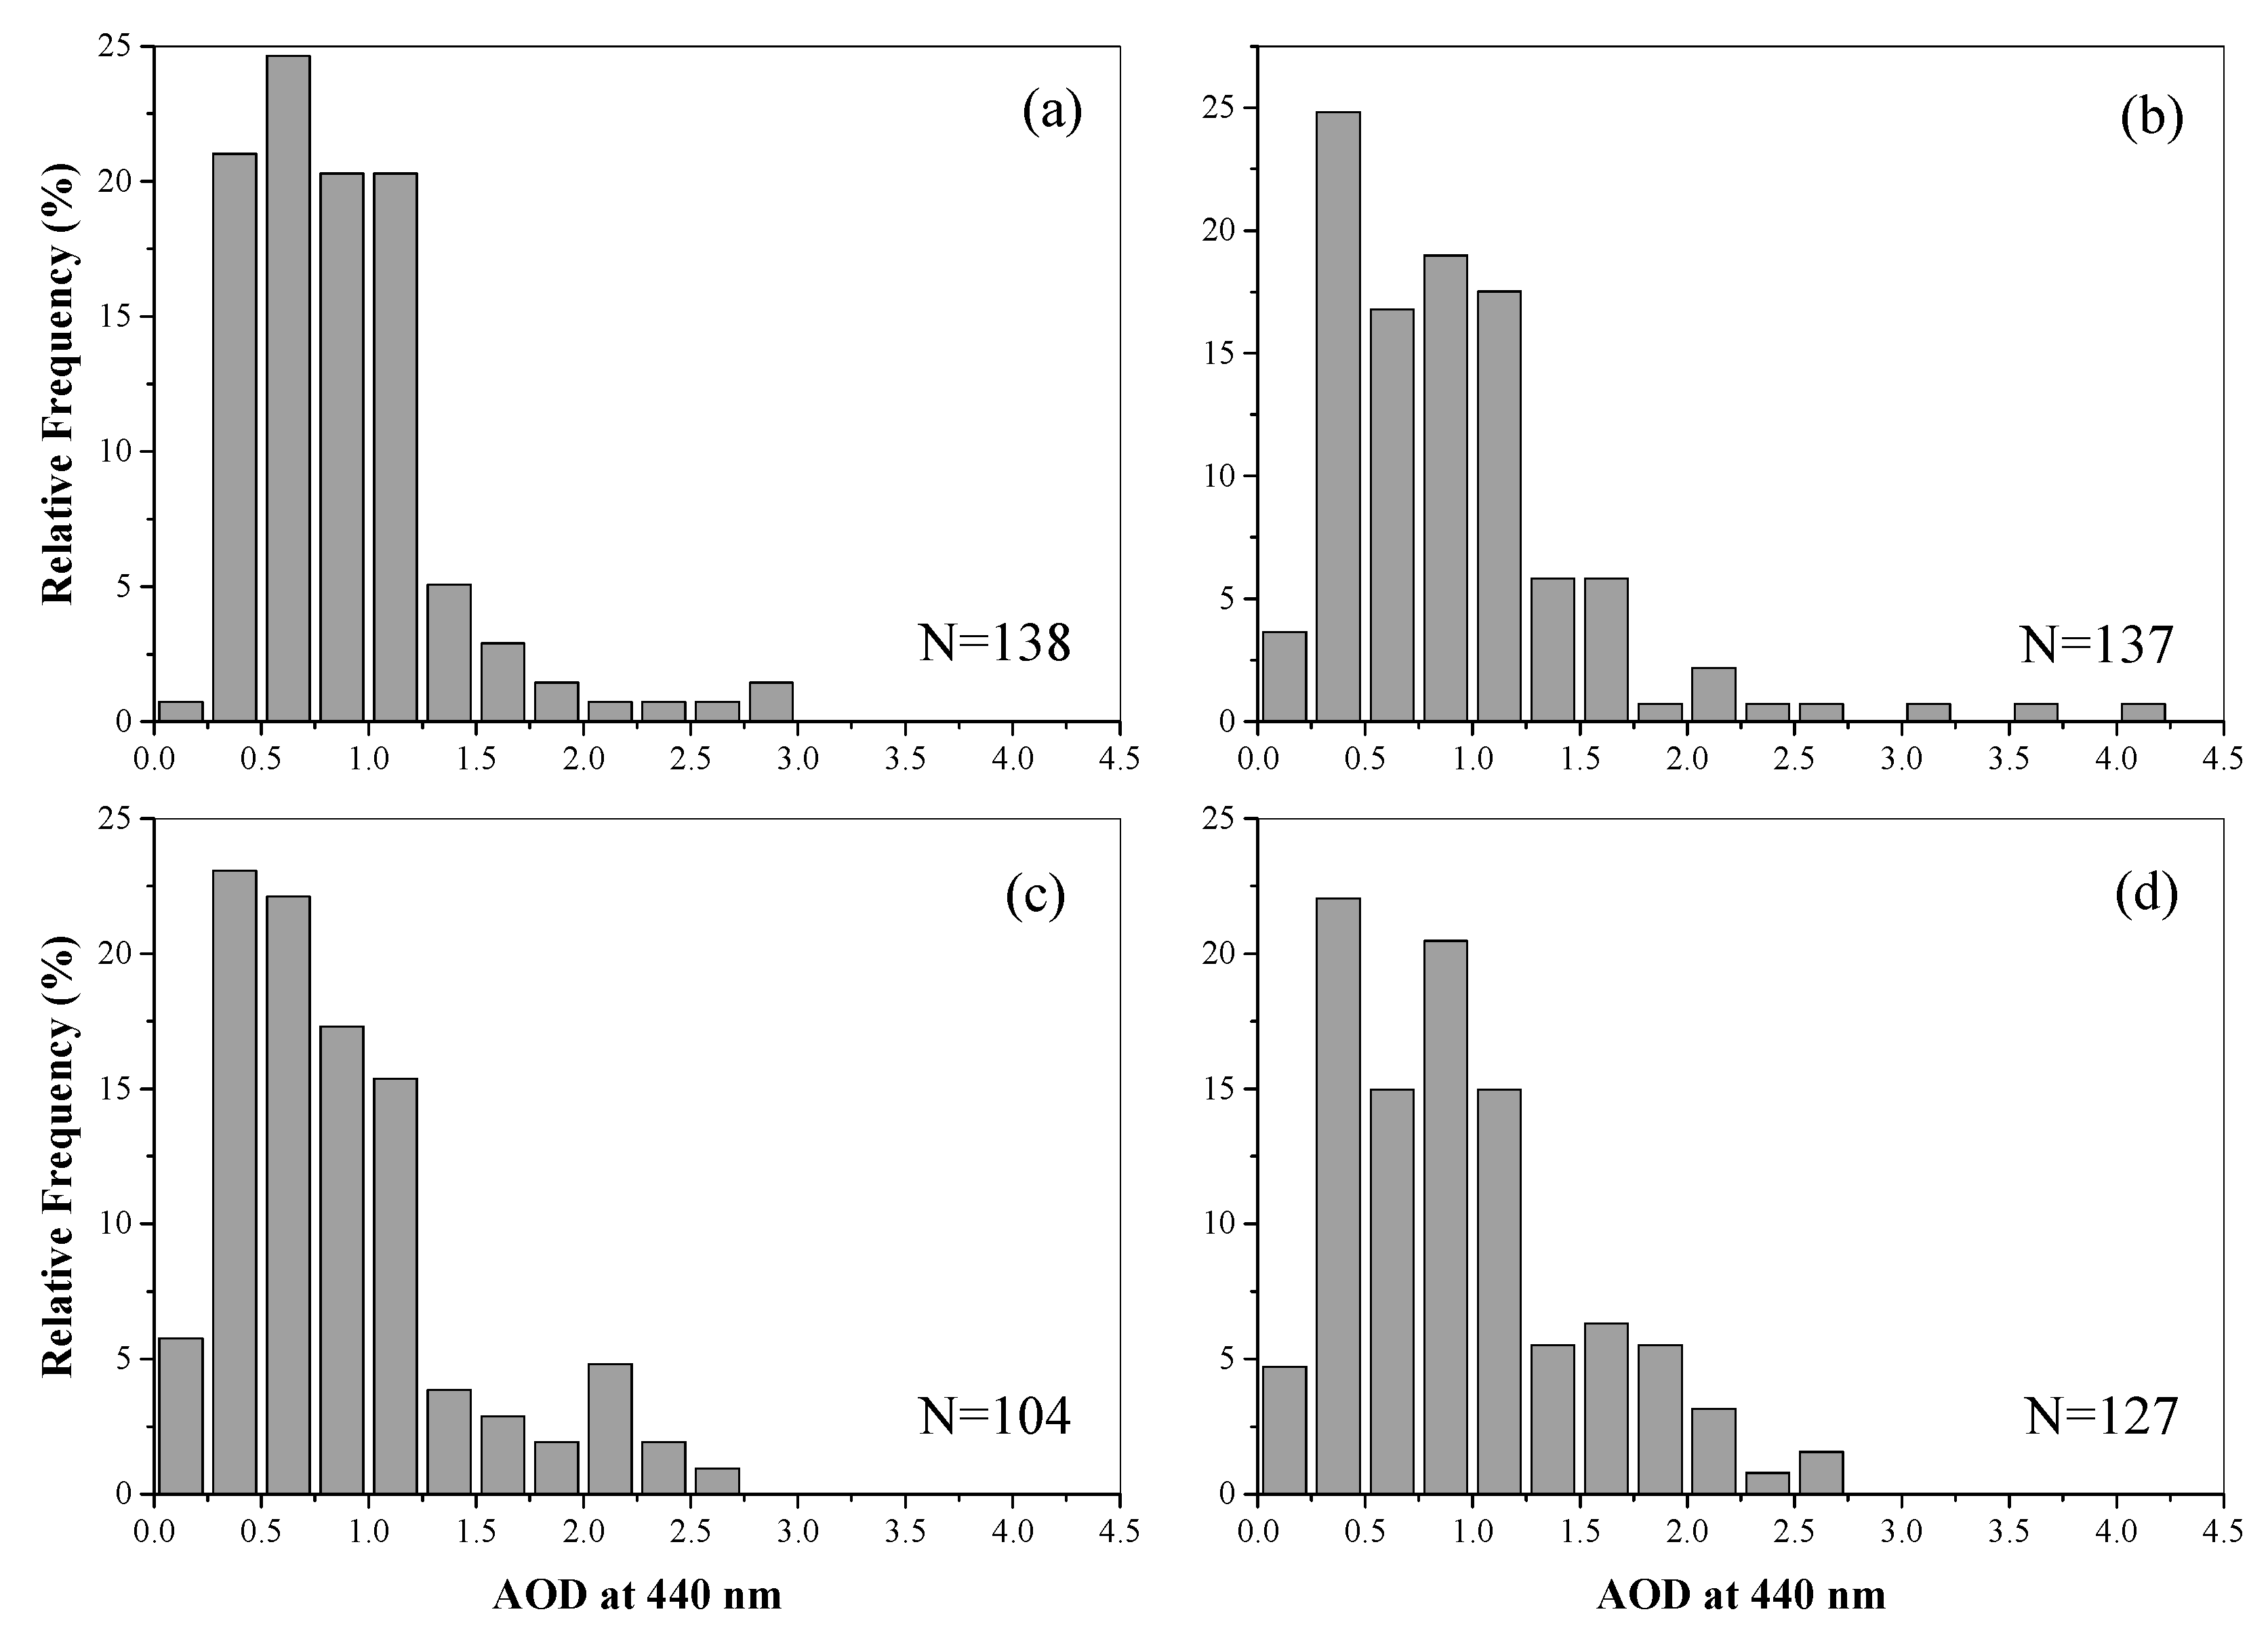
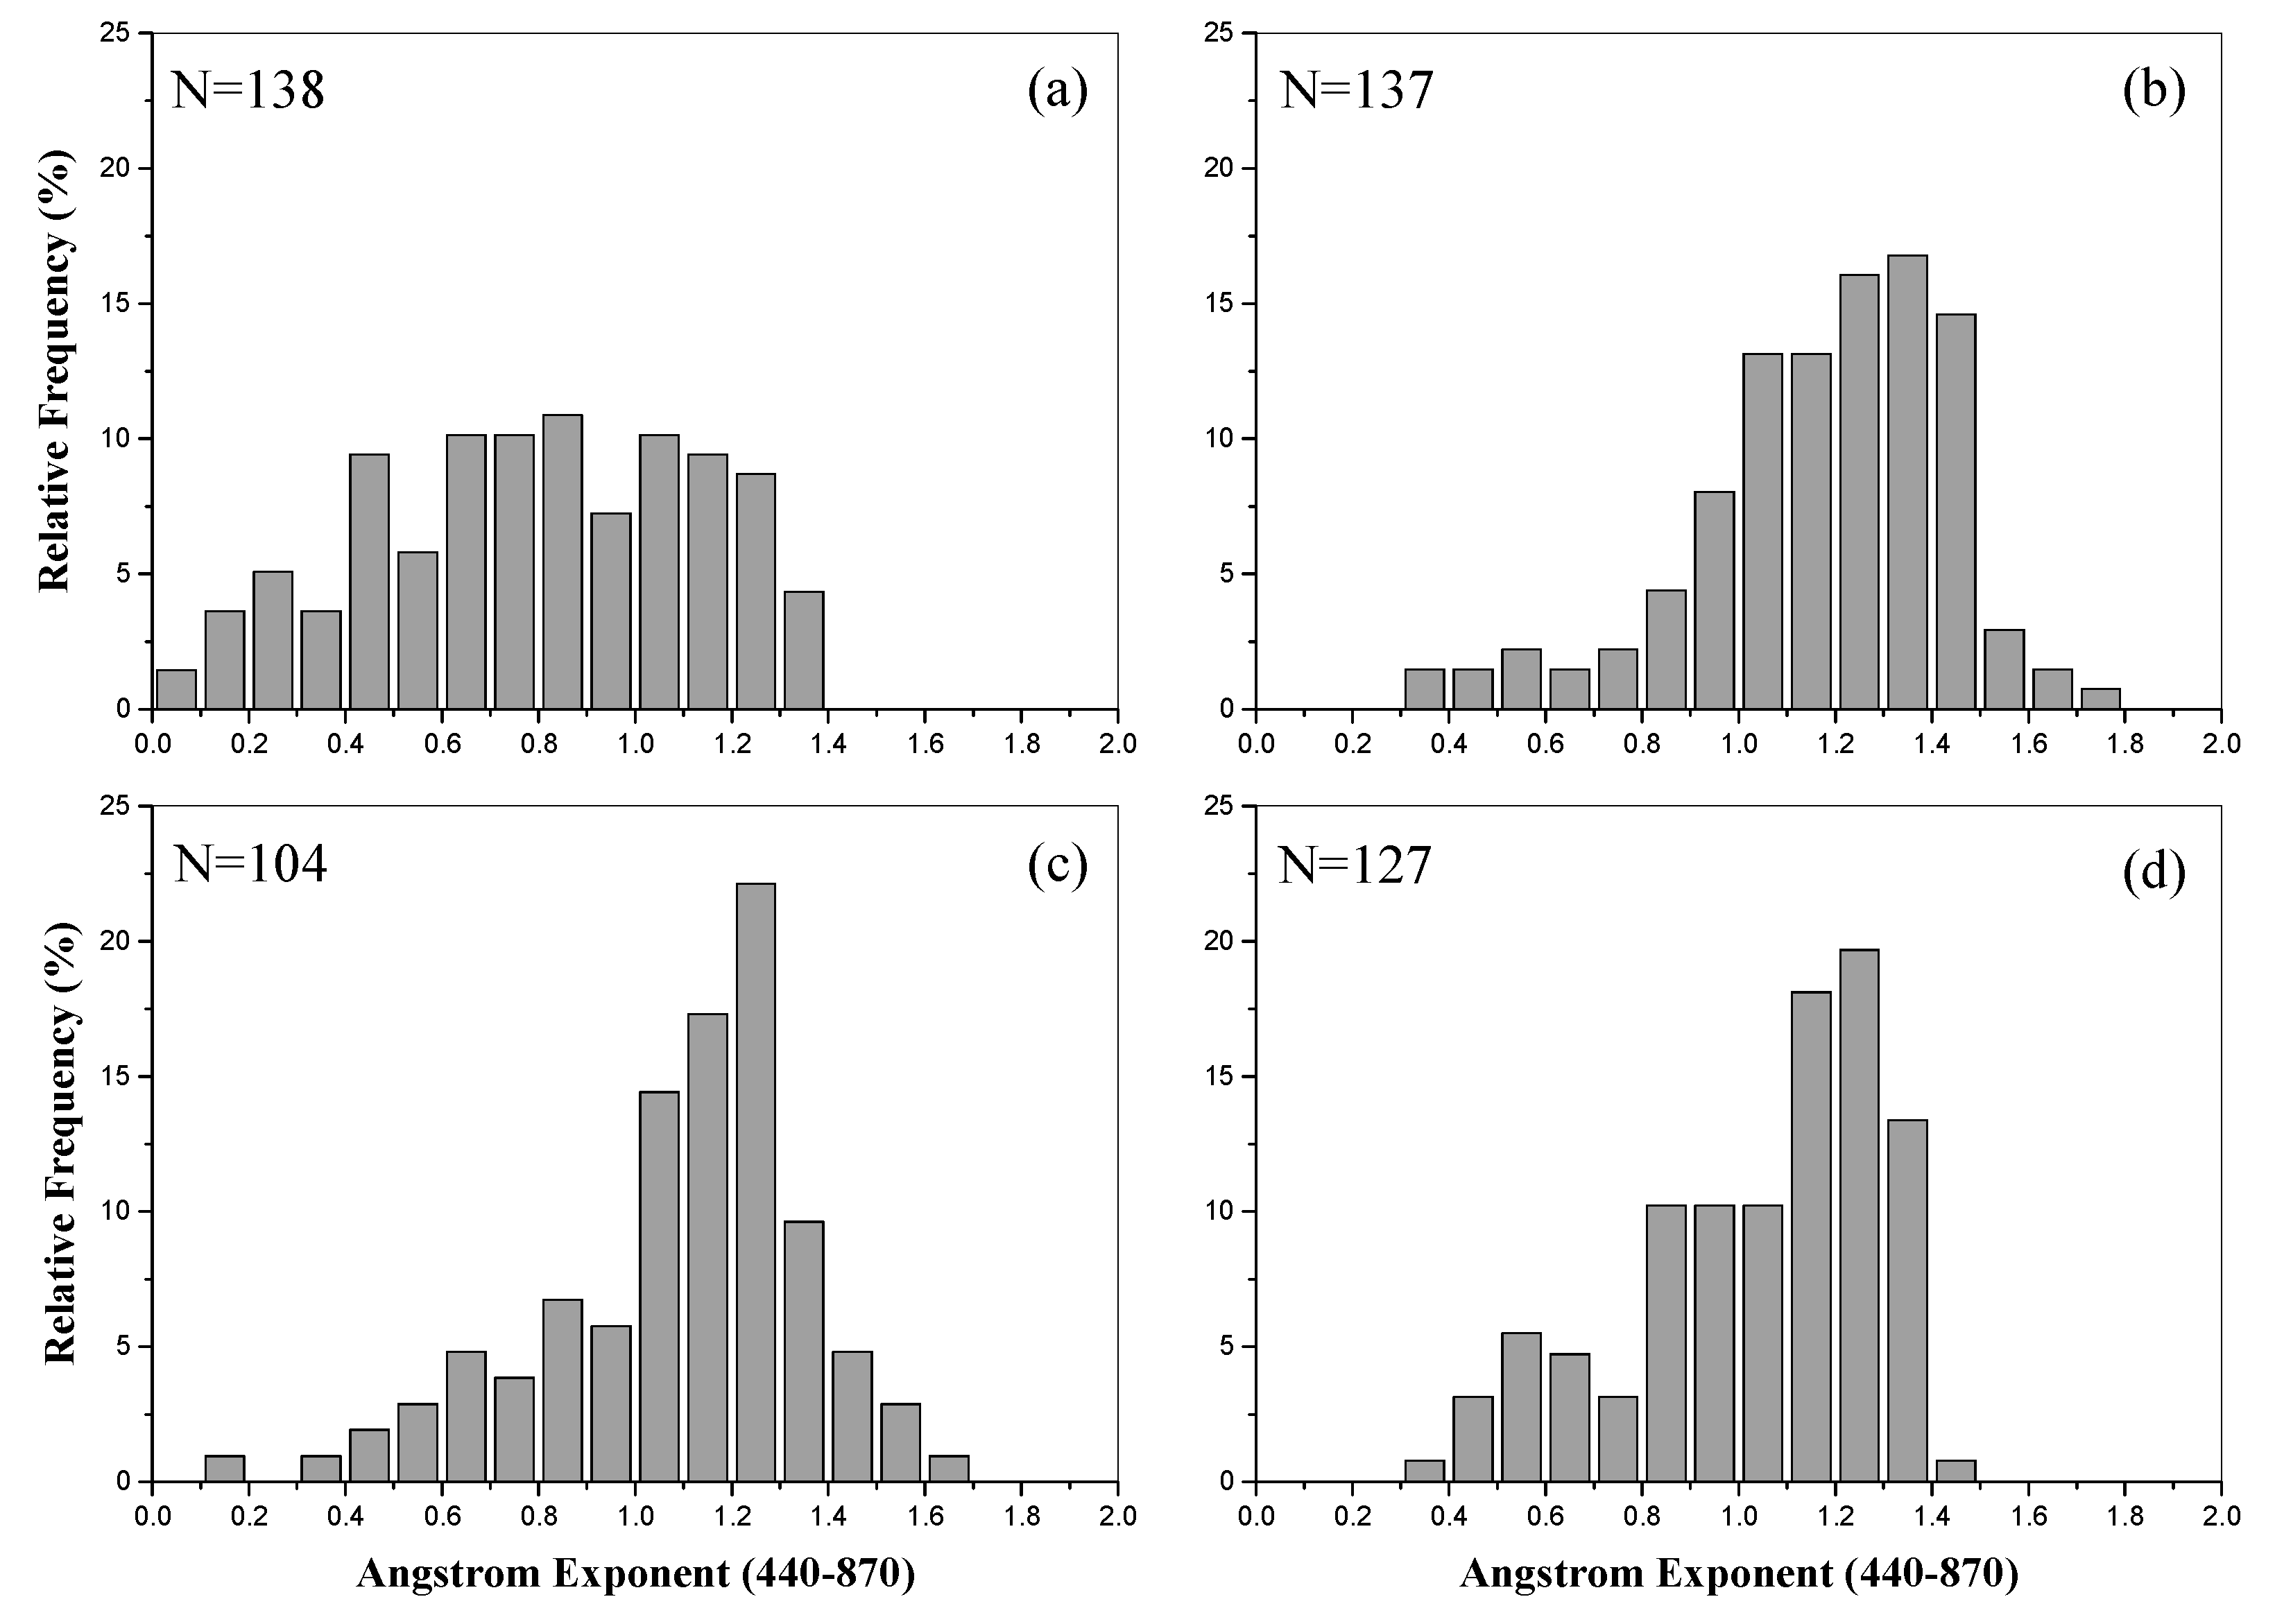
3.1. Aerosol Optical Depth, Ångstrom Exponent, and Columnar Water Vapor

Aerosol optical depth (AOD) and AE are the most important aerosol parameters derived from direct solar radiation measurements. Aerosol optical depth, the integral of the extinction coefficient from surface to the top of the atmosphere, reflects the total aerosol loading in a vertical atmospheric column of unit cross-section; whereas AE, a parameter describing the spectral dependence of AOD, is an indicator of particle size. A smaller AE represents the dominance of coarse mode particles and vice versa. Three-year average of AOD440 in Xi’an is about 0.88 ± 0.24 (mean ± SD), which is close to the measurements reported in Nanjing (0.88) [58]. However, it is much higher not only than that in background sites, such as Xinglong (0.28) [27] and Longfengshan (0.35) [31], but also than that over some urban or industrial regions, such as Beijing (0.71) [16] and Shanghai (0.74) [59]. According to Li et al. [49], AOD in Xi’an was only second to that of Chengdu in the sixteen sites of SONET. The high AOD in Xi’an implies the heavy aerosol loading in this region, which might be caused by industrial pollution, human activities, and urban transportation. The multi-year averaged AE is about 1.02 ± 0.15, rather comparable to those in Beijing (1.06) [49], suggesting the dominance of fine-mode particles.
Monthly and seasonal averages of AOD at 440 nm, AE at 440–870 nm, and CWV (in cm) over Xi’an from May 2012 to June 2015 are shown in Figure 2. The error bars in the left panel (Figure 2a,c,e) denote the inter-annual variation of monthly averages, while the daily median and mean values are given by different symbols in the box plots on the right (Figure 2b,d,f), along with the maximum and minimum. Aerosol optical depth shows a pronounced monthly variation, with maximum values in February (1.36) and August (1.17), and minima in June (0.59) and December (0.63). The higher AOD in August may be attributed to the conversions of gaseous species to particulates promoted by the higher temperatures and more abundant water vapors in summer. However, the wet deposition and scavenging of particles due to the frequent and plentiful rainfall probably resulted in a lower AOD in June, another summer month. As for winter, the increase of emissions due to residential heating might generate more particles and lead to higher AOD in February, while the lower AOD in December is possibly related with the scavenging effect of the dry and cold air in winter. The conjunction of maxima and minima in the same season (summer and winter) reveals the high variability and the complexity in aerosol loading in Xi’an, and results in similar averages of AOD in different seasons. The averaged AOD in winter is about 0.99 ± 0.36, slightly higher than those in other seasons (~0.85). The frequency distributions of AOD440 also show a similar unimodal structure in different seasons, but with a different range (Figure A1). For summer, daily AOD varies from 0.1 to 4.1, while the maxima in the other seasons are around 2.7. The relative frequencies of AOD < 0.5 are 22%, 28%, 29%, and 27% from spring to winter. The frequencies of AOD in the range of 0.5–1.0 are 45%, 36%, 39%, and 35% for each season. For high AOD (>1.0), the frequencies are 33%, 36%, 32%, and 38% in spring, summer, autumn, and winter. Especially in summer, about 6% of daily AOD appeared in the range of 2.0 and 4.0. These results indicate that high AOD occurred all year in Xi’an. The maximum of AOD appeared in summer. This is possibly related to the hygroscopic growth of aerosols and air stagnation.
Compared with AOD, monthly and seasonal AE show different features. The monthly AEs did not vary as significantly as AOD did, but present an obvious seasonal variation. Monthly AE were normally larger than 1.0 in summer, autumn, and winter, with the highest value in September (1.24). The lowest AE occured in spring (~0.85), implying the significant impact of dust episodes on aerosol size distribution. Figure A2 shows the seasonal frequency distributions of AE at 440–870 nm in Xi’an. Similar to the AOD frequency distribution, the histograms of AE also presented a unimodal structure. The peak values distributed between 1.2 and 1.3 in most seasons except spring, when the monthly AE centered at 0.8–0.9. Daily AE fluctuated in the range of 0–1.8, suggesting that there were different sizes of aerosol particles in the atmosphere. For AE < 0.5, the relative frequency of AE was about 23% in spring, much higher than that in other seasons (<4%). High frequency of low AE values in spring indicates the influence of coarse dust particles. The frequencies of AE > 1.0 are about 33%, 79%, 72%, and 63% from spring to winter, respectively. Monthly and seasonal variations of CWV are also provided in Figure 2e,f. High values of monthly CWV occur in July, August, and June, resulting in the maximum average of CWV in summer (3.63 ± 0.89 cm). In contrast, the lowest CWV appears in winter (0.68 ± 0.16).

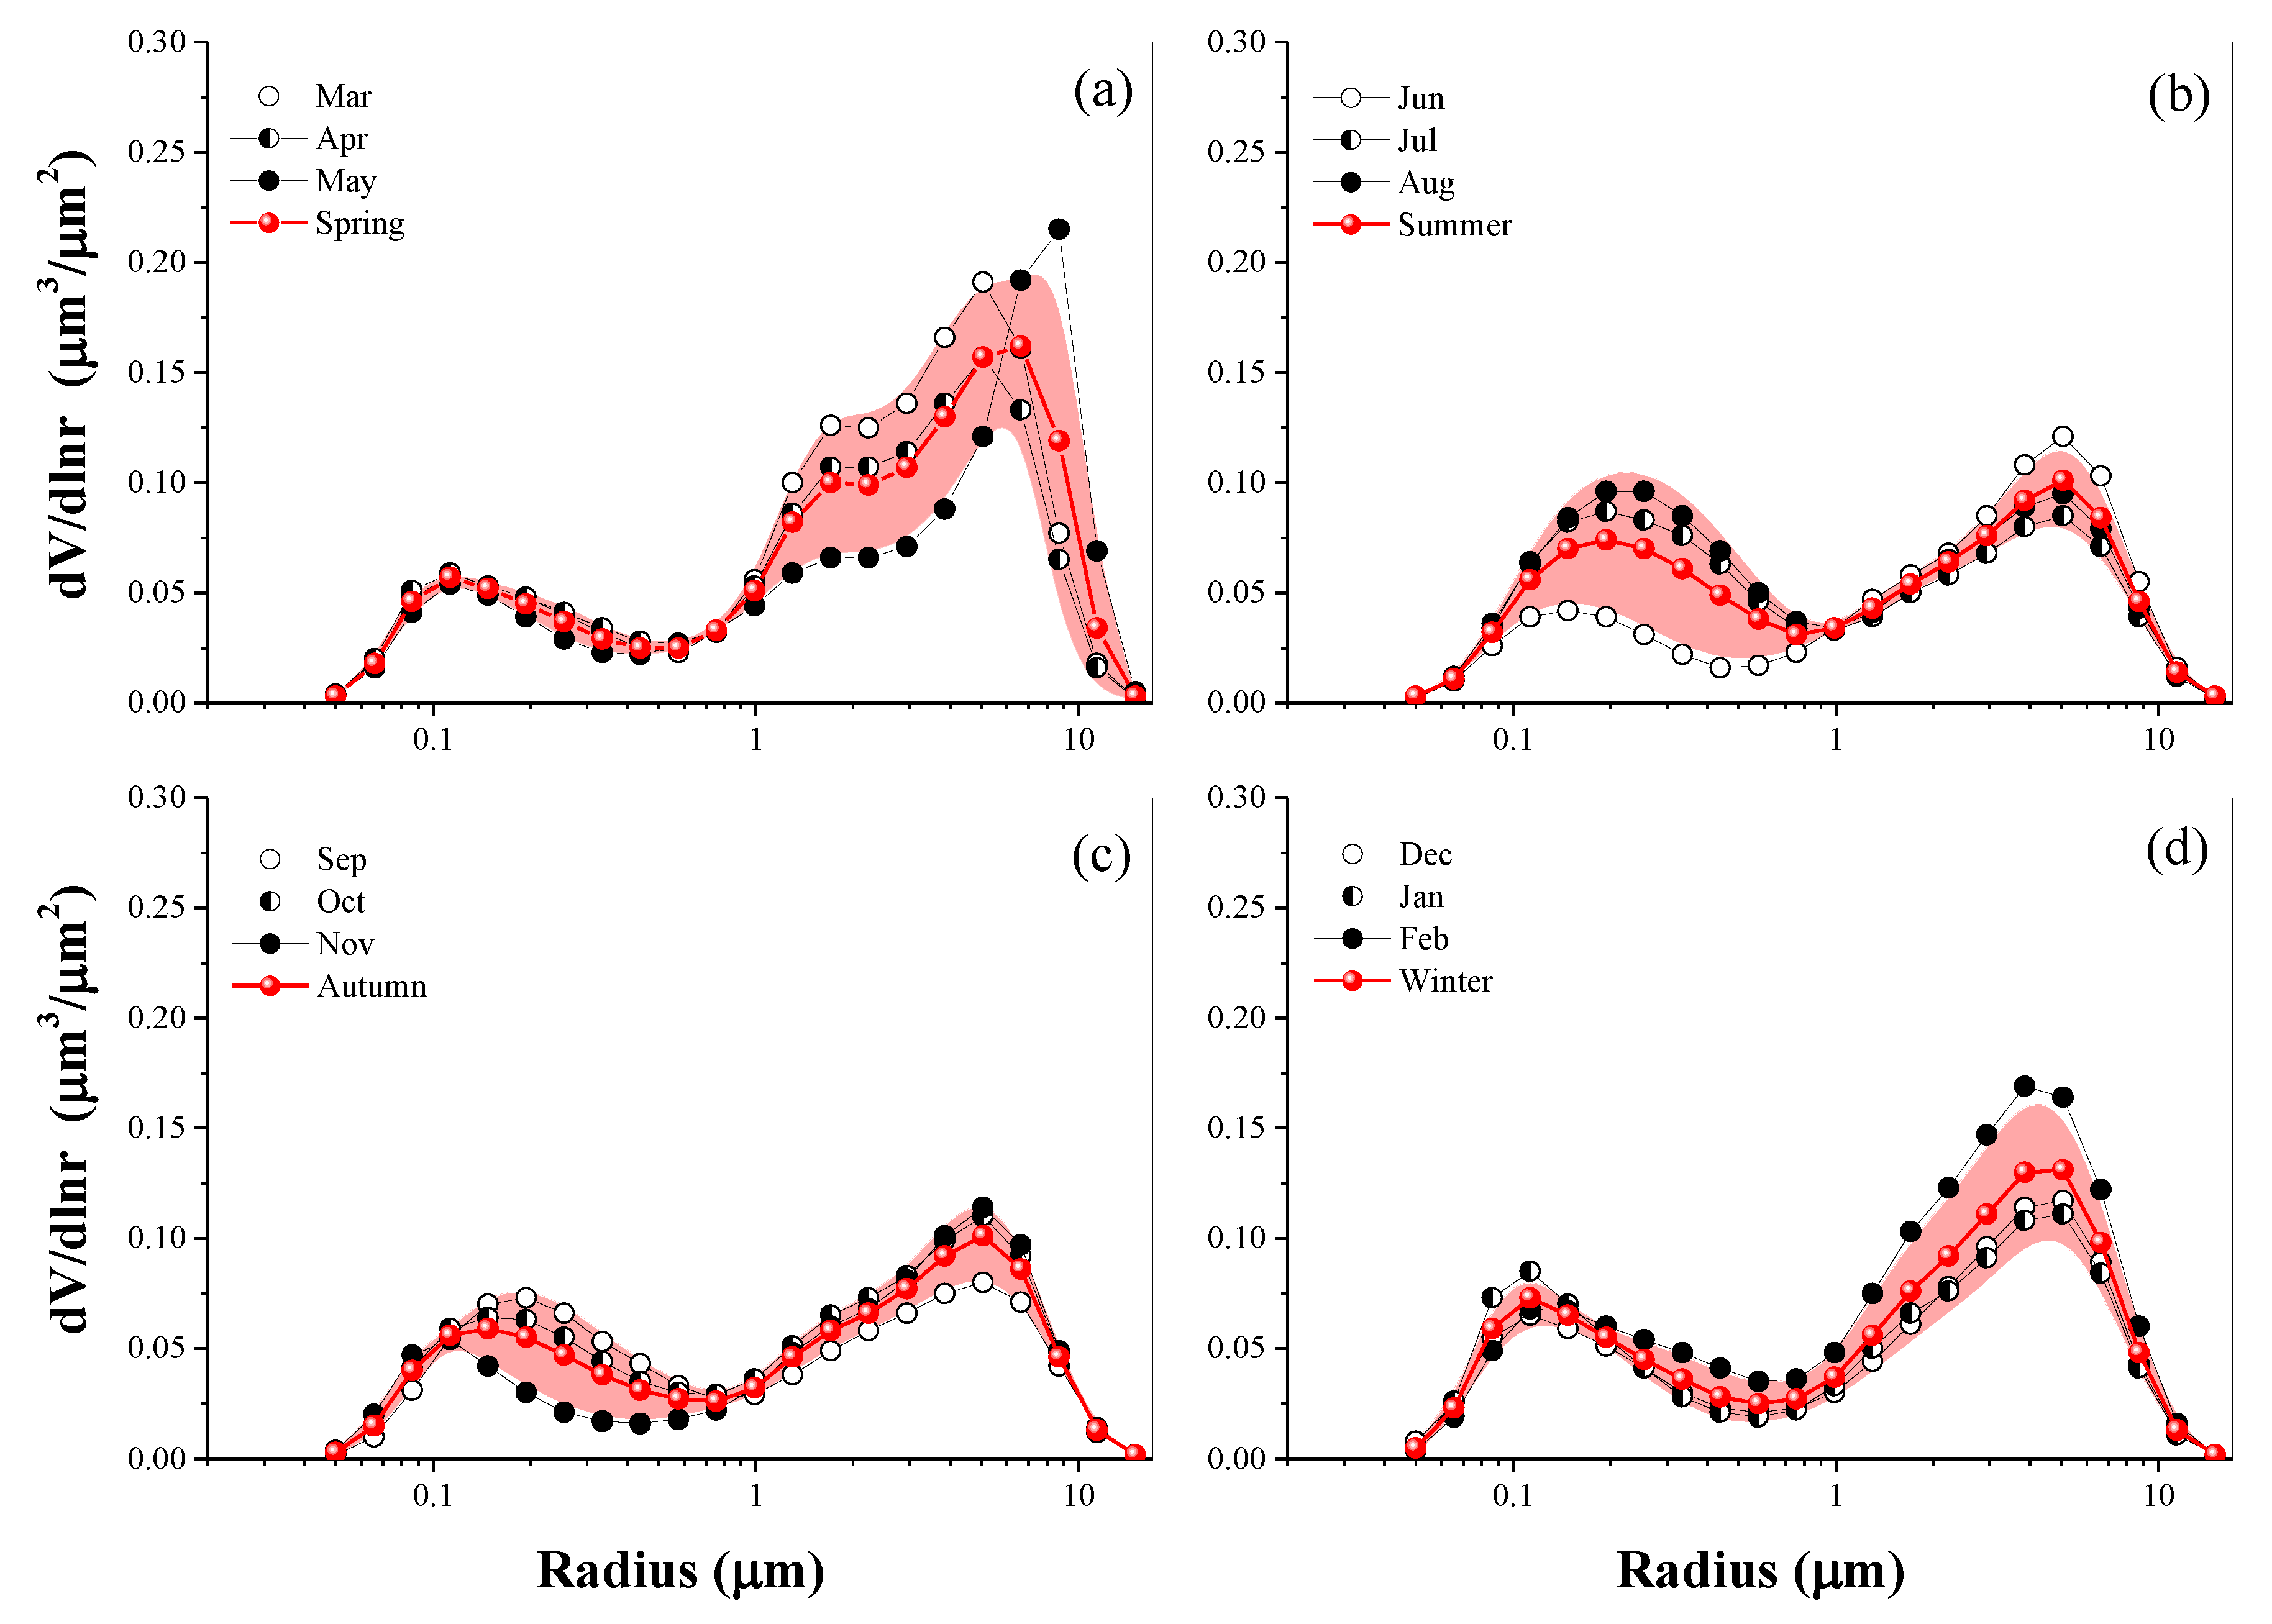
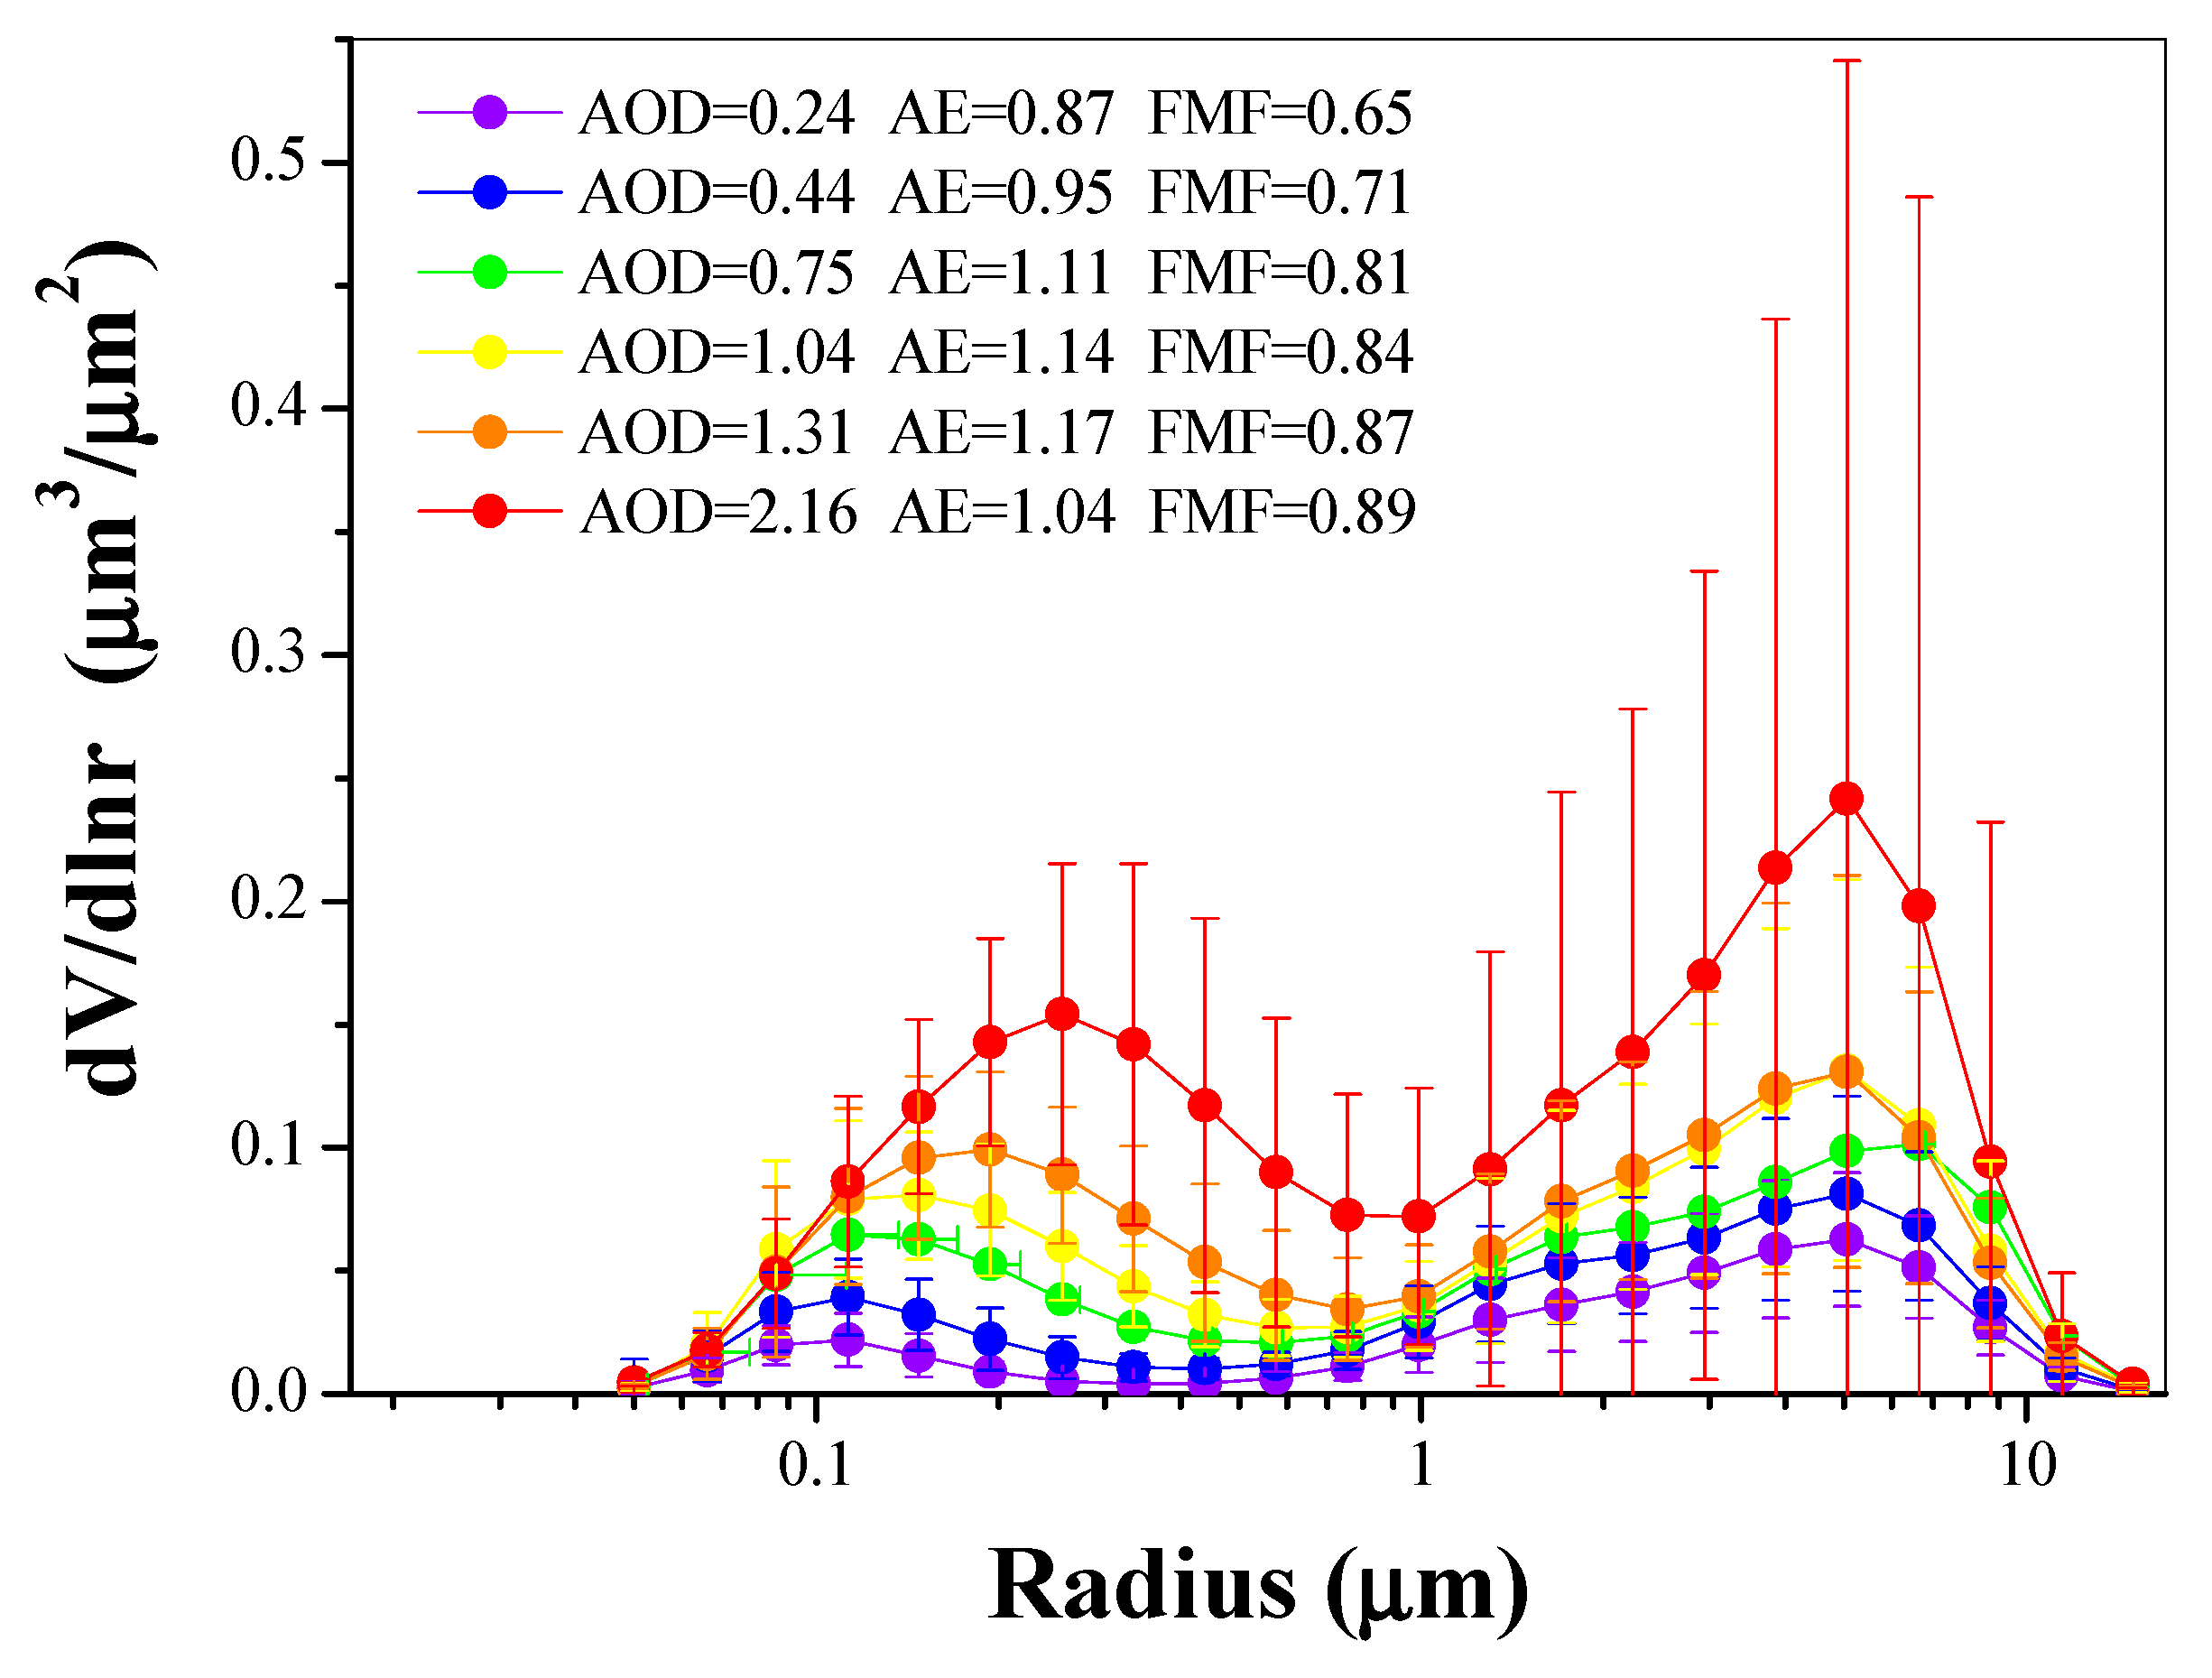
3.2. Volume Particle Size Distribution

Figure 3 shows the monthly and seasonal averages of VPSD in Xi’an. The typical bimodal or multimodal structures of the VPSD in all the months or seasons imply a fine-coarse mixed-size distribution in this region, similar to the urban-industrial site Beijing [13]. The retrieved total volume concentration was highest in spring (0.38 ± 0.03 μm3/μm2), followed by winter, summer, and the lowest in autumn (0.28 ± 0.02 μm3/μm2). Moreover, the dominance of coarse mode in size distribution can be observed in all seasons, especially in spring. This can be explained by local dust by traffic and construction all year round [60], and abundant dust particles transported from remote sources during the frequent dust episodes in spring [41]. However, fine-mode volume concentrations in four seasons were all around 1.00 μm3/μm2, illustrating a typical densely-populated site feature. Another noticeable feature was that extra peaks can be observed in coarse mode of VPSDs for all spring months. According to Zhang et al. [61], the extra coarse modal peaks are probably related to the wet scavenging effects on dust-like particles in coarse mode or the aging of transported activated particles with radius <1 μm [62]. Another possibility might be the mixture effect of local and transported coarse mode particles in this season. Additionally, the fine-mode effective radius in summer was much larger than that in other seasons, which is associated with coagulation or hygroscopic growth of fine mode particles and lead to enhanced scattering of aerosols.
Averages of VPSD were calculated for different AOD440 bins, ranging from 0.00 to 4.00 with an interval of 0.3, to detect the relationship between VPSD and AOD (Figure 4). The mean values of AOD, AE, and FMF (fine mode fraction) were also provided for the given bin. As shown in Figure 4, the size distributions still presented bimodal patterns, but the mean center radius of both fine and coarse modes increased with AOD. The increase of the center radius in fine mode might be related to the hygroscopic growth, while the increasing center radius in coarse mode is possibly associated with the addition of coarse particles, such as dust aerosol. Note that FMF is about 0.89 for the cases with high AOD (>1.5), which suggests the dominant contribution of fine mode particles to the total AOD. However, the corresponding VPDS shows a dominance of coarse mode to the total volume concentrations. This is because the particle number and extinction efficiency of coarse mode particles, such as dust, may not be as much as fine particles, although their sizes are much larger.

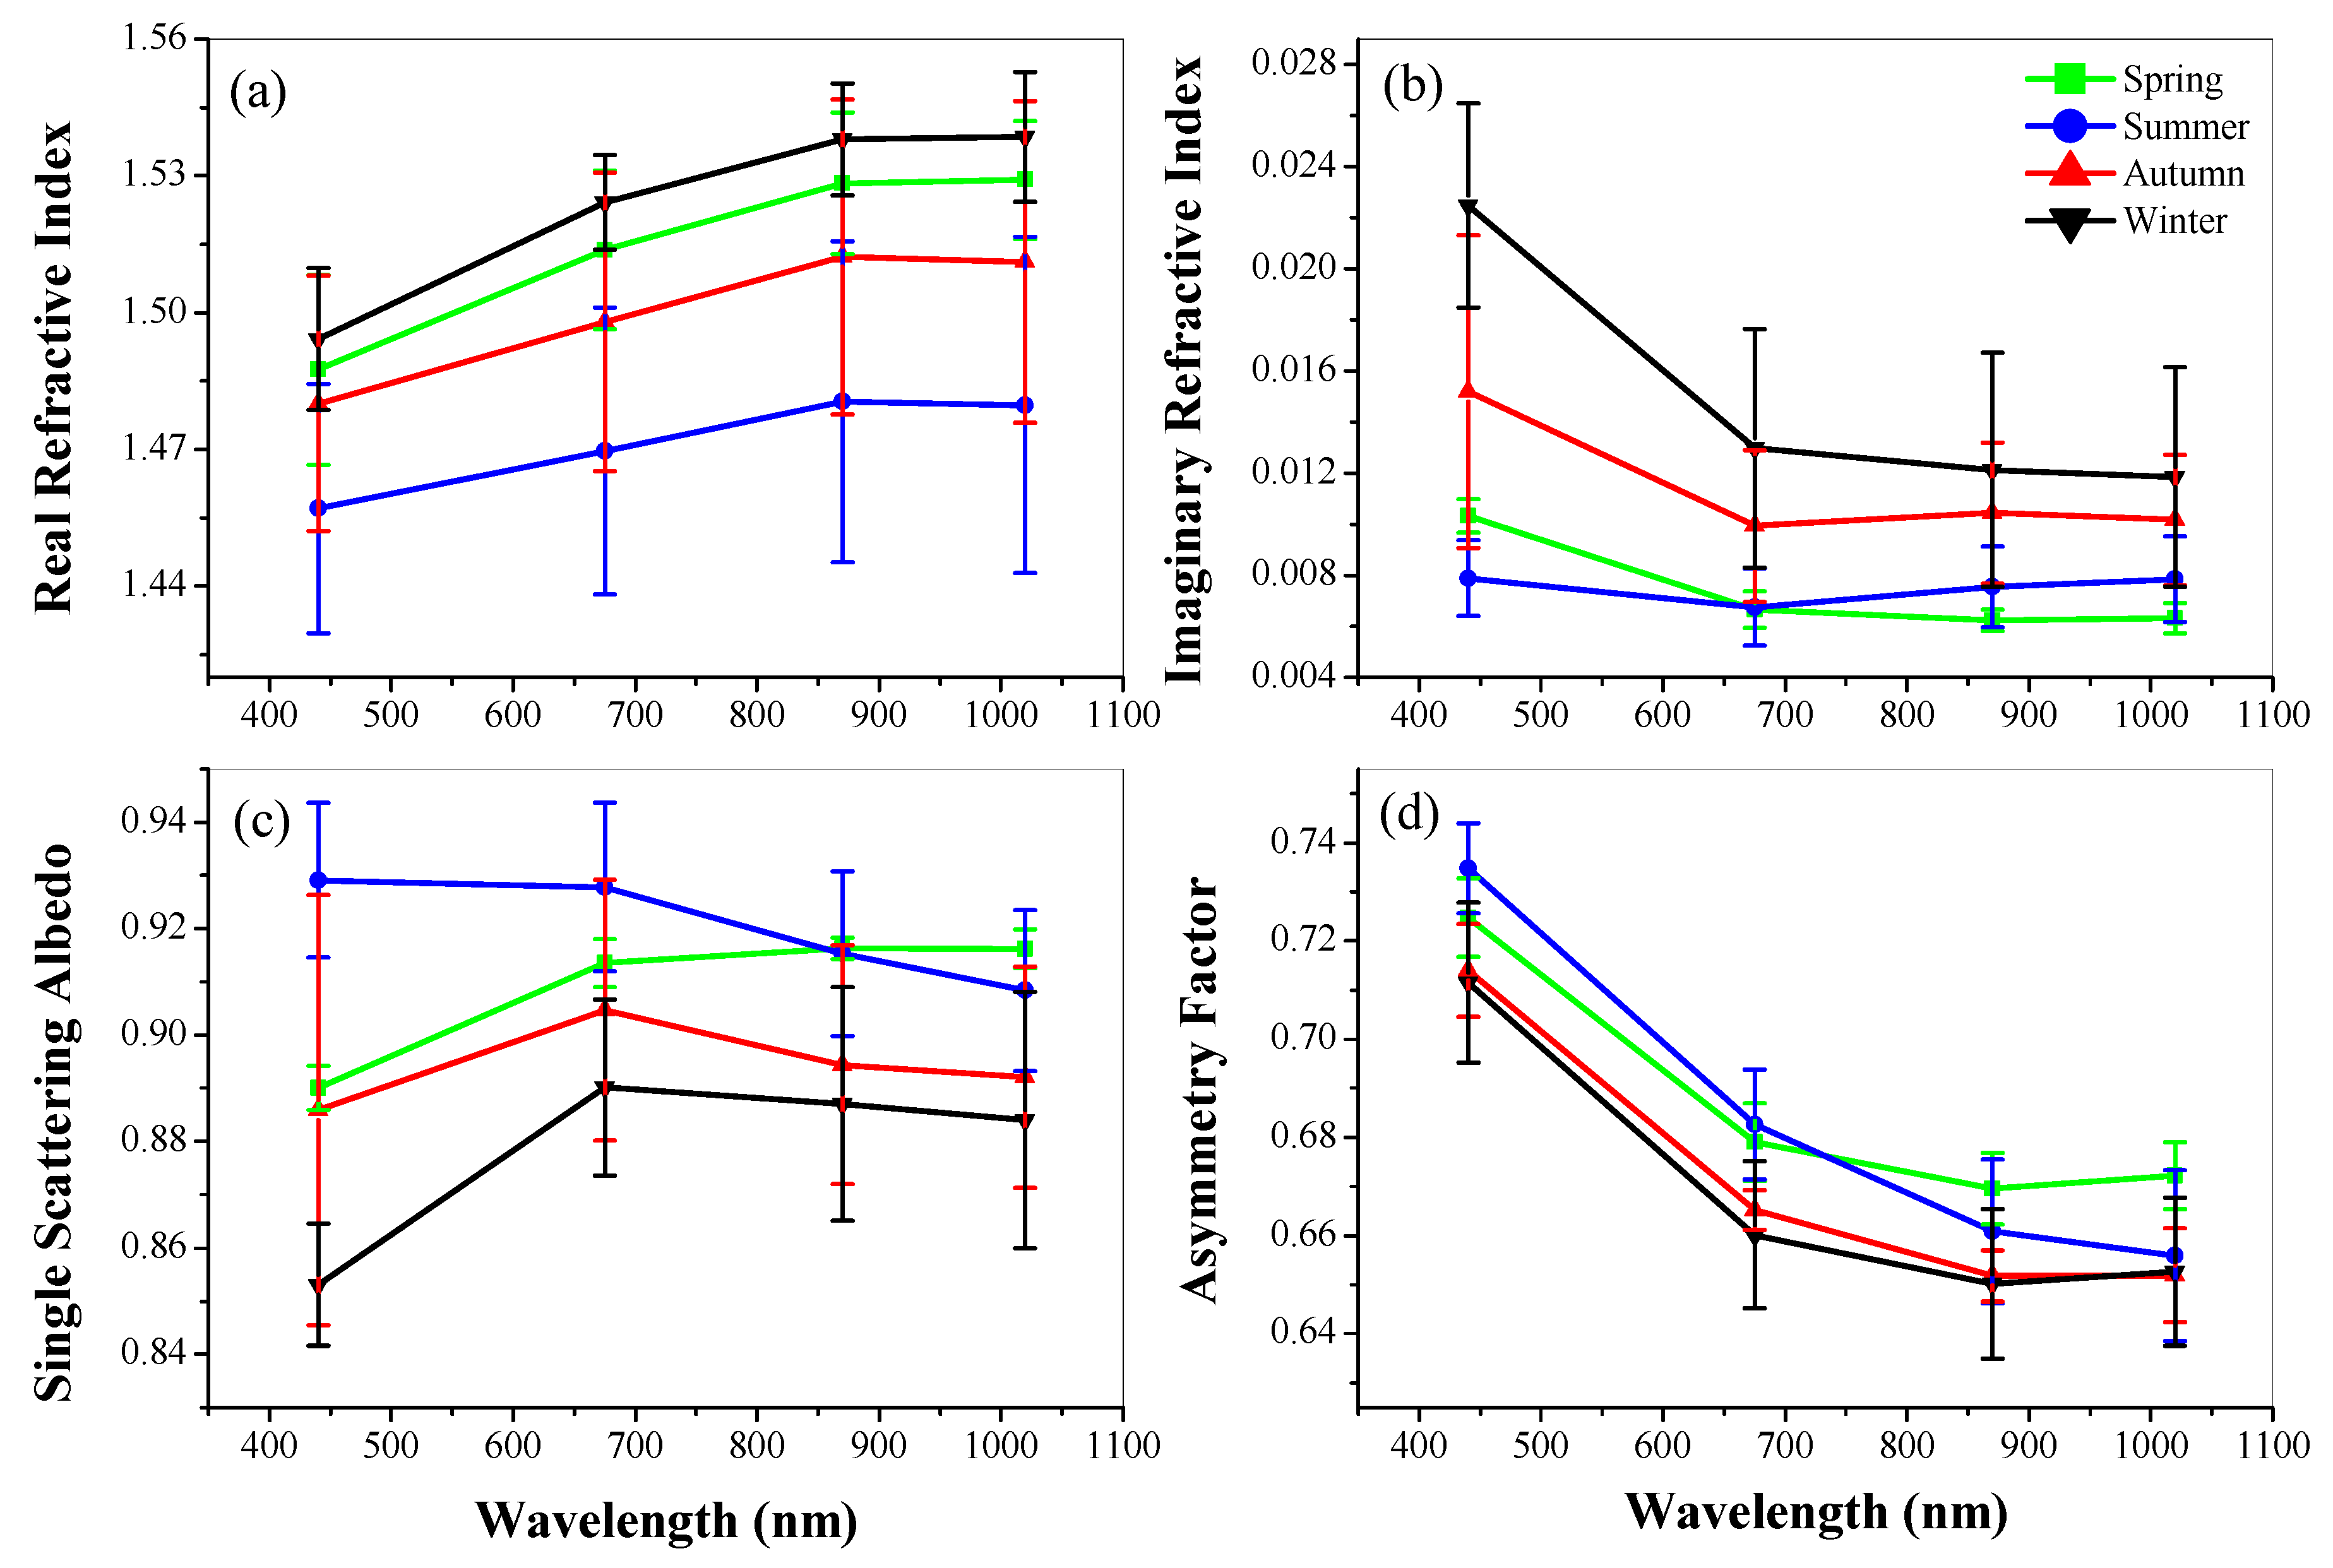
3.3. Complex Refractive Index, Single Scattering Albedo, and Asymmetry Factor

Seasonal averages of spectral RI, SSA, and asymmetry factor in Xi’an are presented in Figure 5. The real and imaginary parts of RI indicate the scattering and absorbing efficiencies of aerosol, respectively. Real RI shows significant seasonal variations, reaching to the highest value in winter and showing its minimum in summer. This can be attributed to the different contents of aerosol water. The real RI of dry particles (normally distributed within 1.45–1.70) is much higher than that of water (1.33), so real RI reflects the water uptake of aerosols to some extent [63]. Therefore, the real RI generally shows high values in the dry season (e.g., winter in Xi’an) and low values in the wet season (e.g., summer in Xi’an). The spectral dependence of real RI is not very obvious. For example, the averaged real RIs at four wavelength in summer are 1.46 ± 0.03, 1.47 ± 0.03, 1.48 ± 0.03, and 1.48 ± 0.03, respectively. In contrast, the imaginary RI reflects absorption of aerosol and a high imaginary RI probably indicates stronger aerosol absorption. Seasonal imaginary RIs decrease drastically in the wavelength range 440–670 nm, and then increase slightly from 670 nm to 1020 nm in summer and autumn, but almost keep the same value in spring and winter. The imaginary parts are higher in winter and autumn than those in spring and summer. Similar seasonal variation has also been observed in Beijing [16], but is quite different from the results in Shanghai [59]. Overall, the averages of imaginary RI at 440 nm are 0.010 ± 0.001, 0.008 ± 0.001, 0.015 ± 0.006, and 0.022 ± 0.004 from spring to winter, respectively. These results indicate that the aerosol particles in winter and autumn over Xi’an are more absorptive to solar radiation than in summer and spring.
Single scattering albedo is one of the key determinants of the radiative effects of the atmospheric aerosol. Defined as the ratio of scattering efficiency of the aerosols to their total extinction efficiency, it provides important information regarding scattering and absorption properties and depends greatly on aerosol composition and mixing states. The three-year average of SSA at 440 nm is about 0.89 ± 0.03, smaller than other reported measurements of desert dust sites (mostly larger than 0.90), illustrating the strong absorptivity of this site. We primarily attribute this to the absorbing aerosol from anthropogenic sources in this city, especially in winter, as well as the higher content level of absorbing hematite or other iron oxides in the dust aerosol at this site. Generally, SSA in summer is the largest (0.93 ± 0.01), attributed to the scattering aerosol and complicated mixing states, while SSA in winter and autumn is much lower because the carbonaceous particles emitted from the city heat and other anthropogenic sources during this period enhance the aerosol absorption. The spectral dependency of SSA also shows a significant seasonal variation. In autumn and winter, SSA increases with wavelength from 440 to 670 and decreases slightly from 670 to 1020 nm, which indicates the presence of brown carbon. In contrast, SSA in spring follows an increasing pattern from 440–670 nm, but continues to increase or stabilized between 670 and 870 nm. As demonstrated in Wang et al. [64], this type of SSA spectra pattern was an indication that mineral dust dominates the aerosols population. Additionally, SSA shows a spectra pattern in summer, which is completely different from other seasons. It decreases from 440 to 1020 nm, and this can be attributed to the existence of fine particles.
The asymmetry parameter represents an estimation of the asymmetry distribution of the dispersed radiation. The seasonal variation of asymmetry factor spectra in Xi’an is shown in Figure 5d. The average values of asymmetry factor commonly show a decreasing trend with wavelengths in summer, autumn, and winter. Except the decrease at 440–870 nm, the average values of asymmetry factor show an increasing trend at 870–1020 nm in spring. This result is similar to the measurements at Beijing and Lanzhou [65] in dusty days. The average values of asymmetry factor in spring and summer are larger than the values in autumn and winter. Its multi-year average value at 440 nm is up to 0.72 ± 0.01, almost the same as the measurement in Lanzhou [65]. In the view of climate, the averages of asymmetry factor in the wavelength range of 440–1020 nm were 0.69 ± 0.03, 0.68 ± 0.04, 0.67 ± 0.03, and 0.67 ± 0.03 in spring, summer, autumn, and winter, respectively.
Along with AOD, AE, and volume concentrations analyzed above, seasonal SSA and some related parameters are summarized in Table 2, including aerosol absorption optical depth (AAOD) and Absorption Ångström Exponent (AAE). Aerosol absorption optical depth is calculated from AOD multiplied by (1-SSA) for the cases with AOD440 > 0.4, while AAE is computed from AAOD at different wavelengths (440 and 870 nm in this study) by replacing AOD with AAOD according to Equation (2). Aerosol absorption optical depth presents the maximum in winter (0.16 ± 0.00) and shows its minimum in summer (0.07 ± 0.01), with an overall mean of 0.10 ± 0.04. Absorption Ångström Exponent is usually used as an indicator of aerosol composition. For example, AAEs are much higher than one in all seasons except summer, indicating that absorption species other than BC have notable contribution on aerosol absorption. After rejecting the rare dust cases in winter and autumn, AAEs are still significantly higher than one. This suggests that absorbing components such as brown carbon, which has a larger AAE, contribute considerably to aerosol absorption. Brown carbon is mainly originated from human activities related to biomass burning in autumn and winter, such as straw burning after harvest and residential heating. In addition, the high AAE in spring (1.36 ± 0.11) is probably associated with dust particles transported from resource regions, which are regarded as another absorber in the atmosphere.
Note that aerosol optical properties, such as RI, SSA, and AAE, are also affected by its morphology, especially for BC particles [66,67,68]. Recent studies suggested that lacy bare BC presented lower SSA and higher AAE than compact ones [66]. The optical properties of BC even varied with the different evolution stages during its aging according to the results from both theoretical calculations and experimental measurements [68]. However, characteristics of aerosol morphology have rarely been investigated over our studied areas during the past years, so further researches concerning the effects of aerosol morphology on its optical properties will be expected in the coming years.

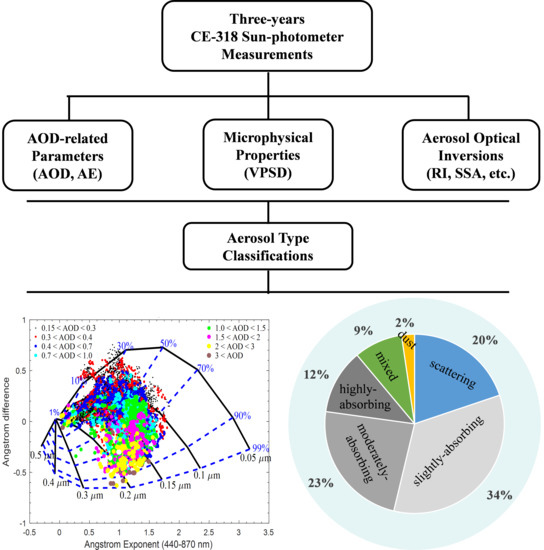
3.4. Classification of Aerosol Types

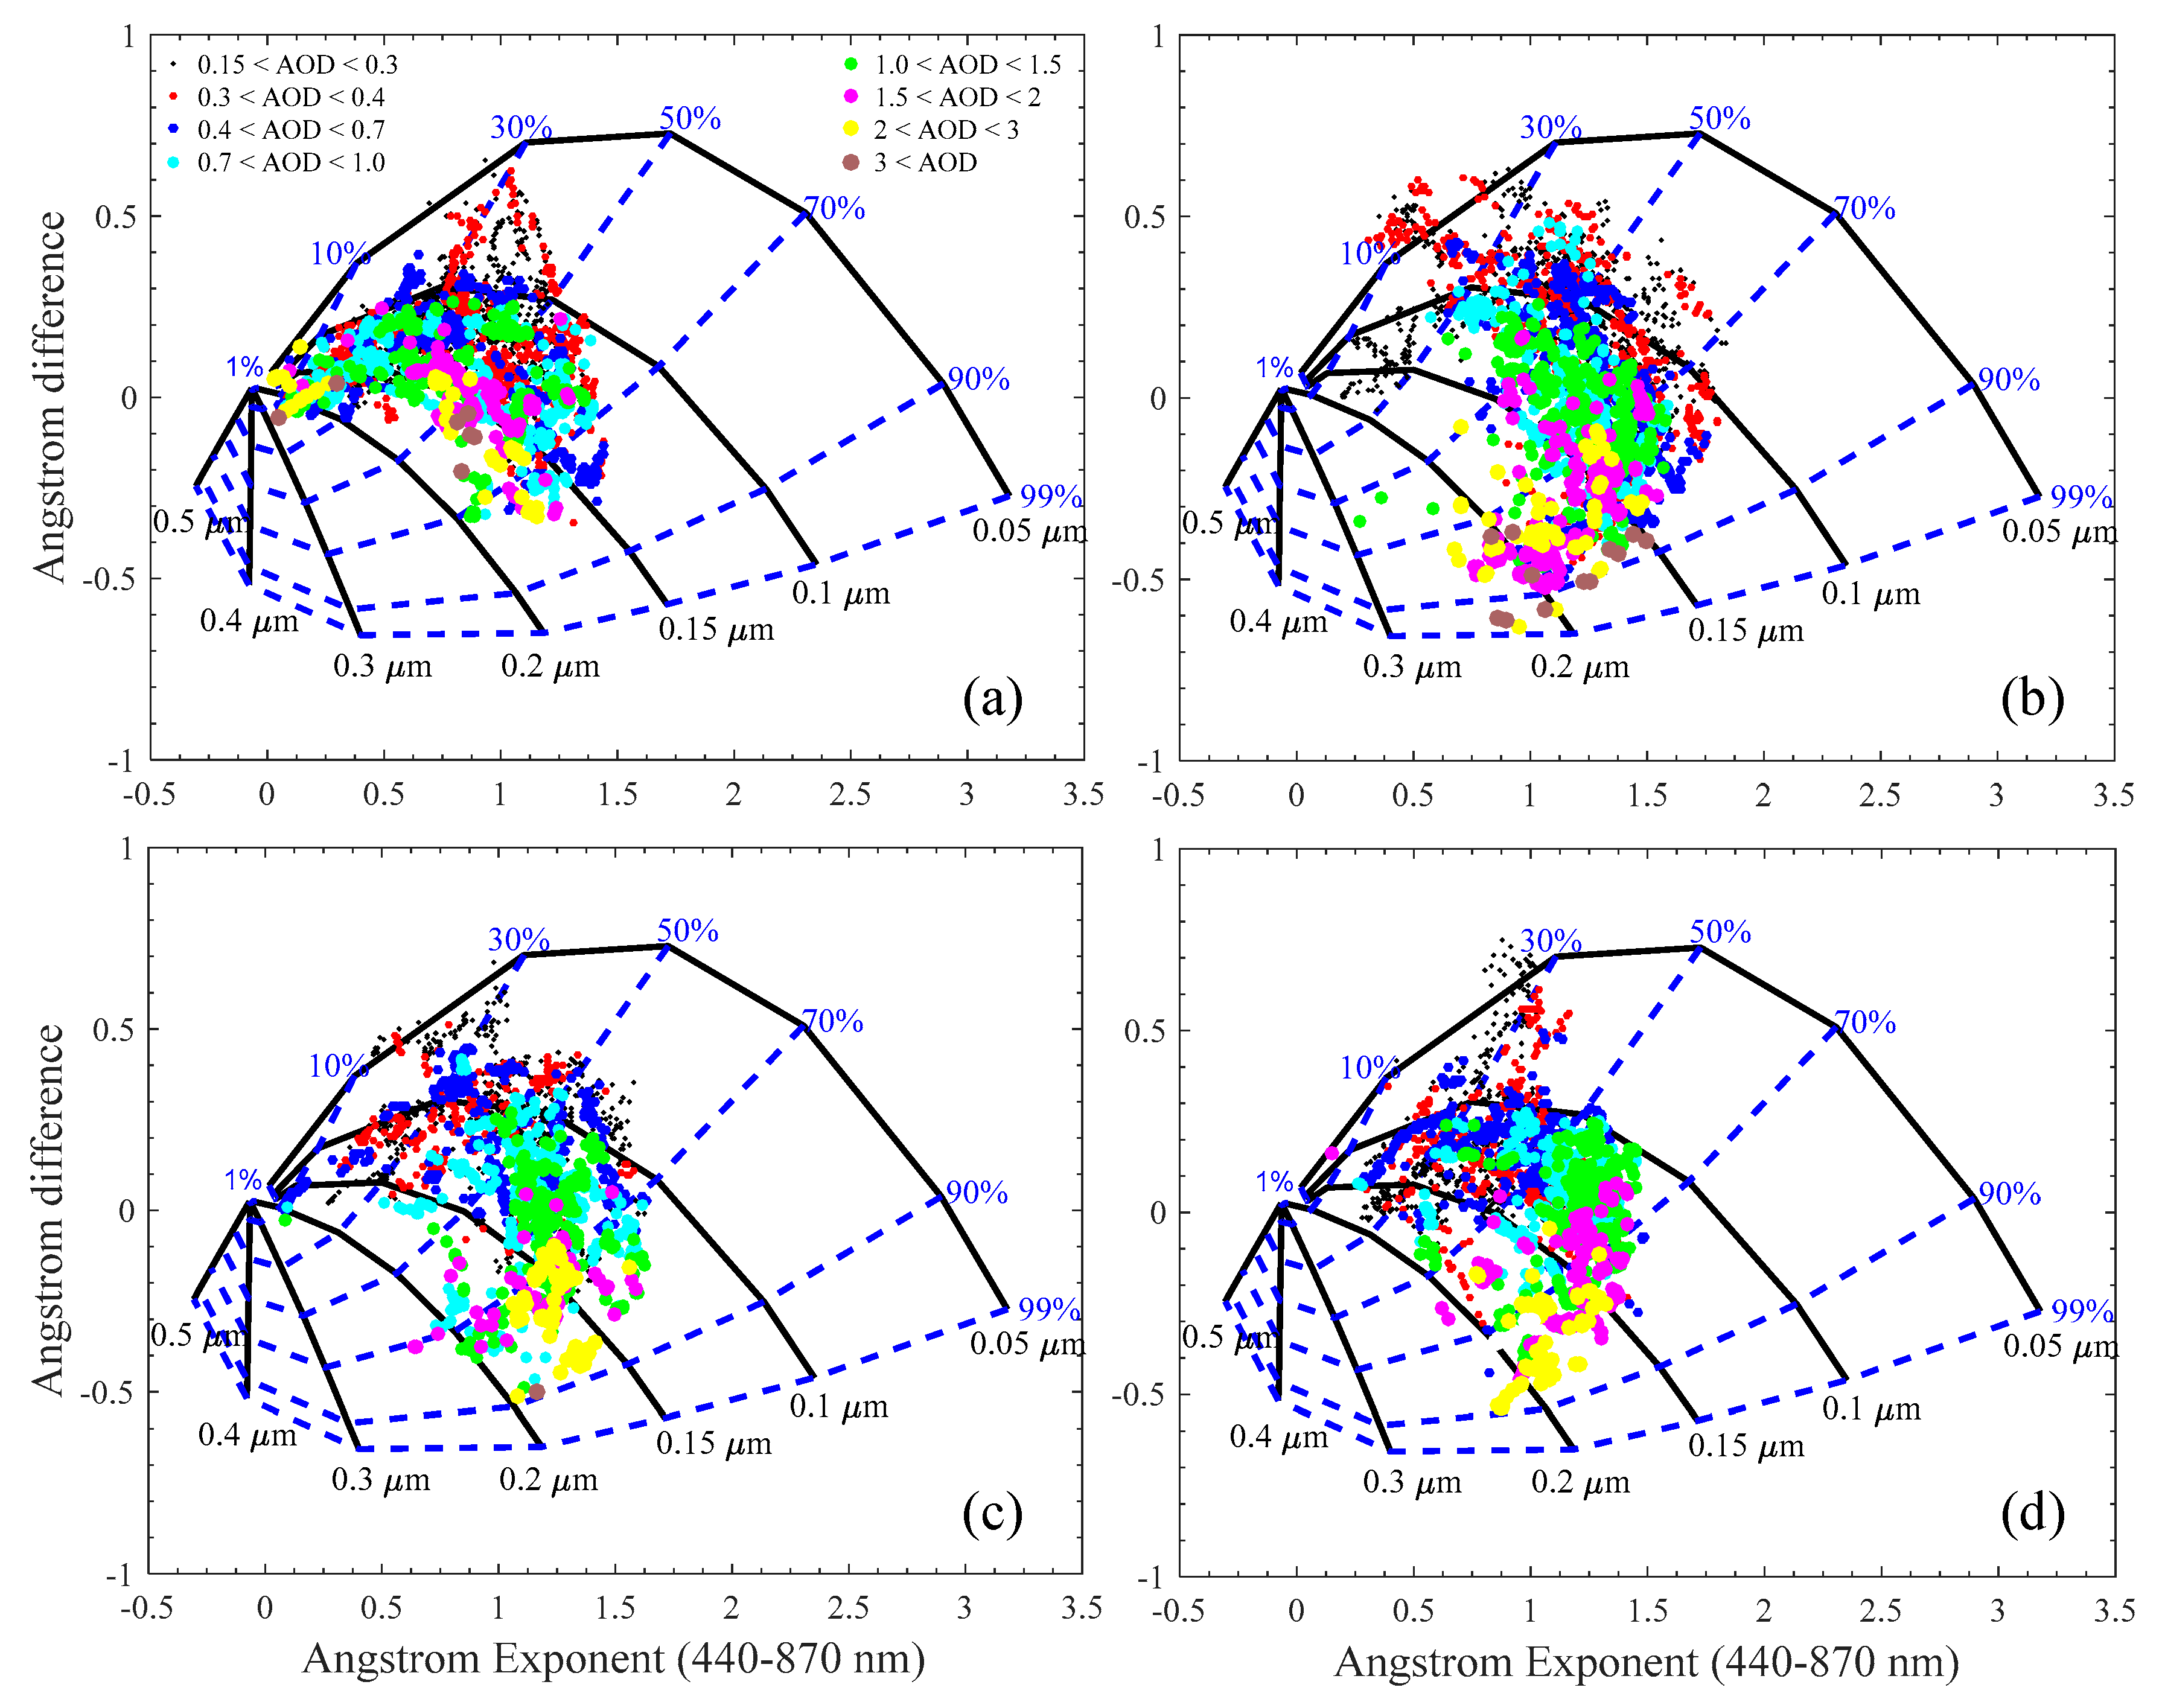
3.4.1. Graphical Method

Although AE is a good indicator of particle size in the solar spectrum, it cannot always provide unambiguous information on the relative weight of fine and coarse modes in determining the AOD. For instance, large fine mode particles possibly present the same AE as the mixture of small fine mode and coarse mode ones [69]. Therefore, Gobbi et al. [69] developed a graphical scheme by introducing AOD and the spectral curvature of AE to distinguish the increases of AOD due to aerosol humidification from those due to the addition of coarse mode aerosols. Following this graphical method, Figure 6 presents the classifications of aerosol properties as a function of AE (440–870 nm, α) and AE difference (δα) between AE440–675 and AE675–870 for bimodal and lognormal size distributions with a refractive index of 1.4–0.001i. The dots in different colors and sizes in Figure 6 represent the different bins of AOD at 675 nm. The black solid and blue dashed lines represent the fixed size of the fine-mode effective radius (Rf) and fixed fraction contribution of the fine mode to the AOD at 675 nm (η), respectively. In addition, only cloud-screened data with AOD675 > 0.15 were used in this study to avoid errors larger than 30% [69].
Three years of data in Xi’an shows high AODs (>1.0), both clustering in the fine mode growth wing (δα < 0, η > 60%) and the coarse mode (δα > 0, η < 30%). In spring (Figure 6a), it is very obvious that higher AODs (>1.0) are associated with coarse mode particles (δα > 0, η < 30%) due to the effect of dust episodes. Additionally, there are also some high AODs clustering in the fine mode growth wing. There are also some cases with high AODs of coarse mode in autumn (Figure 6c) and winter (Figure 6d) but much fewer than that of the spring. For the fine mode growth wing (1.0 < α < 1.5, δα < 0, η > 50%), many high AODs (>1.0) are clustered here for all four seasons, especially in summer. The AODs are much higher and distribute more densely in summer due to the effects of increases water vapor and air stagnation, corresponding to a fine fraction of ~90% and Rf ~ 0.2 μm. The extension of Xi’an pollution to higher AODs span perpendicularly downward to the black lines, leading to the increase of both η and Rf. This implies that AOD growth in many cases remains associated to a hygroscopic and/or coagulation growth from aging of the fine mode aerosols in Xi’an even with the presence of the coarse particles (likely dust). Such a coexistence of high pollution levels and mineral dust in Xi’an has been confirmed by chemical analyses of particles in Reference [40]. Similar patterns have also been reported in Beijing [16].

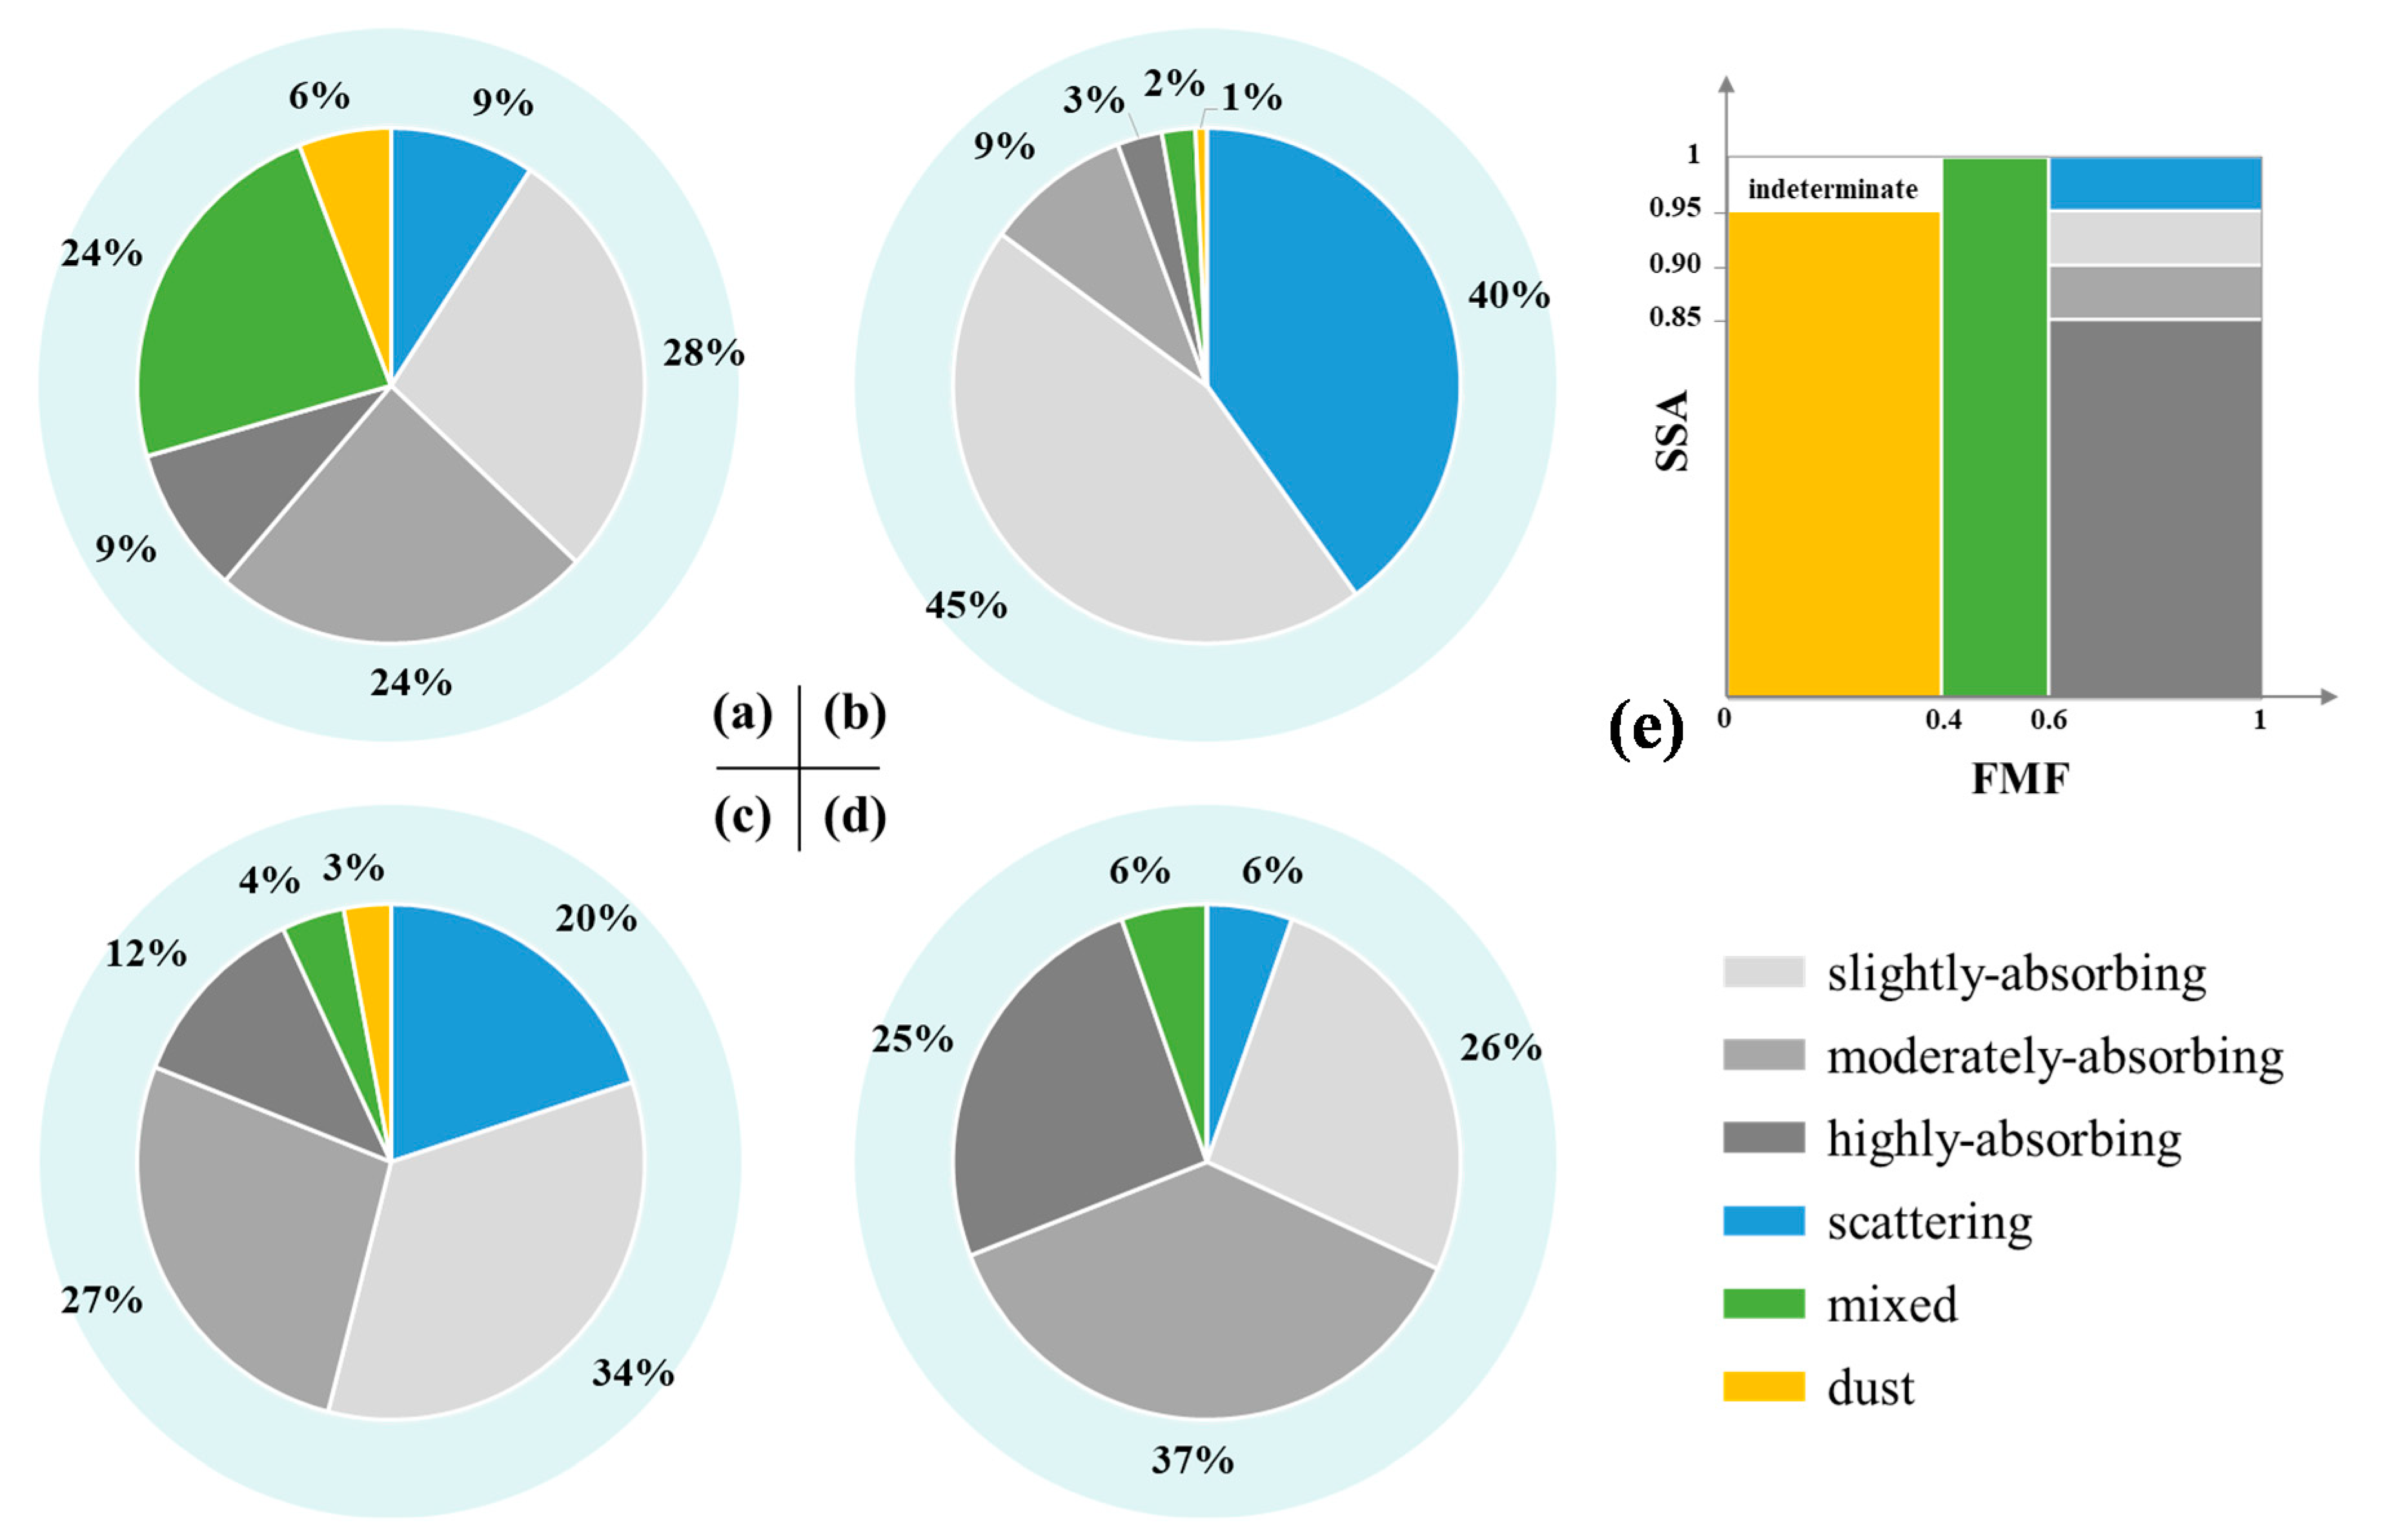
3.4.2. Threshold Method Involving FMF and SSA

Previous studies demonstrated that aerosol classification could be successfully conducted at both regional and global scale by using aerosol products associated with particle size and radiation absorptivity, such as FMF and SSA [70,71]. In this section, aerosols are firstly grouped into three types according to their FMF. Aerosols with daily FMF < 0.4 are identified as coarse mode particles, while the ones with FMF > 0.6 correspond to fine mod aerosols. Aerosols with FMF in the range of 0.4–0.6 are considered as a mixture of fine and coarse particles. Then, SSA at 440 nm is utilized to distinguish absorbing from scattering aerosols using the threshold of 0.95. For the absorbing aerosols with FMF > 0.6 and SSA < 0.95, three subtypes of highly-absorbing, moderately-absorbing, and slightly-absorbing can be further classified by using two other thresholds of SSA (0.85 and 0.90). By contrast, the coarse mode aerosols are further divided into dust (SSA < 0.95) and indeterminate type (SSA > 0.95). The classification method is illustrated in Figure 7e. Note that the indeterminate type accounts for less than 0.5% (only two days) of our dataset, therefore it is not involved in following discussion.
Average proportions of different aerosol types show significant seasonal variations (Figure 7). For example, dust accounts for about 6% in spring due to the effect of dust episodes, much more than in other seasons. Likewise, dust particles transported from resource regions mix with local anthropogenic emissions and lead to the highest percentage of mixture type in spring. The proportion of scattering aerosols reaches to the highest value (40%) in summer, followed by autumn, spring, and winter. This is possibly related to the strong photochemical reaction in the condition of high temperature and humidity, which might produce abundant secondary scattering particles, such as sulfate and nitrate. For the slightly-absorbing aerosol type, it constitutes more than 25% of total aerosols in all the seasons. This might be attributed to high industrial emissions and vehicle exhaust in the urban region. The other absorbing aerosol types (highly- and moderately-absorbing types) account for 33%, 12%, 39%, and 62% in spring, summer, autumn, and winter, respectively. The proportions of the all absorbing aerosol types are more than 50% in all seasons, especially in winter (up to 88%). This result is consistent with the conclusion provided in Li et al. [5] that the dominant aerosol types are absorbers. The percentages of absorbing aerosol types in Xi’an are much higher than that in Beijing [71], suggesting stronger absorptivity of aerosols in this region. Furthermore, the highest percentage of absorbing aerosols in winter probably associates with combustion of coal in the heating season, besides automobile exhaust and industrial emissions. The strongest absorptivity of aerosols in winter is also confirmed by the lowest SSA and highest AAOD in this season in Table 2.

4. Summary and Conclusions

Monthly and seasonal variability in aerosol optical and microphysical properties are firstly investigated in detail over Xi’an based on three years (2012–2015) of sun photometer measurements records. Annual average of AOD at 440 nm is about 0.88 ± 0.24 in Xi’an, which is higher than that of both background and industrial-urban sites reported in the previous studies. Averages of AOD in most seasons are comparable (~0.85), only showing a slightly higher value in winter (0.99 ± 0.36). The overall average of AE440–870 is about 1.02 ± 0.15, suggesting a dominant contribution of fine-mode particles to the AOD. Monthly AE are normally larger than 1.0 in summer, autumn, and winter with the highest value in September (1.24). The lowest AE occurs in spring (~0.85), implying the significant impact of dust episodes on aerosol size distribution.
The retrieved total volume concentration is highest in spring, followed by winter, summer, and the lowest in autumn. Moreover, coarse mode is dominant in size distribution for both spring and winter, while comparable contributions of fine and coarse mode particles to the total volume concentrations can be observed in both summer and autumn. Real RI shows significant seasonal variations, reaching to the highest value in winter and showing its minimum in summer. In contrast, seasonal imaginary RIs decrease drastically in the wavelength range 440–670 nm, and then increase slightly from 670 nm to 1020 nm in summer and autumn, but almost keep the same value in spring and winter. The multi-year average of SSA at 440 nm is about 0.89 ± 0.03, illustrating the strong absorptivity of this site. In autumn and winter, SSA increases with wavelength from 440 to 670 and decreases slightly from 670 to 1020 nm, which indicates the presence of brown carbon. In contrast, SSA in spring follows an increasing pattern from 440–670 nm, then continues to increase or stabilize between 670 and 870 nm, indicating the dominance of mineral dust in the aerosols population. Additionally, SSA decreases from 440 to 1020 nm, which can be attributed to the existence of fine particles.
Based on the long-term sun photometer measurement, aerosol types are classified by using both the graphical and threshold methods. The first method provides some qualitative results as below. High AODs (>1.0) are clustered in both of the fine mode growth wing (δα < 0, η > 60%) and the coarse mode (δα > 0, η < 30%). In spring, it is very obvious that higher AODs (>1.0) are associated with coarse mode particles (δα > 0, η < 30%) due to the effect of dust episodes. However, there are also many high AODs (>1.0) clustering in the fine mode growth wing (1.0 < α < 1.5, δα < 0, η > 50%) for all four seasons, especially in summer. The AODs are much higher and distribute more densely in summer due to the effects of increases water vapor and air stagnation, corresponding to a fine fraction of ~90% and Rf ~ 0.2 μm. The extension of Xi’an pollution to higher AODs span perpendicularly downward to the black lines, leading to the increase of both η and Rf. This implies that AOD growth in many cases remains associated to a hygroscopic and/or coagulation growth from aging of the fine mode aerosols in Xi’an even with the presence of the coarse particles (likely dust). In contrast, average proportions of different aerosol types are assessed by using the threshold method. Dust aerosols account for the highest percentage in spring due to the impact of dust episodes, while absorbing aerosol types constitute high proportions in all seasons, demonstrating the strong absorptivity of aerosols in this region. Results from this study are helpful to completely understand aerosol optical and microphysical properties and improve the modeling of aerosol effects in northwest urban regions of China.

Author Contributions

All authors have made significant contributions to the paper. X.S., J.C. and Z.L. conceived and designed the experiments, wrote and edited the manuscript; S.L. performed the experiments; K.L. and H.X. analyzed the data; X.F. contributed to the analysis tool.

Funding

This research received no external funding.

Acknowledgments

This work was supported by the National Natural Science Foundation of China (Grant No. 41505032) and the Ministry of Science and Technology (2017YFC0212200).

Conflicts of Interest

The authors declare no conflict of interest.

Appendix A

Figure A1. Frequency distributions of AOD at 440 nm for (a) spring, (b) summer, (c) autumn and (d) winter in Xi’an site.
Remotesensing 10 01169 g0a1
Figure A2. Same as Figure A1 but for Ångstrom exponent (440–870 nm).
Remotesensing 10 01169 g0a2

References

  1. Ramanathan, V.; Crutzen, P.; Kiehl, J.; Rosenfeld, D. Aerosols, climate, and the hydrological cycle. Science 2001, 294, 2119–2124. [Google Scholar] [CrossRef] [PubMed]
  2. Rosenfeld, D.; Rudich, Y.; Lahav, R. Desert dust suppressing precipitation: A possible desertification feedback loop. Proc. Natl. Acad. Sci. USA 2001, 98, 5975–5980. [Google Scholar] [CrossRef] [PubMed] [Green Version]
  3. Eddy, C. Aerosol direct radiative forcing: A review. In Atmospheric Aerosols—Regional Characteristics—Chemistry and Physics; Abdul-Razzak, H., Ed.; InTech: Rijeka, Croatia, 2012; ISBN 978-953-51-0728-6. [Google Scholar]
  4. Intergovernmental Panel on Climate Change (IPCC). Climate Change 2013: The Physical Science Basis: Working Group I Contribution to the Fifth Assessment Report of the Intergovernmental Panel on Climate Change; Stocker, T., Qin, D., Plattner, G.-K., Tignor, M., Allen, S.K., Boschung, J., Nauels, A., Xia, Y., Bex, V., Midgley, P.M., Eds.; Cambridge University Press: New York, NY, USA, 2014; ISBN 978-1-107-05799-9. [Google Scholar]
  5. Li, Z.; Gu, X.; Wang, L.; Li, D.; Xie, Y.; Li, K.; Dubovik, O.; Schuster, G.; Goloub, P.; Zhang, Y.; et al. Aerosol physical and chemical properties retrieved from ground-based remote sensing measurements during heavy haze days in Beijing winter. Atmos. Chem. Phys. 2013, 13, 10171–10183. [Google Scholar] [CrossRef] [Green Version]
  6. Che, H.; Xia, X.; Zhu, J.; Li, Z.; Dubovik, O.; Holben, B.; Goloub, P.; Chen, H.; Estelles, V.; Cuevas-Agulló, E.; et al. Column aerosol optical properties and aerosol radiative forcing during a serious haze-fog month over North China Plain in 2013 based on ground-based sunphotometer measurements. Atmos. Chem. Phys. 2014, 14, 2125–2138. [Google Scholar] [CrossRef] [Green Version]
  7. Yu, X.; Kumar, K.R.; Lü, R.; Ma, J. Changes in column aerosol optical properties during extreme haze-fog episodes in January 2013 over urban Beijing. Environ. Pollut. 2016, 210, 217–226. [Google Scholar] [CrossRef] [PubMed]
  8. Higgs, G.; Sterling, D.A.; Aryal, S.; Vemulapalli, A.; Priftis, K.N.; Sifakis, N.I. Aerosol Optical Depth as a Measure of Particulate Exposure Using Imputed Censored Data, and Relationship with Childhood Asthma Hospital Admissions for 2004 in Athens, Greece. Environ. Health Insights 2015, 9, 27–33. [Google Scholar] [CrossRef] [PubMed]
  9. Xue, T.; Zheng, Y.; Geng, G.; Zheng, B.; Jiang, X.; Zhang, Q.; He, K. Fusing Observational, Satellite Remote Sensing and Air Quality Model Simulated Data to Estimate Spatiotemporal Variations of PM2.5 Exposure in China. Remote Sens. 2017, 9, 221. [Google Scholar] [CrossRef]
  10. Leelasakultum, K.; Kim Oanh, N.T. Mapping exposure to particulate pollution during severe haze episode using improved MODIS AOT-PM10 regression model with synoptic meteorology classification: Mapping Exposure to Biomass Burning Haze. GeoHealth 2017, 1, 165–179. [Google Scholar] [CrossRef]
  11. Dubovik, O.; Smirnov, A.; Holben, B.N.; King, M.D.; Kaufman, Y.J.; Eck, T.F.; Slutsker, I. Accuracy assessments of aerosol optical properties retrieved from Aerosol Robotic Network (AERONET) Sun and sky radiance measurements. J. Geophys. Res. Atmos. 2000, 105, 9791–9806. [Google Scholar] [CrossRef] [Green Version]
  12. Che, H.; Zhang, X.-Y.; Xia, X.; Goloub, P.; Holben, B.; Zhao, H.; Wang, Y.; Zhang, X.-C.; Wang, H.; Blarel, L.; et al. Ground-based aerosol climatology of China: Aerosol optical depths from the China Aerosol Remote Sensing Network (CARSNET) 2002–2013. Atmos. Chem. Phys. 2015, 15, 7619–7652. [Google Scholar] [CrossRef]
  13. Xie, Y.; Li, Z.; Li, D.; Xu, H.; Li, K. Aerosol Optical and Microphysical Properties of Four Typical Sites of SONET in China Based on Remote Sensing Measurements. Remote Sens. 2015, 7, 9928–9953. [Google Scholar] [CrossRef] [Green Version]
  14. Li, J.; Carlson, B.E.; Dubovik, O.; Lacis, A.A. Recent trends in aerosol optical properties derived from AERONET measurements. Atmos. Chem. Phys. 2014, 14, 12271–12289. [Google Scholar] [CrossRef]
  15. Yu, H.; Kaufman, Y.J.; Chin, M.; Feingold, G.; Remer, L.A.; Anderson, T.L.; Balkanski, Y.; Bellouin, N.; Boucher, O.; Christopher, S.; et al. A review of measurement-based assessments of the aerosol direct radiative effect and forcing. Atmos. Chem. Phys. 2006, 6, 613–666. [Google Scholar] [CrossRef] [Green Version]
  16. Yu, X.; Lü, R.; Liu, C.; Yuan, L.; Shao, Y.; Zhu, B.; Lei, L. Seasonal variation of columnar aerosol optical properties and radiative forcing over Beijing, China. Atmos. Environ. 2017, 166, 340–350. [Google Scholar] [CrossRef]
  17. Wang, Y.; Che, H.; Ma, J.; Wang, Q.; Shi, G.; Chen, H.; Goloub, P.; Hao, X. Aerosol radiative forcing under clear, hazy, foggy, and dusty weather conditions over Beijing, China. Geophys. Res. Lett. 2009, 36. [Google Scholar] [CrossRef] [Green Version]
  18. Nichol, J.; Bilal, M. Validation of MODIS 3 km Resolution Aerosol Optical Depth Retrievals Over Asia. Remote Sens. 2016, 8, 328. [Google Scholar] [CrossRef]
  19. Zhang, M.; Huang, B.; He, Q. An Evaluation of Four MODIS Collection 6 Aerosol Products in a Humid Subtropical Region. Remote Sens. 2017, 9, 1173. [Google Scholar] [CrossRef]
  20. Chin, M.; Ginoux, P.; Kinne, S.; Torres, O.; Holben, B. Tropospheric aerosol optical thickness from the GOCART model and comparisons with satellite and sun photometer measurements. J. Atmos. Sci. 2002, 59, 461–483. [Google Scholar] [CrossRef]
  21. Kim, D.-H. Aerosol optical properties over east Asia determined from ground-based sky radiation measurements. J. Geophys. Res. 2004, 109. [Google Scholar] [CrossRef] [Green Version]
  22. Holben, B.N.; Eck, T.F.; Slutsker, I.; Tanré, D.; Buis, J.P.; Setzer, A.; Vermote, E.; Reagan, J.A.; Kaufman, Y.J.; Nakajima, T.; et al. AERONET—A Federated Instrument Network and Data Archive for Aerosol Characterization. Remote Sens. Environ. 1998, 66, 1–16. [Google Scholar] [CrossRef] [Green Version]
  23. Xin, J.; Wang, Y.; Li, Z.; Wang, P.; Hao, W.M.; Nordgren, B.L.; Wang, S.; Liu, G.; Wang, L.; Wen, T.; et al. Aerosol optical depth (AOD) and Ångström exponent of aerosols observed by the Chinese Sun Hazemeter Network from August 2004 to September 2005. J. Geophys. Res. 2007, 112. [Google Scholar] [CrossRef] [Green Version]
  24. Zhengqiang, L.I.; Donghui, L.I.; Kaitao, L.I.; Hua, X.U.; Chen, X.; Chen, C.; Xie, Y.; Li, L.I.; Lei, L.I.; Wei, L.I. Sun-sky radiometer observation network with the extension of multi-wavelength polarization measurements. J. Remote Sens. 2015, 19, 495–519. [Google Scholar]
  25. Xia, X.; Chen, H.; Goloub, P.; Zhang, W.; Chatenet, B.; Wang, P. A compilation of aerosol optical properties and calculation of direct radiative forcing over an urban region in northern China. J. Geophys. Res. 2007, 112. [Google Scholar] [CrossRef] [Green Version]
  26. Li, Z.; Xia, X.; Cribb, M.; Mi, W.; Holben, B.; Wang, P.; Chen, H.; Tsay, S.-C.; Eck, T.F.; Zhao, F.; et al. Aerosol optical properties and their radiative effects in northern China. J. Geophys. Res. 2007, 112. [Google Scholar] [CrossRef] [Green Version]
  27. Zhu, J.; Che, H.; Xia, X.; Chen, H.; Goloub, P.; Zhang, W. Column-integrated aerosol optical and physical properties at a regional background atmosphere in North China Plain. Atmos. Environ. 2014, 84, 54–64. [Google Scholar] [CrossRef]
  28. Pan, L.; Che, H.; Geng, F.; Xia, X.; Wang, Y.; Zhu, C.; Chen, M.; Gao, W.; Guo, J. Aerosol optical properties based on ground measurements over the Chinese Yangtze Delta Region. Atmos. Environ. 2010, 44, 2587–2596. [Google Scholar] [CrossRef]
  29. He, Q.; Li, C.; Geng, F.; Yang, H.; Li, P.; Li, T.; Liu, D.; Pei, Z. Aerosol optical properties retrieved from Sun photometer measurements over Shanghai, China: Aerosol measured from sunphotometer. J. Geophys. Res. Atmos. 2012, 117. [Google Scholar] [CrossRef]
  30. Wang, Z.; Liu, D.; Wang, Z.; Wang, Y.; Khatri, P.; Zhou, J.; Takamura, T.; Shi, G. Seasonal characteristics of aerosol optical properties at the SKYNET Hefei site (31.90°N, 117.17°E) from 2007 to 2013: First long-term AOP over Hefei. J. Geophys. Res. Atmos. 2014, 119, 6128–6139. [Google Scholar] [CrossRef]
  31. Wang, P.; Che, H.; Zhang, X.; Song, Q.; Wang, Y.; Zhang, Z.; Dai, X.; Yu, D. Aerosol optical properties of regional background atmosphere in Northeast China. Atmos. Environ. 2010, 44, 4404–4412. [Google Scholar] [CrossRef]
  32. Che, H.; Zhao, H.; Wu, Y.; Xia, X.; Zhu, J.; Wang, H.; Wang, Y.; Sun, J.; Yu, J.; Zhang, X.; et al. Analyses of aerosol optical properties and direct radiative forcing over urban and industrial regions in Northeast China. Meteorol. Atmos. Phys. 2015, 127, 345–354. [Google Scholar] [CrossRef]
  33. Wu, Y.; Zhu, J.; Che, H.; Xia, X.; Zhang, R. Column-integrated aerosol optical properties and direct radiative forcing based on sun photometer measurements at a semi-arid rural site in Northeast China. Atmos. Res. 2015, 157, 56–65. [Google Scholar] [CrossRef]
  34. Ma, Y.; Xin, J.; Zhang, W.; Wang, Y. Optical properties of aerosols over a tropical rain forest in Xishuangbanna, South Asia. Atmos. Res. 2016, 178–179, 187–195. [Google Scholar] [CrossRef]
  35. Zhu, J.; Xia, X.; Che, H.; Wang, J.; Zhang, J.; Duan, Y. Study of aerosol optical properties at Kunming in southwest China and long-range transport of biomass burning aerosols from North Burma. Atmos. Res. 2016, 169, 237–247. [Google Scholar] [CrossRef]
  36. Wang, L.; Gong, W.; Xia, X.; Zhu, J.; Li, J.; Zhu, Z. Long-term observations of aerosol optical properties at Wuhan, an urban site in Central China. Atmos. Environ. 2015, 101, 94–102. [Google Scholar] [CrossRef]
  37. Xia, X.; Chen, H.; Wang, P. Aerosol properties in a Chinese semiarid region. Atmos. Environ. 2004, 38, 4571–4581. [Google Scholar] [CrossRef]
  38. Che, H.; Zhang, X.; Alfraro, S.; Chatenet, B.; Gomes, L.; Zhao, J. Aerosol optical properties and its radiative forcing over Yulin, China in 2001 and 2002. Adv. Atmos. Sci. 2009, 26, 564–576. [Google Scholar] [CrossRef]
  39. Xin, J.; Gong, C.; Wang, S.; Wang, Y. Aerosol direct radiative forcing in desert and semi-desert regions of northwestern China. Atmos. Res. 2016, 171, 56–65. [Google Scholar] [CrossRef]
  40. Niu, X.; Cao, J.; Shen, Z.; Ho, S.S.H.; Tie, X.; Zhao, S.; Xu, H.; Zhang, T.; Huang, R. PM 2.5 from the Guanzhong Plain: Chemical composition and implications for emission reductions. Atmos. Environ. 2016, 147, 458–469. [Google Scholar] [CrossRef]
  41. Cao, J.J.; Lee, S.C.; Zhang, X.Y.; Chow, J.C.; An, Z.S. Characterization of airborne carbonate over a site near Asian dust source regions during spring 2002 and its climatic and environmental significance. J. Geophys. Res. 2005, 110. [Google Scholar] [CrossRef] [Green Version]
  42. Zhao, S.; Tie, X.; Cao, J.; Zhang, Q. Impacts of mountains on black carbon aerosol under different synoptic meteorology conditions in the Guanzhong region, China. Atmos. Res. 2015, 164–165, 286–296. [Google Scholar] [CrossRef]
  43. Cao, J.J.; Wu, F.; Chow, J.C.; Lee, S.C. Characterization and source apportionment of atmospheric organic and elemental carbon during fall and winter of 2003 in Xi’an, China. Atmos. Chem. Phys. 2005, 5, 3127–3137. [Google Scholar] [CrossRef] [Green Version]
  44. Shen, Z.; Arimoto, R.; Cao, J.; Zhang, R.; Li, X.; Du, N.; Okuda, T.; Nakao, S.; Tanaka, S. Seasonal variations and evidence for the effectiveness of pollution controls on water-soluble inorganic species in total suspended particulates and fine particulate matter from Xi’an, China. J. Air Waste Manag. Assoc. 2008, 58, 1560–1570. [Google Scholar] [CrossRef] [PubMed]
  45. Zhang, T.; Cao, J.J.; Tie, X.X.; Shen, Z.X.; Liu, S.X.; Ding, H.; Han, Y.M.; Wang, G.H.; Ho, K.F.; Qiang, J.; et al. Water-soluble ions in atmospheric aerosols measured in Xi’an, China: Seasonal variations and sources. Atmos. Res. 2011, 102, 110–119. [Google Scholar] [CrossRef]
  46. Zhu, C.-S.; Cao, J.-J.; Ho, K.-F.; Antony Chen, L.-W.; Huang, R.-J.; Wang, Y.-C.; Li, H.; Shen, Z.-X.; Chow, J.C.; Watson, J.G.; et al. The optical properties of urban aerosol in northern China: A case study at Xi’an. Atmos. Res. 2015, 160, 59–67. [Google Scholar] [CrossRef]
  47. Cao, J.; Zhu, C.; Ho, K.; Han, Y.; Shen, Z.; Zhan, C.; Zhang, J. Light attenuation cross-section of black carbon in an urban atmosphere in northern China. Particuology 2015, 18, 89–95. [Google Scholar] [CrossRef]
  48. Su, X.; Cao, J.; Li, Z.; Lin, M.; Wang, G. Column-Integrated Aerosol Optical Properties during Summer and Autumn of 2012 in Xi’an, China. Aerosol Air Qual. Res. 2014. [Google Scholar] [CrossRef] [Green Version]
  49. Li, Z.Q.; Xu, H.; Li, K.T.; Li, D.H.; Xie, Y.S.; Li, L.; Zhang, Y.; Gu, X.F.; Zhao, W.; Tian, Q.J.; et al. Comprehensive study of optical, physical, chemical and radiative properties of total columnar atmospheric aerosols over China: An overview of Sun-sky radiometer Observation NETwork (SONET) measurements. Bull. Am. Meteorol. Soc. 2017. [Google Scholar] [CrossRef]
  50. Li, Z.; Blarel, L.; Podvin, T.; Goloub, P.; Buis, J.-P.; Morel, J.-P. Transferring the calibration of direct solar irradiance to diffuse-sky radiance measurements for CIMEL Sun-sky radiometers. Appl. Opt. 2008, 47, 1368. [Google Scholar] [CrossRef] [PubMed]
  51. Fröhlich, C.; Shaw, G.E. New determination of Rayleigh scattering in the terrestrial atmosphere. Appl. Opt. 1980, 19, 1773–1775. [Google Scholar] [CrossRef] [PubMed]
  52. Angstrom, A. The Parameter of Atmospheric Turbidity. Tellus 1964, 16, 64–75. [Google Scholar] [CrossRef]
  53. Dubovik, O.; King, M.D. A flexible inversion algorithm for retrieval of aerosol optical properties from Sun and sky radiance measurements. J. Geophys. Res. Atmos. 2000, 105, 20673–20696. [Google Scholar] [CrossRef] [Green Version]
  54. Dubovik, O.; Sinyuk, A.; Lapyonok, T.; Holben, B.N.; Mishchenko, M.; Yang, P.; Eck, T.F.; Volten, H.; Muñoz, O.; Veihelmann, B.; et al. Application of spheroid models to account for aerosol particle nonsphericity in remote sensing of desert dust. J. Geophys. Res. 2006, 111. [Google Scholar] [CrossRef] [Green Version]
  55. Holben, B.N.; Kim, J.; Sano, I.; Mukai, S.; Eck, T.F.; Giles, D.M.; Schafer, J.S.; Sinyuk, A.; Slutsker, I.; Smirnov, A.; et al. An overview of meso-scale aerosol processes, comparison and validation studies from DRAGON networks. Atmos. Chem. Phys. Discuss. 2017, 1–23. [Google Scholar] [CrossRef]
  56. Smirnov, A.; Holben, B.N.; Eck, T.F.; Dubovik, O.; Slutsker, I. Cloud-screening and quality control algorithms for the AERONET database. Remote Sens. Environ. 2000, 73, 337–349. [Google Scholar] [CrossRef]
  57. Holben, B.N.; Eck, T.F.; Slutsker, I.; Smirnov, A.; Sinyuk, A.; Schafer, J.; Giles, D.; Dubovik, O. Aeronet’s Version 2.0 quality assurance criteria. In Proceedings of the Asia-Pacific Remote Sensing Symposium, Goa, India, 13–17 November 2006. [Google Scholar]
  58. Li, S.; Wang, T.; Xie, M.; Han, Y.; Zhuang, B. Observed aerosol optical depth and angstrom exponent in urban area of Nanjing, China. Atmos. Environ. 2015, 123, 350–356. [Google Scholar] [CrossRef]
  59. Cheng, T.; Xu, C.; Duan, J.; Wang, Y.; Leng, C.; Tao, J.; Che, H.; He, Q.; Wu, Y.; Zhang, R.; et al. Seasonal variation and difference of aerosol optical properties in columnar and surface atmospheres over Shanghai. Atmos. Environ. 2015, 123, 315–326. [Google Scholar] [CrossRef]
  60. Long, X.; Li, N.; Tie, X.; Cao, J.; Zhao, S.; Huang, R.; Zhao, M.; Li, G.; Feng, T. Urban dust in the Guanzhong Basin of China, part I: A regional distribution of dust sources retrieved using satellite data. Sci. Total Environ. 2016, 541, 1603–1613. [Google Scholar] [CrossRef] [PubMed] [Green Version]
  61. Zhang, Y.; Li, Z.; Zhang, Y.; Chen, Y.; Cuesta, J.; Ma, Y. Multi-peak accumulation and coarse modes observed from AERONET retrieved aerosol volume size distribution in Beijing. Meteorol. Atmos. Phys. 2016, 128, 537–544. [Google Scholar] [CrossRef]
  62. Yang, X.; Wenig, M. Study of columnar aerosol size distribution in Hong Kong. Atmos. Chem. Phys. 2009, 9, 6175–6189. [Google Scholar] [CrossRef] [Green Version]
  63. Schuster, G.L.; Lin, B.; Dubovik, O. Remote sensing of aerosol water uptake. Geophys. Res. Lett. 2009, 36. [Google Scholar] [CrossRef]
  64. Wang, L.; Li, Z.; Tian, Q.; Ma, Y.; Zhang, F.; Zhang, Y.; Li, D.; Li, K.; Li, L. Estimate of aerosol absorbing components of black carbon, brown carbon, and dust from ground-based remote sensing data of sun-sky radiometers: Bc, brown carbon, and dust from aeronet. J. Geophys. Res. Atmos. 2013, 118, 6534–6543. [Google Scholar] [CrossRef]
  65. Yu, X.; Zhu, B.; Fan, S.; Yin, Y.; Bu, X. Ground-based observation of aerosol optical properties in Lanzhou, China. J. Environ. Sci. 2009, 21, 1519–1524. [Google Scholar] [CrossRef]
  66. Scarnato, B.V.; Vahidinia, S.; Richard, D.T.; Kirchstetter, T.W. Effects of internal mixing and aggregate morphology on optical properties of black carbon using a discrete dipole approximation model. Atmos. Chem. Phys. 2013, 13, 5089–5101. [Google Scholar] [CrossRef] [Green Version]
  67. China, S.; Scarnato, B.; Owen, R.C.; Zhang, B.; Ampadu, M.T.; Kumar, S.; Dzepina, K.; Dziobak, M.P.; Fialho, P.; Perlinger, J.A.; et al. Morphology and mixing state of aged soot particles at a remote marine free troposphere site: Implications for optical properties. Geophys. Res. Lett. 2015, 42, 1243–1250. [Google Scholar] [CrossRef] [Green Version]
  68. He, C.; Liou, K.-N.; Takano, Y.; Zhang, R.; Levy Zamora, M.; Yang, P.; Li, Q.; Leung, L.R. Variation of the radiative properties during black carbon aging: Theoretical and experimental intercomparison. Atmos. Chem. Phys. 2015, 15, 11967–11980. [Google Scholar] [CrossRef]
  69. Gobbi, G.P.; Kaufman, Y.J.; Koren, I.; Eck, T.F. Classification of aerosol properties derived from AERONET direct sun data. Atmos. Chem. Phys. 2007, 7, 8713–8726. [Google Scholar] [CrossRef]
  70. Lee, J.; Kim, J.; Song, C.H.; Kim, S.B.; Chun, Y.; Sohn, B.J.; Holben, B.N. Characteristics of aerosol types from AERONET sunphotometer measurements. Atmos. Environ. 2010, 44, 3110–3117. [Google Scholar] [CrossRef]
  71. Ou, Y.; Zhao, W.; Wang, J.; Zhao, W.; Zhang, B. Characteristics of Aerosol Types in Beijing and the Associations with Air Pollution from 2004 to 2015. Remote Sens. 2017, 9, 898. [Google Scholar] [CrossRef]
Figure 1. Location of the Xi’an observation site and its surrounding topography.
Remotesensing 10 01169 g001
Figure 2. Monthly and seasonal average of AOD at 440 nm (a,b), Ångstrom Exponent (AE, 440–870 nm) (c,d) and columnar water vapor (e,f) at Xi’an site. In the box plots (b,d,f), the lines crossing the boxes denote the median, and the lower and upper limits are the first and third quartiles, respectively. The small squares in the boxes and the short lines at top and bottom indicate mean, maximum, and minimum values, while the crosses denote the 1–99% range. The whiskers denote 1.5 times of the difference between the first and the third quartiles.
Remotesensing 10 01169 g002
Figure 3. Monthly and seasonal average of volume particle size distribution (VPSD) over Xi’an site for (a) spring, (b) summer, (c) autumn, and (d) winter. The red shadows indicate the standard deviations of monthly averages for the given season.
Remotesensing 10 01169 g003
Figure 4. Relationship between volume particle size distribution and AOD in Xi’an. The average of VPSD for each bins of AOD (≤0.3, 0.3–0.6, 0.6–0.9, 0.9–1.2, 1.2–1.5, >1.5) are marked in different colors from purple to red, with error bars indicating the standard deviation. The mean values of AOD, AE, and Fine mode fraction (FMF) for the given bin are also presented in the legend.
Remotesensing 10 01169 g004
Figure 5. Seasonal average of spectral refractive index, including real (a) and imaginary parts (b), SSA (c), and asymmetry factor (d) over the Xi’an site. Error bars indicate the standard deviation of the monthly averages for the given season.
Remotesensing 10 01169 g005
Figure 6. Ångstrom exponent difference between AE440–675 and AE675–870 over Xi’an in (a) spring, (b) summer, (c) autumn, and (d) winter, as a function of Ångstrom exponent (440–870 nm) and aerosol optical depth at 675 nm. Only cloud screened data with AOD > 0.15 are used.
Remotesensing 10 01169 g006
Figure 7. Average proportions of different aerosol types in (a) spring, (b) summer, (c) autumn, and (d) winter in Xi’an according to the aerosol classification scheme illustrated in (e), where aerosols can be grouped into six types according to different thresholds of their FMF and SSA.
Remotesensing 10 01169 g007
Table 1. Comparison of Single Scattering Albedo (SSA), Volume Particle Size Distribution (VPSD) and real and imaginary parts of refractive index (RI) from SONET and AERONET [49].
Aerosol ParametersAERONET Uncertainty 1Diff. from AERONET (Avg ± SD)
SSA0.030.02 ± 0.04
VPSD25% (0.1 < r < 7 µm)1.5 ± 26% (0.1 < r < 7 µm)
25–100% (r < 0.1 µm and r > 7 µm)18 ± 85% (r < 0.1 µm and r > 7 µm)
Real part of RI0.040.007 ± 0.04
Imaginary part of RI40%18 ± 46%
1 Uncertainties of AERONET inversions are summarized according to Dubovik et al. [11].
Table 2. Seasonal averages of aerosol optical and microphysical properties in Xi’an.
SeasonsAOD440 1AE440–870 1Vf 2Vc 2FMFSSA 3AAOD 3AAE 3
Spring0.85 ± 0.200.85 ± 0.050.08 ± 0.010.30 ± 0.030.70 ± 0.010.89 ± 0.000.09 ± 0.011.36 ± 0.11
Summer0.87 ± 0.291.12 ± 0.160.13 ± 0.060.17 ± 0.030.81 ± 0.130.93 ± 0.010.07 ± 0.011.00 ± 0.06
Autumn0.82 ± 0.191.08 ± 0.150.10 ± 0.030.18 ± 0.020.80 ± 0.070.89 ± 0.040.10 ± 0.031.26 ± 0.18
Winter0.99 ± 0.361.02 ± 0.070.11 ± 0.010.23 ± 0.060.78 ± 0.010.85 ± 0.010.16 ± 0.001.52 ± 0.04
1 AOD and AE are retrieved from direct measurements; 2 Vf and Vc are the volume concentrations (μm3/μm2) of fine and coarse mode particles; 3 Only measurements with AOD440 > 0.4 are used to calculate the seasonal averages of Single scattering albedo (SSA), aerosol absorption optical depth (AAOD), and absorption Ångström Exponent (AAE) here.

