Article

Impacts of Agricultural Expansion (1910s–2010s) on the Water Cycle in the Songneng Plain, Northeast China

1
Heilongjiang Province Key Laboratory of Geographical Environment Monitoring and Spatial Information Service in Cold Regions, Harbin Normal University, Harbin 150025, China
2
Department of Geography, University of South Carolina, Columbia, SC 29208, USA
3
Key Laboratory of Land Surface Pattern and Simulation, Institute of Geographical Sciences and Natural Resources Research, Chinese Chinese Academy of Sciences, Beijing 100101, China
4
Key Laboratory of Land Surface Process and Climate Change, Northwest Institute of Eco-Environment and Resources, Chinese Academy of Sciences, Lanzhou 730000, China
5
Department of Geological and Atmospheric Science, Iowa State University, Ames, IA 50010, USA
6
Innovation and Opening Laboratory of Regional Eco-Meteorology in Northeast, China Meteorological Administration, Meteorological Academician Workstation of Heilongjiang Province, Heilongjiang Province Institute of Meteorological Sciences China, Harbin 150030, China
*
Author to whom correspondence should be addressed.
Remote Sens. 2018, 10(7), 1108; https://doi.org/10.3390/rs10071108
Submission received: 12 June 2018 / Revised: 6 July 2018 / Accepted: 8 July 2018 / Published: 12 July 2018

Abstract

:
Agricultural expansion is one of the primary land use changes on the Earth’s surface. The Songnen Plain in Northeast China is renowned for its Black Soil and is one of the most important agricultural regions of this country. In the last century, its population increased 20-fold and excessive areas of grassland were cultivated. Based on a series of decadal land use/land cover data sets in the plain (1910s–2010s), this study simulated the water balance in each decade using the Weather Research and Forecasting (WRF) model and assessed the water effects of centurial agricultural expansion. Six variables were simulated to explain the land-atmosphere interaction: precipitation, total evapotranspiration, canopy transpiration, canopy interception evaporation, land evaporation and land surface runoff and infiltration. Agreeing with historical climate reanalysis data, the simulated precipitation in the plain did not have a significant trend. However, the total evapotranspiration significantly increased in the study region. The canopy transpiration and interception evaporation increased and the runoff and infiltration decreased, both indicating a drought effect in soil. The drying trend varied spatially with the strongest pattern in the central plain where large areas of wetlands remain. As a consequence of agricultural expansion, the centurial drying process in the fertile Black Soil may put strong pressure on the crop productivity and food safety of this important agricultural region.

Graphical Abstract

1. Introduction

Anthropogenic activities play a significant role in global warming by altering land use and land cover (LULC) patterns on Earth’s surfaces [1,2]. It was reported that the LULC change had outcompeted greenhouse gases and become the largest contributor to global climate change [3,4]. Agricultural land expansion, for example, converts natural land covers to cultivated lands and is among the primary land use changes on a global scale [5]. According to the U.N. Food and Agriculture Organization (FAO), global arable lands in use increased from 1.375 million ha in 1961 to 1.562 million ha in 2005 and had a projected increase rate of 9% toward 2050 [6].
Long-term water effects of expanding cultivation have attracted attention all over the world. Land exploration in the U.S. western states since the 1800s, for example, was directly related to the desertified lands, devastated ecosystems and degraded ecological functions [7]. In historical China, several macro-scale agricultural land conversion events occurred, all of which attributed to the fluctuating decrease of humidity and rapid loss of water resources [8]. The long-term, intensive agricultural development is also believed to play a role in the depletion of civilization, for example the loss of the Ancient Loulan Kingdom to deserts in northwestern China [9]. While human beings benefit from abundant crop production, intensified cultivation may eventually be paid back by degraded lands and living environments. This change-response mechanism is a significant research question that needs to be answered for sustainable agriculture [10].
Intensive studies have been conducted to examine the climatic impacts of agricultural expansion in statistical and numerical models [11,12,13]. One of the most widely applied models, the Weather Research and Forecasting (WRF) model, was developed by National Center for Atmospheric Research (NCAR) under a collaborative partnership among multiple federal agencies in the United States [14]. As a mesoscale numerical weather prediction system, it has served a wide range of meteorological research and operational forecasting worldwide [15,16]. While studies generally supported the conclusion that agricultural land use change varied the temperature and precipitation patterns in regional levels [2,17], it was also recognized that the impacts were distributed heterogeneously upon local weather, soil type, historical land use and management strategies [18]. Among the limited efforts to explore the water effects of land use changes, Yu et al. [19] suggested that intensive cultivation alters the natural partition of water resources and eventually breaks the balance of water usage in the watershed. Sun et al. [20] found that the corn boom [21] in the U.S. Midwest reduced water consumption efficiency in croplands after vast areas of permanent green covers were converted to corn fields to meet bioenergy needs. In the agricultural region of Northeast China, agricultural activities have affected about 62–82% runoff [22]. The water effects of agricultural expansion involve a complex process that interacts with multiple aspects including runoff, precipitation and land-atmosphere exchanges such as evaporation and evapotranspiration. The current literature has been lacking quantitative analysis of these indicators.
This study aims to simulate the impacts of long-term agricultural expansion in Northeast China on the water cycle of this region. In the late 1800s, an extensive wave of immigrants washed over the Northeast China (with the old name of Manchuria) from southern provinces such as Shandong that had undergone severe droughts and famines [19]. Since then, vast areas of natural grasslands have been cultivated in this productive Black Soil region. Taking the Songnen Plain as the experimental region, this study collects the decadal LULC data in the period from the 1910s to the 2010s, simulates the water effects of agricultural expansion using land surface models and analyzes the LULC change-response mechanism across the plain. The long-term trends of water effects extracted in this study region, which have not been thoroughly studied in the current literature, may provide compatible information for other major agricultural regions worldwide.

2. Materials and Methodology

2.1. Study Region

The Songnen Plain is located in the Nenjiang River Basin, Northeast China with a geographic extent of 42°30′–51°20′N and 121°40′–128°30′E, covering an area of 0.18 million km2 (Figure 1). It is a huge alluvial plain deposited from the Songhuajiang River and Nenjiang River [20]. The plain has a gentle, flat terrain with an elevation of 100–200 m decreasing from north to south. In a temperate continental monsoon climate, it has clear seasonality with cold winters and wet summers influenced by the southeast Monsoon. Temperature varies from −24 °C in January to 26 °C in July. Annual precipitation has a range of 350–700 mm, most of which occurs in the growing season from May to September. Northeast China is well known for its unique, highly productive Black Soil [23,24], in which the Songnen Plain (our study region), Sanjiang Plain and the Liaohe Plain compose the three primary plains from north to south. Historically converted from vast areas of grasslands since the 1800s, croplands dominate the plains with major crop types of corn, soybean and spring wheat.

2.2. Data Sets

The 100-year LULC products are the primary data inputs of this study. The study region can be fully covered by 30 Landsat tiles (path 26–30 and row 116–121) that have been available since the 1970s. With a rich set of Landsat MSS, TM and ETM+ imagery, the decadal LULC maps in the 1970s, 1980s, 1990, 2000s and 2010s were classified at a 30-m grid size in previous projects [24]. While classification accuracies in earlier decades cannot be assessed due to a lack of ground-truth data, the overall accuracy of the 2010s LULC map reached 85% using 400 ground-truth points randomly collected from the meter-scale Google Earth imagery in adjacent years. The LULC map in the 1950s was digitized from the historical 1:300,000,000 land use maps of Northeast China published in 1959 [25]. Information on the study region was very limited before the founding of the New China in 1949. Through our previous efforts, the documentation of historical forest distributions, population and settlement clusters were collected and the LULC maps in 1910s and 1930s were extracted in alignment with river channel patterns and cultivation indices. More details about the process can be found in [13]. Using the satellite-classified LULC maps as a reference, all historical LULC maps in the 1910s, 1930s and 1950s were geo-referenced and re-sampled to 30-m spatial resolution by previous projects. Given the coarse resolution of digitized maps, these resampled 30-m outputs inevitably contained high uncertainties in calculating land use changes. However, the uncertainties were less dominant for our model simulation using large grid sizes (described in the next section). To generalize the products, the LULC types in each decade were grouped into the same class set: developed lands (urban and rural development), agricultural lands (dryland and paddy fields), grasslands, forests, wetlands and water. The centurial change of agricultural lands is our primary interest.
Environmental data such as the digital elevation model (DEM) were downloaded from the U.S. Geological Survey Data Clearinghouse. Data on the monthly precipitation and temperature in the 1910s–2010s came from the European Reanalysis Interim (ERA-Interim) data at a grid size of 0.5° × 0.5°, which served as the validation source for the model simulation in this study. The 6-h National Centers for Environmental Prediction (NCEP) global forecast system (GFS) final (FNL) operational global analysis data were adopted to parameterize the planetary boundary layer for WRF model simulation [26].

2.3. Approaches

Land use patterns in the study region and their decadal changes in the 1910s–2010s are first examined. The water effects of these changes to the study region are then evaluated via model simulation. Common mesoscale weather models often use a grid resolution ranging from 10 to 100 km [27] and model simulation reaches higher accuracies with finer grid sizes [28]. Limited by computation power in this study, we decided to group the study region into a 30 km × 30 km grid network. There is a total of 94 by 89 grids across the region. Within each grid, the percentage of coverage of each LULC class in a decade is calculated from the LULC data sets. For agricultural land use, its trajectory of percentage changes in the past 100 years represents the process of historical expansion in this grid.
This study applied the WRF model to simulate the land-atmosphere interactions in the study region. The land surface model, NOAH Multi-Parameterization (NAOH-MP) (Niu et al., 2011), was selected within the WRF simulation. Overall, two categories of input variables were considered for WRF model simulation: land surface characteristics that are represented by topography, land use/land cover types, soil, leaf area index (LAI) and albedo, and so forth.; and atmospheric conditions described by air temperature, precipitation, water vapor, wind speed and air pressure, and so forth. [14]. When water balance is of the major interest, the coupled WRF/NOAH model can be partitioned as [29]:
PRE = TET + RI
TET = CE + IE + LE
where the term PRE represents the precipitation, TET denotes the total evapotranspiration and RI is the surface runoff and infiltration in the soil layer. The CE is the canopy transpiration, IE is the interception evaporation from the vegetation layer and LE is the evaporation from the land surface.
As described in the NOAH-MP model [24], in a water cycle, the downward precipitation (PRE) balances with the upward total evapotranspiration (TET), runoff on land surface and infiltration downward. With a lack of detailed soil texture properties in such a large region, we combined the runoff and infiltration as a single variable (RI) in this study. The TET is composed of canopy transpiration (CE), vegetation interception evaporation (IE) and land evaporation (LE). These variables define the water cycle and can be simulated in the WRF model. Meanwhile, since this study examined the impacts of agricultural land use change on the water cycle, we set a fixed boundary layer of climatic condition represented by the 5-year averages of climatic variables over the period from 1 January 2008 to 31 December 2012. These truthing data were retrieved from the FNL Reanalysis products. All WRF simulations in this study were based on this fixed climatic condition and therefore, the influences of climatic change in the past century were excluded from the analysis.
In our experimental design, the 1910s were set as an initial stage that represents the original land-atmosphere status before agricultural expansion in the study region and all other decades (1930s, 1950s, 1970s, 1980s, 1990s, 2000s, 2010s) represent stages undergoing various expansion. In each decade, all water balance variables in Equation (1) were simulated in a monthly interval at each WRF grid within the growing season (May–September). To reduce seasonal effects, the off-season simulations were not processed. In each decade, their deviations against the 1910s (e.g., ΔPRE and ΔTET) at each grid were calculated. Their spatial and temporal patterns were then compared to explore the LULC change-induced variations of water balance in different stages of LULC change.
Finally, the LULC-based WRF simulations were compared with the drought index to evaluate the water effects of agricultural expansion. In this study, we utilized the widely applied Palmer Drought Severity Index (PDSI) that is rooted on the supply-demand concept of water balance [30]. The PDSI is generally in a range of −6 to 6, with negative values indicating dry spells while positive values denote wet spells. Using readily available temperature and precipitation data to estimate relative dryness, the PDSI has been reasonably successful at quantifying long-term agricultural drought [31]. The exclusion of off-season months in this study reduced the snow/ice effects on its calculation. Therefore, it is a fairly good tool for exploring the drought effects in the study region. Here we calculated the PDSI from the ERA Reanalysis data in the study region and compared their 30-year trends in the periods from 1901–1930 (initial stage) and from 1981–2010 (post-stage). These spatial patterns serve as good reference about the variations of drought status in the past century.

3. Results and Discussion

3.1. The Centurial LULC Change (1910s–2010s)

The Songnen Plain is one of the most productive agricultural plains in China. It is primarily composed of croplands, grasslands and forests that currently cover more than 80% of the study region [24]. Areal coverage of the three classes in different decades is summarized. In the 1910s, grasslands dominated the region in a total area of 0.1 million km2, followed by croplands in 0.05 million km2 and forests in 0.02 million km2. As shown in Figure 2, croplands dramatically increased from 1910s to 1970s at a rate of 0.03 million km2/10a (p < 0.05), with the unit 10a representing a 10-year period. Correspondingly, grasslands decreased at a similar rate in the 1910s–1970s. Since the 1930s, croplands have become the dominant LULC type in the study region. Since China’s Reform and Opening policy in 1978, its economy has dramatically switched to industrialization and other financial forms [32]. Therefore, agricultural activities slowed down and the total area of croplands became relatively stable after the 1970s. By the 2010s, croplands cover a total area of 0.13 million km2 while grasslands decreased to 0.015 million km2. Forests have much less coverage than the other two classes and have not revealed significant change in the past century. Figure 2 shows that the LULC changes in the study region primarily occurred in the period from the 1910s–1970s and the major land conversion is from grasslands to croplands, the so-called agricultural expansion. Total areas (×104 km2) of conversion of all land cover types from the 1910s to 2010s are listed in Table 1. Within the century, more than 600 million km2 of grasslands were converted to croplands, confirming that agricultural expansion in the study region is mainly from grasslands. Table 1 also shows that croplands, forests and grasslands are the three primary classes in the region. This study only examines these three LULC types and their contributions to water balance across the plain.
Percentage covers of the three primary LULC classes in all WRF grids were extracted. Their spatial patterns and the grassland-cropland conversions are displayed in Figure 3. Croplands in the 1910s were mostly clustered in the southeast of the plain. By the 1930s, the extensive area of grasslands in the eastern plain was converted to croplands. Croplands in other decades continued to expand across the plain at the expense of grassland. As seen in the 1950s map, an exception remained in the central plain where agricultural expansion was less intensive. Checking with historical maps and Google Earth imagery, this area has higher coverage of water surfaces and wetlands that are not suitable for cultivation. Forests grow in relatively high elevations along the north and northeast ends of the region (refer to the DEM in Figure 1) and did not reveal apparent change over the 100 years. Poor soil quality in mountainous areas may prevent the conversion of forests to croplands.

3.2. The WRF-Simulated Water Effects

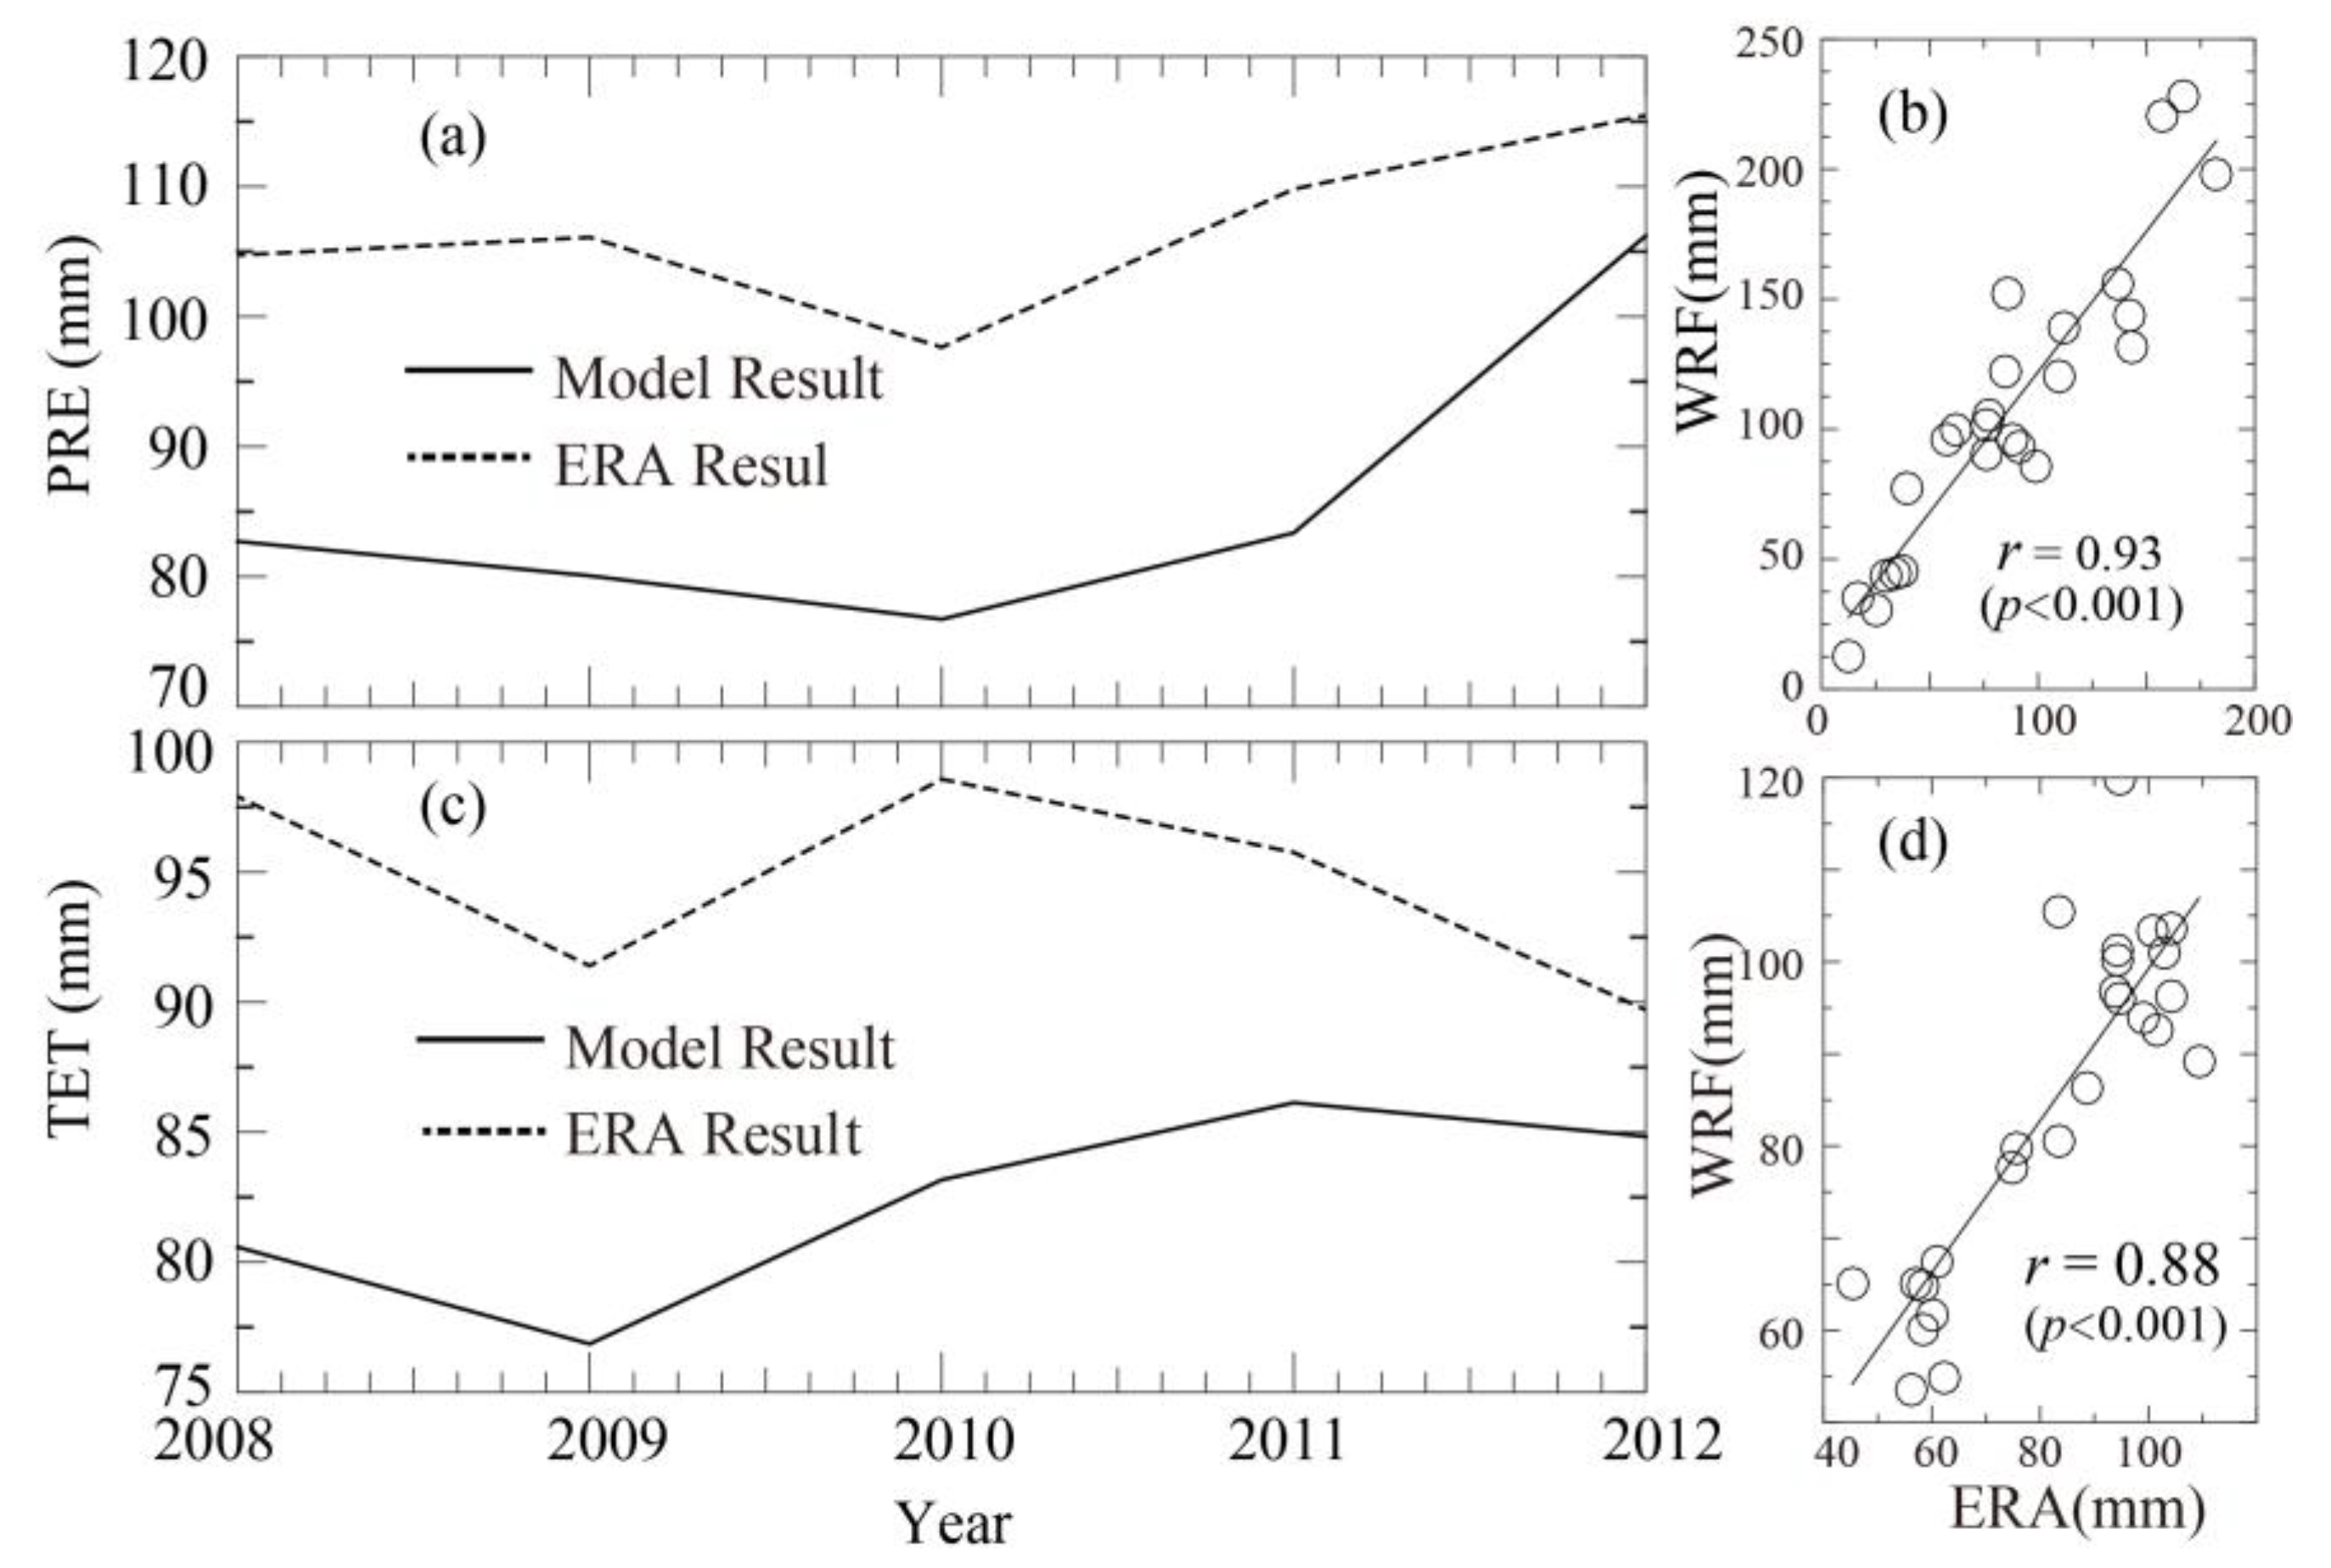
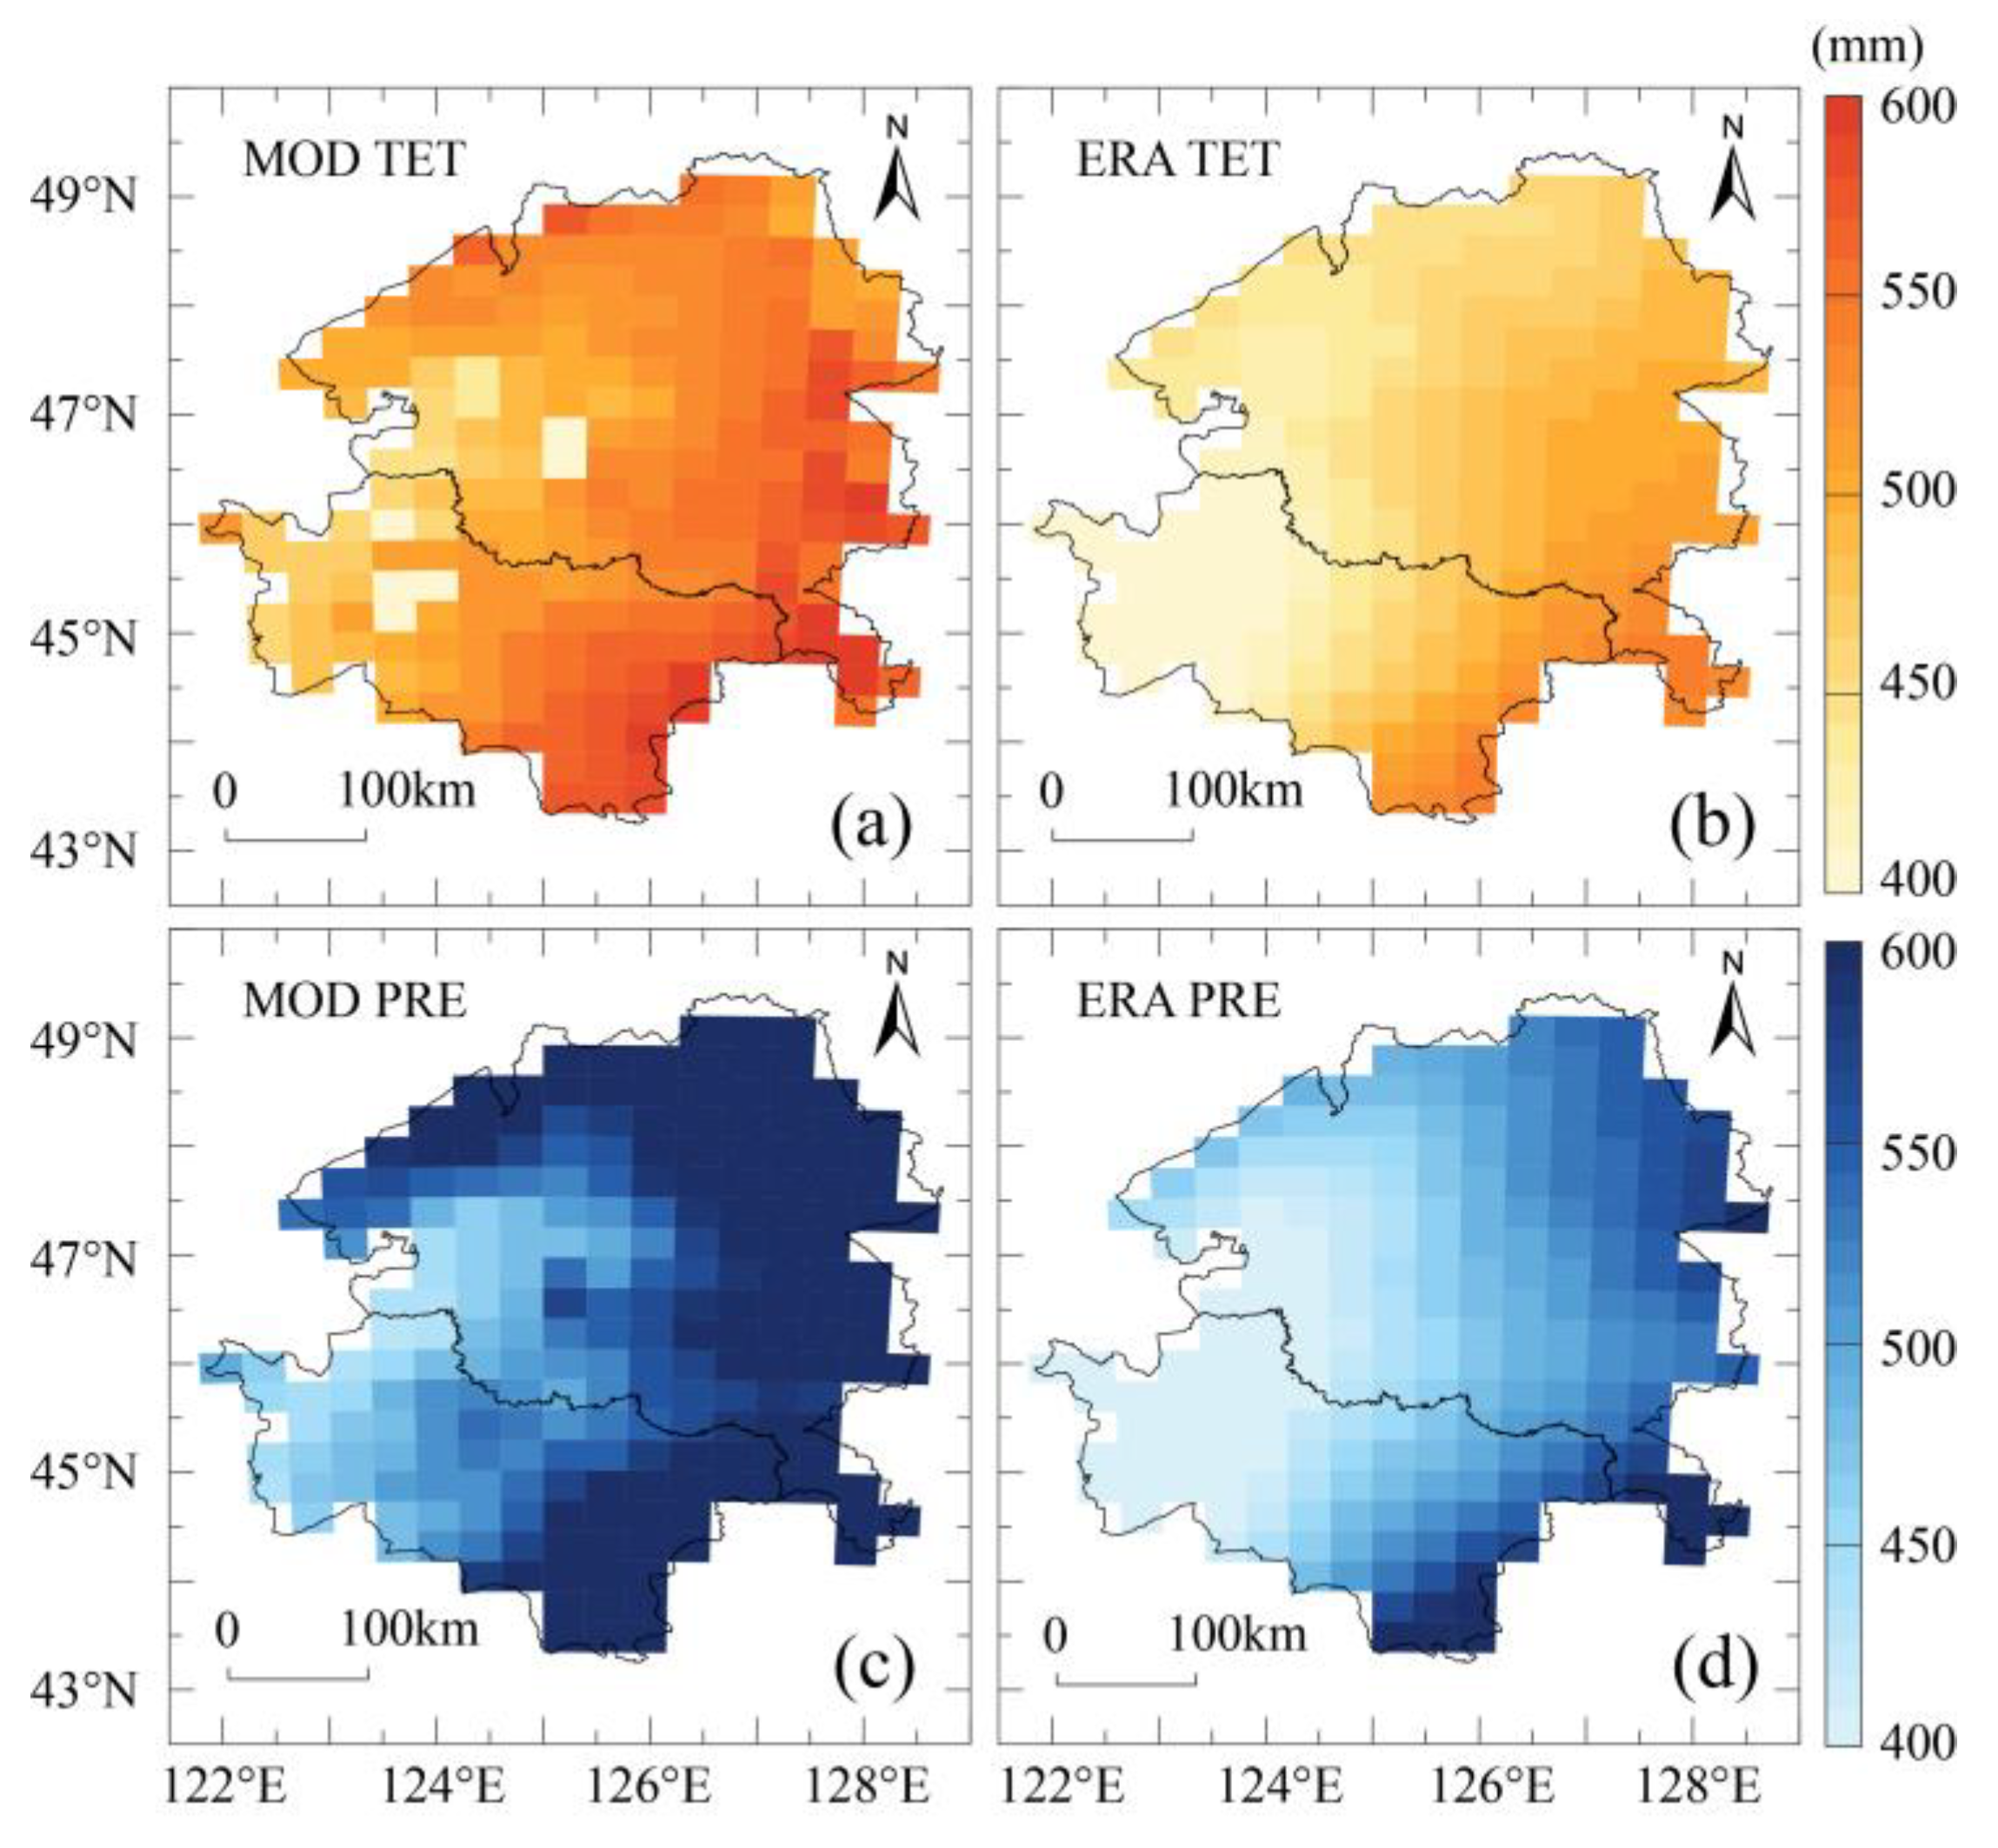
3.2.1. WRF Model Validation

To test the validity of the WRF model in the study region, the simulated PRE and TET results were compared with the ERA Reanalysis data in the recent 5-year period (2008–2012). For both variables, the monthly average values of all grids across the study region were calculated. For both PRE (Figure 4a) and TET (Figure 4c), the WRF simulation reveals the fluctuation of the ERA data in all years. In their scatterplots, the WRF simulated precipitation (Figure 4b) is significantly correlated with the ERA precipitation with a Pearson’s correlation coefficient of 0.93 (p < 0.001) and that of the simulated TET (Figure 4d) is 0.88 (p < 0.001).
For both variables, the WRF simulated outputs are generally lower than the ERA data. Since this study was merely interested in the 100-year dynamics of water effects from agricultural expansion, other environmental and socio-economic changes such as urbanization, increased population and intensified cropping activities are purposely excluded from the model simulation. This explains the absolute differences between the modeled and ERA Reanalysis in Figure 4a (PRE) and Figure 4c (TET). Figure 5 indicates that the WRF model is able to pick up the inter-annual trends of the land-atmosphere water cycle in the study region.
Spatial distributions of the WRF simulations and ERA data in the growing season, averaged in May–September, were also compared (Figure 5). For the two variables, both the model simulation (Figure 5a,c) and ERA Reanalysis (Figure 5b,d) reveal an increasing trend from the west to the east. The WRF simulated results extract more details at local scales, for example higher TET in the northwest of the study region (Figure 5a) and higher PRE in the northeast (Figure 5c). For the ERA data, the spatial patterns of TET (Figure 5b) and PRE (Figure 5d) are smoother, with one possible reason being that the ERA Reanalysis data are coarse-resolution global products from spatial interpolation of meteorological records, while the stations in the plain are limited. Taking all grids into consideration, the grid-level correlation coefficients between the WRF simulated and ERA Reanalysis data reach 0.90 (p < 0.001) for TET and 0.55 (p < 0.001) for PRE.
Assuming the ERA Reanalysis as truthing data in the period from 2008 to 2012, Figure 4 and Figure 5 indicate that the WRF model successfully extracted the spatial patterns and temporal dynamics of the land-atmosphere process in the study region. It was then used to examine the centurial dynamics of water balance following the intensive agricultural expansion.

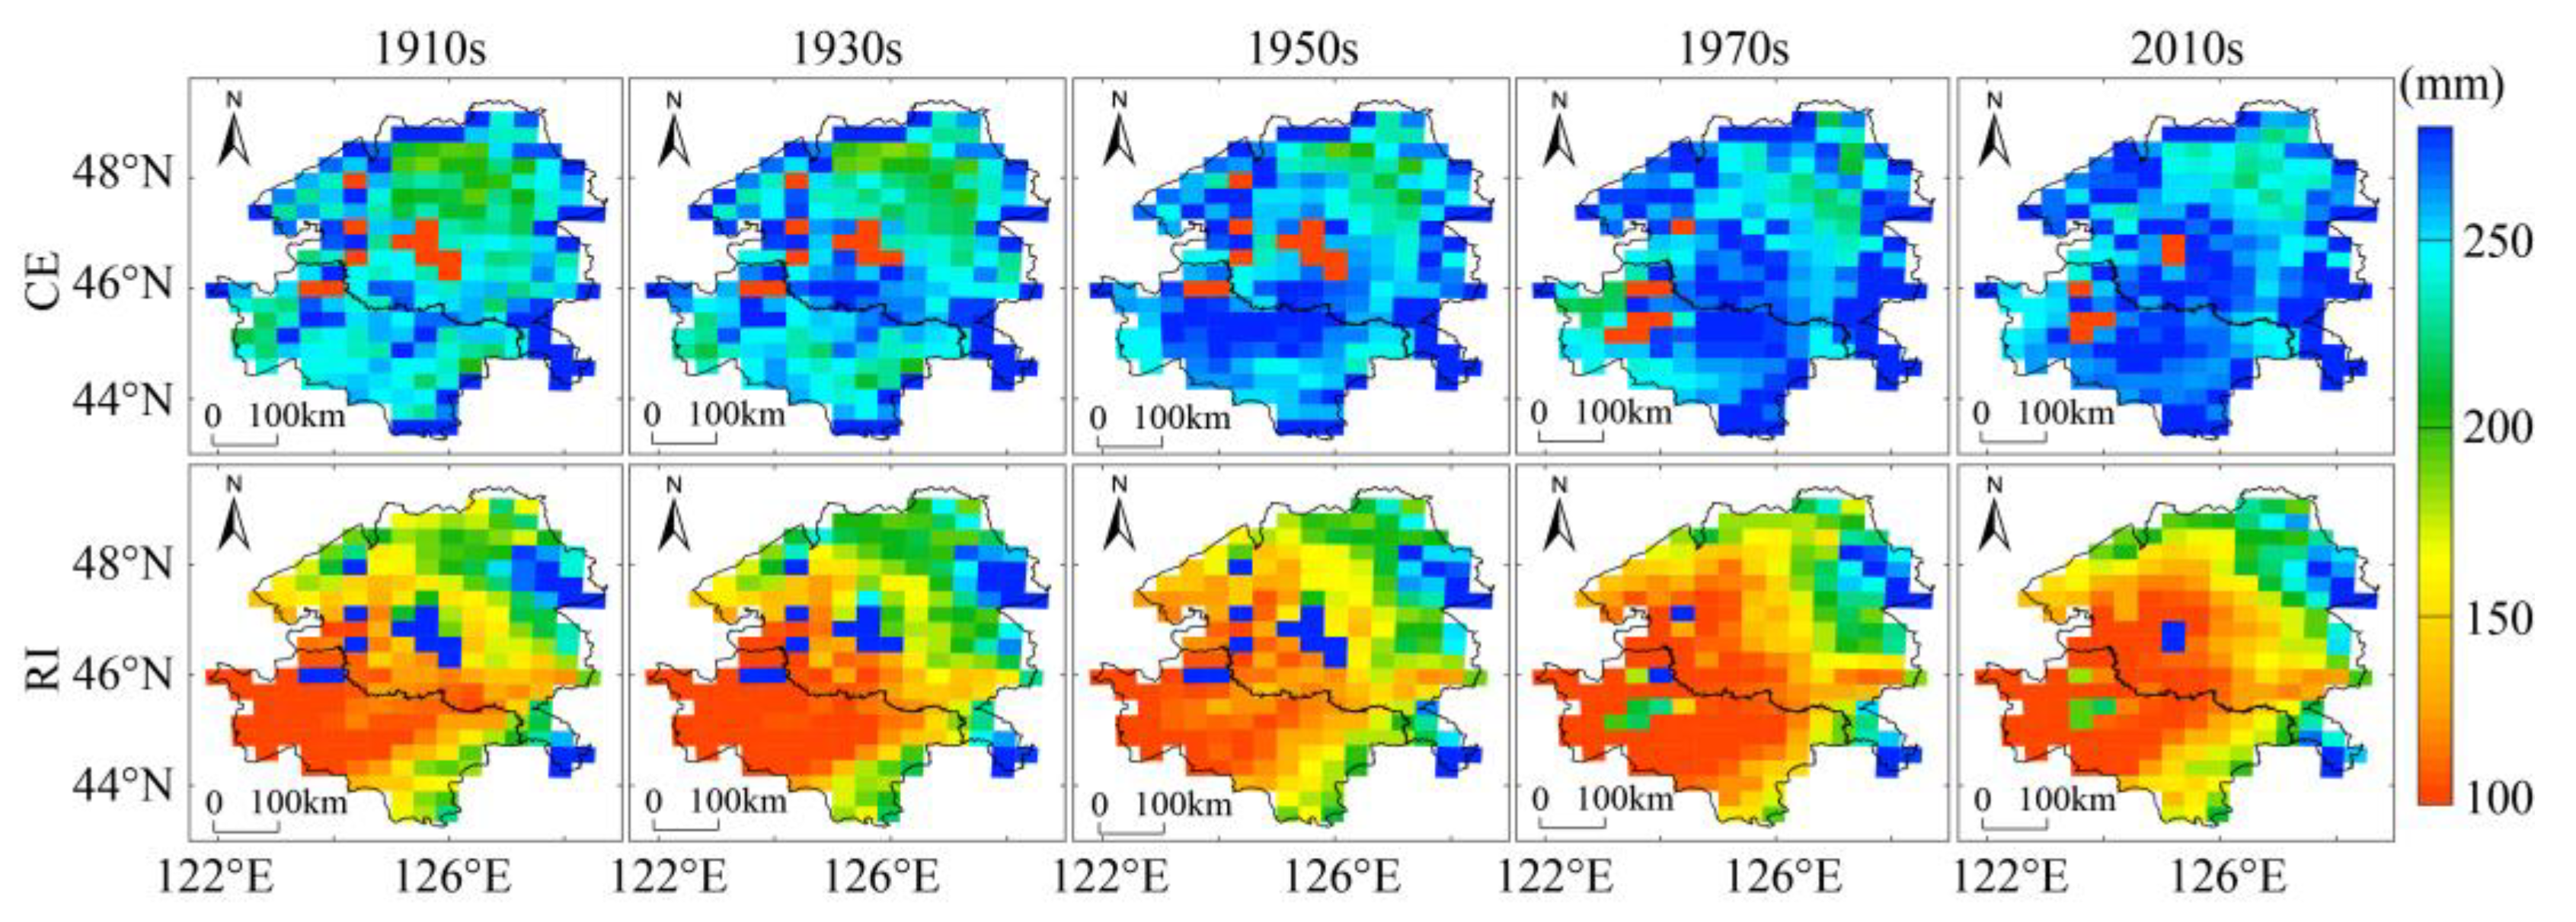
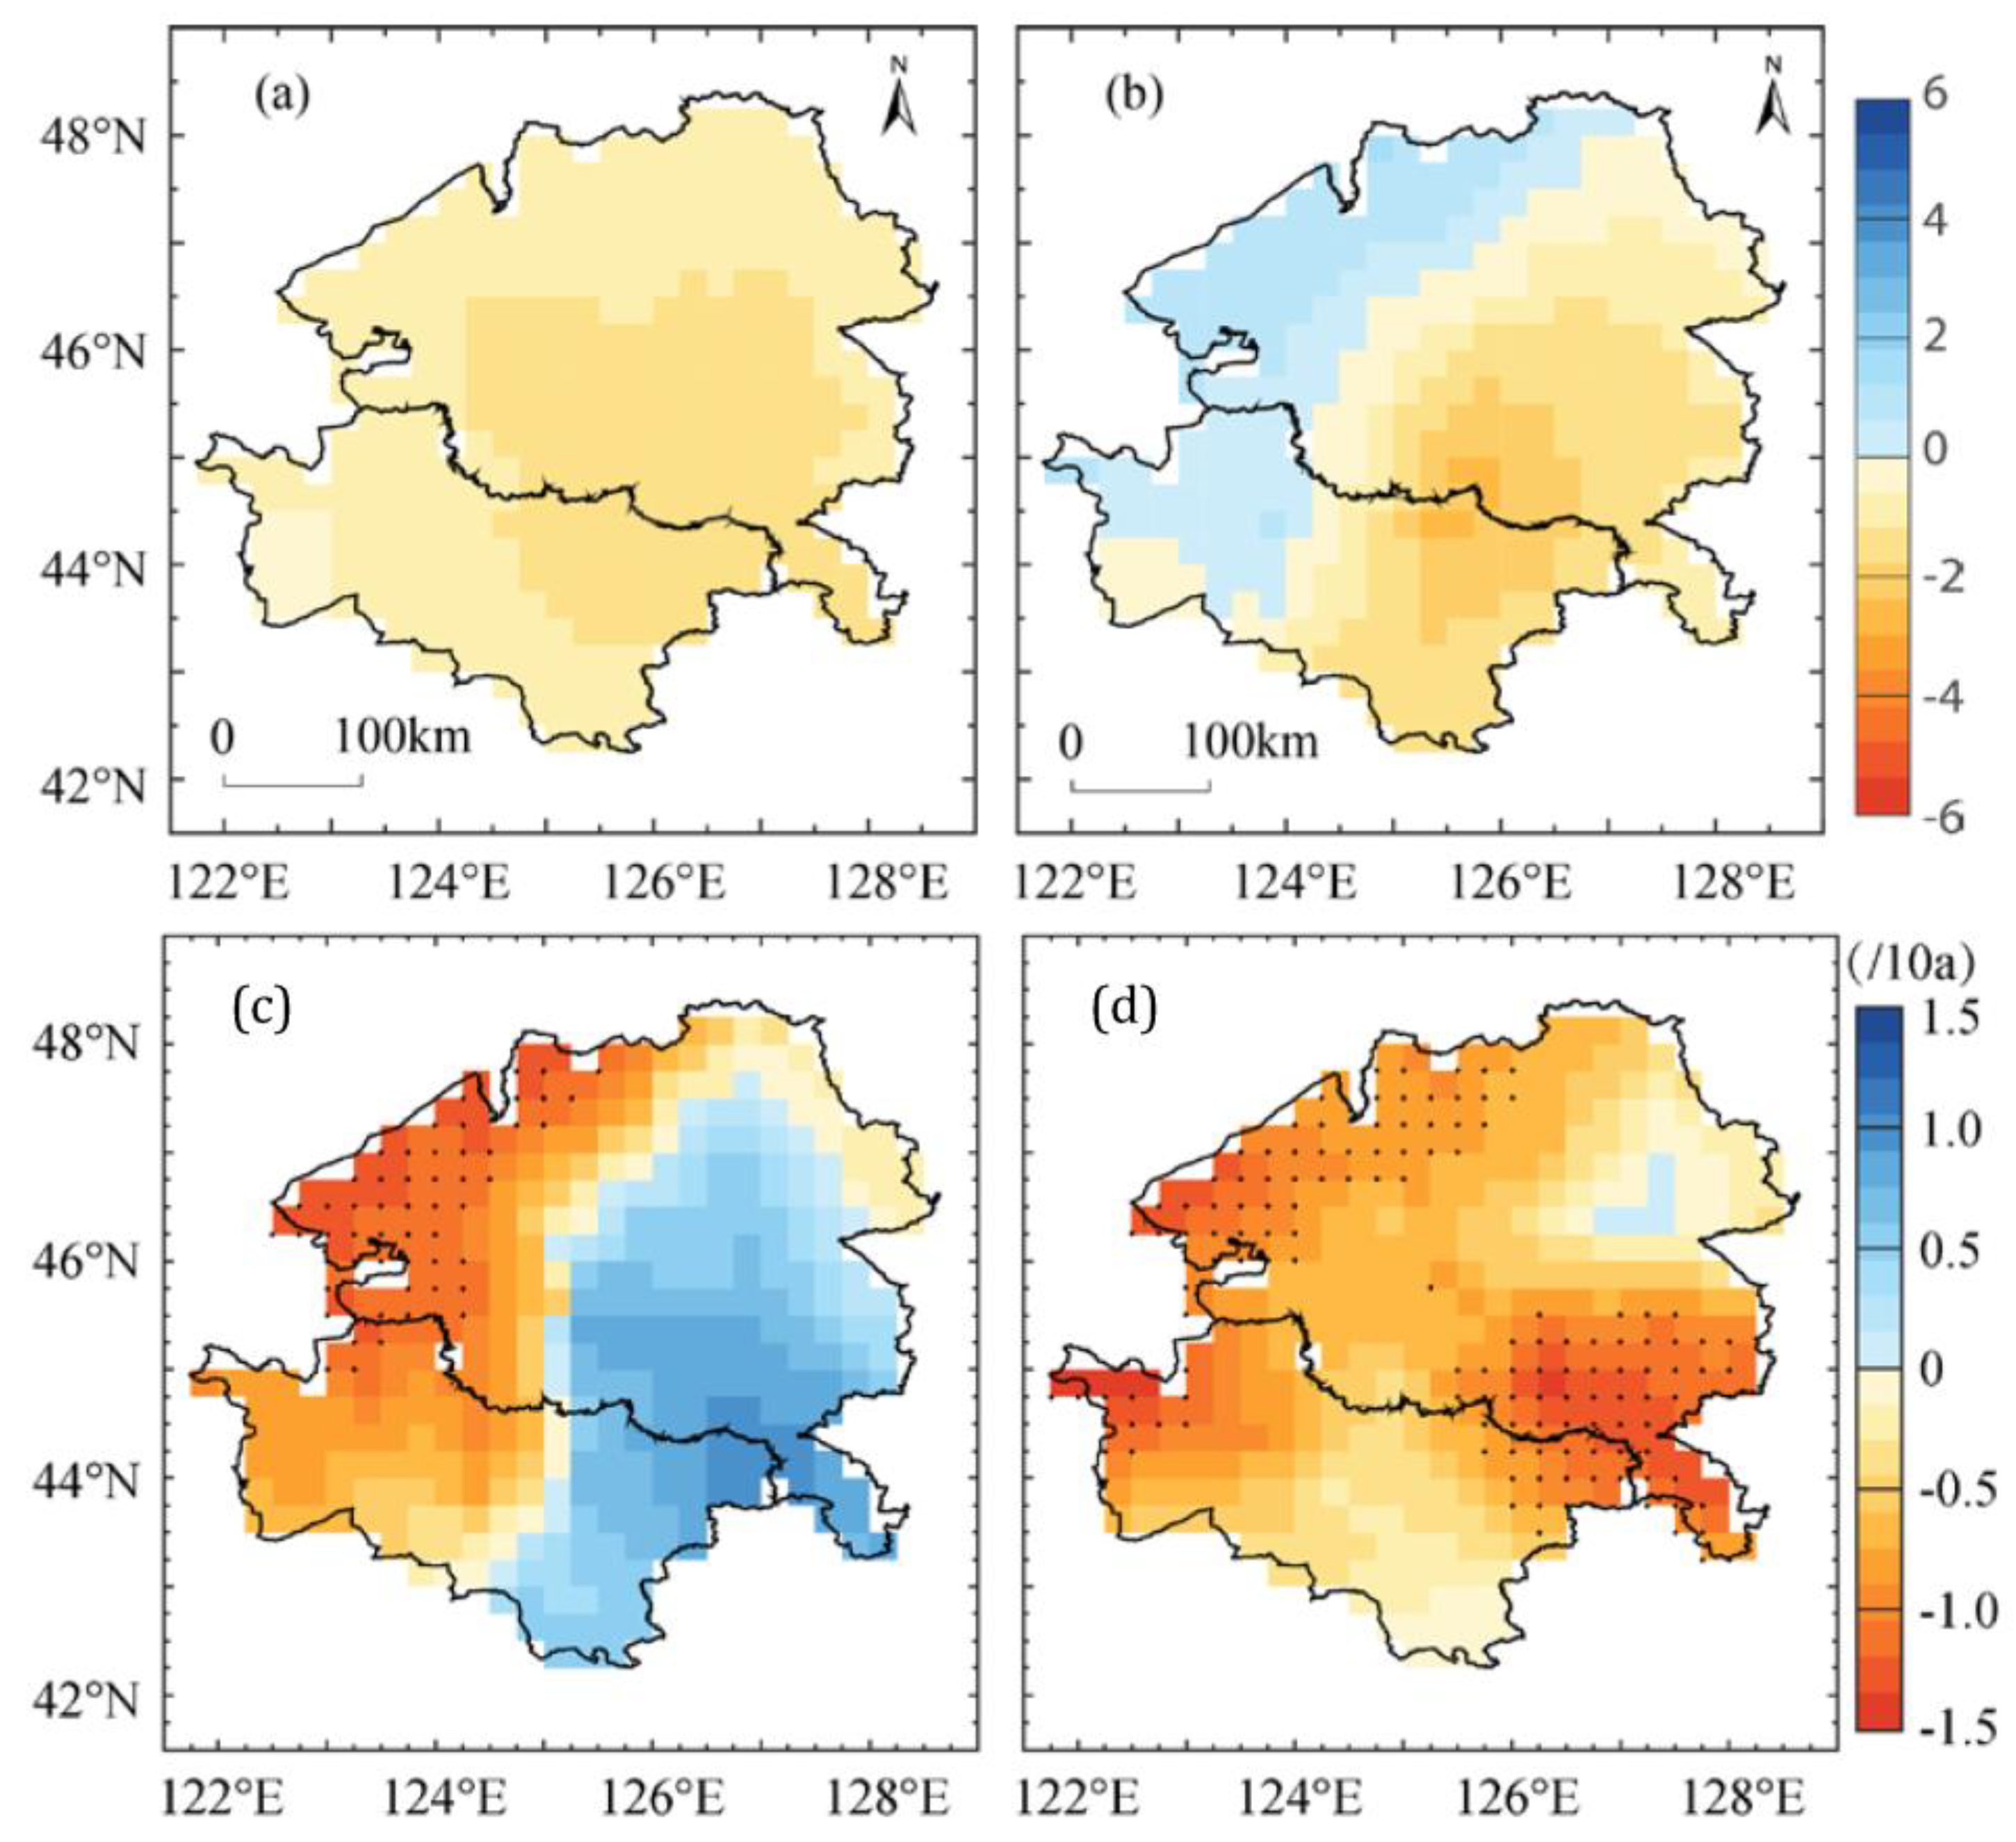
3.2.2. Water Effects of Agricultural Expansion

For the plain-wide trends, the precipitation deviations (ΔPRE) do not show a significant trend in a linear trend analysis (Figure 6a). Since the climatic variation was excluded by fixing the climatic boundary layers for all simulations, Figure 6a indicates that the centurial agricultural expansion does not have a significant effect on precipitation plainwide. However, it results in a significantly increasing trend of ΔTET (p < 0.01) with a rate of 3.4 mm/10a (Figure 6b). For both variables, the ΔPRE and ΔTET become relatively stable after the 1970s. It is reasonable because land conversion from grasslands to croplands was saturated (as shown in Figure 2).
The grid-level centurial trends of the PRE and TET deviations from the 1910s were also mapped in the study region. A linear trend analysis was performed and only the grids with statistically significant trends were mapped in Figure 6c,d. Although Figure 6a does not show a significant ΔPRE trend plainwide, its grid-level trends in Figure 6c reveal a statistically strong decrease in the central plain in a rate of 5–10 mm/10a, where agricultural expansion was actually less intensified (as shown in Figure 3). For spatial patterns of the ΔTET (Figure 6d), trends in both directions are observed. Similar to the ΔPRE distributions in Figure 6c, the ΔTET in Figure 6d also shows decreasing trends in the central plain. Different from the mono-directional ΔPRE patterns, however, the ΔTET shows statistically significant two-way changes. While the central plain also has a decreasing trend (red grids in Figure 6d), other areas all over the study region reveal weak yet statistically increasing trends (the blue grids in Figure 6d). In comparison with the land use maps in Figure 3, areas with increasing ΔTET have undergone intensive agricultural expansion in the past 100 years. It is reasonable to conclude that the total evapotranspiration increased after the permanent grass covers were replaced by annual crops. The significant decrease of local precipitation in the less disturbed central plain may reflect the localized drying effects by agricultural expansion.
The vegetation-related variables of water balance are the CE and IE. In Figure 7, their plain-wide decadal deviations against the 1910s are statistically significant, reaching a rate of 3.6 mm/10a for the ΔCE (Figure 7a) and 0.6 mm/10a for the ΔIE (Figure 7b). The absolute amount of change to the CE is much higher than the IE because the CE is a continuous physiological process of vegetation along its growth. The IE is mainly effective during rainfall. Grasses have relatively lower canopy cover and green biomass than annual crops. Conversion of grasslands to croplands thus creates stronger effects on the CE than the IE.
Given the intensified cultivation all over the region, the grid-level ΔCE (Figure 7c) and ΔIE (Figure 7d) have mono-directionally increased in the past 100 years. Studies have measured that the LAI of grasslands (with an average around 1.62) is much lower than annual crops such as spring wheat (2.82) and corn (3.49) that are commonly grown in northern China [33]. More than a two-fold increase of the LAI therefore dramatically enhances the vegetation transpiration and interception evaporation in the canopy layer. The CE in the canopy layer is mostly absorbed from water in the soil and the IE blocks water availability in the soil. Therefore, the dramatic increase of the CE and LE indicates the increased water usage accompanying agricultural expansion. In the growing season, in grids with significant centurial trends, the ΔCE and ΔIE spread across the study region, although the absolute amounts of ΔIE are generally lower than that of ΔCE.
The soil-related variables of water balance are the RI and LE. Their plain-wide deviations against the 1910s statistically decreased at a rate of −4.4 mm/10a for the ΔRI (Figure 8a) and −0.8 mm/10a for the ΔLE (Figure 8b). In the 1910s–2010s, the RI decreased 34.2 mm and the LE decreased 6.4 mm. While the LE decrease indicates less water loss from land evaporation, the decrease of RI dramatically outcompetes the decrease of the LE, also indicating a drying trend of soil moisture in the study region. In their grid-level spatial distributions, water loss in the central plain is apparent from the decreasing trends of both ΔRI (Figure 8c) and ΔLE (Figure 8d). Especially in the central plain where large areas of wetlands remain nowadays, a drying trend is suggested by a strong decrease of the RI. This is in agreement with the spatial patterns in Figure 6 and Figure 7 above.
The three figures above demonstrate the increased water usage in crop canopies (Figure 7) and decreased water availability in the soil (Figure 8), resulting in an enhanced total water loss in this agricultural region (Figure 6). These changes are jointly attributed to the drought effects across the study region. Geographically, the central plain reveals the highest sensitivity of water effects. In this area, the decreased precipitation directly reflects a drying trend affected by the expanded cultivation. The temporal trends in Figure 7 and Figure 8 show that the CE and RI have the largest amount of changes in the 1910s–2010s. Using these two variables as examples, their spatial distributions in different decades are simulated in the WRF model (Figure 9). Along with the conversion of grasslands into croplands, the CE increase and RI decrease are apparent. Spatially, the CE increases all over the region but the decrease of the RI is more dramatic in the central plain. Therefore, these two variables explain different mechanisms of water loss; one is in the vegetation layer and the other is on the soil surface. Both variables effectively reveal the drying trend in the plain.

3.3. Comparison with Drought Index

The PDSI of the study region was extracted to compare with the drought effects identified in this study. Two stages of the last century are considered: the initial stage (1901–1930) and the post-stage (1981–2010) after agricultural expansion. Overall, the 30-year average PDSI distributions in the initial stage indicate slightly dry conditions across the plain (Figure 10a). The southeast of the plain, where the expansion started (as shown in Figure 3), is drier than other areas. Agricultural expansion actually slowed down after reaching saturation in the 1970s. In the post-stage PDSI map (Figure 10b), the west of region becomes slightly wetter and the east is drier. The relatively low PDSI values across the plain, however, indicate a mild climate in both stages. Temporally, the PDSI trends in each stage are examined via a linear trend analysis and tested at a significance interval of 0.05. In Figure 10c, opposite trends in the west and east of the plain are observed in the initial stage but only the drying trends in the northwest are significant. This is reasonable because agricultural expansion was still in its early stage in this period. In the post-stage, the drying trends become stronger across the plain (Figure 10d) and more grids with significant drying trends are observed in both the northwest and the southeast.
The PSDI considers the interaction of land surface and climatic conditions. As shown in Figure 5, the modeled and ERA Reanalysis data confirm that the precipitation decreases from west to east. Both Figure 10b,c show apparent transect lines splitting the west and east, which may be explained by the climatic patterns of the region. Although the PSDI grids with significant trends in Figure 10c,d do not exactly comply with the drying trends identified in this study, the widespread PSDI patterns support our results that the Songnen Plain has become drier in the past 100 years, although the drying pace may be slow given the low PDSI values in both stages. The PDSI captures the basic climatic effects on drought through changes in potential evapotranspiration due to land expansion. It has to be noted, however, this simple index has some key limitations and is less accurate than the more advanced drought indices such as the Standardized Precipitation Index (SPI) [34] and the Standardized Precipitation Evapotranspiration Index (SPEI) [35]. When advanced data become available, we will explore these advanced indices in explaining the drought effects in the study region.
The annual (year-long) and growing-season climatic variables in the two periods were further compared (Table 2). The ANOVA analysis shows that the precipitation and precipitation days do not have significant differences between 1901–1930 and 1981–2010. However, there is a significant increase for both annual and growing-season water vapor pressure between the two periods. The annual evaporation is also significantly increased, probably due to decreased vegetation cover after harvesting. These significant changes in Table 2 also agree with our WRF-model simulation that the study region has become drier.
The drought effects simulated via the WRF model in this study agree with field observations in past studies of the region. From the observations of 30 meteorological stations in 1961–2013, Zheng et al. [36] found an upward trend of average drought index in the Songnen Plain and the annually increasing number of medium-scale droughts indicated the enhanced drought severity in this region. Our results are also supported by the observed warming and drying trend since the 1960s [37], although some studies claimed that the precipitation change was not significant in the past 50 years [38]. Our major findings about the water effects of agricultural expansion are also in agreement with past model-based studies in other regions. For example, similar to the increased evaporation and water vapor pressure in Table 2, Douglas et al. [39] found an increase of vapor fluxes due to agricultural land use change and irrigation in the Indian Monsoon Belt. Using over 1500 estimates of annual evapotranspiration worldwide, Sterling et al. [2] reported a dramatic decrease of terrestrial evapotranspiration due to the loss and degradation of wetlands. This finding also agrees with our simulated results of total evapotranspiration in Figure 6b, where the wetland-dominated central plain has undergone significant TET decrease in the past century.
Most WFR model efforts in past studies have focused on the climatic responses such as temperature, precipitation and carbon flux. While agricultural expansion is integrated in their simulations, the simulated outputs are inevitably affected by climatic change in global energy cycles, which heavily contaminate the impacts specifically from land use change [40]. In a uniquely different view angle, our study simulated the water balance between the land-atmosphere interactions in which the LULC change is the primary driver of the region. Therefore, our results better explain the centurial changes to the water cycle caused by agricultural expansion. In the 30-km grid scale of our WRF model, all crop types are treated equally as croplands in the simulation. Actually, crops in the study region (e.g., corn, soybean and winter wheat) contain different canopy structures and green biomass. Intensified cropping activities and management strategies further enlarge their biophysical heterogeneities. With a high-resolution (km-scale) WRF model and advanced computer power, it is possible to simulate individual crop types and management activities to better quantify the water effects of land cultivation and conversion.
One assumption in this study was to fix the climatic boundary layers with the 5-year average data to remove the effects of weather dynamics in the model simulation. While the simulated precipitation and evapotranspiration are noticeably lower than the Reanalysis data (as shown in Figure 4), our model fairly matches the 5-year trajectories that the Reanalysis data explain. It is good enough for this study as we only examine the impacts of areal expansion of agricultural lands. To better understand the water effects of land use change, more detailed, human-induced modifications should be considered, for example irrigation and fertilizing intensities. These changes do not affect the planting acreage but may dramatically change water usage and land-atmosphere interaction. Moreover, drought effects of agricultural expansion may also be related to the decreased total area of waterbodies. Although not investigated here, past studies have reported that water coverage in the Songnen Plain has decreased 14% since 1986 [24]. Although intensified water usage in the region is probably the major contributor to water volume decrease, the shrinking water resource from runoff and ground water infiltration may also play a role and deserves further investigation. Due to limited sources of soil data in such a large region, this study does not separate these two water variables. When the extent and volume of water bodies across the region are available, the variation of runoff and infiltration could be separately examined. In our future research, we will address these LULC-related changes in the WRF model to better quantify the drought effects of agricultural intensification.
Finally, the Songnen Plain is one of three Black Soil Belts in the world. Soil organic matter in the plain has dropped from 4–6% in the 1960s to 0.8–4.7% in the 2000s [41]. It has been commonly recognized that intensified cultivation plays a major role in soil degradation. Studies also reported that droughts amplified the decrease of organic matter in soil [42]. Identifying the drought effects of agricultural expansion across the plain, this study suggests the urgent need for Black Soil conservation for sustainable development of this important agricultural region.

4. Conclusions

This study explored the spatiotemporal dynamics of centurial agricultural expansion in the Songnen Plain, Northeast China and assessed its impacts on the land-atmosphere water cycle via WRF model simulation. Primary findings include:
(1)
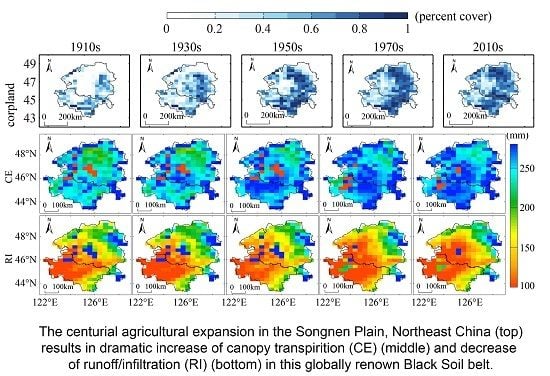
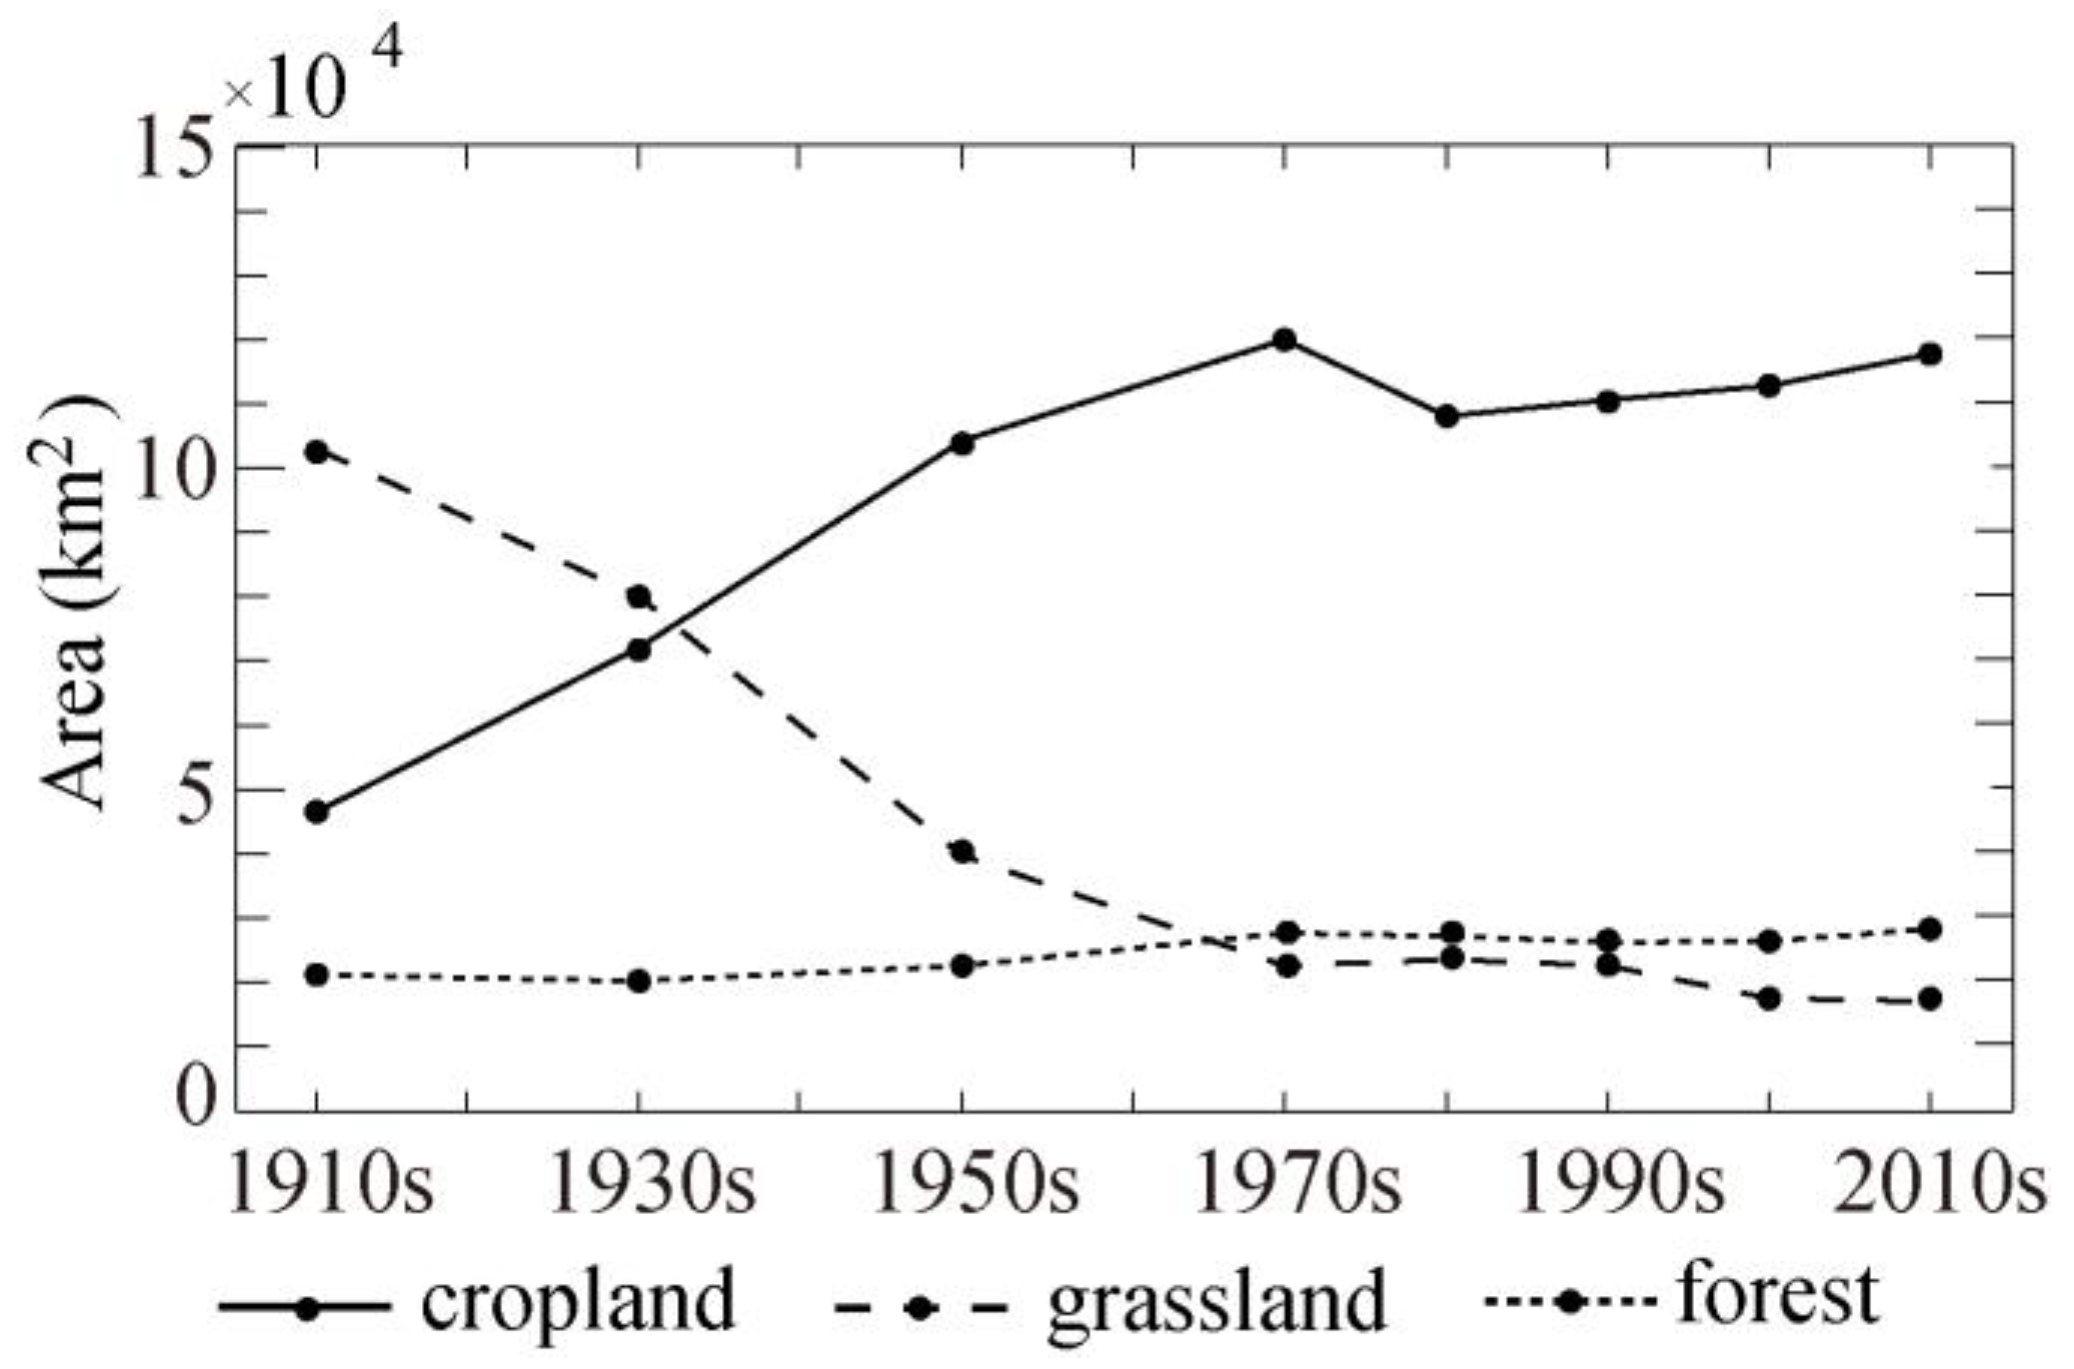
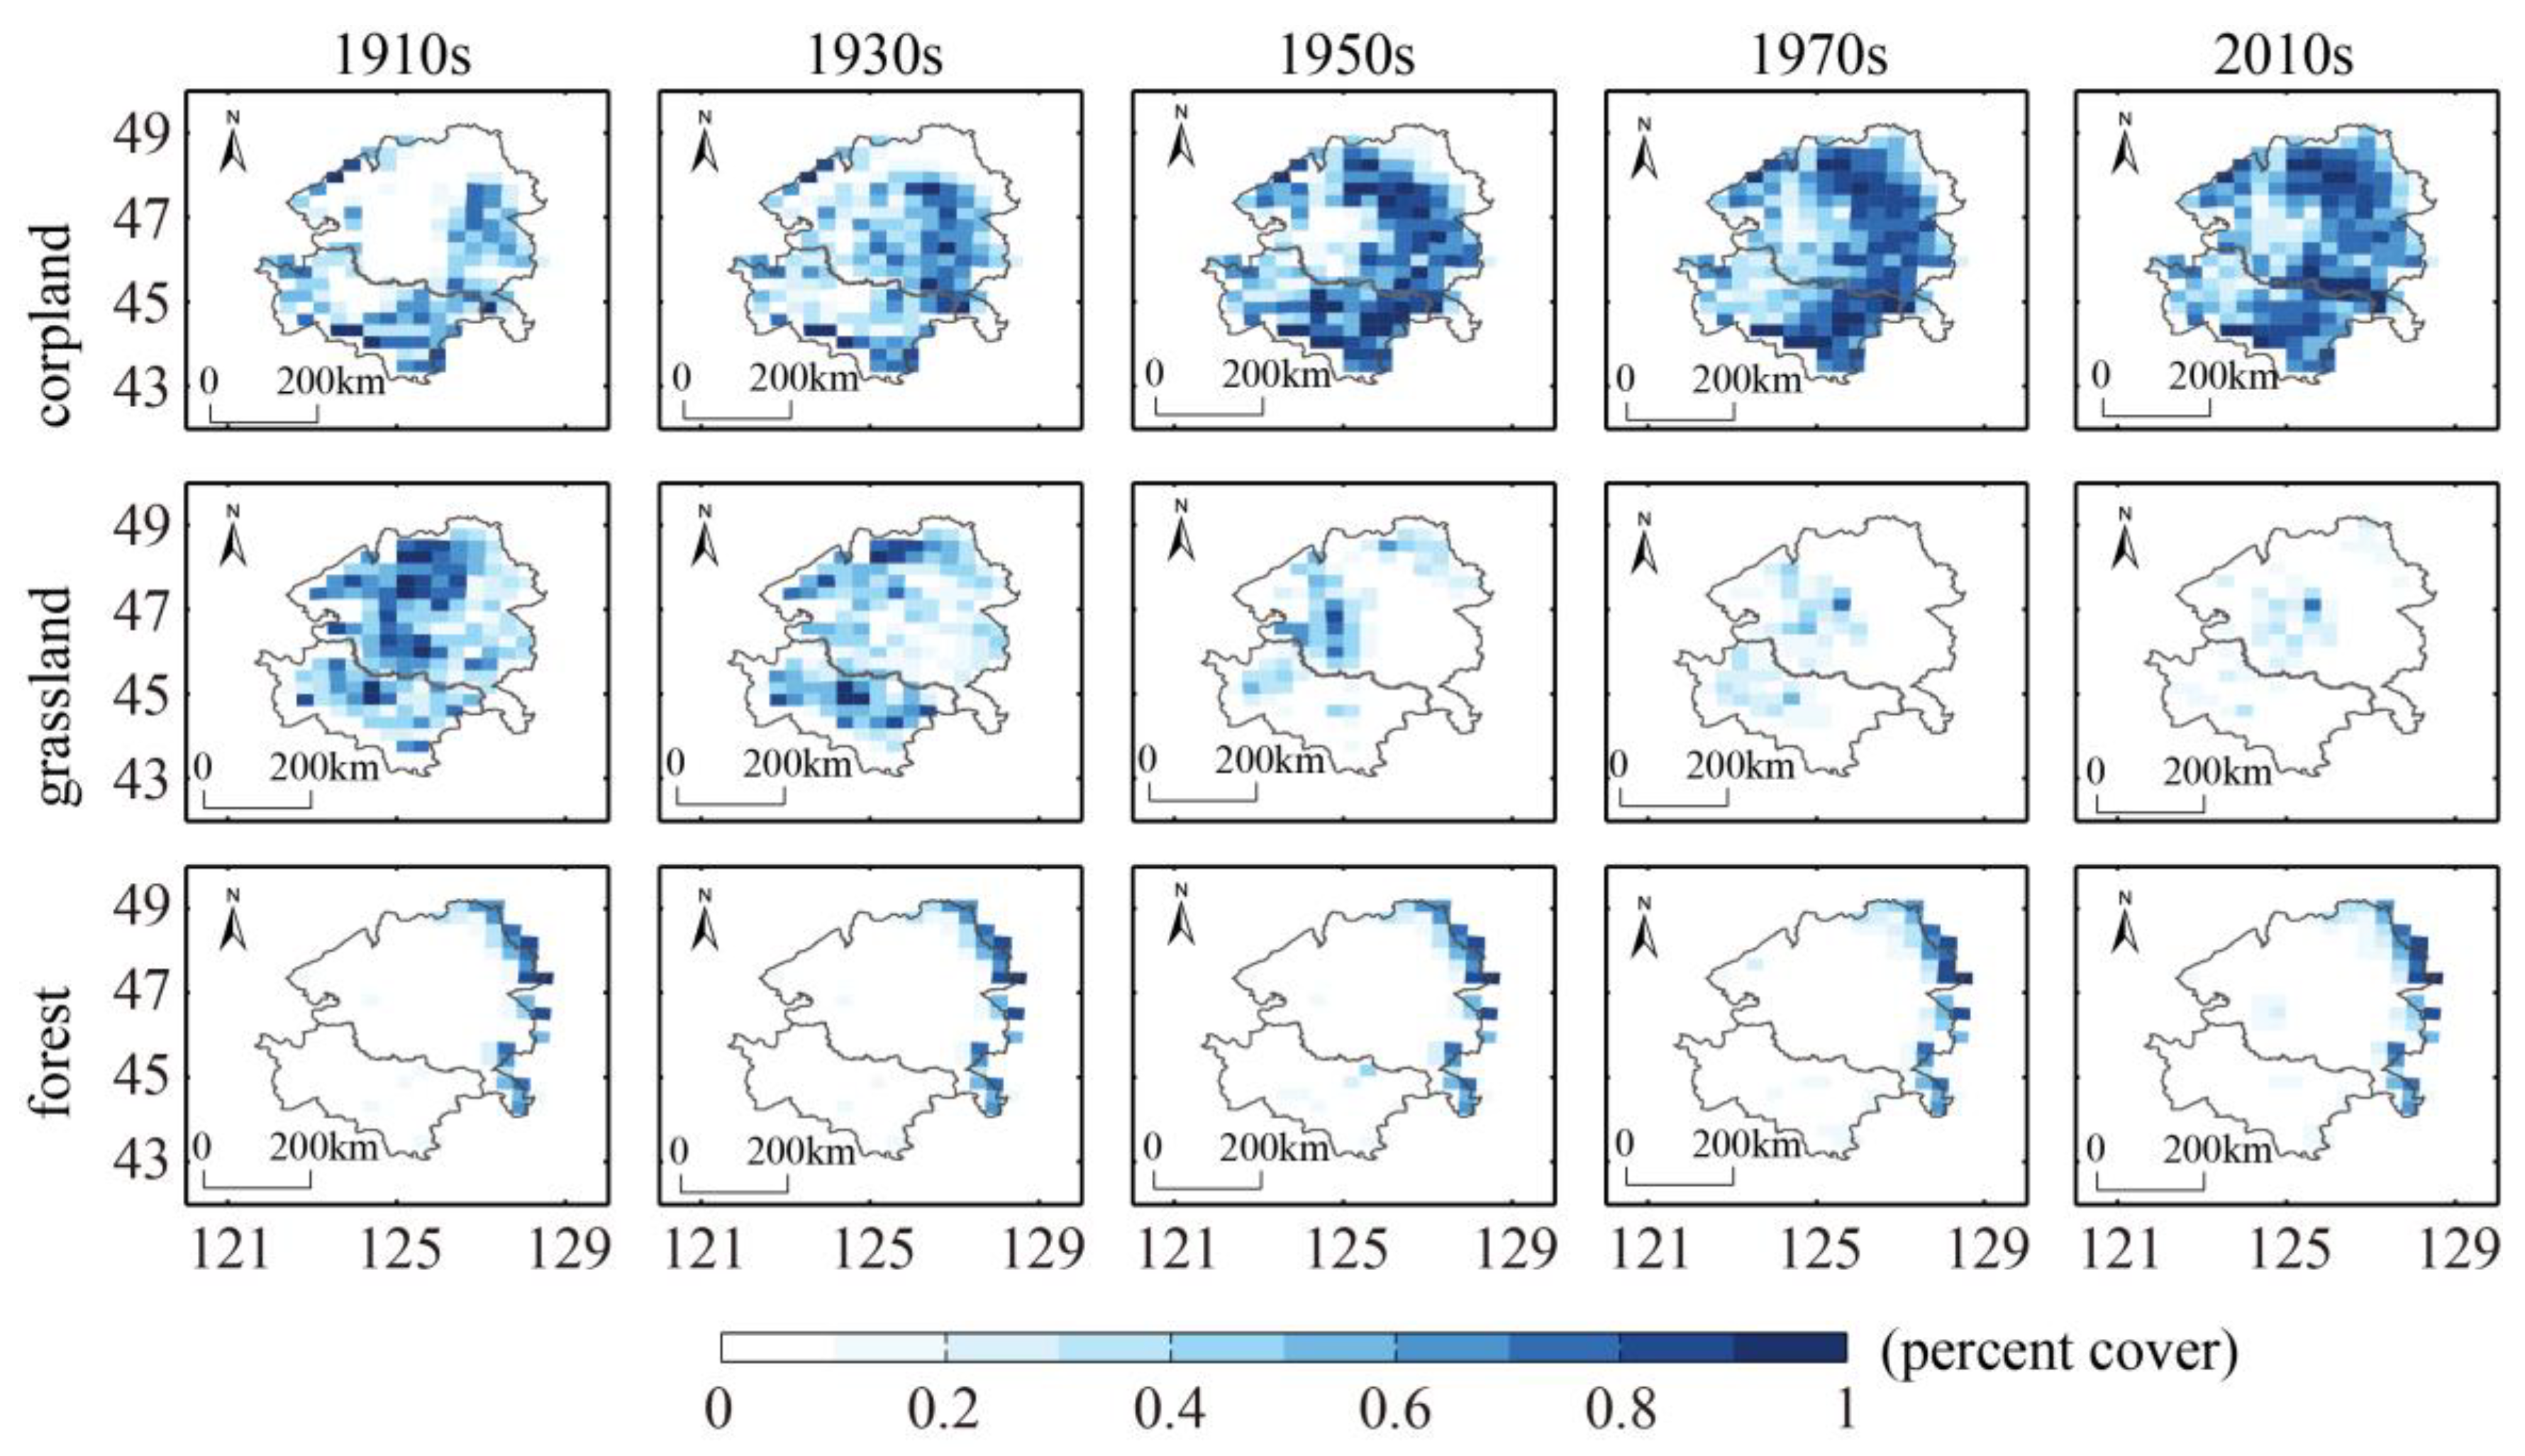
Agricultural lands in the plain were primarily converted from the historically predominant grasslands and were expanded from 28% of the plain in the 1910s to 72% in the 2010s.
(2)
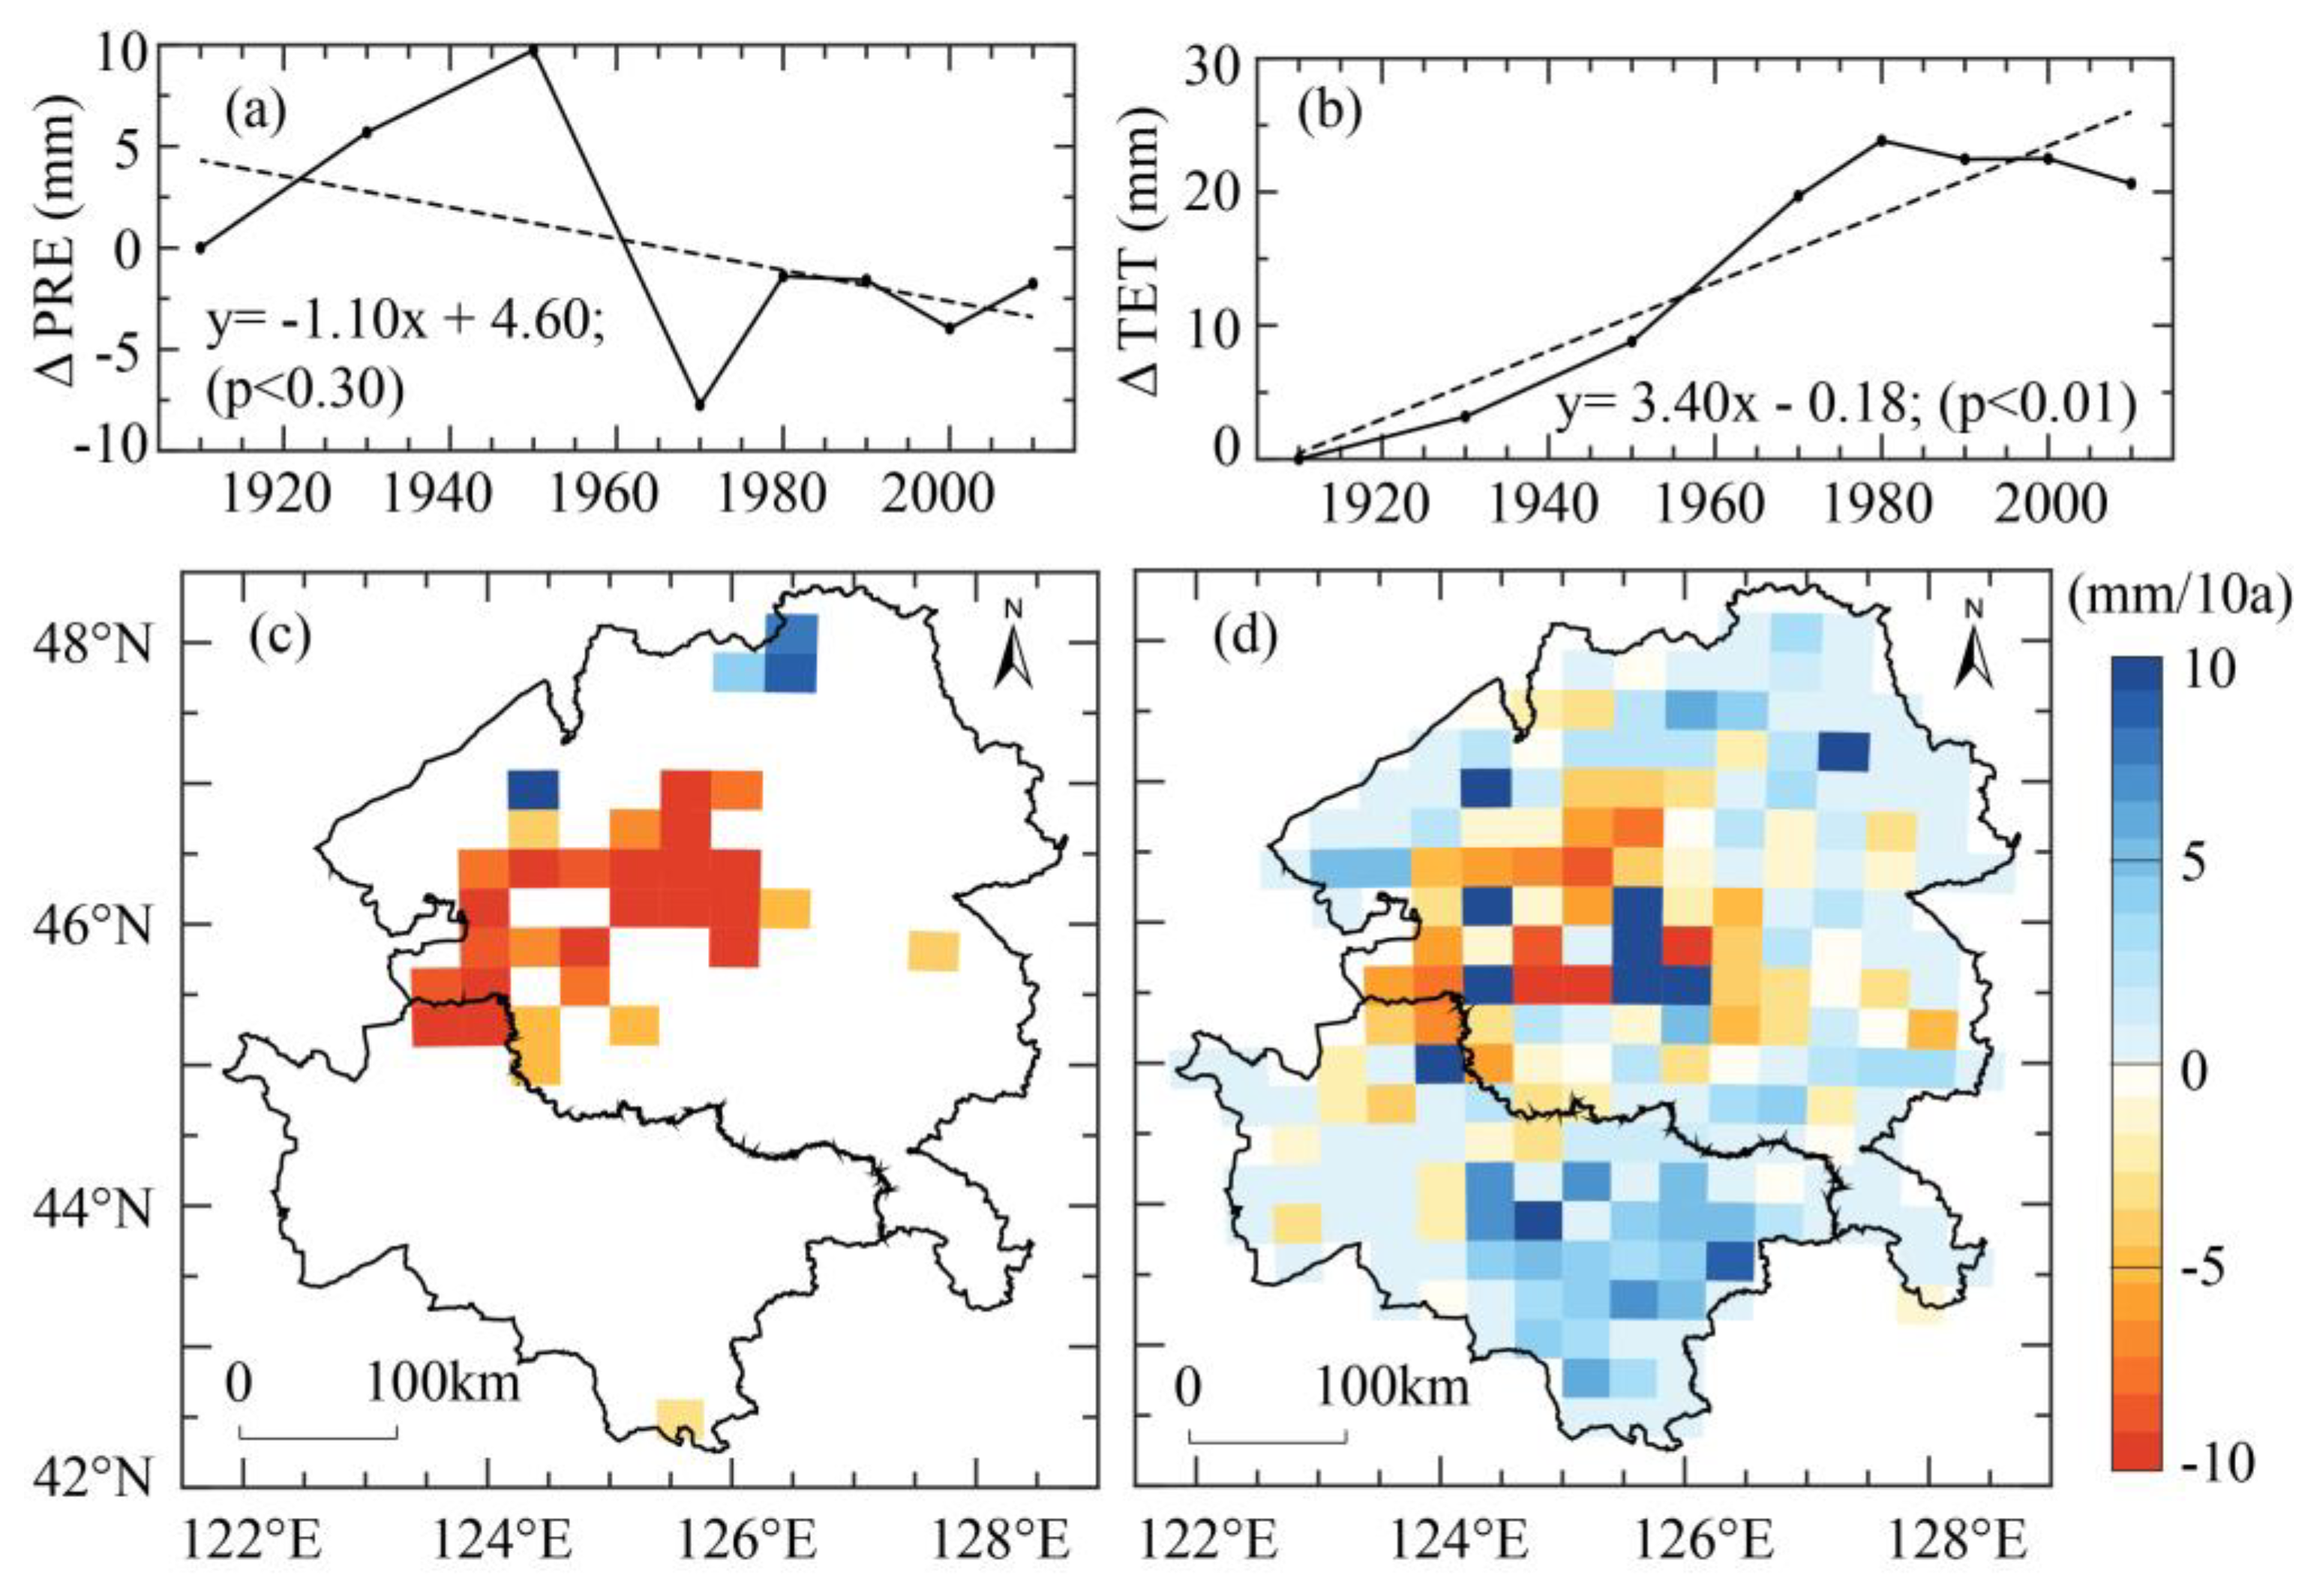
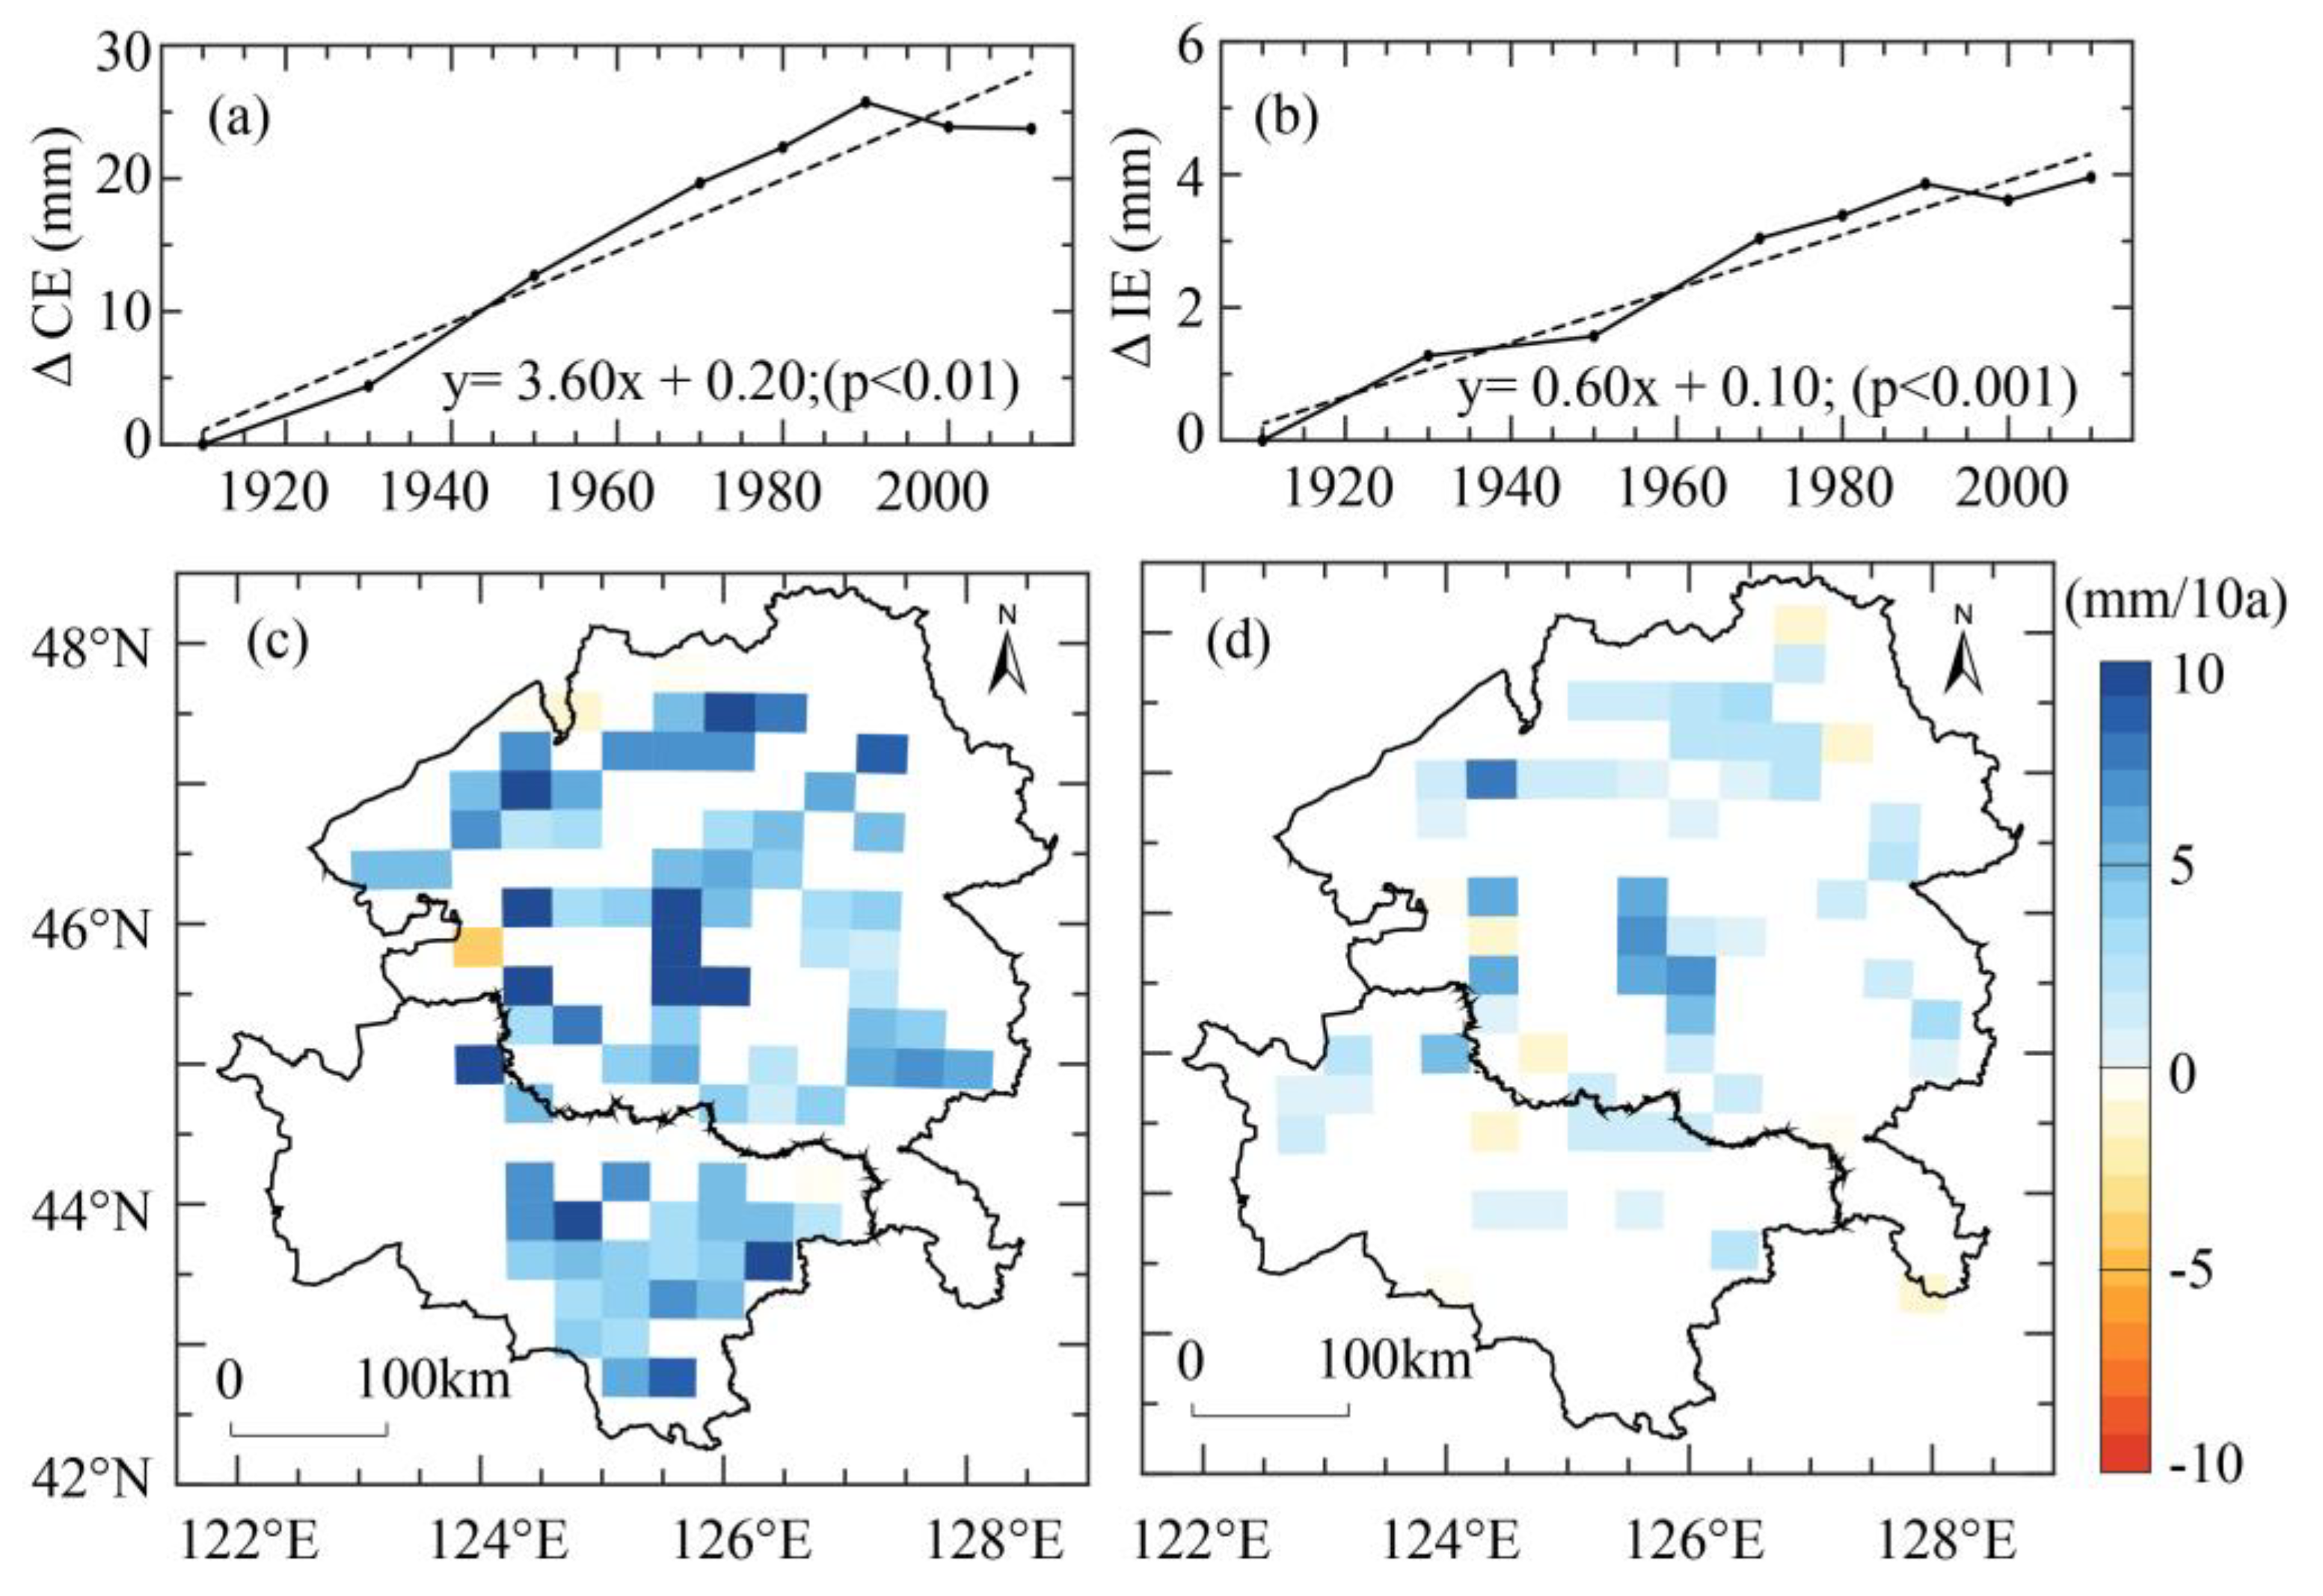
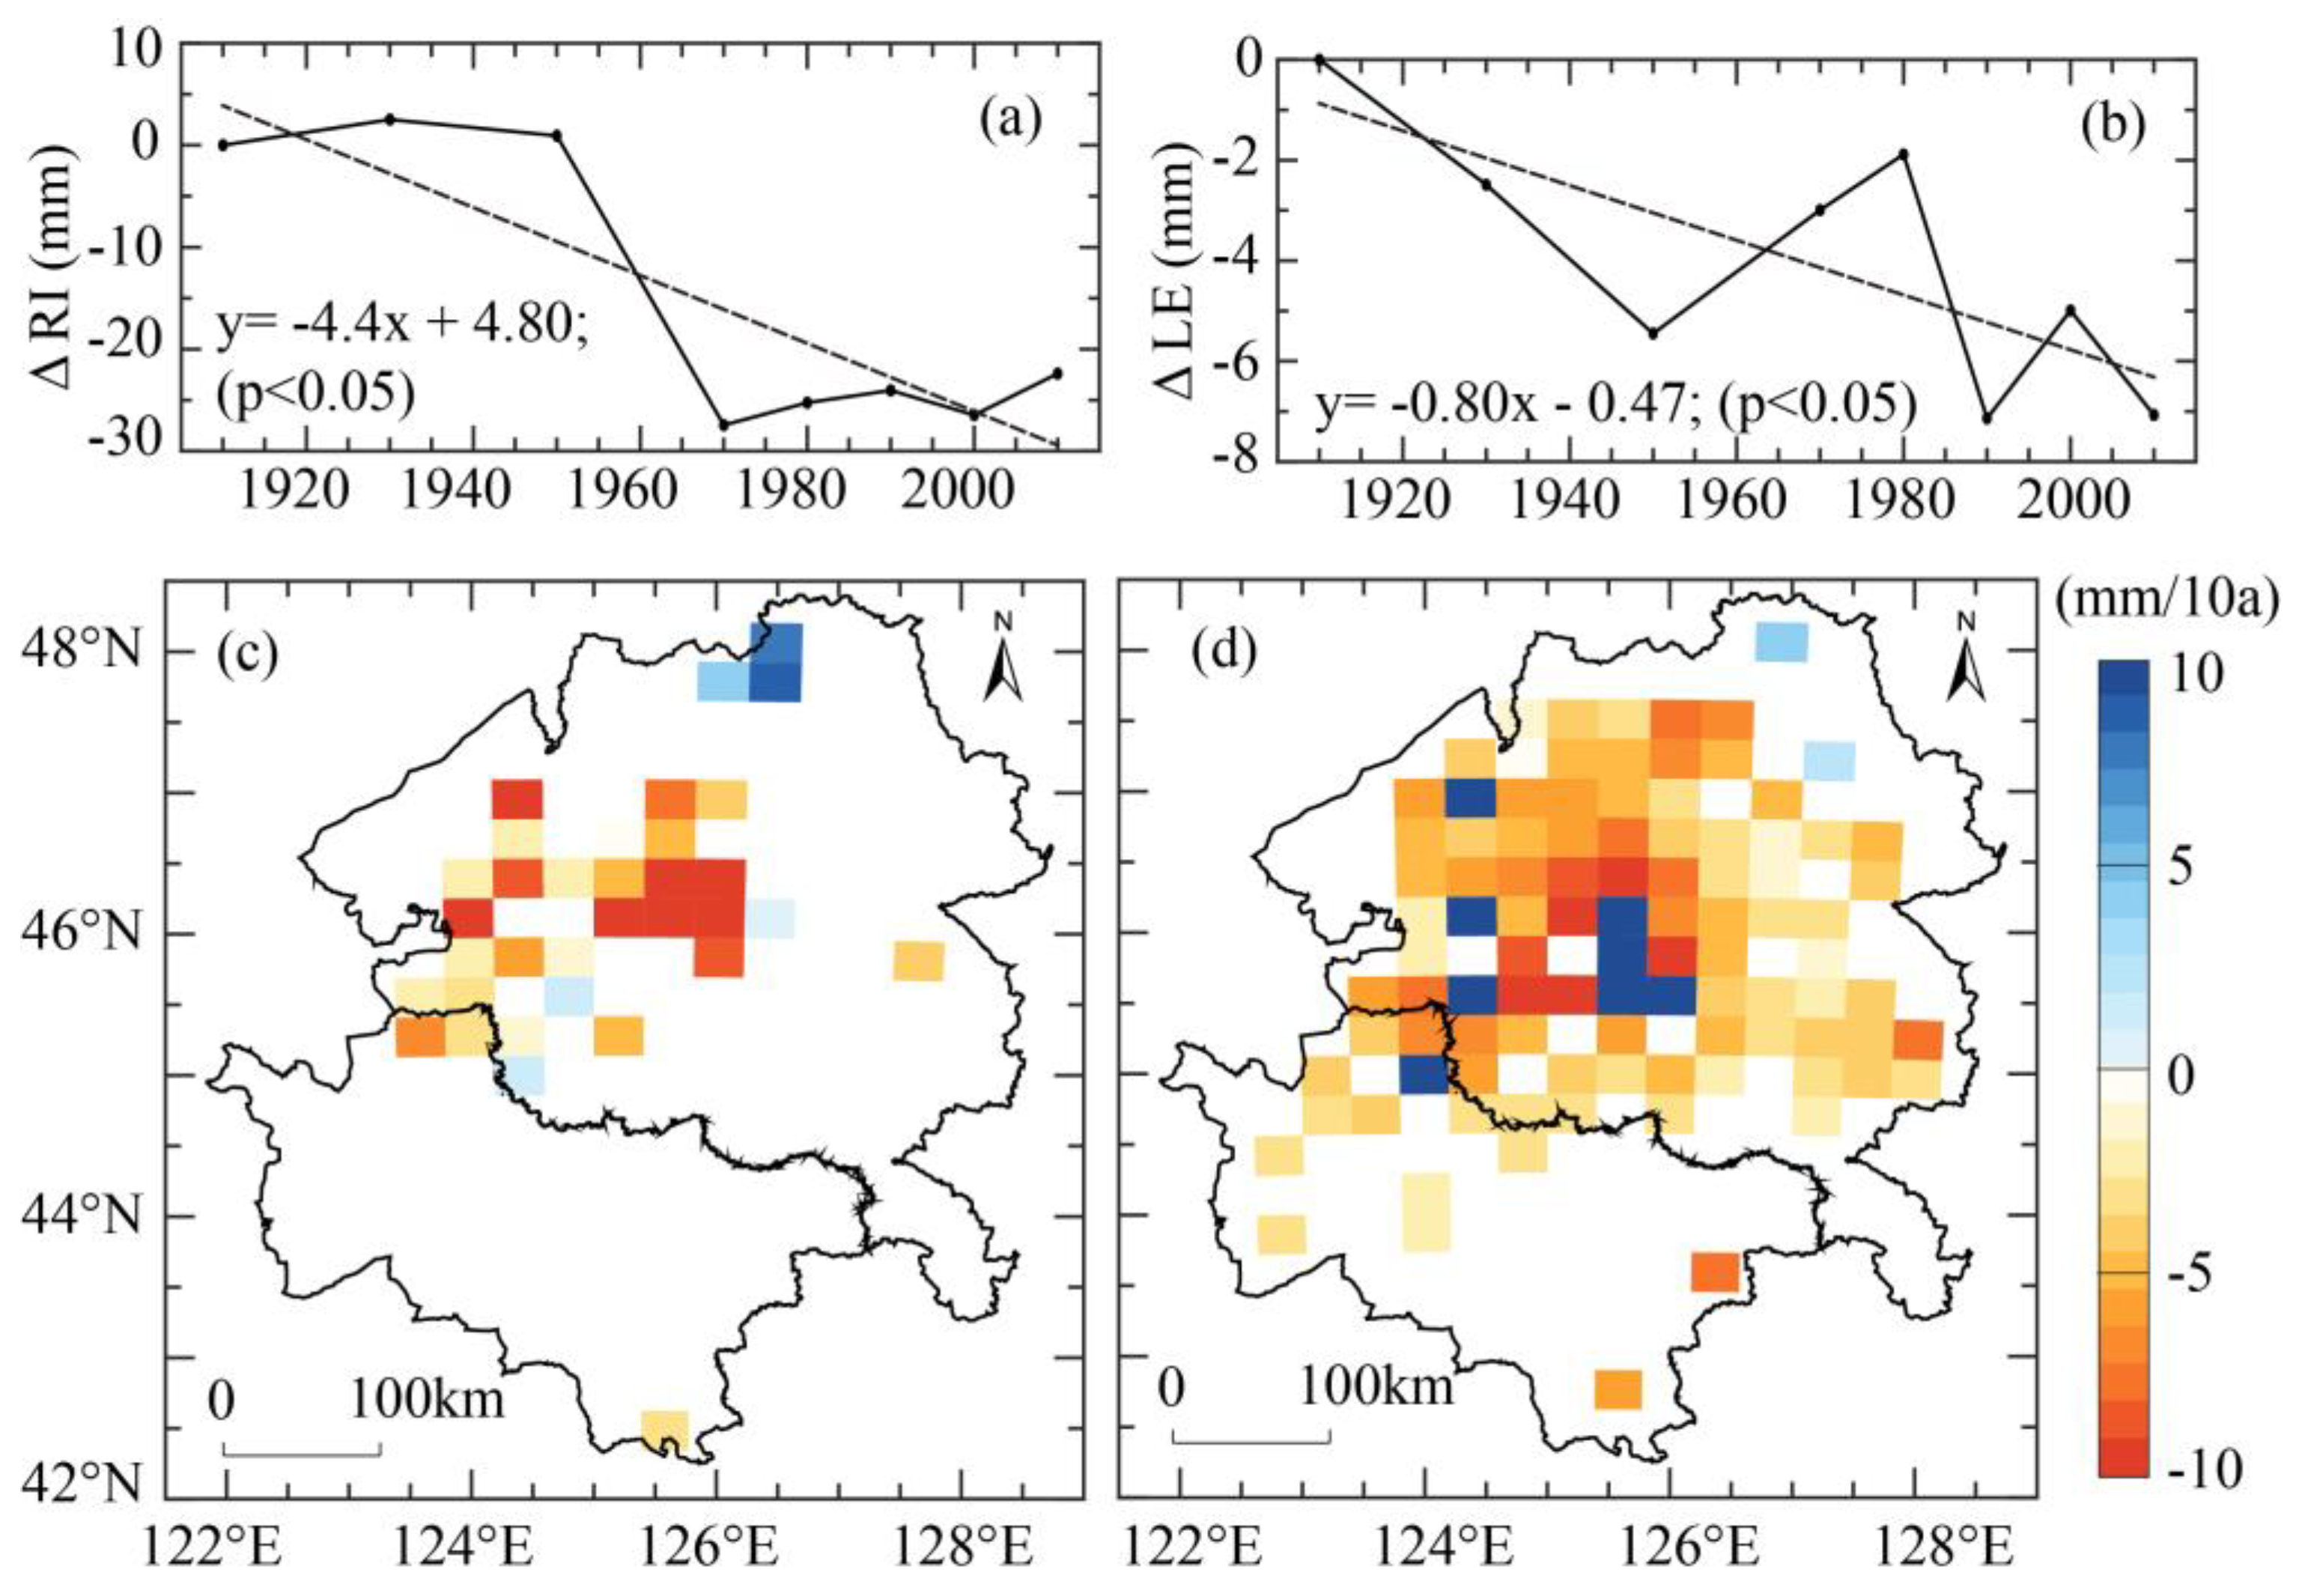
The WRF model simulations showed that the plain-wide precipitation did not change significantly in the past 100 years but agricultural expansion resulted in a dramatic increase in canopy transpiration (at an average rate of 36 mm/10a) and vegetation interception evaporation (6 mm/10a) and a decrease in surface runoff and infiltration in soil (−44 mm/10a) and land surface evaporation (−8 mm/10a). All these aspects jointly attributed to the increased evapotranspirition across the plain.
(3)
This study reveals a drought effect of centurial agricultural expansion in the Songnen Plain, which is supported by the stronger decreasing trends of the Palmer Index since the 1980s. The drying trend in its Black Soil raises alarm about the sustainability of this famous Black Soil Belt.

Author Contributions

L.Z. designed the research framework and drafted the manuscript; C.W. completed the manuscript and made major revision; X.L. contributed to model simulation and data analysis; H.Z., W.L. and L.J. collected the data and provided preliminary processing for model inputs.

Funding

This research is funded by the National Natural Science Foundation of China (No. 1771067 and No. 41371397).

Conflicts of Interest

The authors declare no conflict of interest.

References

  1. Pielke, R.A. Land use and climate change. Science 2005, 310, 1625–1626. [Google Scholar] [CrossRef] [PubMed]
  2. Sterling, S.M.; Ducharne, A.; Polcher, J. The impact of global land-cover change on the terrestrial water cycle. Nat. Clim. Chang. 2012, 3, 13688–13692. [Google Scholar] [CrossRef]
  3. Feddema, J.J.; Oleson, K.W.; Bonan, G.B.; Mearns, L.O.; Buja, L.E.; Meehl, G.A.; Washington, W.M. The importance of land-cover change in simulating future climate. Science 2005, 310, 1674–1678. [Google Scholar] [CrossRef] [PubMed]
  4. Stone, B. Land use as climate change mitigation. Environ. Sci. Technol. 2009, 43, 9052–9056. [Google Scholar] [CrossRef] [PubMed]
  5. Foley, J.A.; DeFries, R.; Asner, G.P.; Barford, C.; Bonan, G.; Carpenter, S.R.; Chapin, F.S.; Coe, M.T.; Daily, G.C.; Gibbs, H.K.; et al. Global consequences of land use. Science 2005, 309, 570–574. [Google Scholar] [CrossRef] [PubMed]
  6. Alexandratos, N.; Bruinsma, J. World Agriculture Towards 2030/2050: The 2012 Revision; ESA Working Paper No. 12–03; FAO: Italy, Rome, 2012. [Google Scholar]
  7. Owen, O.S.; Chiras, D.D. Natural Resource Conservation: An Ecological Approach; MacMillan Publishing Company: New York, NY, USA, 1990. [Google Scholar]
  8. Xie, L. The spatial distribution of reclaimed and abandoned land in Luopu of Hotan River Basin in the period of republic of China based on the historical data. Acta Geogr. Sin. 2013, 8, 232–244. (In Chinese) [Google Scholar]
  9. Xie, L. The development of oasis agriculture and the changes of the ecological environment in Ancient Kroraina. Chin. Agric. Hist. 2001, 20, 16–26. (In Chinese) [Google Scholar]
  10. Liu, J.Y.; Zhang, Z.X.; Xu, X.L.; Kuang, W.H.; Zho, W.C.; Zhang, S.W.; Li, R.D.; Yan, C.Z.; Yu, D.S.; Wu, S.X.; et al. Spatial patterns and driving forces of land use change in China in the early 21st century. Acta Geogr. Sin. 2009, 64, 1411–1420. [Google Scholar] [CrossRef]
  11. Sampaio, G.; Nobre, C.A.; Costa, M.H.; Satyamurty, P.; Soares-Filho, B.S.; Cardoso, M. Regional climate change over eastern Amazonia caused by pasture and soybean cropland expansion. Geophys. Res. Lett. 2007, 34, L17709. [Google Scholar] [CrossRef]
  12. Betts, R.A.; Fallon, P.D.; Goldewijk, K.K.; Ramankutty, N. Biogeophysical effects of land use on climate: Model simulations of radiative forcing and large-scale temperature change. Agric. For. Meteorol. 2007, 142, 216–233. [Google Scholar] [CrossRef]
  13. Zhang, X.Z.; Liu, J.Y.; Xiong, Z.; Zhang, H.W. Simulated effects of agricultural development on surface air temperature over Central and Eastern China in the late 20th century. Acta Geogr. Sin. 2015, 70, 1423–1433. [Google Scholar]
  14. Skamarock, W.C.; Klemp, J.B.; Dudhia, J.; Gill, D.O.; Barker, D.M.; Duda, M.G.; Huang, X.Y.; Wang, W.; Powers, J.G. A Description of the Advanced Research WRF Version 3; NCAR Technical Note NCAR/TN-475+STR; National Center for Atmospheric Research: Boulder, CO, USA, 2008. [Google Scholar] [CrossRef]
  15. Ruiz, J.J.; Saulo, C.; Nogués-Paegle, J. WRF model sensitivity to choice of parameterization over South America: Validation against surface variables. Mon. Weather Rev. 2010, 138, 3342–3355. [Google Scholar] [CrossRef]
  16. Hong, S.; Lakshmi, V.; Small, E.E.; Chen, F.; Tewari, M.; Manning, K.W. Effects of vegetation and soil moisture on the simulated land surface processes from the coupled WRF/Noah model. J. Geophys. Res. 2009, 114, D18118. [Google Scholar] [CrossRef]
  17. Cao, Q.; Yu, D.; Georgescu, M.; Han, Z.; Wu, J. Impacts of land use and land cover change on regional climate: A case study in the agro-pastoral transitional zone of China. Environ. Res. Lett. 2015, 10, 124025. [Google Scholar] [CrossRef]
  18. Oliver, T.H.; Morecroft, M.D. Interactions between climate change and land use change on biodiversity: Attribution problems, risks and opportunities. WIRES Clim. Chang. 2014, 5, 317–335. [Google Scholar] [CrossRef] [Green Version]
  19. Yu, Y.; Fang, X.Q.; Ren, Y.Y.; Zhang, X.Z.; Chen, L. The cultivated land cover has changed in the last 300 years in the northeast. Sci. China 2009, 39, 340–350. [Google Scholar]
  20. Sun, J.; Twine, T.E.; Hill, J.; Noe, R.; Shi, J.; Li, M. Effects of land use change for crops on water and carbon budgets in the Midwest USA. Sustainability 2017, 9, 225. [Google Scholar] [CrossRef]
  21. SooHoo, W.M.; Wang, C.; Li, H. Geospatial assessment of bioenergy land use and its impacts on soil erosion in the U.S. Midwest. J. Environ. Manag. 2017, 190, 188–196. [Google Scholar] [CrossRef] [PubMed]
  22. Li, F.P.; Zhang, G.X.; Xu, Y.J. Separating the impacts of climate variation and human activities on Runoff in the Songhua River Basin, Northeast China. Water 2014, 6, 3320–3338. [Google Scholar] [CrossRef]
  23. Zhang, L.J.; Jiang, L.Q.; Zhang, X.Z. Spatial explicit reconstruction of cropland for Heilongjiang province of Northeast China in 1900–1910. J. Geogr. Sci. 2015, 25, 292–602. [Google Scholar] [CrossRef]
  24. Zhang, L.J.; Jiang, L.Q.; Zhang, X.Z. Reconstruction of cropland spatial pattern and its spatiotemporal changes over the 20th century on the Songnen Plain, Northeast China. J. Geogr. Sci. 2017, 27, 771–785. [Google Scholar] [CrossRef]
  25. Sun, J.Z. The Regional Economic Geography Science in Northeast China; Science Press: Beijing, China, 1959. (In Chinese) [Google Scholar]
  26. Hu, X.; Nielsen-Gammon, J.W.; Zhang, F. Evaluation of three planetary boundary layer schemes in the WRF model. J. Appl. Meteorol. Climatol. 2010, 49, 1831–1844. [Google Scholar] [CrossRef]
  27. Collins, S.N.; James, R.S.; Ray, P.; Chen, K.; Lassman, A.; Brownlee, J. Grids in numerical weather and climate models. In Climate Change and Regional/local Responses; Ray, P., Zhang, Y., Eds.; IntechOpen: London, UK, 2003; pp. 112–128. [Google Scholar]
  28. Sharma, A.; Fernando, H.J.S.; Hamlet, A.F.; Hellmann, J.J.; Barlage, M.; Chen, F. Urban meteorological modeling using WRF: A sensitivity study. Int. J. Clim. 2017, 37, 1885–1900. [Google Scholar] [CrossRef]
  29. Niu, G.Y.; Yang, Z.L.; Mitchell, K.E.; Ek, M.B.; Barlage, M.; Kumar, A.; Manning, K.; Niyogi, D.; Rosero, E.; Tewari, M.; et al. The community Noah land surface model with multiparameterization options (Noah-MP): 1. Model description and evaluation with local-scale measurements. J. Geophys. Res. 2011, 116, D12109. [Google Scholar] [CrossRef]
  30. Palmer, W.C. Meteorological Drought; U.S. Department of Commerce: Washington, DC, USA, 1965; Volume 30. [Google Scholar]
  31. Guttman, N.B. Comparing the Palmer Drought Index and the standardized precipitation index. J. Am. Water Resour. Assoc. 1998, 34, 113–121. [Google Scholar] [CrossRef]
  32. Brandt, L.; Rawski, T.G. (Eds.) China’s Great Economic Transformation; Cambridge University Press: Cambridge, UK, 2008. [Google Scholar]
  33. Liu, Y.B.; Ju, W.M.; Zhu, G.L.; Chen, J.M.; Xing, B.L.; Zhu, J.F.; Zhou, Y.L. Retrieval of leaf area index for different grasslands in Inner Mongolia prairie using remote sensing data. Acta Ecol. Sin. 2011, 31, 5159–5170. [Google Scholar]
  34. Guttman, N.B. Accepting the Standardized Precipitation Index: A calculation algorithm. J. Am. Water Resour. Assoc. 1999, 35, 311–322. [Google Scholar] [CrossRef]
  35. Vicente-Serrano, S.M.; Begueria, S.; Lopez-Moreno, J.I. A Multiscalar Drought Index Sensitive to Global Warming: The Standardized Precipitation Evapotranspiration Index. J. Clim. 2010, 23, 1696–1718. [Google Scholar] [CrossRef] [Green Version]
  36. Zheng, S.; Qin, Z.; Zhang, W. Drought variation in Songnen Plain and its response to climate change. Chin. J. Agrometeorol. 2015, 36, 640–649. (In Chinese) [Google Scholar]
  37. Zeng, L.; Song, K.; Zhang, B.; Wang, Z. The growing-season drought characteristics in the Songnen Plain since the 1960s. J. Arid Land Resour. Environ. 2010, 24, 114–122. (In Chinese) [Google Scholar]
  38. Luan, Z.; Zhang, G.; Deng, W. Variations of precipitation and temperature of the Songnen Plain in the past 50 years. Chin. J. Agrometeorol. 2007, 28, 355–358. (In Chinese) [Google Scholar]
  39. Douglas, E.M.; Niyogi, D.; Frolking, S.; Yeluripati, J.B.; Pielke Sr., R.A.; Niyoigi, N.; Vörösmarty, C.J.; Mohanty, U.C. Changes in moisture and energy fluxes due to agricultural land use and irrigation in the Indian Monsoon Belt. J. Geophys. Res. 2006, 33, L14403. [Google Scholar] [CrossRef]
  40. Li, X.; Zhang, X.; Zhang, L.; Deng, J. Uncertainty analysis of land use and land cover change to summer precipitation in eastern China. Geogr. Res. 2017, 36, 1233–1244. (In Chinese) [Google Scholar]
  41. Wu, Y.; Zhang, B.; Song, K.; Liu, H.; Wang, Z.; Liu, D. Retrieval of soil organic matter content from hyper-spectra in Songnen Plain. J. Grad. Sch. Chin. Acad. Sci. 2011, 28, 187–194. (In Chinese) [Google Scholar]
  42. Bai, R. The climate change and blackland degeneration in SongNen River area. Heilongjiang Meteorol. 2005, 3, 27. (In Chinese) [Google Scholar]
Figure 1. The Songnen Plain (red polygon) in the Songhua River Basin, Northeast China. The right figure is an elevation map of the basin.
Remotesensing 10 01108 g001
Figure 2. Trajectories of areal coverage of the three primary land use and land cover (LULC) classes (grassland, cropland, forest) in the 1910s–2010s.
Remotesensing 10 01108 g002
Figure 3. Spatial patterns and dynamics of the three LULC classes in the 1910s–2010s. Maps in the 1980s, 1990s and 2000s are not shown here because of their visual similarities with the 1970s and 2010s.
Remotesensing 10 01108 g003
Figure 4. Comparison of the Weather Research and Forecasting (WRF) simulated and European Reanalysis (ERA) Reanalysis of precipitation (a) and total evapotranspiration (c) in 2008–2012. (bd) are scatterplots of precipitation (PRE) and total evapotranspiration (TET), respectively.
Remotesensing 10 01108 g004
Figure 5. The spatial patterns of total evapotranspiration and precipitation: the WRF-modeled (a,c) and ERA Re-analysis (b,d). Each grid value is a 5-year average in the growing season (May–September).
Remotesensing 10 01108 g005
Figure 6. Trends of the plain-wide and grid-level deviations (against the 1910s) of the WRF-simulated precipitation (a,c) and total evapotranspiration (b,d) in growing season. In (a,b), the dashed lines are the linear correlation lines. In (c,d), only grids with significant trends are colored.
Remotesensing 10 01108 g006
Figure 7. Trends of the plain-wide and grid-level deviations (against the 1910s) of the WRF-simulated canopy transpiration (a,c) and interception evaporation (b,d) in growing season. In (a,b), the dashed lines are the linear correlation lines. In (c,d), only grids with significant trends are colored.
Remotesensing 10 01108 g007
Figure 8. Trends of the plain-wide and grid-level deviations (against the 1910s) of the WRF-simulated RI (a,c) and land evaporation (b,d) in growing season. In (a,b), the dashed lines are the linear correlation lines. In (c,d), only grids with significant trends are colored.
Remotesensing 10 01108 g008
Figure 9. The centurial patterns of the canopy transpiration (CE) and runoff and infiltration (RI) in the study region. Maps in the 1980s, 1990s and 2000s are not shown because of their visual similarities with the 1970s and 2010s.
Remotesensing 10 01108 g009
Figure 10. The 30-year average Palmer Drought Severity Index (PDSI) in 1901–1930 (a) and 1981–2010 (b), in which a negative value represents drier and a positive one means wetter conditions. In their 30-year linear trends in 1901–1930 (c) and 1981–2010 (d), black dots mark the grids with significant trends.
Remotesensing 10 01108 g010
Table 1. Total area of conversion from the 1900s to 2010s (unit of 104 km2). Note there are no developed lands in the 1910s. The three primary classes are highlighted in bold.
1900sCroplandForestGrasslandWaterWetland
2010s
Cropland34,827.7325,469.4162,876.58988.546951.86
Forest1589.5118,332.046271.71179.381431.92
Grassland2368.493620.7215,184.79807.713516.76
Water803.99746.142298.712963.712409.82
Wetland0.360.320.690.285718.10
Developed land0.1850.1220.2250.070.06
Table 2. The ANOVA comparison of climatic variables in the Songnen Plain between 1901–1930 and 1981–2010 in two intervals: annual (year-long) and growing-season.
Climatic Variables1901~19301981~2010Variance Analysis (t Value)
AnnualGrowing-SeasonAnnualGrowing-SeasonAnnualGrowing-Season
Precipitation (mm)495.133426.315516.636442.125−1.047−0.867
evaporation (mm)791.055566.148821.472574.073−3.046 **−1.037
precipitation days (d)84.12256.05985.26756.166−0.811−0.095
Water vapor pressure (hpa)7.48314.3107.78314.671−4.152 **−2.432 *
** denotes p < 0.01; * denotes p < 0.05.

