Article

Effects of Dynamic Range and Sampling Rate of an Infrared Thermometer to the Accuracy of the Cloud Detection

1
Department of Atmospheric Science and Engineering, Ewha Womans University, Ewhayeodae-gil 52, Seodaemun-gu, Seoul 03760, Korea
2
National Institute of Meteorological Sciences, 33, Seohobuk-ro, Seogwipo-si 63568, Jeju-do, Korea
*
Author to whom correspondence should be addressed.
Remote Sens. 2018, 10(7), 1049; https://doi.org/10.3390/rs10071049
Submission received: 30 April 2018 / Revised: 25 June 2018 / Accepted: 29 June 2018 / Published: 3 July 2018
(This article belongs to the Section Atmospheric Remote Sensing)

Abstract

:
Cloud detection using downwelling radiation measured by infrared thermometer (IRT) has been utilized for many applications. The current study investigates the effects of disparate IRT specifications, including the dynamic range and sampling rates on the performance of cloud detection, which utilizes the spectral and temporal characteristics of cloudy radiation. To analyze the effects, the detection algorithm that was prepared with and applied to the IRT data with different specifications is compared with reference data, a ceilometer, and micro-pulse lidar (MPL). The comparison results show that the low-altitude clouds are detected with a sufficient accuracy: better than 97% probability of detection (POD). This is due to the much warmer brightness temperature (Tb) of the low clouds compared with the clear sky in the atmospheric window region where the IRT measurement was made. Conversely, the high-altitude cold clouds are hard to detect with the spectral test due to the much-reduced Tb contrast between cloudy and clear sky. Thus, the algorithm performance is largely dependent on the performance of the temporal test. Since the lower measurement noise provides a better estimation of the temporal variability of clear sky Tb with less estimation uncertainty, the IRT data having a better noise performance shows a better POD value by as much as 52.2% compared with the MPL result. However, the improvement is realized only when the dynamic range of IRT covers sufficiently cold Tb, such as −100 °C.

1. Introduction

The roles that clouds play in the atmosphere are ubiquitous, not only in the atmospheric processes such as the Earth’s energy budget, precipitation, and chemical, dynamical, and optical phenomena, but also in the atmospheric measurements, specifically by interfering with various types of remote sensing. The cloud amount, type, height, and microphysical properties are all necessary information to meet the requirements for studies of the processes, while an accurate detection of the cloud presence is the basic information to mitigate the interference. Much of the required information is provided from various means from spaceborne, airborne, and ground-based instrumentations; each has its own merits and disadvantages [1,2].
Here, the authors focus on the detection of clouds using downwelling radiation measured by an infrared thermometer (hereafter IRT). Compared with other instruments for cloud detection—active and passive sensors alike—the IRT used for the current study is relatively simple and easy to operate [3,4]. The measured radiances of approximately 10 μm correspond to the atmospheric window region and are quite sensitive to cloud presence, resulting in the measured radiance in cloudy conditions showing a warmer (spectral) and more variable (temporal) characteristic compared with clear-sky radiation. Furthermore, as it uses the emitted radiation from the atmosphere, cloud information could be obtained during both day and night. Therefore, a continuous and automatic cloud detection using IRT measurement is applicable in real-time to improve the retrieval accuracy of atmospheric profiles from the radiometric measurements. Ahn et al. [5] showed the potential application of this approach by eliminating cloud-contaminated data from the radiometric measurement. Furthermore, Brocard et al. [6] tried to utilize a temporal fluctuation of brightness temperature (hereafter Tb) obtained from the infrared radiometer to detect cirrus cloud, which regulates outgoing longwave radiation. From these studies, it has been shown that the detection algorithm using the spectral and temporal characteristics of the cloud radiation provides quite satisfactory and reliable cloud detection [3,6,7,8,9].
However, it is also notable that the dynamic range of the IRT is limited, especially regarding the measurement limit of −50 °C, which could degrade the algorithm performance when the measured brightness temperature is cooler than −50 °C [9]. This issue with cold Tb is further complicated by a limited capability of the reference data used for the algorithm validation. Since the ceilometer used for the validation has a detection limit of about 7 km, which is lower than many of the high cold clouds, a quantitative assessment of the algorithm performance for the high clouds is limited, for example. Thus, here, the authors attempt to resolve these issues by utilizing an improved set of data from instruments installed at the Atmospheric Radiation Measurements (ARM) Southern Great Plains (SGP) site, Tb data from an IRT with a wider dynamic range as low as −100 °C and a higher sampling rate of 5 Hz [10], together with the improved reference data from both a ceilometer and micro-pulse lidar (hereafter, MPL) that is able to detect clouds as high as 18 km [11].
The paper is organized as follows: Section 2 describes the used data and the instruments, and introduces pre-processing to utilize the ARM data to resolve aforementioned issues; Section 3 analyzes the effects of the new IRT data on the cloud detection algorithm with respect to the spectral and temporal characteristics of clouds; this is followed by an overall validation of the algorithm performance in Section 4. The validation results are analyzed by focusing on two issues—the different characteristics of the IRT data as well as the improved reference data—followed by a short discussion on the implication of the findings to the utilization of IRT data for cloud detection. The paper is concluded in Section 5 with a summary of the current study.

2. Data and Pre-Processing

The cloud detection algorithm using the IRT data [9] is based on the characteristics of the cloudy Tb against the clear sky Tb (hereafter TbCLR). When the measured Tb is warmer and/or more variable than the TbCLR, the measurement is determined to be cloud-affected. Since TbCLR and its temporal variability changes with the atmospheric conditions, the most important part of the detection algorithm is to have an accurate TbCLR and its temporal variability. Here, it should be emphasized that TbCLR has a rather large variation, even at the atmospheric window region, which is mainly depending on the variability of water vapor and the temperature of the lower atmosphere [3,12,13,14]. It has been shown that a sufficiently accurate TbCLR is obtained with an empirical formula as a function of the real-time surface temperature (TSFC) and humidity (e) (a detailed description for the derivation of the empirical formula is given elsewhere [9], while a summary is also given in Appendix A). Concerning the derivation of the empirical formulas for clear sky, the measured Tb from the IRT (hereafter TbIRT) is regressed with the simulated clear sky Tb to reflect the characteristics of a specific IRT. Thus, the empirical formula for TbCLR depends on the characteristics of the IRT. It is also true that the temporal variability of TbCLR for the clear sky is derived using the measured TbIRT. Thus, both the formulas for TbCLR and its temporal variability depend on the instrument characteristics.
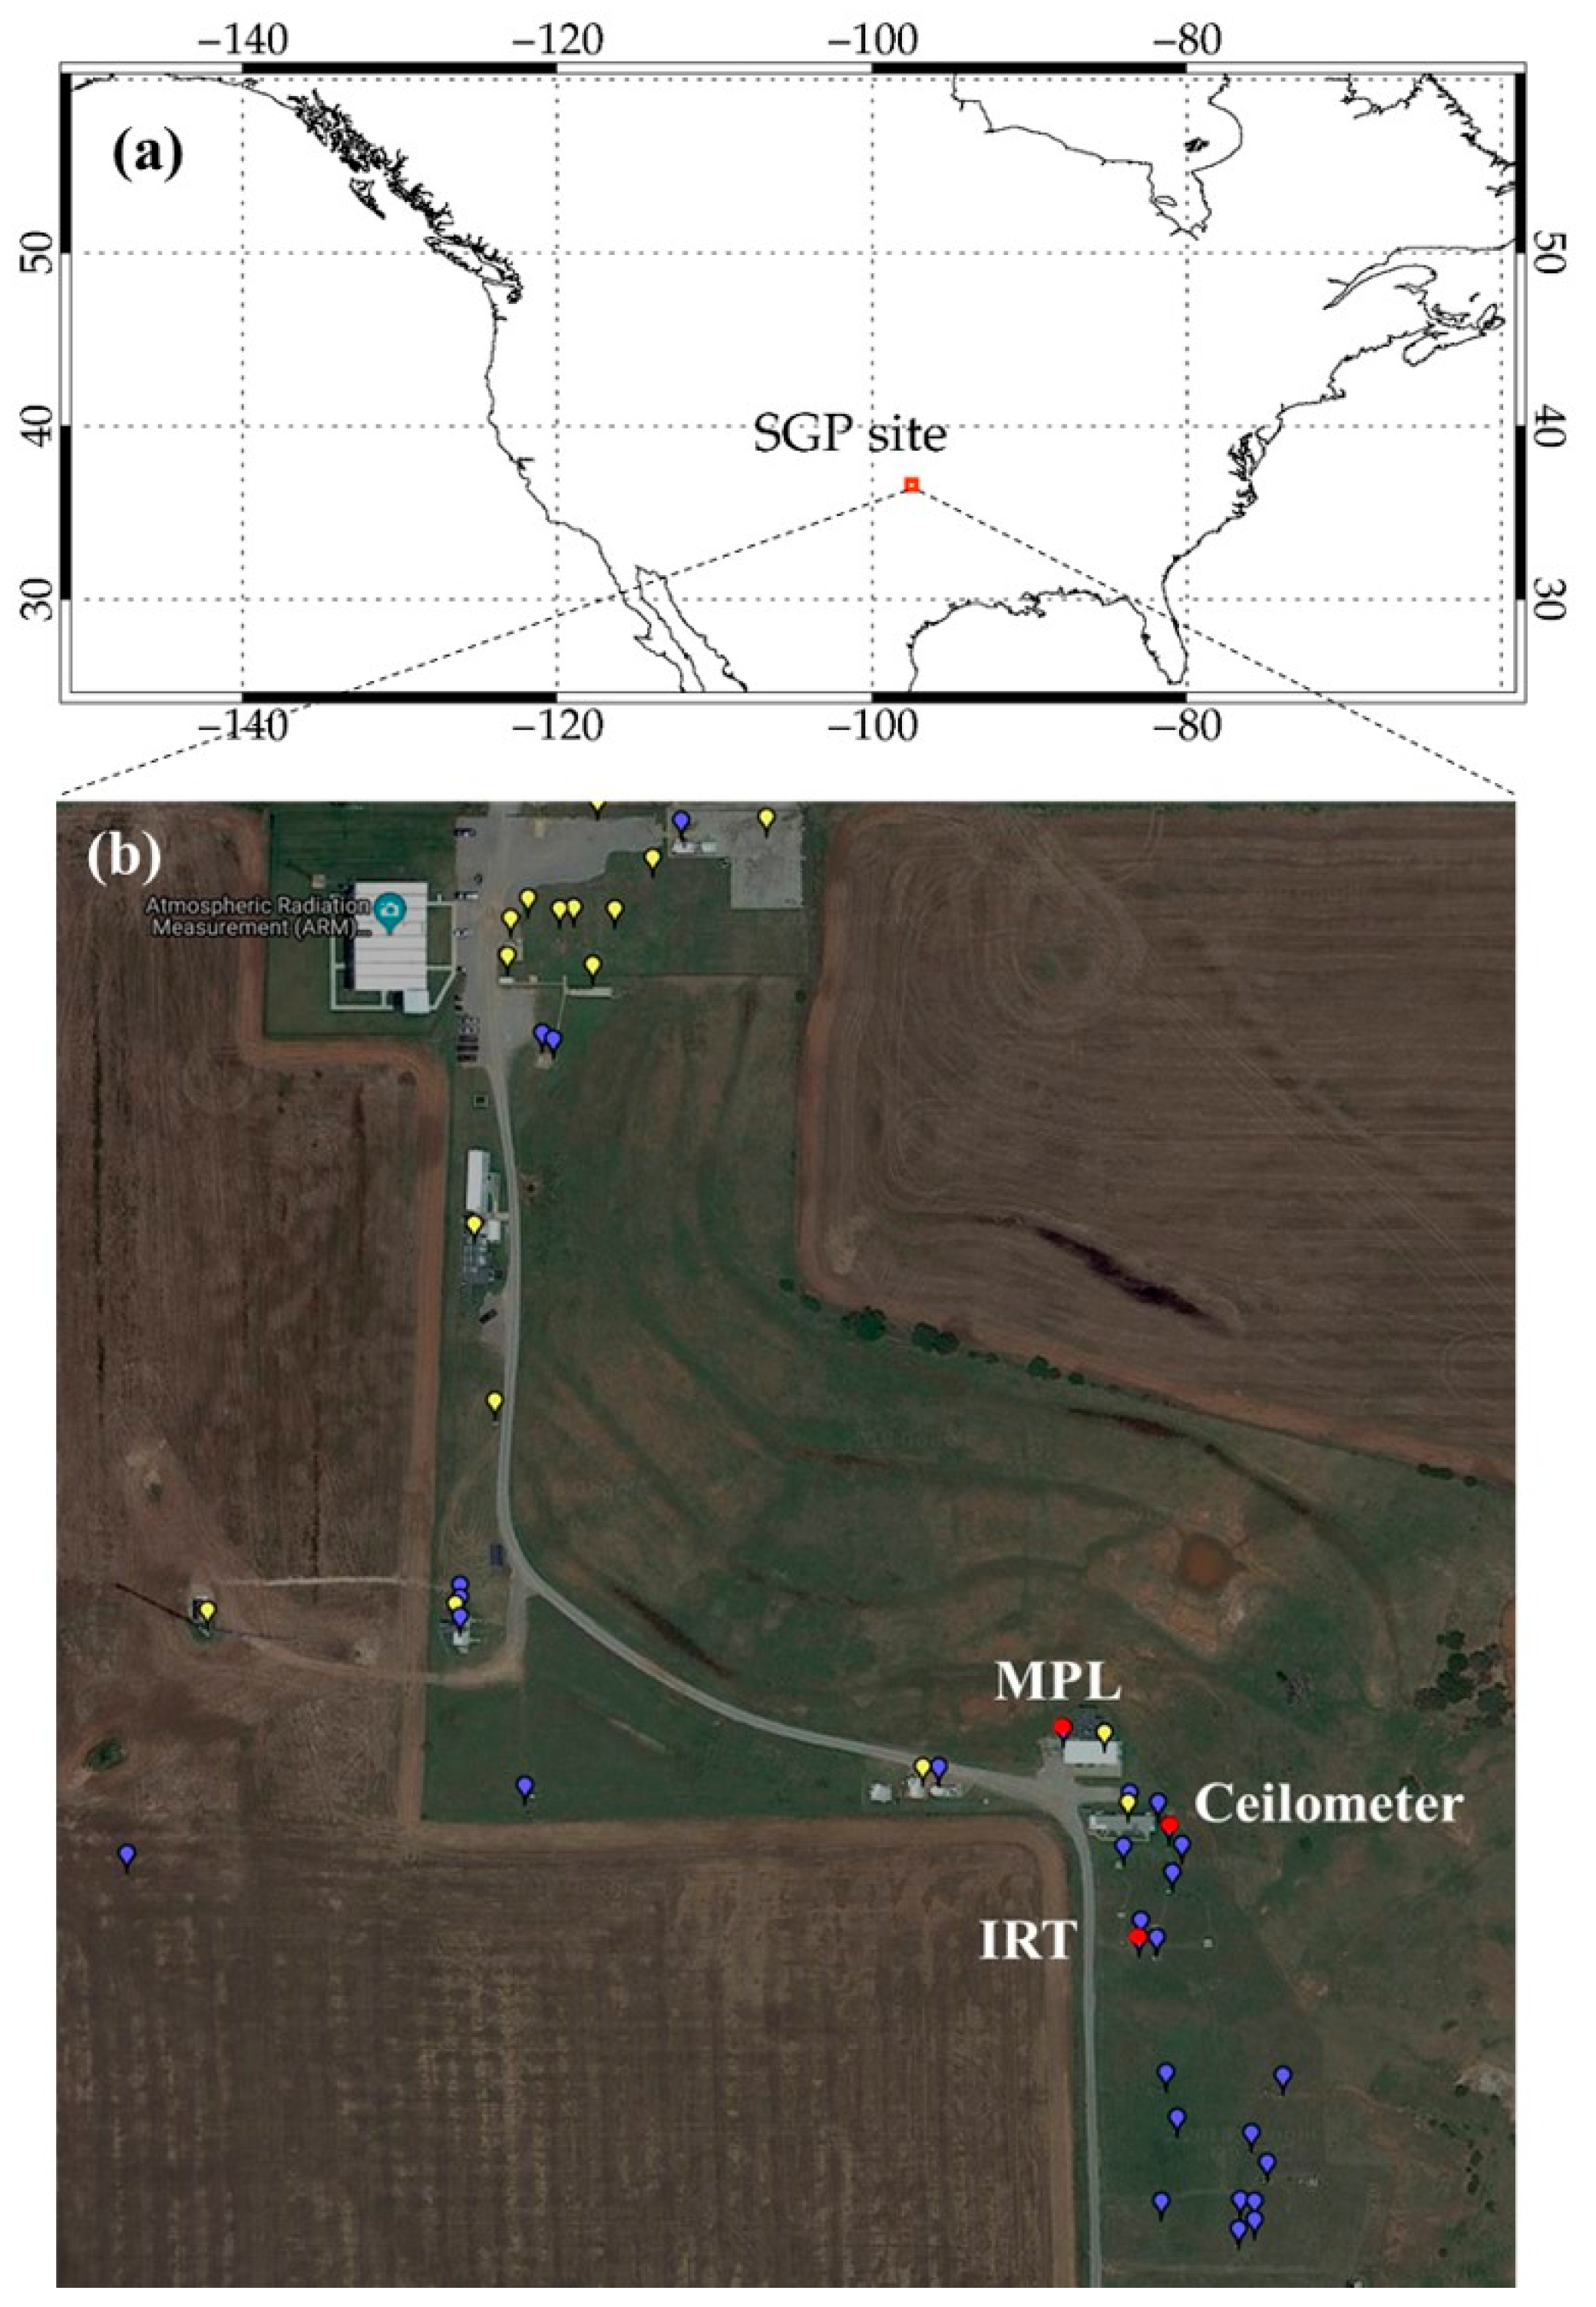
The ARM program has been operating various ground-based remote sensing instruments to characterize the aerosol, cloud, and radiative properties in different atmospheric conditions since 1992 [15,16]. The SGP site (36°36′18.0″N, 97°29′6.0″W, and 318 m above sea level) is located in the mid-latitude climate zone where the seasonal variations in temperature and humidity are distinct, as shown in Figure 1. The SGP site hosts one of the most comprehensive sets of instruments ever, making it a natural choice for this analysis. Among the various instrument data, the current study utilizes (1) TbIRT, (2) the information on the cloud presence from both MPL and ceilometer, and (3) the radiosonde observation and surface weather data. Here, the instruments and data used for the current study are introduced followed by data preparation to consider the different characteristics of the instrument specifications.

2.1. Infrared Thermometer

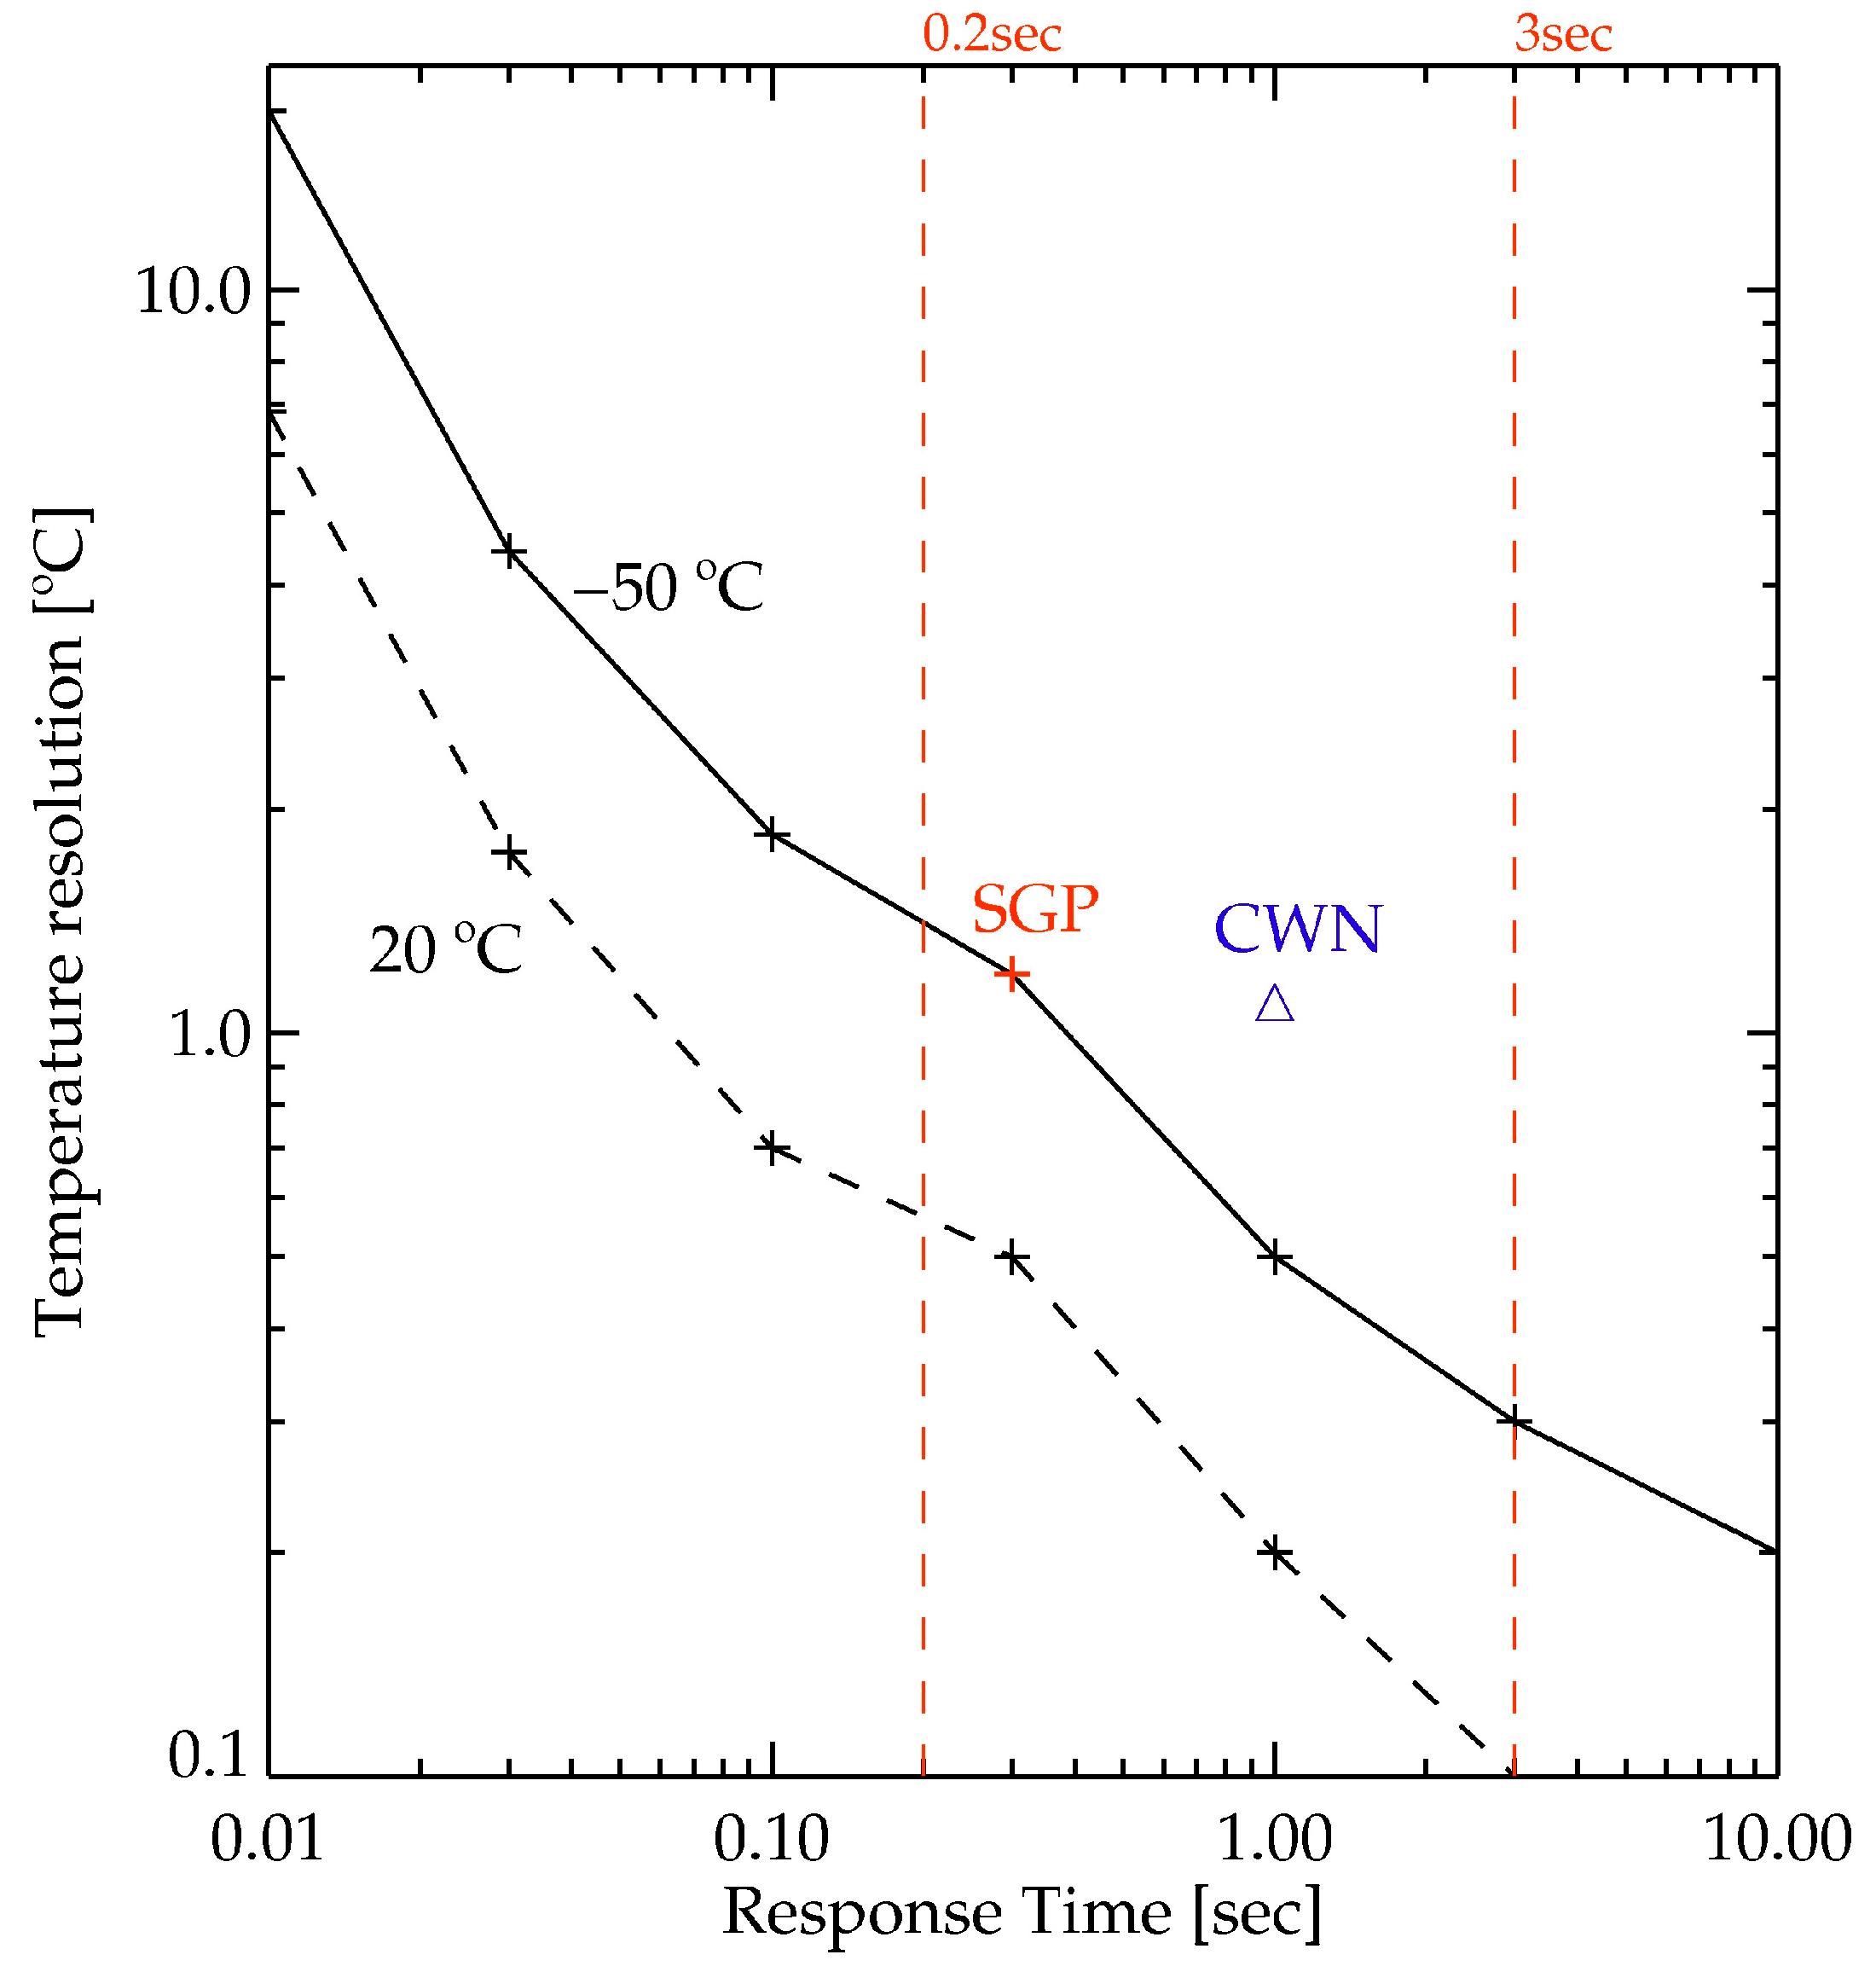
The IRT, which is an infrared pyrometer with an optical chopper (basically with mechanical blades), measures downwelling radiance within its field of view (FOV) of 2.64° with a moderate spectral band, from 9.6 μm to 11.5 μm, and reports the measurement in the form of brightness temperature, Tb [4]. At the SGP site, the IRT instrument, Heitronics KT 19.85II, is protected by a ventilated enclosure which is mounted at a height of 1–2 m above ground. The downwelling radiation reflected by a protected gold mirror is guided into the optical lens of the IRT (see Figures 3–6 of Morris [4] for details). The IRT instrument that was used for the current study has been operated at the SGP site since 2006 with the improved instrument specifications, as summarized in Table 1. First, the dynamic range of TbIRT is extended to as low as −100 °C, often associating with the cold clear sky and high-altitude cold clouds. Secondly, the data acquisition process is capable of reporting Tb with a higher sampling rate at 5 Hz [10], whereas many similar instruments have a longer sampling rate of 3 s. It is conceived to capture the temporal variability of clouds better with the increased sampling rate, which is an additional aspect that the current study attempts to analyze. Finally, the temperature resolution is slightly better than previous instruments such as used by Ahn et al. [9] (also, see Figure 2). Here, the temperature resolutions are interpreted as the noise equivalent delta-temperature (NEdT), following the description given by Heitronics [17]. Thus, the temperature resolution represents a measure of the detector sensitivity at the given observational conditions along with the random noise of the instrument at the response time and radiation source temperature.
Figure 2 shows the temperature resolution as a function of the response time for two different target temperatures (−50 °C versus 20 °C). Here, the response time is given as the time required to respond to 90% of temperature changes against the internal reference temperature of IRT, while the temperature resolution at the given response time is a minimum of temperature variation to be capable of responding [18]. Thus, in general, the temperature resolution improves with the increasing target temperature, as well as the increasing response time, simply due to the increased input signal. Therefore, the temperature resolution of TbIRT needs to be understood in relation to the function of response time and the target temperature. The SGP IRT seems to have a slightly poorer temperature resolution of 1.2 °C (red plus in Figure 2) compared with the 1.1 °C of the previous study (Ahn et al. [9]; blue triangle in Figure 2). However, if the response time is considered to have the same value of 1 s, the SGP IRT shows a better temperature resolution of about 0.5 °C. Since the simultaneous acquisition of IRT data having different temperature resolutions with a single IRT is not possible, the different temperature resolutions are simulated with the different sampling rates, which correspond to a specific measurement period to integrate the input signals. Here, the longer sampling rate against the response time could enhance the NEdT with the reduced noise level. The high sampling rate with shorter response time, such as with the SGP IRT, can detect the high variability temporal feature of clouds, although the NEdT is slightly larger. The disparate sampling rates of IRT—the original 0.2-s rate, and the modified one by integrating input signals during the lower sampling period—are applied to investigate the effects of the disparate noise characteristics of IRT on the cloud detection algorithm. The resulting NEdT of the sampled IRT data for 3 s would be lower than that of 0.2 s.
Along with the instrument specifications, the radiometric calibration is also quite an important characteristic to be considered for the current study. First of all, the IRTs of ARM SGP sites are calibrated at a factory using the calibration procedures by means of a black body source. However, during the field operation, there are sources resulting in the calibration uncertainty. For this, the ARM site relies on the mentor calibration procedure using the collocated hyperspectral atmospheric emitted radiance interferometer (AERI), which is compared with the IRT measurement on a weekly basis. Thus, when any issues occur—in particular calibration issues—the data quality report (DQR) are submitted [4]. Here, only IRT data obtained during the period when no reported calibration issues are noted.

2.2. Ceilometer and MPL

The algorithm is validated through comparisons with the sky conditions obtained by the reference instruments such as the ceilometer and MPL. Here, the cloud presence is inferred with the cloud base height (CBH), which is the variable usually given by those reference instruments, by assigning cloudy sky conditions whenever a meaningful CBH value is observed [19,20,21]. The CBH data obtained from both a ceilometer (Vaisala CL31, the same instrument used in Ahn et al. [9]) and MPL (manufactured by Sigma Space Corporation, Lanham, MD, USA) are used in the ARM SGP site. The top-level specifications of the two instruments are summarized in Table 2.
The Vaisala CL31 measures the backscattered signal of transmitted radiation from a pulsed InGaAs diode laser (operated at 910 nm with the pulse rate of 10 kHz). The CBH data, at the maximum of three different layers, are produced up to an altitude of 7.7 km using a built-in algorithm [22]. Since the forward and return signal overlap near the instrument, about 10 m above the optics assembly, the lowest detectable cloud altitude is set to about 10 m above the instrument. Since the return signals are collected with the same frequency as the pulsed signal, the vertical resolution is about 10 m. To reduce the random noise and improve detection accuracy, the signals are averaged for 16 s.
The MPL is also a ground-based lidar system measuring backscattered radiation at a shorter wavelength of approximately 530 nm. Due to the higher output power, the detection limit is higher than that of the ceilometer: as high as 18 km [11]. The CBH is derived by MPLCMASK (MPL Cloud Mask), which is a value-added product of the ARM program that is implemented in the operational cloud algorithm [23]. The used CBH data from MPL have a vertical resolution of 30 m with the temporal resolution of 30 s. Due to the beam overlapping effect, the lowest cloud detected by MPL was at 500 m [24].
Compared with the FOV of IRT (approximately 46 mrad), the ceilometer and the MPL have relatively narrow FOVs. Thus, the portion of sky viewed by the two instruments is much smaller than that of the IRT. For example, the IRT FOV increases with increasing cloud altitude: the sky-viewing area is about 0.046 km2 at the height of 1 km, and is increased 100-fold at a height of 10 km. Therefore, it is noted that this difference could introduce a slight discrepancy in the cloud detection among different instruments.
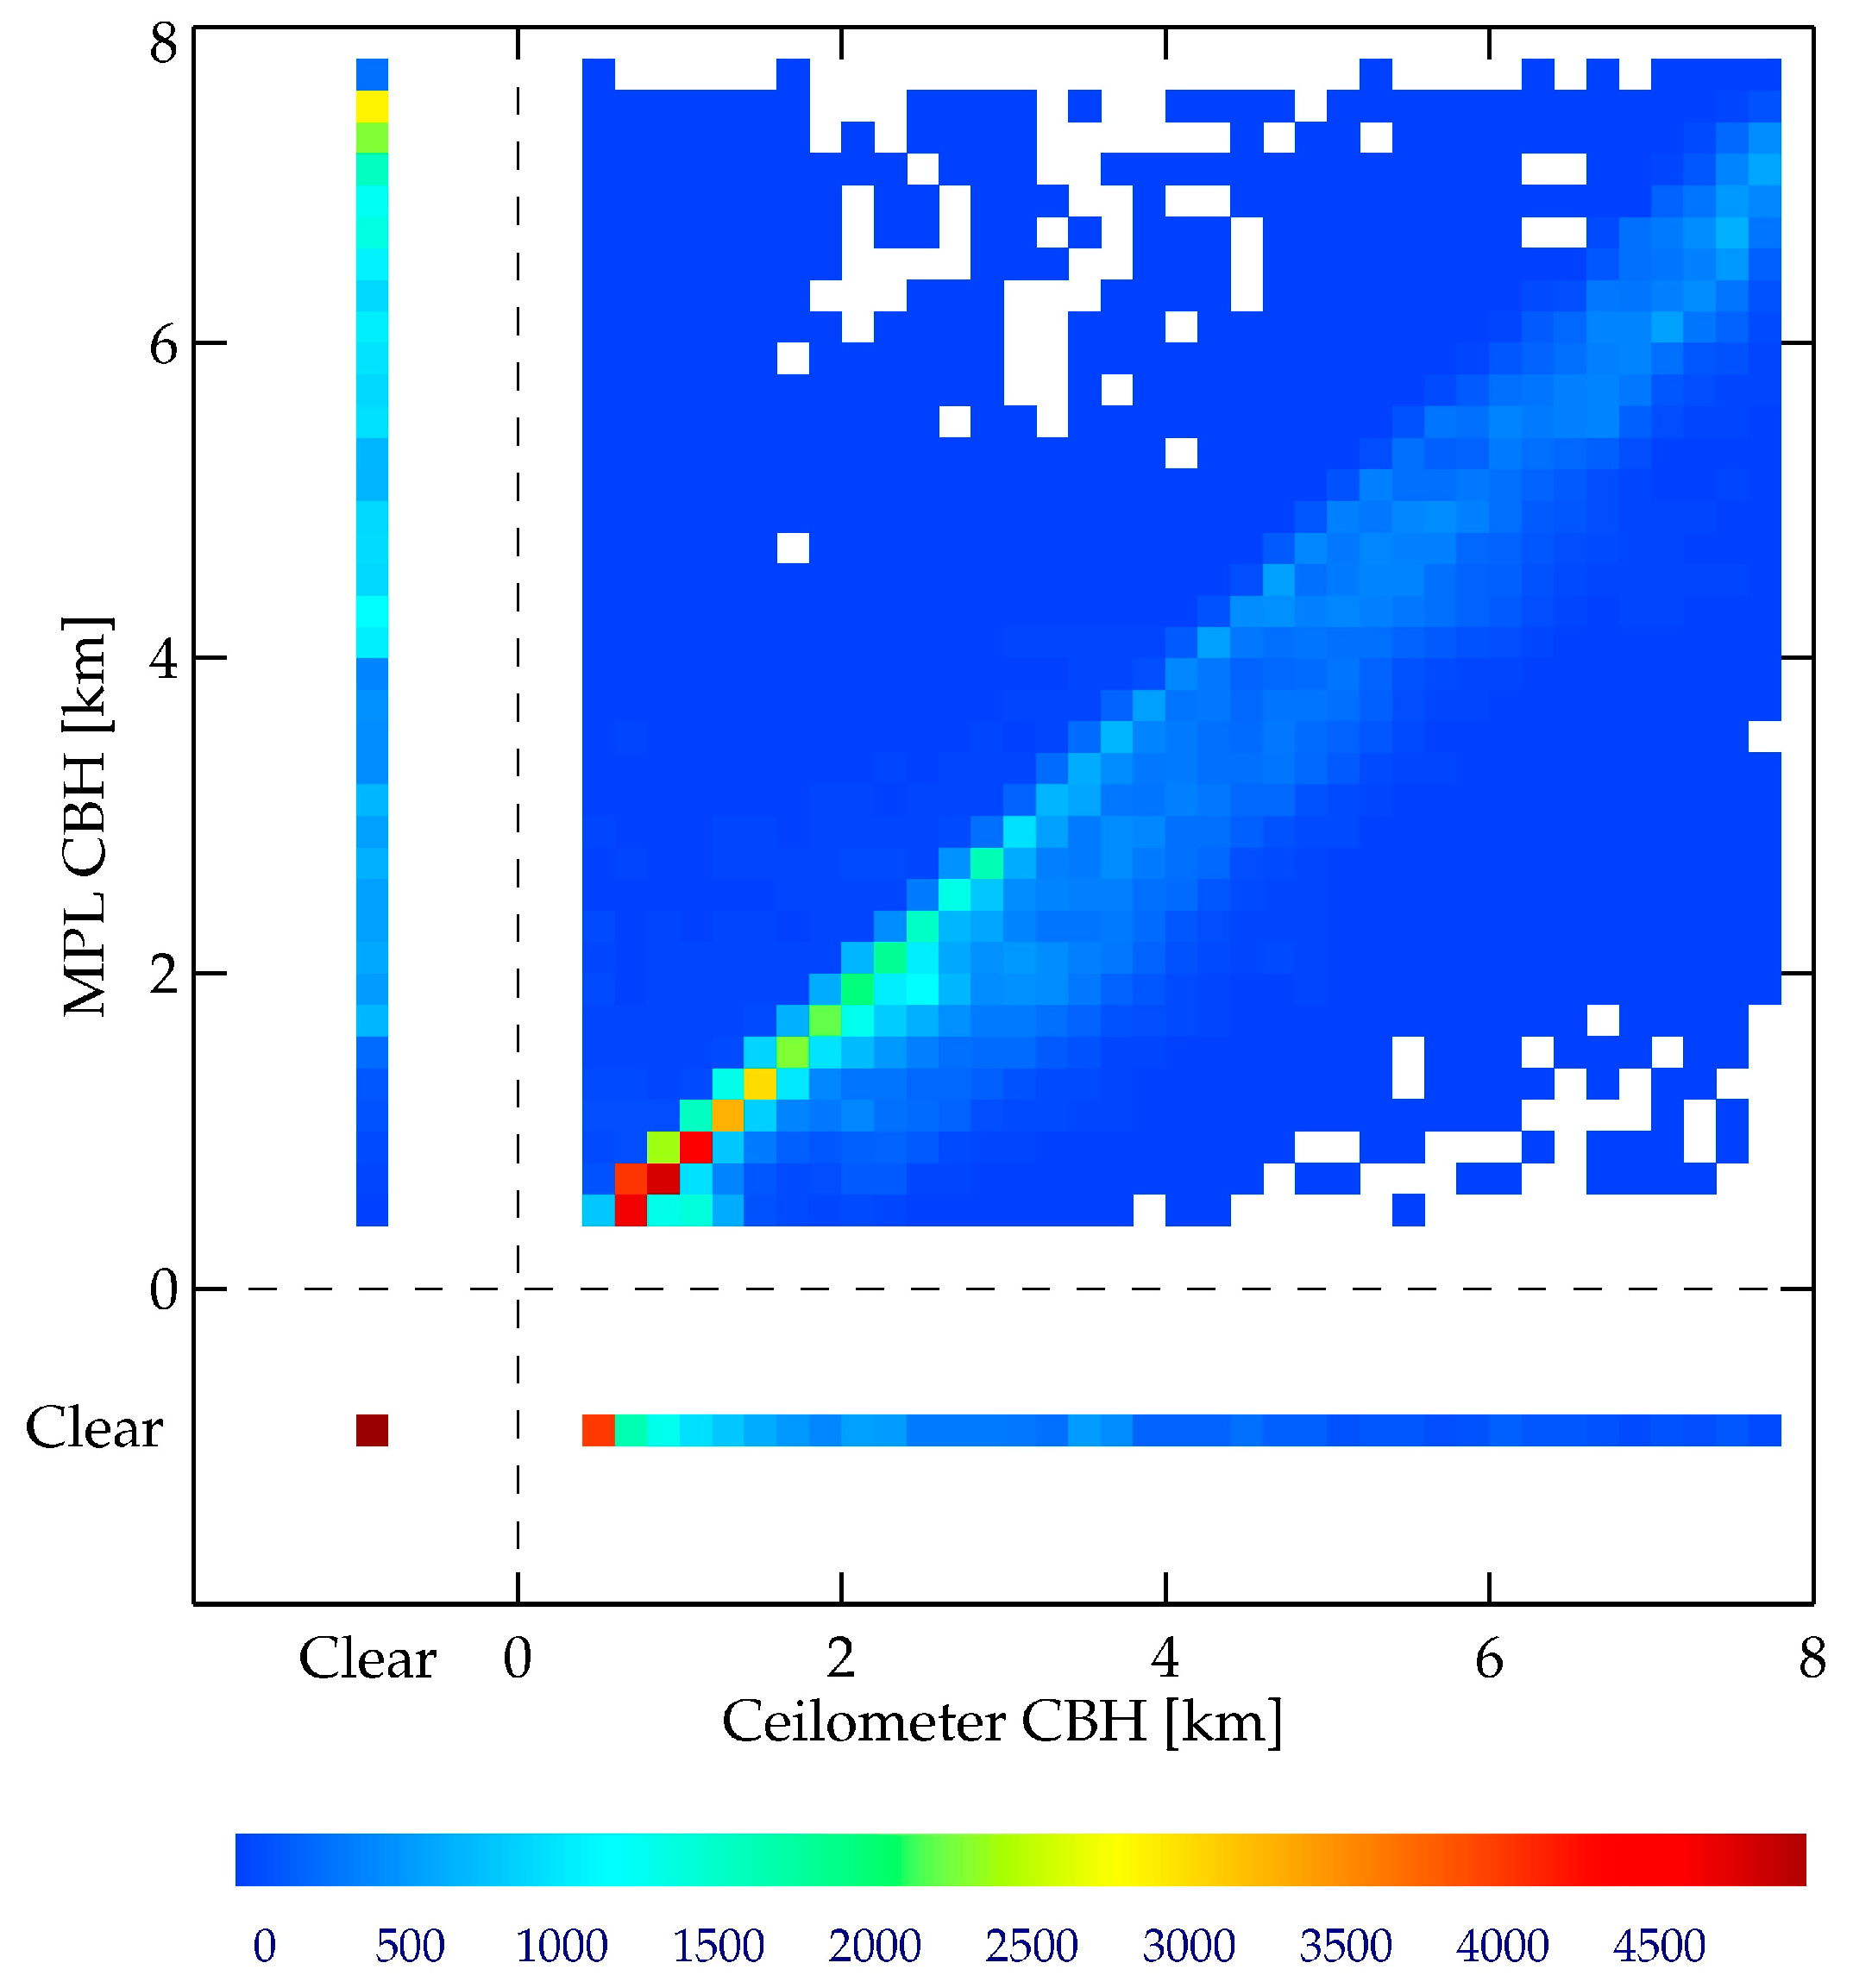
Previous studies [25,26,27,28] have reported that the CBH values from a ceilometer and MPL could be quite different due to the different specifications and approaches. Thus, the CBH data used for the current study are compared beforehand, and the results are summarized in Appendix B. The comparison shows that the sky conditions from the ceilometer and MPL agree each other for about 88.3% of the cases. The main cause of the discrepancy is due to the instrument characteristics. First, the ceilometer detects cloud below about 7.7 km, while MPL could detect clouds at much higher altitudes. Conversely, MPL is not able to detect clouds at lower altitudes—below about 500 m—where the ceilometer has a much better capability. Moreover, due to the difference in the used wavelength, there are disagreements in the sky conditions during a few days of heavy smoke events, specifically during 17 February, 20–21 April, 29–30 June, 4 July, and 1 September 2015, when the data were excluded from the current study.

2.3. Pre-Processing

The effects of the disparate characteristics of TbIRT, in terms of the dynamic range and the sampling rate, for cloud detection are investigated with four different experimental datasets prepared using the original TbIRT. The “Control” represents the original TbIRT data, while the EXP1 simulates the reduced dynamic range of −50 °C, as shown in Table 3. The reduced dynamic range is simply simulated by assigning the original TbIRT having colder temperatures than −50 °C to −50 °C. The EXP2 is to simulate the reduced sampling rate of 3 s, which is achieved by taking a time average of the original signals for 3 s. Finally, the EXP3 is to simulate the reduced dynamic range and sampling rate, which is the same specification as the TbIRT of Ahn et al. [9], but with a slightly better temperature resolution. Such treatments of the original TbIRT allow the authors to approximately reproduce the data characterized by different specifications of IRT.
The effects are analyzed with two different aspects of the algorithm: the development of the algorithm and the overall performance of the cloud detection. The first aspect is analyzed with the characteristics of the empirical equations that depend on the TbIRT, while the second aspect is through comparison with the reference data. The datasets are prepared for two different time periods: one for the algorithm development and the other for the algorithm validation for the analysis. More than 19 months of data, from 4 October 2010 to 27 April 2012, are utilized for algorithm development. Not only TbIRT, but also the radiosonde observation and surface weather data, are collected and processed. The algorithm results are compared with the cloud presence determined by both MPL and the ceilometer for one year, from 1 November 2014 to 30 October 2015 for validation.

3. Methodology

The effects of the disparate IRT specifications on cloud detection are assessed through the analysis of the impacts to the development process of the empirical relations (Equations (A2) and (A3) of Appendix A). Special attention is given to the linearity of the empirical formulae, along with their uncertainties, which consist of the core of the detection algorithm. The analysis is given for the dynamic range followed by the sampling rate for each of the four experimental datasets.

3.1. Dynamic Range

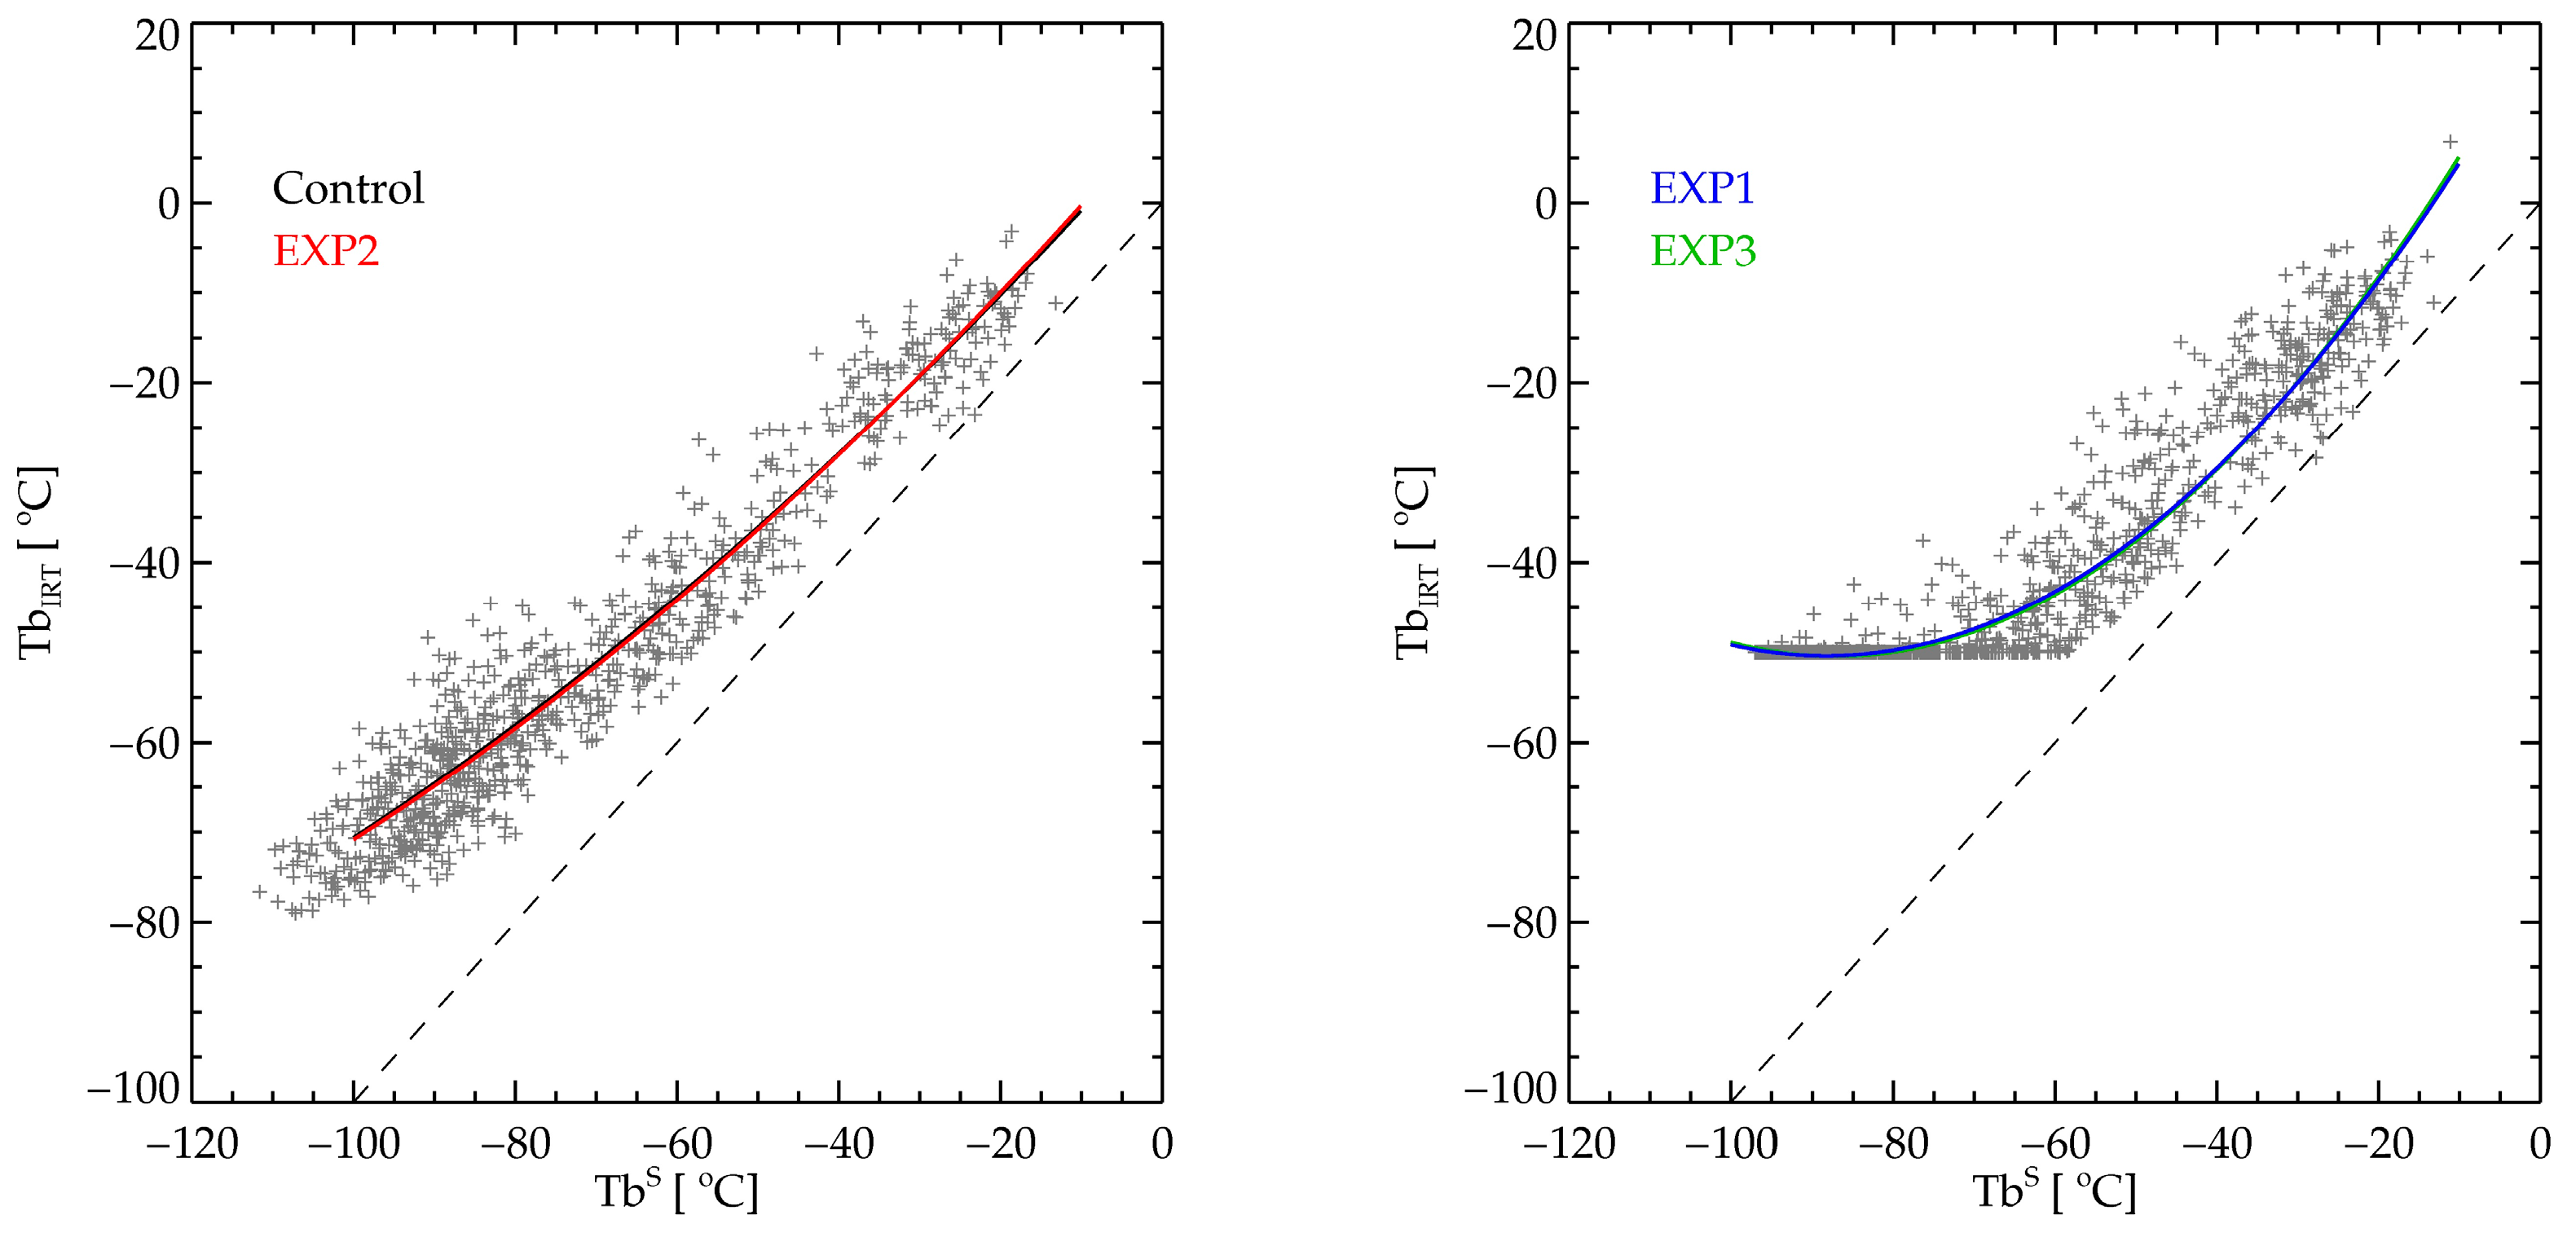
The effects of the dynamic range on algorithm development are best described with the scatter plot of the simulated clear sky Tb (TbS) and the corresponding TbIRT. Figure 3 shows such a plot along with the best-fit lines for each experimental dataset: the left panel for the Control and EXP2, and the right panel for EXP1 and EXP3. Here, the cloud-contaminated data are discarded through the empirical procedures (see Appendix A for details). The best-fit lines in Figure 3 show the quadratic relationship of Equation (A2) used for the real-time estimation of the clear sky Tb (hereafter TbECLR) as a function of TSFC and e (along with Equation (A1)). Interestingly, the two best-fit lines in each scatter diagram are almost identical, demonstrating that Equation (A2) should be same for the dataset having the same dynamic range. Conversely, the best-fit lines for the different dynamic ranges are quite a similar at warm TbS, but they begin to deviate near −50 °C, which is the lower limit of the EXP1 and the EXP3. The deviation increases in the quadratic relationship, and shows as large as 35 °C at −100 °C of TbS, which implies that the Control and EXP2 could be better positioned for cold environments such as the winter time or cold clouds. Another aspect of the relationship between TbS and TbECLR is that the two temperatures are not on the one-to-one line (dashed line in Figure 3); TbECLR is warmer than the theoretical TbS, and the difference increases with decreasing TbS. This is thought to be due to the inaccurate calibration of the IRT for a relatively very cold sky Tb against the internal reference temperature of the IRT [4], but confirmation is beyond scope of the current study.
The best-fit coefficients for the four datasets are summarized in Table 4, along with the uncertainty of the fitting lines (standard deviation of the difference between TbIRT and the estimated TbECLR). Figure 3 indicates that the coefficients for the Control and EXP2 are quite similar to each other, as are those of EXP1 and EXP3. It also confirms that Equation (A2) depends strongly on the dynamic range, but weakly on the sampling rate. Additionally, the experimental datasets with the full dynamic range favor a linear relationship that is closer to the ideal cases. Finally, the fitting uncertainty that is used for the threshold in the spectral test shows a smaller value with the limited dynamic range due to the spectral limitations. Since the uncertainty is smaller with EXP1 and EXP3, the spectral test would be more sensitive with these experimental datasets if other conditions are the same.
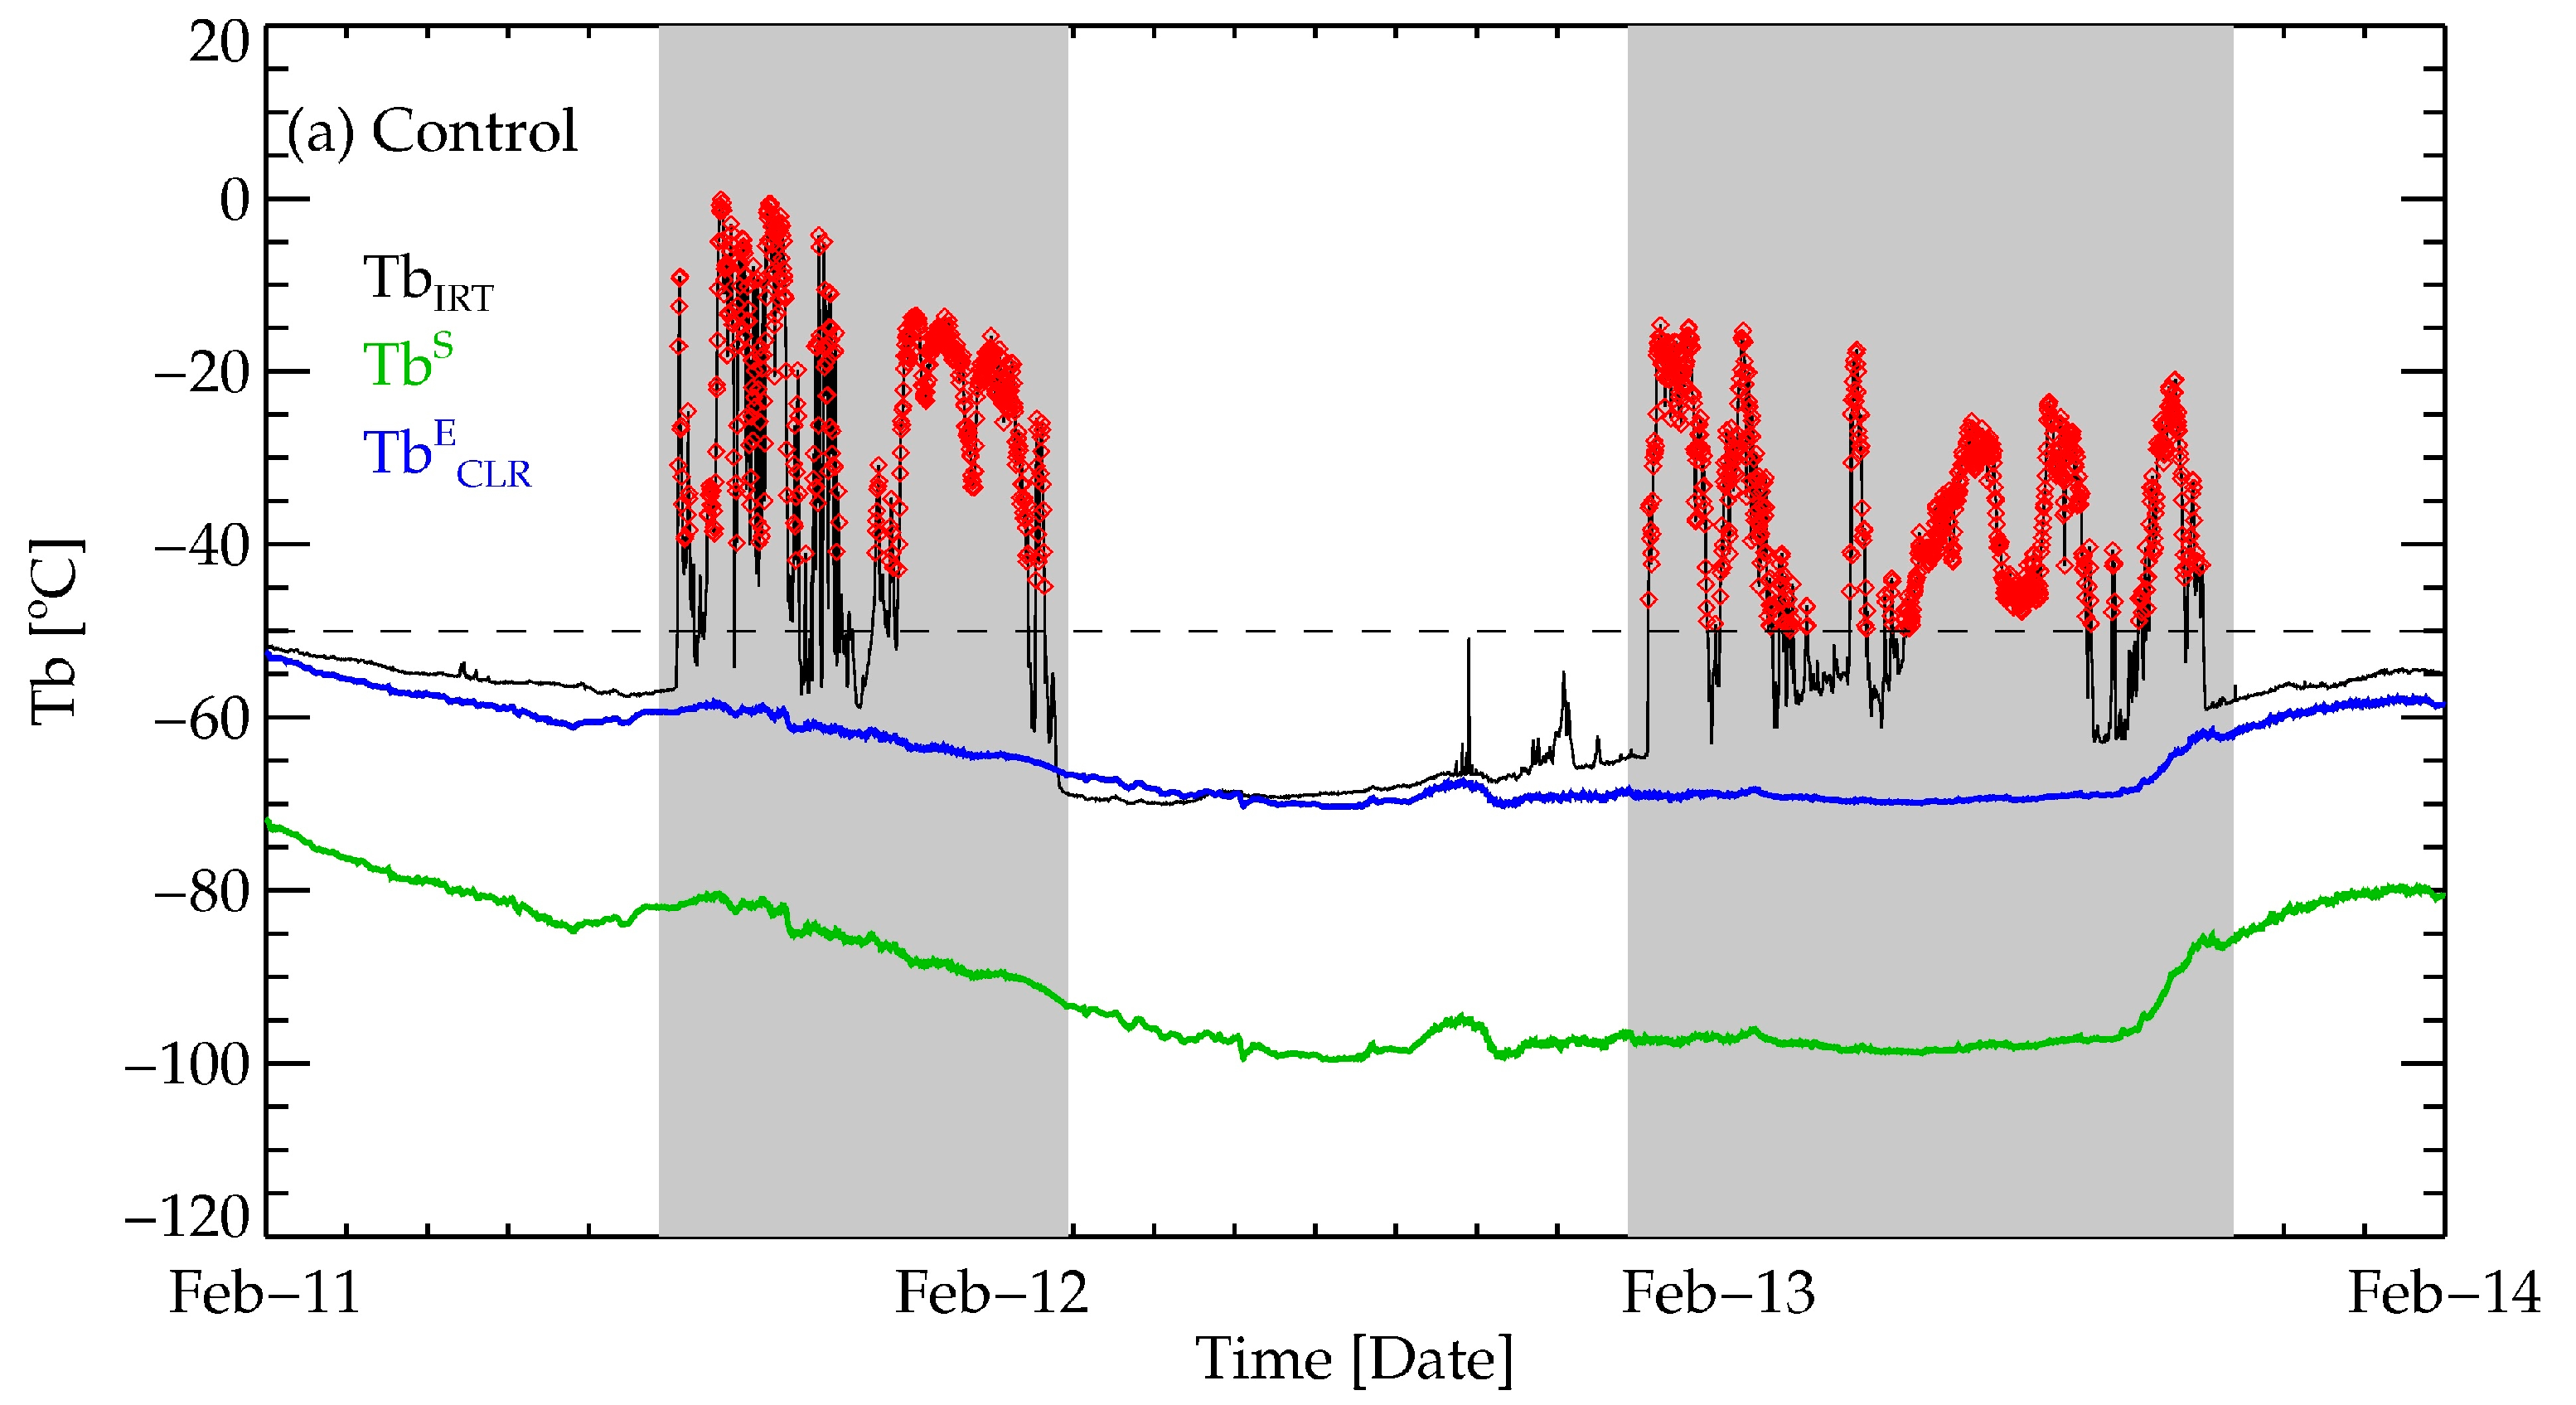
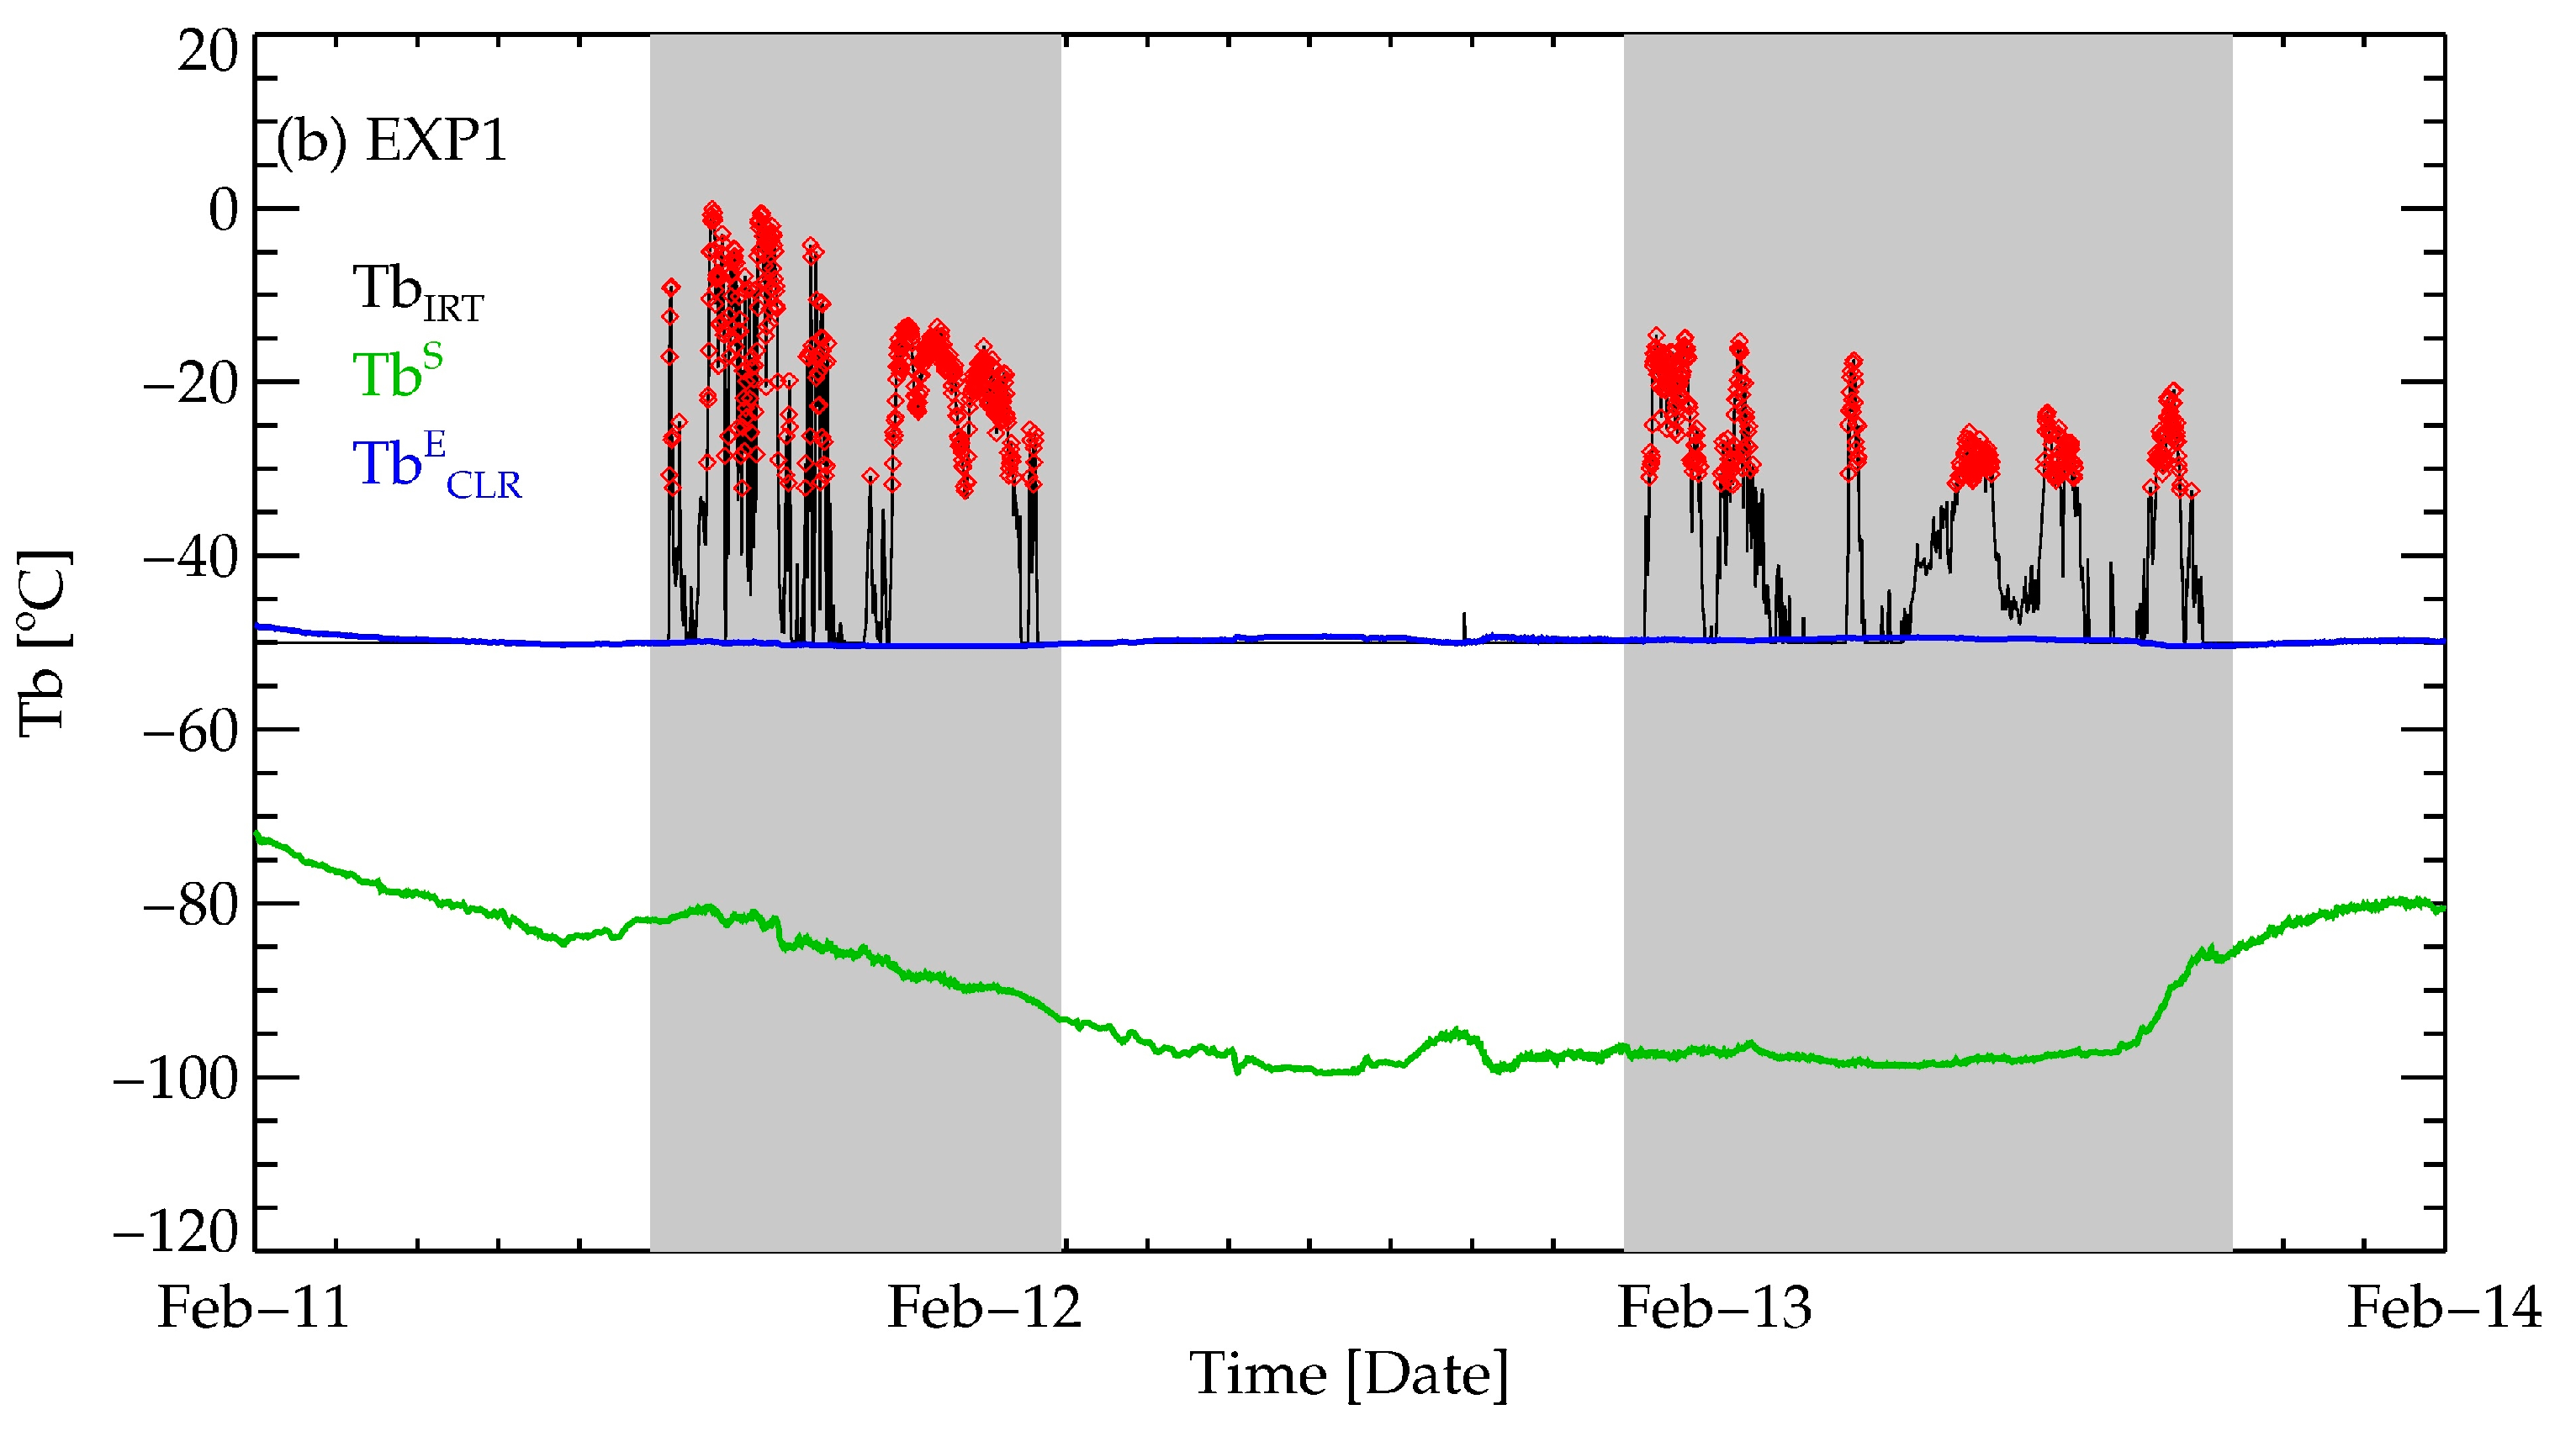
The potential harm to cloud detection due to the limited dynamic range would be the cases when the actual cloudy TbIRT and TbECLR are very cold, which is usually during the winter in the SGP site. Figure 4 shows the time series of TbIRT (black solid line), TbS (green solid line), and TbECLR (blue solid line) for three days in February 2015 for the Control and EXP1 datasets. Regarding the Control, TbECLR follows the general trend of TbS quite well, and the values are close to the clear sky TbIRT (bottom of the black lines). Conversely, in the case of EXP1, the trend and absolute value of TbECLR are quite different from TbS; EXP1 TbECLR do not show a large variability of TbS and their values, which are almost constant at −50 °C, and are much warmer than the TbS. Thus, during the periods of the shaded area in Figure 4, many of the cloudy data detected in the Control are classified as clear sky in EXP1. These missed cases are due to either the incapability of measuring cold TbIRT, below −50 °C, or an incorrect estimation of TbECLR. Thus, the effects of the dynamic range to cloud detection are especially significant for the cold clear sky Tb and clouds having cold Tb, specifically colder than −50 °C, which usually occurs during the winter, or in instances of high-altitude clouds and optically thin clouds.

3.2. Sampling Rate

While the effects of the dynamic range are closely related to the spectral test, so are those of the sampling rate with the temporal test. The key for the temporal test is the determination of the temporal variability of the clear sky TbIRT, which hereafter will be called σECLR at the specific situation. Here, the real-time σECLR is determined by Equation (A3) as a function of TbIRT. The close relations of σECLR to the measured TbIRT is explained twofold; the increasing NEdT with the decreasing source temperature, and the variation of the temporal variability of the actual clear sky Tb. Although it is not clear which cause is dominant, it is clear that the measured TbIRT reflects both effects, and thus provides a good indicator for the variability of the clear sky Tb.
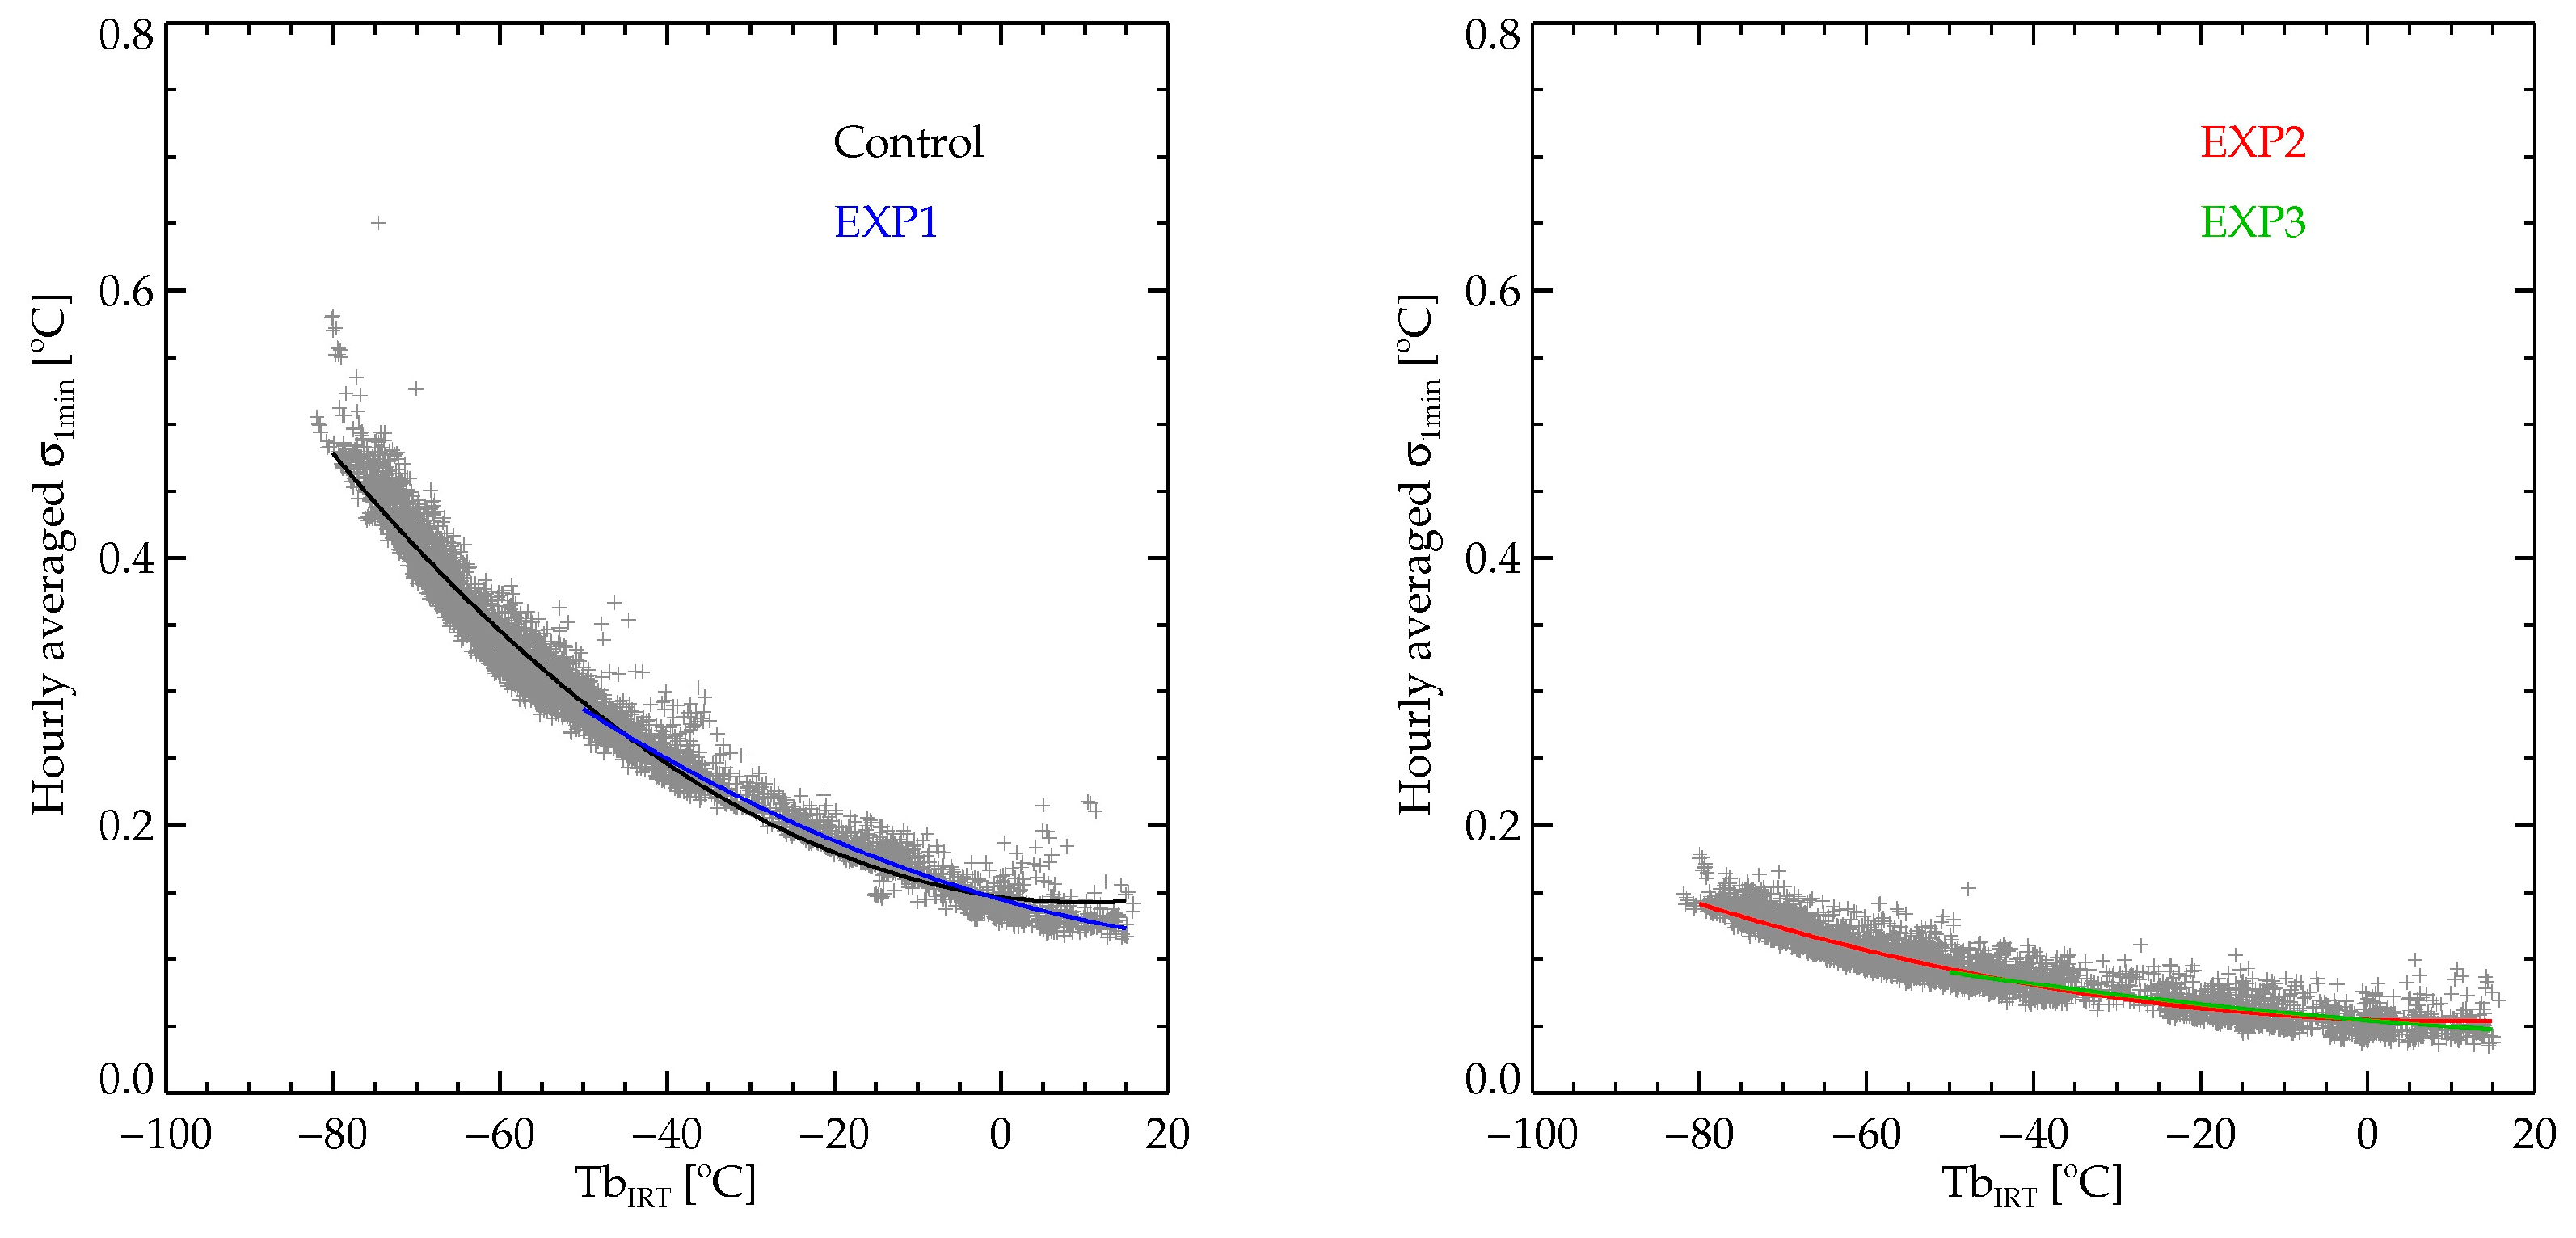
Figure 5 shows the relationship between hourly averaged σ1min (the TbIRT variability for one minute) and TbIRT of the clear sky (for the screening process, see Ahn et al. [9] and Appendix A for a short summary) with the best-fit lines giving the coefficients for Equation (A3), as summarized in Table 5. The relationship again is divided clearly into two groups: the Control and EXP1 versus EXP2 and EXP3, which have sampling rates of 5 Hz and 3 s, respectively. Generally, σECLR increases with the cooler TbIRT. More importantly, the σECLR difference between the two groups also increases with the decreasing TbIRT. The hourly averaged σ1min at TbIRT of −80 °C is 0.47 °C and 0.15 °C for the Control and EXP2, respectively, resulting in a 0.32 °C difference between them. However, at TbIRT of 10 °C, they are 0.14 °C and 0.05 °C; thus, the difference is only about 0.09 °C. Thus, the effects due to the different sampling rate would be more significant with the cold TbIRT. Overall, σECLR is larger for the cooler TbIRT, and/or the higher sampling rate against the response time. Such a characteristic of σECLR is directly related to NEdT, as shown in Figure 2; the smaller the input signal, the larger the NEdT. The higher sampling rate would cut off or ignore the input signal before a sufficient accumulation of the input signal, which results in the larger NEdT.
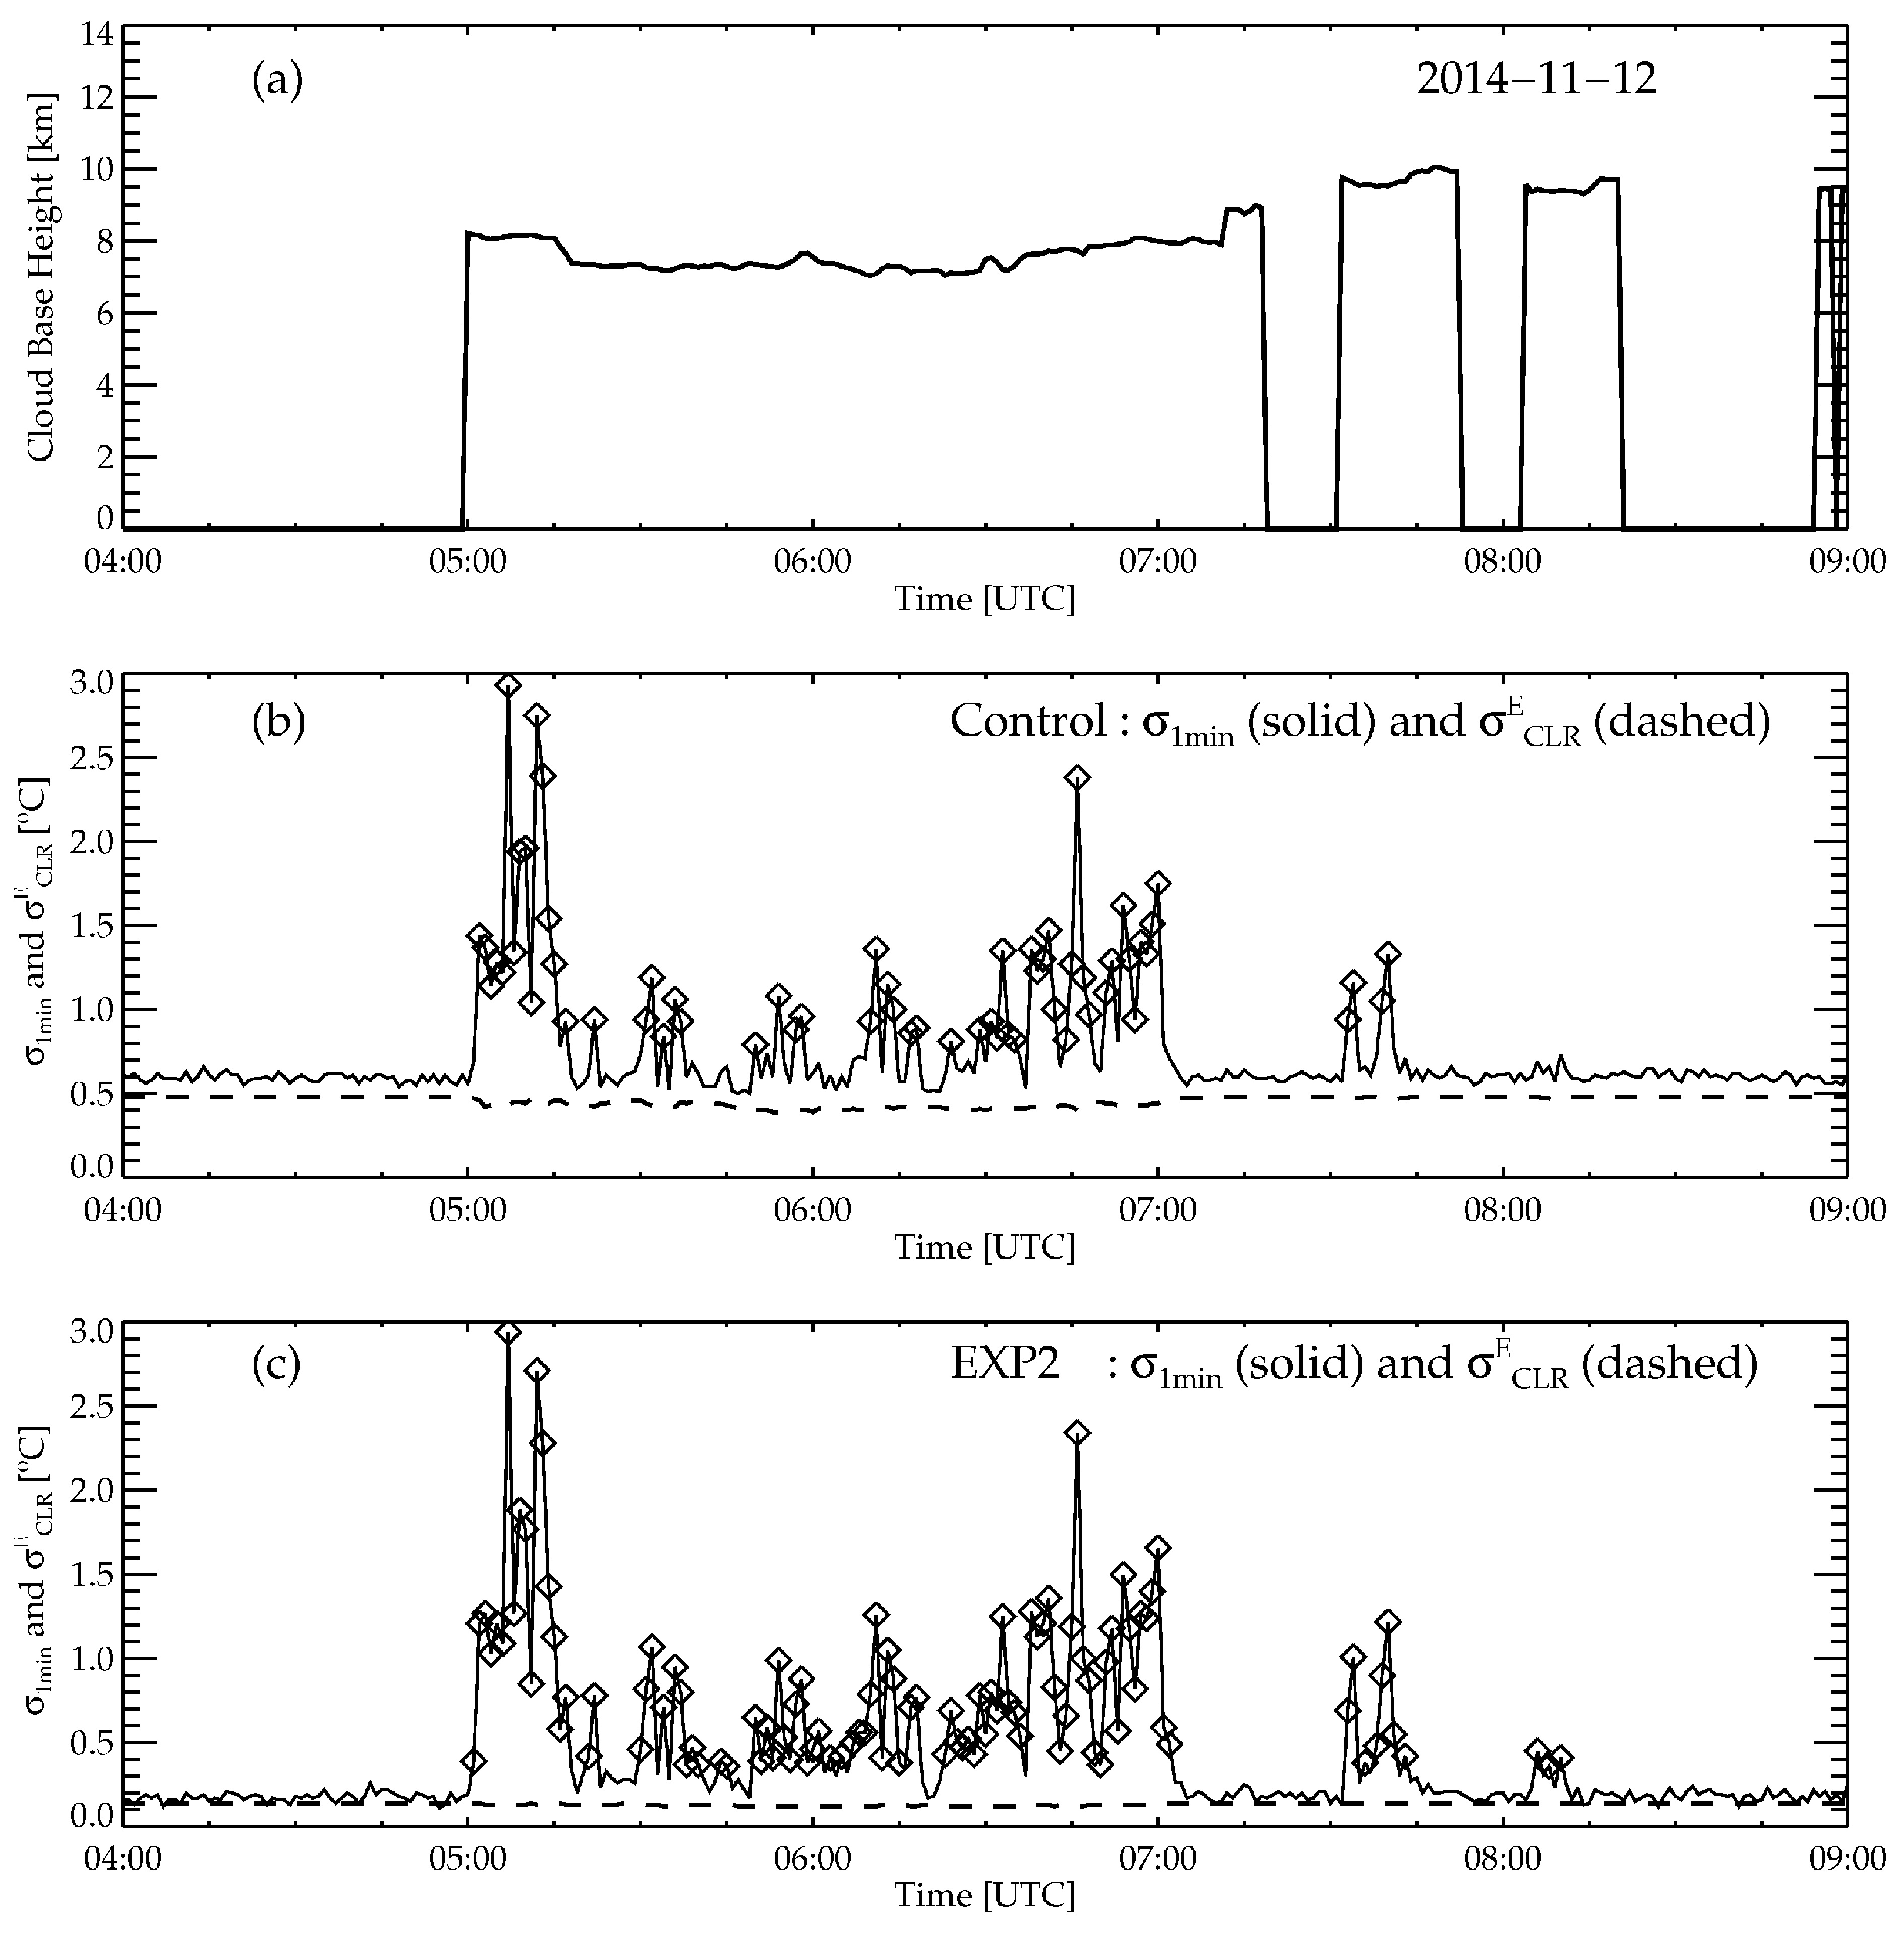
A smaller (or tighter) σECLR in the temporal test is quite important, because it means a higher chance of discerning clouds having a weak temporal variability, such as the uniform stratus or cirrus-type clouds. Alternately, the larger σECLR would be less sensitive to the temporal variability, which results in an increased chance of missed detection. Figure 6 shows such an example with the time series of the temporal variability of TbIRT along with the CBH of MPL for high clouds during the winter. Overall, both the Control and EXP2 detect clouds quite satisfactorily, even when the cloud altitudes are as high as 8–10 km. However, when the measured temporal variability is not very strong, the Control does not detect the cloud, while EXP2 does (104 points versus 61 points, see Figure 6). The discrepancy is shown to be due to the difference in σECLR, which is larger with the Control. Furthermore, in the case of EXP2, σECLR is quite similar to the actual temporal variability, σ1min, during the clear sky, while that of the Control is larger than the clear sky σ1min. Thus, it is quite important to have a better NEdT characteristic for the temporal test, especially for cold Tb values.
When the NEdT is smaller, the uncertainty in Equation (A3), as shown in Table 5, is also reduced from about 0.0166 °C (the Control) to 0.0095 °C (EXP2), in addition to the smaller value of σECLR. Again, as the fitting uncertainty is used as the threshold; a tighter threshold means an increased possibility of a successful temporal test. Therefore, although the increased sampling rate could provide an increased temporal resolution of TbIRT, and thus provide an increased possibility of cloud detection, the possibility is not going to be materialized unless the NEdT of TbIRT is improved. A better NEdT characteristic, especially at the cold target temperature, is the preferred characteristic for the increased sampling rate for the temporal test.

4. Results and Discussion

4.1. Validation

The characteristics of algorithm performance are analyzed through the comparison with the reference data, the ceilometer, and MPL measurements. A different period from the algorithm development—one year, from November 2014 to October 2015—was used for the validation. The IRT data used for the validation were also processed to have the same specifications of each dataset used for the algorithm development. The validation results are shown first for the Control, with the different reference data, followed by the results for the different experimental datasets, cloud altitudes, and seasons. Through the analysis of the validation results, the effects of the different types of IRT data on cloud detection are characterized.
First, the overall performance of the Control is summarized into a contingency table, Table 6, which shows the number of cases for the four categories—hit, miss, false alarm, and corrective negative—in comparison with the measurement of the ceilometer and MPL. The successful detection includes hit and correct negative, while miss and false alarm correspond to detection failure. Regarding the ceilometer-based validation, the success rate is better than 93%, while it reduces to about 73% for the MPL-based validation. This dramatic decrease is due to the increase of both the false alarm and miss, especially due to misses. The percentage of miss increases from 3% for the ceilometer-based to 17% for the MPL-based validation. This degree of increase is mainly due to the increased detectability of MPL for the high clouds (see Appendix B). Consider a case of high clouds that are not detected by the ceilometer but are detected by MPL, for example. Additionally, assume that the clouds are not detected by IRT. Then, the comparison result is a correct negative with the ceilometer-based validation, while it is a miss with the MPL-based validation. Indeed, the difference in the number of correct negatives between the ceilometer-based and MPL-based validation is 67,059, which is the same as the difference of misses between the two references. Moreover, it turns out that about 70% of misses in the MPL-based validation are caused by high clouds that the ceilometer could not detect.
Then again, the false alarms in MPL-based validation, which also increased compared with the ceilometer-based validation (from 20,808 to 52,502 points), are due to the characteristics of the reference instrument: MPL. The difference in the cases of hit for the two reference instruments is 31,694, which is the same as difference in the false alarms. Thus, the majority of false alarms with the MPL-based validation, about 65% of the false alarms, occurs when CBH is below 500 m. This corresponds to the lower boundary of the MPL cloud detection [24,26]. Therefore, the increased false alarms with the MLP-based validation is originated from the limitations in the reference data, not in the limitations of the detection algorithm, nor of the IRT.
The algorithm performances for the different experimental datasets are analyzed using two derived scores: POD (probability of detection) and FAR (false alarm ratio). While POD represents correct detection when the event actually occurs (thus estimated by the number of hits divided by the number of occurrences (i.e., hits plus misses)), FAR represents incorrect detection (thus estimated by the number of false alarms divided by the number of detections (i.e., false alarms plus hits). Table 7 shows the two scores for the four experimental datasets using the two reference data. Overall, the characteristics of the validation results in terms of the reference data are the same as those of the Control: the higher (lower) PODs (FARs) for the ceilometer-based validation compared to the MPL-based validation. The larger FAR score, which is as large as about 25%, is evident with the MPL-based validation, which is due to the increase in false alarms with a limited detection of low clouds by MPL. It is interesting to note that the highest FAR of EXP2, with the ceilometer-based validation, is due to the increased false alarms from high clouds resulting from the limited capability of the ceilometer, rather than due to the limitations of the algorithm.
The root cause for the large POD difference compared with the reference data is clearly identified when PODs are estimated for the different cloud altitudes, as summarized in Table 8. When the clouds are at lower altitude, the POD values are quite similar, all having POD values of higher than 97%, regardless of the reference data (a slightly better POD with the ceilometer-based validation due to lower false alarms). However, with increasing cloud altitudes, the POD values decrease significantly, especially with high clouds, although it depends on the experimental datasets. The POD score with the MPL-based validation shows the worst value of 32% for EXP1 and the best value of 52.2% for EXP2. This rather large difference between the two experimental datasets is due to the difference in the temporal test, which will be shown later. Here, it is important to note that the validation of cloud detection for the high clouds should be performed with the reference data from instruments that capable of detecting high clouds, such as the MPL used for the current study.
Table 8 also shows the different performances for the different experimental datasets. EXP2, having the full dynamic range and a lower sampling rate, shows the best performance, while the Control and EXP3 show a similar performance followed by EXP1, regardless of the reference data. Also, in general, EXP2 shows the best performance for all of the cloud layers, with the increasing degree of outperformance paralleling the increasing cloud altitude. EXP1 having a limited dynamic range and a higher sampling rate shows the worst performance for all of the cloud layers, in fact. Although it is not as prominent as the MPL-based validation, the results from the ceilometer-based validation also show similar characteristics. Thus, EXP2 outperforms regardless of cloud layers and reference data, which entails a more detailed analysis, especially for each spectral and temporal test.
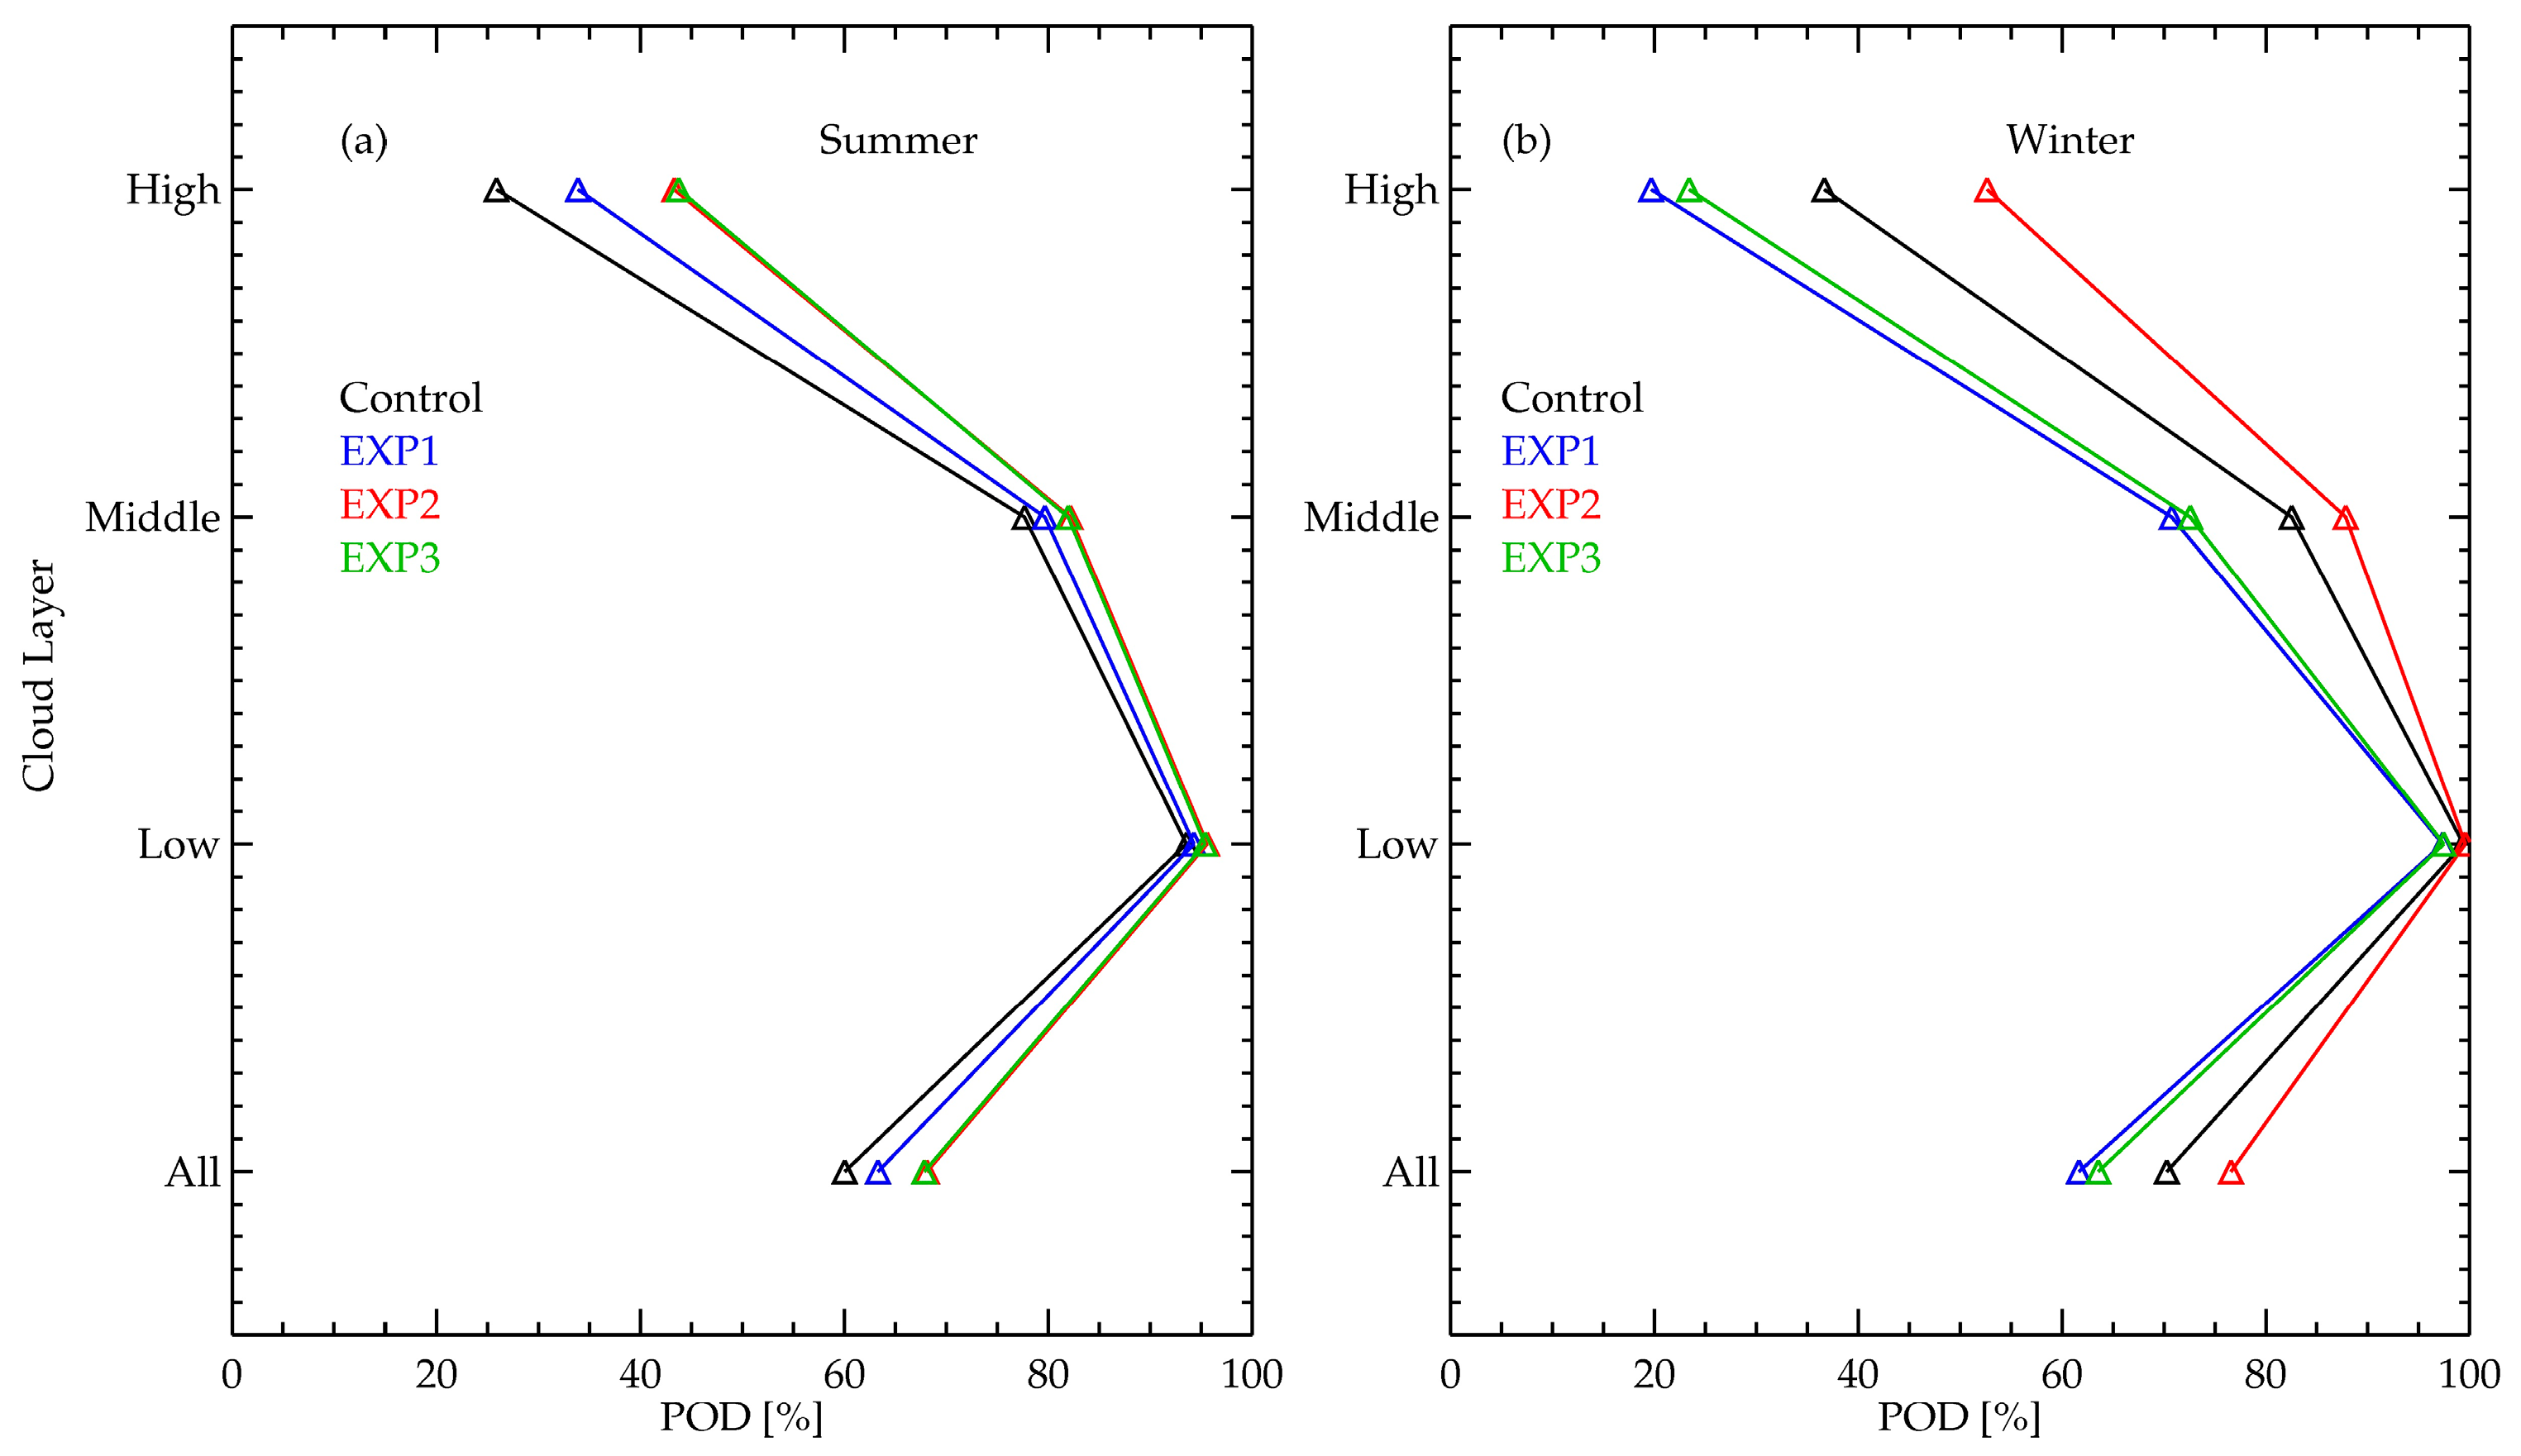
As shown in the algorithm development in Section 3, the spectral and temporal tests are sensitive to the dynamic range and NEdT, respectively. Since both are dependent on the measured Tb, they also depend on the atmospheric conditions. Thus, the authors first check the POD performances for the different atmospheric conditions. To represent the dissimilar atmospheric conditions, the authors use two different seasons: the warm and moist summer, and the cold and dry winter. Here, the two seasons are grouped based on the TSFC and e measured at the SGP site; from June to September (JJAS) for the summer, and from November to February (NDJF) as the winter. Figure 7 shows the POD values of the four experimental datasets with the MPL-based validation for the two seasons and the different cloud layers.
Overall, the POD scores decrease with increasing cloud altitudes, regardless of seasons and experimental datasets, which is the same as the results from the yearlong data. However, the performances with respect to the different seasons and experimental datasets show distinct characteristics. During the summer, for example, EXP2 and EXP3 (having the lower NEdT) show almost the same POD scores at all of the cloud layers, followed by the EXP1 and Control scores. Conversely, during the winter, while the EXP2 still shows the best POD performance, the Control performs the second best, followed by EXP3 and EXP1 (with the last two having the same dynamic range). It is interesting to note that there is a rather large performance difference between the two top performers—EXP2 and the Control—even though they have the same dynamic range. This is due to the performance differences in the temporal test, which will be shown later. To summarize, during the summer, NEdT, and thus the temporal test, is the key to differentiating the detection performance. During the winter, the dynamic range, and thus the spectral test, is the key for the winter, while the temporal test plays an important role when the dynamic range is the same.
The reasons for such a performance characteristic are traced back to the combined effects of the IRT data type, the characteristics of algorithm tests, and the atmospheric conditions. First, during the summer, the clear sky Tb is rather warm, and thus, the estimated TbECLR for all four experimental datasets are almost the same (see Figure 3). Furthermore, the Tb contrast between the clouds and the clear sky is reduced due to the warmer clear sky Tb. This is especially true for the high altitude and thin clouds with the warm and humid atmosphere [13,29]. Overall, during the warm and humid summer, the spectral test for the cold clouds, but over −50 °C, becomes less effective than the temporal test [3,8]. Thus, the POD difference among the four experimental datasets is mainly determined by the temporal test, which shows a better performance with the lower NEdT. EXP2 and EXP3 equally outperform the other two experimental datasets as a result.
During the winter, the IRT data having limited dynamic range (EXP1 and EXP3) show the worst performance, because the actual TbIRT could be well below −50 °C for many cases. Regarding those cases, the measured TbIRT will be −50 °C, even though the actual Tb of the cloudy or the clear sky is cooler than −50 °C. Concurrently, due to the cold and dry atmospheric conditions, the estimated TbECLR would be about −50 °C. A combination of the two effects results in the failure of the spectral test, because the cloudy TbIRT would be almost the same as TbECLR. The limited dynamic range also introduces an issue with the temporal test, because the actual temporal variability of the cloudy Tb would be smeared out with the constant value of −50 °C. Thus, the dramatic reduction of POD with EXP1 and EXP3 compared with EXP2 is due to the limited performance of both spectral and temporal tests. Finally, the POD difference between the EXP2 and Control having the same dynamic range is mostly due to the performance difference of the temporal test due to the NEdT difference.
Finally, the POD performance for each test, season, and experimental dataset for the high clouds are summarized in Table 9. First, regardless of seasons and experimental datasets, the largest POD contribution is from the temporal test, confirming the important role of the temporal test in detecting high clouds. Regarding the temporal test, the experimental datasets with the better NEdT, such as EXP2 and EXP3, show the better POD values, even though EXP3 has the limited dynamic range. However, the much smaller POD value of EXP3 during the winter is due to the limited dynamic range, which smears out the temporal variability, and thus makes the temporal test inefficient. Secondly, in the case of the spectral test, both the dynamic range and the fitting uncertainty play a role. During the summer, which has less Tb contrast due to the humid and warmer lower atmosphere, EXP1 and EXP3 show the better performance compared with the others, which have the larger fitting uncertainty (see Table 4), for example. Then again, during winter, the Control shows a much better POD compared with the EXP1 and EXP3 values, which have a limited dynamic range. Here, it is noteworthy that EXP2 shows a smaller POD compared to the Control for the spectral test (8.0% versus 4.3%), while EXP2 shows a much larger POD value in both tests (12.5% versus 8.3%). Thus, the total PODs of the spectral test and both tests for the two experimental datasets are almost the same (about 16%).

4.2. Discussion

The results from the algorithm development and algorithm validation are used to characterize the relationship between the characteristics of IRT data and cloud detection. First, the sufficient dynamic range of IRT is shown to be a necessary condition for the accurate and realistic estimation of TbECLR, especially for cold atmospheric conditions. Regarding the case of the cold clouds, the dataset that has a limited dynamic range with a better NEdT shows an inferior performance compared with the case with a full dynamic range. Conversely, if the dynamic range is sufficient, the reduced sampling rate, which increases NEdT performance, is shown to be highly important for high-altitude clouds. Thus, the best detection performance for the worst situation—high thin clouds with warm and humid lower atmosphere—is achieved when the IRT data has the best NEdT performance with the full dynamic range.
One thing to note with the algorithm performance is the fitting uncertainty that is used as a threshold for the detection test, particularly for the estimation of TbECLR. Although the Control dataset covers the full dynamic range, its performance for the summer is the worst due to the larger fitting uncertainty (5.0 °C), which is much larger than that of EXP1 (3.3 °C) having the limited dynamic range. The increased fitting uncertainty is mainly due to the increased NEdT with the decreasing Tb. As the dynamic range extends toward cold Tb, the number of data with higher NEdT are going to be increased, and thus, the fitting uncertainty is going to be increased. Therefore, it is important to have a dataset with a sufficient NEdT performance and a full dynamic range to improve both the spectral and temporal tests.
Even though the cloud detection could be improved with better NEdT performance, the performance with the high clouds shows room to improve. Concerning the instrumentation, it is highly recommended to improve the NEdT performance, especially at the cooler Tb, which would require a substantial improvement in the noise reduction measures. Alternately, regarding algorithm improvement, there are at least two areas to be investigated further. The first is to improve the accuracy of TbECLR by utilizing better information for atmospheric water vapor. Currently, the surface humidity is used for a proxy of total atmospheric water content, or total precipitable water (TPW), in the TbECLR estimation. When the surface humidity does not properly represent TPW, the estimated TbECLR does have an error, and consequently there are also errors in the detection algorithm. Thus, a utilization of TPW from a collocated instrument such as a microwave radiometer or GPS observation will be further investigated [30]. Another possibility lies in the improvement of the threshold values used in both tests by utilizing the detection results, for example, a re-evaluation of the temporal variability using the measured clear sky Tb. Furthermore, the whole process ought to be performed in the radiance domain instead of the Tb domain, in order to resolve the non-linearity problem in digitization of the input signal.
Finally, it is quite important to use proper reference data for an accurate validation of algorithm performance, especially for the high altitude and optically thin clouds. When a ceilometer with limited detection capability for high clouds is used for the algorithm validation, the estimated POD is shown to be higher erroneously than the actual performance available with the comparison of the MPL data.
5. Conclusions

Here, the effects due to the different types of IRT data on cloud detection are investigated using data from the ARM-SGP site. Since the two important characteristics of IRT—dynamic range and sampling rate (or overall NEdT)—are directly related to the formulation of the empirical equation for the detection algorithm, the algorithm performance is highly dependent on the characteristics of IRT data. It is shown that the dynamic range of the IRT data strongly affects the characteristics of the expected clear sky Tb, while the sampling rate does so on the expected temporal variability of the clear sky Tb. Overall, the most significant effect due to the different data type occurs when the measured Tb are cold such as during the winter, when there are high-altitude clouds, optically thin clouds, and/or a combination of these conditions. The full dynamic range, especially with the lower boundary of −100 °C, provides a possibility of having realistic clear sky Tb forecasting, even during the winter. Furthermore, if the dynamic range is not sufficient, the actual temporal variability is not captured by the limited Tb value, resulting in the failure of the temporal test. Conversely, the lower sampling rate with the increased NEdT performance has a significant advantage for the detection of high cold-altitude cold clouds, thanks to the better characterization of temporal variability.
Such effects are quantitatively demonstrated through the validations of the algorithm performance using the sky conditions inferred from the reference instruments: a ceilometer and micropulse LIDAR (MPL). Due to the instrument characteristics, the ceilometer has a limited detection capability with the high clouds, which are usually higher than about 7 km, while MPL has issue with the lower clouds that are below about 500 m. Thus, the algorithm performances are analyzed for the different reference instrument, different cloud altitudes, different seasons, and different detection tests. Overall, the performance analysis is summarized as follows:
(i)
The ceilometer-based validation shows the higher probability of detection (POD) and the lower false alarm ratio (FAR) compared with the MPL-based validation, which is mainly due to the limited capability of the ceilometer with high clouds.
(ii)
Regardless of the reference data, the POD scores decrease with increasing cloud altitudes due to the decreased contrast between the clear sky and the cloudy Tbs. Instead, the detectability of the low clouds is outstanding: better than 97%, in all of the experimental datasets.
(iii)
Among the different IRT data types, the dataset having the full dynamic range and the lower sampling rate shows the best performance, especially for the high clouds, whereas the poorest performance is shown with the dataset with the limited dynamic range and the higher sampling rate.
(iv)
The algorithm performance for all of the different IRT data types to different seasons reveals the relative importance of the IRT specifications; the lower sampling rate is the key factor in the summer, whereas the full dynamic range is the necessary condition for the proper application of both the spectral and temporal tests.
(v)
The majority of successful detections of high clouds come from the temporal test (about 92% of POD in the winter); thus, the lower measurement uncertainty in the cold Tb is the most important characteristics for the detection of high clouds.

Author Contributions

Both authors contributed to the conception of paper, analysis and discussion, and the writing of the manuscript. M.H.A. conceived the idea and moved forward the idea; H.Y.W. designed the experiments and analyzed the results.

Funding

National Strategic Project-Fine Particle of the National Research Foundation of Korea (NRF) funded by the Ministry of Science and ICT (MSIT), the Ministry of Environment (ME), and the Ministry of Health and Welfare (MOHW). (NRF-2017M3D8A1092021).

Acknowledgments

The data from the U.S. Department of Energy’s Atmospheric Radiation Measurement (ARM) Climate Research Facility located near Lamont, Oklahoma were used in this study. Careful comments given by the anonymous reviewers helped improve the manuscript.

Conflicts of Interest

The authors declare no conflict of interest.

Appendix A

The cloud detection algorithm introduced by Ahn et al. [9] consists of two tests—the spectral and the temporal tests—which basically compare the brightness temperature (Tb) measured by an infrared thermometer (IRT) with the estimated clear Tb. If the measured Tb (TbIRT) is warmer than expected clear sky Tb (TbECLR) beyond the uncertainty of the expected value, it is determined as the cloudy sky, naming the spectral test. Similarly, if the temporal variability of Tb is larger than that of the clear sky Tb (σECLR) beyond the uncertainty, it is considered as a cloudy sky. For the temporal test, the TbIRT variability for one minute is used. If the cloud presence is determined by any of the two tests, it is determined to be cloudy. Thus, the essence of the algorithm is to obtain TbECLR and σECLR along with their uncertainties as a function of real time TbIRT, temperature (TSFC), and humidity (e) measured at the ground level.
First, the equation for the TbECLR is prepared through two steps: establishing a theoretical relationship, followed by an empirical adjustment. The theoretical relationship of the simulated clear sky Tb (TbS) as a function of TSFC and e are obtained using the TbS prepared by the radiative transfer simulations with MODTRAN 5.2.2 [31]. The input atmospheric profiles of temperature and humidity for the radiative transfer model are from the radiosonde observations: a total of 1993 soundings obtained at every 6 h at the SGP site. Using TbS and the set of measured TSFC and e (water vapor pressure), the theoretical relationship is derived. By brute force tests, the most appropriate formula is determined to have following formula:
TbS = TSFC exp [a0 + a1 × (e/TSFC) + a2 × (e/TSFC)2]
The second step is an adjustment of the theoretical relationship (A1) to account for the characteristics of TbIRT that depend on the specific instrument. For example, the systematic uncertainties in TbIRT could be reduced for the algorithm through the adjustment. The effects due to the limited range of the TbIRT used for Ahn et al. [9], having the coldest TbIRT of −50 °C, could also be mitigated. Thus, this adjustment process is the one of the main algorithm parts that is affected by the instrument characteristics. The adjustment process is relatively simple once the dataset consisting of TbS and the corresponding clear sky TbIRT is prepared. The time averaged (for 30 min after the radiosonde launch time) TbIRT and its temporal variability are inspected to select the clear sky TbIRT (see below). The most plausible formula relating TbS and the clear sky TbIRT and thus giving the formula for TbECLR is determined to be:
TbECLR = b0 + b1 × TbS + b2 × (TbS)2
where the regression coefficients of b0, b1, and b2 are the instrument specifics.
Finally, the uncertainty in the estimated TbECLR is determined by the root mean square error of the fitting uncertainties in the Equations (A1) and (A2) by assuming that the two relations are independent. As the TbECLR uncertainty is used for the threshold of the spectral test, its magnitude also affects the algorithm performance; the larger is the larger difference between TbECLR and TbIRT that is required in order for it to be determined as cloudy.
For the temporal variability, σECLR, a set of reliable clear sky data are selected by constraining temporal variation of TbIRT [13,32]. Here, an hourly average σ1min (the TbIRT variability for one minute) and its standard deviation (σ1h) are used to select a potential clear sky data. Only data points having a small σ1h value of less than 0.03 (as shown in Figure 5b of Ahn et al. [9]) are considered as the cloud-free data. The σ1min for clear sky show a clear dependency on the corresponding TbIRT, which is mainly explained by the dependence of the temperature resolution to the target temperature, the larger σ1min for the cooler TbIRT. Thus, the expected temporal variability of the clear sky TbIRT for one minute is given by:
σECLR = c0 + c1 × TbIRT + c2 × (TbIRT)2
The uncertainty of σECLR of Equation (A3) is also determined to be equal to the fitting uncertainty.
Therefore, the TbIRT value obtained from the IRTs having different dynamic range and sampling rates will affect the empirical Equations (A2) and (A3) along with the fitting uncertainties, which affect the algorithm characteristics and the overall performances. One thing to note is that the different characteristics of IRT data are directly related to the derived equations, although the performance of cloud detection also depends on several other components, such as the atmospheric conditions and characteristics of algorithm itself, not only the specification of IRT.

Appendix B

The several comparison studies of the cloud base height (CBH) from the ceilometer and micropulse LIDAR (MPL) have shown that the ceilometer tends to register a slightly higher CBH [25,26,27,28,33]. Even the same brands such as CL31 and CL51 are known to provide a different CBH due to different laser power [34,35,36]. Therefore, for a better utilization of the CBH data for a specific instrument, it would be better to make a comparison to make sure that the reference data are well understood.
For the comparison, the first-layer CBH data from the two instruments are averaged for every minute, as treated by the previous studies [25,34]. Figure A1 shows the number distribution of CBHs between ceilometer and MPL over one year (from 1 November 2014 to 31 October 2015). Here, the lower boundary of 0.5 km corresponds to that of MPL while the upper limit of 7.7 km is due to the ceilometer. The agreement in the sky condition (clear or cloudy) between the two instruments is about 88.3%: 220,134 points for clear sky (49.4%) and 157,558 points for cloudy sky (38.9%). The majority of disagreements are concentrated at each limiting altitude; indeed, ceilometer misses the cloud detected by MPL at higher than about 7.4 km, while MPL is indeterminate at below 500 m. Due to such a discrepancy in the cloud detection between the two reference data, it is expected that validation results would vary depending on which reference data is applied. Although Costa-Surós et al. [37] utilized the cloud base best estimate (CBBE) obtained by combining MPL and ceilometer, CBBE is best applicable to determine cloud base height from different types of active remote sensing instruments, rather than for determination of the cloud presence. Therefore, in this study, with the limitations of each CBH data in mind, both are utilized as reference data for algorithm validation.
Figure A1. The number distribution of CBHs between ceilometer and MPL at the ARM SGP site over one year (1 November 2014–31 October 2015). The number count within each bin is expressed with the different colors. The size of each bin is 0.2 km, and the total data are 404,971 points. Here, “Clear” indicates that no significant backscattering signal is detected at each instrument.
Remotesensing 10 01049 g0a1
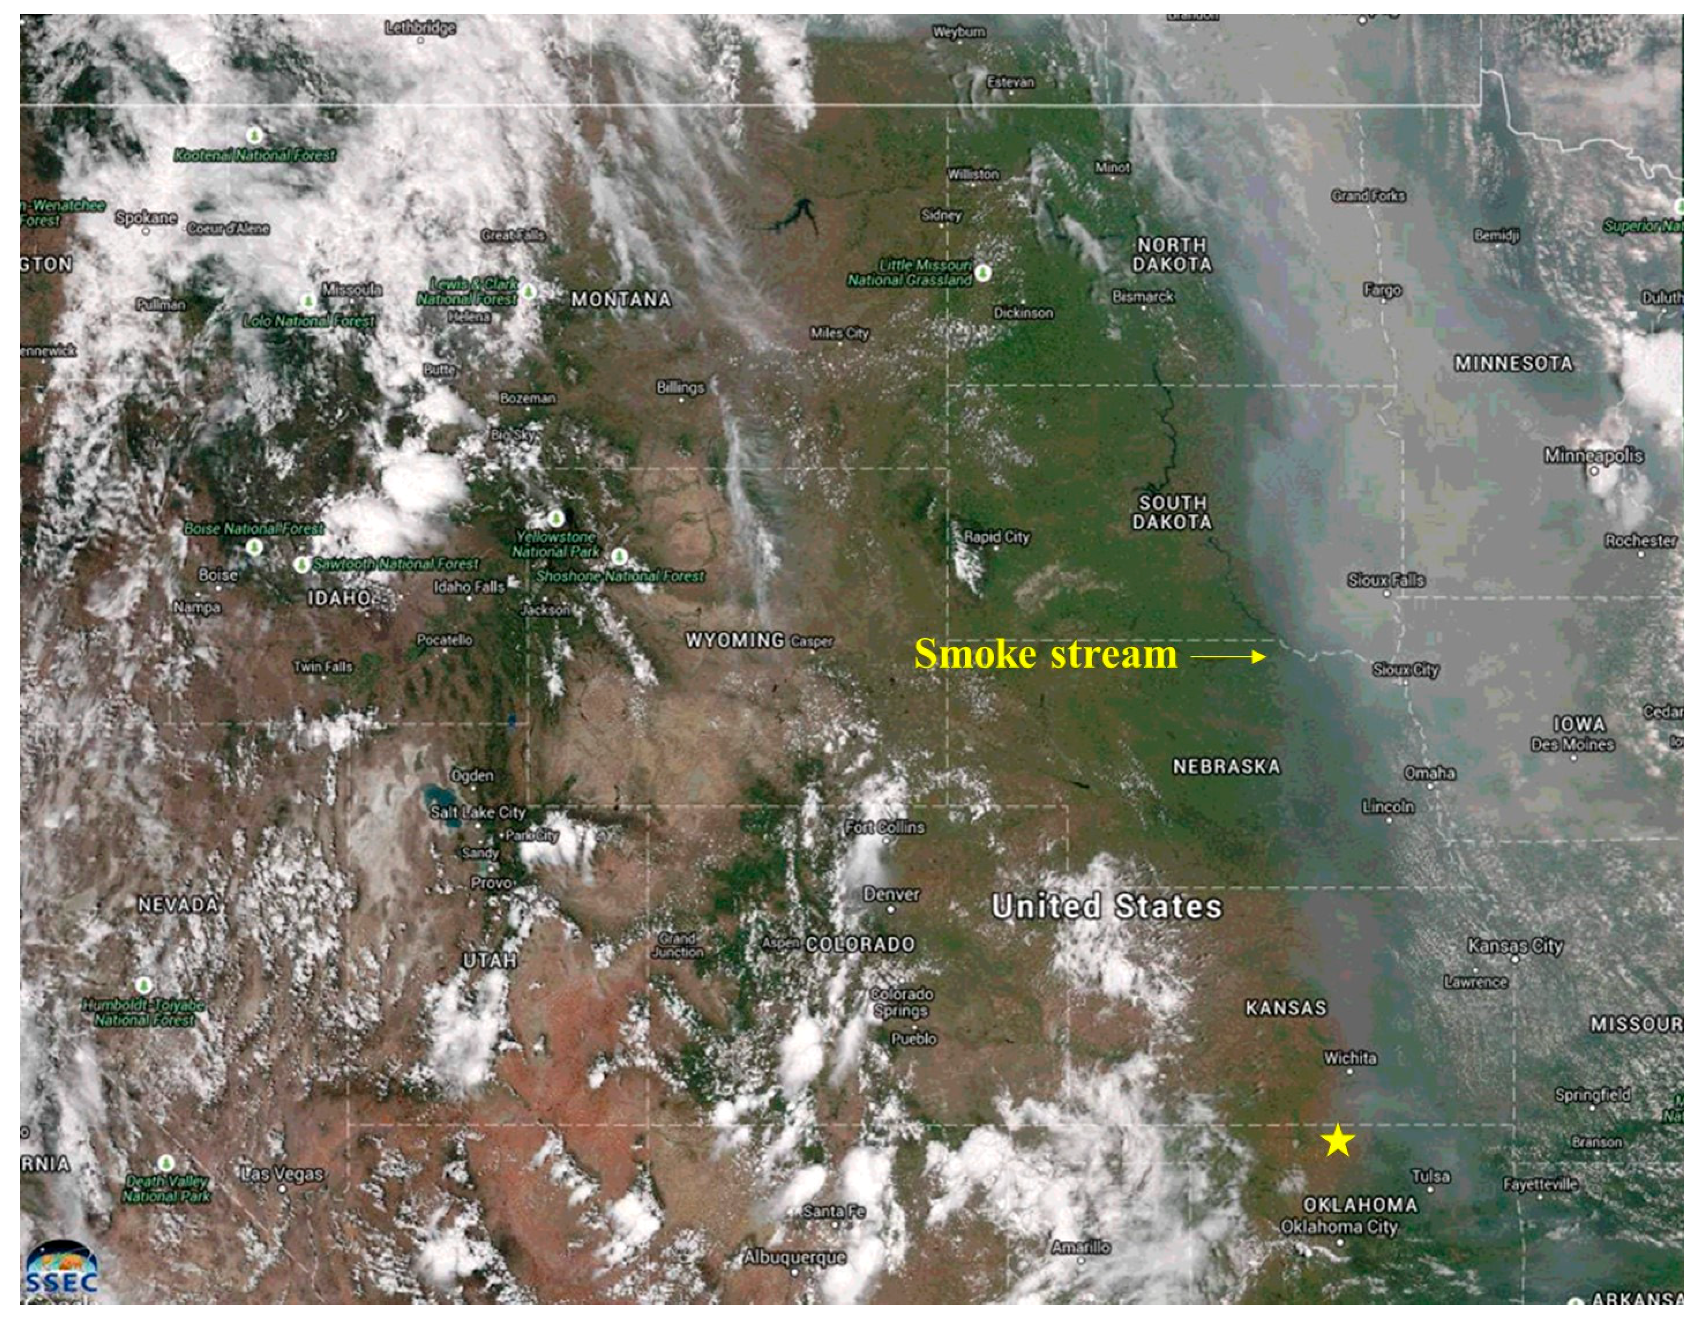
During the inter-comparison between CBHs of ceilometer and MPL, a few interesting cases are found exemplifying the different characteristics of the wavelength used for each instrument. As the laser light for MPL is shorter than that of the ceilometer (532 nm versus 910 nm), MPL is more sensitive to the smaller particles such as dust, smoke, and haze. Therefore, MPL could be sensitive to the presence of particles other than the cloud droplets, and could misclassify the aerosol layer as the cloud layer. One such an example is the smoke layer from the fires [38]. As shown in Figure A2, during about two days on 29 June and 30 June 2015, a heavy smoke layer was transported over the SGP sites from the wild fires.
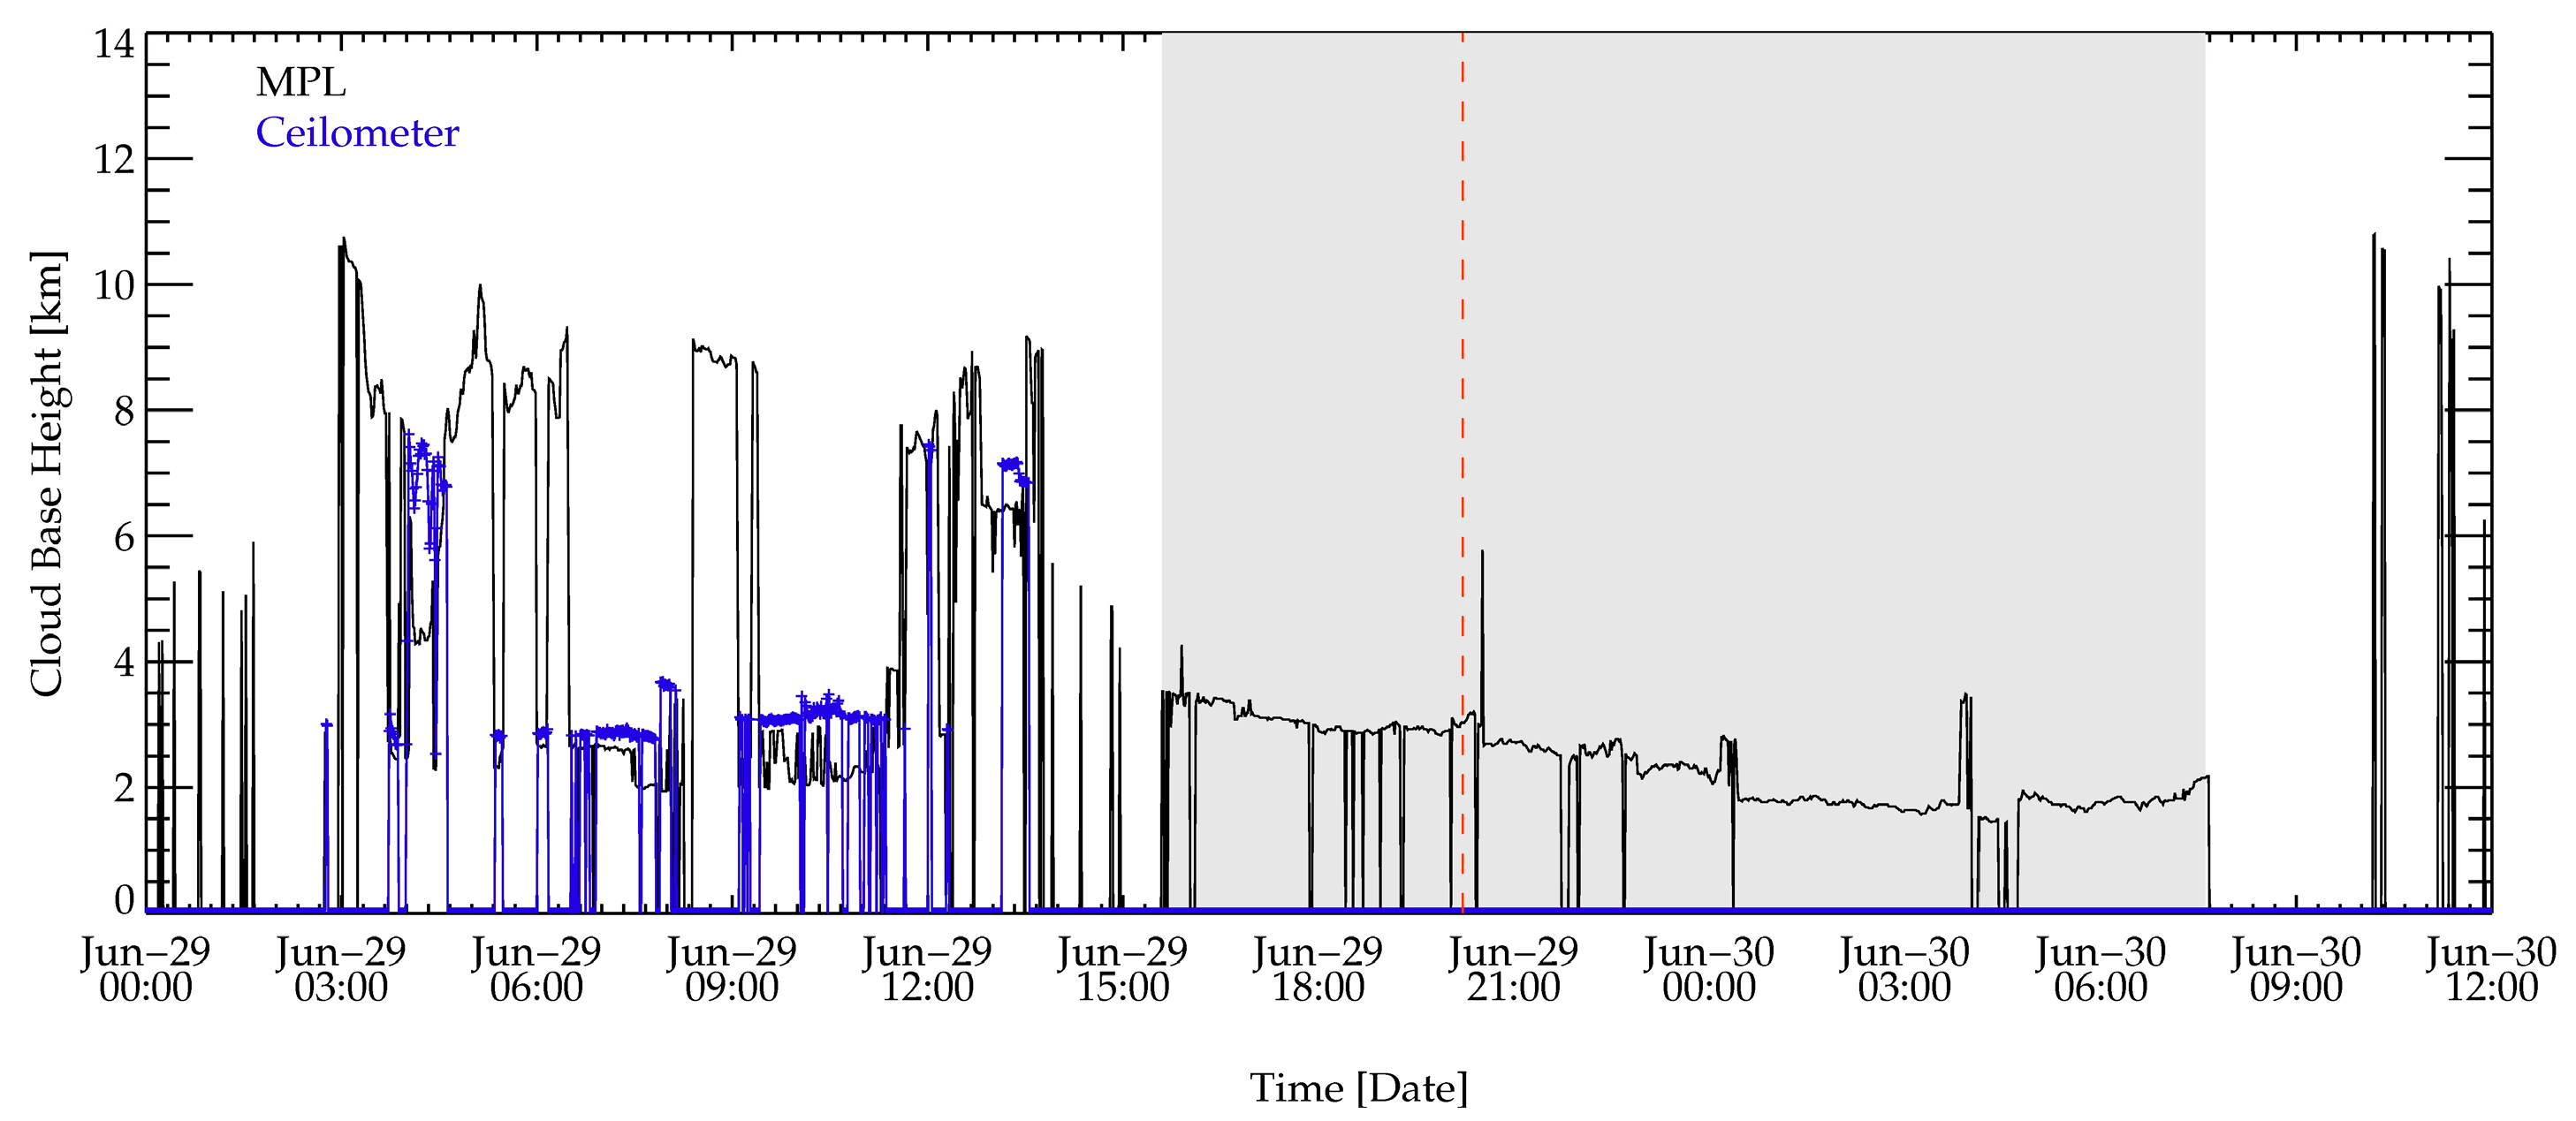
During the two days, the time series of the derived CBH from both MPL and the ceilometer are shown in Figure A3. First, many of the low to middle clouds are well captured by both instruments, such as the time between 10:00 UTC to 15:00 UTC, 29 June. On the other hand, the high clouds—above about 7 km—that were detected by MPL were not captured by the ceilometer. However, the most interesting case occurred from 15:00 UTC of 29 June to 09:00 UTC of 30 June, when the MPLCMASK (MPL cloud mask algorithm; Sivaraman and Comstock [24]) reported clouds at around 3 km above ground, while the ceilometer reported no clouds (or zero CBH). In such a case, it is known that cloud detection with a ceilometer is more reliable than that of MPL, because of the limit of the MPLCAMSK procedure, specifically due to the shortage in separating water cloud from other strong scatters [39]. Therefore, the possible contaminated data are checked through a manual inspection, and thus, a total of seven days of data are suspected to be affected by the heavy smoke layer and are excluded for current study. It is interesting to note that the IRT distinguishes clouds and aerosols during this period (the shaded period in Figure A3); during the aerosol episode, it is classified as a clear sky. Thus, the IRT-based cloud detection is affected by aerosols only when their optical depth is high enough to increase the downwelling radiance significantly (not the current case).
Figure A2. The true-color red–green–blue (RGB) imagery of VIIRS (Visible Infrared Imaging Radiometer Suite) onboard the SNPP (Suomi National Polar-orbiting Partnership) at 20:13 UTC on the first day (as marked red dashed line in Figure A3). Ashy smoke stream is seen across the central part of North America. The ARM SGP site (marked with a yellow star) is located at the edge of the smoke stream (image source: http://cimss.ssec.wisc.edu/goes/blog/wp-content/uploads/2015/06/150629_modis_virrs_truecolor_Canadian_smoke_anim.gif).
Remotesensing 10 01049 g0a2
Figure A3. Time series of CBH from ceilometer (blue solid line) and MPL (black solid line) on 29 and 30 June 2015.
Remotesensing 10 01049 g0a3

References

  1. Illingworth, A.J.; Hogan, R.J.; O’Connor, E.J.; Bouniol, D.; Brooks, M.E.; Delanoé, J.; Donovan, D.P.; Eastment, J.D.; Gaussiat, N.; Goddard, J.W.F.; et al. Cloudnet—Continuous evaluation of cloud profiles in seven operational models using ground-based observations. Bull. Am. Meteorol. Soc. 2007, 88, 883–898. [Google Scholar] [CrossRef]
  2. Wulfmeyer, V.; Hardesty, R.M.; Turner, D.D.; Behrendt, A.; Cadeddu, M.P.; Di Girolamo, P.; Schlüssel, P.; Van Baelen, J.; Zus, F. A review of the remote sensing of lower tropospheric thermodynamic profiles and its indispensable role for the understanding and the simulation of water and energy cycles. Rev. Geophys. 2015, 53, 819–895. [Google Scholar] [CrossRef] [Green Version]
  3. Kerber, F.; Querel, R.R.; Neureiter, B.; Hanuschik, R. Through thick and thin: Quantitative classification of photometric observing conditions on Paranal. In Proceedings of the SPIE (9910), Edinburgh, UK, 26 July–1 June 2016. [Google Scholar] [CrossRef]
  4. Morris, V. Infrared Thermometer (IRT) Handbook; DOE/SC-ARM-TR-015; U.S. Department of Energy: Washington, DC, USA, 2018; p. 31.
  5. Ahn, M.-H.; Won, H.Y.; Kim, Y.-H.; Ha, J.-C. Characterization of downwelling radiance measured from a ground-based radiometer using numerical weather prediction model. Atmos. Meas. Tech. 2016, 9, 281–293. [Google Scholar] [CrossRef]
  6. Brocard, E.; Schneebeli, M.; Matzler, C. Detection of cirrus clouds using infrared radiometry. IEEE Trans. Geosci. Remote Sens. 2011, 49, 595–602. [Google Scholar] [CrossRef]
  7. Sutter, M.; Dürr, B.; Philipona, R. Comparison of two radiation algorithms for surface-based cloud-free sky detection. J. Geophys. Res. 2004, 109, D17202. [Google Scholar] [CrossRef]
  8. Thurairajah, B.; Shaw, J.A. Cloud statistics measured with the infrared cloud imager (ICI). IEEE Trans. Geosci. Remote Sens. 2005, 43, 2000–2007. [Google Scholar] [CrossRef]
  9. Ahn, M.-H.; Han, D.; Won, H.Y.; Morris, V. A Cloud detection algorithm using the downwelling radiance measured by an infrared pyrometer of the ground-based microwave radiometer. Atmos. Meas. Tech. 2015, 8, 553–566. [Google Scholar] [CrossRef]
  10. Morris, V.; Long, C.; Nelson, D. Deployment of an infrared thermometer network at the Atmospheric Radiation Measurement Program Southern Great Plains Climate Research Facility. In Proceedings of the 16th Atmospheric Radiation Measurement (ARM) Science Team Meeting, Richland, WA, USA, 27–31 March 2016; Department of Energy: Washington, DC, USA, 2016. [Google Scholar]
  11. Coulter, R. Micropulse Lidar (MPL) Handbook; DOE/SC-ARM-TR-019; U.S. Department of Energy: Washington, DC, USA, 2012; p. 13.
  12. Zhang, W.-X.; Lu, D.-R.; Change, Y.-L. A feasibility study of cloud base height remote sensing by simulating ground-based thermal infrared brightness temperature measurements. Chin. J. Geophys. 2007, 50, 339–350. [Google Scholar] [CrossRef]
  13. Turner, D.D.; Gero, P.J. Downwelling 10 μm radiance temperature climatology for the Atmospheric Radiation Measurement Southern Great Plains site. J. Geophys. Res. 2011, 116, D08212. [Google Scholar] [CrossRef]
  14. Meloni, D.; di Sarra, A.; Brogniez, G.; Denjean, C.; De Silvestri, L.; De Iorio, T.; Formenti, P.; Gómez-Amo, J.L.; Gröbner, J.; Kouremeti, N.; et al. Determining the infrared radiative effects of Saharan dust: A radiative transfer modelling study based on vertically resolved measurements at Lampedusa. Atmos. Chem. Phys. 2018, 18, 4377–4401. [Google Scholar] [CrossRef]
  15. Stokes, G.M.; Schwartz, S.E. The Atmospheric Radiation Measurement (ARM) program: Programmtic background and design of the cloud and radiation testbed. Bull. Am. Meteorol. Soc. 1994, 75, 1201–1221. [Google Scholar] [CrossRef]
  16. Ackermann, T.P.; Stokes, G.M. The Atmospheric Radiation Measurements program. Phys. Today 2003, 56, 38–44. [Google Scholar] [CrossRef]
  17. Heitronics. Infrared Radiation Pyrometer KT 19 II. Available online: www.pentronic.se/media/53285/KT19II%20e%20Manual.pdf (accessed on 21 March 2018).
  18. Wintronics. Lighting Industry Technote. Wintronics. Available online: http://www.wintron.com/Infrared/Infrared-Tech-Notes (accessed on 21 March 2018).
  19. Berendes, T.A.; Welch, R.M.; Dutton, E.G.; Uttal, T.; Clothiaux, E.E. Cloud cover comparisons of the MODIS daytime cloud mask with surface instruments at the north slope of Alaska ARM site. IEEE Trans. Geosci. Remote Sens. 2004, 42, 2584–2593. [Google Scholar] [CrossRef]
  20. Feister, U.; Möller, H.; Sattler, T.; Shields, J.; Görsdorf, U.; Güldner, J. Comparison of macroscopic cloud data from ground-based measurements using VIS/NIR and IR instruments at Lindenberg, Germany. Atmos. Res. 2010, 96, 395–407. [Google Scholar] [CrossRef]
  21. Joro, S.; Hyvärinen, O.; Kotro, J. Comparison of satellite cloud masks with ceilometer sky conditions in Southern Finland. J. Appl. Meteo. Climatol. 2010, 49, 2508–2526. [Google Scholar]
  22. Vaisala. Vaisala Ceilometer CL31 User’s Guide; Vaisala Oyj.: Helsinki, Finland, 2006. [Google Scholar]
  23. Wang, Z.; Sassen, K. Cloud type and macrophysical property retrieval using multiple remote sensors. J. Appl. Meteorol. 2001, 40, 1665–1682. [Google Scholar] [CrossRef]
  24. Sivaraman, C.; Comstock, J. Micropulse Lidar Cloud Mask Value-Added Product Technical Report; DOE/SC-ARM/TR-098; U.S. Department of Energy: Washington, DC, USA, 2011; p. 7.
  25. Turner, D.D. Comparison of the micropulse lidar and Belfort laser ceilometer at the Atmospheric Radiation Measurement Southern Great Plains Cloud and Radiation Testbed site. In Proceedings of the 6th Atmospheric Radiation Measurement (ARM) Science Team Meeting, San Antonio, TX, USA, 4–7 March 1996. [Google Scholar]
  26. Kalb, C.P.; Dean, A.R.; Peppler, R.A.; Sonntag, K.L. Intercomparison of cloud base height at the Atmospheric Radiation Measurement Southern Great Plains Site. In Proceedings of the 14th Atmospheric Radiation Measurement (ARM) Science Team Meeting, Albuquerque, NM, USA, 22–26 March 2004. [Google Scholar]
  27. Morris, V. Vaisala Ceilometer (VCEIL) Handbook; DOE/SC-ARM-TR-020; U.S. Department of Energy: Washington, DC, USA, 2018; p. 17.
  28. Shukla, K.K.; Kumar, K.N.; Phanikumar, D.V.; Newsom, R.K.; Kotamarthi, V.R.; Ouarda, T.B.M.J.; Ratnam, M.V. Identification of the cloud base height over the central Himalayan region: Intercomparison of Ceilometer and Doppler Lidar. Atmos. Meas. Tech. Discuss. 2016. under review. [Google Scholar] [CrossRef]
  29. Dürr, B.; Philipona, R. Automatic cloud amount detection by surface longwave downward radiation measurement. J. Geophys. Res. 2004, 109, D05201. [Google Scholar] [CrossRef]
  30. Won, H.Y.; Ahn, M.-H. Introduction to a real-time cloud detection based on the ground-based infrared thermometer and microwave radiometer at ARM SGP site. In Proceedings of the 19th EGU General Assembly/EGU2017, Vienna, Austria, 23–28 April 2017. [Google Scholar]
  31. Berk, A.; Anderson, G.P.; Acharya, P.K.; Shettle, E.P. MODTRAN® 5.2.2 User’s Manual; Spectral Sciences, INC.: Burlington, NJ, USA, 2011; p. 69. [Google Scholar]
  32. Marty, C.; Philipona, R. The clear-sky index to separate clear-sky from cloudy-sky situations in climate research. Geophys. Res. Lett. 2000, 27, 2649–2652. [Google Scholar] [CrossRef] [Green Version]
  33. Wagner, T.; Kleiss, J.M. Error characteristics of ceilometer-based observations of cloud amount. J. Atmos. Ocean. Technol. 2016, 33, 1557–1567. [Google Scholar] [CrossRef]
  34. Liu, L.; Sun, X.; Liu, X.; Gao, T.; Zhao, S. Comparison of cloud base height derived from a ground-based infrared cloud measurement and two ceilometers. Adv. Meteorol. 2015, 2015, 853861. [Google Scholar] [CrossRef]
  35. Görsdorf, U.; Mattis, I.; Pittke, G.; Bravo-Aranda, J.A.; Brettle, M.; Cermak, J.; Drouin, M.-A.; Geiβ, A.; Haefele, A.; Hervo, M.; et al. The ceilometer inter-comparison campaign CeiLinEx2015—Cloud detection and cloud base height. In Proceedings of the Technical Conference on Meteorological and Environmental Instruments and Methods of Observation (TECO), Madrid, Spain, 27–30 September 2016. [Google Scholar]
  36. Lee, S.H.; Hwang, S.O.; Kim, J.; Ahn, M.-H. Characteristics of cloud occurrence using ceilometer measurements and its relationship to precipitation over Seoul. Atmos. Res. 2018, 201, 46–57. [Google Scholar] [CrossRef]
  37. Costa-surós, M.; Calbó, J.; González, J.A.; Long, C.N. Comparing the cloud vertical structure derived from several methods based on radiosonde profiles and ground-based remote sensing measurements. Atmos. Meas. Tech. 2014, 7, 2757–2773. [Google Scholar] [CrossRef] [Green Version]
  38. Pavlovic, R.; Chen, J.; Anderson, K.; Moran, M.D.; Beaulieu, P.-A.; Davignon, D.; Cousineau, S. The FireWork air quality forecast system with near-real-time biomass burning emissions: Recent developments and evaluation of performance for the 2015 North American wildfire season. J. Air Waste Manag. Assoc. 2016, 66, 819–841. [Google Scholar] [CrossRef] [PubMed] [Green Version]
  39. Riihimaki, L.; (Pacific Northwest National Laboratory, Richland, WA, USA). Personal communication, 2017.
Figure 1. The Southern Great Plains (SGP) site located at the mid-latitude climate zone (36°36′18.0″N, 97°29′6.0″W, and 318 m above sea level) (a) and its site map including the location of the infrared thermometer (IRT), ceilometer, and micro-pulse lidar (MPL) (b). The red circles indicate the location of each instrument utilized in the current study (image source: http://www.arm.gov/sites/sgp).
Remotesensing 10 01049 g001
Figure 2. The temperature resolution as a function of the response time [17]. The solid and dashed black lines denote the radiation source temperatures of −50 °C and 20 °C, respectively. The red plus indicates the NEdT of the SGP IRT (Table 1). The red vertical lines indicate two different sampling rates: the original 0.2-s rate, and the reduced 3-s rate. The blue triangle represents the NEdT specification of IRT used for the previous study [9]: 1.1 K at −50 °C with a 1-s response time.
Remotesensing 10 01049 g002
Figure 3. The scatter diagram of the simulated clear sky Tb (TbS) and the TbIRT (potentially clear sky Tb). The best-fit lines (black, blue, red, and green for the Control, the EXP1, the EXP2, and the EXP3, respectively) represent Equation (A2), while the dashed line is the one-to-one line.
Remotesensing 10 01049 g003
Figure 4. Time series of the brightness temperatures (Tbs) (the TbIRT (black), TbS (green), TbECLR (blue)) for each experimental dataset ((a) Control and (b) EXP1) for three days in February 2015. Here, the red diamonds are the cloudy data detected by the spectral test.
Remotesensing 10 01049 g004aRemotesensing 10 01049 g004b
Figure 5. The relationship between the hourly averaged σ1min and TbIRT of the clear sky. The solid lines over the scatter plots are the best-fit lines used for the estimation of the expected temporal variation (σECLR) of clear sky (Equation (A3)).
Remotesensing 10 01049 g005
Figure 6. Time series of the (a) MPL CBH (solid line), the temporal variability, σ1min (solid line), and the expected clear sky temporal variability, σECLR (dashed line) for (b) the Control and (c) EXP2 for 5 h on 12 November 2014. Here, the diamonds indicate successful cloud detection by the temporal test: 61 data points for the Control versus 104 data points for EXP2.
Remotesensing 10 01049 g006
Figure 7. The POD values of the four experimental datasets: Control (black), EXP1 (blue), EXP2 (red), and EXP3 (green), for (a) summer and (b) winter based on MPL validation.
Remotesensing 10 01049 g007
Table 1. The specification of IRT (Heitronics KT 19.85II) used for the current study. Here, the temperature resolution represents a measure of the detector sensitivity, equivalent to the noise equivalent delta-temperature (NEdT) at the given observation conditions [17]. Here, the value given in the table is for the case with the emissivity of 1 and the response time of 0.3 s.
Spectral range9.6–11.5 μm
Dynamic range−100 °C–200 °C
Digitization12 bits
Sampling rate5 Hz (0.2 s)
Optical field of view (FOV)2.64° (f-120 mm)
Temperature resolution (NEdT)1.2 °C at −50 °C
Table 2. Summary of top-level specifications of the ceilometer and the micro-pulse lidar (MPL) at the Atmospheric Radiation Measurements (ARM) SGP site. Note that the lower limit of the MPL cloud base height (CBH) is 0.5 km, whereas it is 10 m for the ceilometer.
InstrumentCL31Sigma MPL
Wavelength910 nm532 nm
Vertical resolution10 m30 m
Averaging interval16 s30 s
Range of CBH10 m–7.7 km0.5 km–18 km
Field of view (FOV)0.83 mrad0.1 mrad
Table 3. The four experimental datasets are used to analyze the effects of the disparate specifications of IRT to the cloud detection algorithm. Each dataset has a different dynamic range (the lowest boundary) and/or sampling rate. The original TbIRT are used for the “Control”, while the other experimental datasets having different characteristics are prepared using the original data. Note that EXP3 has the same dynamic range and sampling rate as those of the previous study [9], but with slightly better temperature resolution.
DatasetControlEXP1EXP2EXP3
Dynamic range (the lowest boundary)−100 °C−50 °C−100 °C−50 °C
Sampling rate5 Hz5 Hz3 s3 s
Table 4. The coefficients for the quadratic formulas of Equation (A2) of Appendix A for the four experimental datasets. The uncertainty represents a fitting error as a standard deviation of the difference between TbIRT and estimated TbECLR. The uncertainty is used as a threshold value for the spectral test.
Datasetb0b1b2Uncertainty (°C)
Control9.121.012.13 × 10−35.0
EXP119.371.588.94 × 10−33.3
EXP29.961.042.35 × 10−34.9
EXP320.561.639.35 × 10−33.0
Table 5. The coefficients of the empirical Equation (A3) for the four experimental datasets. The uncertainty represents a best-fit error as a standard deviation of the difference between the hourly average σ1min and estimated σECLR.
Datasetc0c1c2Uncertainty (°C)
Control0.148−0.84 × 10−34.14 × 10−51.66 × 10⁻²
EXP10.144−1.77 × 10−32.16 × 10−51.26 × 10⁻²
EXP20.055−0.21 × 10−31.09 × 10−50.95 × 10⁻²
EXP30.054−0.52 × 10−33.95 × 10−61.04 × 10⁻²
Table 6. Contingency table for the IRT cloud detection (the Control case which is for the original dataset) compared with the measurement of the ceilometer and MPL. The number inside the parenthesis is number of data corresponding to the case (among a total of 491,240 data points). Here, “No” in both ceilometer and MLP means there is no significant backscattering signal obtained from the measurement, which is regarded as clear sky.
Control Experiment (N = 491,240)Algorithm
YesNo
CeilometerYesHit (198,695)miss (12,990)
Nofalse alarm (20,808)correct negative (258,747)
MPLYesHit (167,001)miss (80,049)
Nofalse alarm (52,502)correct negative (191,688)
Table 7. The probability of detection (POD) and false alarm ratio (FAR) scores of the four experimental datasets with the reference data from both ceilometer and MPL. Here, POD is estimated by hits/(hits + misses), while FAR is estimated by false alarms/(false alarms + hits).
Reference DataCeilometerMPL
DatasetControlEXP1EXP2EXP3ControlEXP1EXP2EXP3
POD93.992.096.193.267.665.474.468.6
FAR9.59.316.212.623.924.824.225.0
Table 8. The POD scores of the four experimental datasets for the different cloud base heights. The low, middle, and high clouds correspond to the layers of 0–2 km, 2–6 km, and over 6 km, respectively. Here, the range of high clouds is limited to below 10 km, considering the occurrence frequency of the higher clouds, while the altitude range of low clouds is different (0.5–2 km) in the MPL-based validation.
Reference DataCeilometer-Based ValidationMPL-Based Validation
DatasetControlEXP1EXP2EXP3ControlEXP1EXP2EXP3
Low cloud (0–2 km)99.198.299.598.498.197.498.797.7
Middle cloud (2–6 km)94.092.196.193.182.279.686.581.6
High cloud (6–10 km)71.966.482.072.336.132.052.239.5
Table 9. The POD scores for the high clouds obtained from the spectral test, the temporal test, and both tests. Note that the sum of the POD values for each experimental dataset equals the POD value of the high clouds given in Figure 7.
PeriodSummerWinter
DatasetControlEXP1EXP2EXP3ControlEXP1EXP2EXP3
Spectral5.28.34.77.88.03.74.32.5
Temporal19.423.236.832.620.412.435.916.0
Both1.22.31.93.38.33.612.54.9