Article

Application of UAV Remote Sensing for a Population Census of Large Wild Herbivores—Taking the Headwater Region of the Yellow River as an Example

1
Institute of Geographic Sciences and Natural Resources Research, Key Laboratory of Land Surface Patterns and Simulation, CAS, Beijing 100101, China
2
University of Chinese Academy of Sciences, Beijing 101407, China
3
Institute of Mountain Hazards and Environment, CAS, Chengdu 610000, China
*
Author to whom correspondence should be addressed.
Remote Sens. 2018, 10(7), 1041; https://doi.org/10.3390/rs10071041
Submission received: 25 April 2018 / Revised: 26 June 2018 / Accepted: 29 June 2018 / Published: 2 July 2018

Abstract

:
We used unmanned aerial vehicles (UAVs) to carry out a relatively complete population census of large wild herbivores in Maduo County on the Tibetan Plateau in the spring of 2017. The effective area covered by aerial surveys was 326.6 km2, and 23,784 images were acquired. Interpretation tag libraries for UAV images were created for wild animals, including Kiang (Equus kiang), Tibetan gazelle (Procapra picticaudata), and blue sheep (Pseudois nayaur), as well as livestock, including yaks and Tibetan sheep. Large wild herbivores in the survey transect were identified through manual imagery interpretation. Densities ranged from 1.15/km2 for Kiang, 0.61/km2 for Tibetan gazelle, 0.62/km2 for blue sheep, 4.12/km2 for domestic yak, and 7.34/km2 for domestic sheep. A method based on meadows in the cold and warm seasons was used for estimating the densities and numbers of large wild herbivores and livestock, and was verified against records of livestock numbers. Population estimates for Kiang, Tibetan gazelle, blue sheep, domestic yak, and domestic sheep were 17,109, 15,961, 9324, 70,846, and 102,194, respectively. Based on published consumption estimates, the results suggest that domestic stock consume 4.5 times the amount of vegetation of large wild herbivores. Compared with traditional ground survey methods, performance of UAV remote sensing surveys of large wild herbivore populations was fast, economical and reliable, providing an effective future method for surveying wild animals.

Graphical Abstract

1. Introduction

Terrestrial wild animal populations can be investigated with ground surveys, aerial surveys (visual counting by human observers), or remote sensing surveys. Ground surveys are currently the most common method. Between 1995 and 2003, the State Forestry Administration (SFA) of China organized the first national survey of terrestrial wildlife resources, measuring the number, distribution, and habitat status of species using ground survey methods (State Forestry Administration, 2009). The SFA formulated the National Survey of Terrestrial Wildlife Resources and Monitoring Technical Regulations for carrying out ground surveys. Ground transect methods have been widely used in China. For example, Liu et al. studied the population and distribution of blue sheep in the Helan Mountains in summer [1], while Wu et al. investigated the population size and habitat preference of Kiang in the eastern Altun Nature Reserve [2]. The SFA launched the second survey of terrestrial wildlife resources in 2011. All of these previous reports used the transect method as the standard method. An important advantage of the ground survey method is that investigators can observe wild animal behavior at close range and collect samples of plants and wild animal traces. Its disadvantages include low efficiency, high cost, obstacles to lines of sight, and restricted access by road and river. Moreover, because their results cannot be repeated and contrasted by other researchers, ground surveys are insufficient for meeting China’s long-term requirements for dynamic monitoring of wild animal populations.
Remote sensing surveys can be divided into aerial surveys, satellite remote sensing, and aerial remote sensing. Aerial surveys of wild animals involve visual counting by human observers from helicopters or other aircraft. Dawson et al. estimated the wild horse population in the Bogong High Plains, Alpine National Park, Victoria using an aerial survey method [3]. Melville et al. estimated the abundance of several medium-sized mammals in semiarid ecosystems using three methods, and discussed the advantages and disadvantages of each [4]. Fewster et al. counted grey kangaroo in Queensland, combining data from conventional distance sampling and aerial methods to obtain more accurate population estimates [5]. Satellite remote sensing began to be applied to wildlife research in the 1970s, but has been limited by the resolution of available satellite images. To date, the method has mainly been used to monitor, evaluate, and study factors such as habitat area, grass production, and ecological capacity [6,7,8,9,10]. Aerial remote sensing uses manned aircraft or unmanned aerial vehicles (UAVs) for aerial photography. Using these technologies, the flight height can be set according to the specific requirements and image resolution needed for counting animals. There are many successful examples of manned vehicle use for surveying wild animals, including a substantial body of related international research [11,12,13,14]. Manned aircraft to survey wild animal populations can reach areas that are difficult for ground transport to access, and transects are not constrained by natural barriers such as rivers. However, manned aircraft are typically too noisy to monitor animals without disturbance during flight, their landing procedures are complex, and the method is relatively expensive.
With the development of technologies such as the Global Positioning System (GPS), microcomputers and miniature autopilot systems, mobile communication equipment, compact digital cameras, and high-power electric batteries, UAV remote sensing is evolving rapidly. UAV also has several advantages, including low cost and safe and flexible operation, which has enabled new approaches for dynamically monitoring wildlife populations, including large wild herbivores [15,16]. Chretien et al. used visible and thermal infrared cameras mounted on UAVs to monitor white-tailed deer (Odocoileus virginianus) in Quebec, Canada [17]. They concluded that visible and thermal infrared images at 8 cm resolution could be interpreted to accurately identify white-tailed deer. Vermeulen et al. used UAV-mounted visible-light cameras to examine African elephants in southern Burkina Faso, Africa, reporting that only African elephants were easily found, while other small and medium-sized mammals were undetectable [18]. Therefore, many previous studies monitoring large wild herbivores with UAVs have employed different methods, with survey areas that are typically less than 30 km2. No methods have been developed for using UAVs to survey populations and report the number of large wild herbivores within a large range in a plateau area, such as the Tibetan Plateau.
Maduo County was traditionally used as a pastoral range at the source of the Yellow River on the Qinghai-Tibetan Plateau. However, because of the combined effects of overgrazing and climate change in the past 30 years, Maduo has experienced the most serious degradation of grassland ecosystems of any county in the Three River Source (TRS) area [1,19,20,21,22]. In 2005, the State Council approved the implementation of the Master Plan for “Ecological Protection and Development in the Three River Source Nature Reserve.” Zhaling Lake, Erling Lake, and the Star Sea in Maduo County are classified as parts of the Three River Source Nature Reserve. After construction of the ecological engineering zone I in the TRS area, ecosystem degradation has been curbed, and the number of wild animals has been increasing, especially in Maduo County [23,24]. To enhance the ecological integrity and protection in the TRS area, the TRS National Park was established in 2016 as China’s first national park, incorporating 78.1% of Maduo County’s land area [25]. Therefore, a census of the large wild herbivore population in the county is urgently needed for informing wildlife and grassland management. At the same time, a study of the population distribution could provide important information for the delineation of protected areas and reasonable grazing by herders.

2. Materials and Methods
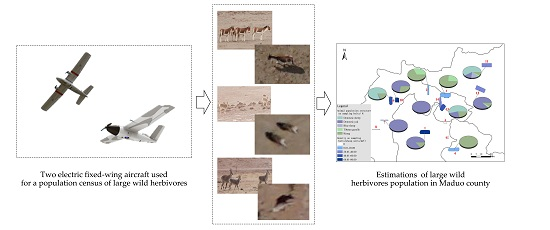
In this study, we conducted UAV remote sensing to survey the population and distribution of large wild herbivores in Maduo County, in which the Yellow River Source Park of the TRS National Park is located. The survey method is shown in Figure 1.

2.1. Study Area

Maduo County is located at the source area of the Yellow River and is the main production region in the area. The county is densely populated with rivers and lakes and 78.1% of the county’s land is within the Yellow River Source Park of Sanjiangyuan National Park. The county is rich in resources, containing more than 50 species of wild vertebrate, including Kiang (Equus kiang), Tibetan gazelle (Procapra picticaudata), and blue sheep (Pseudois nayaur). Maduo County is attached to the Guoluo Tibetan Autonomous Prefecture, located in the south of Qinghai Province, at the northern foot of Bayankala Mountain (96°50′−99°20′ east longitude, 33°50′−35°40′ north latitude). The county is 207 km from north to south and 228 km from east to west, with a total land area of 25,300 km2, an altitude range of 3902–5243 m, and an average elevation of 4200 m. The area consists mainly of high plains, with little relief, and is relatively flat and high in the southwest, and low in the northeast, containing flatlands, deserts, and marshes. The vegetation of Maduo County is mainly grassland, which accounts for approximately 88% of the area, and includes alpine grassland and alpine meadow.

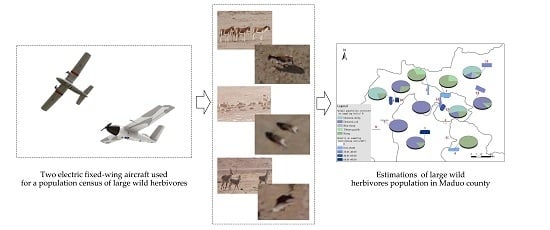
2.2. UAV Survey and Image Recognition
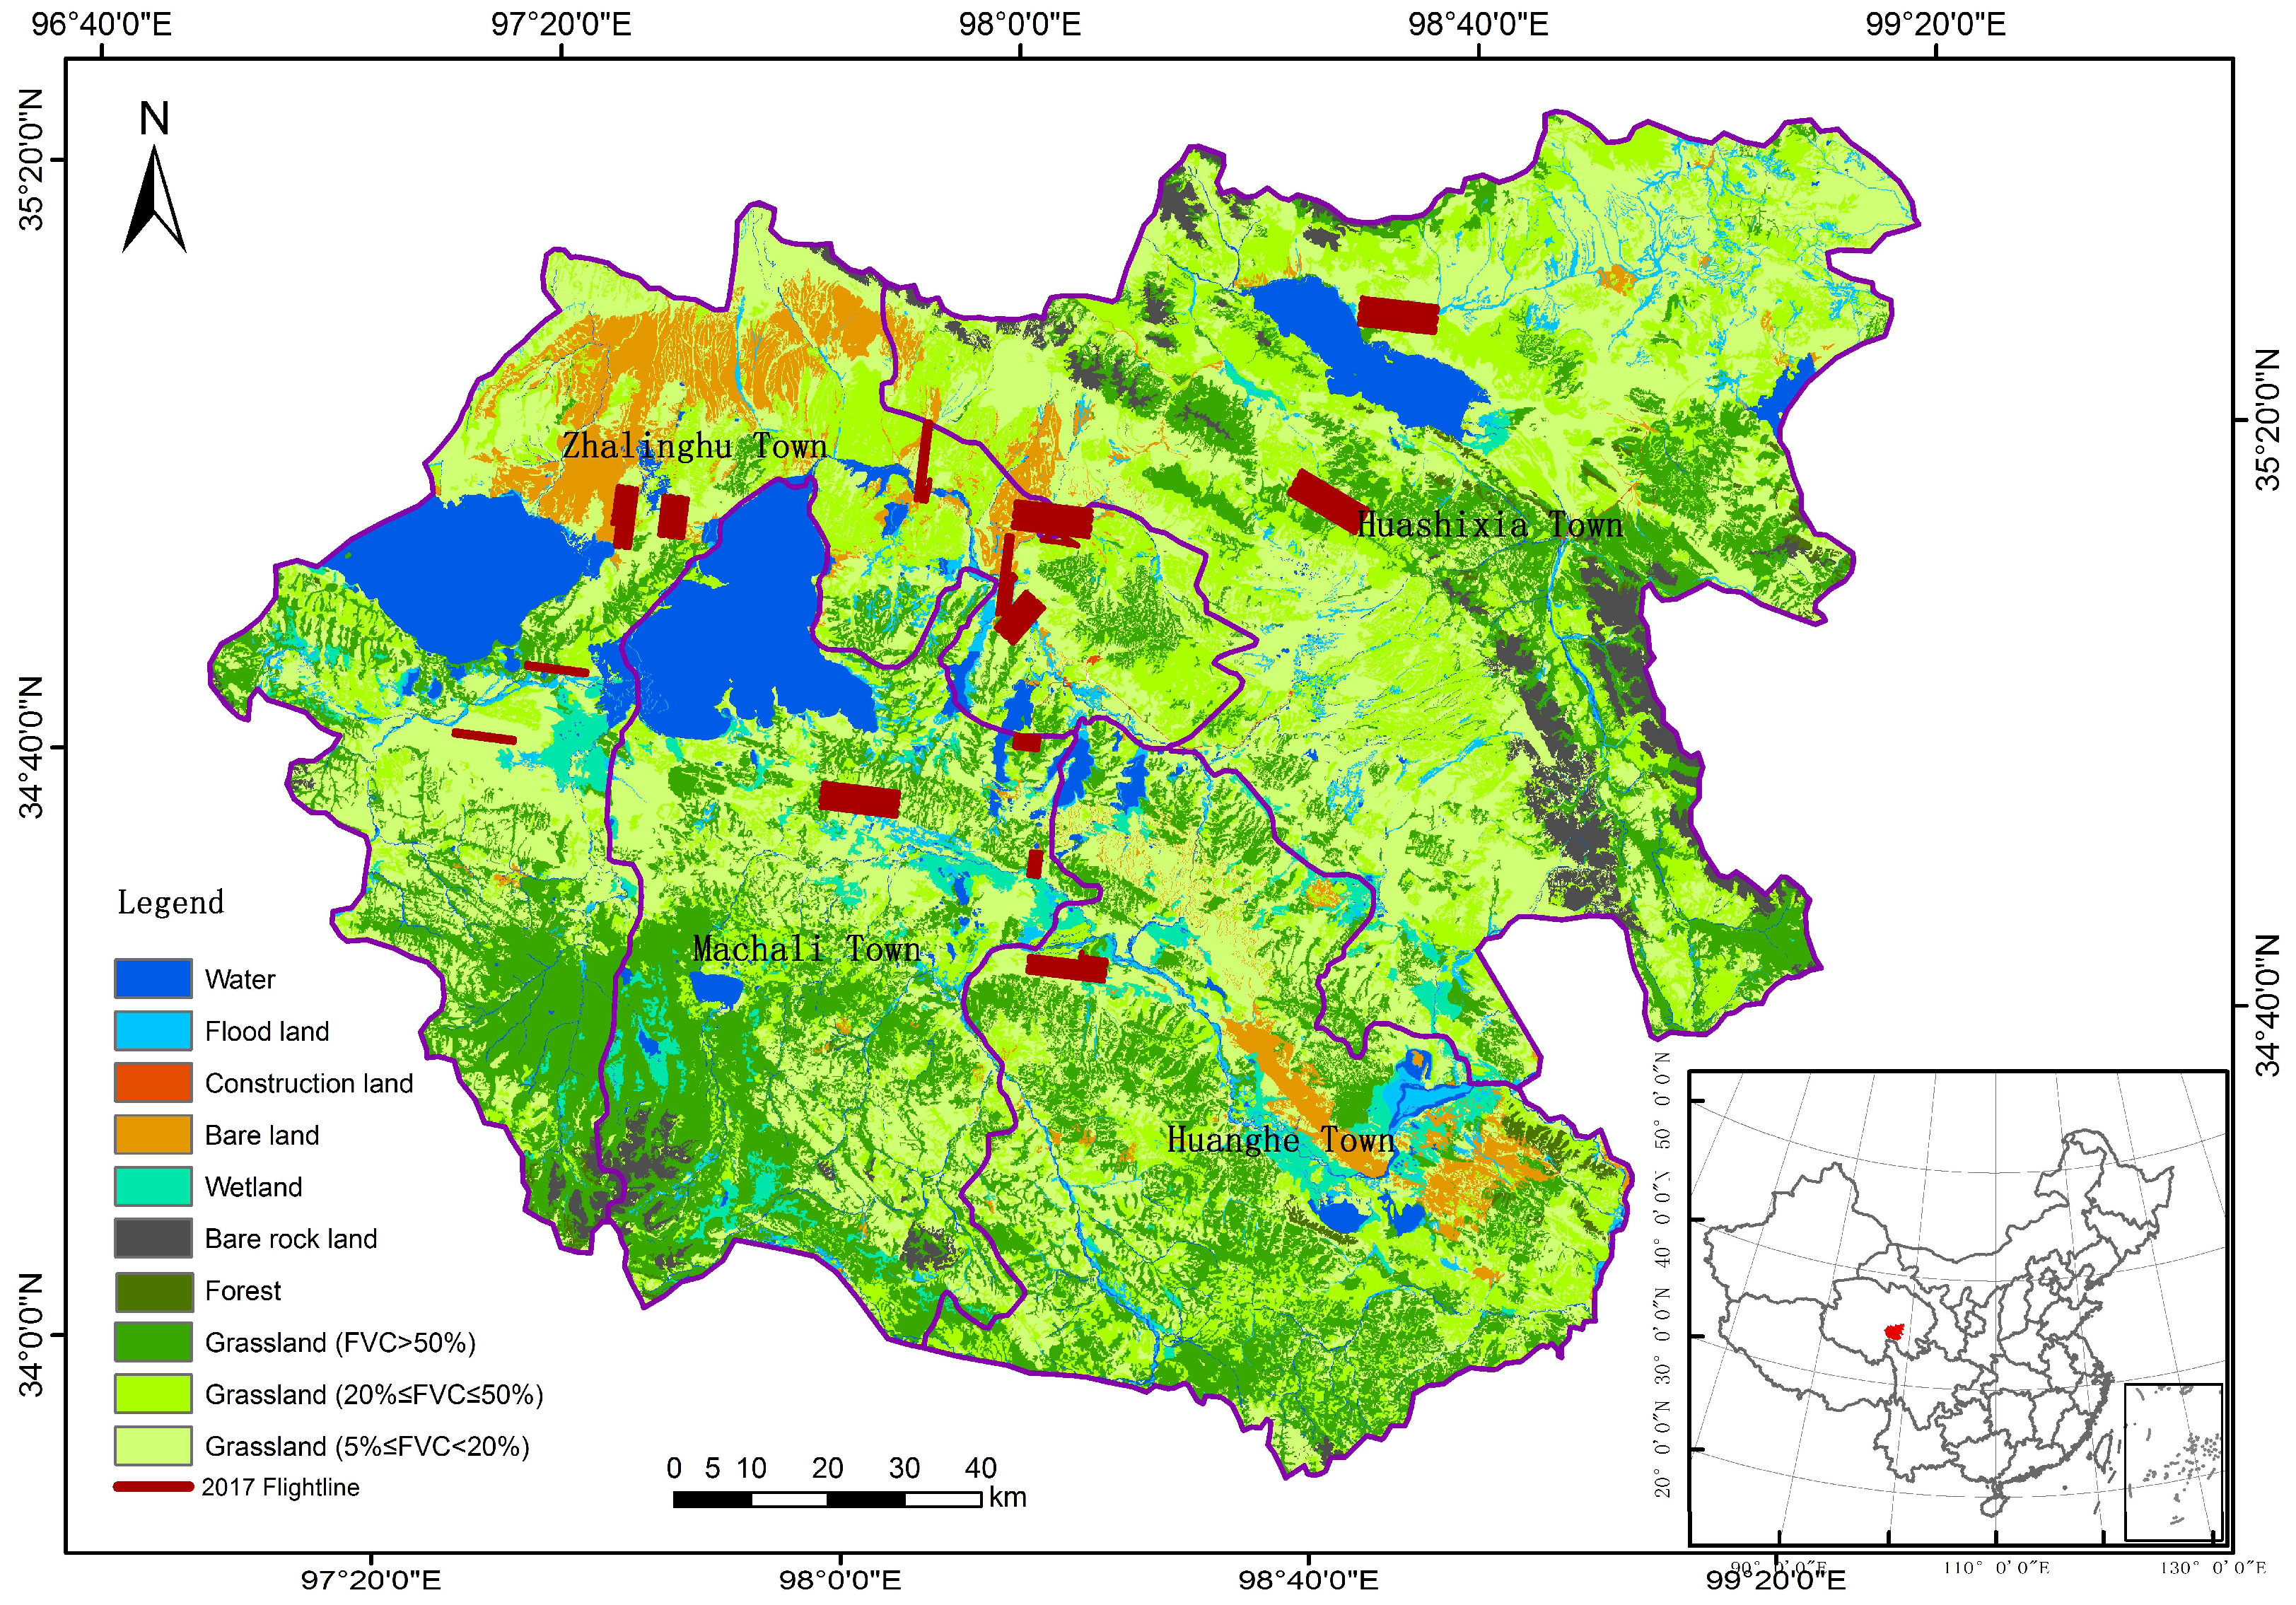
2.2.1. UAV Survey

In accordance with the National Terrestrial Wild Animals Resources Survey and Monitoring Technical Specification from the SFA, we used a sampling intensity of “not less than 2.0% for grassland areas and not less than 1.0% for meadow areas.” The proportion of different terrains, land use/cover, and vegetation types was integrated, and systematic sampling was used to develop the survey area and flight plan (Figure 2). An aerial survey was carried out on 9–18 April 2017 from 8:00 to 11:00 a.m., when the solar elevation angle was low, and the surveyed individuals cast clear shadows on the ground, which reduces interpretation difficulty and improves accuracy. We used two electric fixed-wing aircraft from the Chengdu Institute of Mountain Hazards and Environment at the Chinese Academy of Sciences (Figure 3a) and the Shenzhen FEIMA Robotics Technology Co., Ltd, Beijing, China (Figure 3b). The UAV system and image parameters are shown in Table 1. We conducted 14 samples with an effective aerial area of 326.6 km2 with an aerial image resolution of 4–7 cm, providing a total of 23,784 images. The samples covered an area of 72.85 km2 in alpine grassland with a sampling rate of 2.21%, and an area of 249.69 km2 in alpine meadow with a sampling rate of 1.42%.

2.2.2. Image Recognition and Quality Control
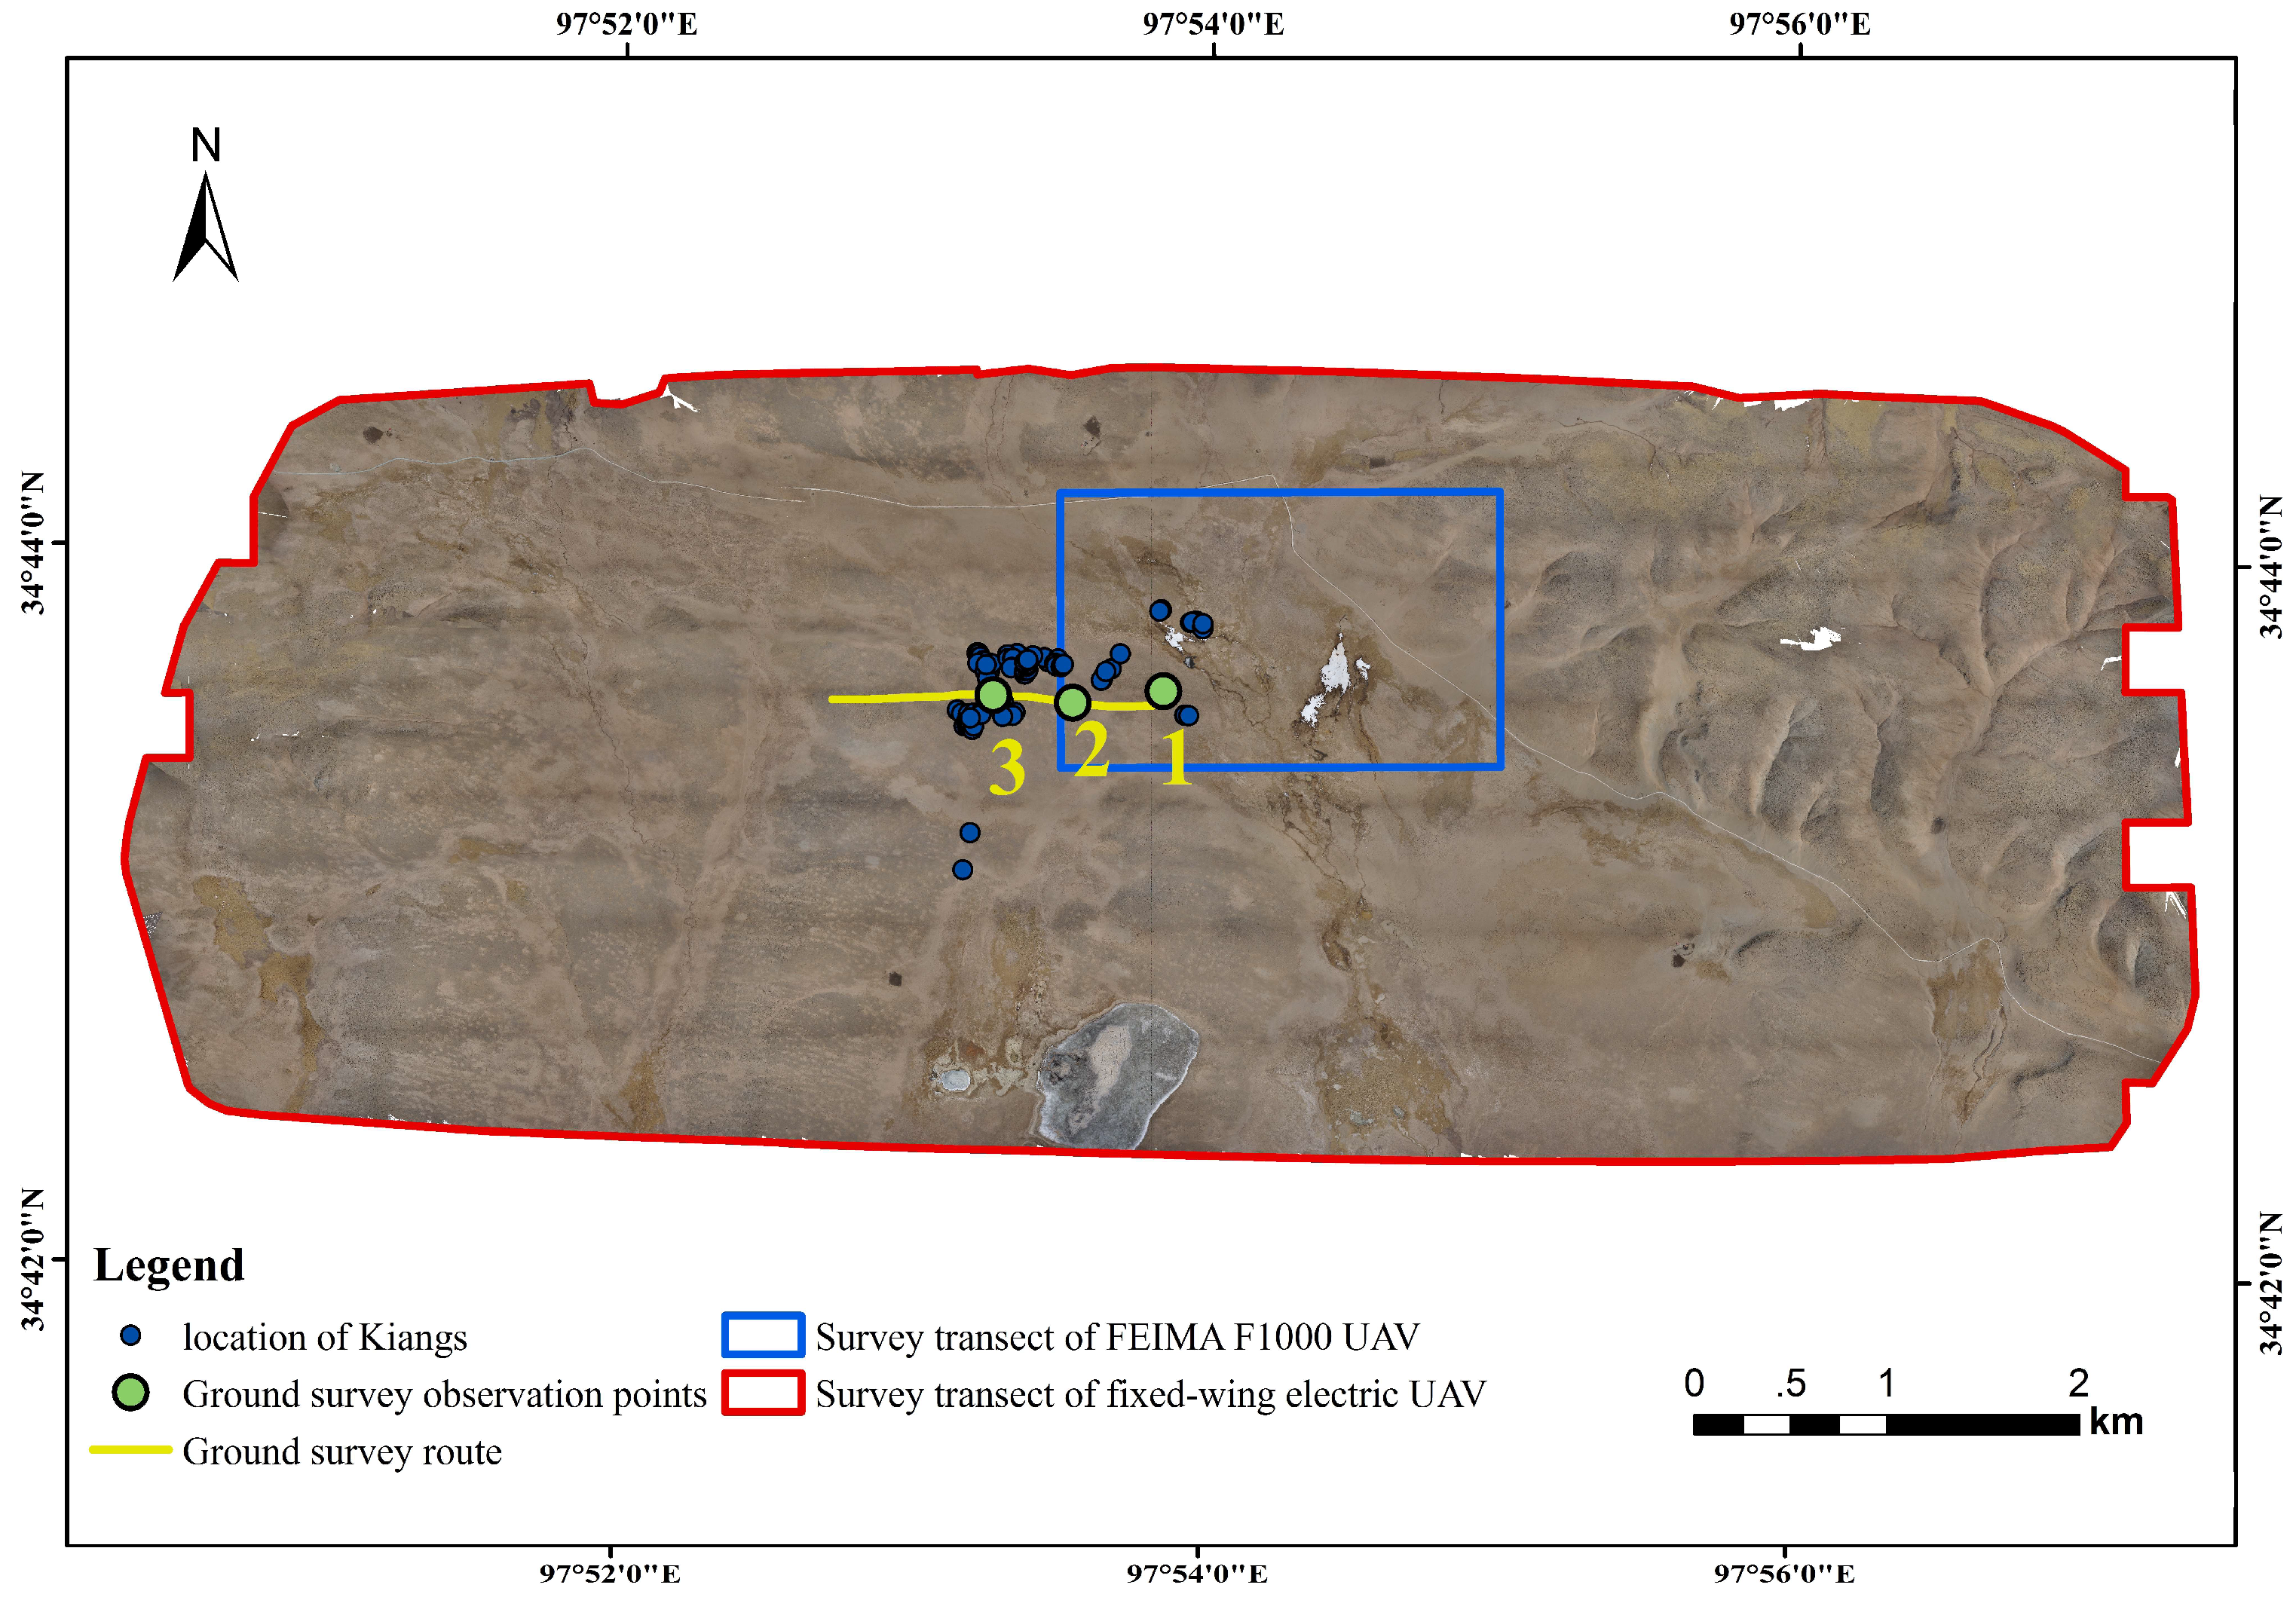
Two high-performance workstations were used for mosaicking images, and five computers were used for visual interpretation. Image mosaics were constructed using Pix4Dmapper, FeiMa, and LiMapper; visual interpretation was performed in ArcGIS.
For our visual interpretations, we established applicable tag libraries according to seven elements of remote sensing interpretation, including tone, color, texture, shadow, size, shape, and layout (Table 2).

2.3. Ground Surveys

Ground surveys were conducted on foot by four observers, matching the UAV survey transects and using a HCIYET HT-1500A rangefinder and compass. The following variables were recorded: wild animal species, number of individuals in the groups, geographical coordinates of the record points, distances between record points and wild animals, angle between the observation direction and survey route, survey time, and route length. A direct counting method was applied for the ground survey. To avoid visual errors that increase with distance, only areas within 500 m on both sides of the survey route were recorded. Individuals were defined as being part of the same cluster if the distance between them was <100 m.

2.4. Population Estimation

The transect densities of wild and domestic herbivores were calculated using the UAV image interpretation results, as well as five analysis methods, including direct extrapolation, extrapolation after deducting non-vegetated areas, and estimations based on meadows in the cold and warm seasons, on elevation zones, and on vegetation type. Domesticated herbivores were also estimated, and the results were verified using livestock number records provided by the Qinghai Provincial Grassland Station, to identify the most accurate and reasonable method.
Through direct extrapolation, populations were estimated by assuming the animal density in the transects to be the same as the density in Maduo County. The other four methods were estimated based on calculating animal populations in different areas with various properties, and then adding the numbers using the following formula:
Q = 1 n D S i × A i
where Q represents the estimation of the population of any kind of animal in Maduo County; D S i represents the density of animals in transects with properties i ; A i represents the total area with properties i , and n is the number of properties.
Data for seasonal meadows were provided by the Qinghai Provincial Department of Agriculture and Animal Husbandry, and the division of seasonal grazing lands was mostly based on the range of suitable grazing in different seasons formed by long-term grazing activities.

3. Results

3.1. Large Wild Herbivores and Livestock Populations

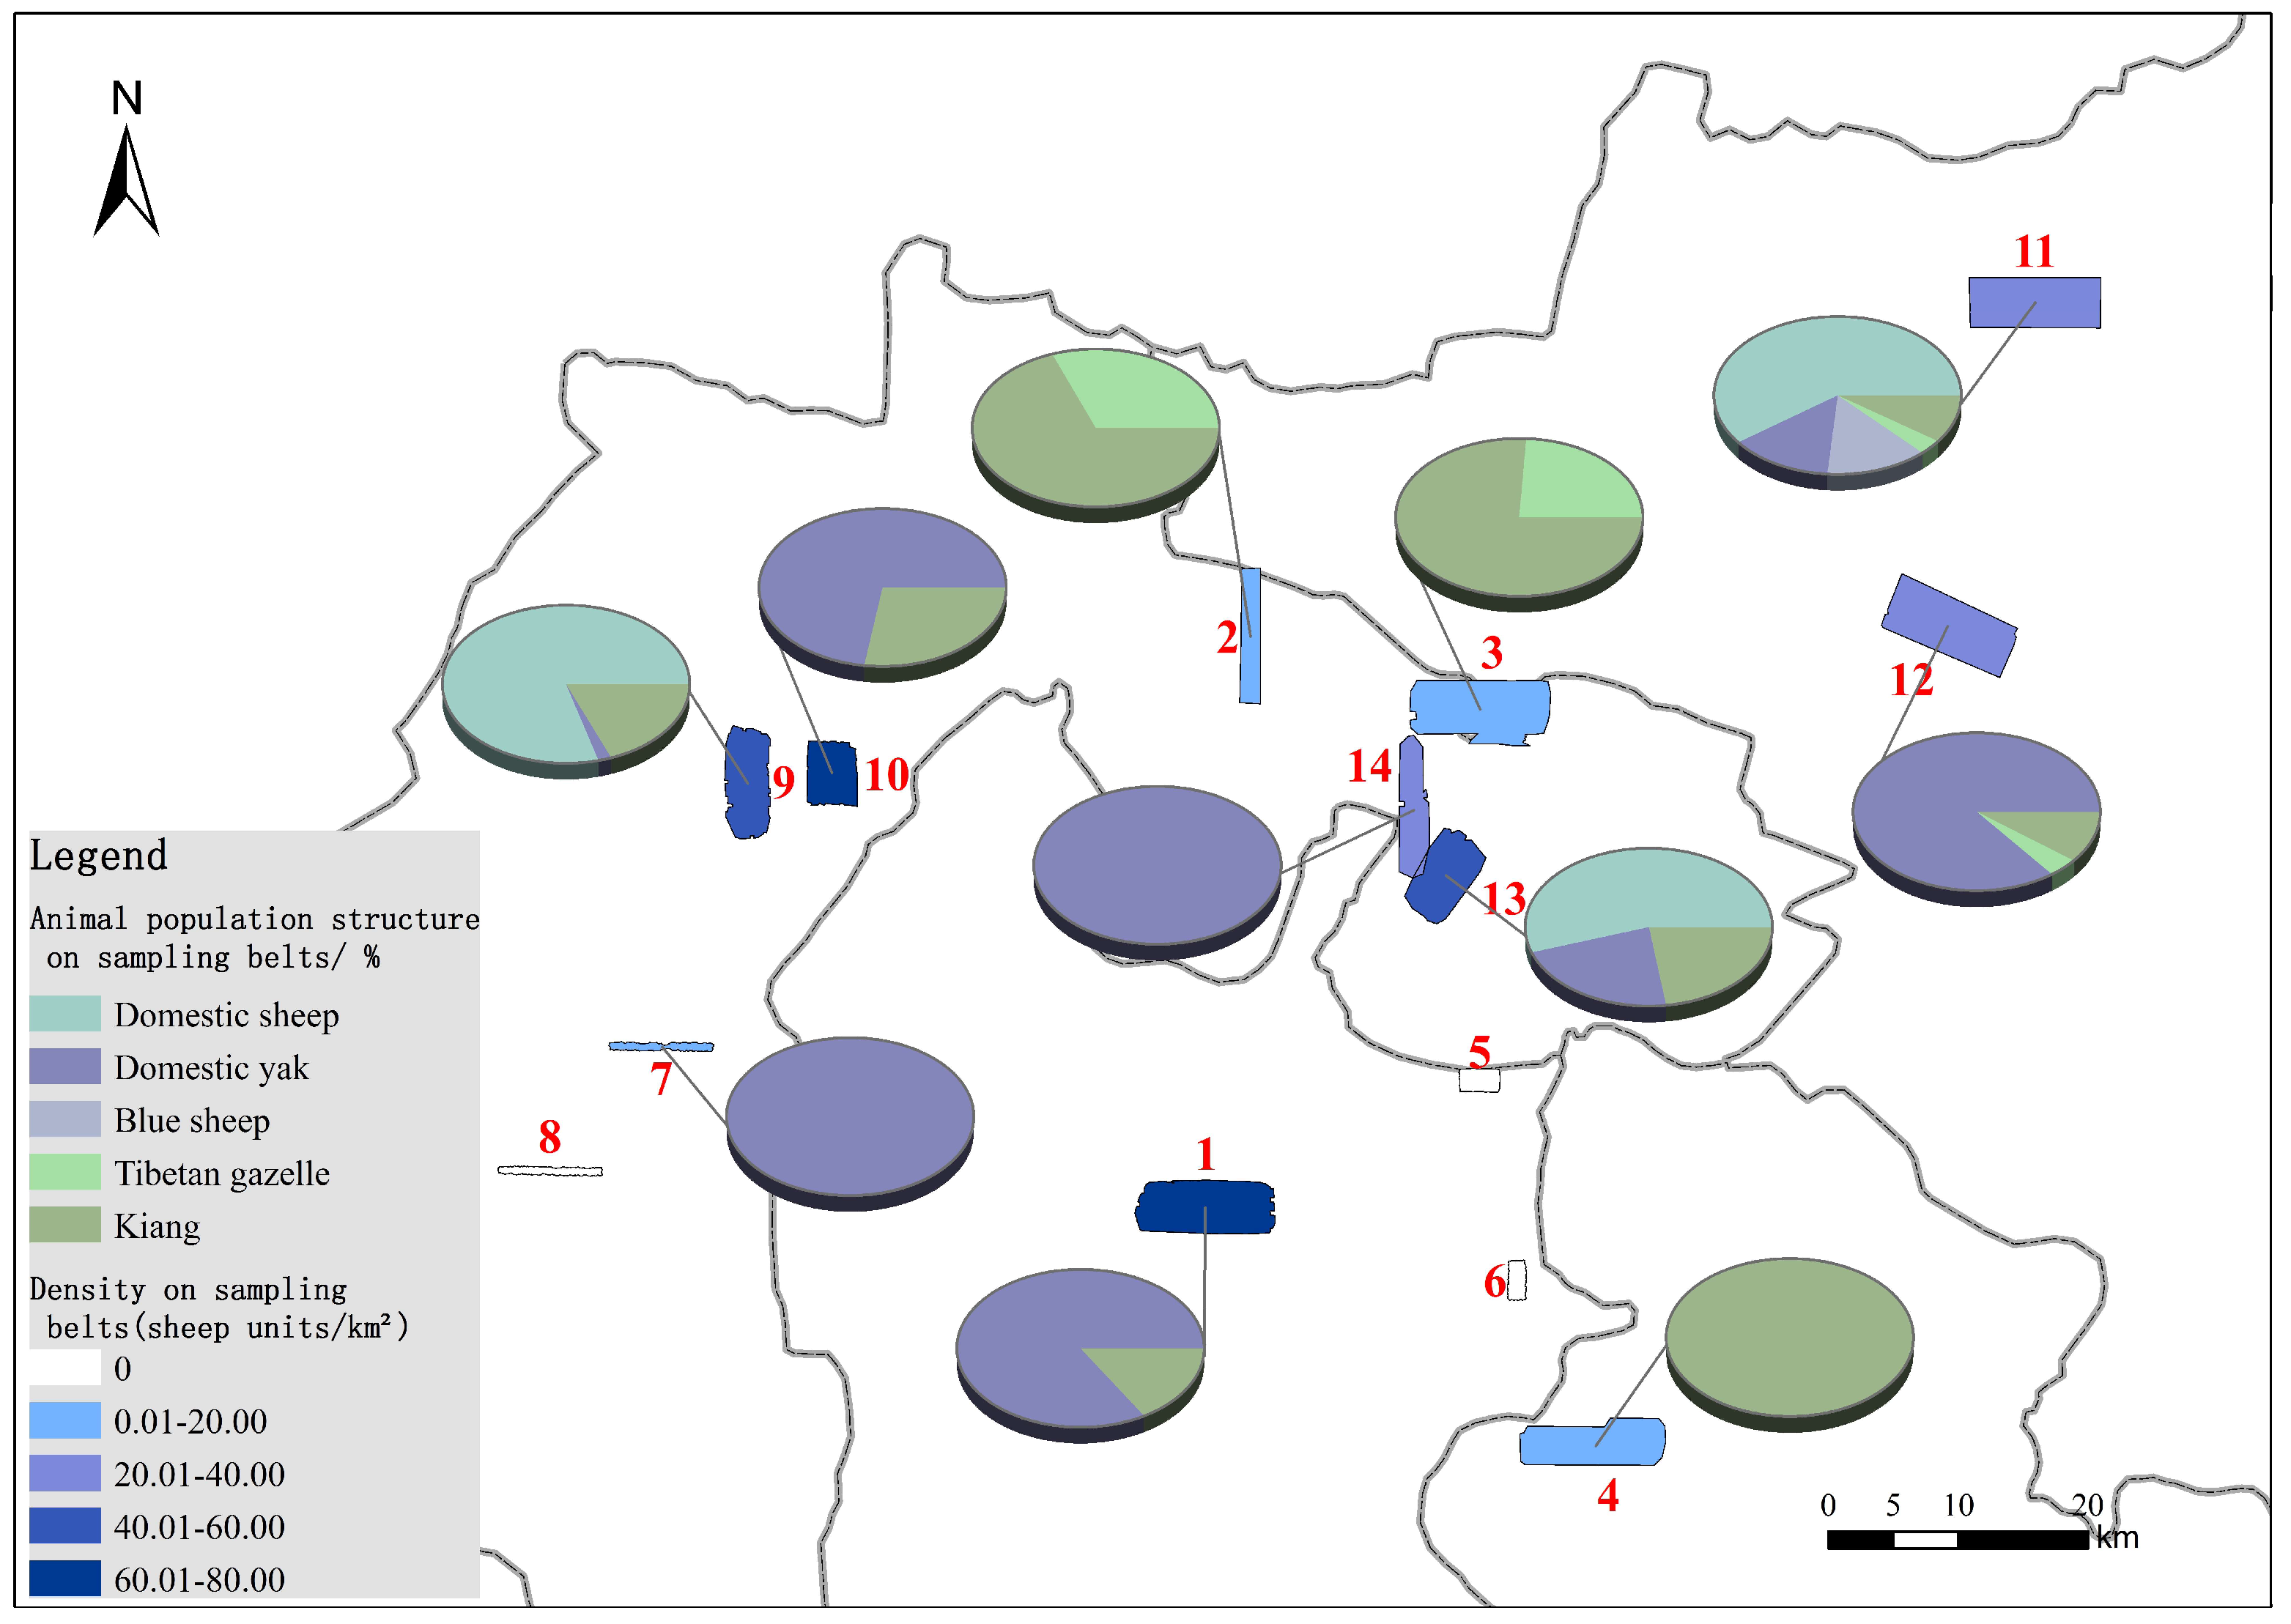
3.1.1. Population and Group Size in the UAV Survey Transects

(1) Populations
The sheep unit refers to the unit of livestock calculation, and was converted according to the animal’s food intake compared with adult domestic sheep. To objectively reflect the relationships between surveyed objects and the surrounding grassland, we converted the surveyed subjects into sheep units, as shown in Table 3.
In transects that were surveyed by UAVs in spring 2017, 4536 large herbivores were recorded. The most abundant wild species was Kiang and the most abundant domestic species was domestic sheep. Domestic yak accounted for the greatest vegetation consumption in sheep units. We estimated 1814.5 sheep units of large wild herbivores and 7809 sheep units of livestock. The ratio of large wild herbivores to livestock was approximately 1:4.30 in sheep units (Table 4).
Our survey statistics revealed that, of the 14 transects surveyed by UAV in spring 2017, the greatest number of large herbivores (1043) was found in transect 11, accounting for 30.8% of the total. We found 195 blue sheep in transect 11, accounting for 96.06% of the blue sheep in all transects. The highest number of Kiangs (107) was found in transect 1, accounting for 28.31% of the total. The highest number of Tibetan gazelles (72) was found in transect 12, accounting for 36.18% of the total. The highest number of domestic yaks was found in transect 1, accounting for 47.3% of the total, while domestic sheep were most often found in transect 9 (n = 891), accounting for 37.04% of the total (Figure 4).
(2) Accuracy verification
Based on the 2017 synchronous ground observation data from 9, 15 and 16 April, we conducted a comparative analysis of the credibility of our UAV image interpretations. On 9 April, the ground survey transect overlapped with the drone survey line and the time difference between the two surveys was 1 h. Three Kiang groups were found by ground survey, with counts of 31, 51, and 30 (total count = 112). In the UAV survey, three groups of Kiang were found, with counts of 28, 48, and 31 (total count = 107). The three Kiang groups that were found with the two survey methods in the same place deviated in quantity by 9.68%, 5.88%, and 3.33%, with an average deviation of 4.46%. On 15 and 16 April the time differences between the two surveys were <1 h. No animals were found on either the ground or drone surveys, so the results were consistent.
We compared the aerial image interpretation results of the two drone types for the same region, and we found that the interpretations of the two resolutions both identified 28 Kiang, yielding 100% agreement. (Figure 5)
Five methods, including direct extrapolation based on land area, extrapolation after deducting non-vegetated areas, and estimations based on meadows in cold and warm seasons, elevation zones, and vegetation type, were used to calculate the total number of domestic herbivores, and were compared with livestock number records provided by the Qinghai Provincial Grassland Station.
According to those records, at the end of 2015, there were 59,235 domestic yak and 73,133 domestic sheep in Maduo County. Because the records were from the end of 2015, we converted the UAV survey results from spring 2017 to the number of livestock at the end of 2016, according to a 30% birth rate. Because we assumed that the number of livestock in 2016 was the same as in 2015, the number of livestock converted from UAV data could be compared with the livestock number records at the end of 2015 (Table 5).

3.1.2. Large Wild Herbivore Populations in Maduo County

Estimations based on seasonal meadows were the most accurate, yielding deviations for domestic yak and domestic sheep of −8.00% and +7.49%, respectively. This result may have been related to the division of seasonal meadows that cover a variety of factors, such as elevation, vegetation type, and seasonal livestock and wild animal distribution patterns, making estimation by seasonal meadows more comprehensive. Thus, we used this method for this research to estimate the population of large wild herbivores in Maduo County.
According to estimates based on meadows in cold and warm seasons, in Maduo County there were 17,109 Kiangs (68,400 sheep units), with a density of 0.77/km2; 15,961 Tibetan gazelles (8000 sheep units), with a density of 0.72/km2; 9324 blue sheep (9300 sheep units), with a density of 0.42/km2; 70,846 domestic yaks (283,400 sheep units), with a density of 3.18/km2; and 102,194 domestic sheep (102,200 sheep units), with a density of 4.59/km2. There were a total of 385,600 sheep units for domestic yaks and domestic sheep, and a total of 471,300 sheep units for large wild herbivores. The ratio of sheep units of large wild herbivores to livestock was 1:4.50 (Table 6).

4. Discussion

Given the constraints of manpower and material conditions, the intensity of wildlife census by ground survey is around 1% [26], and the general known ground-survey research area in the Qinghai-Tibet area is less than 7,500 km2 [6,27]. We used UAV remote sensing for a large wild herbivore census in spring 2017, and we targeted a 2.21% sampling rate in alpine grassland and 1.42% in alpine meadow, over a 25,300-km2 study area. While our sampling intensity was significantly higher than that of traditional ground surveys, the study area increased more than three times. The Tibetan Plateau environment is complex, and some wild animal habitats are difficult to reach. Ground surveys can only drive vehicles along the road, so it is impossible to investigate species that have special habitat requirements, such as blue sheep. However, UAVs are not limited by the ground environment, and the layout of sample plots is more consistent with statistical requirements, and estimation results are more accurate and reliable. Furthermore, UAVs are small and they do not make much noise, which eases the problem of wildlife sensitivity to disturbance. It is worth noting that UAV surveys are top-down, and are difficult to carry out in areas that are severely shaded by trees; but this is rarely a problem in the Tibetan Plateau because of its exposed natural environment.
We accumulated some useful experiences and developed a complete set of technical methods that can be used in future research. We used UAV aerial images that were 4–7 cm, and Kiang, Tibetan gazelle, blue sheep, domestic yak, and domestic sheep were clearly identifiable. Therefore, we recommend not exceeding 7 cm for image resolution in future UAV surveys of large wild herbivores, with an optimal resolution of at least 5 cm. There was an 80% front overlap and a 60% side overlap in the UAV survey, but problems with low accuracy of image mosaics were still present because of fewer feature points in the study area. These findings suggest that, in future research on the Tibetan plateau or similar areas, further image-overlap enhancement will have a limited effect on improving mosaic accuracy, and methods such as control-point placement on the ground should be used.
Herein, we constructed an image interpretation tag library for UAV remote sensing of large herbivores, based on Kiang, Tibetan gazelle, blue sheep, domestic yaks, and domestic sheep. In future, the objects included in the remote sensing image interpretation tag library for UAVs could be continuously expanded to important wildlife other than large herbivores in the Tibetan Plateau, such as snow leopards (Uncia). Additionally, this library could provide technical support for wildlife monitoring in the Tibetan Plateau. Moreover, there are a growing number of studies using automated or semi-automated detection of wild animals, including a study by Norouzzadeh et al., wherein use of camera-trap images with deep learning to conduct automatic identification, counting, and description of wild animals achieves 96.6% accuracy [28]. Pabico et al. identified animal breeds and species automatically using bioacoustics and artificial neural networks [29]. Automatic identification of wild animals based on UAV remote sensing images could also be developed to reduce manual operation or replace the image recognition work of visual interactions.
Because of a lack of comparable wildlife data, we used indirect verification of livestock number records. However, the most accurate method for domestic species is not necessarily the most suitable method for wild herbivores, and may have caused extrapolation errors. The 2017 survey results we used in this study revealed densities of 0.77/km2 for Kiang and 0.72/km2 for Tibetan gazelle in Maduo County. The results of the first national terrestrial wild animals resource survey conducted by the SFA from 1995 to 2003 reported densities of 0.874/km2 for Kiang and 0.557/km2 for Tibetan gazelle in the Qinghai province [30]. There is insufficient evidence for a significant increase in the number of wild animals, indicating that wildlife in this area require ongoing protection.
Although many researchers have examined the feeding intake and preferences of wild herbivores [2,30,31,32], research on forage-livestock balance has often focused on four aspects: grassland forage yield, livestock feed intake, pasture availability, and stock capacity calculations [33,34,35,36,37,38,39,40,41,42]. Thus, these studies have not examined the effects of large wild herbivores on the forage-livestock balance. Meadows that are not categorized as over-grazed by only measuring livestock may actually be over-grazed because of the presence of large wild herbivores. Our findings suggest that, for ensuring adequate food and other living resources, the core area of the TRS National Park requires further reduction of livestock to protect wildlife.
UAV survey methods can be used to obtain annual and inter-annual data on wild animal populations in the TRS National Park over a long time period, monitor changes in wild animal populations more accurately, and quantitatively assess the effectiveness of biodiversity conservation in the TRS National Park. These findings can provide the basis for further formulation and implementation of protection measures.

5. Conclusions

In transects surveyed by UAVs in Maduo County in spring 2017, the transect density was 1.15/km2 for Kiang, 0.61/km2 for Tibetan gazelle, 0.62/km2 for blue sheep, 4.12/km2 for domestic yak, and 7.34/km2 for domestic Tibetan sheep. In the spring, we found that a small number of Kiang and Tibetan gazelle lived alone, while the majority lived in groups. Blue sheep were not found to live alone, and generally lived in groups of less than 50. Our estimations revealed that Maduo County contained 17,109 Kiangs, 15,961 Tibetan gazelles, 9324 blue sheep, 70,846 domestic yaks, and 102,194 domestic sheep. The ratio of large wild herbivores to livestock was 1:4.5 in sheep units.
We found no significant increase in the population of large wild herbivores, indicating that further protection is still needed. Our findings suggest that the core area of the TRS National Park requires a further reduction in the number of livestock to ensure that sufficient resources are available for wildlife.

Author Contributions

Q.S., Y.L., D.W., J.L. and J.F. conceived and designed the experiments; X.G., Y.L., Y.W. and D.W. performed the experiments; X.G., Y.L., Q.S., D.W. and F.Y. analyzed the data; Q.S., Y.W. and F.Y. contributed analysis tools; X.G. and Q.S. wrote the paper.

Funding

This research was funded by the National Natural Science Foundation of China (No. 41571504), the National Key Research and Development Program of China (No.2017YFC0506501) and Major Science and Technology Project of Qinghai Province (No. 2015-SF-A4-1).

Acknowledgments

For the UAV flight sample design, we received guidance from Jiang Zhigang, researcher at the Institute of Zoology, Chinese Academy of Sciences, and Li Laixing, associate researcher at the Northwest Plateau Institute of Biology. All task force members involved in UAV flight, image processing, and image interpretation were paid for their work. We would like to express our heartfelt gratitude to all of these team members.

Conflicts of Interest

The authors declare no conflicts of interest. The funding sponsors had no role in the study design, data collection, analyses, or interpretation; manuscript writing, or in publication decisions.

References

  1. Liu, J.Y.; Xu, X.L.; Shao, Q.Q. Grassland degradation in the “Three-River Headwaters” region, Qinghai Province. Acta Geogr. Sin. 2008, 64, 364–367. [Google Scholar] [CrossRef]
  2. Wu, Y.; Dong, S.-K.; Zhang, X.-F.; Liu, Y.-H.; Shi, J.-B.; Zhang, X.; Su, X.-K.; Wang, X.-X.; Li, Y.-Y.; Beijing Normal University; et al. Summer Habitat Selection of the Ungulates Equus kiang and Bos grunniens in Altun Mountain Reserve. Chin. J. Zool. 2014, 49, 317–327. [Google Scholar]
  3. Dawson, M.J.; Miller, C. Aerial mark–recapture estimates of wild horses using natural markings. Wildl. Res. 2008, 35, 365–370. [Google Scholar] [CrossRef]
  4. Melville, G.J.; Tracey, J.P.; Fleming, P.J.S.; Lukins, B.S. Aerial surveys of multiple species: critical assumptions and sources of bias in distance and mark–recapture estimators. Wildl. Res. 2008, 35, 310–348. [Google Scholar] [CrossRef]
  5. Fewster, R.M.; Pople, A.R. A comparison of mark–recapture distance-sampling methods applied to aerial surveys of eastern grey kangaroos. Wildl. Res. 2008, 35, 320–330. [Google Scholar] [CrossRef]
  6. Zhao, H.T.; Wang, C.L.; Wang, X.W.; LI, B.G.; Wang, K.F.; LI, T.C.; Li, J.F.; Gao, C.L. Distribution and population status of Macaca mulatta in Shaanxi Micangshan National Reserve. Acta Ecol. Sin. 2015, 35, 5632–5637. [Google Scholar]
  7. Liu, S.L.; Zhao, H.D.; Dong, S.K.; Su, X.K.; Liu, Q.; Deng, L.; Zhang, X.; Beijing Normal University; Administration of Altun Mountain National Nature Reserve. Dynamic of Vegetation in the Altun Mountain Nature Reserve Based on SPOT NDVI. Arid Zone Res. 2014, 31, 832–837. [Google Scholar]
  8. Su, X.K.; Dong, S.K.; Liu, S.L.; Liu, Y.H.; Shi, J.B.; Wu, Y.; Zhang, X.; Xu, D.H. Effects of land use/land cover change (LUCC) on habitats of Tibetan wild donkey in Aerjin Mountain Nature Reserve. Chin. J. Ecol. 2014, 33, 141–148. [Google Scholar]
  9. Viña, A.; Bearer, S.; Zhang, H.; Ouyang, Z.; Liu, J. Evaluating MODIS data for mapping wildlife habitat distribution. Remote Sens. Environ. 2008, 112, 2160–2169. [Google Scholar] [CrossRef]
  10. Ito, T.Y.; Miura, N.; Lhagvasuren, B.; Enkhbileg, D.; Takatsuki, S.; Tsunekawa, A.; Jiang, Z. Satellite tracking of Mongolian gazelles (Procapra gutturosa) and habitat shifts in their seasonal ranges. J. Zool. 2006, 269, 291–298. [Google Scholar] [CrossRef]
  11. Ottichilo, W.K.; Leeuw, J.D.; Prins, H.H.T. Population trends of resident wildebeest [Connochaetes taurinus hecki, (Neumann)] and factors influencing them in the Masai Mara ecosystem, Kenya. Biol. Conserv. 2001, 97, 271–282. [Google Scholar] [CrossRef]
  12. Georgiadis, N.J.; Olwero, J.N.; Romañach, S.S. Savanna herbivore dynamics in a livestock-dominated landscape: I. Dependence on land use, rainfall, density, and time. Biol. Conserv. 2007, 137, 461–472. [Google Scholar] [CrossRef]
  13. Stoner, C.; Caro, T.I.M.; Mduma, S.; Mlingwa, C.; Sabuni, G.; Borner, M. Assessment of Effectiveness of Protection Strategies in Tanzania Based on a Decade of Survey Data for Large Herbivores. Conserv. Biol. 2007, 21, 635–646. [Google Scholar] [CrossRef] [PubMed]
  14. Ogutu, J.O.; Owen-Smith, N.; Piepho, H.P.; Said, M.Y. Continuing wildlife population declines and range contraction in the Mara region of Kenya during 1977–2009. J. Zool. 2011, 285, 99–109. [Google Scholar] [CrossRef]
  15. Chabot, D.; Bird, D.M. Wildlife research and management methods in the 21st century: Where do unmanned aircraft fit in? J. Unmanned Veh. Syst. 2015, 3, 137–155. [Google Scholar] [CrossRef] [Green Version]
  16. Linchant, J.; Lisein, J.; Semeki, J.; Lejeune, P.; Vermeulen, C. Are unmanned aircraft systems (UASs) the future of wildlife monitoring? A review of accomplishments and challenges. Mammal Rev. 2015, 45, 239–252. [Google Scholar] [CrossRef]
  17. Chretien, L.; Theau, J.; Menard, P. Visible and thermal infrared remote sensing for the detection of white-tailed deer using an unmanned aerial system. Wildl. Soc. Bull. 2016, 40, 181–191. [Google Scholar] [CrossRef]
  18. Vermeulen, C.; Lejeune, P.; Lisein, J.; Sawadogo, P.; Bouché, P. Unmanned aerial survey of elephants. PLoS ONE 2013, 8, e54700. [Google Scholar] [CrossRef] [PubMed]
  19. Bing, L.F.; Shao, Q.Q.; Liu, J.Y. Characteristic of Land Cover Changes in the Yellow River Headwaters Region over the Past 30 Years. Geo-Inf. Sci. 2011, 13, 289–296. [Google Scholar] [CrossRef]
  20. Shao, Q.Q.; Xiao, T.; Liu, J.Y.; Qi, Y. Soil erosion rates and characteristics of typical alpine meadow using 137Cs technique in Qinghai-Tibet Plateau. Chin. Sci. Bull. 2011, 56, 1708–1713. [Google Scholar] [CrossRef] [Green Version]
  21. Huang, L.; Shao, Q.Q.; Liu, J.Y. Spatial-temporal Analysis of Soil Erosion in Grassland over the Past Three Decades in Sanjiangyuan Region, Qinghai Province, China. Geo-Inf. Sci. 2011, 13, 12–21. [Google Scholar] [CrossRef]
  22. Zhang, S.; Shao, Q.Q.; Liu, J.Y.; Xu, X.L. Grassland Cover Change near the Source of the Yellow River: Case Study of Madoi County, Qinghai Province. Resour. Sci. 2008, 30, 1547–1554. [Google Scholar]
  23. Shao, Q.Q.; Cao, W.; Fan, J.W.; Huang, L.; Xu, X.L. Effects of an ecological conservation and restoration project in the Three-River Source Region, China. J. Geogr. Sci. 2017, 27, 183–204. [Google Scholar] [CrossRef]
  24. Quanqin, S.; Jiangwen, F.; Jiyuan, L.; Lin, H.; Wei, C.; Lulu, L. Target-based Assessment on Effects of First-stage Ecological Conservation and Restoration Project in Three-river Source Region, China and Policy Recommendations. Bull. Chin. Acad. Sci. 2017, 32, 35–44. [Google Scholar]
  25. Fu, M.D.; Tian, J.L.; Zhu, Y.P.; Tian, Y.; Zhao, Z.; Li, J. Functional zoning and target management of Sanjiangyuan National Park. Biodivers. Sci. 2017, 25, 71–79. [Google Scholar] [CrossRef]
  26. Tian, Y.; Feng, Y.J.; Zhang, C.L.; Yu, B.C.; Tang, X.P.; Hu, H.J. Effectiveness of line transects during wild animal surveys in mountain forests of South China. Biodivers. Sci. 2015, 23, 109–115. [Google Scholar] [CrossRef] [Green Version]
  27. Harris, B.R.; Miller, J.D.; Cai, G.; Pletscher, H.D. Mannalian Status and Conservation in Yeniugou, Qinghai, China. Acta Therigl. Sin. 1996, 16, 113–118. [Google Scholar]
  28. Norouzzadeh, M.S.; Nguyen, A.; Kosmala, M.; Swanson, A.; Palmer, M.S.; Packer, C.; Clune, J. Automatically identifying, counting, and describing wild animals in camera-trap images with deep learning. Proc. Natl. Acad. Sci. USA 2018, 115, E5716–E5725. [Google Scholar] [CrossRef] [PubMed]
  29. Pabico, J.P.; Gonzales, A.M.V.; Villanueva, M.J.S.; Mendoza, A.A. Automatic Identification of Animal Breeds and Species Using Bioacoustics and Artificial Neural Networks. Comput. Sci. 2015. Available online: https://arxiv.org/abs/1507.05546 (accessed on 26 June 2018).
  30. State Forestry Administration. Investigation on Key Terrestrial Wildlife Resources in China; China Forestry Publishing House: Beijing, China, 2009.
  31. Liu, Z.S.; Wang, X.M.; Li, Z.G.; Cui, D.Y. Summer feeding and bedding habitat selection by blue sheep (Pseudois nayaur) in Helan Mountains. Acta Ecol. Sin. 2008, 28, 4277–4285. [Google Scholar]
  32. Munn, A.J.; Kalkman, L.; Skeers, P.; Roberts, J.A.; Bailey, J.; Dawson, T.J. Field metabolic rate, movement distance, and grazing pressures by western grey kangaroos (Macropus fuliginosus melanops) and Merino sheep (Ovis aries ) in semi-arid Australia. Mamm. Biol. 2016, 81, 423–430. [Google Scholar] [CrossRef]
  33. Mai, X.H.; Zhang, Y.J.; Zhang, Y.J.; Shi, S.L.; Huang, D.; Zhang, Y. Research Progress of Grassland Feed-animal Balance at Home and Abroad. Chin. Agric. Bull. 2013, 29, 1–6. [Google Scholar]
  34. Fan, J.W.; Shao, Q.Q.; Wang, J.B.; Chen, Z.Q. An Analysis of Temporal-spatial Dynamics of Grazing Pressure on Grassland in Three Rivers Headwater Region. Chin. J. Grassl. 2011, 33, 64–72. [Google Scholar]
  35. Xu, B.; Yang, X.C.; Jin, Y.X.; Wang, D.L.; Yang, Z.; Li, J.Y.; Liu, H.Q.; Yu, H.D.; Ma, H.L. Monitoring and evaluation of grassland-livestock balance in pastoral and semi-pastoral counties of China. Geogr. Res. 2012, 31, 1998–2006. [Google Scholar]
  36. Li, Q.F. Series of studies on balance control between animal demanding and feed availability (3)—Improvement of the current estimation methods for animal-feed balance. Pratacult. Sci. 2011, 28, 2190–2194. [Google Scholar]
  37. Liang, T.G.; Feng, Q.S.; Xia, W.T.; Cui, X. Optimization strategy and management decision-masking in balancing forage and livestock in Gannan pastoral area. Acta Ecol. Sin. 2011, 31, 1111–1123. [Google Scholar]
  38. Li, W.J.; Jiu, C.L.; Tan, Z.H.; Ma, X.L. Natural Grassland Productivity and the Livestock-Feeds Balance in Qinghai Province. Resour. Sci. 2012, 34, 367–372. [Google Scholar]
  39. Cai, H.; Yang, X.; Xu, X. Human-induced grassland degradation/restoration in the central Tibetan Plateau: The effects of ecological protection and restoration projects. Ecol. Eng. 2015, 83, 112–119. [Google Scholar] [CrossRef] [Green Version]
  40. Laca, E.A. New Approaches and Tools for Grazing Management. Rangel. Ecol. Manag. 2009, 62, 407–417. [Google Scholar] [CrossRef]
  41. Qi, J.; Xin, X.; John, R.; Groisman, P.; Chen, J. Understanding livestock production and sustainability of grassland ecosystems in the Asian Dryland Belt. Ecol. Process. 2017, 6, 22. [Google Scholar] [CrossRef]
  42. Fan, J.W.; Shao, Q.Q.; Liu, J.Y.; Wang, J.B.; Harris, W.; Chen, Z.Q.; Zhong, H.P.; Xu, X.L.; Liu, R.G. Assessment of effects of climate change and grazing activity on grassland yield in the Three Rivers Headwaters Region of Qinghai-Tibet Plateau, China. Environ. Monit. Assess. 2010, 170, 571. [Google Scholar] [CrossRef] [PubMed]
Figure 1. Technical flowchart.
Remotesensing 10 01041 g001
Figure 2. Maduo County and the UAV flight path over the county.
Remotesensing 10 01041 g002
Figure 3. Electric aircraft from the Chengdu Institute of Mountain Hazards and Environment, Chinese Academy of Sciences (a), and Shenzhen FEIMA Robotics Technology Co., Ltd. (b); aircrafts taking off at the start of the aerial survey (c) and (d).
Remotesensing 10 01041 g003
Figure 4. Population, density, and composition of large herbivores in transects surveyed by UAVs in spring 2017. The pie chart indicates the proportion of each animal in the transect and the color of the transect indicates the density of sheep units in the transect.
Remotesensing 10 01041 g004
Figure 5. Ground survey transect and aerial survey transect on 9 April 2017.
Remotesensing 10 01041 g005
Table 1. UAVs system and image parameters.
ParameterFixed-Wing Electric UAVFEIMA F1000 UAV
Span1.6 m1.6 m
Payload0.5 kg1.0 kg
Maximum Takeoff Weight3 kg3 kg
Engineelectricalelectrical
Battery Life90 min60 min
Speed72 km/h60 km/h
Camera ModelILCE-5100ILCE-5100
Number of Integrated Cameras2 (Angle of 130°, overlap of 50%)1
Focal length30 mm30 mm
Pixel6000 × 40006000 × 4000
Relative Altitude of Flight250 m
Number of survey samples14
Image Amounts23,784
Total Aerial Area350 km2
Effective Aerial Area326.6 km2
Setting Resolution5 cm
Actual Resolution4–7 cm
Front overlap80%
Side overlap60%
Table 2. Image recognition signs for large wild herbivores.
KiangTibetan GazelleBlue SheepDomestic YakDomestic Sheep
ToneSmoke brown, ochre brownEarthy yellow, yellowish brown, grayish yellowSteel gray, grayBlack, dark grayWhite, off-white
ColorThe main body is smoke brown, ochre brown, with edges in white and brown black.The main body is earthy yellow, yellowish brown and grayish yellow, with tail end in white.Body can be steel gray, gray and dirty white.The main body is black, gray black and white.The main body is black, dirty white and white.
TextureThe brown longitudinal strips in the center of back, and splicing texture of white patches at edges of the limbs and body side.It is earthy yellow or solid color of similar color, with white patches on hips.Gradients from steel gray to gray white.Solid color or solid block splicing texture.Solid color or solid block splicing texture.
ShadowIt has shadows with clear border (except for photos at cloudy day or noon), the shadows of head and face, neck longer than other animals.Shadows with clear border (except for photos at cloudy day or noon).Shadows with clear border (except for photos at cloudy day or noon).Shadows with clear border (except for photos at cloudy day or noon).Shadows with clear border (except for photos at cloudy day or noon).
SizeAn adult Kiang has body length between 1.6 m–2.3 m. With aerial photos of resolution 4 cm, the individual lengths are 40–60 pixels. Immature Kiang is smaller but not alone.An adult Tibetan gazelle has body length between 0.8 m–1.0 m. By taking 4 cm resolution as an example, the individual lengths mostly range from 20–30 pixels.Adult blue sheep have a body length between 1.2 m and 1.4 m. With aerial photos of resolution 4 cm, the individual lengths are 25–35 pixels.Adult domestic yak has a body length between 1.6 m and 2.2 m. With aerial photos of resolution 4 cm, the individual lengths are 40–50 pixels. Juvenile yaks can be as small as 0.8 m, but will not be alone.Adult domestic sheep has a body length between 1.2 m and 1.5 m. With aerial photos of resolution 4 cm, the individual lengths are 25–35 pixels. Juvenile sheep can be as small as 0.4 m, but will not be alone.
ShapeThe overall shape is approximate to the long strip and bulk or long handle and long circle. Length-width ratio is 4:1–5:1.The overall shape is approximate to the long oval or rod-like. Length-width ratio is 3:1–5:1.The overall shape is nearly oval. Length-width ratio is 3:1–4:1.The overall shape is approximate to the long oval or rectangle. Length-width ratio is 1.5:1–3:1.The overall shape is approximate to the long oval or water drop-shaped. Length-width ratio is 1.5:1–3:1.
LayoutMostly distribute in groups, a small number of individuals live alone.Live in Group or alone.Mostly live in groups.Mostly distribute in groups, often with objects and traces of human activities in the neighborhood.Mostly distribute in groups, often with objects and traces of human activities in the neighborhood.
Group Remotesensing 10 01041 i001 Remotesensing 10 01041 i002 Remotesensing 10 01041 i003 Remotesensing 10 01041 i004 Remotesensing 10 01041 i005
Individual recognition example Remotesensing 10 01041 i006 Remotesensing 10 01041 i007 Remotesensing 10 01041 i008 Remotesensing 10 01041 i009 Remotesensing 10 01041 i010
Sectional view Remotesensing 10 01041 i011 Remotesensing 10 01041 i012 Remotesensing 10 01041 i013 Remotesensing 10 01041 i014 Remotesensing 10 01041 i015
Table 3. Standard sheep unit conversion table for herbivores.
Animal SpeciesSheep Units
Kiang4
Tibetan gazelle0.5
Blue sheep1
Domestic yak4
Domestic sheep1
Table 4. Herbivore population in the transects.
Animal SpeciesPopulation in TransectsDensity in Transects/km2Sheep Units
Kiang3781.151512
Tibetan gazelle1990.6199.5
Blue sheep2030.62203
Domestic yak13514.125404
Domestic sheep24057.342405
Total45369623.5
Table 5. Comparison of livestock estimates using different methods in Maduo County.
MethodsDirect ExtrapolationExtrapolation after Deducting Non-Vegetated AreasEstimations Based on Seasonal MeadowsEstimations Based on Elevation ZonesEstimations Based on Vegetation Type
Estimations by the UAV survey in spring, 2017 Domestic yak104,23693,55770,84676,84175,116
Domestic sheep185,702166,398102,194390,257108,919
Conversion of livestock population at the end of 2016Domestic yak80,18271,96754,49759,10857,782
Domestic sheep142,848 127,998 78,611 300,198 83,784
Deviations of conversion with livestock number records at the end of 2015Domestic yak+35.36%+21.49%−8.00%−0.21%−2.45%
Domesticsheep+95.33%+75.02%+7.49%+310.48%+14.56%
Table 6. Estimation of large wild herbivores in spring 2017 in Maduo County.
Animal SpeciesMeadow TypeDensity in Transects/km2Estimations of Population in Maduo County104 Sheep Units
KiangMeadows in cold seasons1.71155526.22
Meadows in warm seasons0.1215570.62
total0.77171096.84
Tibetan gazelleMeadows in cold seasons0.5348020.24
Meadows in warm seasons0.85111590.56
total0.72159610.80
Blue sheepMeadows in cold seasons0.9182860.83
Meadows in warm seasons0.0810380.10
total0.4293240.93

