Article

Automatic Measurement of Water Height in the As Conchas (Spain) Reservoir Using Sentinel 2 and Aerial LiDAR Data

by
Higinio González-Jorge
1,2,*,
Luis Miguel González-deSantos
1,2,
Joaquin Martínez-Sánchez
1,2,
Ana Sánchez-Rodríguez
1 and
Henrique Lorenzo
1
1
Department of Natural Resources and Environmental Engineering, University of Vigo, As Lagoas s/n, 36310 Vigo, Spain
2
Galician Aerospace Centre (CINAE), Porto do Molle, 36350 Nigrán, Spain
*
Author to whom correspondence should be addressed.
Remote Sens. 2018, 10(6), 902; https://doi.org/10.3390/rs10060902
Submission received: 4 May 2018 / Revised: 1 June 2018 / Accepted: 5 June 2018 / Published: 8 June 2018
(This article belongs to the Section Remote Sensing in Geology, Geomorphology and Hydrology)

Abstract

:
A methodology for the measurement of height in water reservoirs is developed. It is based on Sentinel 2 imagery and aerial LiDAR data. The methodology is automatized using Matlab software and focused on image processing techniques (equalization, binarization, and edge detection) combined with LiDAR data processing (near neighbour search and height averaging). It is applied in a region of interest selected by the user characterized by a water–land interface. Results are validated in the As Conchas water reservoir (Spain) using an in situ sensing system provided by the Hydrographic Miño-Sil Confederation. The duration of the experiment was one year. The Sentinel 2 bands B2, B3, B4, and B8 were tested during this study. The best results for water height evaluation were obtained for band B8 (842 nm) with an error of 0.20 m and a standard deviation of 0.17 m. The time resolution of the technique depends on the Sentinel 2 revisit time. The time resolution and height accuracy could be improved using complementary satellite systems.

Graphical Abstract

1. Introduction

Due to climate change, drought episodes are becoming more frequent in regions that traditionally did not face this problem. For example, Galicia, a typically rainy Spanish region, experienced drought phenomena during the summer and autumn of 2017. These facts, together with other environmental issues, such as water pollution, are of concern to the authorities and aroused interest in using techniques to monitor water bodies. One example in Galicia is the Hydrographic Miño-Sil Confederation [1], which is responsible for the management of one of the main hydrological basins of the region. Their data acquisition is based on in situ sensors that provide parameters as water level, flow, or chemical components. In this sense, the initiative described by Tauro et al. [2] must be noted, as it describes the works of the measurements and observation activities carried out by the XXI Century Working Group of the Association of Hydrological Sciences. This group combines hydrologists with experts in other fields such as robotics and electronics.
George [3] and Dekker et al. [4] report on the limitations of conventional single point sampling methods to address heterogeneity and temporal changes in water quality. In these cases, remote sensing techniques based on different platforms (i.e., manned airborne systems, unmanned airborne systems (UAS) or satellites) appear as useful tools that provide the measurement of a number of water parameters [5].
Bandini et al. [6] used UAS for the measurement of water levels in rivers and lakes using the Global Navigation Satellite System (GNSS) receiver and payloads for range measurement (RADAR, SONAR, and laser distance meter). Manfreda et al. [7] conducted a review of the existing research studies and applications of UAS and concluded that they could be a bridge for the existing gap between the existing in situ field observations and the manned airborne or satellite observations.
There are many important water masses that cannot be monitored in situ or for which the use of unmanned aerial vehicles is not recommended due to weather conditions or high operational cost. In addition, coastal and inland waters require representative spatial and temporal information that cannot be always provided by in situ sensing or UAS. The satellite market presents a good opportunity in this sense. For example, ESA [8] (Sentinel satellites) and NASA [9] (Landsat satellites) provide freely accessible and periodic information services to its users. Other non-free services are based on high-resolution imagery (i.e., GeoEye, Worldview, Spot, and Deimos). Applications of remote sensing to water monitoring cover several related aspects with, for example, chlorophyll concentration [10], oil spill detection [11], flood monitoring [12], the evaluation of the pathways of marine debris [13], and water level studies. The effort of the current work focus is on the latter and some highlighted works are next described.
Tarpanello et al. [14] coupled MODIS and radar altimetry from ENVISAT data for discharge estimation in poorly gauged river basins. The discharge estimation accuracy is validated using in situ measurements along the Po river (Northern Italy).
Birkett et al. [15] applied the radar satellite altimeter from NASA operating on-board the Topex-Poseidon satellite to the monitoring of large rivers and wetlands level. The methodology showed a water level monitoring geometric accuracy of 11 cm.
Other examples of radar altimetry measurements are provided by the ENVISAT satellite. Frappart et al. [16] compared the performance of different algorithms applied to ENVISAT data to deliver reliable water levels for land hydrology using in situ sensing stations.
Crétaux et al. [17] developed a database to monitor, in near real time, water level and storage variations using remote sensing data from altimetry missions (Topex-Poseidon, GFO, ERS-2, Jason and Envisat). It includes information for 150 lakes and reservoirs.
Hall et al. [18] used ICESat laser altimetry observations to geodetically level gauge stations within the Amazon Basin. The method allows for calculation of slope and the discharge of rivers.
Zang et al. [19,20] and Creataux et al. [21] also used ICESat laser altimetry to examine the water level of lakes, mass changes, and groundwater storage variations in the Tibetan Plateau to illustrate critical aspects and issues linked to the observation of climate change impact on surface waters.
As can be observed in the above research, water level monitoring is mainly based on satellite altimetry missions. Currently, the Sentinel 3 [22] from ESA also includes an active topography package system that allows for the measurement of the height of sea and inland waters. Its measurements present a resolution of 300 m. Thus, other remote sensing methodologies are necessary for small- and medium-size inland water reservoirs. In the present work, the authors present a methodology for water level measurement in areas where a higher resolution than that provided by Sentinel 3 satellites is required. It is based on Sentinel 2 data combined with digital elevation models obtained from aerial LiDAR. The manuscript is structured in three main sections. Section 2 includes the materials and methods. It describes the area of study (As Conchas water reservoir in Spain), the data sources (aerial LiDAR and satellite imagery), and the data processing algorithm. Section 3 presents the results and discussion, where the accuracy of the procedure is verified with in situ water level data. Section 4 shows the conclusions of the manuscript.

2. Materials and Methods
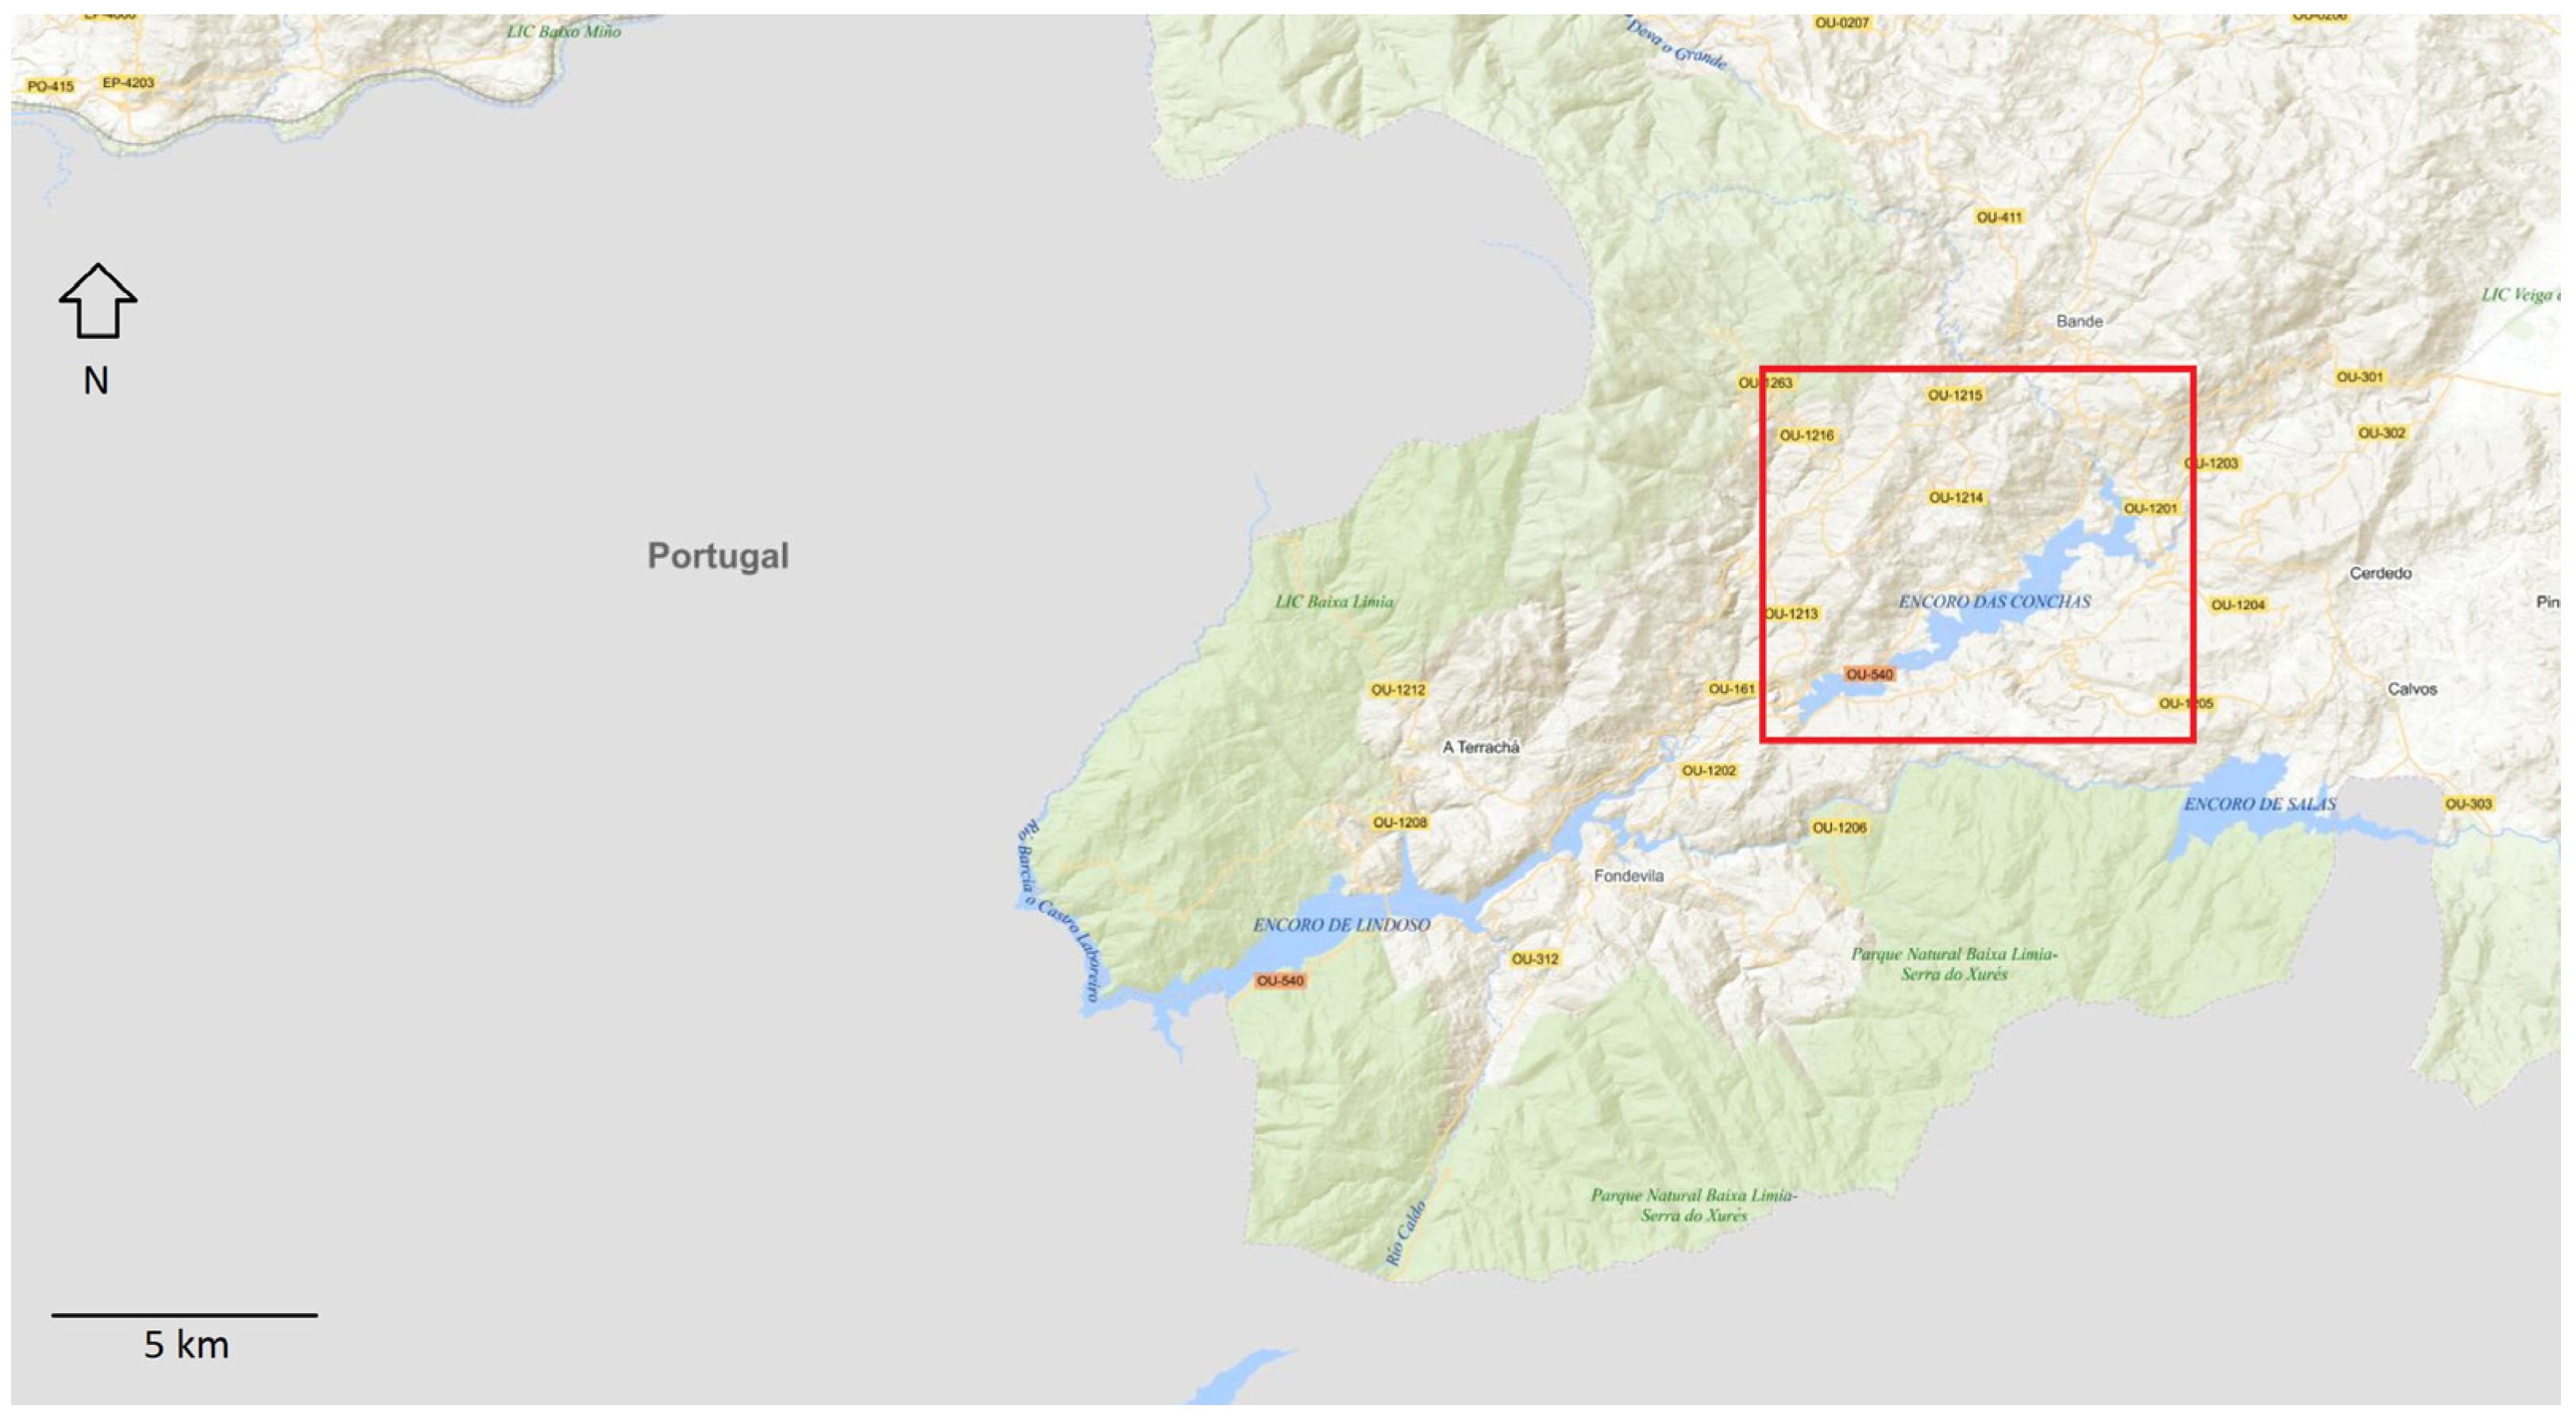
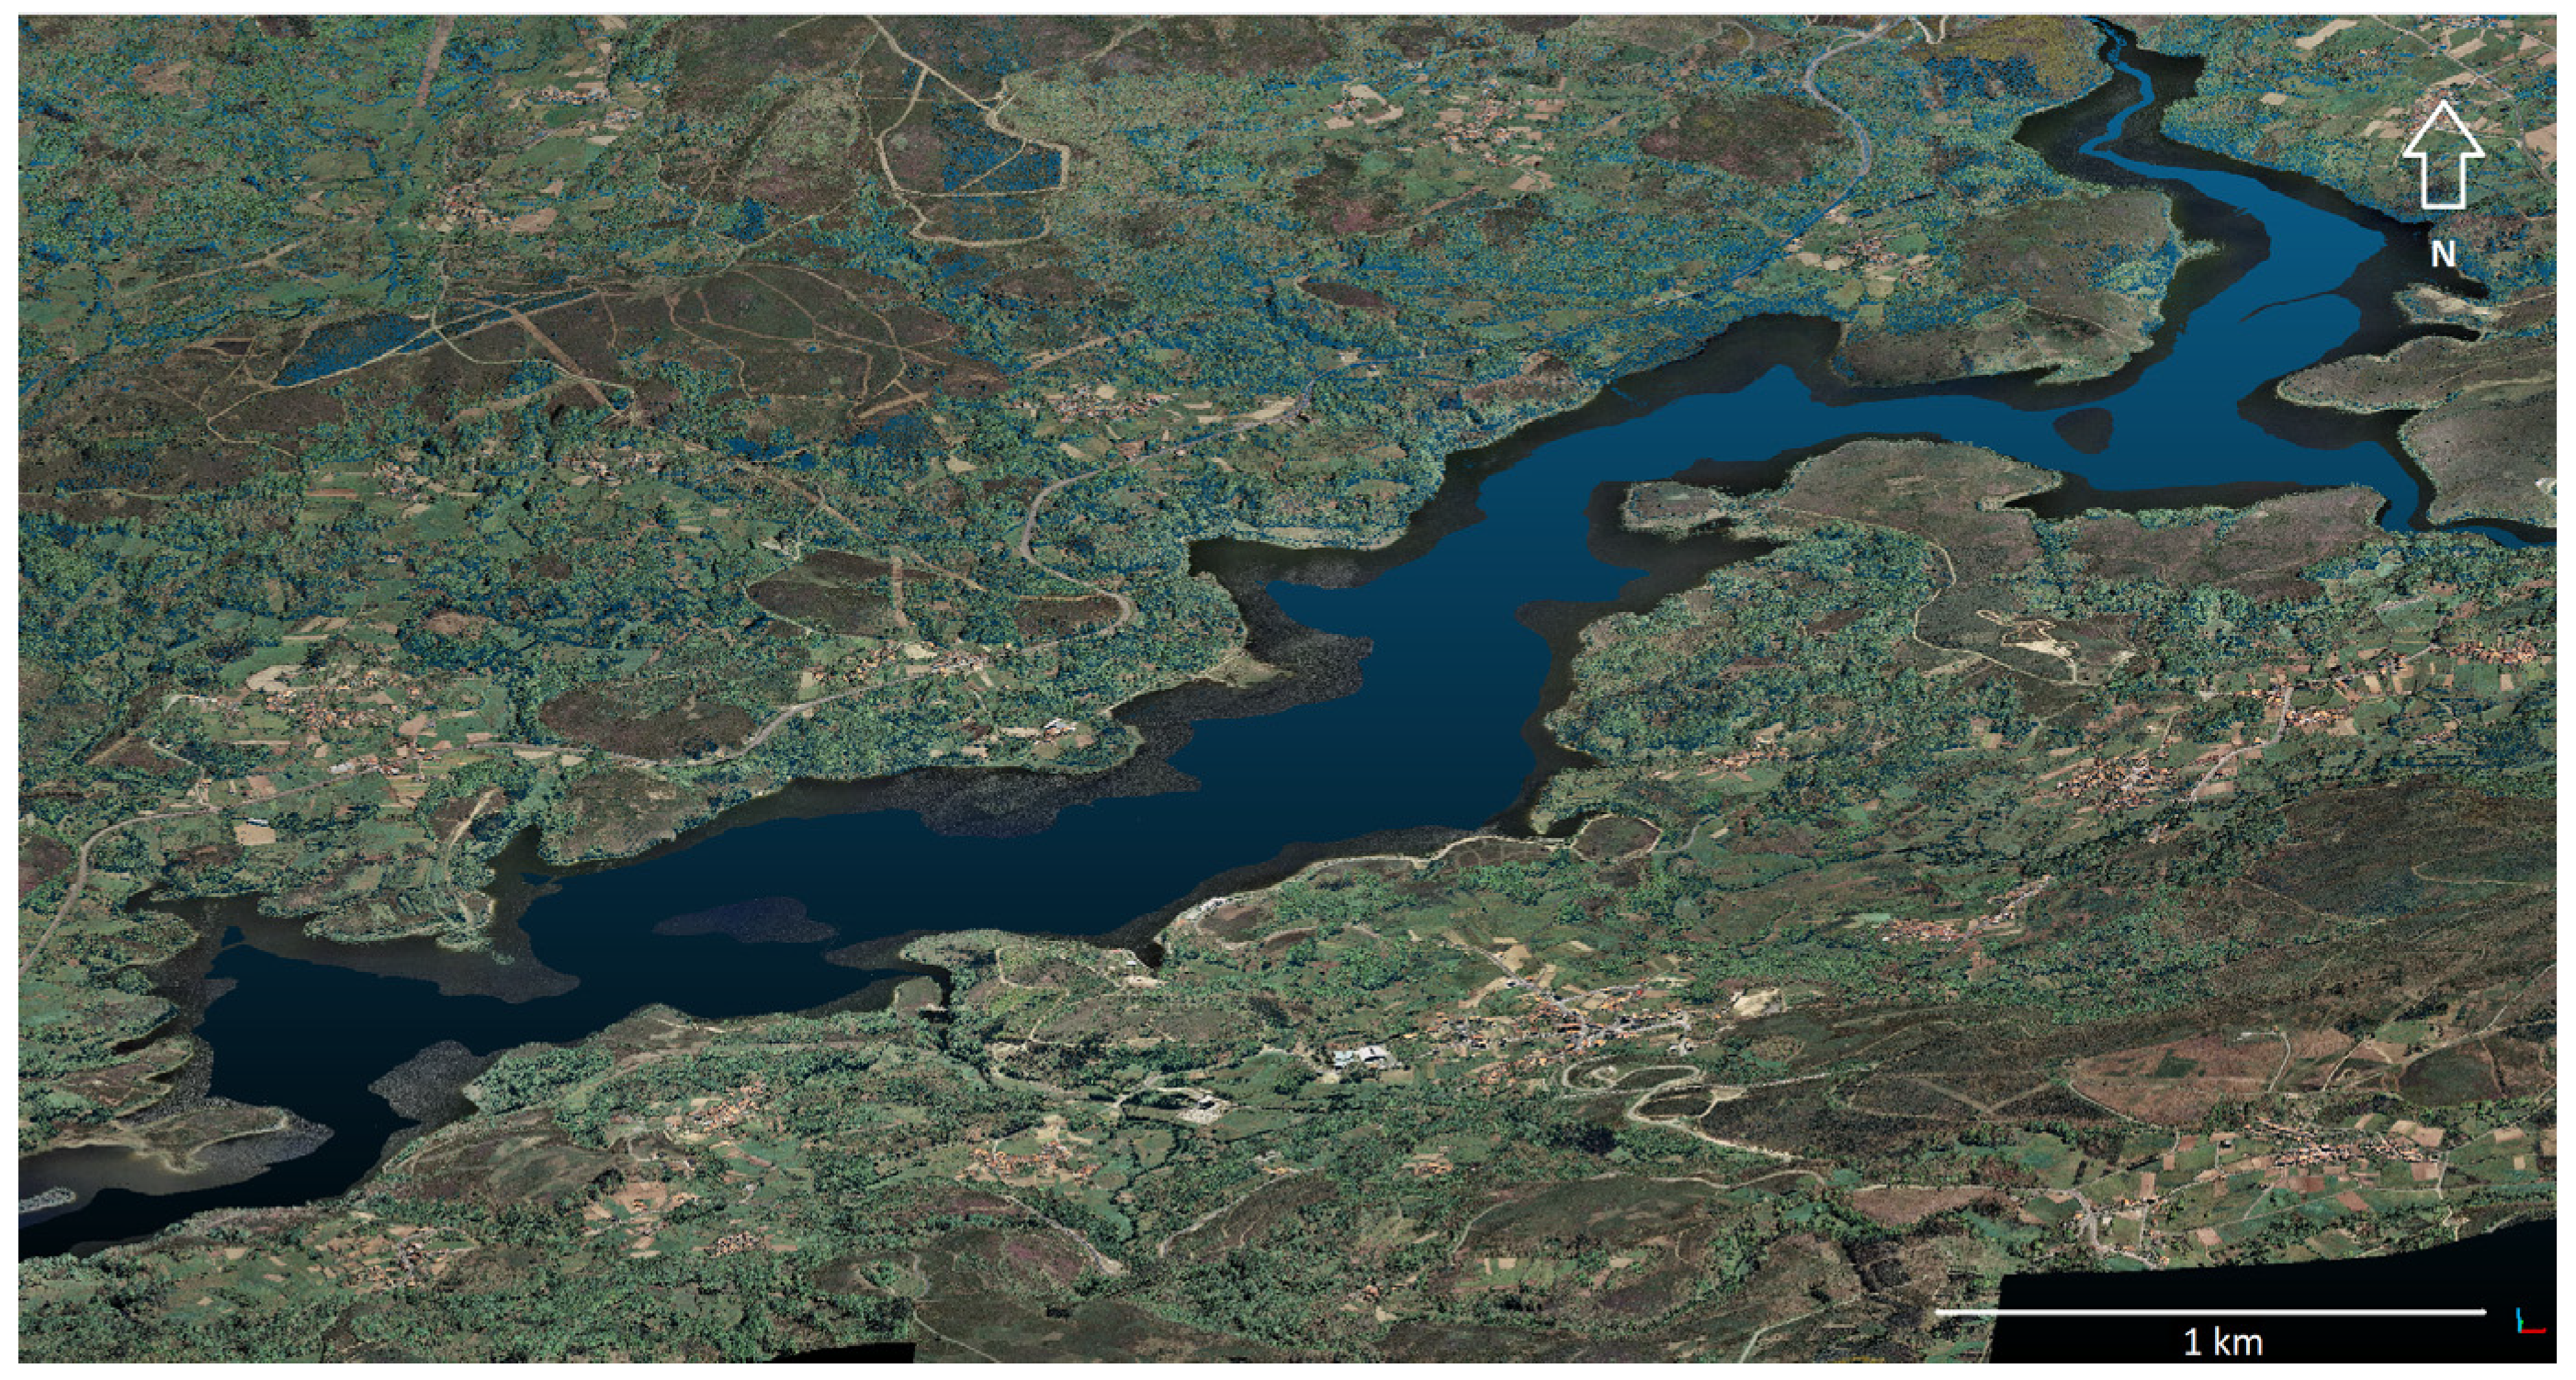
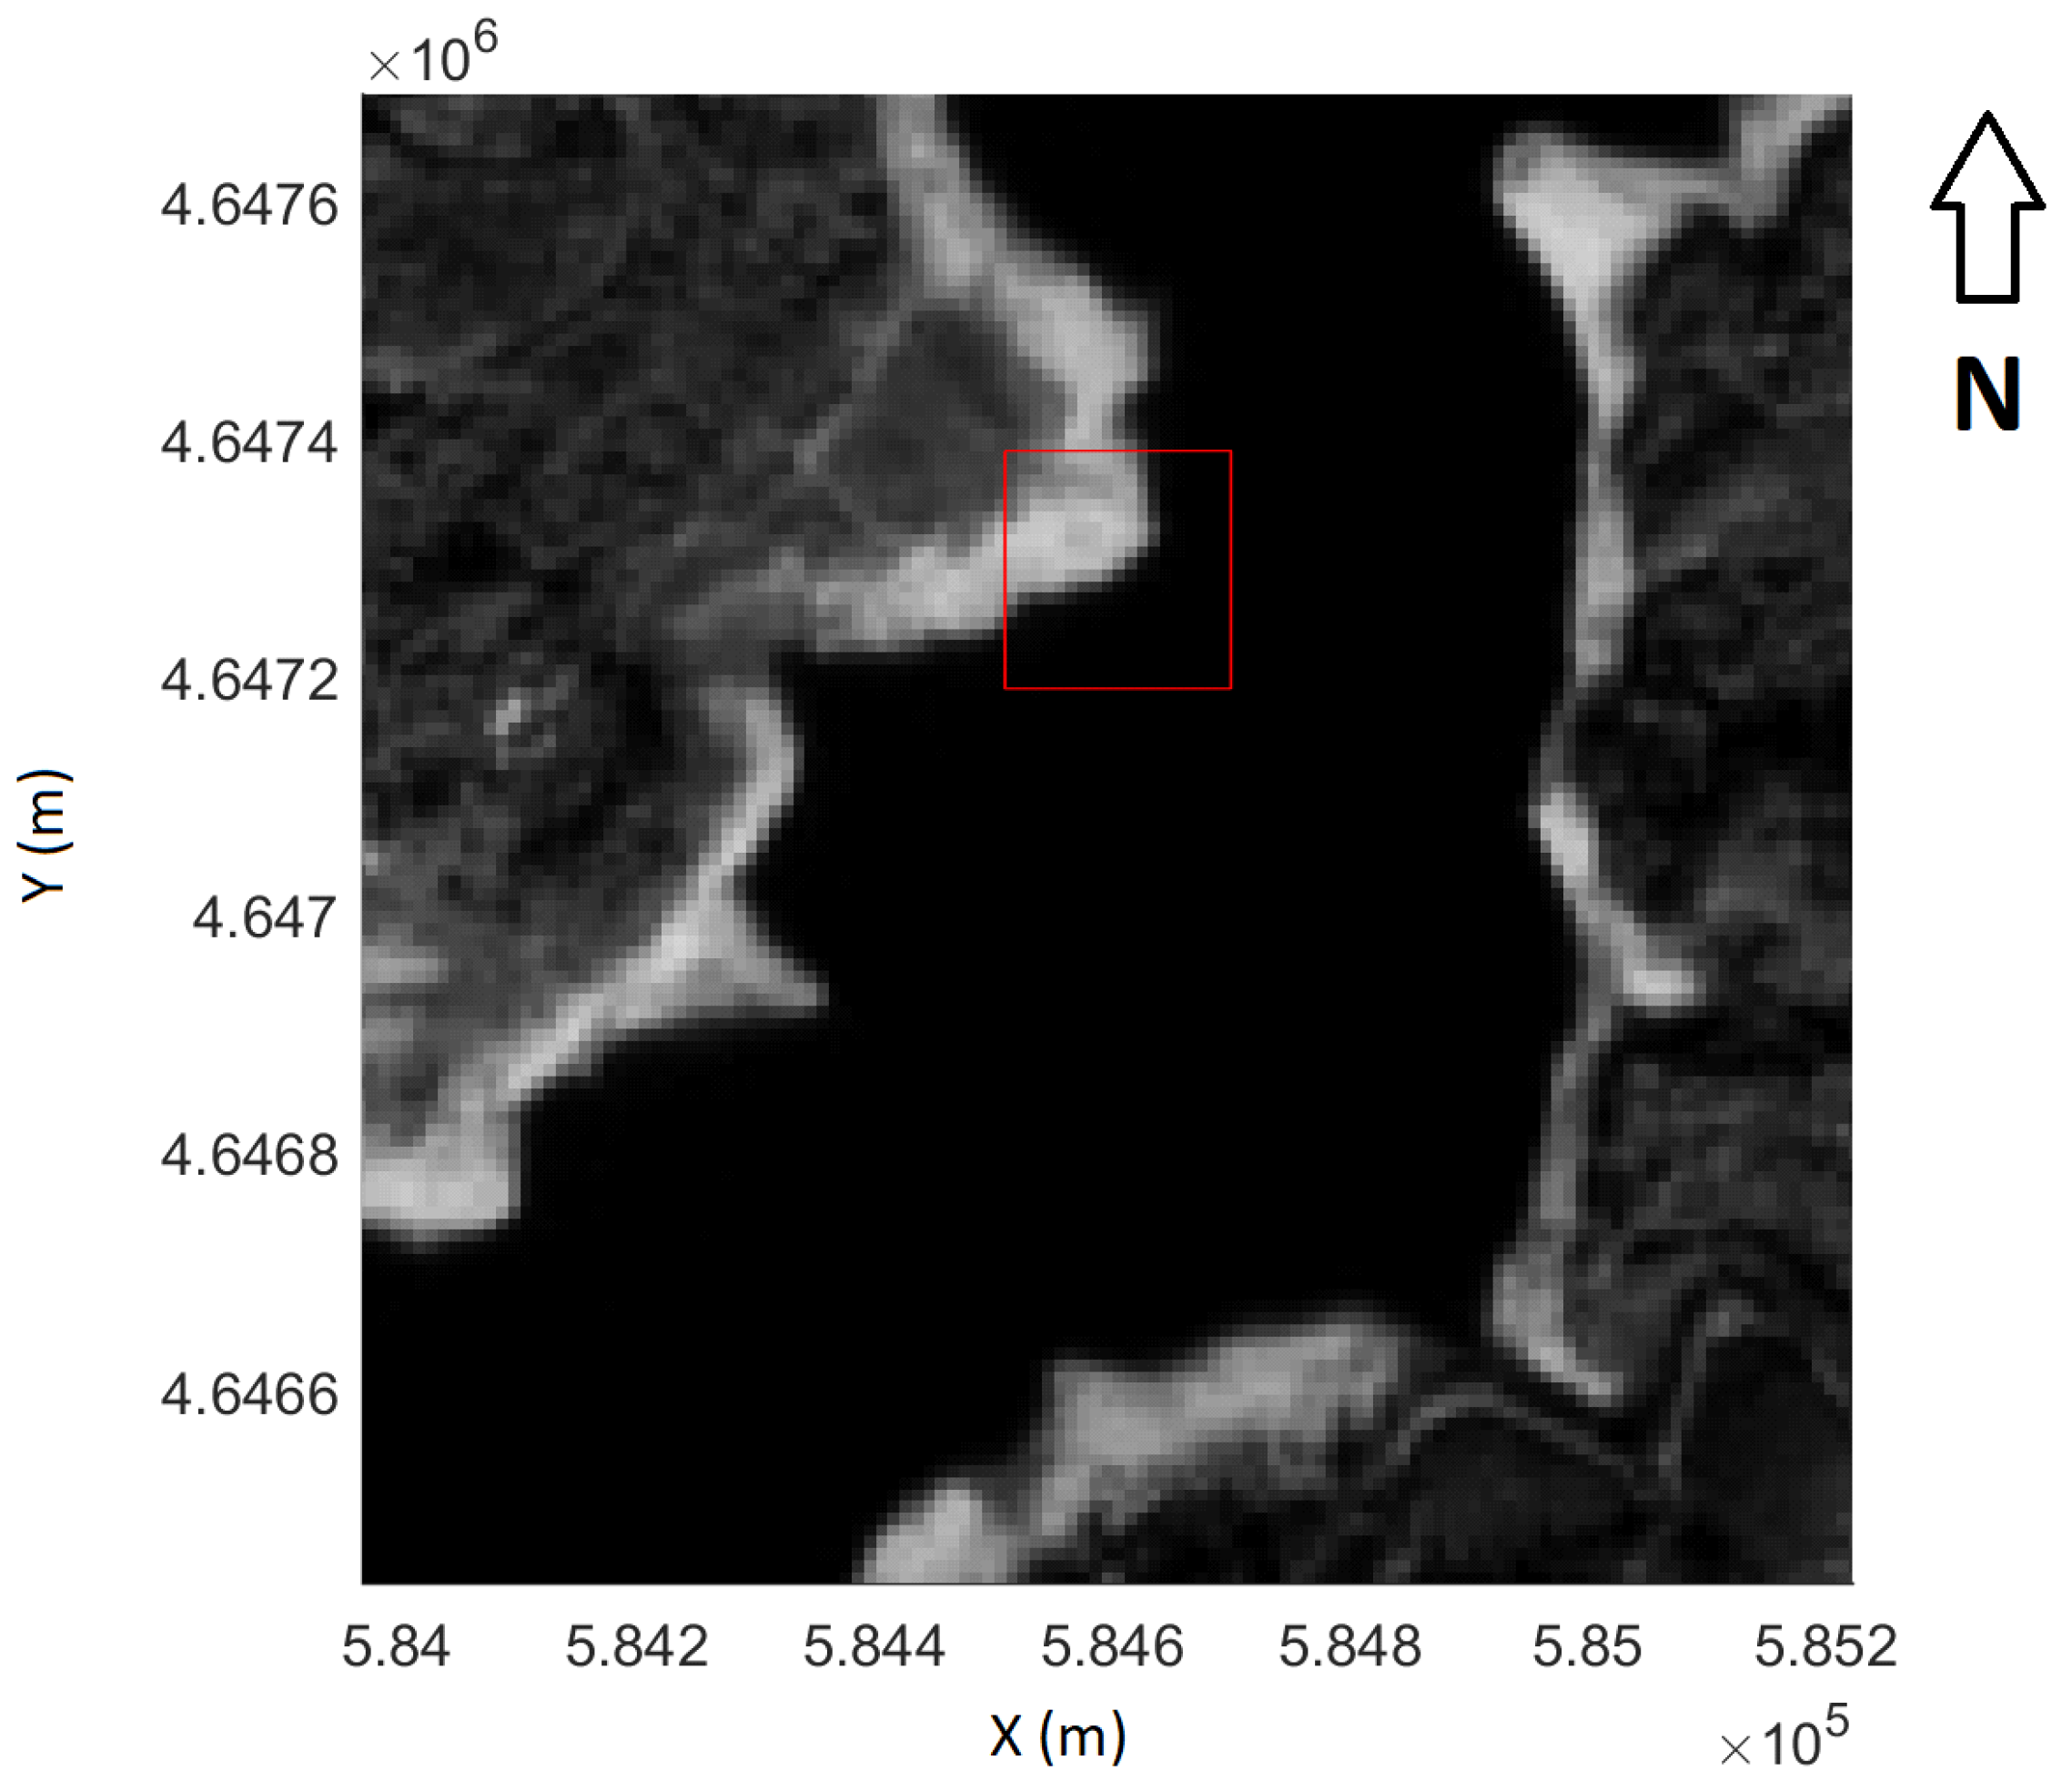
2.1. Area of Study

The area of study is the water reservoir “As Conchas” (Figure 1), located at the south of Ourense province in Spain. The reservoir is formed by the dam that holds the water of the Limia river at the Baixa Limia district. The As Conchas dam was constructed in 1949 and has a height of 48 m and a length of 170 m. The geodetic height of the water level is approximately 500 m. The river basin reaches 978 km2 between the municipalities of Muiños and Bande. Its main purpose is the production of electricity, although it is also used for tourism, leisure, and agriculture.
This reservoir is permanently monitored by the Hydrographic Miño-Sil Confederation [1], which provides daily hydrographic data as height, flow, river temperature, dissolved oxygen, pH, turbidity, etc. Height water data provided by the Hydrographic Confederation are used in this study as ground truth to validate the data obtained from the methodology here described.

2.2. Aerial LiDAR Data

The Spanish Geographic Institute provides open LiDAR data for all the territory [23], consisting of digital files of true RGB-coloured LiDAR point clouds (Figure 2). The ground reference system is ETRS89 and units are divided in cells of 2 × 2 km, with a resolution of 0.5 points per square metre. Laser has some underwater penetration, and the terrain under shallow water zones can be detected and 3D modelled by aerial LiDAR.

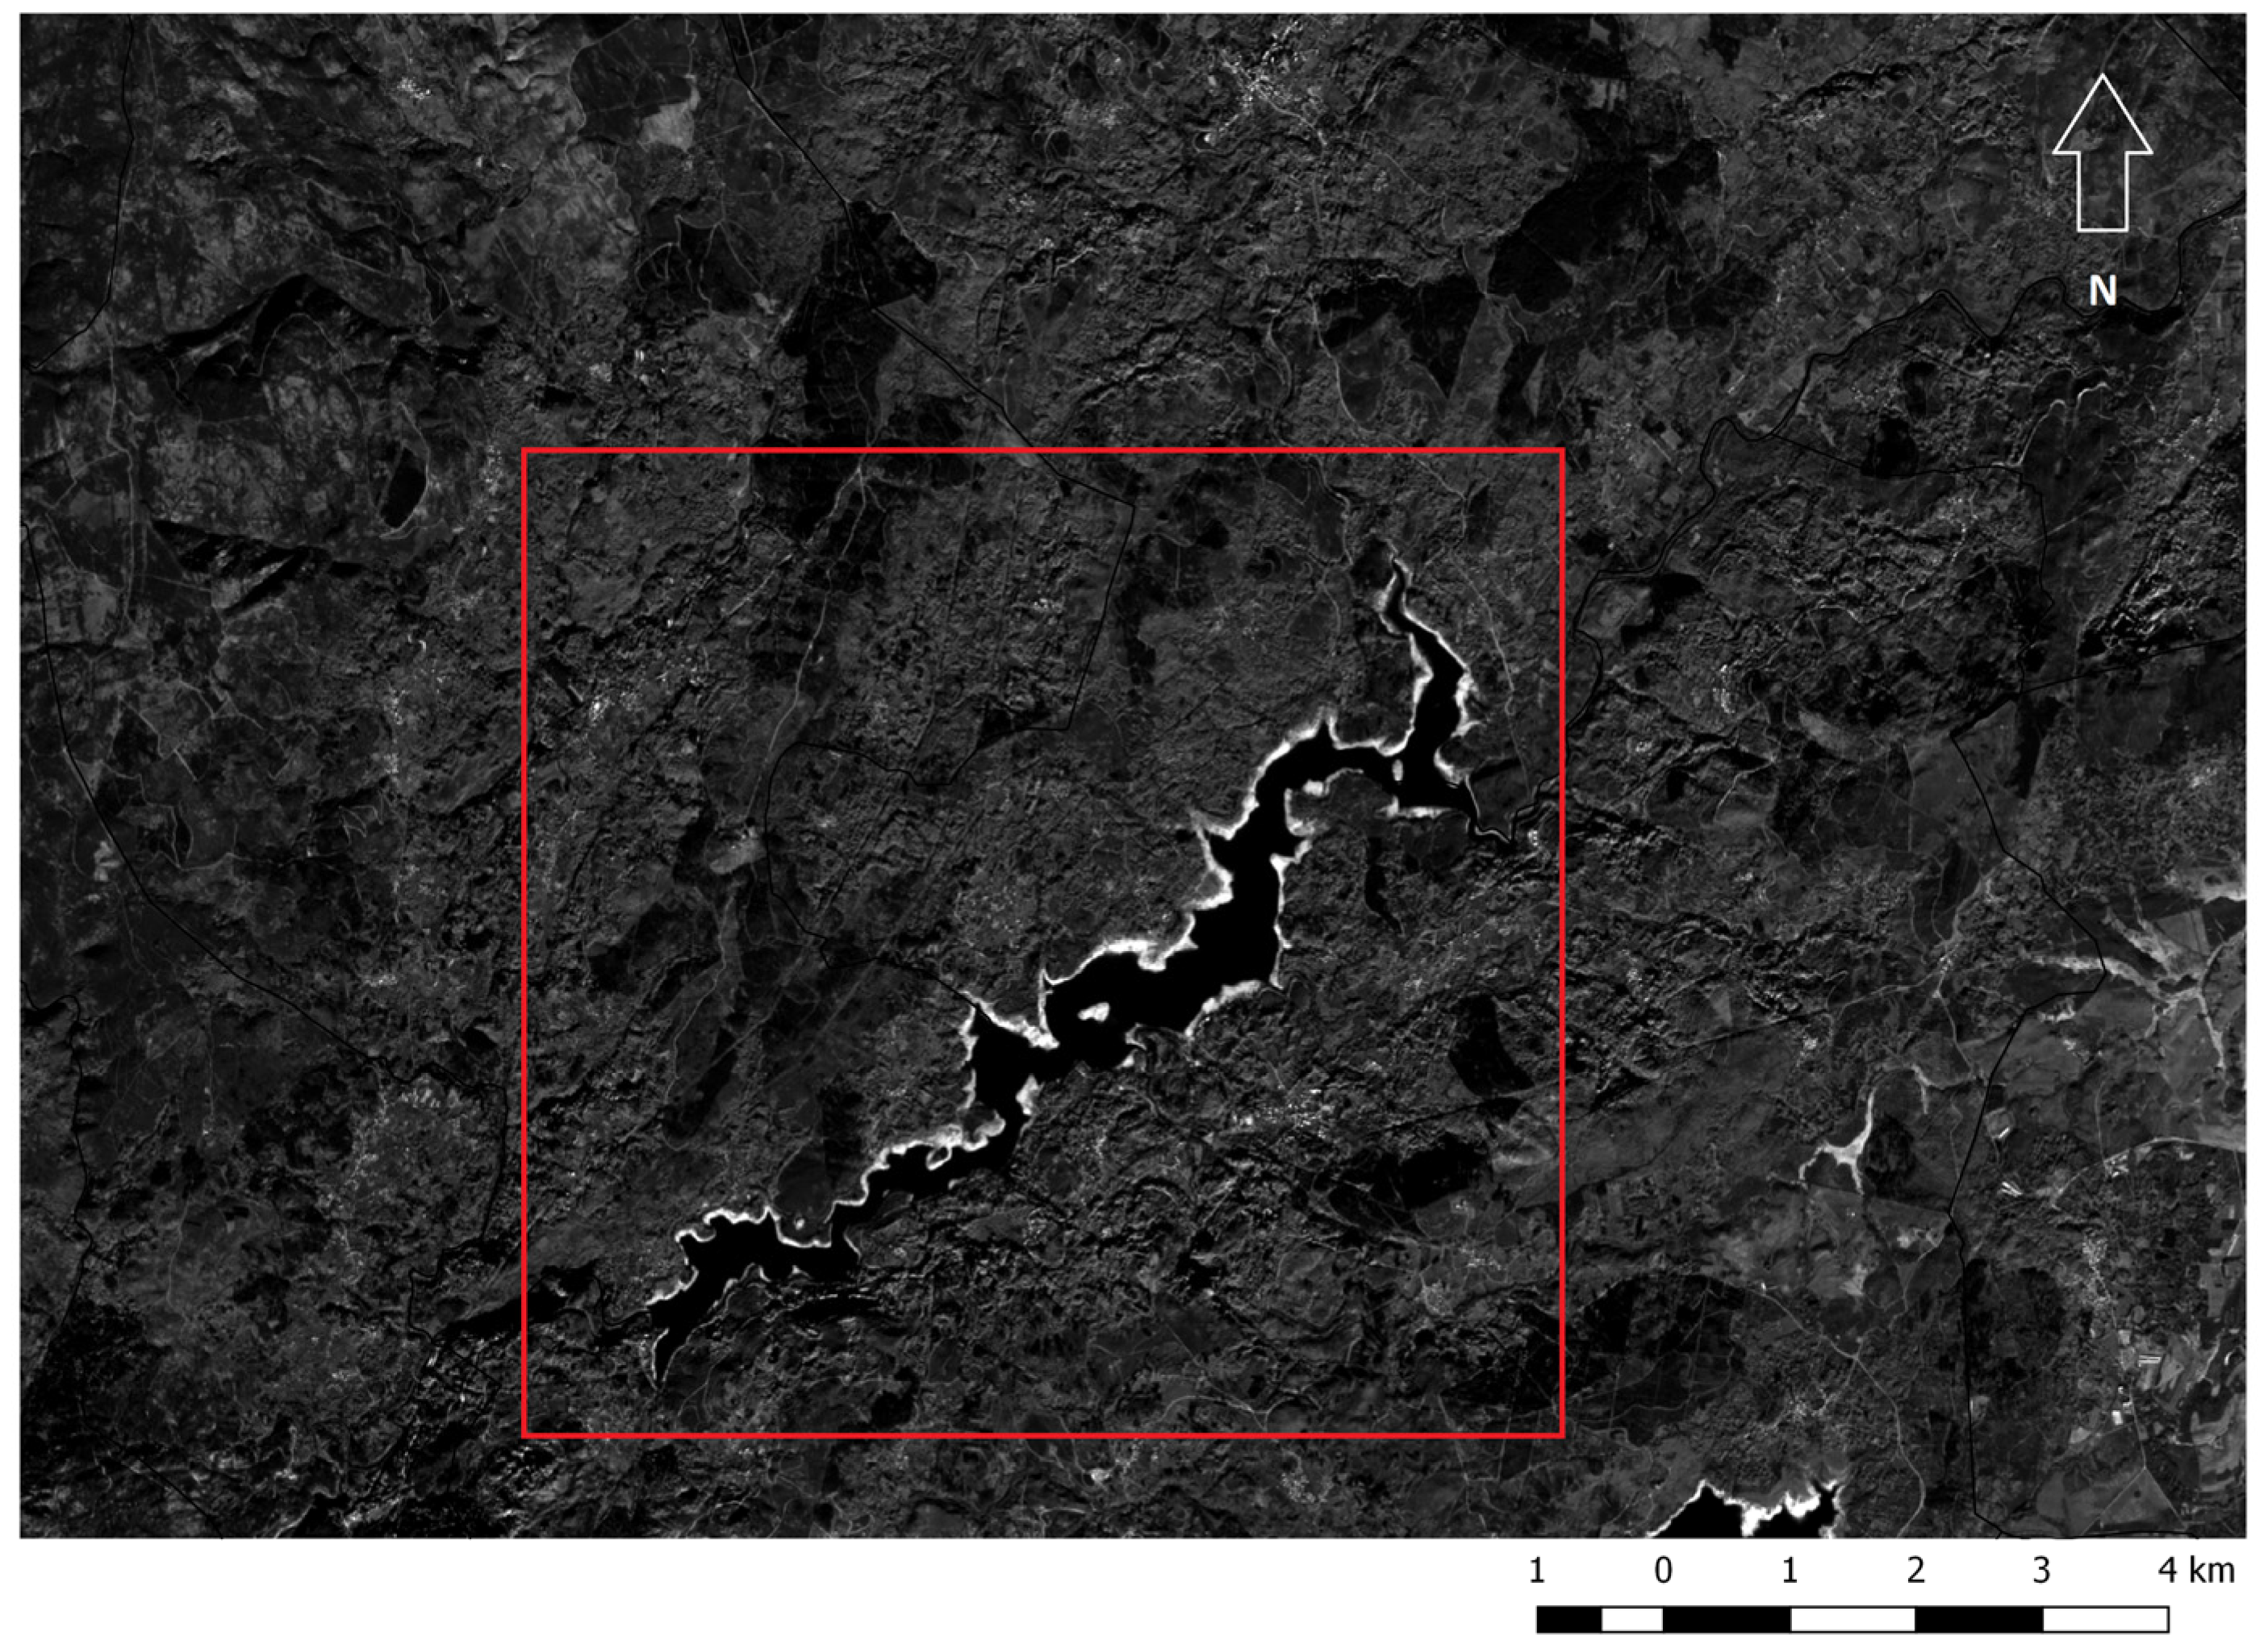
2.3. Satellite Imagery

Imagery (Figure 3) from the Sentinel 2 [24] satellite is used for the methodology. Sentinel 2 is an Earth observation mission developed by the European Space Agency inside the Copernicus Programme [25] to support services related with forest monitoring, land cover changes detection and natural disaster management. It consists of two identical satellites, Sentinel 2A and Sentinel 2B. They provide multi-spectral imagery in 13 bands covering the visible, near infrared and short wave infrared electromagnetic spectrum. Sentinel 2 satellites provide a revisit time of five days. The spatial resolution changes from 10 m (B2—blue, B3—green, B4—red, and B8—near infrared) to 60 m (B1—coastal aerosol, B9—water vapour, B10—shortwave infrared).
Level 1C (top of atmosphere reflectance) imagery is downloaded from the Copernicus Open Access Hub [26]. The twelve months of year 2017 were used to obtain a complete hydrologic cycle.

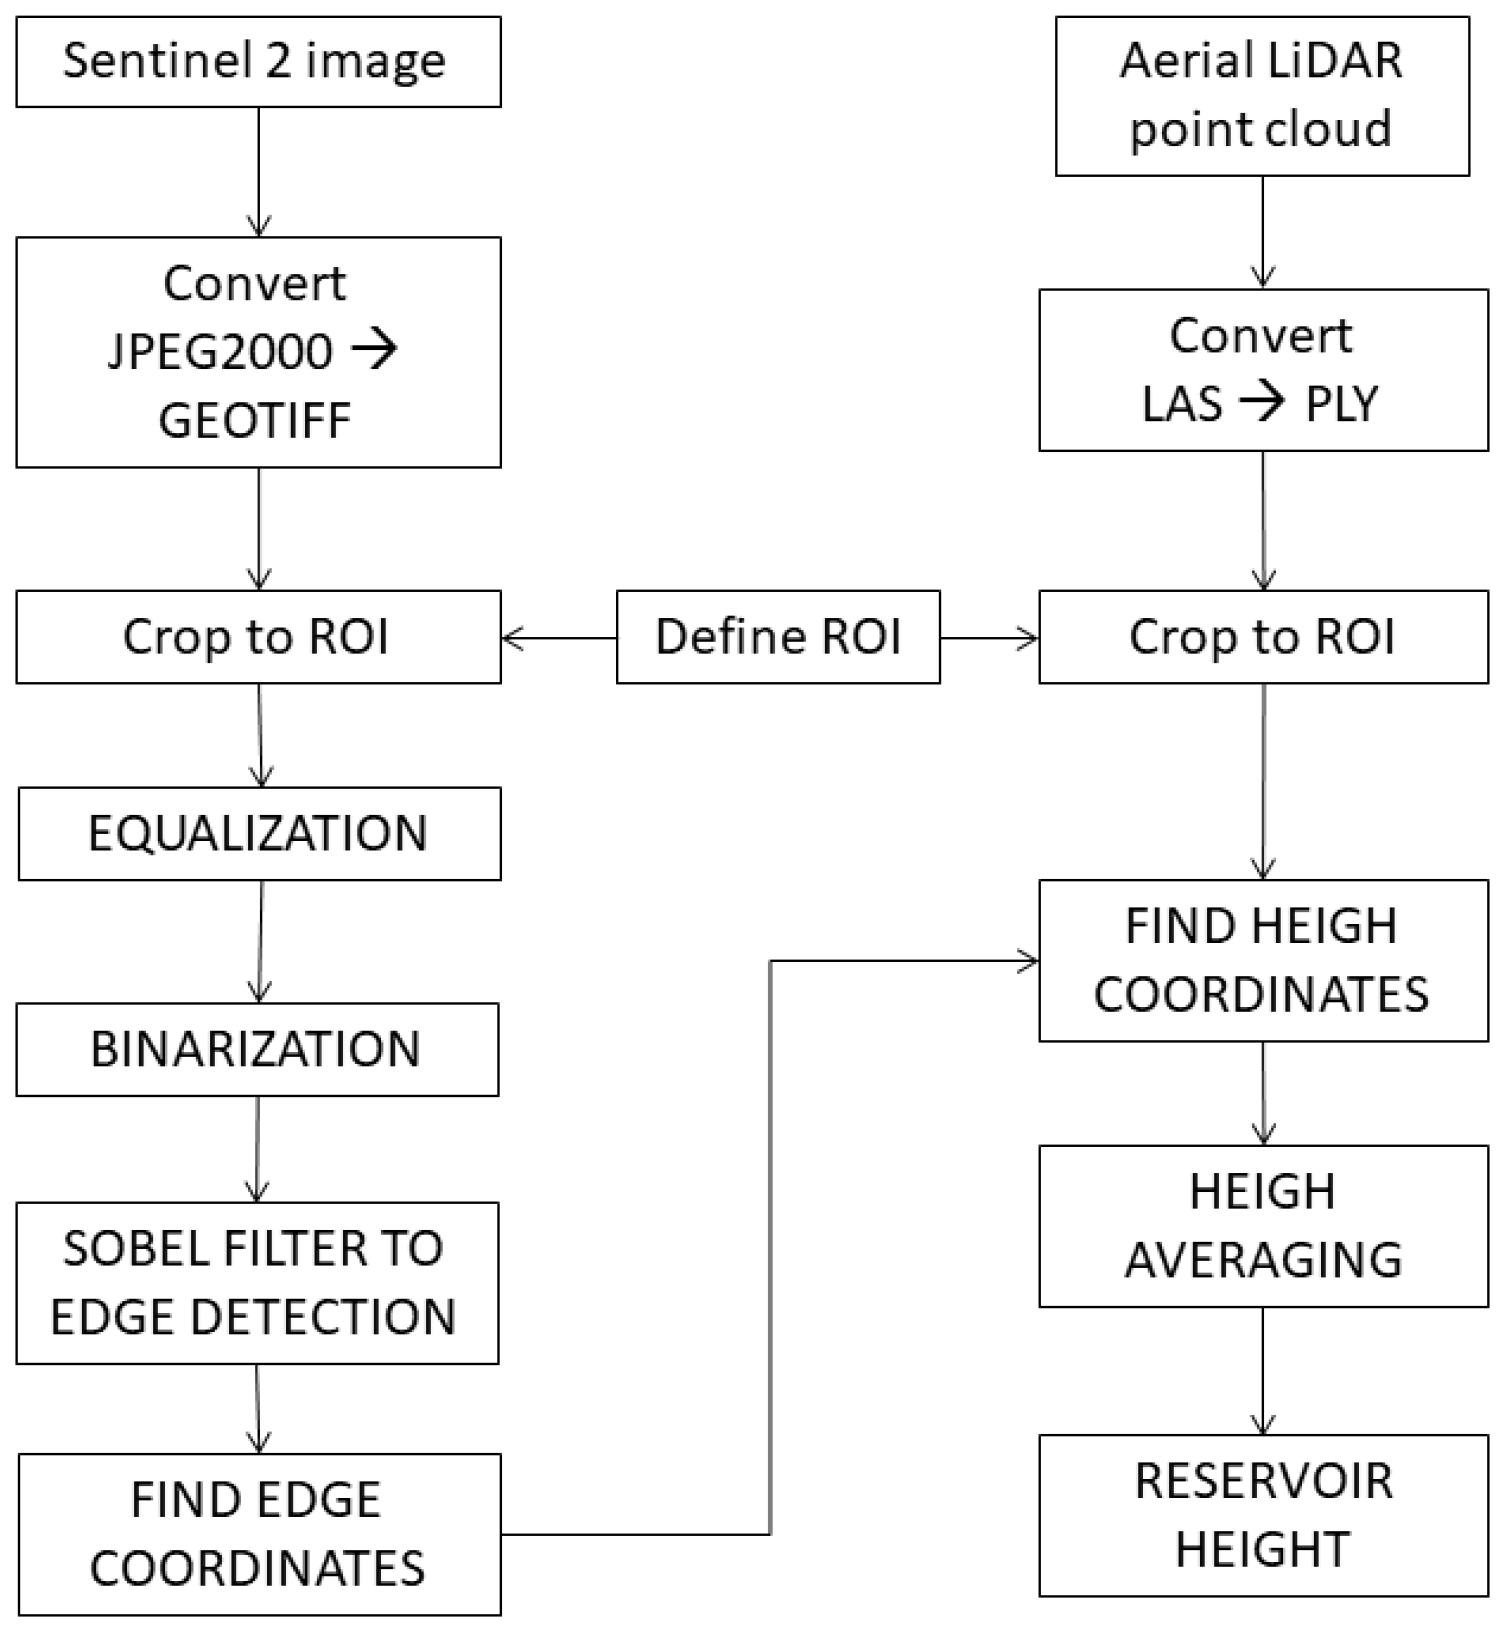
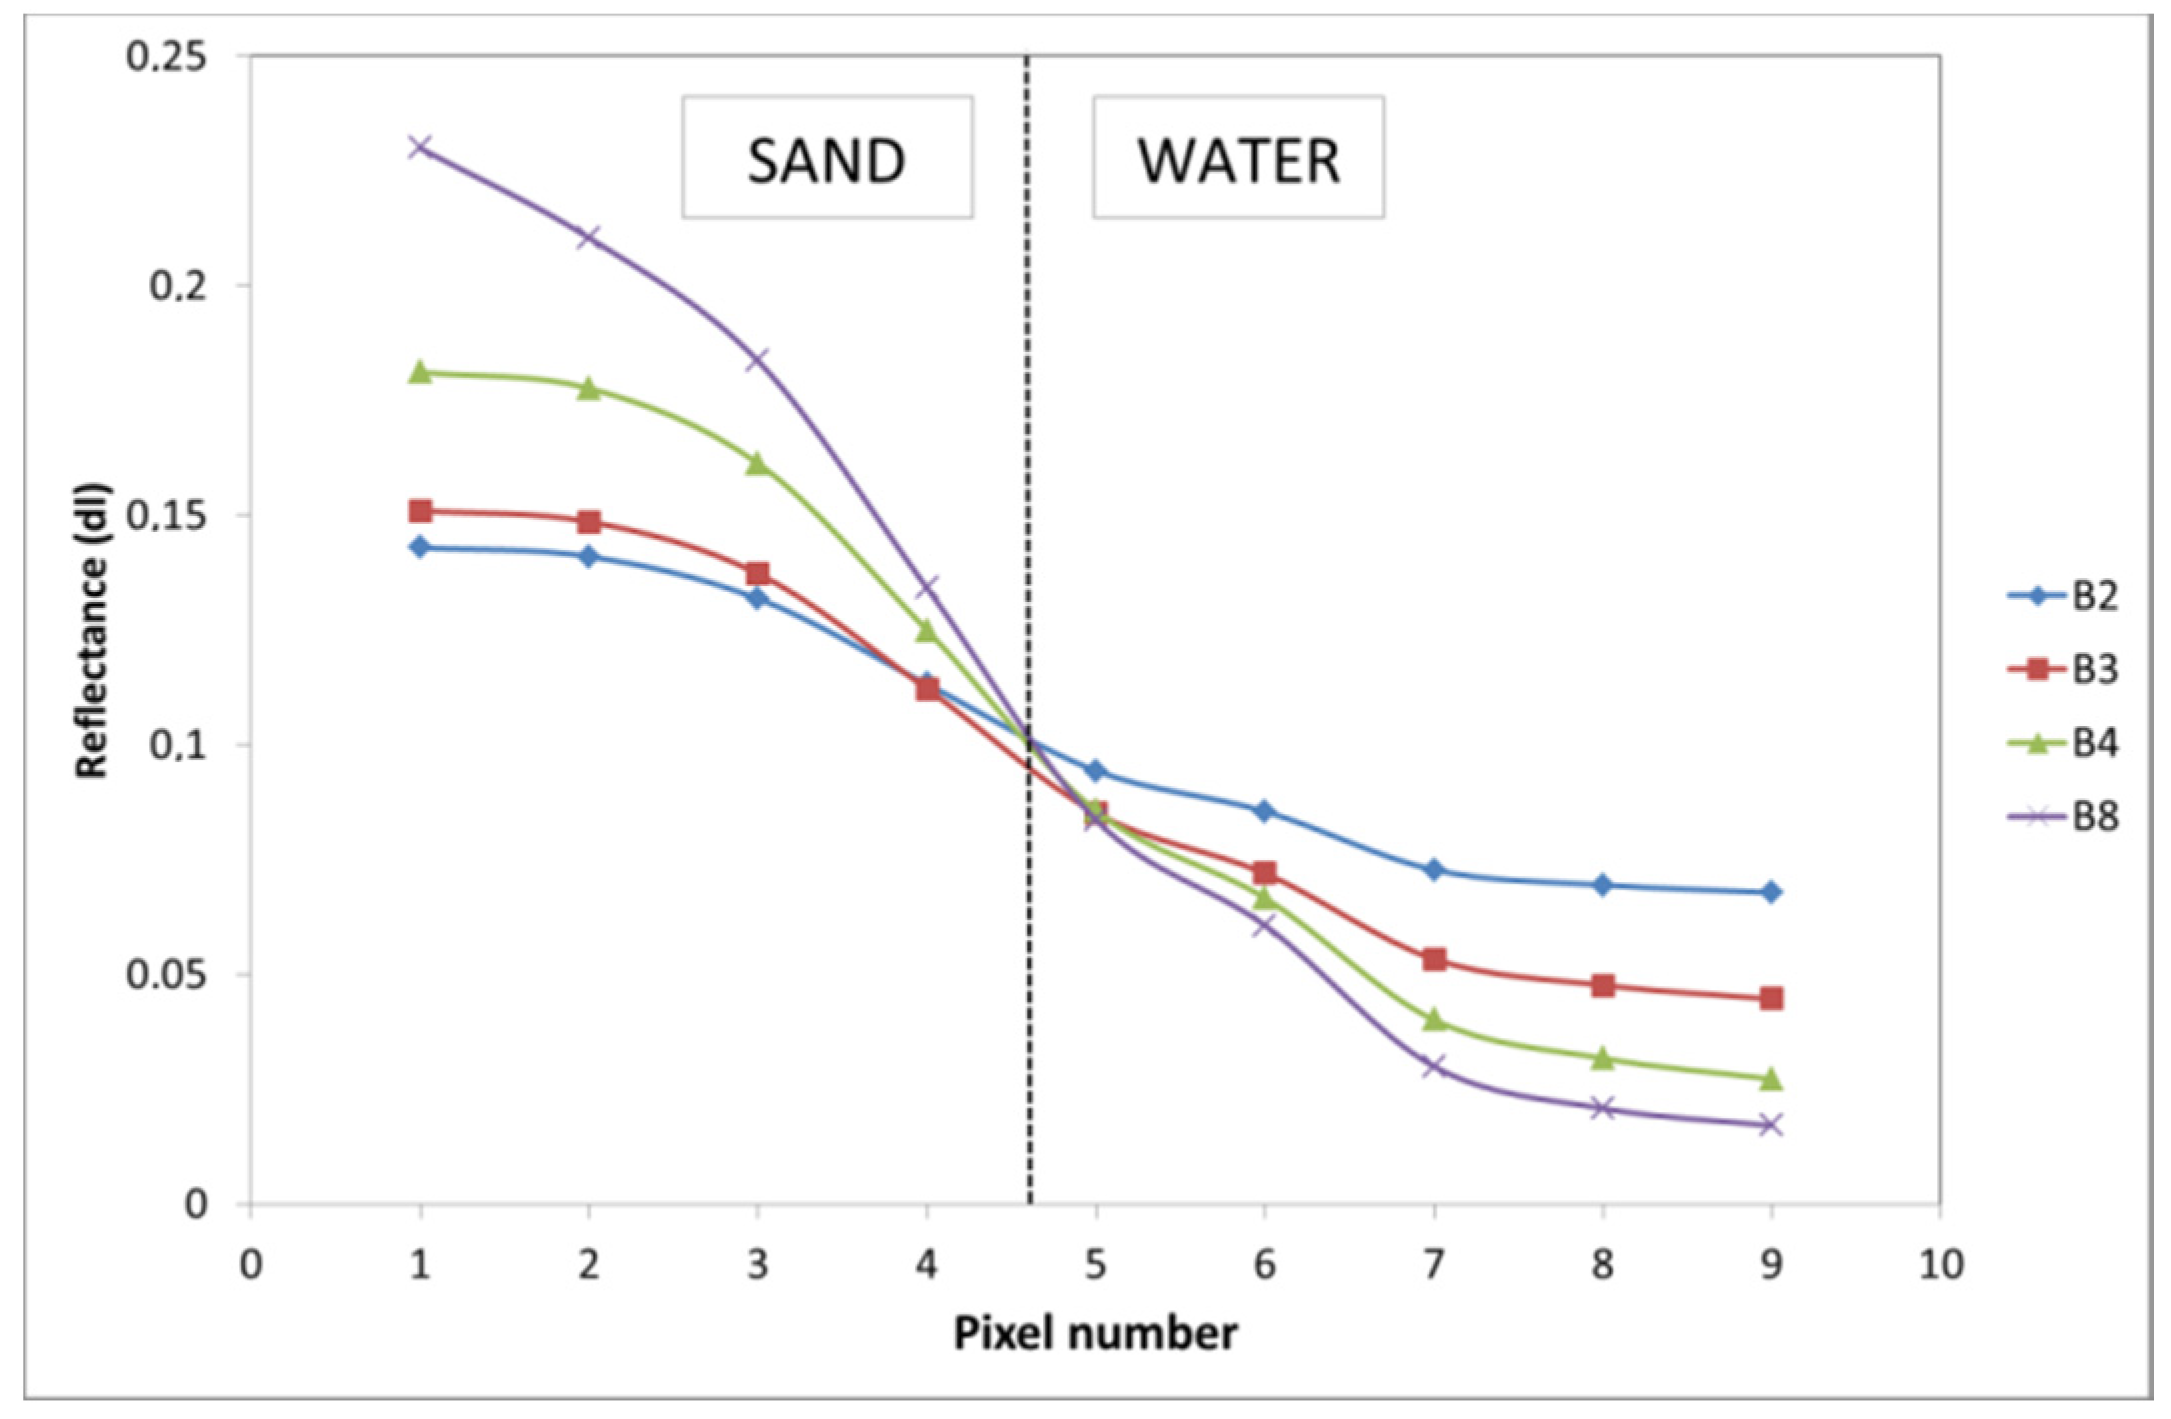
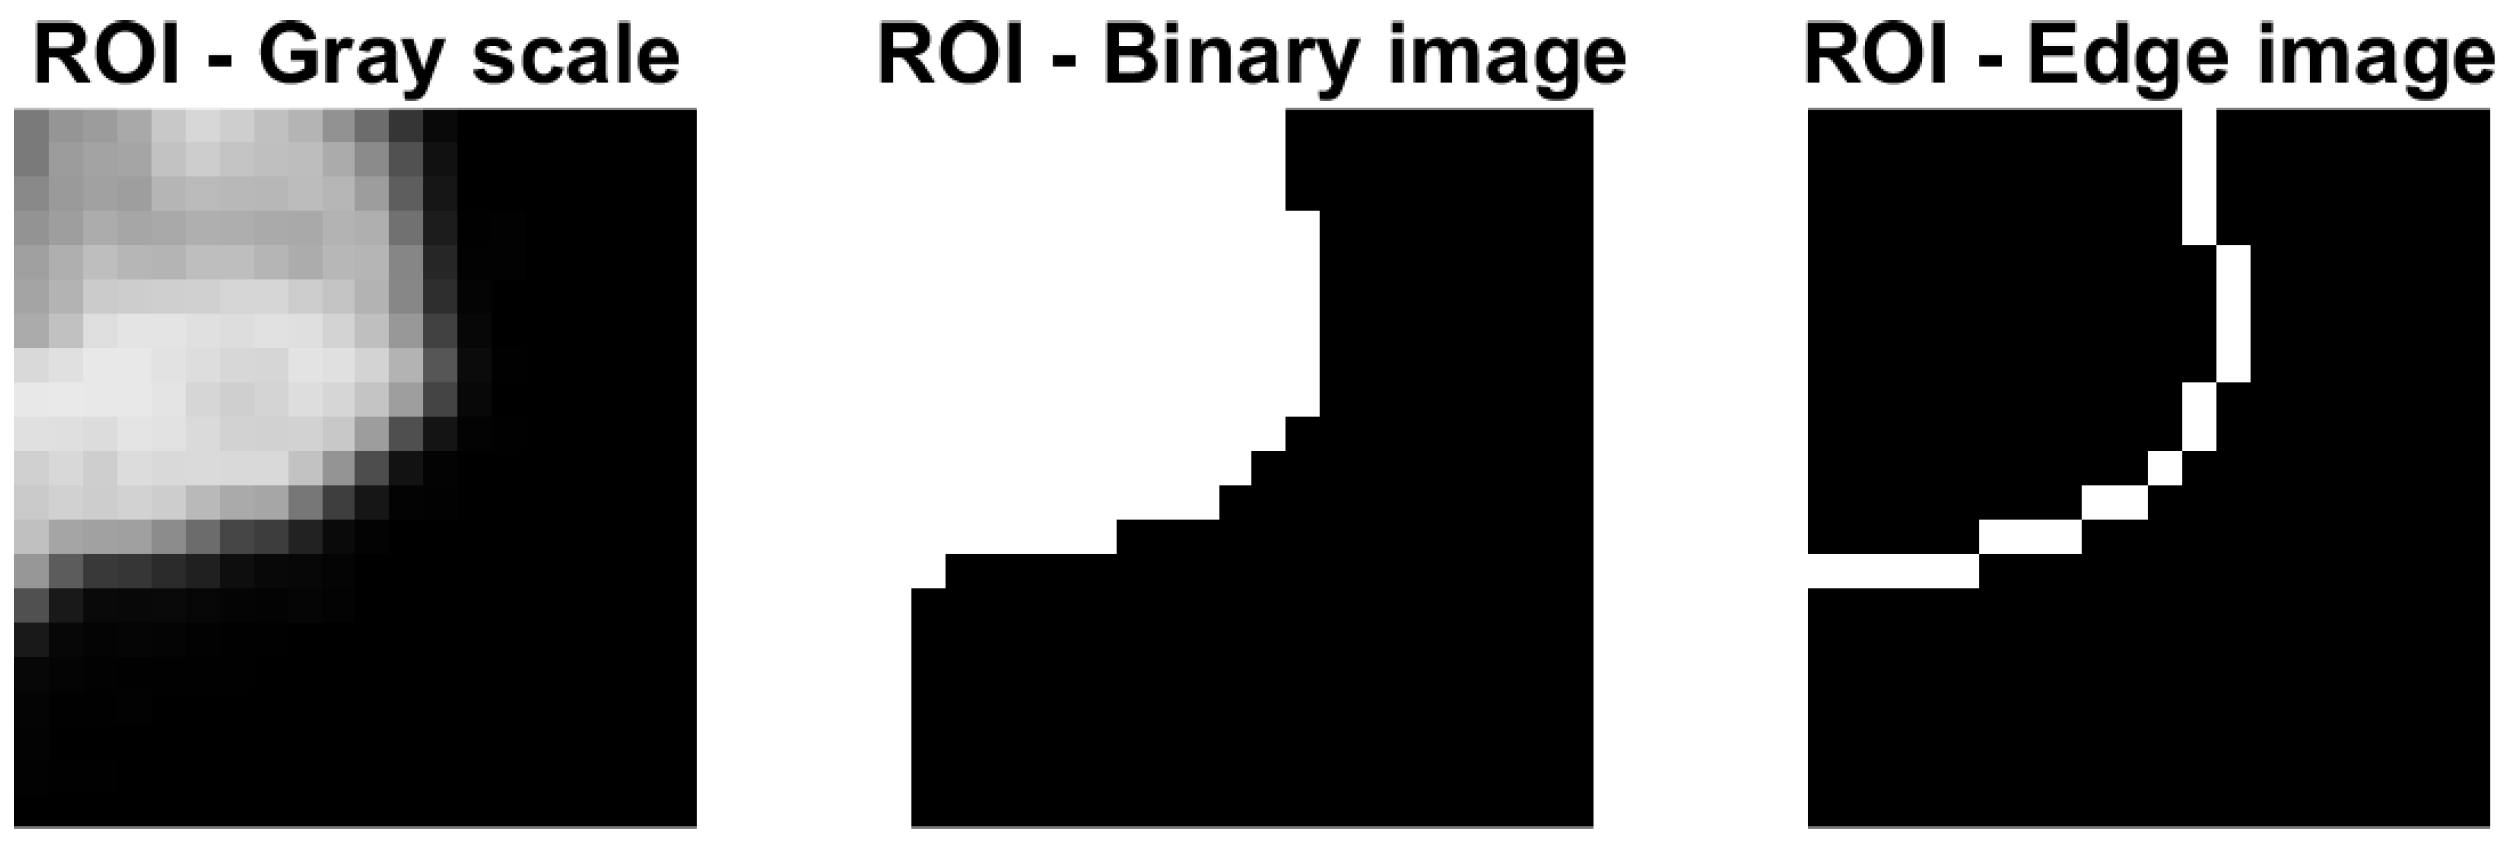
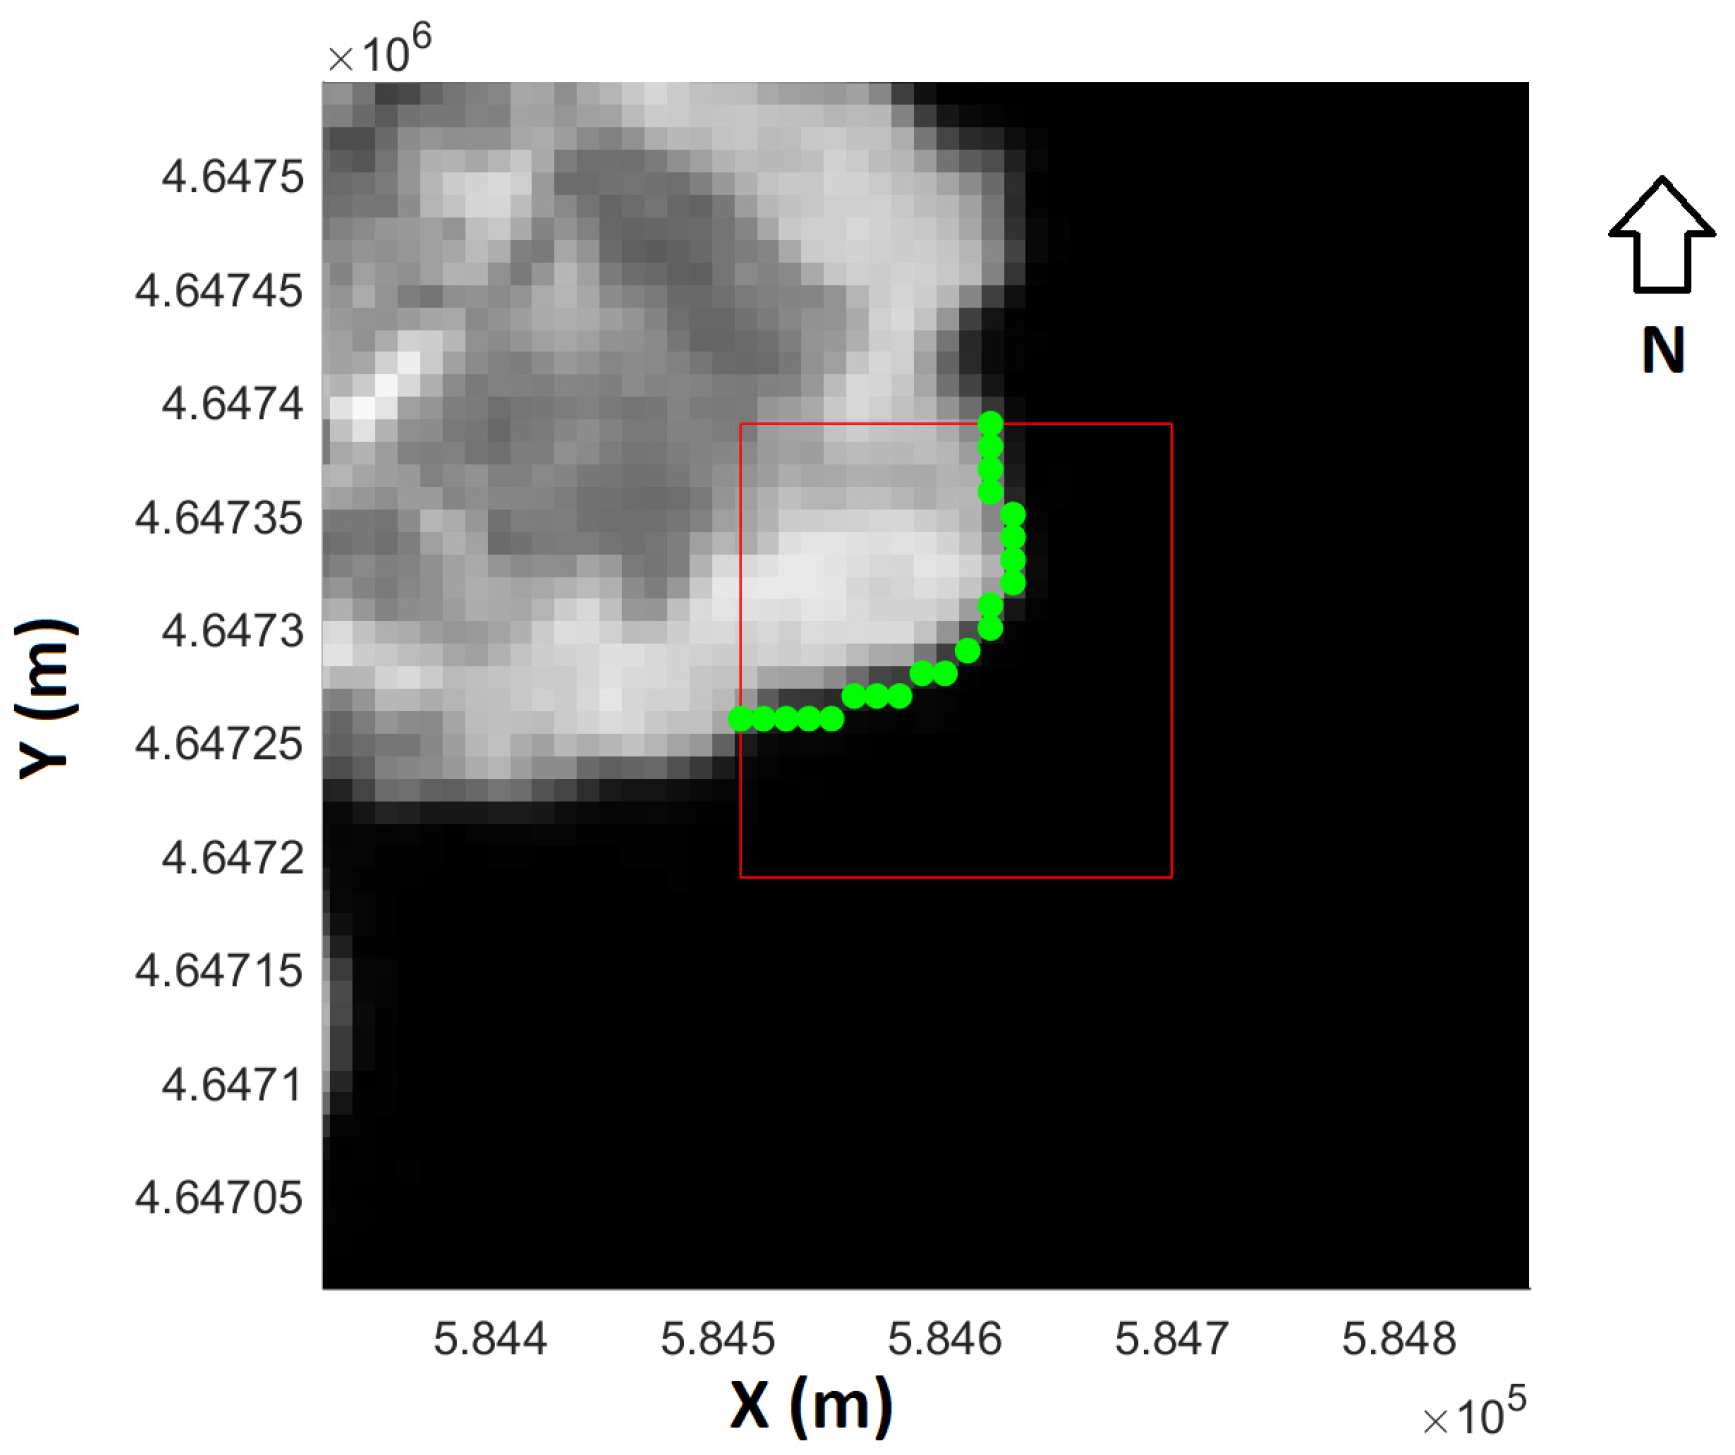
2.4. Data Processing

The algorithm is described in Figure 4. The data processing is focused on a region of interest (ROI) manually selected by the user (Figure 5). The ROI is focused on the land-water interface. The use of a ROI prevents the necessity of large computing resources and makes the image processing algorithm more robust. Data input to the algorithm consists of the aerial LiDAR point cloud and Sentinel 2 imagery in bands B2 (490 nm), B4 (560 nm), B5 (665 nm), and B8 (842 nm). These bands are selected for two main reasons. They present the maximum spatial resolution (10 m) and good reflectance contrast for the water-land interface. Figure 6 shows a reflectance profile between the top-left and bottom-right corners of the ROI. As can be observed, band 8 shows the higher contrast. Reflectance data are obtained using SNAP software from ESA [27].
QGIS software [28] is used for the conversion of the satellite imagery from JPEG2000 format to GEOTIFF. On the other hand, Cloud Compare software [29] is used to convert point clouds from LAS format to PLY. Thus, the imagery and point clouds provide outputs in formats available for Matlab processing [30], which is the software used to implement the following algorithmic.
Satellite images are equalized (Figure 4) to increase the global contrast of the image and make the edge detection robust. This step allows a better distribution of the intensities on the histogram and the areas of lower local contrast gain a higher contrast. The next step of image processing after equalization is a binarization process. The binarization process used the Otsu method, which minimizes the intra-class variance of the thresholded black and white pixels based on the threshold value. The 8-bit image histogram is used to compute the Otsu threshold [31]. After binarization, edge detection process is applied using the Sobel filter [32]. Edge detection finds the edges in the image by approximating the gradient magnitude of the image. It is a discrete differentiation operator that approximates the gradient of the image intensity function. Figure 7 shows the binarization and edge detection on the ROI image.
The ROI image is developed from a satellite image with pixels correlated with coordinates (Figure 8). Thus, a set of 21 coordinates that delimit the water–land interface is obtained from the image. The number of coordinates depends on the area of the region of interest and the morphology of the water-land interface. More than ten coordinates are recommended to enable averaging and obtain accurate results. These UTM–ETRS89 coordinates are correlated with the point cloud data from aerial LiDAR to find their corresponding height values. The near neighbour algorithm is used to determine the abovementioned XY coordinates and the corresponding height value. The final height of the water reservoir is obtained by averaging the 21 height data values previously calculated.

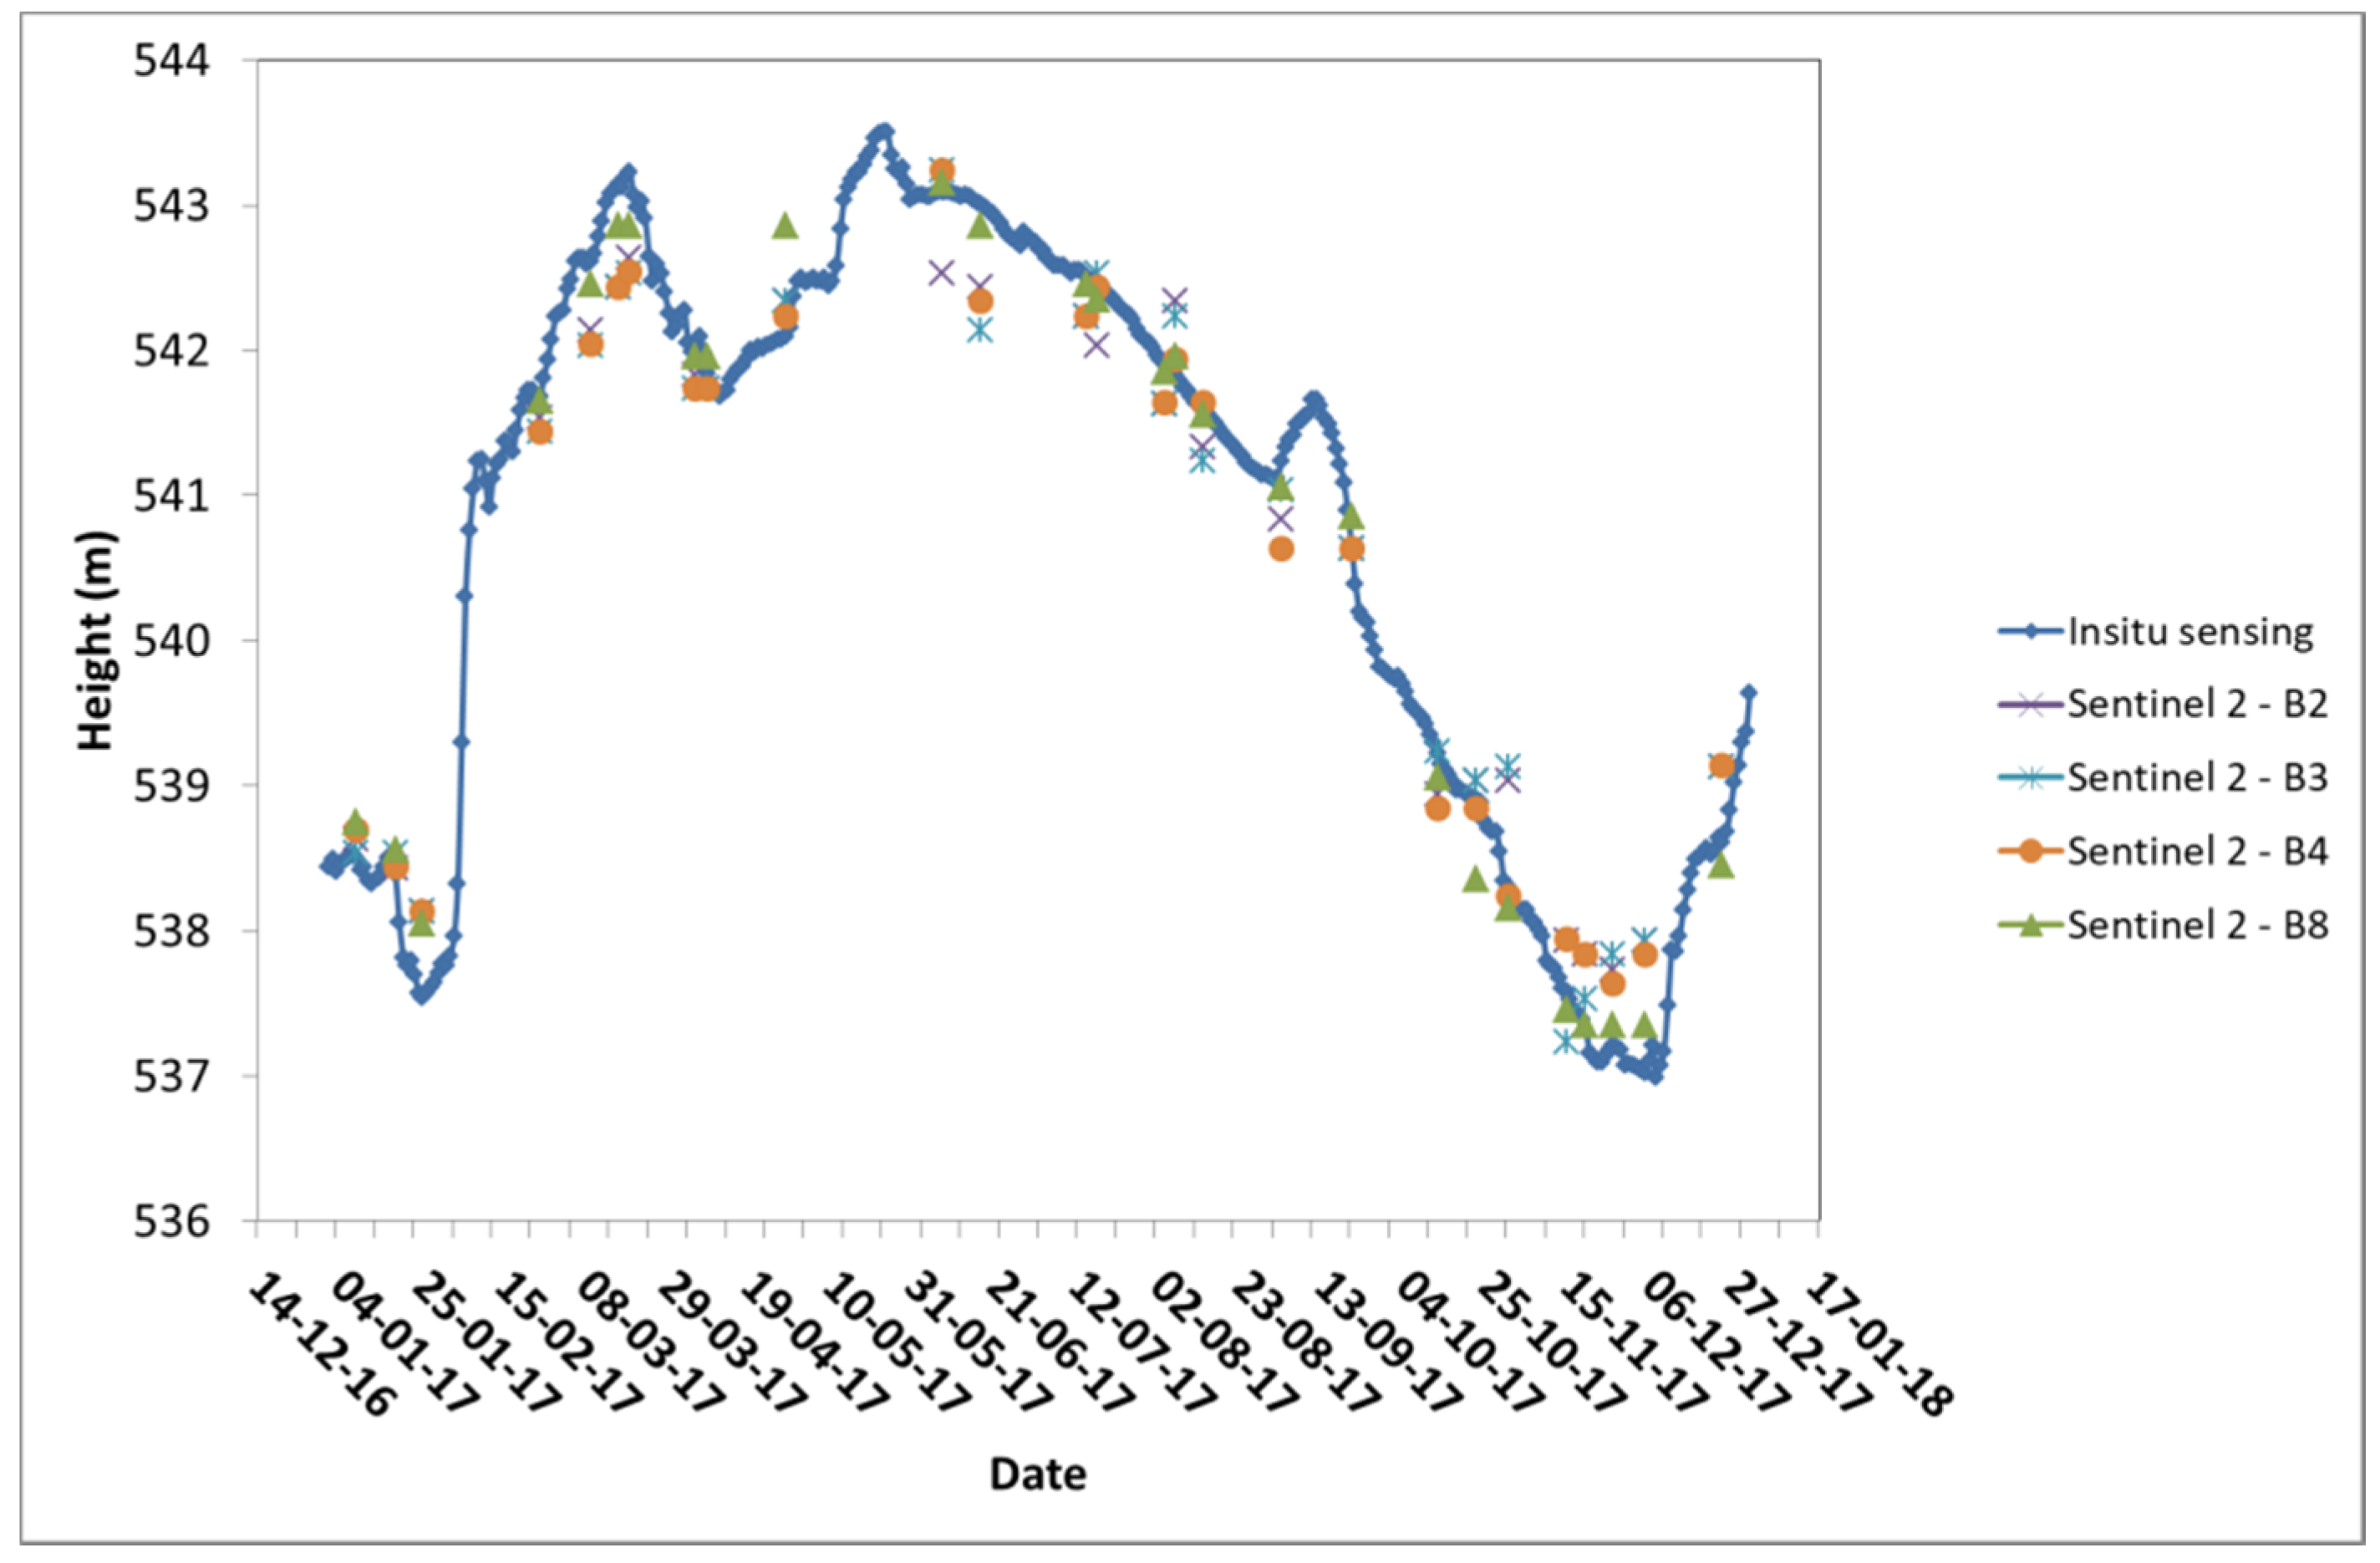
3. Results and Discussion

Figure 9 shows the height values obtained from Sentinel 2 bands B2, B3, B4, and B8. Although the authors attempted to cover all the year 2017, there are some data gaps mainly due to cloud cover, which is quite frequent in the Galicia region. The satellite data were compared with the in situ sensing values provided by the Hydrographic Miño-Sil Confederation, which were used for ground truthing. Table 1 shows the error and standard deviation of the height values in comparison with the in situ sensing data. The error is calculated as the difference between the height data from the in situ sensing and the height data obtained using the methodology presented in this study. To obtain a global result, the error values for each Sentinel 2 band are averaged using the results for all the time series. The error does not present a clear trend for the month under study. In addition, to provide dispersion results, the standard deviation is also calculated.
The results obtained from the methodology presented in this work correlate greatly with the ground truth data. The error and standard deviation ranges from 0.39 ± 0.23 m in the B2 band to 0.20 ± 0.17 m in the B8 band. As can be observed in Figure 6, the B8 band shows the higher difference between the water–sand reflectance which makes the edge detection during the image processing part of the methodology robust. The error results are relatively close to other values obtained from satellite altimetry techniques which range between 10–20 cm [15,18].
Figure 9 shows that the technique gives some underestimation of peaks and overestimation of minimum values. There is no compelling reason why this may have occurred, although it could be due to the low resolution of the Sentinel 2 imagery in the horizontal plane (10 m). This means that the movements of the water mass at the edge lower than its magnitude cannot be detected, with the consequent impact on the height measurement.
The methodology shows some limitations derived from the cloud cover, making it impossible to obtain the water-land interface imagery from the Sentinel 2 satellite. Future works could improve the methodology using a multi-satellite approach. This approach could combine the current Sentinel 2 imagery with Sentinel 1 data, which provide robust information independent of cloud coverage. In addition, the spatial resolution and the consequent accuracy of height evaluation can be improved using satellites with higher spatial resolution (non-free imagery). Thus, higher temporal frequency of data and lower height value error can be achieved. Future research could also estimate the sensitivity of the method to the grey level threshold calculation during the image binarization process.

4. Conclusions

A methodology for the evaluation of height value of water reservoirs was developed. It is based on the combination of free data from Sentinel 2 imagery and digital elevation models from aerial LiDAR, provided by national cartographic institutes.
The methodology combines image processing and LiDAR data processing. Four Sentinel 2 bands are used for the study (B2, B3, B4, and B8). The best results appear for the infrared band B8, which depicts an error of 0.20 m and standard deviation of 0.17 m.
The methodology could be easily automatized to provide continuous monitoring. Its results are of special interest for remote water reservoirs, where it is difficult to establish and maintain in situ sensing systems. In addition, a spatial resolution of 10 m is more adequate for medium to small water reservoirs than other satellite tools, which use an active topography instrument (i.e., the Sentinel 3 satellite with a resolution of 300 m).

Author Contributions

H.G.-J. participate in the conceptualization of the manuscript, writing and review, L.M.G.-d., J.M.-S. and A.S.-R. in the development of the methodology and software implementations and H.L. in the formal analysis, discussion and conclusions.

Funding

This work was partially funded by the Spanish Ministry of Interior (Grant SPIP2017-02122), Spanish Ministry of Economy, Industry and Competitiveness (Grants: EUIN2017-87598; TIN2016-77158-C4-2-R, RTC-2016-5257-7). The support of Xunta de Galicia through grant ED431C2016-038 is acknowledged.

Acknowledgments

The authors specially acknowledge the support provided by the Hydrographic Miño-Sil Confederation.

Conflicts of Interest

The authors declare no conflict of interest.

References

  1. Hydrographic Miño-Sil Confederation. Available online: https://www.chminosil.es/es/ (accessed on 28 May 2018).
  2. Tauro, F.; Selker, J.; van de Giesen, N.; Abrate, T.; Uijlenhoet, R.; Porfiri, M.; Manfreda, S.; Caylor, K.; Moramarco, T.; Benveniste, J.; et al. Measurements and Observations in the XXI century (MOXXI): Innovation and multidisciplinarity to sense the hydrological cycle. Hydrol. Sci. J. 2018, 63, 169–196. [Google Scholar] [CrossRef]
  3. George, D.D. The airborne remote sensing of phytoplankton chlorophyll in the lakes and tarns of the English Lake District. Int. J. Remote Sens. 1997, 18, 1961–1975. [Google Scholar] [CrossRef]
  4. Dekker, A.G.; Vos, R.J.; Peters, S.W.M. Comparison of remote sensing data, model results and in situ data for total suspended matter (TSM) in the southern Frisian lakes. Sci. Total Environ. 2001, 268, 197–214. [Google Scholar] [CrossRef]
  5. Sawaya, K.E.; Olmanson, L.G.; Heinert, N.J.; Brezonik, P.L.; Bauer, M.E. Extending satellite remote sensing to local scales: Land and water resource monitoring using high-resolution imagery. Remote Sens. Environ. 2003, 88, 144–156. [Google Scholar] [CrossRef]
  6. Bandini, F.; JAkobsen, J.; Olesen, D.; Reyna-Gutierrez, J.A.; Bauer-Gottwein, P. Measuring water level in rivers and lakes from lightweight Unmanned Aerial Vehicles. J. Hydrol. 2017, 548, 237–250. [Google Scholar] [CrossRef]
  7. Manfreda, S.; McCabe, M.; Miller, P.; Lucas, R.; Madrigal, V.P.; Mallinis, G.; Ben Dor, E.; Helman, D.; Estes, L.; Ciraolo, G.; et al. On the use of unmanned aerial systems for environmental monitoring. Remote Sens. 2018, 10, 641. [Google Scholar] [CrossRef]
  8. European Space Agency. Available online: http://www.esa.int/ESA (accessed on 28 May 2018).
  9. NASA. Available online: https://www.nasa.gov/ (accessed on 28 May 2018).
  10. Zibordi, G.; Mélin, F.; Berthon, J.F. A time-series of above-water radiometric measurements for coastal water monitoring and remote sensing product validation. IEEE Geosci. Remote Sens. Lett. 2006, 3, 120–124. [Google Scholar] [CrossRef]
  11. Leifer, I.; Lehr, W.J.; Simecek-Beatty, D.; Bradley, E.; Clark, R.; Dennison, P.; Hu, Y.; Matheson, S.; Jones, C.E.; Holt, B.; et al. State of the art satellite and airborne marine oil spill remote Sensing: Application to the BP Deepwater Horizon oil spill. Remote Sens. Environ. 2012, 124, 185–209. [Google Scholar] [CrossRef]
  12. Feng, L.; Hu, C.; Chen, X.; Cai, X.; Tian, L.; Gan, W. Assessment of inundation changes of Poyang Lake using MODIS observations between 2000 and 2010. Remote Sens. Environ. 2012, 121, 80–92. [Google Scholar] [CrossRef]
  13. Maximenko, N.; Hafner, J.; Niiler, P. Pathway of marine debris derived from trajectories of Lagrangian drifters. Mar. Pollut. Bull. 2012, 65, 51–62. [Google Scholar] [CrossRef] [PubMed]
  14. Tarpanelli, A.; Brocca, L.; Barbetta, S.; Faruolo, M.; Lacaba, T.; Moramarco, T. Coupling MODIS and Radar altimetry data for discharge estimation in poorly gauge driver basins. IEEE J. Sel. Top. Appl. Earth Obs. Remote Sens. 2015, 8, 141–148. [Google Scholar] [CrossRef]
  15. Birkett, C.M. Contribution of the TOPEX NASA radar altimeter to the global monitoring of large rivers and wetlands. Water Resour. Res. 1998, 34, 1223–1239. [Google Scholar] [CrossRef]
  16. Frappart, F.; Calmant, S.; Cauhopé, M.; Seyler, F.; Cazenave, A. Preliminary results of ENVISAT RA-2-derived water levels validation over the Amazon basin. Remote Sens. Environ. 2006, 100, 252–264. [Google Scholar] [CrossRef] [Green Version]
  17. Crétaux, J.F.; Jelinski, W.; Calmant, S.; Kouraev, A.; Vuglinski, V.; Bergé-Nguyen, M.; Gennero, M.C.; Nino, F.; Abarca del Rio, E.; Cazenave, A.; Maisongrande, P. SOLS: A lake database to monitor in the Near Real Time water level and storage variations from remote sensing data. Adv. Space Res. 2011, 47, 1497–1507. [Google Scholar] [CrossRef]
  18. Hall, A.C.; Schumann, G.J.P.; Bamber, J.L.; Bates, P.D.; Trigg, M.A. Geodetic corrections to Amazon river water level gauges using ICESat altimetry. Water Resour. Res. 2012, 48, W06602. [Google Scholar] [CrossRef]
  19. Zhang, G.; Yao, T.; Xie, H.; Zhang, K.; Zhu, F. Lakes state and abundance across the Tibetan Plateau. Chin. Sci. Bull. 2014, 59, 3010–3021. [Google Scholar] [CrossRef]
  20. Zhang, G.; Yao, T.; Shum, C.K.; Yi, S.; Yang, K.; Xie, H.; Feng, W.; Bolch, T.; Wang, L.; Behrangi, A.; et al. Lake volume and groundwater storage variations in Tibetan Plaeau’s endorheic basin. Geophys. Res. Lett. 2017, 44, 5550–5560. [Google Scholar] [CrossRef]
  21. Crétaux, J.F.; Abarca del Río, R.; Mergé-Nguyen, M.; Arsen, A.; Drolon, V.; Clos, G.; Maisongrande, P. Lake volumen monitoring from space. Surv. Geophys. 2016, 37, 269–305. [Google Scholar] [CrossRef]
  22. Sentinel 3. Available online: http://www.esa.int/Our_Activities/Observing_the_Earth/Copernicus/Sentinel-3/Instruments (accessed on 28 May 2018).
  23. Spanish Geographic Institute. Available online: http://centrodedescargas.cnig.es/CentroDescargas/locale?request_locale=en (accessed on 28 May 2018).
  24. Sentinel 2 Satellite. Available online: http://www.esa.int/Our_Activities/Observing_the_Earth/Copernicus/Sentinel-2 (accessed on 28 May 2018).
  25. Copernicus Programme. Available online: http://www.copernicus.eu/ (accessed on 28 May 2018).
  26. Copernicus Open Access Hub. Available online: https://scihub.copernicus.eu/ (accessed on 28 May 2018).
  27. Snap Software. Available online: http://step.esa.int/main/toolboxes/snap/ (accessed on 28 May 2018).
  28. QGIS Software. Available online: https://www.qgis.org/en/site/ (accessed on May 28 2018).
  29. Cloud Compare Software. Available online: http://cloudcompare.org/ (accessed on 28 May 2018).
  30. Matlab Software. Available online: https://www.mathworks.com/products/matlab.html (accessed on 28 May 2018).
  31. Otsu, N. Threshold selection method from gray-level histrograms. IEEE Trans. Syst. Man Cybern. 1979, 9, 62–66. [Google Scholar] [CrossRef]
  32. Duda, R.; Hart, P. Pattern Classification and Scene Analysis; John Wiley Sons: Hoboken, NJ, USA, 1973; pp. 271–272. [Google Scholar]
Figure 1. Location of As Conchas water reservoir. Image source is Spanish Geographic Institute [23]. Authors highlight with a red square the area of interest of As Conchas water reservoir.
Remotesensing 10 00902 g001
Figure 2. LiDAR point cloud around the As Conchas water reservoir. Underwater terrain zones with no-data appear as black points in the figure. The image is obtained from Cloud Compare software. The scale is presented in metres at bottom right.
Remotesensing 10 00902 g002
Figure 3. Sentinel 2 image from As Conchas water reservoir (red highlighted) at 24 December 2017. Band B4. In the imagery, water appears as black and sand as white.
Remotesensing 10 00902 g003
Figure 4. Algorithm workflow.
Remotesensing 10 00902 g004
Figure 5. Region of interest (ROI) (red square). Band B8. X and Y are UTM (universal trasverse Mercator) coordinates (H29).
Remotesensing 10 00902 g005
Figure 6. Reflectance change in bands B2, B3, B4, and B8.
Remotesensing 10 00902 g006
Figure 7. Edge detection process that finds the limit between water and sand.
Remotesensing 10 00902 g007
Figure 8. Water-land limit interfacing (green) in an ROI (red) satellite image. Band B8.
Remotesensing 10 00902 g008
Figure 9. Height values obtained from B2, B3, B4, and B8 Sentinel imagery.
Remotesensing 10 00902 g009
Table 1. Average error and standard deviation of the results.
B2B3B4B8
Average error (m)0.390.360.330.20
Standard deviation (m)0.230.280.250.17

