Article

Evaluation of a Bayesian Algorithm to Detect Burned Areas in the Canary Islands’ Dry Woodlands and Forests Ecoregion Using MODIS Data

by
Francisco Guindos-Rojas
1,
Manuel Arbelo
2,*,
José R. García-Lázaro
1,
José A. Moreno-Ruiz
1 and
Pedro A. Hernández-Leal
2
1
Department of Informatics, University of Almería, 04120 La Cañada de San Urbano, Spain
2
Departamento de Física, Universidad de La Laguna, 38200 San Cristóbal de La Laguna, Spain
*
Author to whom correspondence should be addressed.
Remote Sens. 2018, 10(5), 789; https://doi.org/10.3390/rs10050789
Submission received: 11 April 2018 / Revised: 14 May 2018 / Accepted: 17 May 2018 / Published: 19 May 2018
(This article belongs to the Special Issue Remote Sensing of Wildfire)

Abstract

:
Burned Area (BA) is deemed as a primary variable to understand the Earth’s climate system. Satellite remote sensing data have allowed for the development of various burned area detection algorithms that have been globally applied to and assessed in diverse ecosystems, ranging from tropical to boreal. In this paper, we present a Bayesian algorithm (BY-MODIS) that detects burned areas in a time series of Moderate Resolution Imaging Spectroradiometer (MODIS) images from 2002 to 2012 of the Canary Islands’ dry woodlands and forests ecoregion (Spain). Based on daily image products MODIS, MOD09GQ (250 m), and MOD11A1 (1 km), the surface spectral reflectance and the land surface temperature, respectively, 10 day composites were built using the maximum temperature criterion. Variables used in BY-MODIS were the Global Environment Monitoring Index (GEMI) and Burn Boreal Forest Index (BBFI), alongside the NIR spectral band, all of which refer to the previous year and the year the fire took place in. Reference polygons for the 14 fires exceeding 100 hectares and identified within the period under analysis were developed using both post-fire LANDSAT images and official information from the forest fires national database by the Ministry of Agriculture and Fisheries, Food and Environment of Spain (MAPAMA). The results obtained by BY-MODIS can be compared to those by official burned area products, MCD45A1 and MCD64A1. Despite that the best overall results correspond to MCD64A1, BY-MODIS proved to be an alternative for burned area mapping in the Canary Islands, a region with a great topographic complexity and diverse types of ecosystems. The total burned area detected by the BY-MODIS classifier was 64.9% of the MAPAMA reference data, and 78.6% according to data obtained from the LANDSAT images, with the lowest average commission error (11%) out of the three products and a correlation (R2) of 0.82. The Bayesian algorithm—originally developed to detect burned areas in North American boreal forests using AVHRR archival data Long-Term Data Record—can be successfully applied to a lower latitude forest ecosystem totally different from the boreal ecosystem and using daily time series of satellite images from MODIS with a 250 m spatial resolution, as long as a set of training areas adequately characterising the dynamics of the forest canopy affected by the fire is defined.

1. Introduction

As a recurring natural process, fire has been a basic element in preserving the health and biodiversity of numerous terrestrial ecosystems for thousands of years [1,2,3]. However, any alteration to this nature-driven dynamic, due either to direct anthropogenic actions or as a result of global warming, can give rise to situations where fire can become a significant disturbance for many ecosystems, causing feedbacks on global warming, regionally and globally, in turn. Prominent amongst said disturbances are the loss of biodiversity due to the decimation of species and biomass [2]; soil deterioration and erosion which, alongside the change in land cover (terrestrial albedo) [4,5], alter water and energy flows; and the emission of large amounts of aerosols and greenhouse gases affecting the carbon cycle and global warming [6,7,8,9]. For all the above, several international climate research teams—chiefly members of the Global Climate Observing System (GCOS)—have identified Fire Disturbance as an Essential Climate Variable (ECV) that critically contributes to the characterization of Earth’s climate.
The Fire Disturbance ECV consists of three variables: Burned Area, Active Fires and Fire Radiated Power [10]. Amongst them, Burned Area is deemed the main variable [11] and, therefore, its tracking becomes imperative, in order to forecast and understand the Earth’s climate evolution, as well as to take the necessary steps to mitigate its negative effects. But Burned Area maps are also necessary in other applications of vital interest to our society as an early warning fire alert system; the fire hazard assessment for ecosystems management; the study of changes in atmospheric chemistry; and in biogeochemical modelling and that of the vegetation dynamics at a global scale [12].
It is not easy to gather time-consistent Burned Area data for periods exceeding 30 years for climate-related studies. Only sensors onboard the Earth observation satellites—primarily polar orbit satellites, which boast better spatial resolution (≤1000 m) than the geostationary orbit ones (>1000 m)—could provide images of areas affected by the fire at a local, regional, and global level, allowing for the registry of their distribution and occurrence patterns [13].
Of all remote sensors, the only one that has been taking daily images of our planet from the early 1980s is Advanced Very High Resolution Radiometer (AVHRR) onboard the series of NOAA (National Oceanic and Atmospheric Administration) satellites, whose data have made it possible to develop various algorithms to assess fire effects [14,15,16,17,18,19,20,21,22,23]. Other widely used sensors in Burned Area mapping at a regional and global level have been VEGETATION (VGT) onboard SPOT (Systeme Pour I’Observation de la Terre) 4 and 5 satellites [24,25,26,27], and Moderate Resolution Imaging Spectrometer (MODIS) onboard NASA’s Terra and Aqua satellites. MODIS, with excellent temporal resolution (12 h) owing to the combination of two satellites, spectral resolution (36 bands) and spatial resolution (250–1000 m), has allowed for the development of various Burned Area detection algorithms that have been globally applied to and assessed in diverse ecosystems, ranging from tropical to boreal [28,29,30,31,32,33,34].
For local Burned Area studies, sensors with a 30 m spatial resolution, such as those of Landsat Project—a joint initiative between the U.S.A. Geological Survey (USGS) and NASA—are normally used. These include Landsat 5 TM (Thematic Mapper) from March 1984 to November 2012; Landsat 7 ETM (Enhance Thematic Mapper) since 1999, still operational; and Landsat 8 OLI (Optical Land Imager) and TIRS (Thermal Infrared Sensor), in orbit since 11 February 2013 [35]. Landsat images have also been traditionally used to validate Burned Area algorithms developed with sensors showing coarser spatial resolution [26,28,36,37,38,39,40,41,42,43].
There are several global Burned Area products obtained from the data provided by remote sensors [12,44]. These products are free to access, but not all them are operational or cover long temporal series despite the sensors used having had or having a longer lifespan. This is the case of GBS (Global Burned Surfaces) [45], which is limited to the 1982–1999 period. GBS used Pathfinder AVHRR Land (PAL) data at an 8 km spatial resolution. Based on another sensor, SPOT-VGT, we find three Burned Area products: GBA2000 [46], specifically designed for the year 2000; L3JRC [47], available for the April 2000–March 2007 period; and GEOLAND2 [48], based on the previous two and with data available from April 1999 to March 2014. GEOLAND2 has currently been adapted to sensor PROBA-V, with a 300 m spatial resolution. PROBA-V’s spectral bands are similar to those of the VGT, thereby preserving an observational consistency with its predecessor. Two other Burned Area products from European satellites were GLOBCARBON, obtained through a combination of the VGT sensor and the ATSR instrument (Along Track Scanning Radiometer) [49] for the April 1998–December 2007 period, and GLOBSCAR, from ATSR-2 images [50].
Two of the most reliable global Burned Area products, MCD45A1 [51] and MCD64A1 [52], have been generated from MODIS Aqua and Terra images, with maps made available from the year 2000 onwards. Both are monthly Level 3 gridded 500 m products containing per-pixel burning and quality information, and tile-level metadata. Another product that has been using MODIS data from the year 2000 is Global Fire Emissions Database (GFED) [31], which estimates Burned Area and monthly emissions of various fire types with a 0.25° latitude by 0.25° longitude spatial resolution. GFED have available data from 1997 through to the present, for which reason it is regarded as the longest Burned Area temporal series [31]. Active fire data from the Tropical Rainfall Measuring Mission (TRMM) Visible and Infrared Scanner (VIRS), and the Along-Track Scanning Radiometer (ATSR) were used to get GFED where MODIS data was not available yet [53].
Finally, it is worth mentioning the European Project Fire_cci’s Burned Area dataset [12]. Fire_cci Burned Area has been obtained by combining temporal changes in reflectance from Medium Resolution Imaging Spectrometer (MERIS) onboard the ESA ENVISAT satellite and thermal information on active fires from MODIS, for the years 2005 to 2011, as monthly composites. The main advantage of the Burned Area Fire_cci product could be the improvement in detection of small fires by increasing the spatial resolution to 300 m with respect to MODIS Burned Area products [43]. In a second stage, Fire_cci will cover the time series 2000–2017, with a spatial resolution between 250 and 500 m, depending on the sensor being used [54].
Studies comparing the accuracy of global Burned Area products, discussed in the previous paragraphs, prove that there are appreciable differences between them in many regions of our planet [12,23,31,33,43,55,56]. This way, using these products in applications at a local or regional level calls for previously validated studies in order to know the exact commission and omission errors and decide whether or not they may be used as input data for climate models and vegetation dynamics in line with the current requirements. It is hard to connect globally developed algorithms for a specific sensor with the various ecosystems affected by fires at different latitudes.
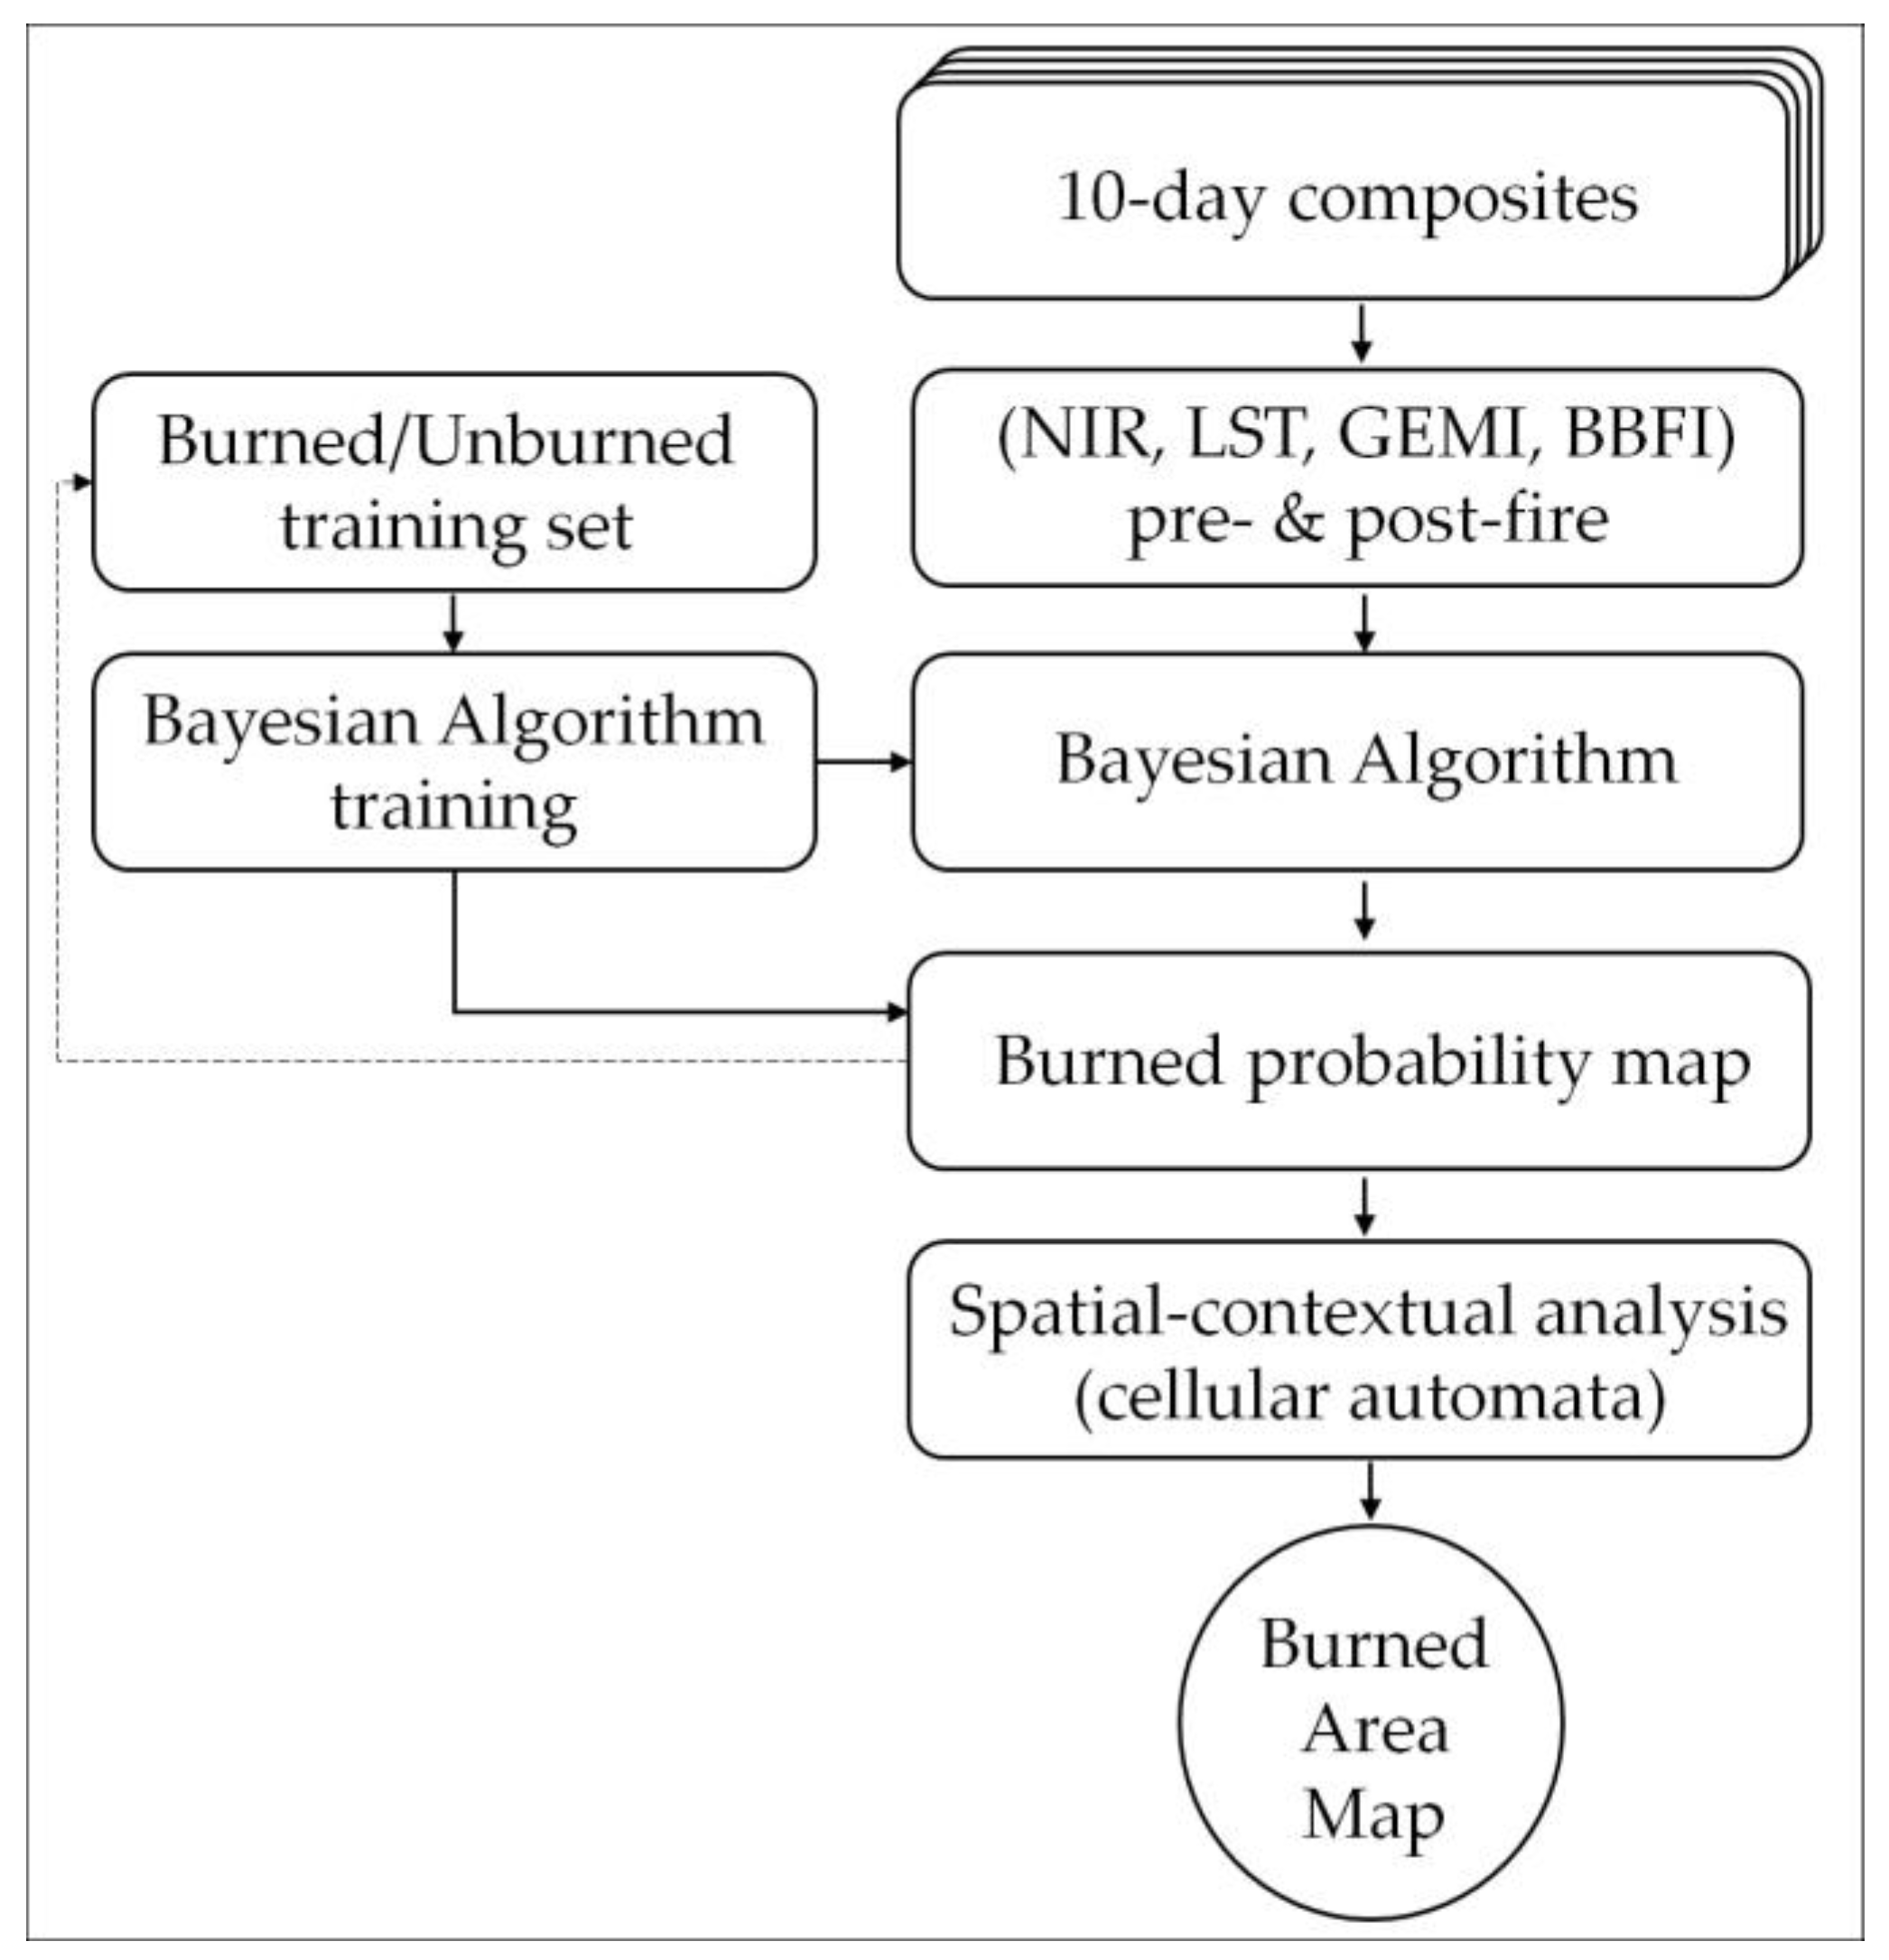
An algorithm for mapping Burned Area in boreal forests was developed as part of a researching project supported in part by the Spanish Ministry of Science and Innovation [23]. It used AVHRR archival data Long Term Data Record (LTDR) version 3, with 0.05° of spatial resolution and was applied to western Canada for the period between 1984 and 1999. Fire event records from Canadian Forest Service National Fire Database (CFSNFD) were used to train the algorithm. The kernel of the algorithm is a Bayesian network classifier, combined with absolute and relative radiometric thresholds, and a post-processing step (neighbourhood analysis) for spatial fire coherence. A chain of software tools was built in order to implement the algorithm and automate the processing from the daily images in their original format to 10 day Burned Area maps. The algorithm was successfully evaluated against reference data and with Burned Area records generated from 1 km AVHRR data by [22]. The same Bayesian network algorithm was applied to mapping Burned Area in the North American boreal region for the years 1984–1998 using the AVHRR-LTDR dataset version 3, and two training sites (Western Canada and Alaska). The results showed an overall good agreement compared to reference maps derived from CFSNFD and Alaska Fire Service (AFS), and comparable results for both training sites [57]. Later, a Burned Area time series (2001–2011) for North America from the MODIS-LTDR dataset version 3 was successfully built as a continuation of the previous time series applying the same methodology, but using the MODIS Brightness Temperature from band 31 T31 (11.03 μm) instead of the AVHRR Top of Atmosphere Brightness Temperature from band 3 (3.7 μm). The results obtained were even better than those derived from other Burned Area products, with higher spatial resolution (MCD45A1 and GEOLAND2) in terms of spatial and temporal accuracy, and comparable with the MCD64A1 Burned Area product [58].
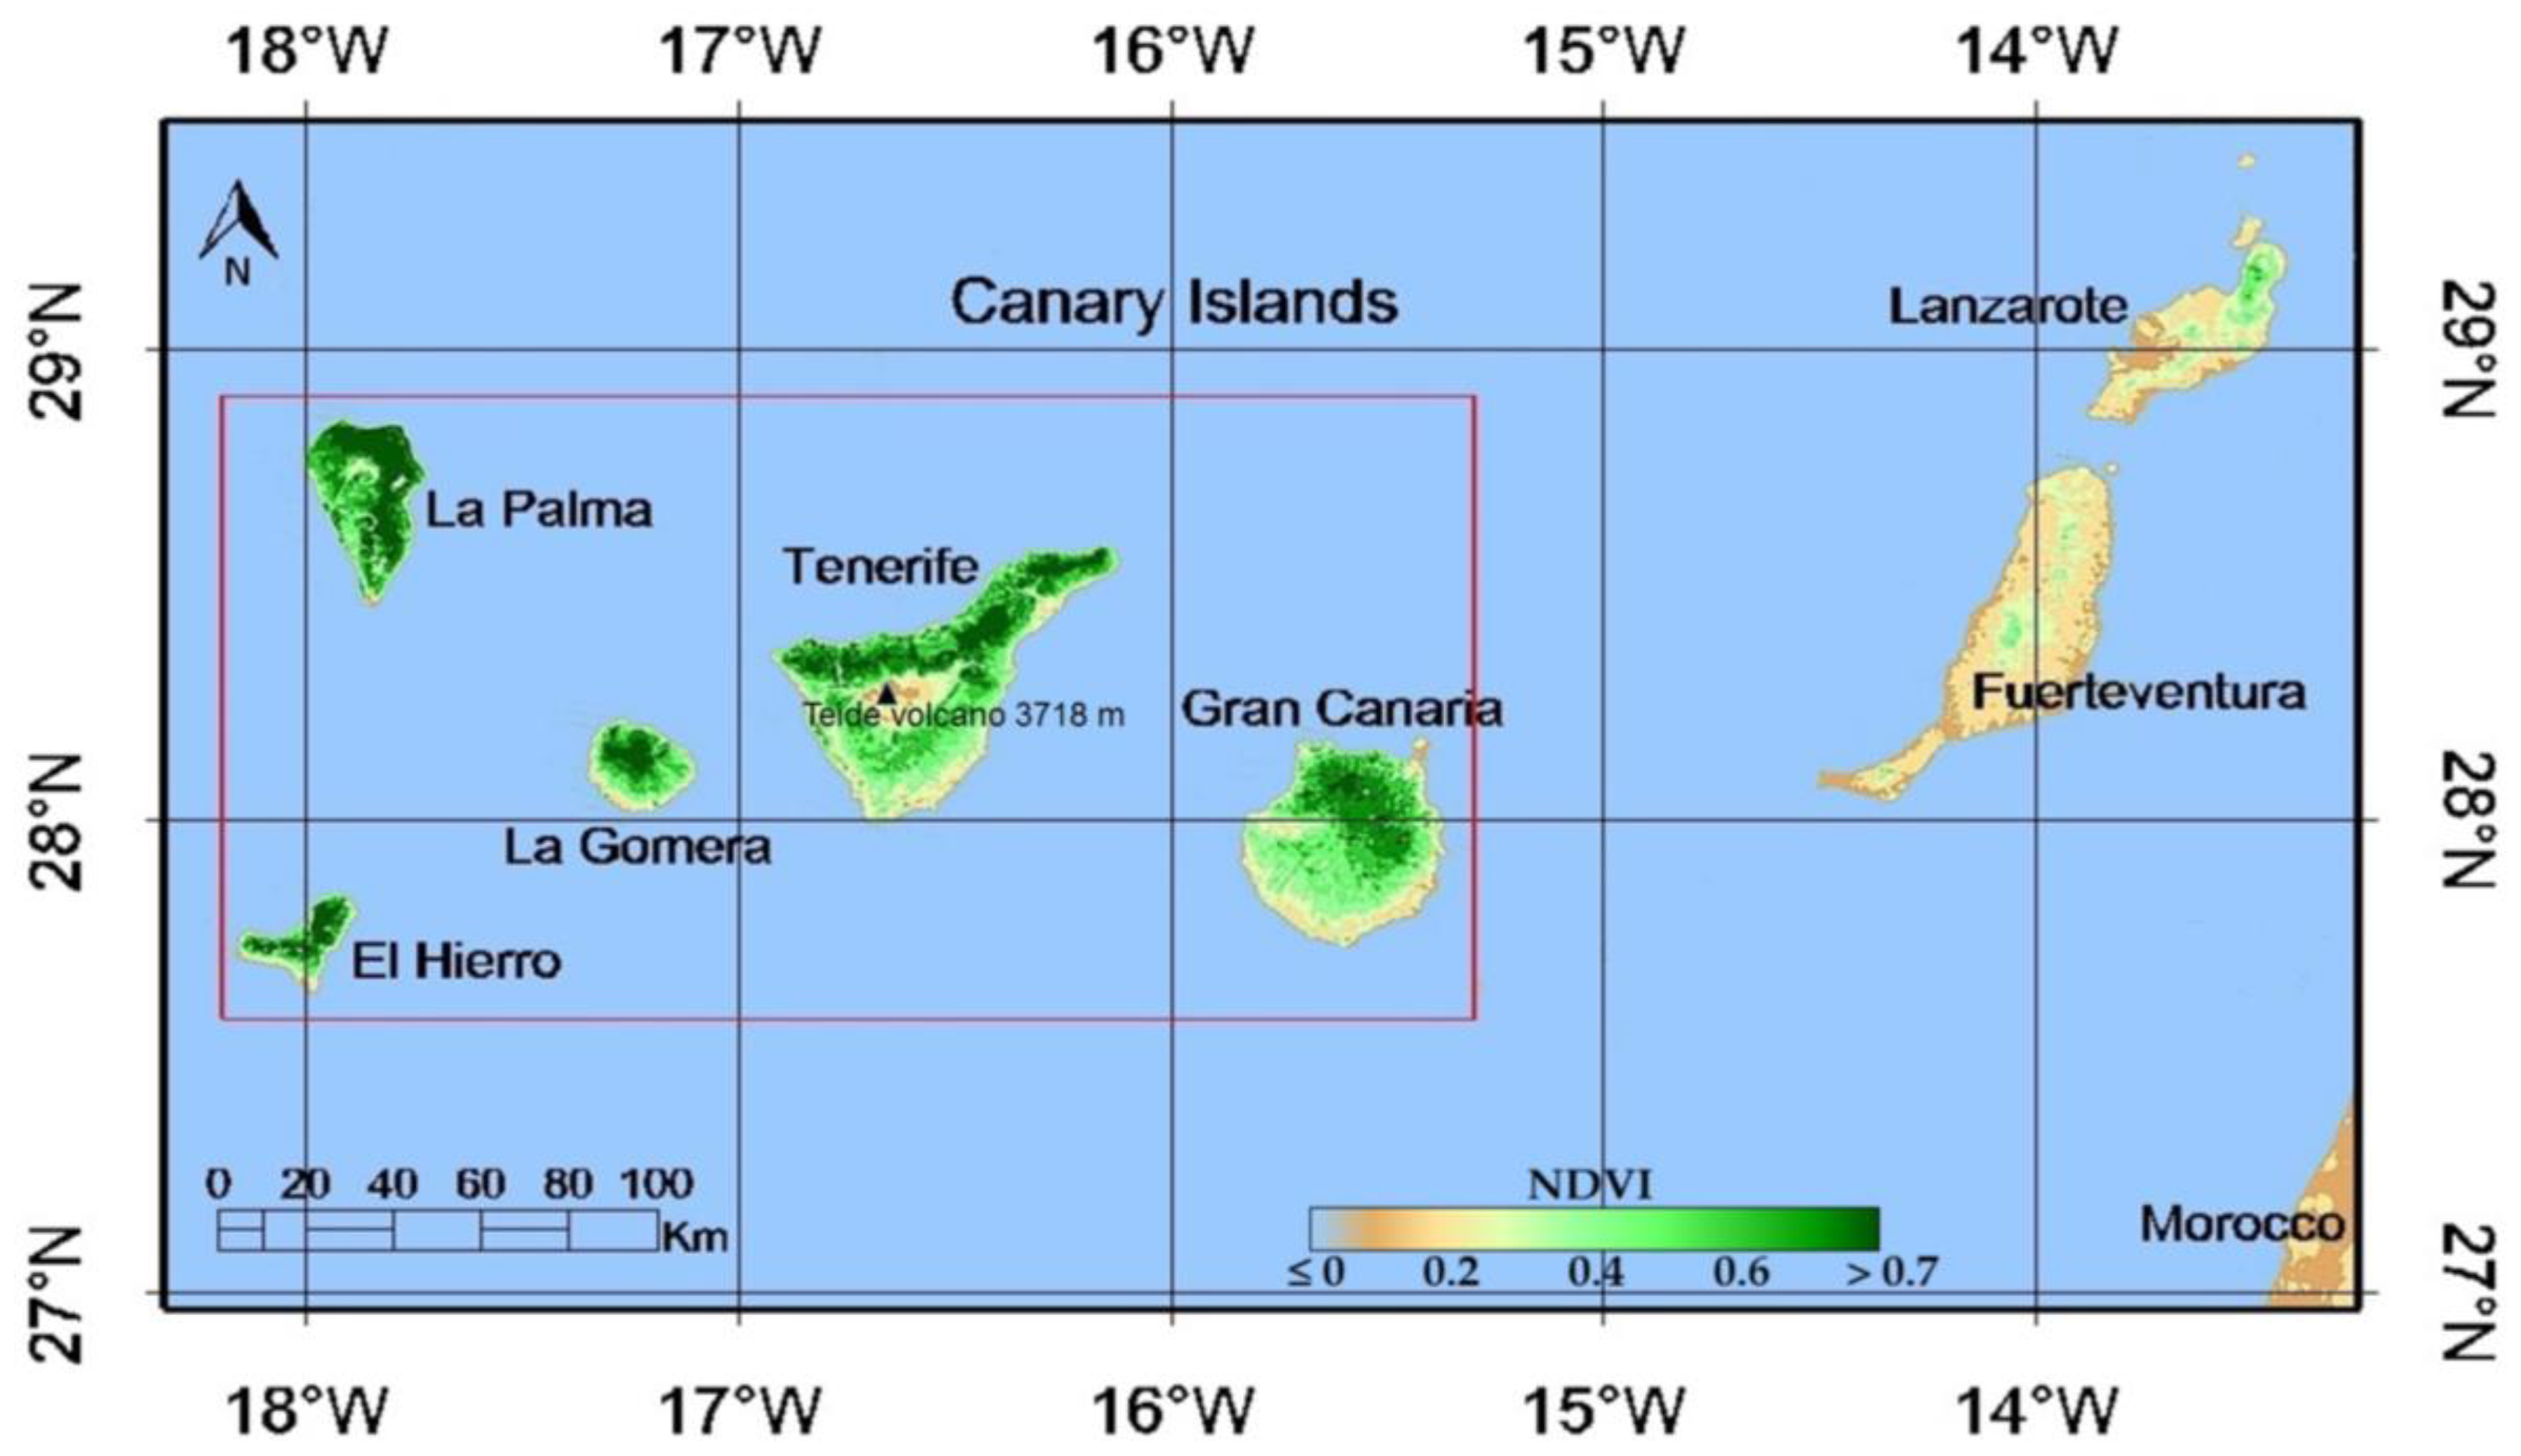
This paper presents the application of the above methodology [23,57,58] to a lower latitude forest ecosystem, totally different from the boreal ecosystem and using daily time series of satellite images from MODIS with a 250 m spatial resolution. The main objectives are: (i) to build a 10 day composite time series of MODIS satellite images using the maximum surface temperature criterion, for the 2002–2012 period in a Mediterranean forest region (the Canary Islands); (ii) to generate Burned Area maps corresponding to the study region using the methodology based on the Bayesian classifier and the same variables, although modifying the values of its parameters by training with reference data extracted from official fire records and post-fire Landsat images; and (iii) to assess the spatial and temporal accuracy of the detected Burned Area with reference data, and to compare the results with those of the official MODIS Burned Area products with analogous spatial resolution (MCD45A1 and MCD64A1).

2. Materials and Methods

2.1. Study Area

The study area included the five western islands of the Canarian Archipelago (Spain) (29°N, 18°W; 27.50°N, 15°W): Tenerife, La Palma, La Gomera, El Hierro, and Gran Canaria (Figure 1). These volcanic islands have a particularly rich biodiversity that supports a wide variety of endemic taxa produced by evolutionary processes due to isolation [59]. The five islands form a small terrestrial ecoregion [60] known as the “Canary Islands’ dry woodlands and forests” [61]. Despite its name, in the northern slope of these islands, and favoured by the north-eastern humid wind regime, the trade winds, there is a humid forest known as “Laurisilva” (laurel forest). This forest is comprised of tree species of the laurel family endemic to subtropical climates, which is regarded as one of the most interesting ecosystems in the Canary Islands, and an heirloom of Tertiary forests in the Mediterranean basin.
In the western Canary Islands, as in other zones with Mediterranean climate, forest fires are a constant worry. Summers with very low precipitation and high daytime temperatures reduce humidity and promote the spread of fires resulting from both natural and man-made causes. Canarian endemic pine forests (Pinus canariensis), located in the northern side above 1200 and up to 2100 m of altitude, and between 700 and up to 2300 m in the southern side, are the plant association most affected by those fires. However, fires also affect the endemic Macaronesian heaths (fayal-brezal) and “Laurisilva”. Only the pines and heaths have a remarkable ability to regenerate after the fire [62,63,64]. As for the rest, being comprised of species not adapted to fire, it could take decades to regain its natural balance.

2.2. Burned Area Information from MAPAMA

Given the complex topography of the Canary Islands, with its many ravines and altitudes ranging between sea level up to 3700 m in the island of Tenerife, combined with weather conditions occurring in summer, the fires are very difficult to control, have a great destructive power, and, therefore, have the potential to burn large areas. According to data from the Ministry of Agriculture and Fisheries, Food and Environment of Spain (MAPAMA) [65], large forest fires (LFF) affecting areas over 100 ha have been increasingly frequent in the region over the last two decades. We must emphasize that during the period studied, between 2002 and 2012, there have been only 14 fires of over 100 ha (Table 1), representing less than 1% of the 1319 occurred. Nevertheless, they have burned 97.35% (55,571.20 ha) (Table 2) of the total affected forest area (57,085.04 ha) in this period. In addition, there have been several fires in the same year, and at the same time, but on different islands, as seen in 2007 and 2012. The year 2007 holds the annual affected area historical record, with 35,758.62 ha in Tenerife and Gran Canaria. On the other hand, in 2012, although the area affected was less than half (12,135.88 ha), there was a notable difference from previous episodes. This year, four LFF burned between 752 and 6512 ha in three of the western islands simultaneously, two in La Palma, one in Tenerife and another one in La Gomera, where the Garajonay National Park—declared a UNESCO World Heritage Site owing to an ecosystem with as high a natural value as Laurisilva—was burning for 86 days (Table 1).

2.3. Data and Pre-Processing

Two daily image products, MOD09GQ and MOD11A1, derived from the Terra-MODIS sensor, were downloaded from http://modis.gsfc.nasa.gov for the study area and the 2002–2012 period. The MOD09GQ provides the surface spectral reflectance corrected for atmospheric conditions of band 1/RED (sur_refl_b01_1) and band 2/NIR (sur_refl_b02_1), with a spatial resolution of 250 m, and from MOD11A1 original files land surface temperatures (LST_Day_1km), were extracted. This information was used for the construction of daily files in geoTiff format with a band structure similar to that of the LTDR files [66] (Table 3). The sinusoidal projection of the original data was transformed to a UTM-28N projection with the nearest neighbouring resampling, an output pixel size of 0.0025° (250 m) and WGS-84 datum. Daily reflectances and temperature bands were combined with their respective quality indicators (QC) to obtain a quality indicator layer according to the LTDR criterion [66]. Scaling factors were applied to each of them to obtain the daily files in band sequential format (BSQ) of signed 16 bit integer. Finally, composite images of 10 days were generated with the criterion of maximum surface temperature [67,68] considering the QC for filtering out invalid values in measurements. The Modis Reprojection Tool retrieved from https://lpdaac.usgs.gov/tools/modis_reprojection_tool and IDL®, a product of Exelis Visual Information Solutions, Inc., (Boulder, Colorado, USA) were used in the preprocessing.

2.3.1. Reference Data of Burned Area

The first cloud-free post-fire images collected by the series of Landsat sensors with a spatial resolution of 30 m (Table 4), together with the Burned Area registered by MAPAMA [65], were both used as reference data. MAPAMA Burned Area maps are usually made with GPS by mean of fieldwork and, for the greatest fires, using aerial orthophotos with 50 cm resolution. The polygons of all the fires greater than 100 ha that occurred from 2002 to 2012 were used to produce the annual vector layers of ground truth. Next, these vector layers were reprojected to a UTM-28N projection with a 250 m × 250 m pixel size to generate annual ground truth maps. In order to determine how the pixel is assigned a burned/non-burned value, the maximum area method within the pixel was used [69].

2.3.2. MODIS Burned Area Products: MCD45A1 and MCD64A1

In order to compare the results obtained by the methodology proposed in this paper (Section 3.2) with the official Burned Area products derived from the MODIS sensor, the MCD64A1 Version 6 [70] and MCD45A1 Version 5.1 monthly subset were downloaded for the 2002–2012 period. These monthly maps were reprojected to UTM-28N projection with a 500 m × 500 m pixel size and resized to the study area, and finally combined to generate the annual maps of burned/non-burned pixels. MODIS Burned Area Products used are briefly described below.
•  MCD64A1 Version 6
This product is generated using an improved version of the MCD64 Burned Area mapping algorithm [52]. MCD64A1 is derived from a group of daily active fires with a 1 km spatial resolution and daily land surface reflectances of 1, 5, and 7 spectral bands with 500 m spatial resolution. The algorithm uses a ratio spectral index of channels 5 and 7 [71]) as a primary indicator. This Vegetation Index (VI) detects an immediate decrease in band 5 reflectance after a burn, in comparison with minor changes in band 7, being a good discriminator between burned and non-burned pixels. The synergy algorithm applies dynamic thresholds to composite imagery generated by VI and a measure of temporal texture. Cumulative active fire maps are used to guide the selection of burned and non-burned training samples and to guide the specification of prior probabilities [31].
•  MCD45A1 Version 5.1
MCD45A1 has a spatial resolution of 500 m and a time resolution of one month. Unlike MCD64A1, do not use the active fire observations as input data in its algorithm. MCD45A1 employs a change detection algorithm based on a BRDF (bi-directional reflectance distribution function) model [72]. The algorithm calculates the difference between the observed BRDF and the predicted BRFD in the near and middle infrared channels at the viewing and illuminating angles of the observation. The decision about a pixel being burned is based on a threshold. This method maps the approximate date of burning by locating pixels showing rapid change in daily surface reflectance time series data over an entire year.

2.4. Bayesian Algorithm to Detect Burned Area

The methodology proposed by Moreno-Ruiz et al. [23] based on a Bayesian algorithm, was adapted and applied to the study region to obtain annual maps of burned areas and their temporal distribution. This methodology is formed by a series of stages displayed in Figure 2. In order to carry them out, a software tool allowing for effective implementation and its integration into a process chain has been developed. The stages are as described below:
  • Pre-processing of MOD09GQ and MOD11A1 time series used for building the daily set of images with the same format as the LTDR dataset (see previous section).
  • Classification scheme: In order to sense a Burned Area at the pixel level, a dichotomous classification scheme was used, the thematic classes under consideration being Burned and Non-Burned.
  • Building a set of training cases: The algorithm was trained for the Burned class with 152 supervised burned pixels from a fire of 6512 ha occurred in the south of the island of Tenerife in the year 2012. For the Non-Burned class, we used 450 non-burned pixels from nearby regions.
  • A choice of an optimal set of variables: Variables that best sensed the change in every one of the chosen pixels for the year the fire occurred in, the previous and the following years were determined, with a 2 month period for pre-fire and post-fire each year, based on the hypothetical date of ignition. The start of the fires is determined by the maximum value of the Burn Boreal Forest Index (BBFI) derived from the NIR and LST bands (Table 3), whose expression is [23] BBFI = (1/NIR + LST/2).
    The study of fire evolution radiometric behaviour and its connection with the potential indexes eventually led to the choice of 12 variables falling under 3 categories:
    • In order to sense pixels of the Non-Burned class (with vegetation or bare ground) the year before the fire, variables measuring the differences in the GEMI [73], BBFI, and NIR indexes, means between the post-fire period of the year the fire occurred in and the previous year were used, as well as the maximum value of the BBFI index for the year before the fire. GEMI is formulated as GEMI = ɳ(1 − 0.25ɳ) − (RED − 0.125)/(l − RED) where ɳ = [2(NIR2 − RED2) + 1.5NIR + 0.5RED]/(NIR + RED + 0.5) [73].
    • For the detection of pixels whose Burned class remained in this class in the year after the fire, we used the variables that measure the maximum of BBFI and LST in the year after the fire, together with the difference of the medians of the GEMI index between the year of the fire and the year after.
    • For the detection of pixels whose class was Burned with vegetation in the year of the fire, we used the variables that measured the maxima of BBFI, GEMI, and LST, respectively, and the minimum of NIR in the year of the fire, and the differences of the medians of GEMI before and after the fire in the year of the fire.
  • Design of the classification algorithm: Based on the selected training cases set, a data file with a format compatible with the WEKA software package from the University of Haikato (New Zealand) [74] was constructed. The value for each variable appears together with the thematic class to which it belongs (Burned or Non-Burned). Resulting from the application of the Bayes-Net classifier in the WEKA set to the training cases set, an algorithm allowing for determination of the likelihood for a pixel to belong to a given class, based on partial probabilities of each of the variables under consideration, is obtained. Based on the minimum commission and omission errors that are obtained from the classification of the training set itself—through a process of refinement of training cases—the classification model is chosen and applied on the dataset in its totality, obtaining a map of probabilities; each variable has an associated probability depending on the class to which it belongs (Burned, Non-Burned). The probability map is obtained by normalizing the joint probability of all variables, taking as positive those belonging to the Burned class and, as negative, those in the Non-Burned class. In order to connect the probability ranges with the thematic classes—Burned and Non-Burned—a discretisation was conducted by adjusting the total number of burned pixels on the grounds of a given probability of the Burned Area estimation obtained in the study area. In this case, we have used the criterion that only pixels with a positive probability are deemed burned.
  • Post-processing: To improve the result, in the post-processing stage we require spatial coherence using a filtering process based on the theory of cellular automata [75]. Cellular automata have previously been applied to improve the results of satellite image mapping [76,77]. Starting with an initial classification state based on burned probabilities, a series of transition rules are applied repeatedly until a final state is reached. Pixels with probabilities greater than 0.90 were labelled as Burned; pixels with probabilities between 0.00 and 0.90 were labelled as Partially-Burned; otherwise they were labelled as Unburned. The transition rules chosen were:
    • A pixel whose class is Burned remains in its status if it has at least one neighbour classified as Burned or Partially-Burned. Otherwise, its status becomes Partially-Burned.
    • A pixel whose class was Partially-Burned moves through to the Burned status if it has at least one neighbour classified as Burned, and two or more neighbours classified as Partially-Burned. Otherwise, its status becomes Unburned.
    • A pixel whose class was Unburned cannot change its status.
Finally, all pixels labelled as Burned or Partially-Burned were considered as Burned pixels.
The ten-day Burned Area maps with 250 m spatial resolution in a UTM-28N projection were generated by the Bayesian network algorithm from the daily images. Then, these maps were combined to generate the annual maps of Burned/Non-Burned pixels.

2.5. Accuracy Assessment of the Estimates of Burned Area

All annual maps (BA products and reference) were clipped to the defined study area and masked with coastline boundaries for every island. The maps were resized to a UTM-28N projection with a 250 m × 250 m pixel size to compute the spatial and temporal accuracy. The temporal accuracy of each product has been assessed considering the total annual Burned Area calculated in the process. To assess the spatial accuracy, the Burned Area proportion of each product map versus the reference map was calculated on a grid of 2.5 km × 2.5 km cells evenly distributed over the entire study area. A simple regression analysis of these proportions was carried out [39]. Then, the error matrix and commission and omission errors [78] were computed considering a 2.5 km pixel size [33] to prevent georeference-derived errors.
Lastly, the efficiency in the detection of fires greater than 2000 ha which occurred during the study period was assessed for each Burned Area product. A set of subscenes measuring 30 km × 30 km that included, at their centre, one of these large burned areas for all of the products and reference data was developed. The total amount of BA was computed for each subscene. The detection of a minimum of 10% of burned pixels inside a subscene, with respect to the reference data, was the criterion considered to identify the presence of a large BA.

3. Results

3.1. Burned Area Distribution in the Period 2002–2012

Table 5 shows the total area sensed by the proposed Bayesian algorithm (hereinafter called BY-MODIS) and official MODIS Burned Area products. For the period under consideration, fourteen registered fires are indicated in the studied area. The total BA estimated over the entire study period for each of these BY-MODIS, MCD45A1, and MCD64A1 products was 36,050, 36,900, 42,850 ha, respectively, and 45,856 ha for LANDSAT. The correlation coefficient between the annual Burned Area estimates for each product in relation to the reference data in the period considered was 0.94, 0.98, 0.98, and 0.99, respectively.
The MCD64A1 product sensed the largest Burned Area, despite not being able to sense any of the smaller fires (2003, 2005_1, 2007_2, 2008, and 2012_5). MCD45A1 failed to detect the fire labelled as 2005_1, and barely 25 ha out of a total 306 ha burned in 2012_5. Regarding BY-MODIS, it must be noted it failed to sense the fire occurred in the island of El Hierro in 2006 and, in line with official MODIS products, it had trouble sensing the fire 2005_1, despite estimating a Burned Area close to 20% of the reference total (130 ha). On the other hand, we observed an overestimation in three Burned Area detections for MCD64A1 (fires 2006, 2009, and 2012_2), three for MCD45A1 (fires 2003, 2007_2, and 2009), and three for BY-MODIS (fires 2003, 2009, and 2012_2).
When spatial distribution of the burned areas was analysed by islands (Table 6), the biggest differences in relative percentages found corresponded to the islands of El Hierro and Gran Canaria. In the first case, MCD64A1 estimated close to a 92% of the reference data, whereas other products showed an underestimation around 30%. For Gran Canaria, MCD64A1 recorded a good estimation of the Burned Area (79.6%). Conversely, both BY-MODIS and MCD45A1 only sensed around 40%. Results are comparable to those for the remaining islands.
Regarding temporal distribution of fires for the 2002–2012 period, and considering the MAPAMA reference data, a rather uneven distribution was found. The year 2007 exhibited the highest fire activity (35,612.17 ha) followed by the year 2012, whereas the years 2002, 2004, 2010, and 2011 did not register any fires. Along with the reference data and BA derived from Landsat imagery, Figure 3 shows the annual distribution of the total BA in the western Canary Islands from 2002 to 2012 for the products under analysis.

3.2. Spatial Accuracy of the Burned Area Products

The results of the accuracy of the BA estimate obtained from the scatter plots of the various products versus the reference map using a 2.5 km × 2.5 km grid are shown in Table 7. The determination coefficient (R2) over the 2002–2012 period for the BY-MODIS, MCD45A1, and MCD64A1 products was 0.82, 0.81, and 0.88, with a slope of 0.76, 0.81, and 0.93, respectively.
Regarding the errors derived from the confusion matrix for each year (Table 8), the average commission errors for the BY-MODIS, MCD45A1, and MCD64A1 products were 0.11, 0.13, and 0.12, whereas the omission errors were 0.30, 0.28, and 0.18, respectively.

3.3. Detection of Fires Greater than 2000 ha

Table 9 shows the results of the study of the various 30 km × 30 km subscenes containing all fires greater than 2000 ha that were recorded in the 2002–2012 period in the Canary Islands. The total BA encompassed by all these subscenes was 50,175 ha (approximately 90% of the total area burned across the study area in that period). The BA recorded was less than 10% in none of the subscenes of each product, and was greater than 100% in the 2009 subscene of all products. The average relative percentage of Burned Area estimated for Landsat images was 83%. We now proceed to describe the rest of products below.
MCD64A1 detected the largest total Burned Area of the six large fires recorded (78.18% over the reference data), followed by MCD45A1 (69.36%), and BY-MODIS (66.73%). MCD64A1 achieved the best results in three of them (2007_1, 2012_1, and 2012_3), BY-MODIS in two (2009 and 2012_4) and MCD45A1 in one (2007_3). On the other hand, BY-MODIS and MCD45A1 got the worst results in the 2007_1 fire, which has the largest amount of Burned Area, detecting around 40% of the Burned Area. For the MCD64A1 product, the result diverging the furthest from the reference value corresponded to fire 2007_3—the second in terms of Burned Area—detecting around 54% of the Burned Area. Also noteworthy is that this product showed the biggest overestimation in the year 2009, about 23% of the Burned Area.
The spatial distribution of the burned pixels for the BY-MODIS, MCD45A1, and MCD64A1 products (in their native resolution) for each of the considered subscenes and the Landsat perimeter are shown in Figure 4.

4. Discussion

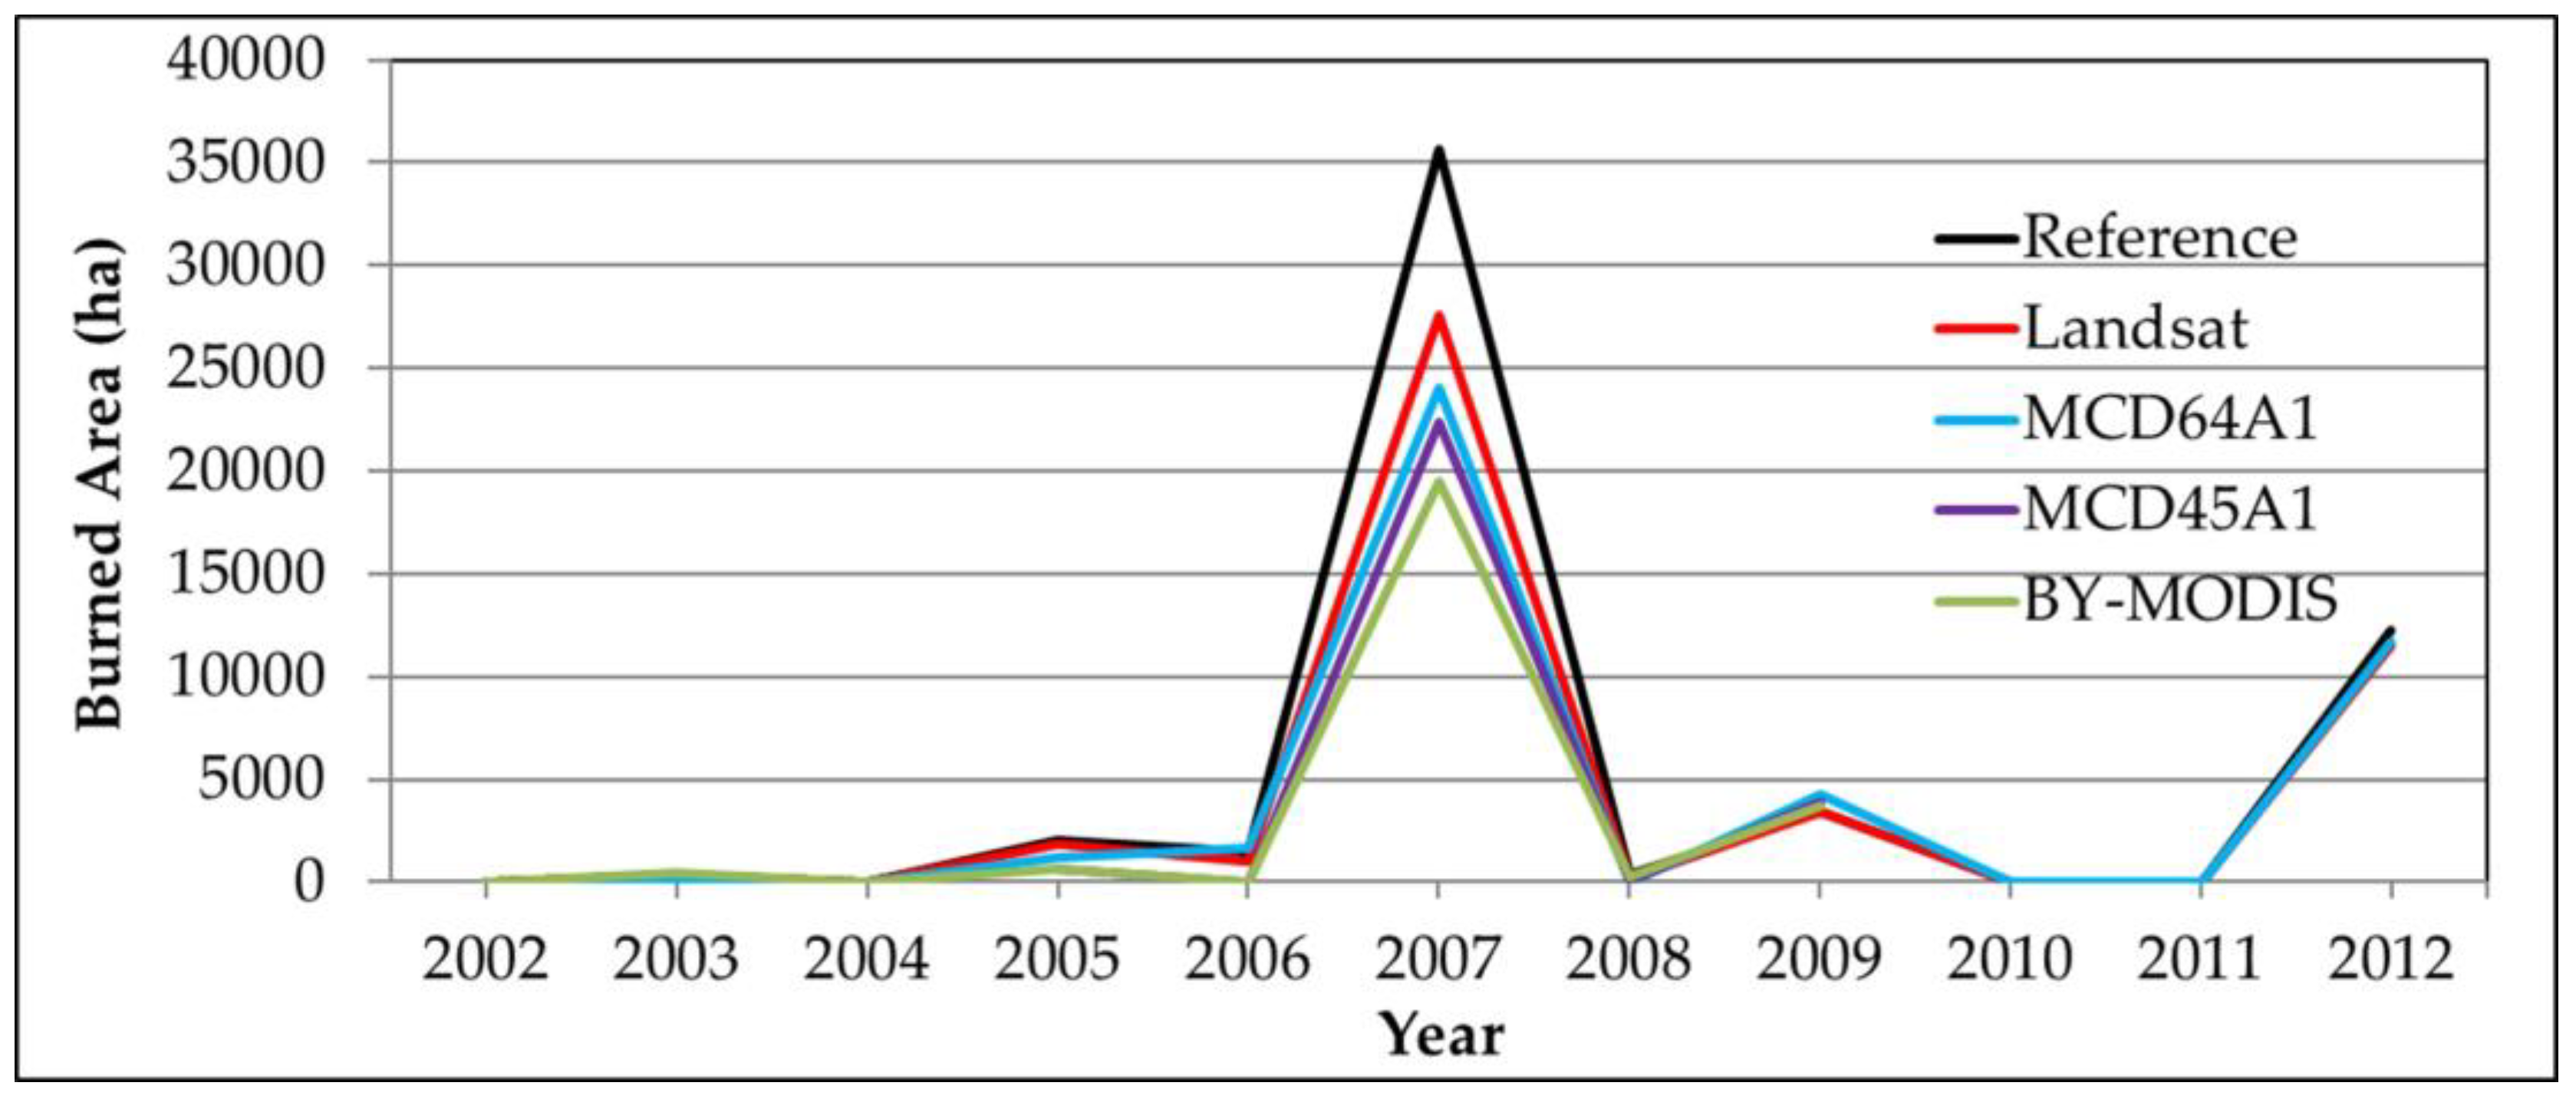
All products, BY-MODIS, MCD45A1, and MCD64A1, including LANDSAT, underestimated the total Burned Area for the set of fourteen fires over 100 ha recorded in the study region for the 2002–2012 period. The difference between the total Burned Area according to MAPAMA and the LANDSAT polygons may be due to the existence of islands of unburned vegetation in the official product, but also to the construction of the LANDSAT polygons with images that, in some cases, differ months from the date of the fire. Regardless of the algorithmic strategy used to tell burned and non-burned pixels apart, all methods are normally designed to be as accurate as possible; that it to say, to obtain low commission errors, even if that means omitting a larger number of burned pixels [39,79]. In this respect, results of this study are in agreement with most previous published works using MODIS data for various regions and ecosystems [33,34,39,58,80,81,82,83,84,85,86,87,88]. However, a great variability was found in Burned Area percentages detected by the products under consideration for the various fires (Table 5 and Table 6).
There are no precedents in the literature about the use of MODIS Burned Area products in the Canary Islands region to analyse a historical series of over ten years, such as the one discussed in this work. Only a few studies have been published on the two large fires that occurred simultaneously in 2007 in Tenerife and Gran Canaria [89,90]. For this reason, our results were compared and discussed with works conducted on Mediterranean ecosystems similar to the Canary Islands and those that included fires in regions of topographic complexity. We cannot ignore the fact that the five western islands of the Canarian Archipelago historically affected by forest fires show a highly rugged terrain of a volcanic origin, with numerous narrow ravines scoring them radially which, in many cases, may disguise the correct sensing of burned areas with the spatial resolution of MODIS products [34,91].
Analysis of the temporal accuracy proved that annual distribution of Burned Area for the BY-MODIS, MCD45A1, and MCD64A1 products shows a good correlation with the reference set, resulting in determination coefficients (R2) of 0.82, 0.81, and 0.88, respectively (Table 7). Similarly to results found by Moreno-Ruiz et al. [58] in the North American Boreal Forest, the year 2006 presented the biggest errors, both in terms of accuracy (Table 7) and spatial precision (Table 8), for the BY-MODIS and MCD45A1 products. By contrast, 2006 was found to be one of the years with the best results for the MCD64A1 product. This fact can be observed in the fire that occurred in the island of El Hierro in September 2006 (Table 5, Table 7 and Table 8). In this case, both BY-MODIS and MCD45A1, with omission errors greater than 98%, were hardly able to sense a single burned pixel within the fire polygon, compared to MCD64A1, with only a 2% omission error and a 24% commission error, possibly due to the identification of isolated regions of bare volcanic ground as burned areas. The use of active fires in the MCD64A1 provides very valuable information to correctly estimate the Burned Area in such cases, where the affected vegetation is basically comprised of Canarian pine trees (conifers) with a forest canopy cover ranging from 60% to 90% and under water stress. Three consecutive months without rainfall and with hot temperatures, alongside intense and long-lasting southerly winds (information retrieved from http://www.aemet.es/es/lineas_de_interes/datos_y_estadistica), led to a relative humidity lower than 20% (whereas, under normal conditions, it exceeds 70%), which made it easier for the fire to spread in just six hours. This situation makes it harder for BY-MODIS or MCD45A1 products, which are based on algorithms seeking to sense drastic changes in post-fire reflectances, to be effective for this fire. Tsela et al. [82] obtained comparable results for pine forest plantations in Sabie (South Africa), with omission errors exceeding 80%.
The year 2005 failed to record satisfactory results for either of the products, with omission errors of 39% for MCD64A1 and of 69% for MCD45A1. The fire dominating statistics for this year corresponded to the one in the north of the island of La Palma, with a 1890 ha Burned Area, according to official figures. The fire affected an area of approximately 7 km long, west-to-east, by 3 km long, north-to-south, but with an altitude variation of over 1000 m in the latter—from 1000 to 2000 m above the sea level—and essentially burned the Canarian pine forest in the lower part and brushwood in the higher part. The steep land, with a highly rugged terrain and deep ravines filled with shade areas, made it difficult to map the Burned Area for all products, as other authors previously pointed out in a mountainous area of Northwest Yunnan (China) [34] or for the fynbos, a Mediterranean shrubland of the southwestern area of South Africa [85,92]. The same argument would be valid to explain big commission and omission errors (Table 8) for the only fire occurred during the year 2008. The 376 affected hectares were located in the north of the island of La Gomera. The area shows a highly heterogeneous coverage, including numerous farming allotments, brushwood, palm trees and heaths located on a topographically complex terrain, making its modelling in two dimensions—using MODIS sensors’ spatial resolution—difficult.
In regard to spatial accuracy of the burned areas estimates, the overall linear regression slope between the results for the BY-MODIS, MCD64A1, and MCD45A1 products, and the reference dataset (Table 7) were similar, with values of 0.76, 0.93, and 0.81, respectively, and are also in line with the results obtained by [79] for the MCD45A1 product. These authors [79] validated MCD45A1 in six different regions with Mediterranean ecosystems in the year 2003. They obtained a commission error of 17.4%, and an omission error of 38.6%, with a 0.79 slope and a 0.84 determination coefficient. However, these results are a long way from the validations conducted by authors [41] for the MCD45 product for Mediterranean Forest biome, with characteristics similar to those of our case study, with commission errors of 69% and omission errors of 95%.
In general, BY-MODIS and MCD45A1 commission and omission errors are similar, but slightly different to those of MCD64A1. The total omission error for the MCD64A1 was around 10% lower than in the other two products. Those results are comparable to those obtained by the authors in the boreal forest region of North America using the same BA algorithm on daily images from the LTDR dataset [33,57].
Another noteworthy difference of the MCD64A1 product with respect to BY-MODIS and MCD45A1 was its difficulty to sense small fires. This product failed to identify a single pixel as burned in the five fires with fewer than 400 ha. Similar findings were reported by Tsela et al. [82], who suggested the combination of the two MODIS BA products (MCD45A1 and MCD64A1) would improve detection of small burned scars in South Africa. Fornacca et al. [34] also report the worse performance of MCD64A1 in the detection of small burned areas in the mountainous region of Yunnan (China) in the years 2006 and 2009, compared to the product that does not use active fires (MCD45A1).
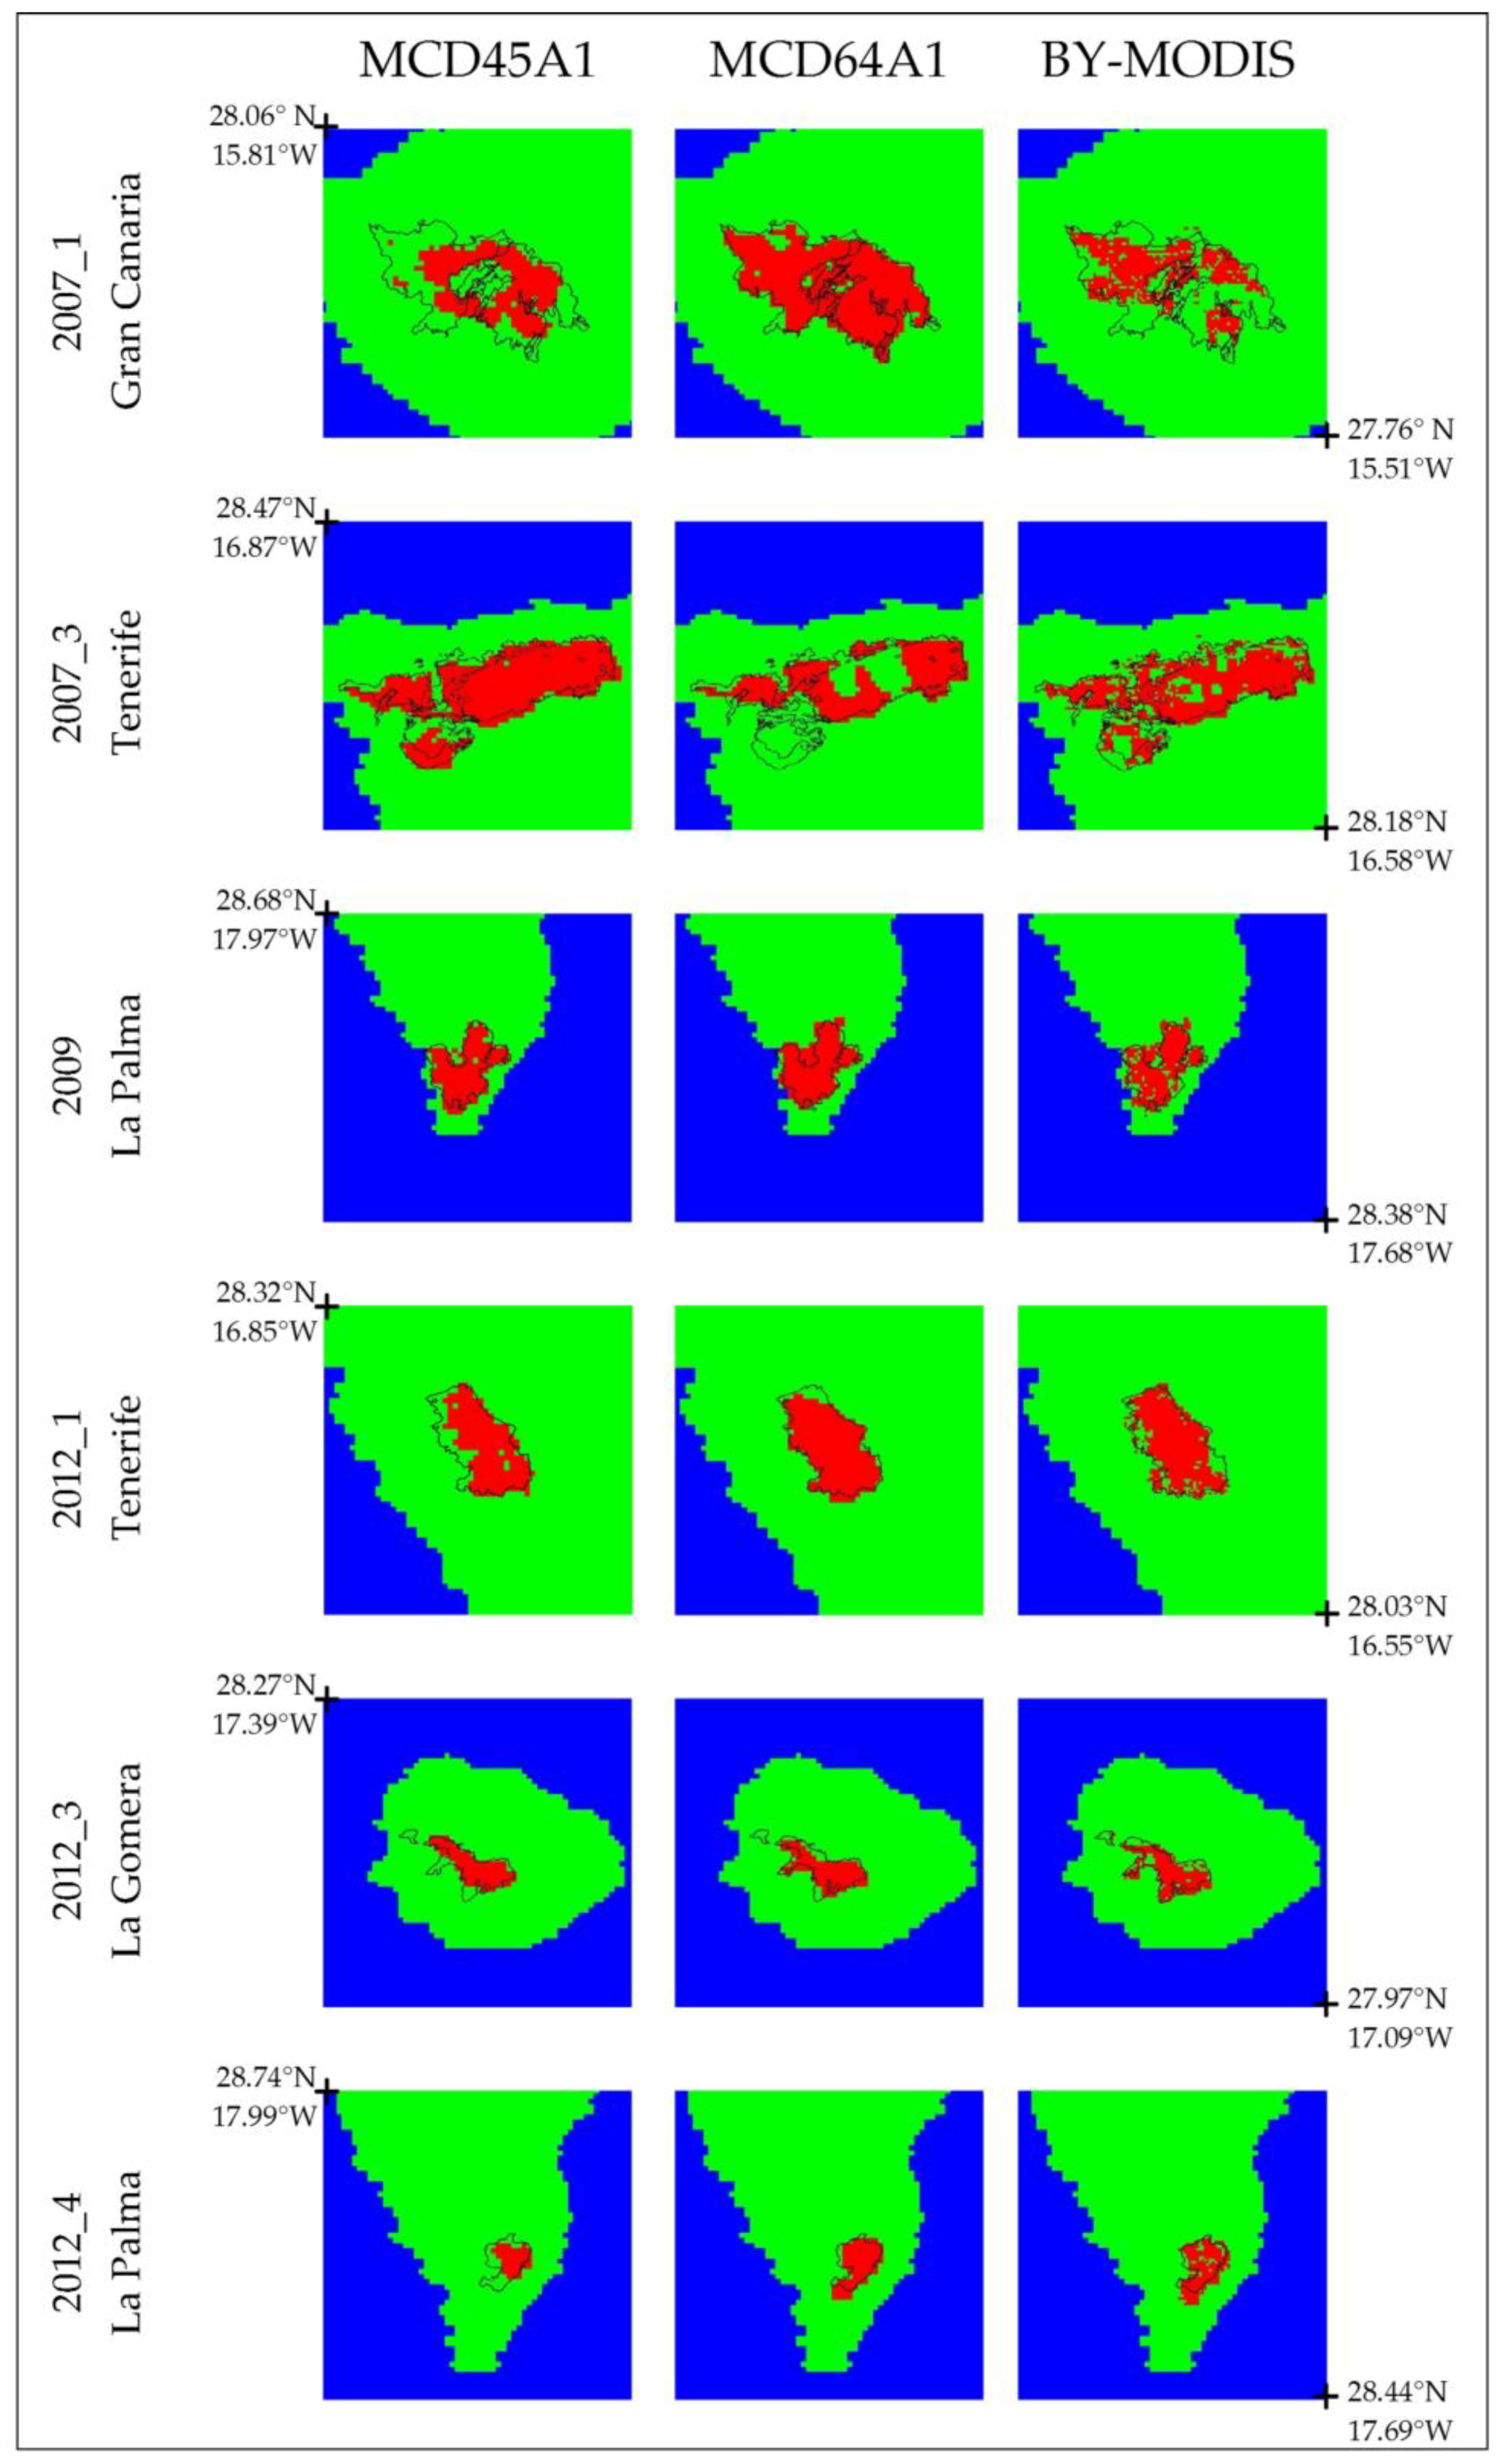
For the largest fires (>2000 ha), although the best total performance corresponded to the MCD64A1 product in both, in the estimated accuracy and spatial precision, we observe a high variability for the Burned Area detected for these fires (Figure 4, Table 9). For the 2007_1 fire—the largest fire, greater than 18,000 ha—MCD64A1 obtained the best Burned Area estimation, twice above the other BA products, which led to an unavoidable bias in favour of this product in global statistics (Table 9). In this case, the Burned Area mainly corresponded to herbaceous and non-wooded vegetation by 63%. The fire took place in the southern slope of the island of Gran Canaria, an area with little forest coverage which is very arid all year round. Once again, the MCD64A1 methodology with active fires allowed for a better total estimation according to the reference set, compared to the other two products. Conversely, for the second largest fire, the 2007_3, which took place mainly in the northern slope of the island of Tenerife, largely affecting a dense and wet Canarian pine tree forest, both BY-MODIS and MCD45A1 improved on MCD64A1 results. The cause could be rooted in the thick smoke and steam produced during biomass combustion, preventing active fires in the central part of the Burned Area from being recorded. There were no remarkable differences between the three products for the remaining big fires.

5. Conclusions

We have evaluated a Bayesian Algorithm (BY-MODIS) to detect burned areas in the Canary Islands’ dry woodlands and forests ecoregion using daily time series of satellite images from MODIS with a 250 m spatial resolution. The results obtained by BY-MODIS were compared with MODIS databased Burned Area products MCD64A1 Version 6 and MCD45A1 Version 5.1 for the 2002–2012 period. This is the first study dedicated to mapping burned areas for such a long period of time in this particular region.
Despite these islands’ topographic complexity and the diverse type of ecosystems affected by the fire found in such a small and fragmented territory, BY-MODIS and the other two products are capable of offering good temporal accuracy when assessed with reference datasets, resulting in determination coefficients (R2) of 0.82, 0.81, and 0.88, for the BY-MODIS, MCD45A1, and MCD64A1, respectively. In regard to spatial accuracy, the Burned Area was underestimated in all products. However, the results should be separated according to the size of the fires. For fires bigger than 2000 ha, the best total performance corresponded to the MCD64A1 product outperforming the other two products by approximately 10%. The use of active fires seems to provide very valuable information to correctly estimate the Burned Area in such cases. On the other hand, the MCD64A1 could not detect any of the five fires with less than 400 ha, being BY-MODIS, the algorithm with the best estimated accuracy and spatial precision in this case. BY-MODIS and MCD45A1 products, which are based on algorithms seeking to sense drastic changes in post-fire reflectances, are effective for these small fires. Taking into account both spatial accuracy in fires of any size and its applicability to the assorted sizes within the period under consideration, BY-MODIS can be regarded as a reliable alternative to MCD54A1 and MCD64A1 products.
The results of this study prove the capacity to adapt and the versatility of a Bayesian algorithm—previously developed and successfully applied to regions in the boreal forest—in other regions showing different ecosystems and satellite images with diverse spatial resolution, as long as a set of training areas adequately characterising the dynamics of the forest canopy affected by the fire is defined.

Author Contributions

J.R.G.-L. and J.A.M.-R. conceived and designed the methodology; F.G.-R. applied the methodology and obtained the results. All authors analyzed and discussed the results. M.A. in collaboration with the rest of authors wrote and contributed to the editing of the manuscript.

Funding

This research was funded by the Spanish Ministry of Economy and Competitiveness through the coordinated project CGL2013-48202-C02-02.

Acknowledgments

We wish to thank the peer reviewers for their valuable comments and suggestions. We acknowledge the use of data products or imagery from the Land, Atmosphere Near real-time Capability for EOS (LANCE) system operated by the NASA/GSFC/Earth Science Data and Information System (ESDIS) with funding provided by NASA/HQ. The MODIS and LANDSAT imagery were courtesy of the NASA EOSDIS Land Processes Distributed Active Archive Center (LP DAAC), USGS/Earth Resources Observation and Science (EROS) Center, Sioux Falls, South Dakota.

Conflicts of Interest

The authors declare no conflict of interest.

References

  1. Pausas, J.G.; Keeley, J.E. A burning story: The role of fire in the history of life. Bioscience 2009, 59, 593–601. [Google Scholar] [CrossRef] [Green Version]
  2. Shlisky, A.; Waugh, J.; Gonzalez, P.; Gonzalez, M.; Manta, M.; Santoso, H.; Alvarado, E.; Ainuddin Nuruddin, A.; Rodríguez-Trejo, D.A.; Swaty, R.; et al. Fire, Ecosystems and People: Threats and Strategies for Global Biodiversity Conservation; GFI Technical Report 2007-2; The Nature Conservancy: Arlington, VA, USA, 2007. [Google Scholar]
  3. Harrison, S.P.; Marlon, J.R.; Bartlein, P.J. Fire in the Earth System. Changing Climates, Earth Systems and Society; Dodson, J., Ed.; Springer: Dordrecht, The Netherlands, 2010; pp. 21–48. [Google Scholar]
  4. Beck, P.S.; Goetz, S.J.; Mack, M.C.; Alexander, H.D.; Jin, Y.; Randerson, J.T.; Loranty, M. The impacts and implications of an intensifying fire regime on Alaskan boreal forest composition and albedo. Glob. Chang. Biol. 2011, 17, 2853–2866. [Google Scholar] [CrossRef]
  5. Rocha, A.V.; Shaver, G.R. Postfire energy exchange in arctic tundra: The importance and climatic implications of burn severity. Glob. Chang. Biol. 2011, 17, 2831–2841. [Google Scholar] [CrossRef]
  6. Kasischke, E.S.; Christensen, N.L.; Stocks, B.J. Fire, global warming, and the carbon balance of boreal forests. Ecol. Appl. 1995, 5, 437–451. [Google Scholar] [CrossRef]
  7. Randerson, J.T.; van der Werf, G.R.; Collatz, G.J.; Giglio, L.; Still, C.J.; Kasibhatla, P.; Miller, J.B.; White, J.W.C.; DeFries, R.S.; Kasischke, E.S. Fire emissions from C-3 and C-4 vegetation and their influence on interannual variability of atmospheric CO2 and delta (CO2)-C-13. Glob. Biogeochem. Cycles 2005, 19, 1–13. [Google Scholar] [CrossRef]
  8. DeFries, R.S.; Morton, D.C.; van der Werf, G.R.; Giglio, L.; Collatz, G.J.; Randerson, J.T.; Houghton, R.A.; Kasibhatla, P.K.; Shimabukuro, Y. Fire-related carbon emissions from land use transitions in southern Amazonia. Geophys. Res. Lett. 2008, 35. [Google Scholar] [CrossRef]
  9. Van der Werf, G.R.; Randerson, J.T.; Giglio, L.; Gobron, N.; Dolman, A.J. Climate controls on the variability of fires in the tropics and subtropics. Glob. Biogeochem. Cycles 2008, 22. [Google Scholar] [CrossRef]
  10. Csiszar, I.A.; Arino, O.; Geraci, R.; Giglio, L.; Goldammer, J.G.; de Groot, W.; Justice, C.O.; Kondragunta, S.; Prins, E.; Sessa, R.; et al. Fire: Fire Disturbance, ECV-T13: GTOS Assessment of the Status of the Development of the Standards for the Terrestrial Essential Climate Variables: Rome, Global Terrestrial Observing System. 2009, p. 38. Available online: http://www.fao.org/gtos/doc/ecvs/t13/t13.pdf (accessed on 2 April 2018).
  11. GCOS. Systematic Observation Requirements for Satellite-Based Products for Climate, 2011 Update. WMO GCOS Rep. 154. 2011. Available online: https://library.wmo.int/opac/doc_num.php?explnum_id=3710 (accessed on 2 April 2018).
  12. Mouillot, F.; Schultz, M.G.; Yue, C.; Cadule, P.; Tansey, K.; Ciais, P.; Chuvieco, E. Ten years of global burned area products from spaceborne remote sensing—A review: Analysis of user needs and recommendations for future developments. Int. J. Appl. Earth Obs. Geoinform. 2014, 26, 64–79. [Google Scholar] [CrossRef]
  13. Lentile, L.B.; Holden, Z.A.; Smith, A.M.S.; Falkowski, M.J.; Hudak, A.T.; Morgan, P.; Lewis, S.A.; Gessler, P.E.; Benson, N.C. Remote sensing techniques to assess active fire characteristics and post-fire effects. Int. J. Wildland Fire 2006, 15, 319–345. [Google Scholar] [CrossRef]
  14. Kasischke, E.S.; French, N.H.S. Locating and estimating the aerial extent of wildfires in Alaskan boreal forests using multiple season AVHRR NDVI composite data. Remote Sens. Environ. 1995, 51, 263–275. [Google Scholar] [CrossRef]
  15. Barbosa, P.M.; Stroppiana, D.; Gregoire, J.M. An assessment of vegetation fire in Africa (1981–1991): Burned areas, burned biomass, and atmospheric emissions. Glob. Biogeochem. Cycles 1999, 13, 933–950. [Google Scholar] [CrossRef]
  16. Roy, D.P.; Giglio, L.; Kendall, J.D.; Justice, C.O. Multi-temporal active-fire based burn scar detection algorithm. Int. J. Remote Sens. 1999, 20, 1031–1038. [Google Scholar] [CrossRef]
  17. Pereira, J.M.C.; Vasconcelos, M.J.P.; Sousa, A.M. A rule based system for burned area mapping in temperate and tropical regions using NOAA/AVHRR imagery. In Biomass Burning and Its Inter-Relationship with The Climate System; Innes, J.L., Beniston, M., Verstraete, M.M., Eds.; Kluwer Academic Publishers: Dordrecht, The Netherlands, 2000; pp. 215–232. ISBN 978-0-306-47959-5. [Google Scholar]
  18. Kajii, Y.; Kato, S.; Streets, D.G.; Tsai, N.Y.; Shvidenko, A.; Nilsson, S.; McCallum, I.; Minko, N.P.; Abushenko, N.; Altyntsev, D. Boreal forest fires in Siberia in 1998: Estimation of area burned and emissions of pollutants by advanced very high resolution radiometer satellite data. J. Geophys. Res 2002, 107. [Google Scholar] [CrossRef]
  19. Soja, A.; Sukhinin, A.; Cahoon, D., Jr.; Shugart, H.; Stackhouse, P., Jr. AVHRR-derived fire frequency, distribution and area burned in Siberia. Int. J. Remote Sens 2004, 25, 1939–1960. [Google Scholar] [CrossRef]
  20. Pu, R.; Gong, P.; Li, Z.; Scarborough, J. A dynamic algorithm for wildfire mapping with NOAA/AVHRR data. Int. J. Wildland Fire 2004, 13, 275–285. [Google Scholar] [CrossRef]
  21. Sukhinin, A.I.; French, N.H.F.; Kasischke, E.S.; Hewson, J.H.; Soja, A.J.; Csiszar, I.A.; Hyer, E.J.; Loboda, T.; Conrad, S.G.; Romasko, V.I.; et al. AVHRR-based mapping of fires in Russia: New products for fire management and carbon cycle studies. Remote Sens. Environ. 2004, 93, 546–564. [Google Scholar] [CrossRef]
  22. Chuvieco, E.; Englefield, P.; Trishchenko, A.P.; Luo, Y. Generation of long time series of burn area maps of the boreal forest from NOAA—AVHRR composite data. Remote Sens. Environ. 2008, 112, 2381–2396. [Google Scholar] [CrossRef]
  23. Moreno Ruiz, J.A.; Riano, D.; Arbelo, M.; French, N.H.; Ustin, S.L.; Whiting, M.L. Burned area mapping time series in Canada (1984–1999) from NOAA-AVHRR LTDR: A comparison with other remote sensing products and fire perimeters. Remote Sens. Environ. 2012, 117, 407–414. [Google Scholar] [CrossRef]
  24. Fraser, R.; Li, Z.; Cihlar, J. Hotspot and NDVI differencing synergy (HANDS): A new technique for burned area mapping over boreal forest. Remote Sens. Environ. 2000, 74, 362–376. [Google Scholar] [CrossRef]
  25. Fraser, R.; Li, Z. Estimating fire-related parameters in boreal forest using SPOT VEGETATION. Remote Sens. Environ. 2002, 82, 95–110. [Google Scholar] [CrossRef]
  26. Zhang, Y.H.; Wooster, M.J.; Tutubalina, O.; Perry, G.L.W. Monthly burned area and forest fire carbon emission estimates for the Russian Federation from SPOT VGT. Remote Sens. Environ. 2003, 87, 1–15. [Google Scholar] [CrossRef]
  27. Tansey, K.; Grégoire, J.M.; Stroppiana, D.; Sousa, A.; Silva, J.; Pereira, J.; Boschetti, L.; Maggi, M.; Brivio, P.A.; Fraser, R. Vegetation burning in the year 2000: Global burned area estimates from SPOT VEGETATION data. J. Geophys. Res. Atmos. 2004, 109, D14S03. [Google Scholar] [CrossRef]
  28. Loboda, T.; O’neal, K.; Csiszar, I. Regionally adaptable dNBR-based algorithm for burned area mapping from MODIS data. Remote Sens. Environ. 2007, 109, 429–442. [Google Scholar] [CrossRef]
  29. Chuvieco, E.; Opazo, S.; Sione, W.; Valle, H.D.; Anaya, J.; Bella, C.D.; Cruz, I.; Manzo, L.; Lopez, G.; Mari, N. Global burned-land estimation in Latin America using MODIS composite data. Ecol. Appl. 2008, 18, 64–79. [Google Scholar] [CrossRef] [PubMed]
  30. Chuvieco, E.; Giglio, L.; Justice, C. Global characterization of fire activity: Toward defining fire regimes from Earth observation data. Glob. Chang. Biol. 2008, 14, 1488–1502. [Google Scholar] [CrossRef]
  31. Giglio, L.; Randerson, J.; Werf, G.; Kasibhatla, P.; Collatz, G.; Morton, D.; DeFries, R. Assessing variability and long-term trends in burned area by merging multiple satellite fire products. Biogeosciences 2010, 7, 1171–1186. [Google Scholar] [CrossRef] [Green Version]
  32. Loboda, T.V.; Hoy, E.E.; Giglio, L.; Kasischke, E.S. Mapping burned area in Alaska using MODIS data: A data limitations-driven modification to the regional burned area algorithm. Int. J. Wildland Fire 2011, 20. [Google Scholar] [CrossRef]
  33. Núñez-Casillas, L.; García-Lázaro, J.R.; Moreno-Ruiz, J.A.; Arbelo, M. A Comparative Analysis of Burned Area Datasets in Canadian Boreal Forest in 2000. Sci. World J. 2013, 2013, 289056. [Google Scholar] [CrossRef] [PubMed]
  34. Fornacca, D.; Ren, G.; Xiao, W. Performance of Three MODIS Fire Products (MCD45A1, MCD64A1, MCD14ML), and ESA Fire_CCI in a Mountainous Area of Northwest Yunnan, China, Characterized by Frequent Small Fires. Remote Sens. 2017, 9, 1131. [Google Scholar] [CrossRef]
  35. USGS Landsat. Available online: https://landsat.usgs.gov/ (accessed on 22 November 2017).
  36. George, C.; Rowland, C.; Gerard, F.; Balzter, H. Retrospective mapping of burnt areas in Central Siberia using a modification of the normalised difference water index. Remote Sens. Environ. 2006, 104, 346–359. [Google Scholar] [CrossRef]
  37. Loboda, T.; Csiszar, I. Reconstruction of fire spread within wildland fire events in Northern Eurasia from the MODIS active fire product. Glob. Planet. Chang. 2007, 56, 258–273. [Google Scholar] [CrossRef]
  38. Boschetti, L.; Roy, D.; Justice, C. International Global Burned Area Satellite Product Validation Protocol Part I—Production and Standardization of Validation Reference Data; Committee on Earth Observation Satellites: Maryland, MD, USA, 2009. [Google Scholar]
  39. Roy, D.P.; Boschetti, L. Southern Africa validation of the MODIS, L3JRC and GlobCarbon burned-area products. IEEE Trans. Geosci. Remote Sens. 2009, 47, 1032–1044. [Google Scholar] [CrossRef]
  40. Garcia-Lázaro, J.R.; Moreno-Ruiz, J.A.; Arbelo, M. Effect of spatial resolution on the accuracy of satellite-based fire scar detection in the northwest of the Iberian Peninsula. Int. J. Remote Sens. 2013, 34, 4736–4753. [Google Scholar] [CrossRef]
  41. Padilla, M.; Stehman, S.V.; Litago, J.; Chuvieco, E. Assessing the temporal stability of the accuracy of a time series of burned area products. Remote Sens. 2014, 6, 2050–2068. [Google Scholar] [CrossRef]
  42. Libonati, R.; DaCamara, C.C.; Setzer, A.W.; Morelli, F.; Melchiori, A.E. An algorithm for burned area detection in the Brazilian Cerrado using 4 μm MODIS imagery. Remote Sens. 2015, 7, 15782–15803. [Google Scholar] [CrossRef]
  43. Chuvieco, E.; Yue, C.; Heil, A.; Mouillot, F.; Alonso-Canas, I.; Padilla, M.; Pereira, J.M.; Oom, D.; Tansey, K. A new global burned area product for climate assessment of fire impacts. Glob. Ecol. Biogeogr. 2016, 25, 619–629. [Google Scholar] [CrossRef]
  44. Roy, D.P.; Boschetti, L.; Smith, A.M.A. Satellite remote sensing of fires, chapter 5. In Fire Phenomena and the Earth System: An Interdisciplinary Guide to Fire Science; Belcher, C.M., Rein, G., Eds.; John Wiley: Chichester, UK, 2013. [Google Scholar]
  45. Carmona-Moreno, C.; Belward, A.; Malingreau, J.P.; Hartley, A.; Garcia-Alegre, M.; Antonovskiy, M.; Buchshtaber, V.; Pivovarov, V. Characterizing interannual variations in global fire calendar using data from Earth observing satellites. Glob. Chang. Biol. 2005, 11, 1537–1555. [Google Scholar] [CrossRef]
  46. Grégoire, J.M.; Tansey, K.; Silva, J. The GBA2000 initiative: Developing a global burnt area database from SPOT-VEGETATION imagery. Int. J. Remote Sens 2003, 24, 1369–1376. [Google Scholar] [CrossRef]
  47. Tansey, K.; Grégoire, J.M.; Defourny, P.; Leigh, R.; Pekel, J.F.; van Bogaert, E.; Bartholomé, E. A new, global, multi-annual (2000–2007) burnt area product at 1 km resolution. Geophys. Res. Lett. 2008, 35, L01401. [Google Scholar] [CrossRef]
  48. Tansey, K.; Bradley, A.; Smets, B.; van Best, C.; Lacaze, R. The GEOLAND2 Biopar Burned Area Product. In Proceedings of the EGU General Assembly Conference, Vienna, Austria, 22–27 April 2012; p. 4727. [Google Scholar]
  49. Plummer, S.; Olivier, A.; Muriel, S.; Will, S. Establishing an earth observation product service for the terrestrial carbon community: The globcarbon initiative. Mitig. Adapt. Strateg. Glob. Chang. 2006, 11, 97–111. [Google Scholar] [CrossRef]
  50. Simon, M.; Plummer, S.; Fierens, F.; Hoelzemann, J.J.; Arino, O. Burnt area detection at global scale using ATSR-2: The GLOBSCAR products and their qualification. J. Geophys. Res. Atmos. 2004, 109, S02. [Google Scholar] [CrossRef]
  51. Roy, D.; Boschetti, L.; Justice, C.; Ju, J. The collection 5 MODIS burned area product—Global evaluation by comparison with the MODIS active fire product. Remote Sens. Environ. 2008, 112, 3690–3707. [Google Scholar] [CrossRef]
  52. Giglio, L.; Loboda, T.; Roy, D.P.; Quayle, B.; Justice, C.O. An active-fire based burned area mapping algorithm for the MODIS sensor. Remote Sens. Environ. 2009, 113, 408–420. [Google Scholar] [CrossRef]
  53. Giglio, L.; Randerson, J.T.; van der Werf, G.R. Analysis of daily, monthly, and annual burned area using the fourth-generation global fire emissions database (GFED4). J. Geophys. Res. Biogeosci. 2013, 118, 317–328. [Google Scholar] [CrossRef]
  54. Chuvieco, E.; Pettinari, M.L.; Heil, A.; Storm, T. ESA CCI ECV Fire Disturbance: D1.2 Product Specification Report, Version 6.1. Available online: http://www.esa-fire-cci.org/documents (accessed on 29 November 2017).
  55. Kasischke, E.S.; Loboda, T.; Giglio, L.; French, N.H.F.; Hoy, E.E.; de Jong, B.; Riano, D. Quantifying burned area for North American forests: Implications for direct reduction of carbon stocks. J. Geophys. Res. 2011, 116, G400. [Google Scholar] [CrossRef]
  56. Loepfe, L.; Lloret, F.; Roman-Cuesta, R.M. Comparison of burnt area estimates derived from satellite products and national statistics in Europe. Int. J. Remote Sens. 2012, 33, 3653–3671. [Google Scholar] [CrossRef]
  57. Moreno-Ruiz, J.A.; Riaño, D.; Kefauver, S. The synergy of the 0.05° (∼5 km) AVHRR Long Term Data Record (LTDR) and Landsat TM archive to map large fires in the North American boreal region from 1984 to 1998. IEEE J. Sel. Top. Appl. Earth Observ. Remote Sens. 2014, 7, 1157–1166. [Google Scholar] [CrossRef]
  58. Moreno-Ruiz, J.A.; García-Lazaro, J.R.; Aguilar-Cano, I.; Hernandez-Leal, P. Burned Area Mapping in the North American Boreal Forest Using Terra-MODIS LTDR (2001–2011): A comparison with the MCD45A1, MCD64A1 and BA GEOLAND-2 Products. Remote Sens. 2014, 6, 815–840. [Google Scholar] [CrossRef]
  59. Machado, A. Biodiversidad; Un paseo por el concepto y las Islas Canarias, Ed.; Cabildo Insular de Tenerife: Tenerife, Spain, 1998; 67p, ISBN 848734048–2. [Google Scholar]
  60. Olson, D.M.; Dinerstein, E.; Wikramanayake, E.D.; Burgess, N.D.; Powell, G.V.N.; Underwood, E.C.; D'Amico, J.A.; Itoua, I.; Strand, H.E.; Morrison, J.C.; et al. Terrestrial ecoregions of the world: A new map of life on Earth. Bioscience 2001, 51, 933–938. [Google Scholar] [CrossRef]
  61. World Wildlife Fund (WWF). Terrestrial Ecoregions of the World. Available online: https://www.worldwildlife.org/publications/terrestrial-ecoregions-of-the-world (accessed on 4 December 2017).
  62. Arévalo, J.R.; Fernández-Palacios, J.; Jiménez, M.; Gil, P. The effect of fire intensity on the understorey species composition of two Pinus canariensis reforested stands in Tenerife (Canary Islands). For. Ecol. Manag. 2001, 148, 21–29. [Google Scholar] [CrossRef]
  63. Climent, J.; Tapias, R.; Pardos, J.A. Fire adaptations in the Canary Islands pine (Pinus canariensis). Plant Ecol. 2004, 171, 185–196. [Google Scholar] [CrossRef]
  64. Pausas, J.G.; Keeley, J.E. Epicormic resprouting in fire-prone ecosystems. Trends Plant Sci. 2017, 22, 1008–1015. [Google Scholar] [CrossRef] [PubMed]
  65. MAPAMA. Ministerio de Agricultura y Pesca, Alimentación y Medio ambiente. Estadísticas de Incendios Forestales. Available online: http://www.mapama.gob.es/es/desarrollo-rural/estadisticas/Incendios_default.aspx (accessed on 15 December 2017).
  66. LTDR Data Products Description (Version 3 Release, PDF). A Description of the Surface Reflectance and NDVI Products (Version 3: March 17, 2010). Available online: https://ltdr.modaps.eosdis.nasa.gov/ltdr/docs/LTDRDataFormatDescriptions_03_2010_30.pdf (accessed on 20 December 2017).
  67. Barbosa, P.M.; Pereira, J.M.C.; Grégoire, J.M. Compositing Criteria for Burned Area Assessment Using Multitemporal Low Resolution Satellite Data. Remote Sens. Environ. 1998, 65, 38–49. [Google Scholar] [CrossRef]
  68. Chuvieco, E.; Ventura, G.; Martín, M.P.; Gómez, I. Assessment of multitemporal compositing techniques of MODIS and AVHRR images for burned land mapping. Remote Sens. Environ. 2005, 94, 450–462. [Google Scholar] [CrossRef]
  69. Arnone, E.; Francipane, A.; Scarbaci, A.; Puglisi, C.; Noto, L. Effect of raster resolution and polygon-conversion algorithm on landslide susceptibility mapping. Environ. Model. Softw. 2016, 84, 467–481. [Google Scholar] [CrossRef]
  70. Giglio, L.; Justice, C.; Boschetti, L.; Roy, D. MCD64A1 MODIS/Terra+Aqua Burned Area Monthly L3 Global 500 m SIN Grid V006 [Data Set]; NASA EOSDIS Land Processes DAAC: Sioux Falls, SD, USA, 2015. [Google Scholar]
  71. Roy, D.P.; Landmann, T. Characterizing the surface heterogeneity of fire effects using multi-temporal reflective wavelength data. Int. J. Remote Sens. 2005, 26, 4197–4218. [Google Scholar] [CrossRef]
  72. Roy, D.P.; Jin, Y.; Lewis, P.E.; Justice, C.O. Prototyping a global algorithm for systematic fire affected area mapping using MODIS time series data. Remote Sens. Environ. 2005, 97, 137–162. [Google Scholar] [CrossRef]
  73. Pinty, B.; Verstraete, M.M. GEMI: A non-linear index to monitor global vegetation from satellites. Plant Ecol. 1992, 101, 15–20. [Google Scholar] [CrossRef]
  74. Hall, M.; Frank, E.; Holmes, G.; Pfahringer, B.; Reutemann, P.; Witten, I.H. The WEKA Data Mining Software: An Update. SIGKDD Explor. Newsl. 2009, 11, 10–18. [Google Scholar] [CrossRef]
  75. Burks, A.W. Essays on Cellular Automata; University of Illinois Press: Urbana, IL, USA, 1970. [Google Scholar]
  76. Espinola, M.; Piedra-Fernandez, J.A.; Ayala, R.; Iribarne, L.; Wang, J.Z. Contextual and hierarchical classification of satellite images based on cellular automata. IEEE Trans. Geosci. Remote Sens. 2015, 53, 795–809. [Google Scholar] [CrossRef]
  77. Mojaradi, B.; Lucas, C.; Varshosaz, M. Using learning cellular automata for post classification satellite imagery. Int. Arch. Photogramm. Remote Sens. Spat. Inf. Sci. 2004, 35, 991–995. [Google Scholar]
  78. Stehman, S.V. Estimating standard errors of accuracy assessment statistics under cluster sampling. Remote Sens. Environ. 1997, 60, 258–269. [Google Scholar] [CrossRef]
  79. Bastarrika, A.; Chuvieco, E.; Martin, M.P. Automatic Burned Land Mapping From MODIS Time Series Images: Assessment in Mediterranean Ecosystem. IEEE Trans. Geosci. Remote Sens. 2011, 49, 3401–3413. [Google Scholar] [CrossRef]
  80. Libonati, R.; DaCamara, C.; Setzer, A.W.; Morelli, F.; Melchiori, A.E.; Almeida, P.; de Jesús, S.C. Validating MODIS burned area products over Cerrado region. Anais XVII Simpósio Brasileiro de Sensoriamento Remoto—SBSR, João Pessoa-PB, Brasil, 25 a 29 de abril de 2015, INPE. Available online: http://www.dsr.inpe.br/sbsr2015/files/p0129.pdf (accessed on 2 April 2018).
  81. De Araújo, F.M.; Ferreira, L.G. Satellite-based automated burned area detection: A performance assessment of the MODIS MCD45A1 in the Brazilian savanna. Int. J. Appl. Earth Obs. Geoinform. 2015, 36, 94–102. [Google Scholar] [CrossRef]
  82. Tsela, P.; Wessels, K.; Botai, J.; Archibald, S.; Swanepoel, D.; Steenkamp, K.; Frost, P. Validation of the two standard MODIS satellite burned-area products and an empirically-derived merged product in South Africa. Remote Sens. 2014, 6, 1275–1293. [Google Scholar] [CrossRef]
  83. Anaya, J.A.; Chuvieco, E. Accuracy assessment of burned area products in the Orinoco basin. Photogramm. Eng. Remote Sens. 2012, 78, 53–60. [Google Scholar] [CrossRef]
  84. Levin, N.; Heimowitz, A. Mapping spatial and temporal patterns of Mediterranean wildfires from MODIS. Remote Sens. Environ. 2012, 126, 12–26. [Google Scholar] [CrossRef]
  85. De Klerk, H.M.; Wilson, A.M.; Steenkamp, K. Evaluation of satellite-derived burned area products for the fynbos, a Mediterranean shrubland. Int. J. Wildland Fire 2011, 21, 36–47. [Google Scholar] [CrossRef]
  86. Urbanski, S.P.; Salmon, J.M.; Nordgren, B.L.; Hao, W.M. A MODIS direct broadcast algorithm for mapping wildfire burned area in the western United States. Remote Sens. Environ. 2009, 113, 2511–2526. [Google Scholar] [CrossRef]
  87. Csiszar, I.A.; Morisette, J.T.; Giglio, L. Validation of active fire detection from moderate-resolution satellite sensors: The MODIS example in Northern Eurasia. IEEE Trans. Geosci. Remote Sens. 2006, 44, 1757–1764. [Google Scholar] [CrossRef]
  88. Roy, D.P.; Frost, P.G.H.; Justice, C.O.; Landmann, T.; Le Roux, J.L.; Gumbo, K.; Makungwa, S.; Dunham, K.; Du Toit, R.; Mhwandagara, K.; et al. The Southern Africa Fire Network (SAFNet) regional burned-area product-validation protocol. Int. J. Remote Sens. 2005, 26, 4265–4292. [Google Scholar] [CrossRef]
  89. Huesca, M.; González-Alonso, F.; Cuevas, J.M.; Merino-de-Miguel, S. Canary Islands burned land mapping using MODIS and HOTSPOT data. For. Syst. 2008, 17, 308–316. [Google Scholar] [CrossRef]
  90. Alonso-Benito, A.; Hernandez-Leal, P.A.; Gonzalez-Calvo, A.; Arbelo, M.; Barreto, A. Analysis of different methods for burnt area estimation using remote sensing and ground truth data. In Proceedings of the International Geoscience and Remote Sensing Symposium (IGARSS), Boston, MA, USA, 7–11 July 2008; pp. 828–831. [Google Scholar]
  91. Weiss, D.J.; Walsh, S.J. Remote Sensing of Mountain Environments. Geogr. Compass 2009, 3, 1–21. [Google Scholar] [CrossRef]
  92. De Klerk, H. A pragmatic assessment of the usefulness of the MODIS (Terra and Aqua) 1-km active fire (MOD14A2 and MYD14A2) products for mapping fires in the fynbos biome. Int. J. Wildland Fire 2008, 17, 166–178. [Google Scholar] [CrossRef]
Figure 1. The Canary Islands Archipelago (Spain) is located off the north-west African coast (Morocco). The image is a NDVI composition from the Terra-MODIS sensor at a 500-m spatial resolution on 30 December 2015 retrieved from the online Land, Atmosphere Near Real-time Capability for the EOS (LANCE) system (https://lance-modis.eosdis.nasa.gov/imagery/subsets/?area=af). The red rectangle includes five islands studied.
Remotesensing 10 00789 g001
Figure 2. Flowchart of the Bayesian algorithm applied to the study region to obtain annual maps of Burned Area.
Remotesensing 10 00789 g002
Figure 3. Annual distribution of the Burned Area estimate (ha) in the study region for the analysed products and the reference data.
Remotesensing 10 00789 g003
Figure 4. The 30 km × 30 km subscenes with fires greater than 2000 ha for the MODIS-based MCD45A1, MCD64A1, and BY-MODIS. The black lines represent the Landsat perimeter of all the fires registered on each subscene. The geographic coordinates indicate the top left and bottom right corners of each of the subscenes.
Remotesensing 10 00789 g004
Table 1. Fires registered for the 2002–2012 period in the Canary Islands: ID (identification code), Region (island name), Detection Date, Days until extinction, geographical coordinates (Latitude and Longitude) and Burned Area (ha) according to Ministry of Agriculture and Fisheries, Food and Environment of Spain (MAPAMA).
IDRegionDetection Date Day/Month/YearDaysLat.Lon.Burned Area (ha)
2003El Hierro7 August 2003327.7−18.0357
2005_1Gran Canaria21 July 2005328.0−15.6130
2005_2La Palma6 September 2005828.8−17.91890
2006El Hierro10 September 20061227.7−18.01467
2007_1Gran Canaria27 July 20072927.9−15.718,673
2007_2La Gomera27 July 2007528.1−17.2119
2007_3Tenerife30 July 20071728.4−16.616,821
2008La Gomera26 April 20086928.1−17.3376
2009La Palma31 July 20095028.5−17.83464
2012_1Tenerife15 July 201210628.1−16.76512
2012_2La Palma16 July 20125328.6−17.9752
2012_3La Gomera4 August 20128628.1−17.22677
2012_4La Palma4 August 20121028.6−17.82028
2012_5Tenerife10 August 20128228.3−16.8306
Table 2. Spatial distribution of the fires registered in the Canary Islands for the 2002–2012 period: Island, Surface (km2), Fires Registered (count and percentage), Burned Area (ha, percentage in relation to the total Burned Area and the Island Surface).
IslandIsland Surface (km2)Fires RegisteredBurned Area
Count%ha% (Total BA)% IS
Tenerife2034.38321.4323,639.0442.5411.62
Gran Canaria1560.10214.2918,803.0133.8412.05
La Palma708.32428.578134.3314.6411.48
La Gomera369.76321.433171.125.718.58
El Hierro268.71214.291823.703.286.79
Total4941.2714100.0055,571.20100.0011.25
Table 3. Bands of the MOD09GQ and MOD11A1 products used for building the daily set of images with the same format than the Long Term Data Record (LTDR) dataset.
Original FileBand
MOD09GQQC_250m_1250 m Quality Bit
sur_refl_b01_1250 m RED Band (620–670 nm)
~LTDR Channel 1
sur_refl_b02_1250 m NIR Band (841–876 nm)
~LTDR Channel 2
QC_500m_1500 m Quality Bit
MOD11A1LST_Day_1km1000 m Land Surface Temperature
~LTDR Channel T3/3B
QC_250m_1250 m Quality Bit
Table 4. Landsat scenes downloaded from https://earthexplorer.usgs.gov/: ID (fire identification code), Fire Detection Date and Landsat Scene (Path, Row and Date).
IDFire Detection Date (Day/Month/Year)Landsat Scene
PathRowDate
20037 August 20032084111 March 2004
2005_121 July 20052064122 May 2006
2005_26 September 20052084013 February 2006
200610 September 20062084112 March 2007
2007_127 July 20072064121 August 2007
2007_227 July 20072074123 October 2007
2007_330 July 20072074028 August 2007
200826 April 20082074129 January 2009
200931 July 20092084016 August 2009
2012_115 July 2012207405 November 2012
2012_216 July 20122084019 August 2013
2012_34 August 2012207412 September 2012
2012_44 August 20122084019 August 2013
2012_510 August 2012207405 November 2012
Table 5. Burned Area distribution (ha) by fire event for the different MODIS-based products in the Canary Islands during the period 2002–2012.
IDReference 1LandsatMCD45A1MCD64A1BY-MODIS
2003357.00362.50575.000.00493.75
2005_1130.11112.500.000.0025.00
2005_21890.001737.50600.001175.00575.00
20061466.70981.2525.001675.000.00
2007_118,672.9014,706.257625.0014,975.007531.25
2007_2118.64125.00225.000.00106.25
2007_316,820.6312,731.2514,500.009075.0011,850.00
2008375.67156.25100.000.00262.50
20093464.333468.753875.004275.003668.75
2012_16512.006643.755450.006450.006081.25
2012_2752.00631.25550.00775.00806.25
2012_32676.812393.752325.002500.002400.00
2012_42028.001581.251025.001950.001950.00
2012_5306.41225.0025.000.00300.00
Total55,571.2045,856.2536,900.0042,850.0036,050.00
1 Reference data are from MAPAMA information.
Table 6. Burned Area distribution by Island for the different MODIS-based products in the Canary Islands during the period 2002–2012.
IslandReference (ha)Landsat (%)MCD45A1 (%)MCD64A1 (%)BY-MODIS (%)
Tenerife23,639.0482.9184.5065.6877.12
Gran Canaria18,803.0178.8140.5579.6440.19
La Palma8134.3391.2074.38100.5086.06
La Gomera3171.1284.3683.5778.8487.31
El Hierro1823.7073.6832.9091.8527.07
Total55,571.2082.5266.4077.1164.87
Table 7. Burned Area estimate accuracy by year (Intercept, Slope and R2) for MCD45A1, MCD64A1, and BY-MODIS.
YearMCD45A1MCD64A1BY-MODIS
InterceptSlopeR2InterceptSlopeR2InterceptSlopeR2
20038.67 × 10−51.380.460.000.000.003.39 × 10−61.260.97
2005−1.01 × 10−60.330.64−1.65 × 10−50.710.91−4.11 × 10−60.350.90
20068.56 × 10−70.010.114.69 × 10−61.260.971.33 × 10−60.000.00
20073.98 × 10−50.800.79−1.01 × 10−50.880.853.72 × 10−50.700.81
2008−4.72 × 10−70.690.730.000.000.001.62 × 10−50.680.26
20092.55 × 10−51.070.971.67 × 10−51.200.972.21 × 10−51.000.97
2012−2.19 × 10−50.850.924.00 × 10−51.000.949.56 × 10−50.940.93
All1.19 × 10−50.810.813.21 × 10−60.930.882.12 × 10−50.760.82
Table 8. Commission (CE) and omission errors (OE) by year for MCD45A1, MCD64A1, and BY-MODIS.
YearMCD45A1MCD64A1BY-MODIS
CEOECEOECEOE
20030.720.000.001.000.260.00
20050.020.690.030.390.000.68
20060.000.980.240.020.000.99
20070.120.280.100.210.070.34
20080.250.500.001.000.670.46
20090.160.040.210.020.130.07
20120.070.230.130.100.160.14
All0.130.280.120.180.110.30
Table 9. Detection of fires greater than 2000 ha in the Canary Islands’ forestry region for MCD45A1, MCD64A1, and BY-MODIS.
SubscenesReferenceLandsatMCD45A1MCD64A1BY-MODIS
Year/Fire Id.(ha)(%)(%)(%)(%)
2007_118,672.978.7640.8380.240.33
2007_316,820.6375.6986.253.9570.45
20093464.3100.13111.85123.4105.9
2012_16512102.0283.6999.0593.39
2012_32676.8189.4386.8693.3989.66
2012_4202877.9750.5496.1596.15
Total50,174.6782.7669.3678.1866.73

