Decorrelation of Satellite Precipitation Estimates in Space and Time

 ,
,  ,
,  , ,
, ,
Abstract
1. Introduction
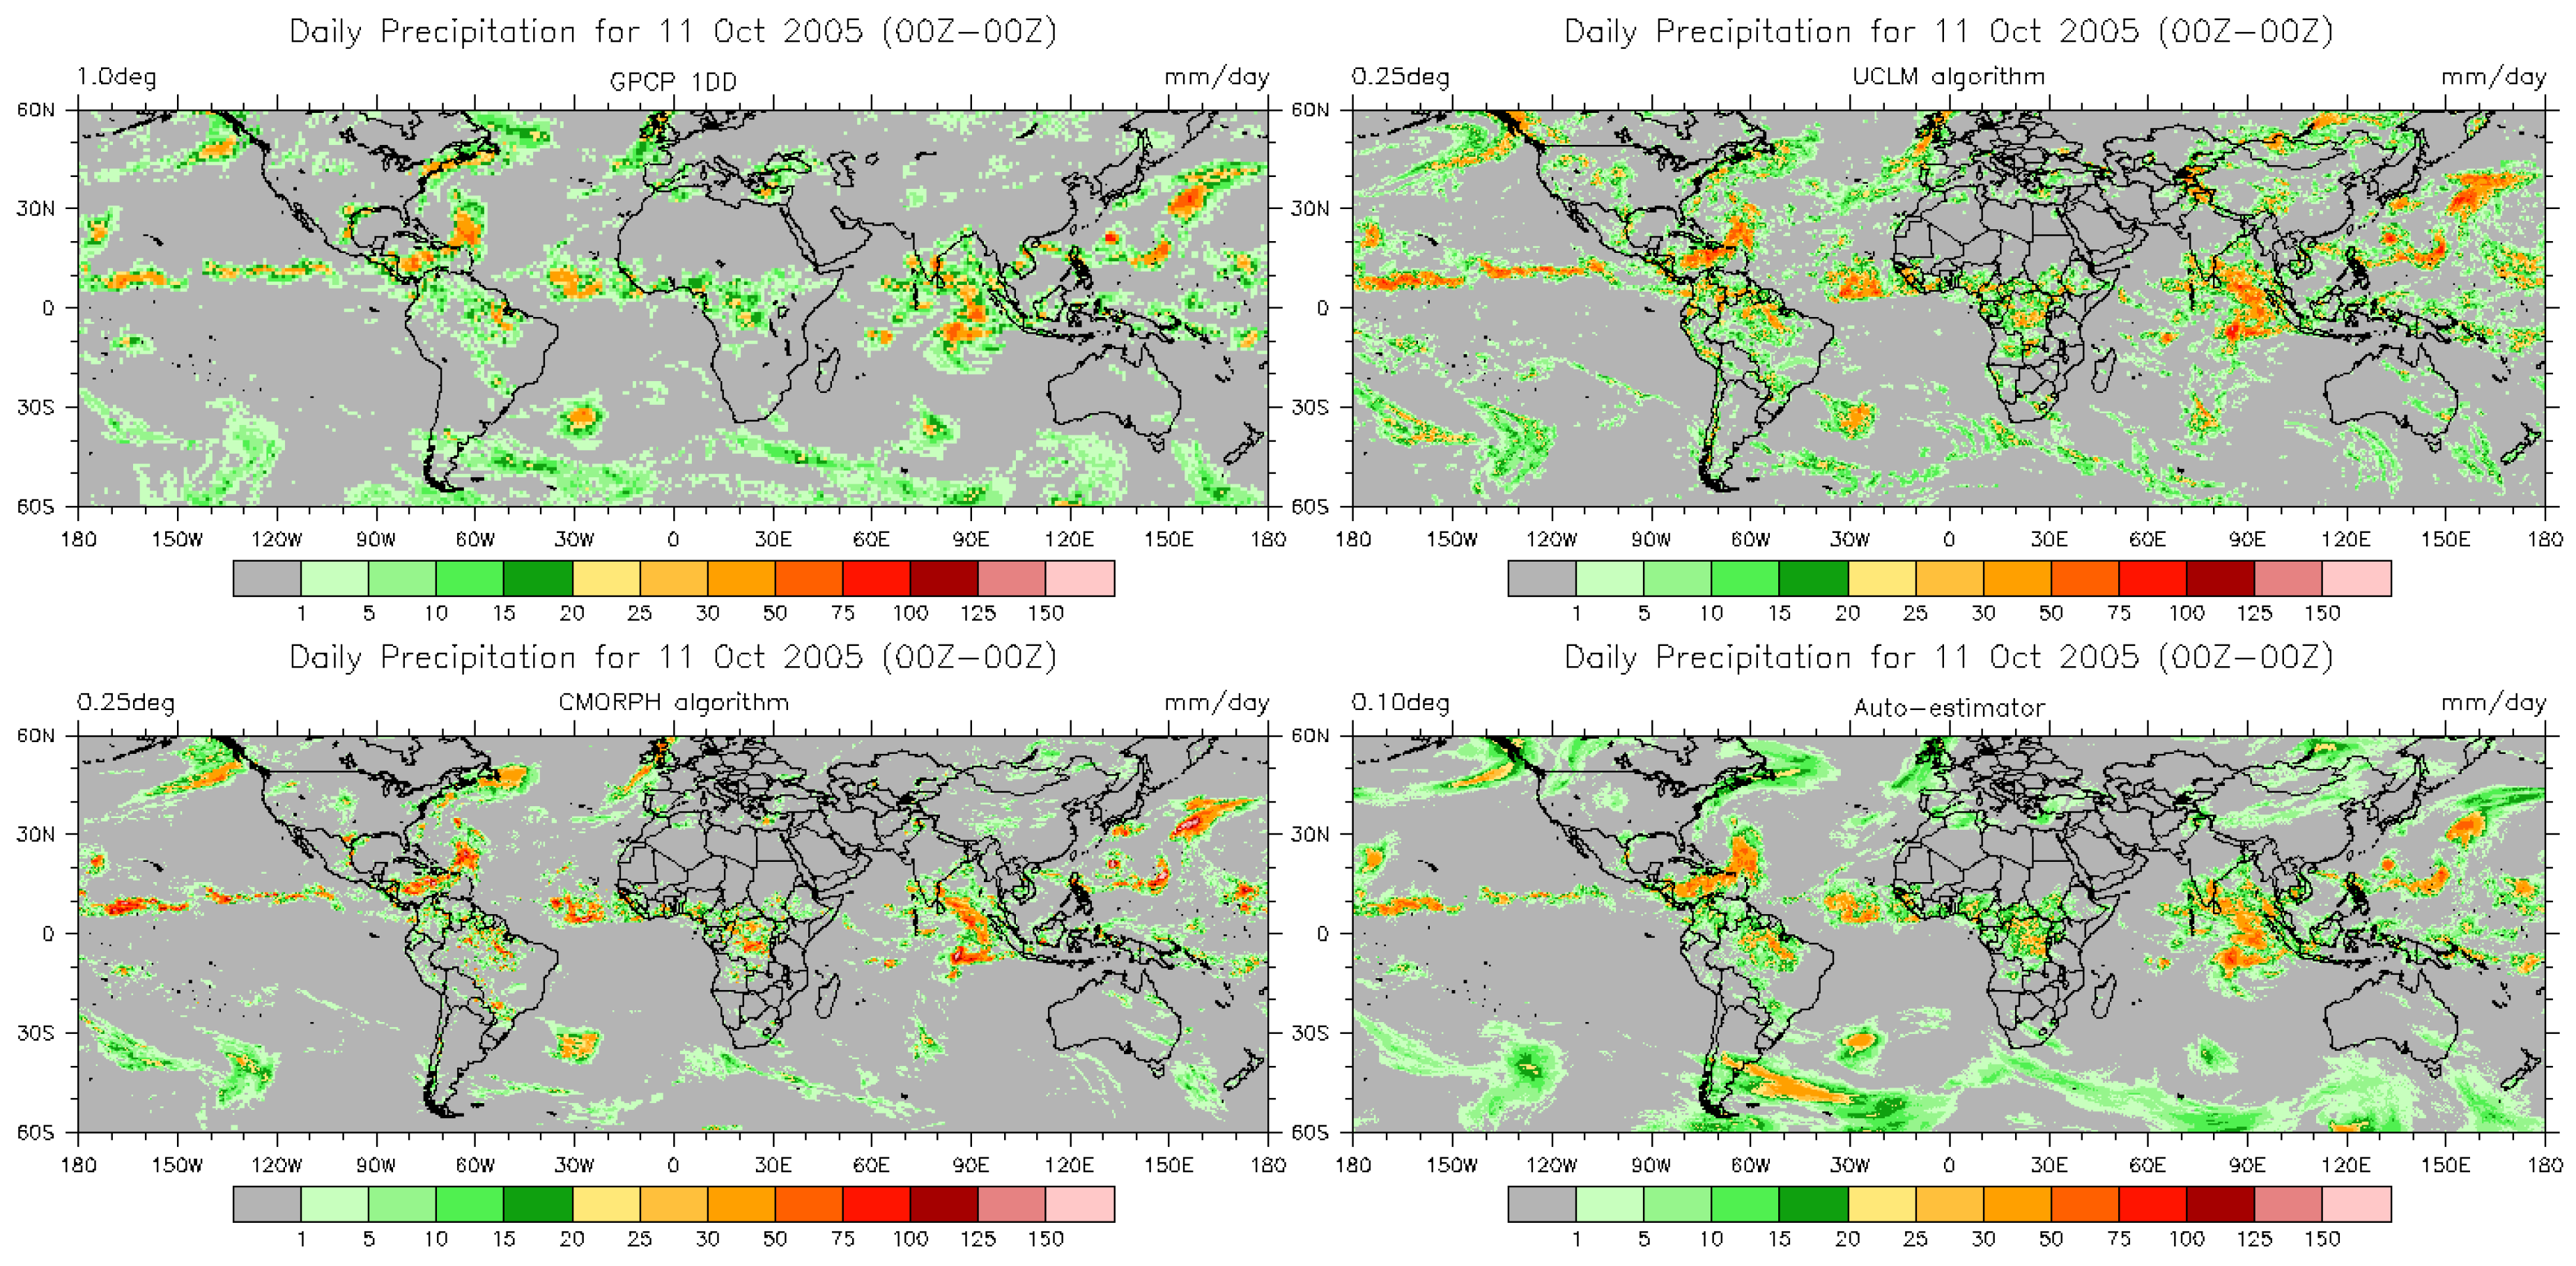
2. Data
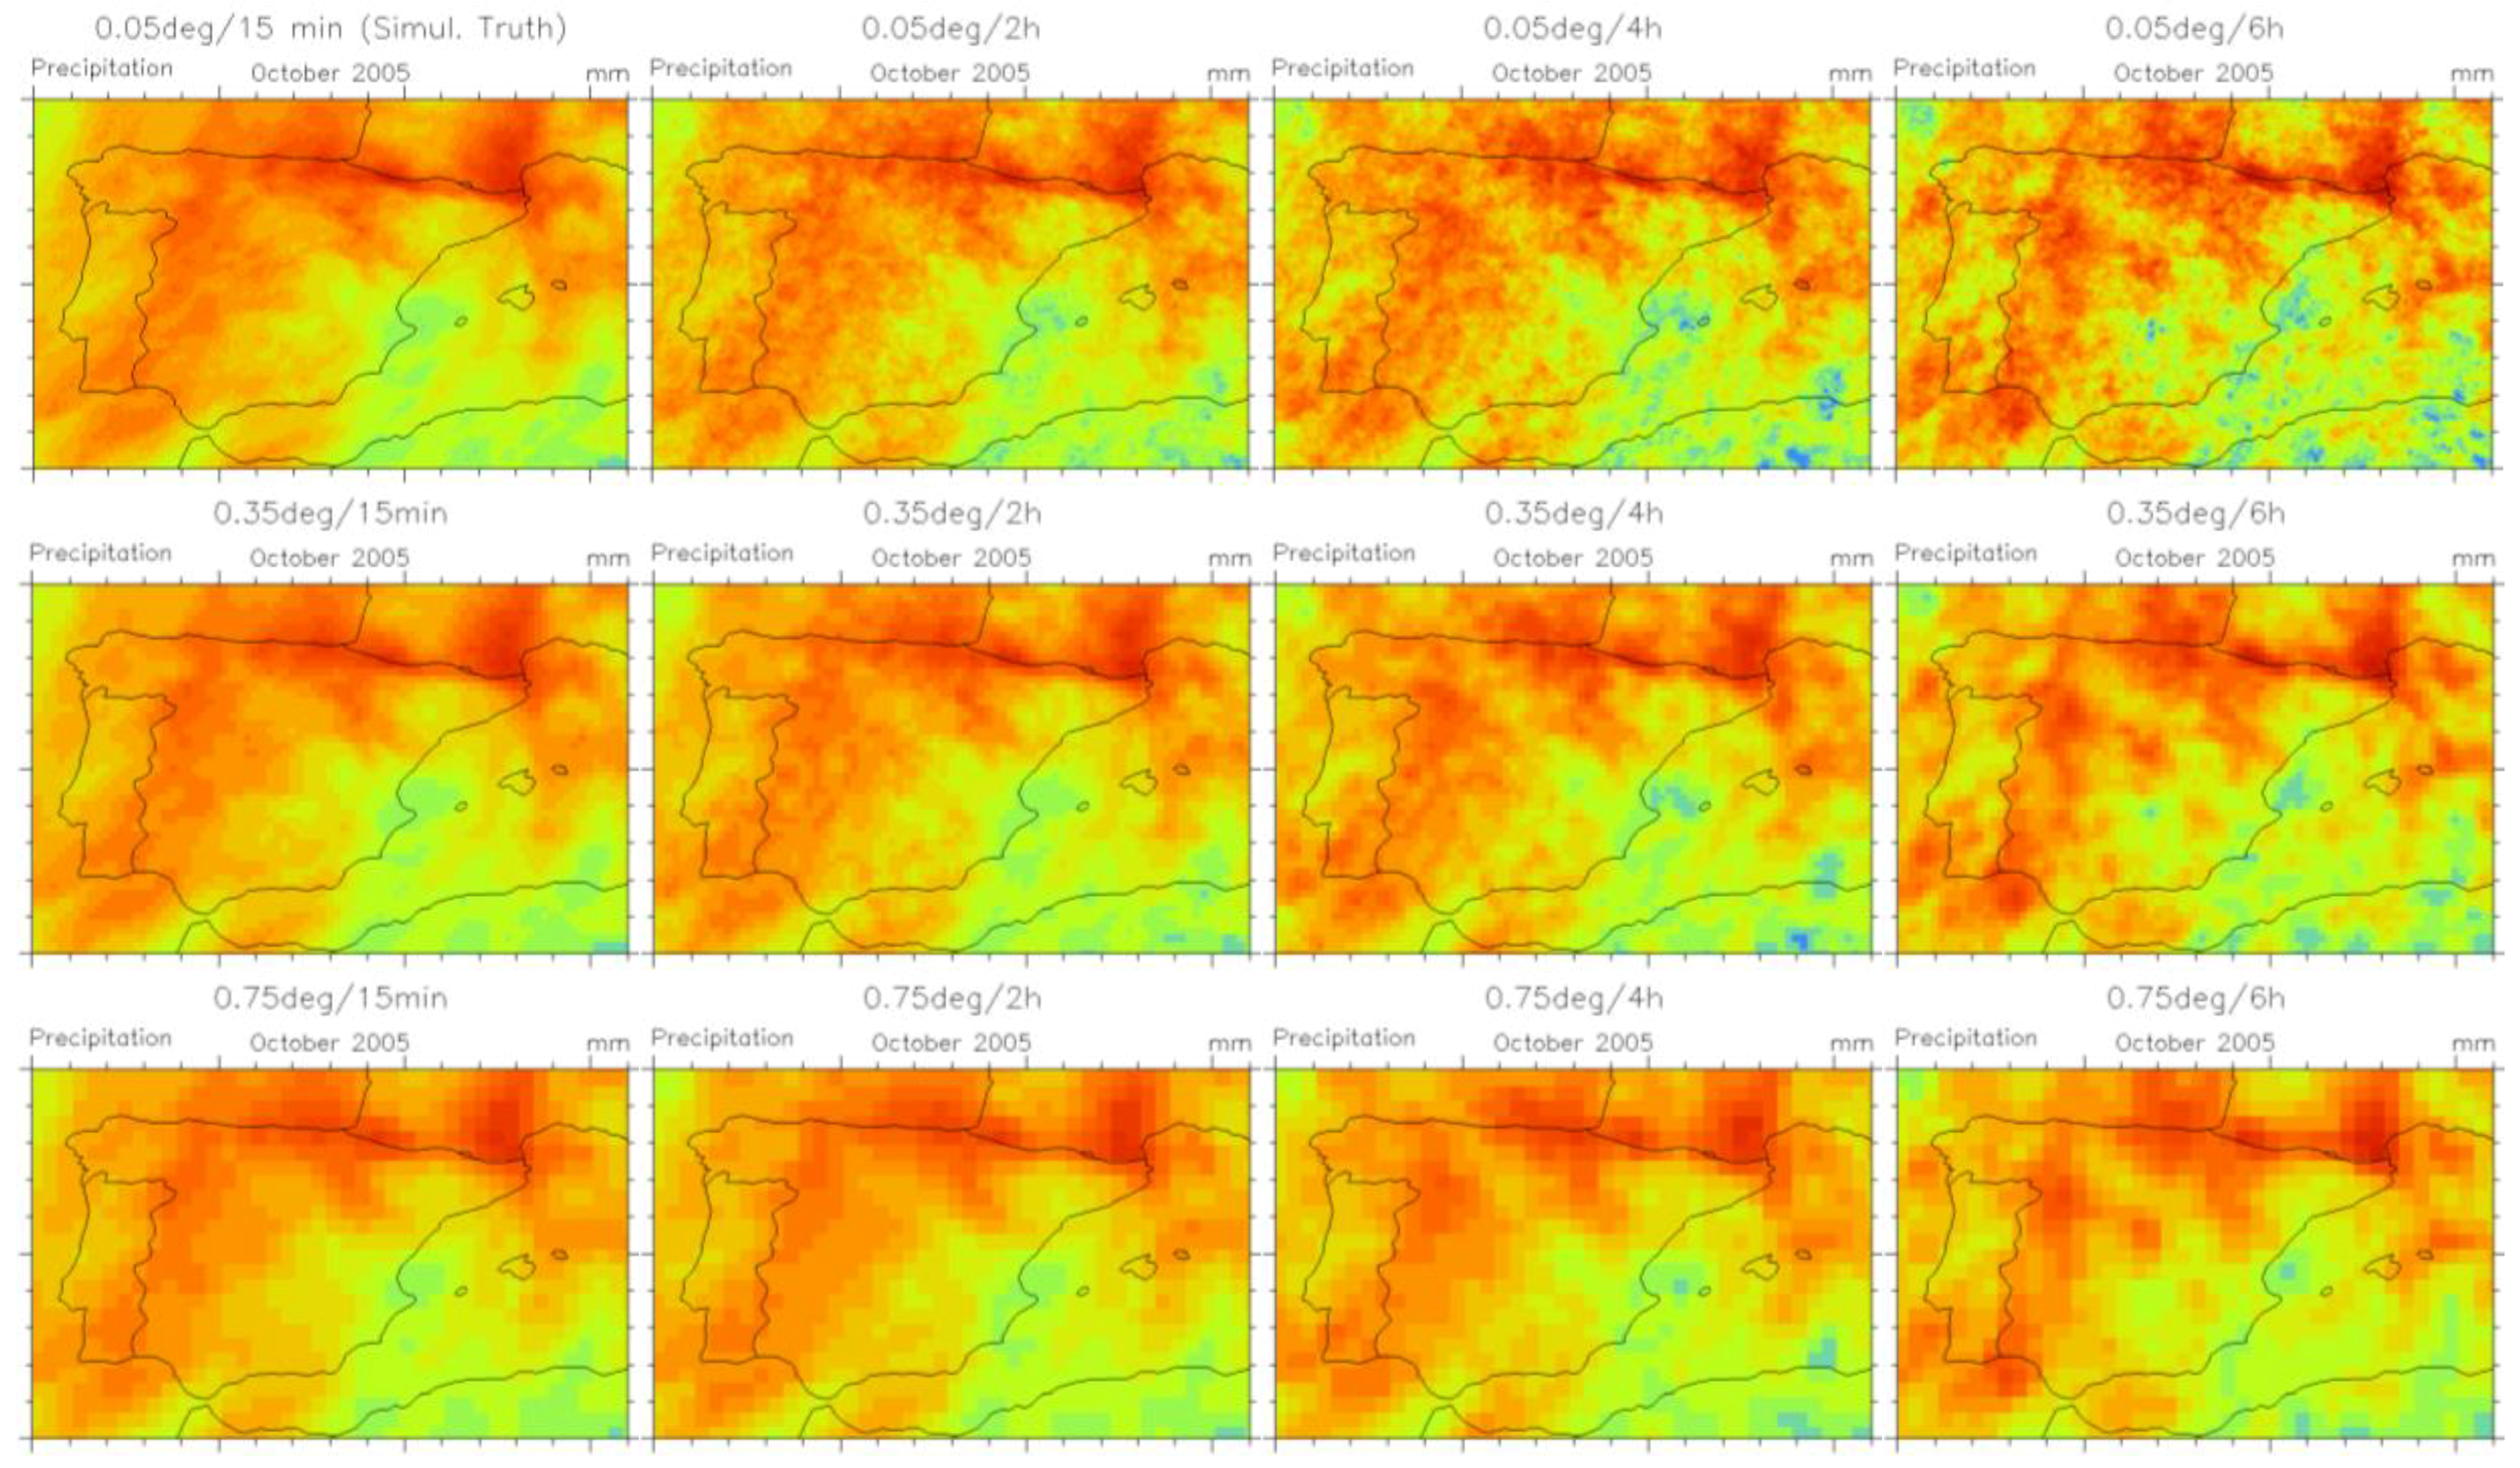
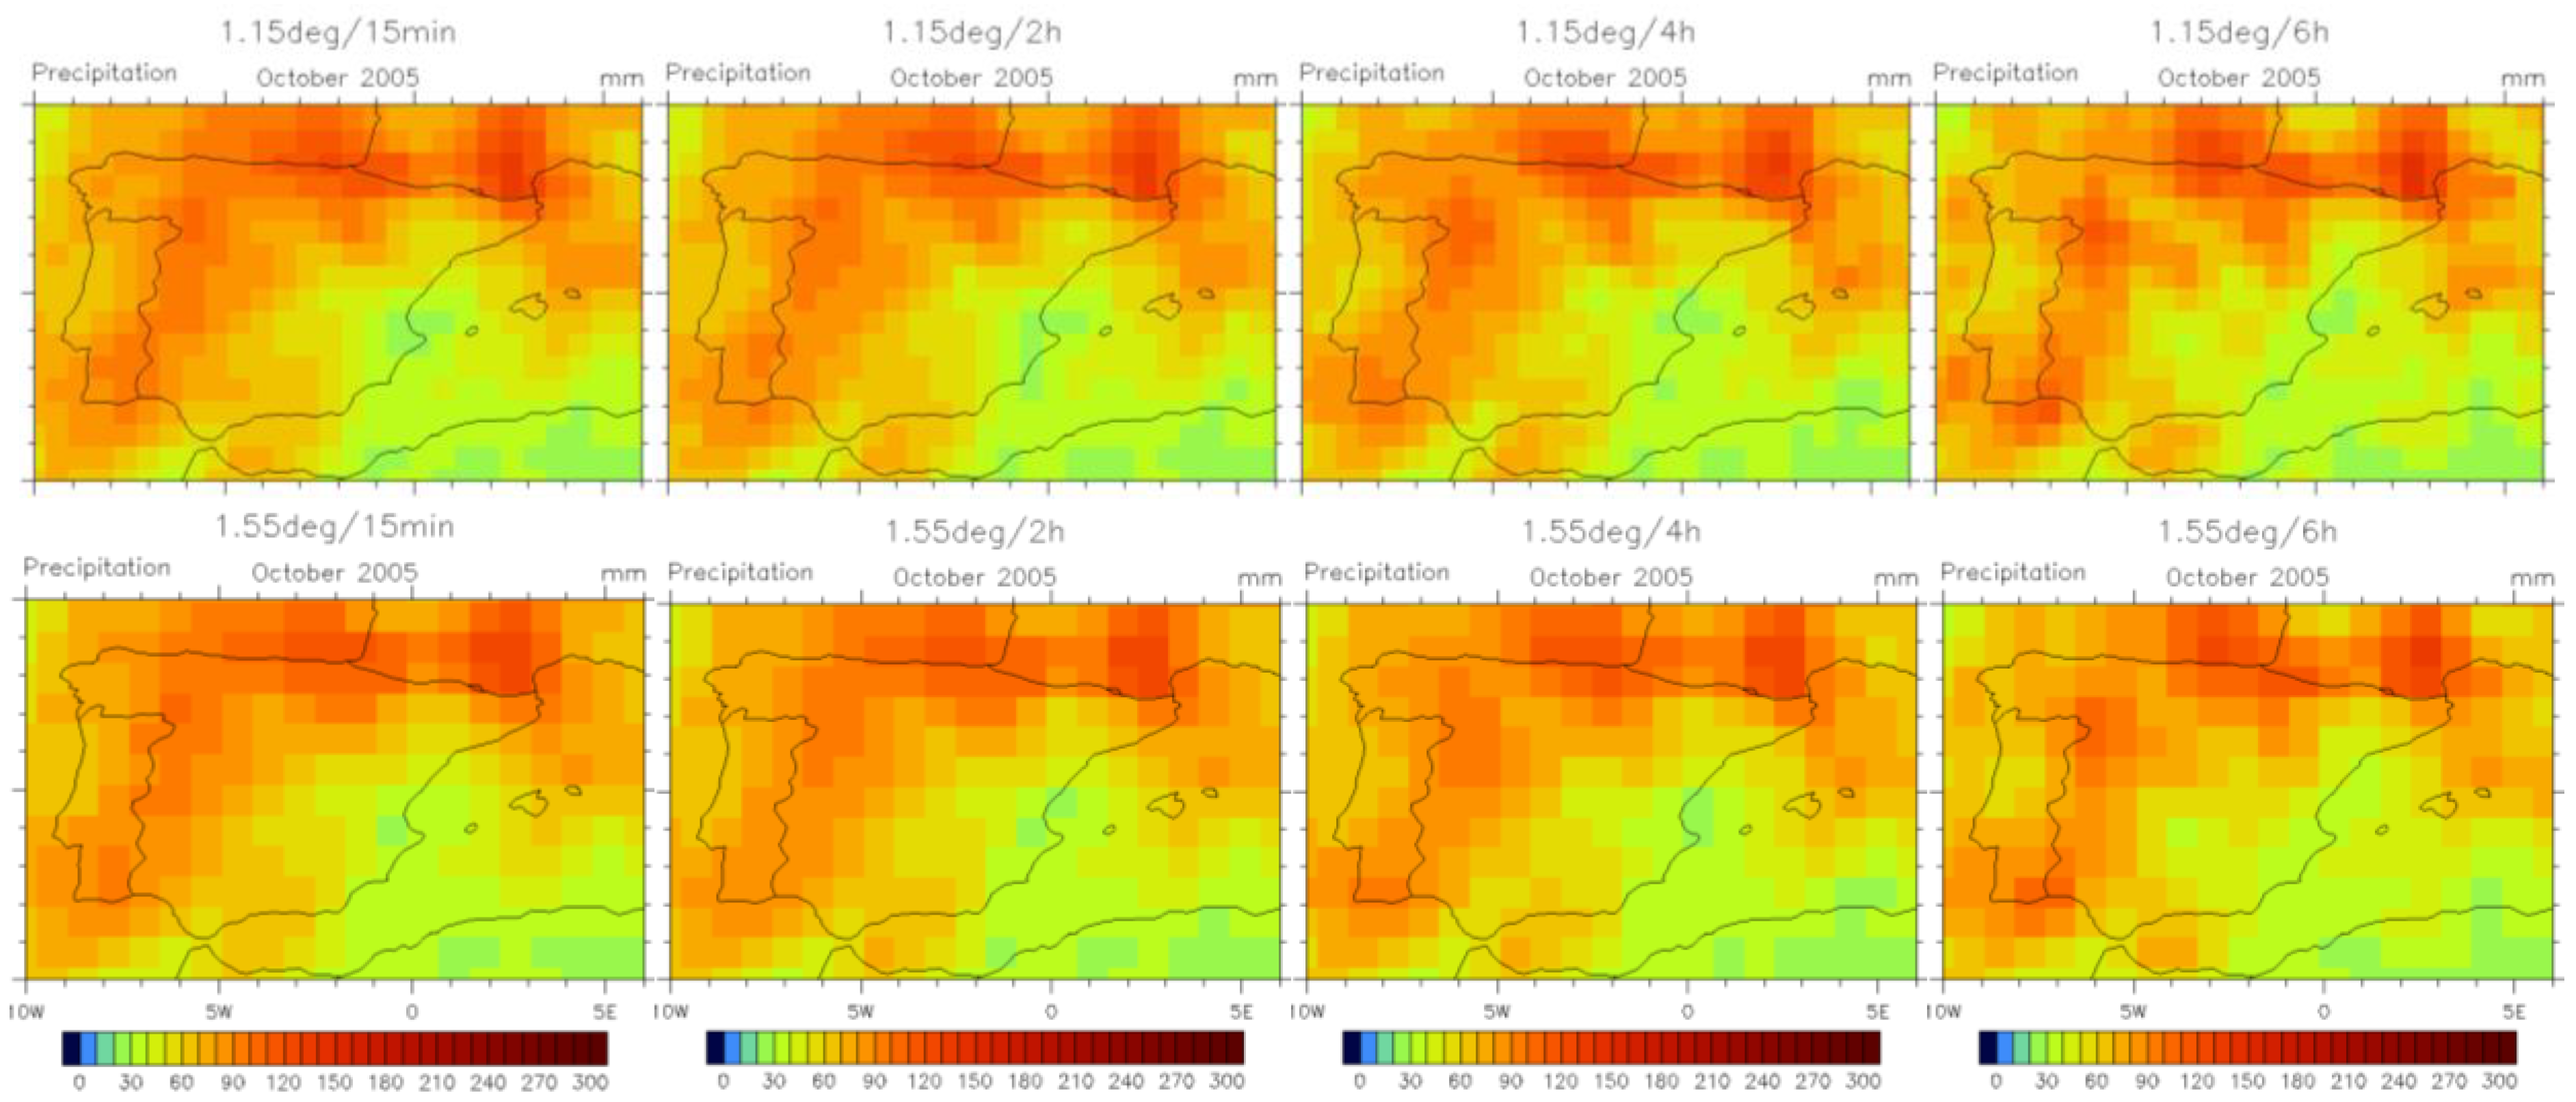
3. Methods
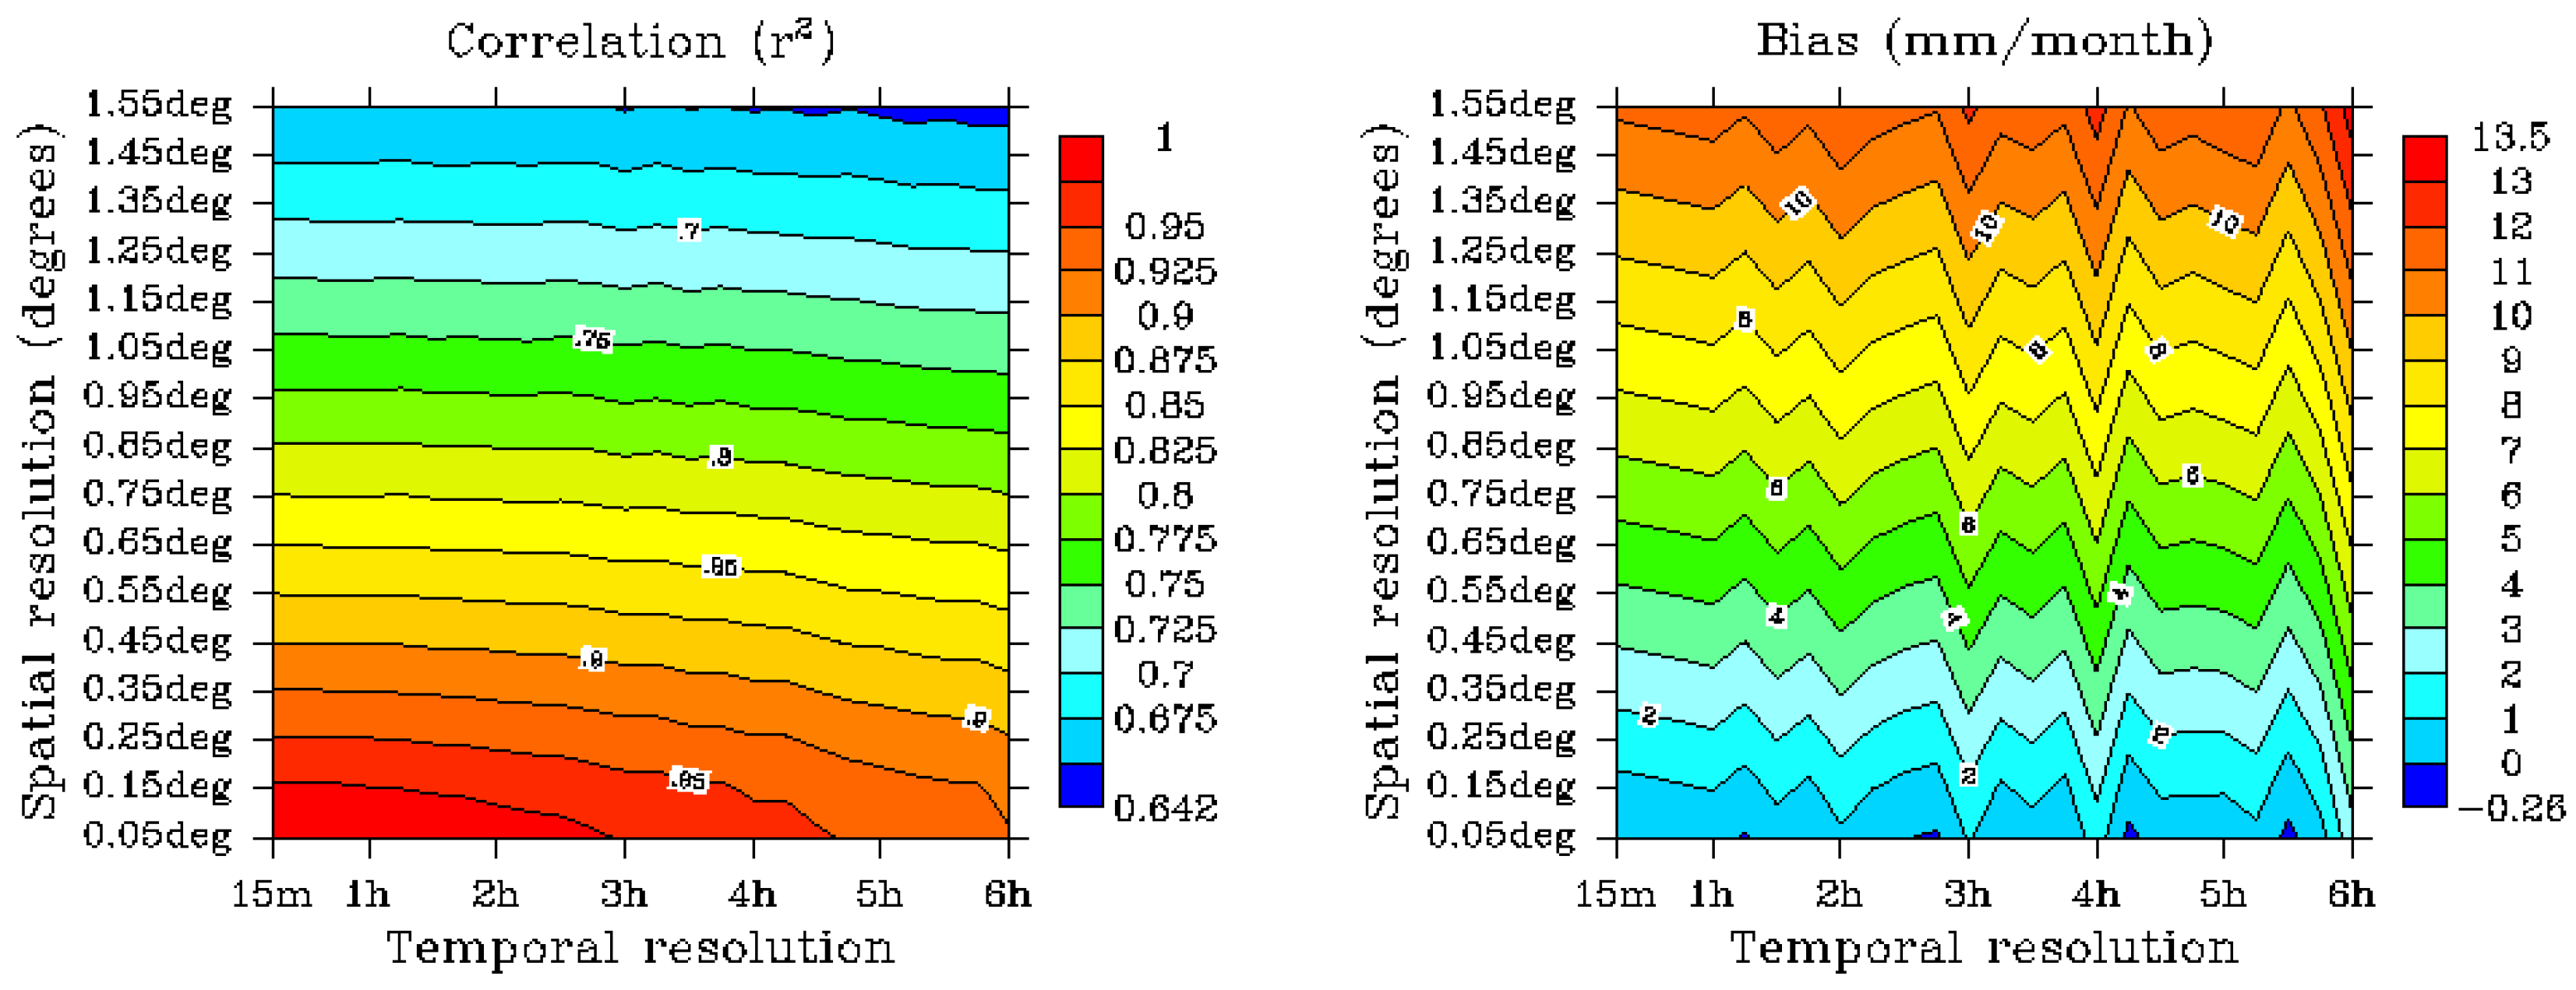
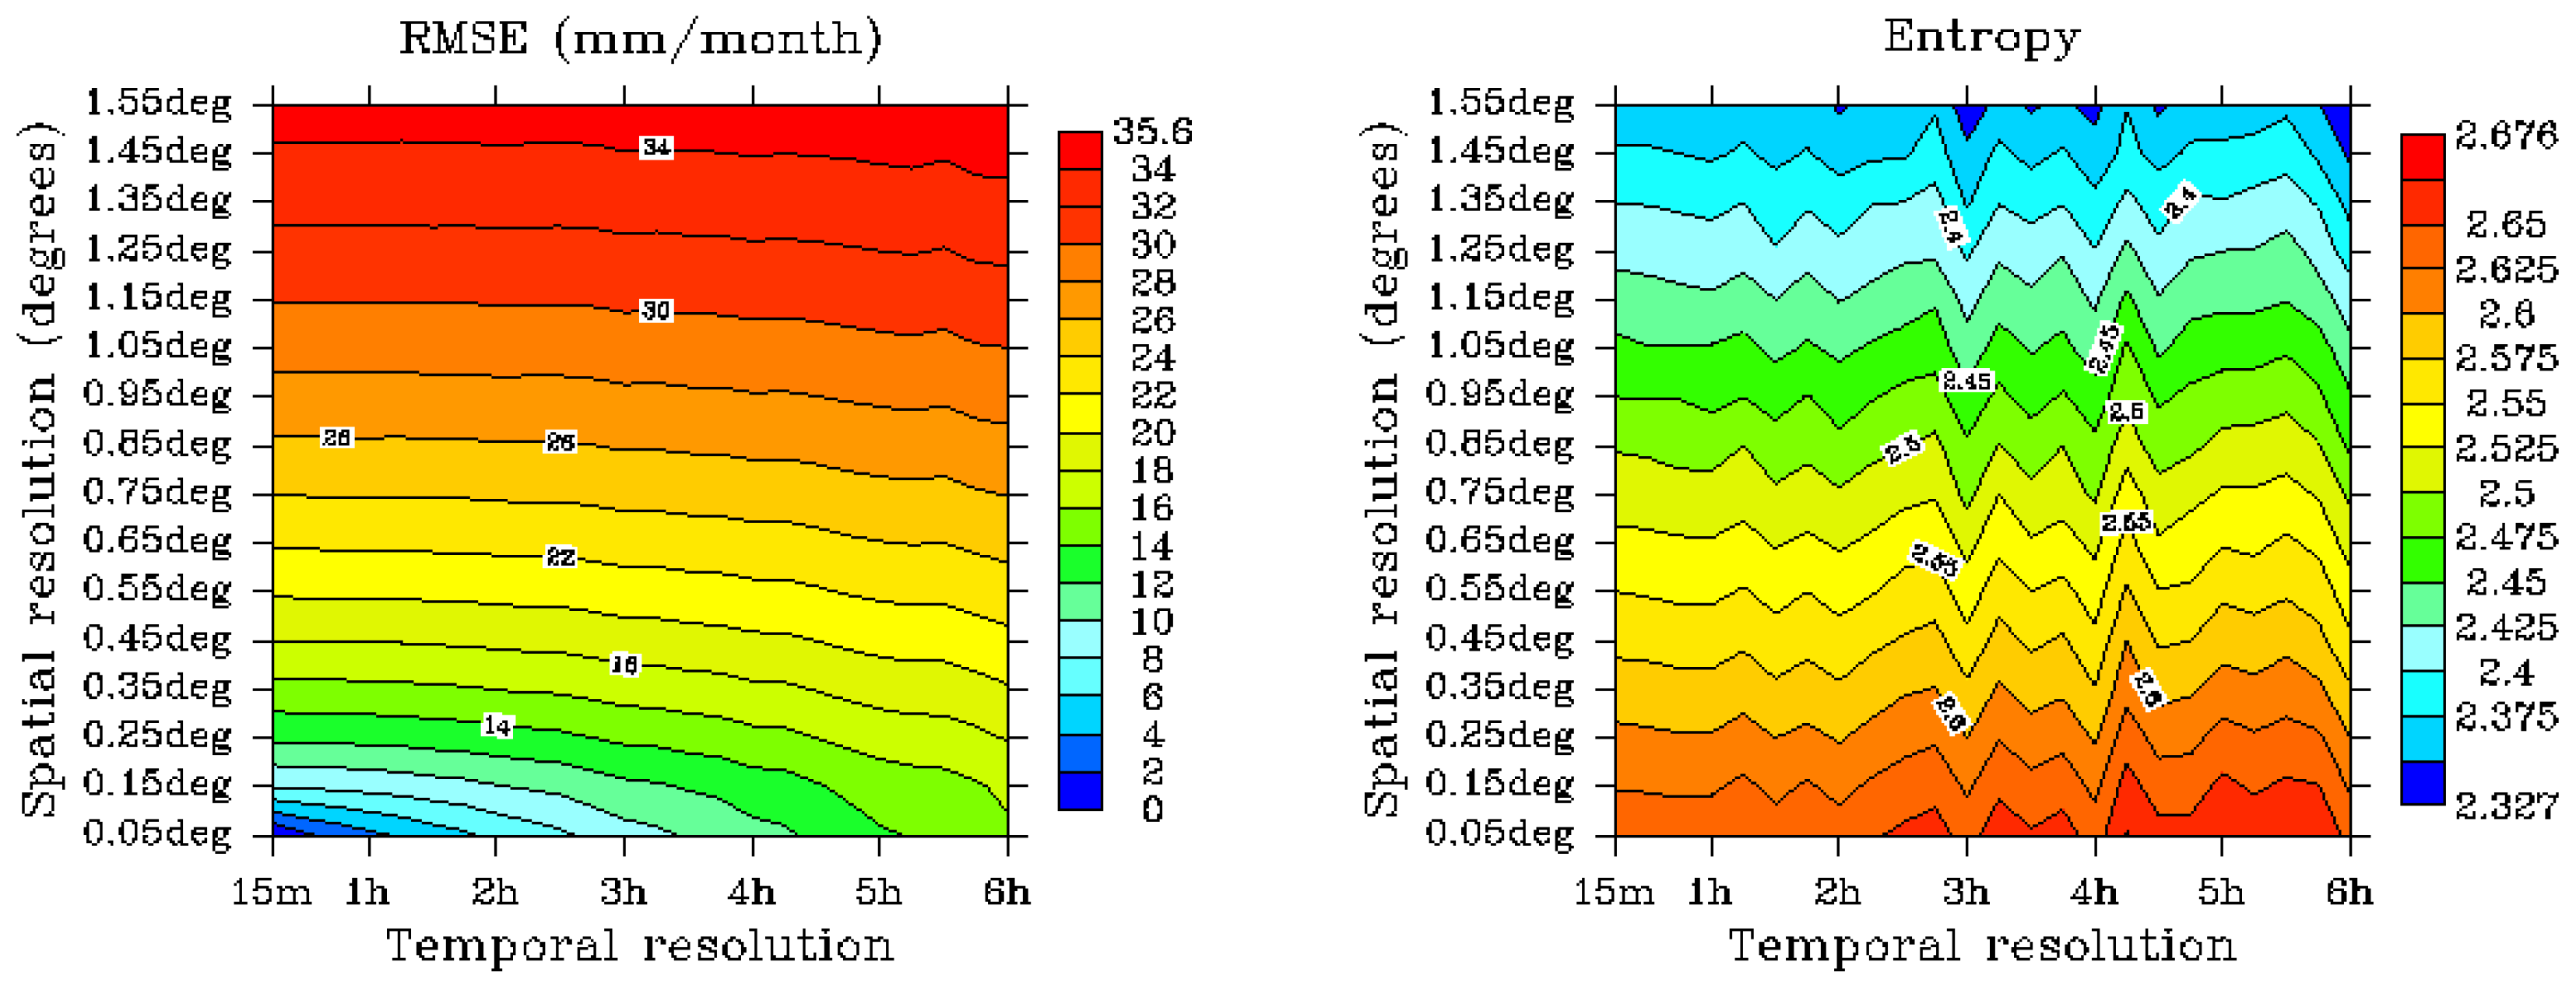
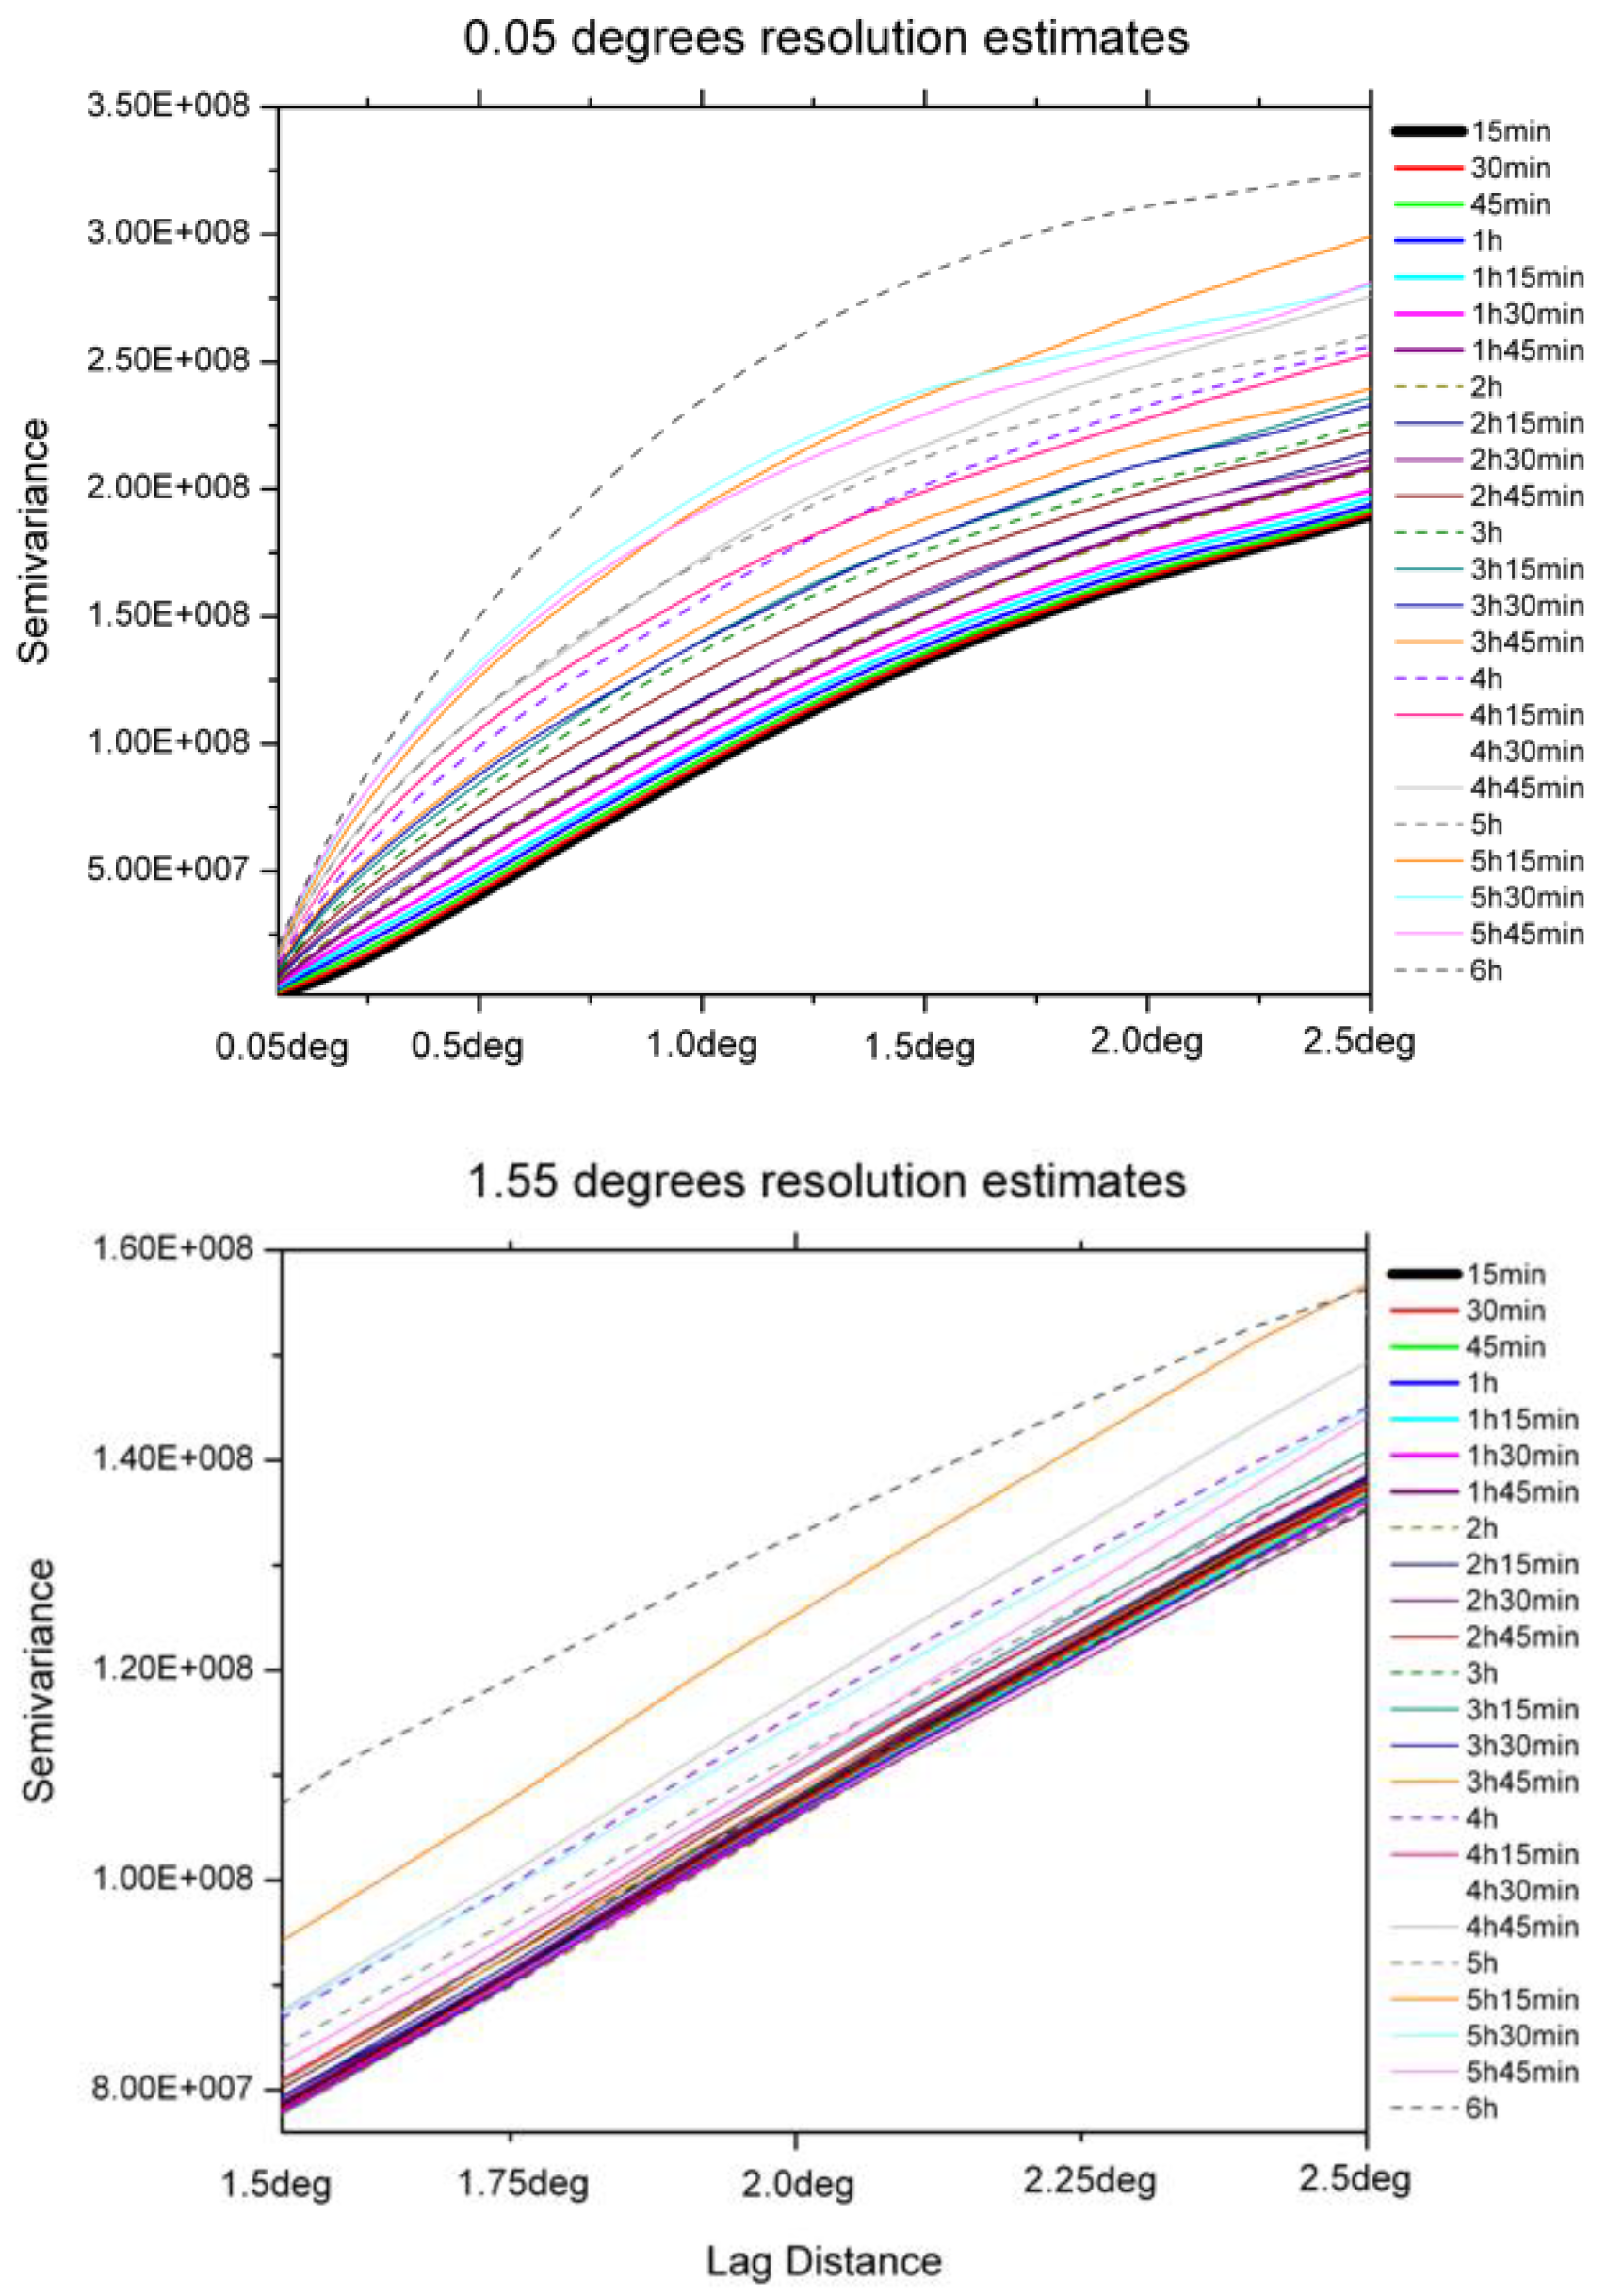
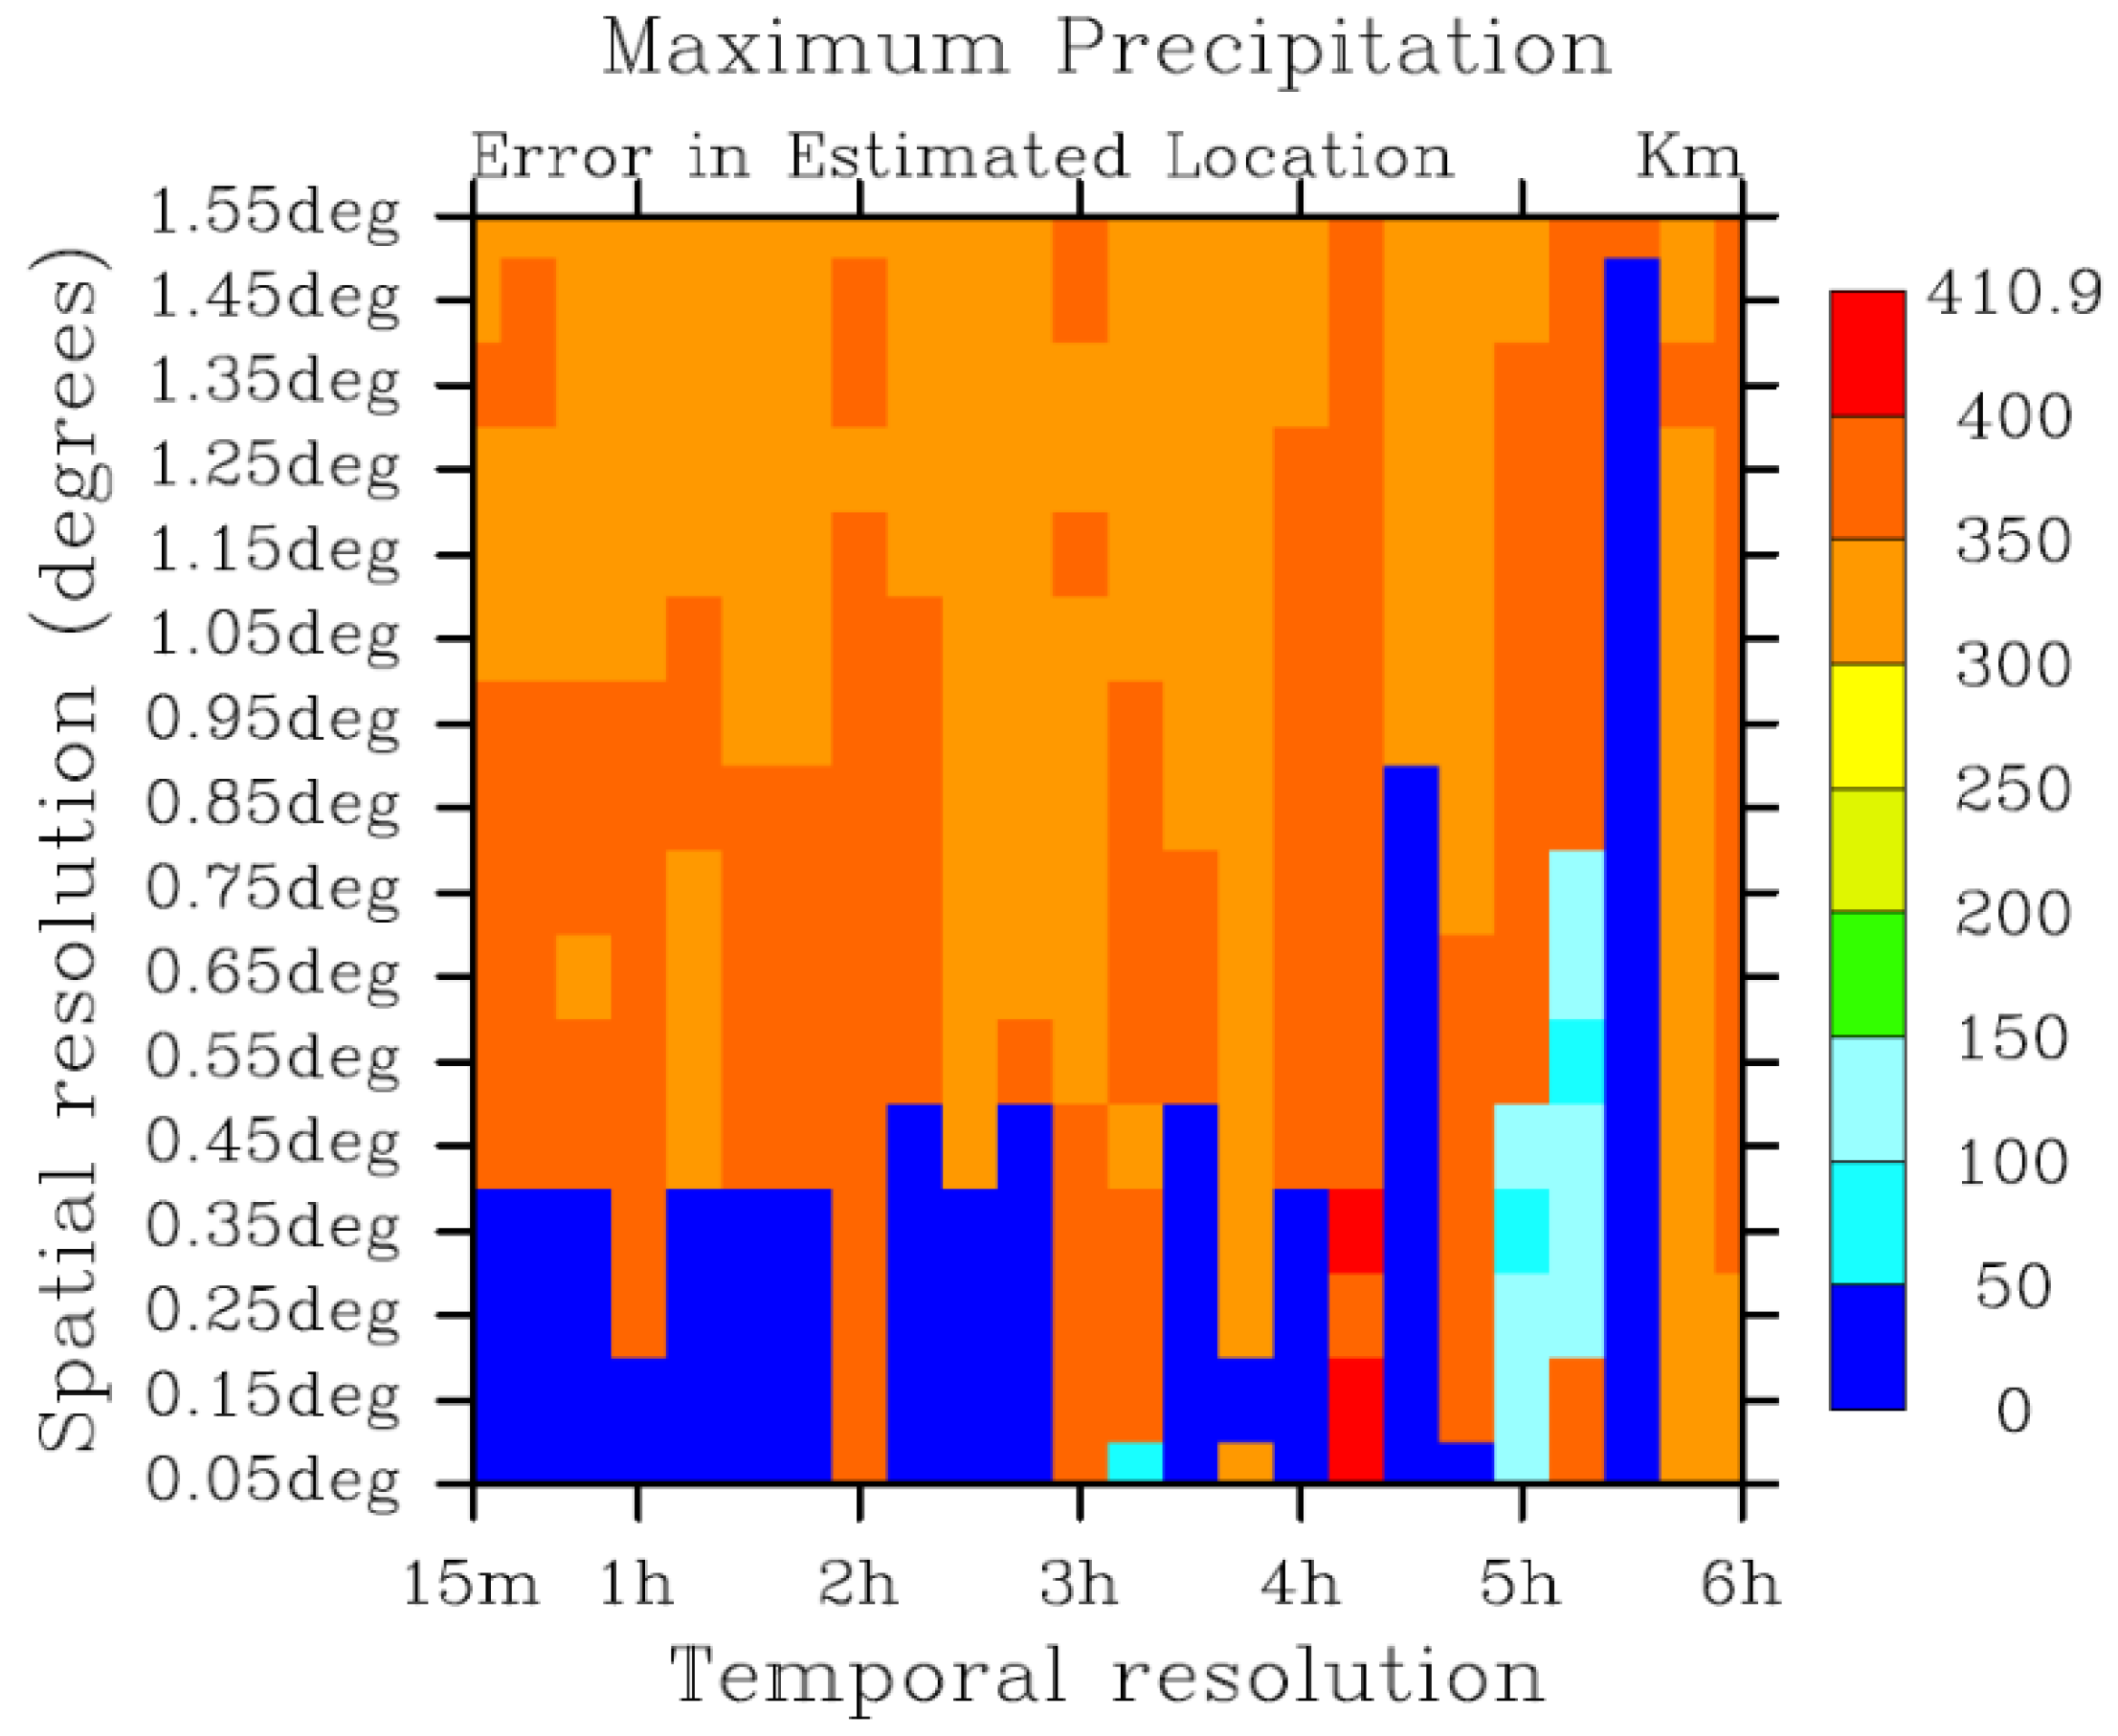
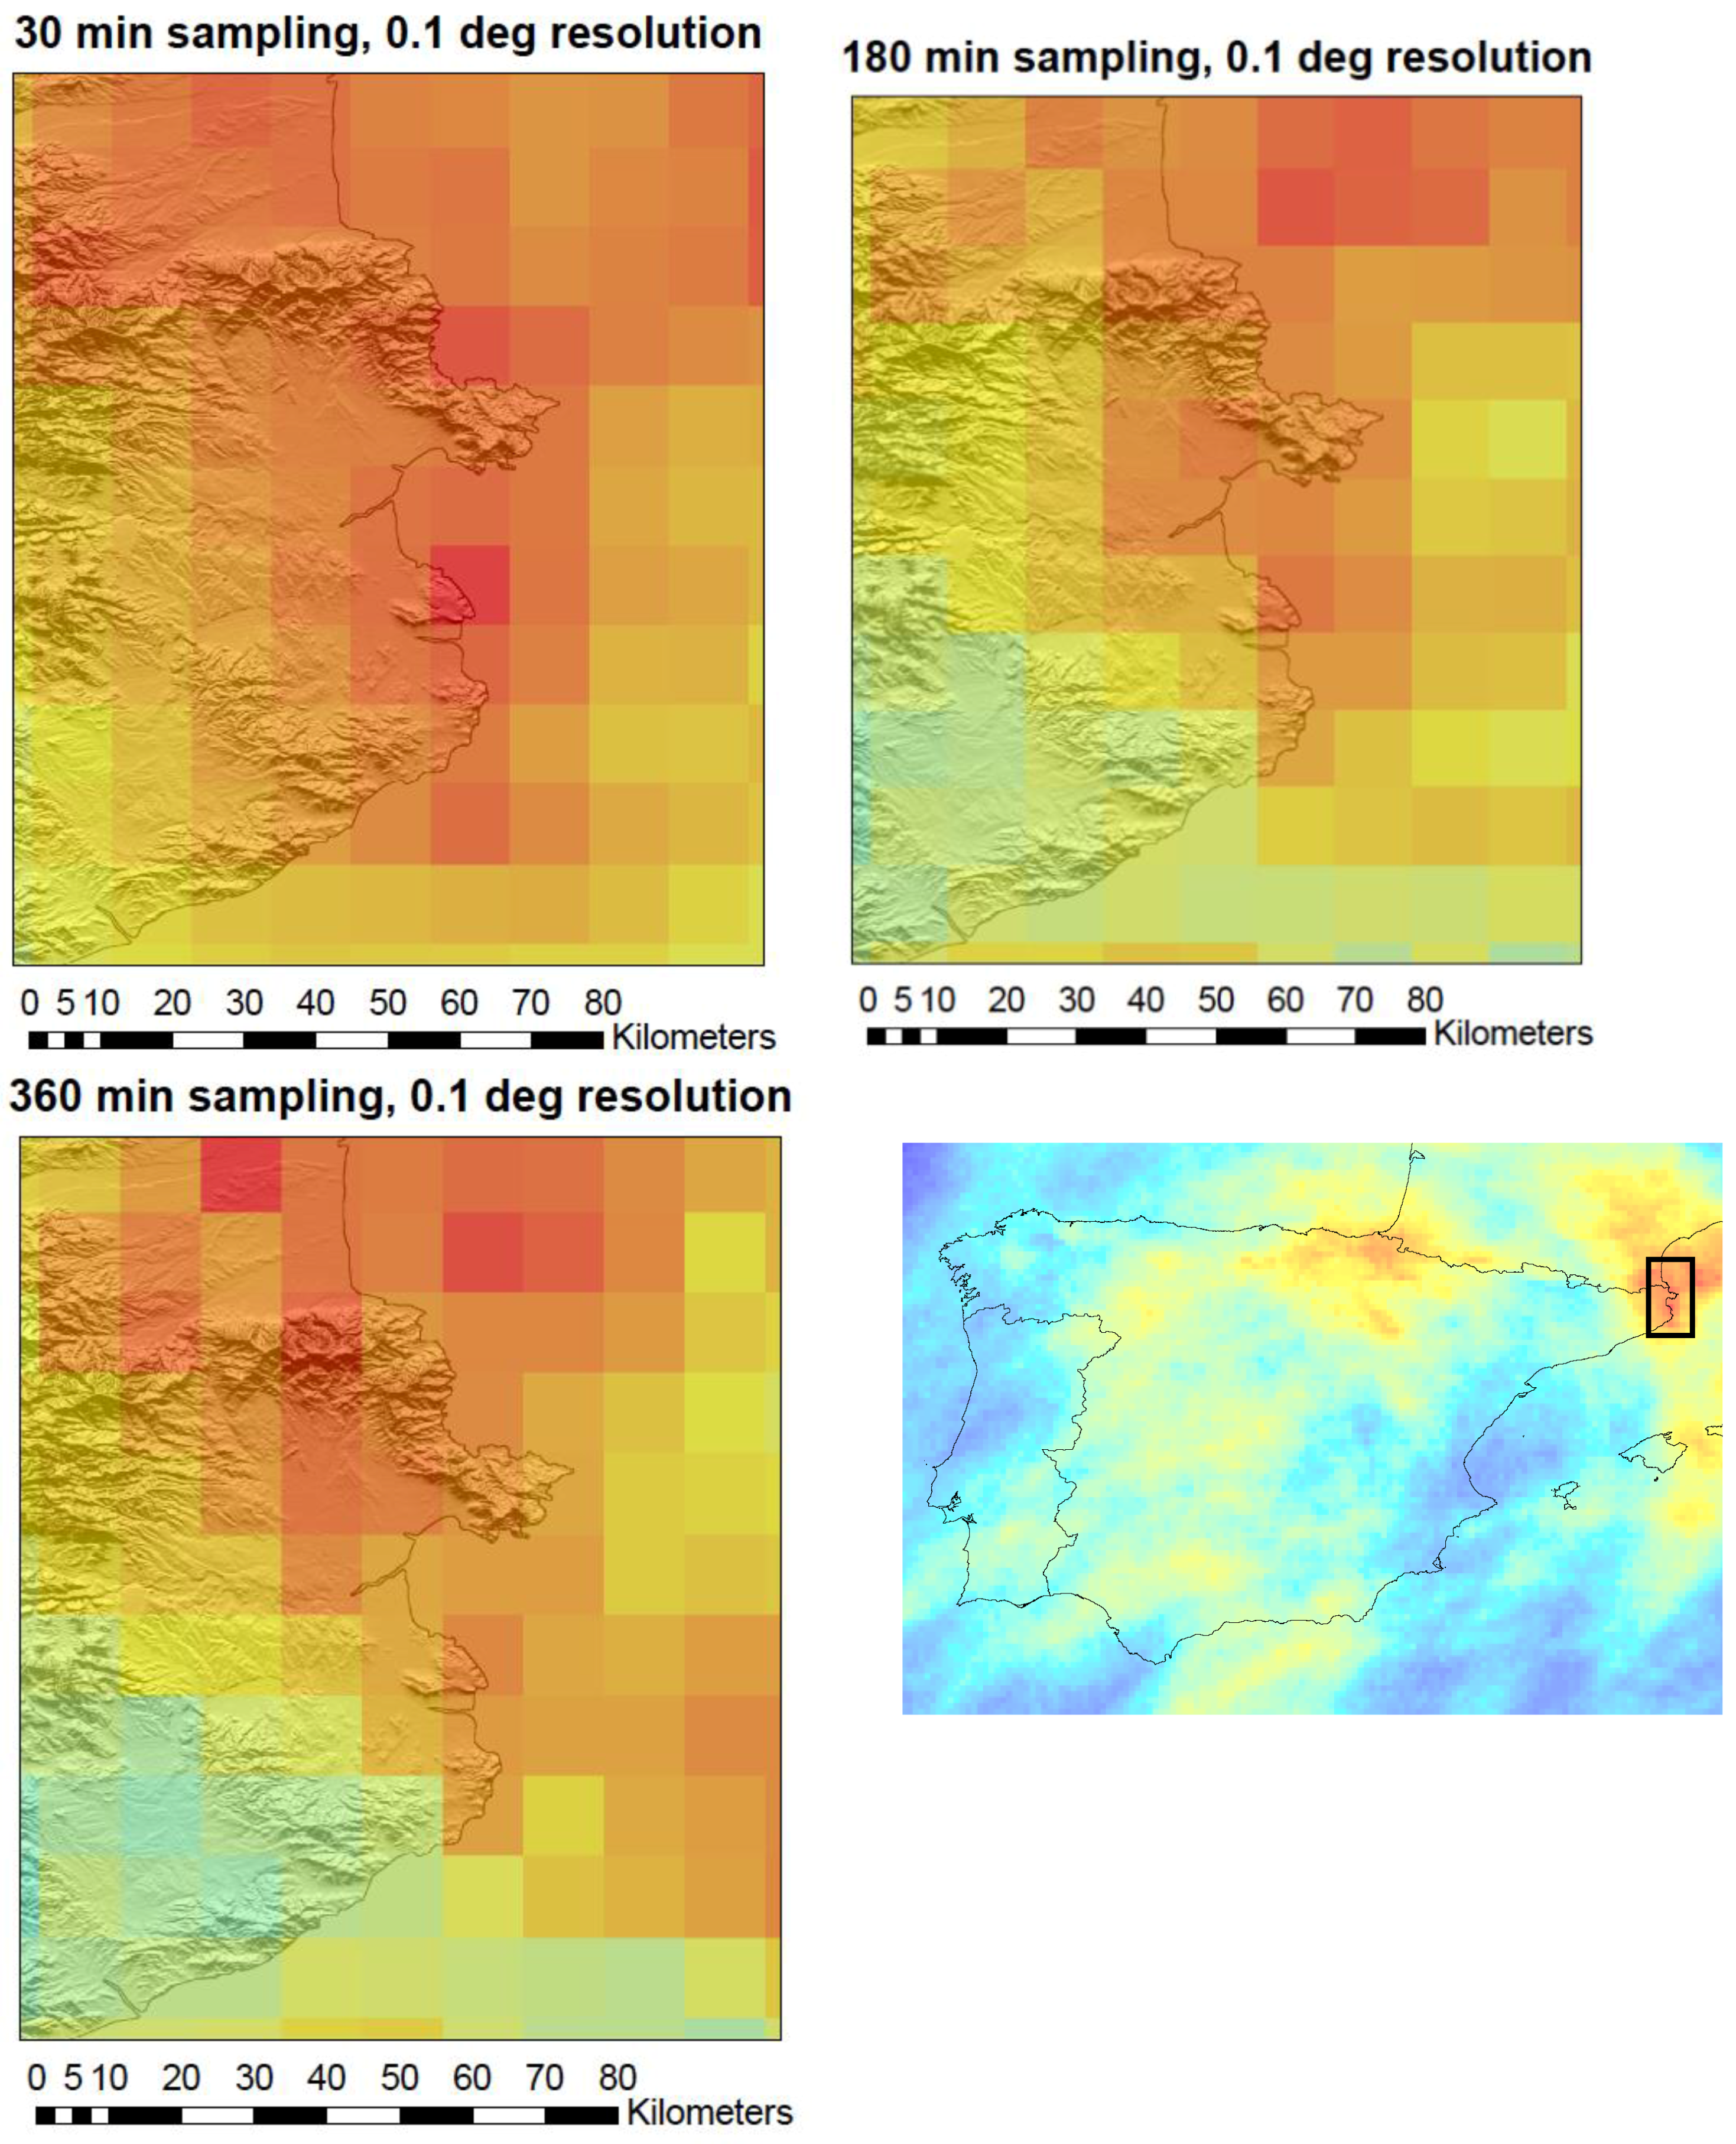
4. Results and Discussion
5. Conclusions
Author Contributions
Acknowledgments
Conflicts of Interest
References
- Pu, Z.; Tao, W.-K.; Braun, S.; Simpson, J.; Jia, Y.; Halverson, J.; Olson, W.; Hou, A.; Pu, Z.; Tao, W.-K.; et al. The Impact of TRMM Data on Mesoscale Numerical Simulation of Supertyphoon Paka. Mon. Weather Rev. 2002, 130, 2448–2458. [Google Scholar] [CrossRef]
- Zhang, X.; Xiao, Q.; Fitzpatrick, P.J. The Impact of Multisatellite Data on the Initialization and Simulation of Hurricane Lili’s (2002) Rapid Weakening Phase. Mon. Weather Rev. 2007, 135, 526–548. [Google Scholar] [CrossRef]
- Xiao, Q.; Zou, X.; Kuo, Y.-H. Incorporating the SSM/I-Derived Precipitable Water and Rainfall Rate into a Numerical Model: A Case Study for the ERICA IOP-4 Cyclone. Mon. Weather Rev. 2000, 128, 87–108. [Google Scholar] [CrossRef]
- Tapiador, F.J.; Behrangi, A.; Haddad, Z.S.; Katsanos, D.; De Castro, M. Disruptions in precipitation cycles: Attribution to anthropogenic forcing. J. Geophys. Res. Atmos. 2016, 121, 2161–2177. [Google Scholar] [CrossRef]
- Tao, W.K.; Chen, J.P.; Li, Z.; Wang, C.; Zhang, C. Impact of aerosols on convective clouds and precipitation. Rev. Geophys. 2012, 50. [Google Scholar] [CrossRef]
- Givati, A.; Rosenfeld, D.; Givati, A.; Rosenfeld, D. Quantifying Precipitation Suppression Due to Air Pollution. J. Appl. Meteorol. 2004, 43, 1038–1056. [Google Scholar] [CrossRef]
- Kucera, P.A.; Ebert, E.E.; Turk, F.J.; Levizzani, V.; Kirschbaum, D.; Tapiador, F.J.; Loew, A.; Borsche, M. Precipitation from space: Advancing earth system science. Bull. Am. Meteorol. Soc. 2013, 94, 365–375. [Google Scholar] [CrossRef]
- De Coning, E. Optimizing satellite-based precipitation estimation for nowcasting of rainfall and flash flood events over the South African domain. Remote Sens. 2013, 5, 5702–5724. [Google Scholar] [CrossRef]
- Li, Y.; Grimaldi, S.; Walker, J.P.; Pauwels, V.R.N. Application of remote sensing data to constrain operational rainfall-driven flood forecasting: A review. Remote Sens. 2016, 8, 456. [Google Scholar] [CrossRef]
- Katsanos, D.; Retalis, A.; Tymvios, F.; Michaelides, S. Analysis of precipitation extremes based on satellite (CHIRPS) and in situ dataset over Cyprus. Nat. Hazards 2016, 83, 53–63. [Google Scholar] [CrossRef]
- Marra, F.; Destro, E.; Nikolopoulos, E.I.; Zoccatelli, D.; Dominique Creutin, J.; Guzzetti, F.; Borga, M. Impact of rainfall spatial aggregation on the identification of debris flow occurrence thresholds. Hydrol. Earth Syst. Sci. 2017, 21, 4525–4532. [Google Scholar] [CrossRef]
- Tapiador, F.J.; Navarro, A.; Jiménez, A.; Moreno, R.; García-Ortega, E. Discrepancies with Satellite Observations in the Spatial Structure of Global Precipitation as Derived from Global Climate Models. Q. J. R. Meteorol. Soc. 2018. [Google Scholar] [CrossRef]
- Tapiador, F.J.; Navarro, A.; Levizzani, V.; García-Ortega, E.; Huffman, G.J.; Kidd, C.; Kucera, P.A.; Kummerow, C.D.; Masunaga, H.; Petersen, W.A.; et al. Global precipitation measurements for validating climate models. Atmos. Res. 2017. [Google Scholar] [CrossRef]
- Navarro, A.; Moreno, R.; Tapiador, F.J. Improving the representation of anthropogenic CO2 emissions in climate models: A new parameterization for the Community Earth System Model (CESM). Earth Syst. Dyn. Discuss. 2018, 1–26. [Google Scholar] [CrossRef]
- Michaelides, S.; Levizzani, V.; Anagnostou, E.; Bauer, P.; Kasparis, T.; Lane, J.E. Precipitation: Measurement, remote sensing, climatology and modeling. Atmos. Res. 2009, 94, 512–533. [Google Scholar] [CrossRef]
- Kidd, C.; Levizzani, V. Status of satellite precipitation retrievals. Hydrol. Earth Syst. Sci. 2011, 15, 1109–1116. [Google Scholar] [CrossRef]
- Tapiador, F.J.; Turk, F.J.; Petersen, W.; Hou, A.Y.; García-Ortega, E.; Machado, L.A.T.; Angelis, C.F.; Salio, P.; Kidd, C.; Huffman, G.J.; et al. Global precipitation measurement: Methods, datasets and applications. Atmos. Res. 2012, 104–105, 70–97. [Google Scholar] [CrossRef]
- Levizzani, V.; Laviola, S.; Cattani, E. Detection and Measurement of Snowfall from Space. Remote Sens. 2011, 3, 145–166. [Google Scholar] [CrossRef]
- Stephens, G.L.; Kummerow, C.D. The Remote Sensing of Clouds and Precipitation from Space: A Review. J. Atmos. Sci. 2007, 64, 3742–3765. [Google Scholar] [CrossRef]
- Barrett, E.C.; Beaumont, M.J. Satellite rainfall monitoring: An overview. Remote Sens. Rev. 1994, 11, 23–48. [Google Scholar] [CrossRef]
- Wilheit, T.; Adler, R.; Avery, S.; Barrett, E.; Bauer, P.; Berg, W.; Chang, A.; Ferriday, J.; Grody, N.; Goodman, S.; et al. Algorithms for the retrieval of rainfall from passive microwave measurements. Remote Sens. Rev. 1994, 11, 163–194. [Google Scholar] [CrossRef]
- Hou, A.Y.; Kakar, R.K.; Neeck, S.; Azarbarzin, A.A.; Kummerow, C.D.; Kojima, M.; Oki, R.; Nakamura, K.; Iguchi, T. The global precipitation measurement mission. Bull. Am. Meteorol. Soc. 2014, 95, 701–722. [Google Scholar] [CrossRef]
- Kummerow, C.; Hong, Y.; Olson, W.S.; Yang, S.; Adler, R.F.; McCollum, J.; Ferraro, R.; Petty, G.; Shin, D.-B.; Wilheit, T.T. The Evolution of the Goddard Profiling Algorithm (GPROF) for Rainfall Estimation from Passive Microwave Sensors. J. Appl. Meteorol. 2001, 40, 1801–1820. [Google Scholar] [CrossRef]
- Kummerow, C.; Masunaga, H.; Bauer, P. A next-generation microwave rainfall retrieval algorithm for use by TRMM and GPM. In Measuring Precipitation from Space; Springer: Dordrecht, The Netherlands, 2007; pp. 235–252. ISBN 13 978-1-4020-5834-9. [Google Scholar]
- Kummerow, C.D.; Randel, D.L.; Kulie, M.; Wang, N.Y.; Ferraro, R.; Joseph Munchak, S.; Petkovic, V. The evolution of the goddard profiling algorithm to a fully parametric scheme. J. Atmos. Ocean. Technol. 2015, 32, 2265–2280. [Google Scholar] [CrossRef]
- Sorooshian, S.; Hsu, K.; Coppola, E.; Tomassetti, B.; Verdecchia, M.; Visconti, G. Hydrological Modelling and the Water Cycle. Coupling the Atmospheric and Hydrological Models; Springer: Dordrecht, The Netherlands, 2009; ISBN 9783540778424. [Google Scholar]
- Vicente, G.A.; Scofield, R.A.; Menzel, W.P. The Operational GOES Infrared Rainfall Estimation Technique. Bull. Am. Meteorol. Soc. 1998, 79, 1883–1893. [Google Scholar] [CrossRef]
- Tapiador, F.J.; Kidd, C.; Levizzani, V.; Marzano, F.S. A Neural Networks–Based Fusion Technique to Estimate Half-Hourly Rainfall Estimates at 0.1° Resolution from Satellite Passive Microwave and Infrared Data. J. Appl. Meteorol. 2004, 43, 576–594. [Google Scholar] [CrossRef]
- Ebert, E.E.; Manton, M.J.; Arkin, P.A.; Allam, R.J.; Holpin, G.E.; Gruber, A. Results from the GPCP algorithm intercomparison programme. Bull. Am. Meteorol. Soc. 1996, 77, 2875–2887. [Google Scholar] [CrossRef]
- Skofronick-Jackson, G.; Petersen, W.A.; Berg, W.; Kidd, C.; Stocker, E.F.; Kirschbaum, D.B.; Kakar, R.; Braun, S.A.; Huffman, G.J.; Iguchi, T.; et al. The Global Precipitation Measurement (GPM) Mission for Science and Society. Bull. Am. Meteorol. Soc. 2017, 98, 1679–1695. [Google Scholar] [CrossRef]
- Bizarro, J.P.S. On the behavior of the continuous-time spectrogram for arbitrarily narrow windows. IEEE Trans. Signal Process. 2007, 55, 1793–1802. [Google Scholar] [CrossRef]
- Staelin, D.H.; Gasiewski, A.J.; Kerekes, J.P.; Shields, M.W.; Solman, F.J., III. Concept Proposal for a Geostationary Microwave (GEM) Observatory; prepared for the NASA/NOAA Advanced Geostationary Sensor (AGS) Program; MIT Lincoln Laboratory: Lexington, MA, USA, 1998. [Google Scholar]
- Bizzarri, B.; Amato, U.; Bates, J.; Benesch, W.; Bühler, S.; Capaldo, M.; Cervino, M.; Cuomo, V.; De Leonibus, L.; Desbois, M.; et al. Requirements and perspectives for MW/sub-mm sounding from geostationary satellite. In Proceedings of the EUMETSAT Meteorological Satellite Conference, Dublin, Ireland, 2–6 September 2002; pp. 97–105. [Google Scholar]
- Gasiewski, A.J. Numerical sensitivity analysis of passive ehf and SMMW channels to tropospheric water vapor, clouds, and precipitation. IEEE Trans. Geosci. Remote Sens. 1992, 30, 859–870. [Google Scholar] [CrossRef]
- Tapiador, F.J.; Gaertner, M.A.; Romera, R.; Castro, M. A multisource analysis of hurricane vince. Bull. Am. Meteorol. Soc. 2007, 88, 1027–1032. [Google Scholar] [CrossRef]
- Ver Hoef, J.M.; Cressie, N. Multivariable spatial prediction. Math. Geol. 1993, 25, 219–240. [Google Scholar] [CrossRef]
- Jaynes, E.T. Information theory and statistical mechanics. Phys. Rev. 1957, 106, 620–630. [Google Scholar] [CrossRef]
- Tapiador, F.J.; Kidd, C.; Hsu, K.-L.; Marzano, F. Neural networks in satellite rainfall estimation. Meteorol. Appl. 2004, 11, 83–91. [Google Scholar] [CrossRef]
- Sorooshian, S.; Hsu, K.L.; Gao, X.; Gupta, H.V.; Imam, B.; Braithwaite, D. Evaluation of PERSIANN system satellite-based estimates of tropical rainfall. Bull. Am. Meteorol. Soc. 2000, 81, 2035–2046. [Google Scholar] [CrossRef]
- Turk, F.J.; Hawkins, J.; Smith, E.A.; Marzano, F.S.; Mugnai, A.; Levizzani, V. Combining SSM/I, TRMM and Infrared Geostationary Satellite Data in a Near-realtime Fashion for Rapid Precipitation Updates: Advantages and Limitations. In Proceedings of the 2000 EUMETSAT Meteorological Satellite Data Users’ Conference, Bologna, Italy, 29 May–2 June 2000; pp. 452–459. [Google Scholar]
- Marzano, F.S.; Palmacci, M.; Cimini, D.; Giuliani, G.; Tapiador, F.; Turk, J.F. Multivariate probability matching of satellite infrared and microwave radiometric measurements for rainfall retrieval at the geostationary scale. In Proceedings of the 2003 IEEE International Geoscience and Remote Sensing Symposium. Proceedings (IEEE Cat. No.03CH37477), Toulouse, France, 21–25 July 2003; Volume 2, pp. 1151–1153. [Google Scholar]
- Joyce, R.J.; Janowiak, J.E.; Arkin, P.A.; Xie, P. CMORPH: A Method that Produces Global Precipitation Estimates from Passive Microwave and Infrared Data at High Spatial and Temporal Resolution. J. Hydrometeorol. 2004, 5, 487–503. [Google Scholar] [CrossRef]
- Turk, F.J.; Bauer, P.; Ebert, E.; Arkin, P.A. Satellite-derived precipitation verification activities within the International Precipitation Working Group (IPWG). In 14th Conference on Satellite Meteorology and Oceanography; American Meteor Society: Atlanta, GA, USA, 2006. [Google Scholar]
- Tapiador, F.J. A physically based satellite rainfall estimation method using fluid dynamics modelling. Int. J. Remote Sens. 2008, 29, 5851–5862. [Google Scholar] [CrossRef]
- Huffman, G.J.; Adler, R.F.; Arkin, P.; Chang, A.; Ferraro, R.; Gruber, A.; Janowiak, J.; McNab, A.; Rudolf, B.; Schneider, U. The Global Precipitation Climatology Project (GPCP) Combined Precipitation Dataset. Bull. Am. Meteorol. Soc. 1997, 78, 5–20. [Google Scholar] [CrossRef]
- Adler, R.F.; Sapiano, M.R.P.; Huffman, G.J.; Wang, J.J.; Gu, G.; Bolvin, D.; Chiu, L.; Schneider, U.; Becker, A.; Nelkin, E.; et al. Bin the Global Precipitation Climatology Project (GPCP) monthly analysis (New Version 2.3) and a review of 2017 global precipitation. Atmosphere 2018, 9, 138. [Google Scholar] [CrossRef]
- Jaynes, E.T. Probability Theory as Logic. In Maximum Entropy and Bayesian Methods; Springer: Dordrecht, The Netherlands, 1990; pp. 1–16. ISBN 9789401067928. [Google Scholar]


© 2018 by the authors. Licensee MDPI, Basel, Switzerland. This article is an open access article distributed under the terms and conditions of the Creative Commons Attribution (CC BY) license (http://creativecommons.org/licenses/by/4.0/).
Share and Cite
Tapiador, F.J.; Marcos, C.; Navarro, A.; Jiménez-Alcázar, A.; Moreno Galdón, R.; Sanz, J. Decorrelation of Satellite Precipitation Estimates in Space and Time. Remote Sens. 2018, 10, 752. https://doi.org/10.3390/rs10050752
Tapiador FJ, Marcos C, Navarro A, Jiménez-Alcázar A, Moreno Galdón R, Sanz J. Decorrelation of Satellite Precipitation Estimates in Space and Time. Remote Sensing. 2018; 10(5):752. https://doi.org/10.3390/rs10050752
Chicago/Turabian StyleTapiador, Francisco J., Cecilia Marcos, Andres Navarro, Alfonso Jiménez-Alcázar, Raul Moreno Galdón, and Julia Sanz. 2018. "Decorrelation of Satellite Precipitation Estimates in Space and Time" Remote Sensing 10, no. 5: 752. https://doi.org/10.3390/rs10050752
APA StyleTapiador, F. J., Marcos, C., Navarro, A., Jiménez-Alcázar, A., Moreno Galdón, R., & Sanz, J. (2018). Decorrelation of Satellite Precipitation Estimates in Space and Time. Remote Sensing, 10(5), 752. https://doi.org/10.3390/rs10050752