Article

Effects of Warming Hiatuses on Vegetation Growth in the Northern Hemisphere

1
State Key Laboratory of Remote Sensing Science, Jointly Sponsored by Beijing Normal University and Institute of Remote Sensing and Digital Earth of Chinese Academy of Sciences, Beijing 100875, China
2
Beijing Engineering Research Center for Global Land Remote Sensing Products, Institute of Remote Sensing Science and Engineering, Faculty of Geographical Science, Beijing Normal University, Beijing 100875, China
3
Remote Sensing Ground System Department, China Siwei Surveying and Mapping Technology Co. Ltd., Beijing 100094, China
4
Department of Geographical Sciences, University of Maryland, College Park, MD 20742, USA
5
State Key Laboratory of Earth Surface Processes and Resource Ecology, Beijing Normal University, Beijing 100875, China
6
College of Urban and Environmental Sciences, Peking University, Beijing 100871, China
7
Division of Environment and Sustainability, The Hong Kong University of Science and Technology, Kowloon, Hong Kong, China
*
Author to whom correspondence should be addressed.
Remote Sens. 2018, 10(5), 683; https://doi.org/10.3390/rs10050683
Submission received: 21 March 2018 / Revised: 16 April 2018 / Accepted: 23 April 2018 / Published: 27 April 2018
(This article belongs to the Special Issue Remote Sensing of Land-Atmosphere Interactions)

Abstract

:
There have been hiatuses in global warming since the 1990s, and their potential impacts have attracted extensive attention and discussion. Changes in temperature not only directly affect the greening of vegetation but can also indirectly alter both the growth state and the growth tendency of vegetation by altering other climatic elements. The middle-high latitudes of the Northern Hemisphere (NH) constitute the region that has experienced the most warming in recent decades; therefore, identifying the effects of warming hiatuses on the vegetation greening in that region is of great importance. Using satellite-derived Normalized Difference Vegetation Index (NDVI) data and climatological observation data from 1982–2013, we investigated hiatuses in warming trends and their impact on vegetation greenness in the NH. Our results show that the regions with warming hiatuses in the NH accounted for 50.1% of the total area and were concentrated in Mongolia, central China, and other areas. Among these regions, 18.8% of the vegetation greenness was inhibited in the warming hiatus areas, but 31.3% of the vegetation grew faster. Because temperature was the main positive climatic factor in central China, the warming hiatuses caused the slow vegetation greening rate. However, precipitation was the main positive climatic factor affecting vegetation greenness in Mongolia; an increase in precipitation accelerated vegetation greening. The regions without a warming hiatus, which were mainly distributed in northern Russia, northern central Asia, and other areas, accounted for 49.9% of the total area. Among these regions, 21.4% of the vegetation grew faster over time, but 28.5% of the vegetation was inhibited. Temperature was the main positive factor affecting vegetation greenness in northern Russia; an increase in temperature promoted vegetation greening. However, radiation was the main positive climatic factor in northern central Asia; reductions in radiation inhibited the greenness of vegetation. Our findings suggest that warming hiatuses differentially affect vegetation greening and depend on meteorological factors, especially the main meteorological factors.

Graphical Abstract

1. Introduction

Global warming has generated extensive concern and is a hot research topic [1,2]. The average sea and land surface temperature at a global scale rose 0.85 °C from 1880–2012 [3]. The temperature has risen an average of 0.12 °C per decade over the past 50 years [4,5]. In the short term, global climate warming hiatuses have occurred since the middle and late 1990s [2,6,7,8]. The variation tendencies of the Atlantic multidecadal oscillation (AMO) and Pacific multidecadal oscillation (PMO) show that natural changes in the Atlantic and Pacific counteract potential global warming [9,10,11]. As a result, the climatic variability or the temperature changes caused by weather can temporarily exceed the global warming tendency, leading to the warming hiatus phenomena.
Vegetation greening is affected by climatic elements, including temperature, radiation, and precipitation [12,13,14]. Variations in global land surface temperature can alter the steady state of radiation and precipitation, thereby influencing the greenness and spatial distribution of land surface vegetation. Therefore, temperature is a crucial meteorological factor affecting vegetation greenness, especially in the middle-high latitudes of the Northern Hemisphere (NH), as this region is sensitive to temperature [15,16,17,18]. Vegetation greenness in the middle-high latitudes of the NH is influenced mainly by temperature and radiation [15]. In the temperate zone of Eurasia, changes in the vegetation greening trend in the summers from 1997–2006 were caused mainly by the reduction in precipitation [19].
Variations in global land surface temperature, such as warming hiatuses, can affect the greenness and spatial distribution of land surface vegetation. In general, a “hiatus” refers to a pause in the change in the global average surface temperature. In the context of a global warming hiatus, the temperatures in different parts of the world are different. At the local scale, it refers to pauses in local temperature changes with variable timing and length. Climate change in the temperate regions of the Eurasian continent is closely related to vegetation greenness [19]. The impact of global warming on the Qinghai-Tibet Plateau ecosystem is positive, but temporal and spatial imbalances remain [20]. The interactions between a long-term series of Normalized Difference Vegetation Index (NDVI) and dynamic climate changes in the Mongolian Plateau showed that the NDVI during the growing season clearly tended to increase as the temperature and precipitation increased during the middle and late 1990s [21]. These studies suggest that vegetation greenness may be affected by warming and warming hiatuses.
At least three deficiencies currently exist in the study of the effects of warming hiatuses on vegetation. First, large-scale data about the spatial distribution of warming hiatuses in the NH and their effects on vegetation greenness are lacking. Second, most studies have reported the effects of only a single temperature factor or two factors (temperature and precipitation) on vegetation greenness [12,19,22,23,24]. However, radiation is also an important factor affecting vegetation greenness in the majority of the NH [15]. Therefore, most studies lack comprehensive analyses of these three meteorological variables and have not accounted for the interactive effects between them. Lastly, studies investigating the effects of warming hiatuses on vegetation usually have not considered the time lag in the response of vegetation to climate change [5,19,25]. In actuality, vegetation greening is not always predominantly influenced by only the current climatic conditions. Due to the lag in the response of vegetation to climate, the climatic conditions in the earlier stages of growth can also affect the current greening state of vegetation.
Based on the above considerations, the purposes of this study were as follows: (i) to determine the regions that have experienced a warming hiatus over the NH and (ii) to analyze the corresponding changes in vegetation in the regions that have experienced a warming hiatus. In consideration of the lag time of vegetation greening in response to climatic elements, the turning time and its spatial distribution of warming hiatuses in the NH were determined. In addition, the effects of both a warming hiatus and accelerated warming on vegetation greenness were comprehensively analyzed by investigating a combination of vegetation greenness and three climatic elements, including temperature, radiation, and precipitation.

2. Materials and Methods

2.1. Data Sources

In this study, to estimate warming hiatuses, we used the Climatic Research Unit (CRU) TS3.24.01 [26] monthly temperature data set, which was obtained using spatial interpolation from more than 4000 meteorological stations worldwide [27]. To determine the main cause of vegetation changes, radiation data was obtained from the CRU-National Centers for Environmental Prediction (NCEP) V5.2 dataset [28]. Precipitation data was obtained from CRU TS3.24.01 [26]. Vegetation indices were widely used for the global or regional monitoring of vegetation conditions and dynamics [17,29,30]. Global Inventory Modeling and Mapping Studies (GIMMS) NDVI3g data [15,30,31] from 1981–2013 was used to represent the vegetation greening status. In the present study, the maximum value composite was used to synthesize the NDVI data every 15 days for the monthly data, a technique that can largely remove atmospheric noise [32]. Land cover type data from the Moderate Resolution Imaging Spectroradiometer (MODIS) MCD12C1 first classification scheme with unchanged types from 2001–2012 was used to distinguish the vegetation types in the NH. The leaf area index (LAI) simulated in the BIOME-BGC and CLASS-CTEM-N+ models from the Multi-Scale Synthesis and Terrestrial Biosphere Model Inter-comparison Project (MsTMIP) was also used to validate the NDVI data [33]. The spatial resolution of all data was resampled with the nearest neighbor interpolation to the 0.5 degree for the various analyses.

2.2. Detection of Regions that Have Experienced a Warming Hiatus

In this study, the NDVI used was the average of the growing season (April–October). Considering a certain lag time in the response of vegetation to climatic factors, this study also used the maximum correlation method to calculate the lag time of temperature [15].
The piecewise linear fitting model [19,34,35] was used to detect whether there was a warming hiatus during the study period from 1982–2013 with the following model:
y i = { b 1 + b 2 t i ,                                                                                   t i < b 3 b 1 + b 2 t i + b 4 ( t i b 3 ) ,                               t i b 3
in which y i is the temperature; t is the time; b3 is the estimated turning point; and b1, b2, and b4 are the regression coefficients.
Before the turning point, the slope of the temperature change with time is k1, but after the turning point, the slope is k2. Equation 1. shows that k1 = b2 and k2 = b2 + b4.
The temperature variation tendencies k1 and k2 before and after the turning point were compared pixel by pixel. The regions with a warming hiatus were then confirmed when k1 > k2, which indicated that the warming trend became slower. When k1 < k2, the warming trend became faster.

2.3. Normalized Difference Vegetation Index Change Trend Calculations

Calculating and determining the statistics of the degree of change in the vegetation greening status before and after the turning point are beneficial for understanding and analyzing changes in vegetation in all regions. To detect the effects of warming hiatuses on vegetation greenness, the NDVI change trends were calculated and compared to the NDVI trends before and after the turning point. Via pixel-by-pixel comparisons of the NDVI change trends v 1 and v 2 before and after the turning point, the effects of temperature change on vegetation were confirmed. When v 1 > v 2 , the vegetation greening trend was weakened; when v 1 < v 2 , the vegetation greening rate was enhanced. The relative change in the NDVI trends can be expressed as v r as follows:
v r = v 2 v 1 | v 1 |
in which v 1 and v 2 refer to the NDVI change trends before and after the turning point.

2.4. Driving Factors Affecting Vegetation Greenness

To identify the causes underlying changes in vegetation before and after the turning point, we needed to detect the main driving climatic factors affecting vegetation change. The partial correlation coefficient of the GIMMS NDVI with each climatic factor was calculated according to the following Equation (3) [15]:
  r 12 , 34 2 = R 1 ( 2 , 3 , 4 )   2 R 1 ( 3 , 4 ) 2 1 R 1 ( 3 , 4 ) 2                  
in which r 12 , 34 is the partial correlation coefficient of variables 1 and 2 when the other variables are controlled; R 1 ( 2 , 3 , 4 ) 2 is the coefficient of determination when the regression analysis is carried out for variables 1 and 2, 3, 4; and R 1 ( 3 , 4 ) 2 is the coefficient of determination when the regression analysis is carried out for variables 1 and 3, 4. In our study, variable 1 stands for NDVI, and variables 2, 3, 4 stand for the temperature, precipitation, and radiation.

3. Results

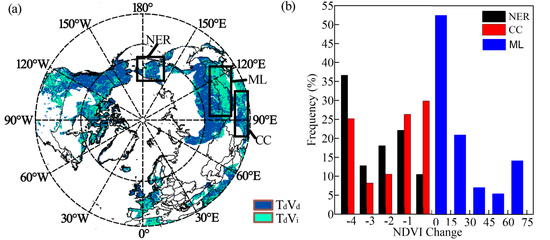
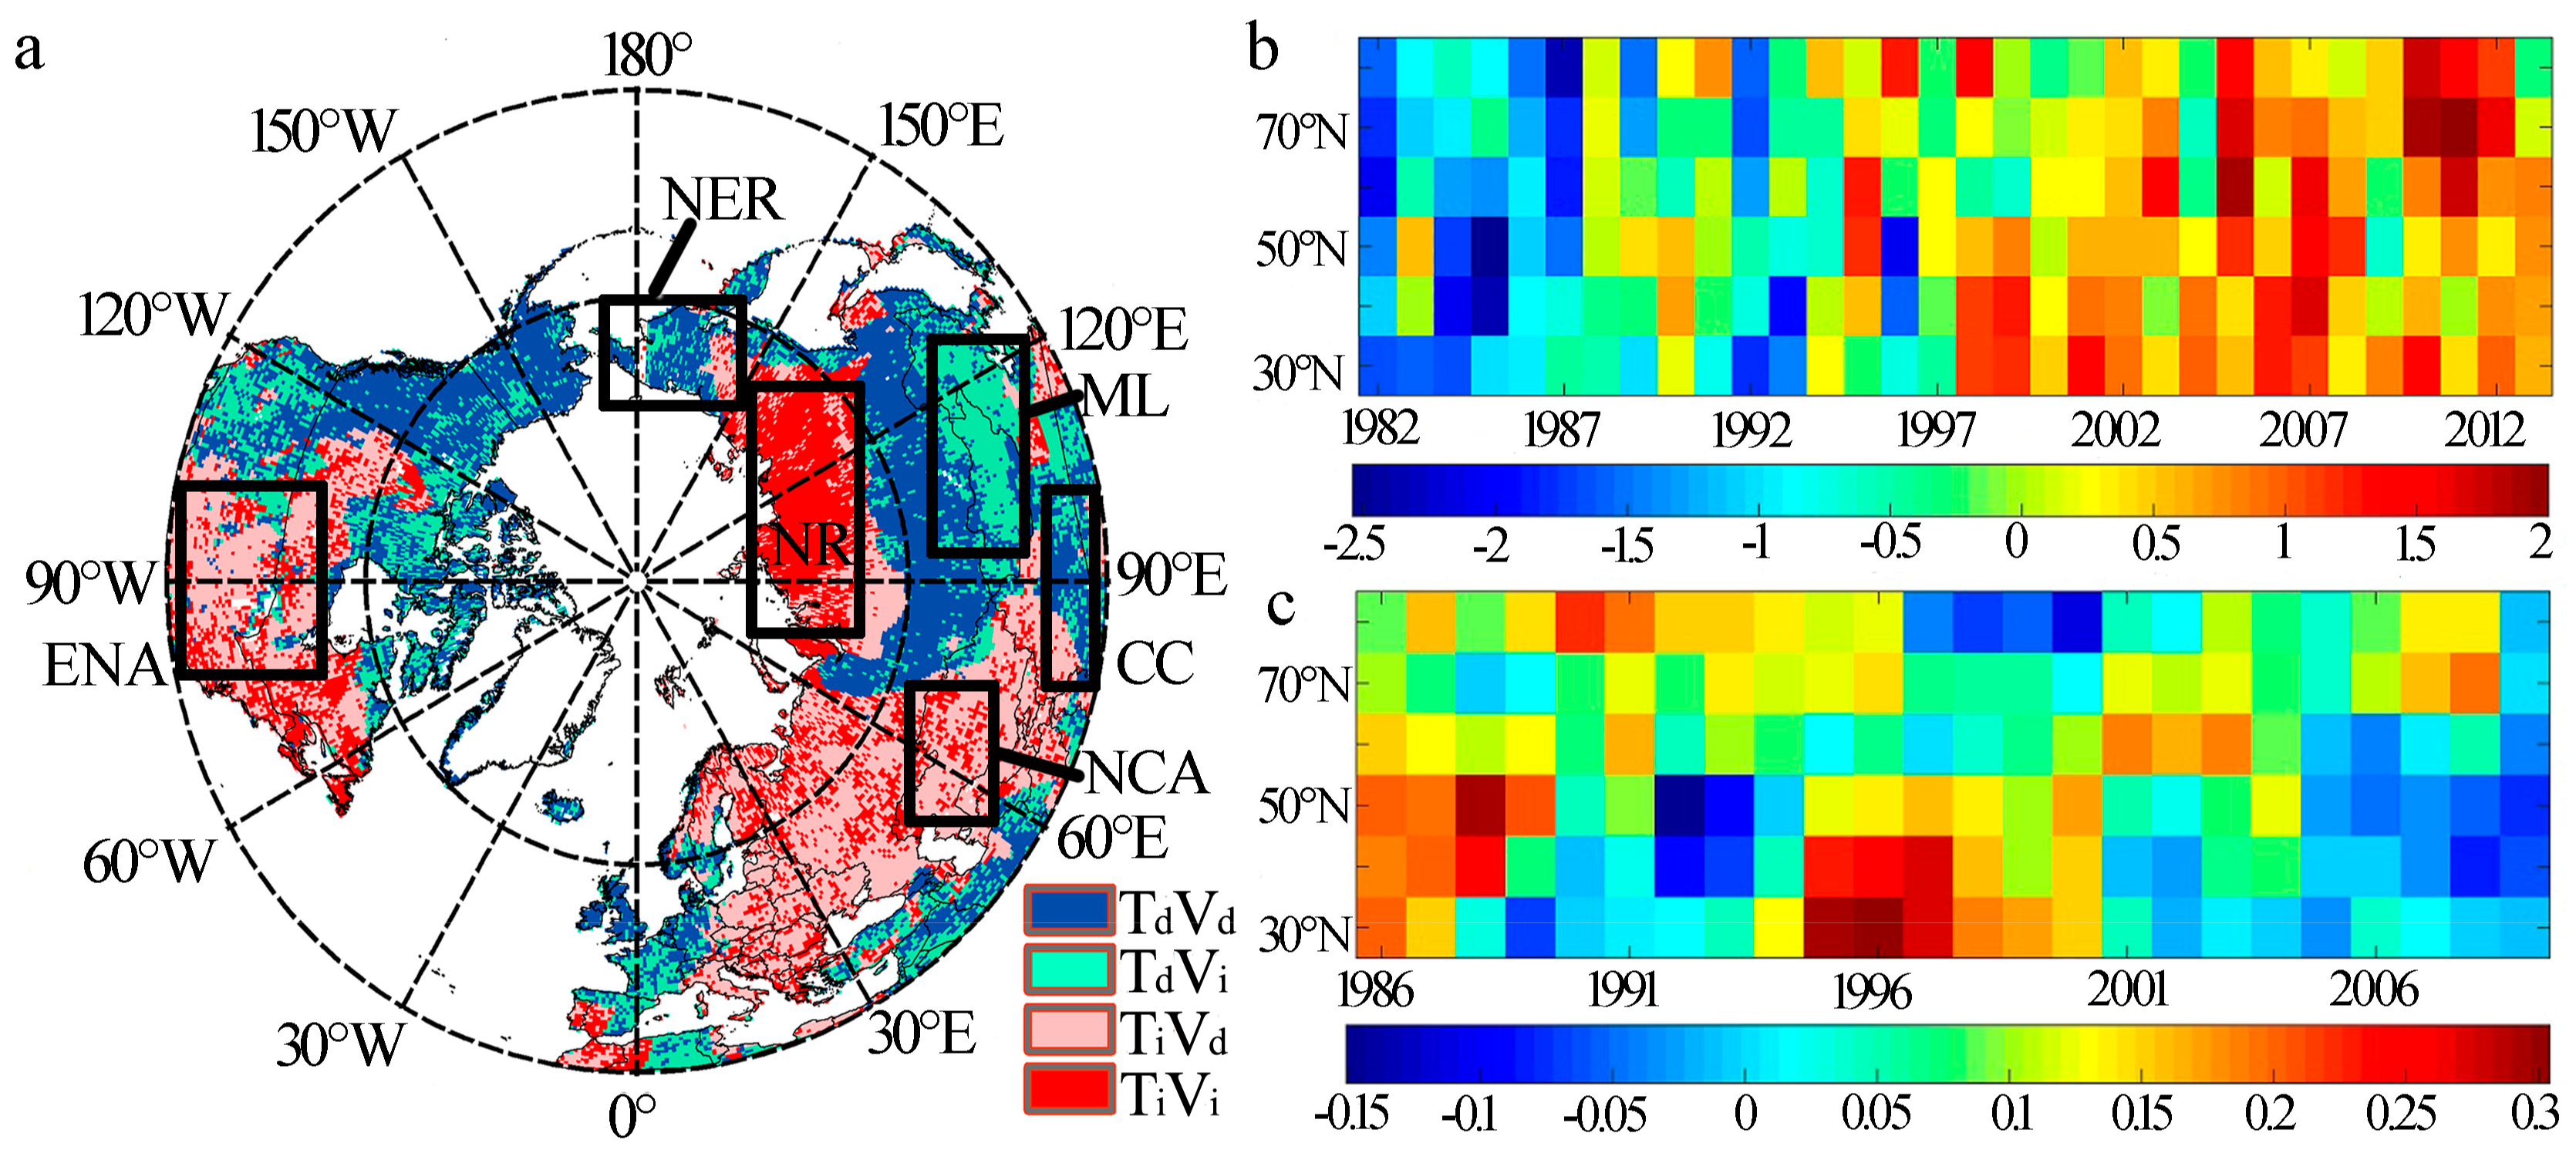
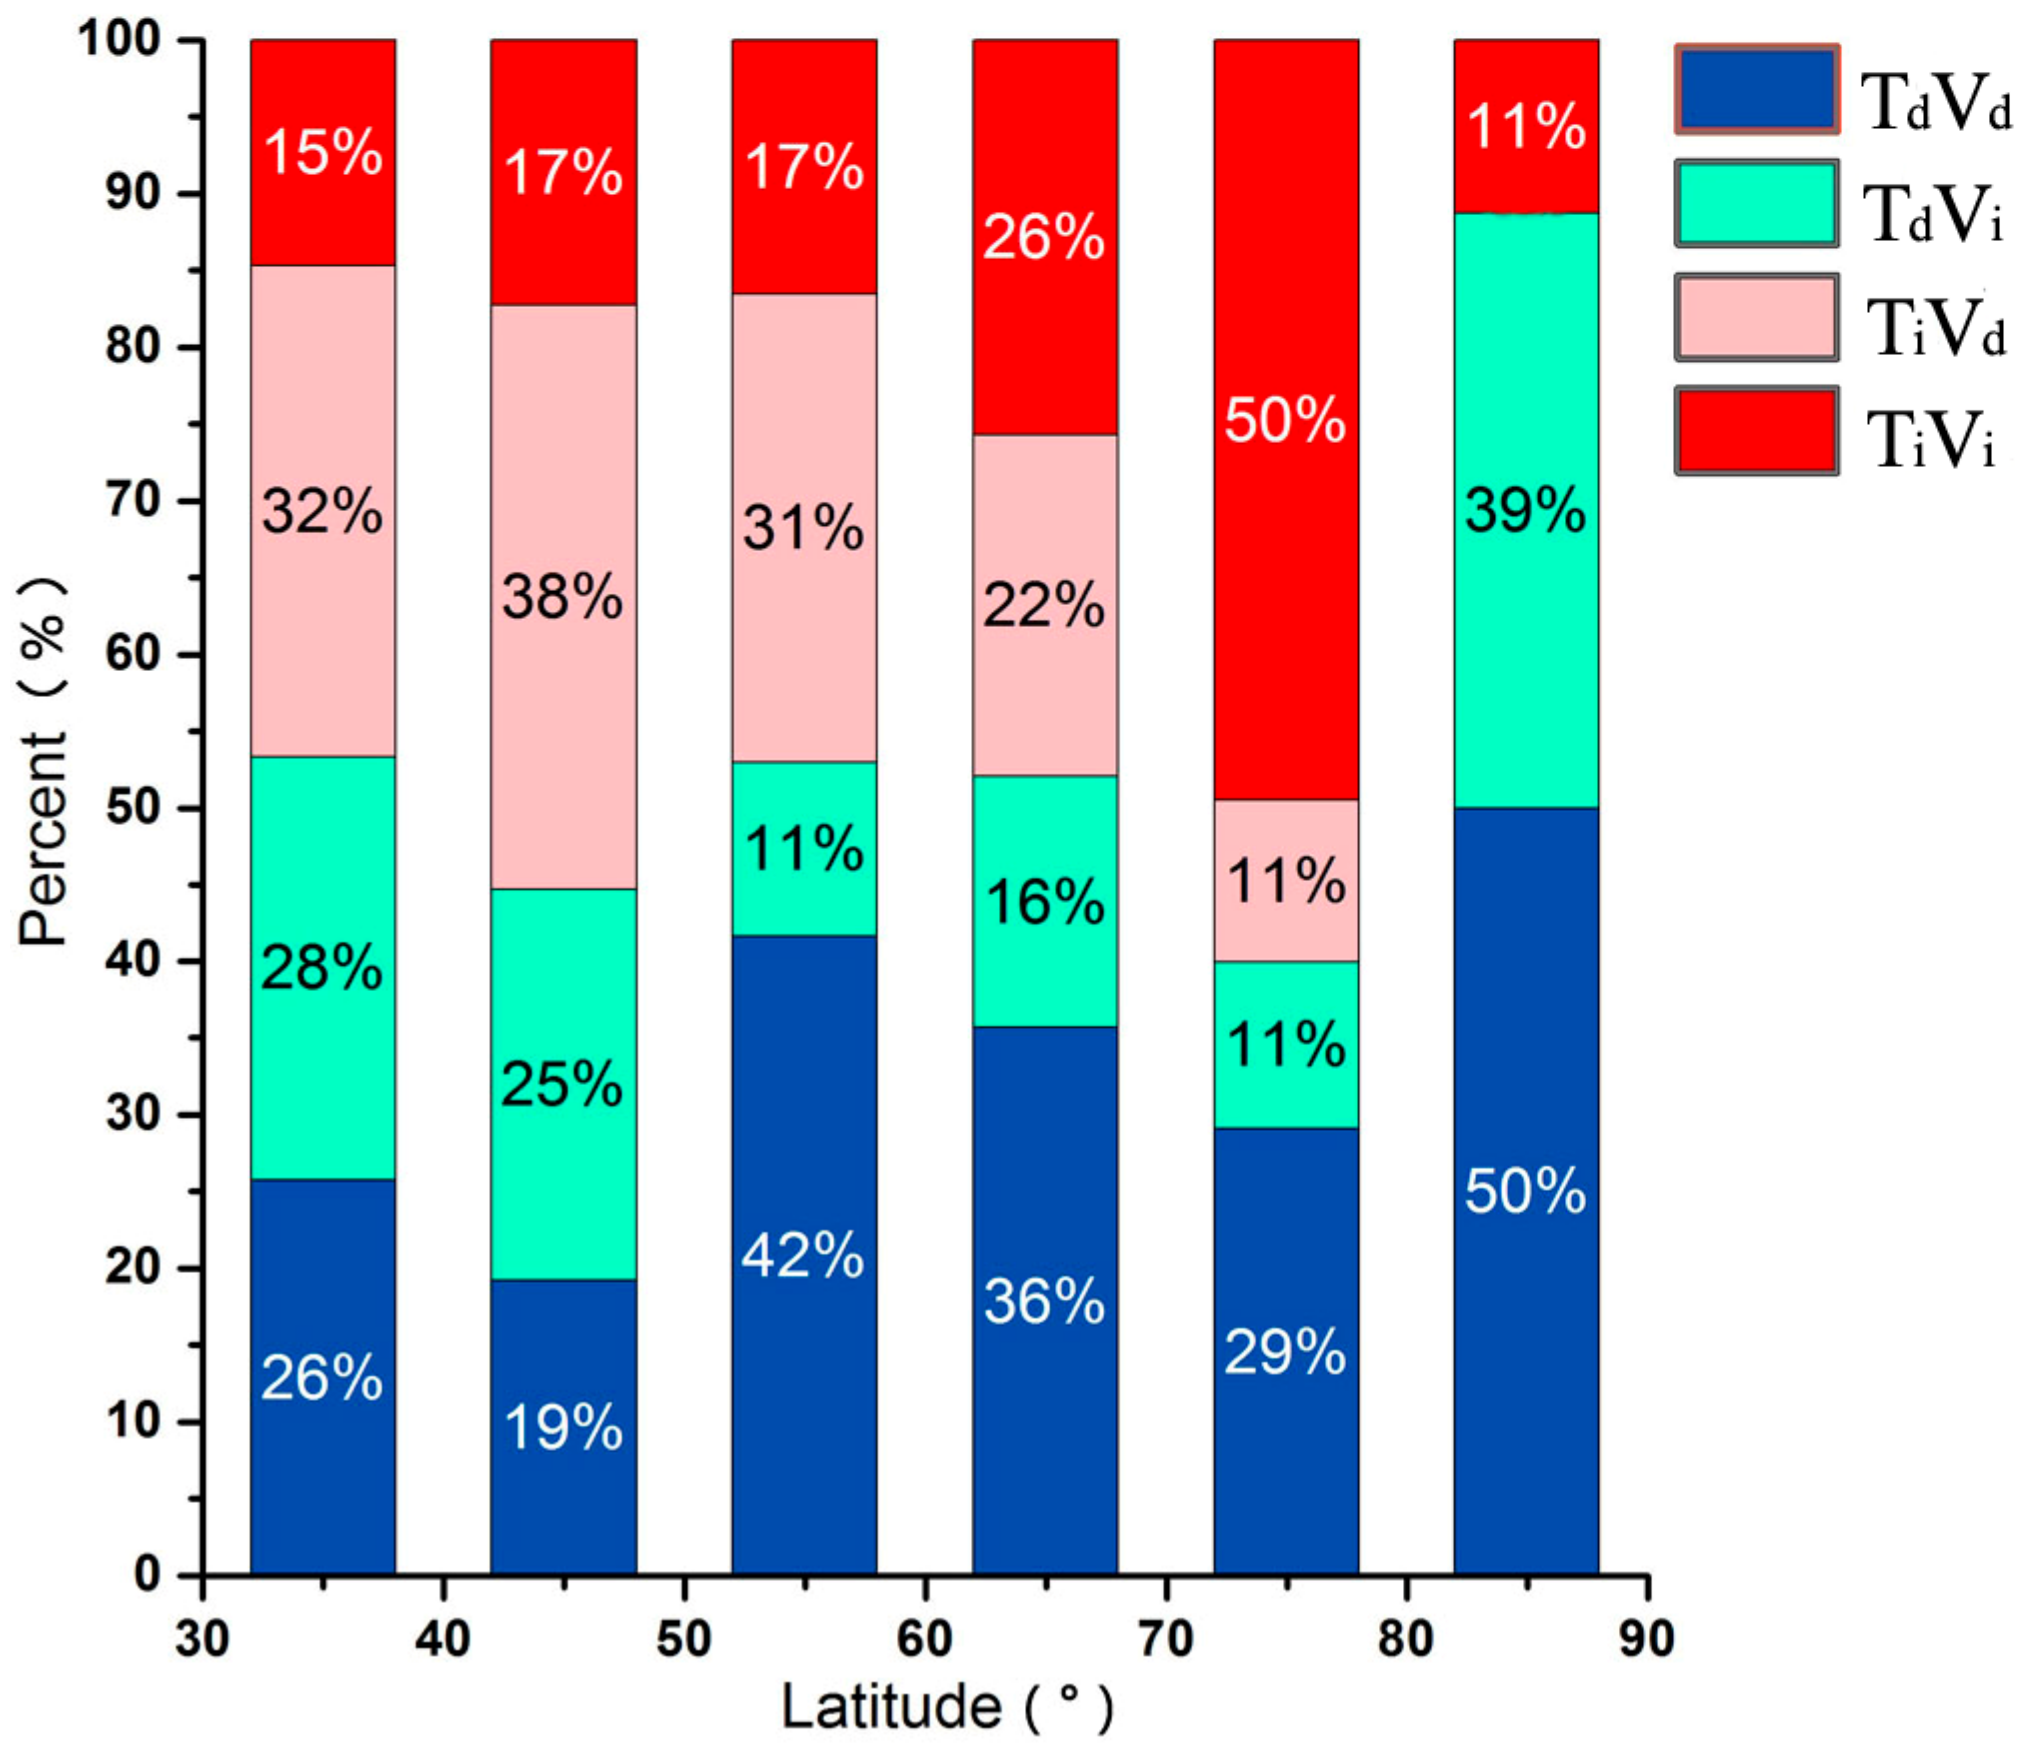
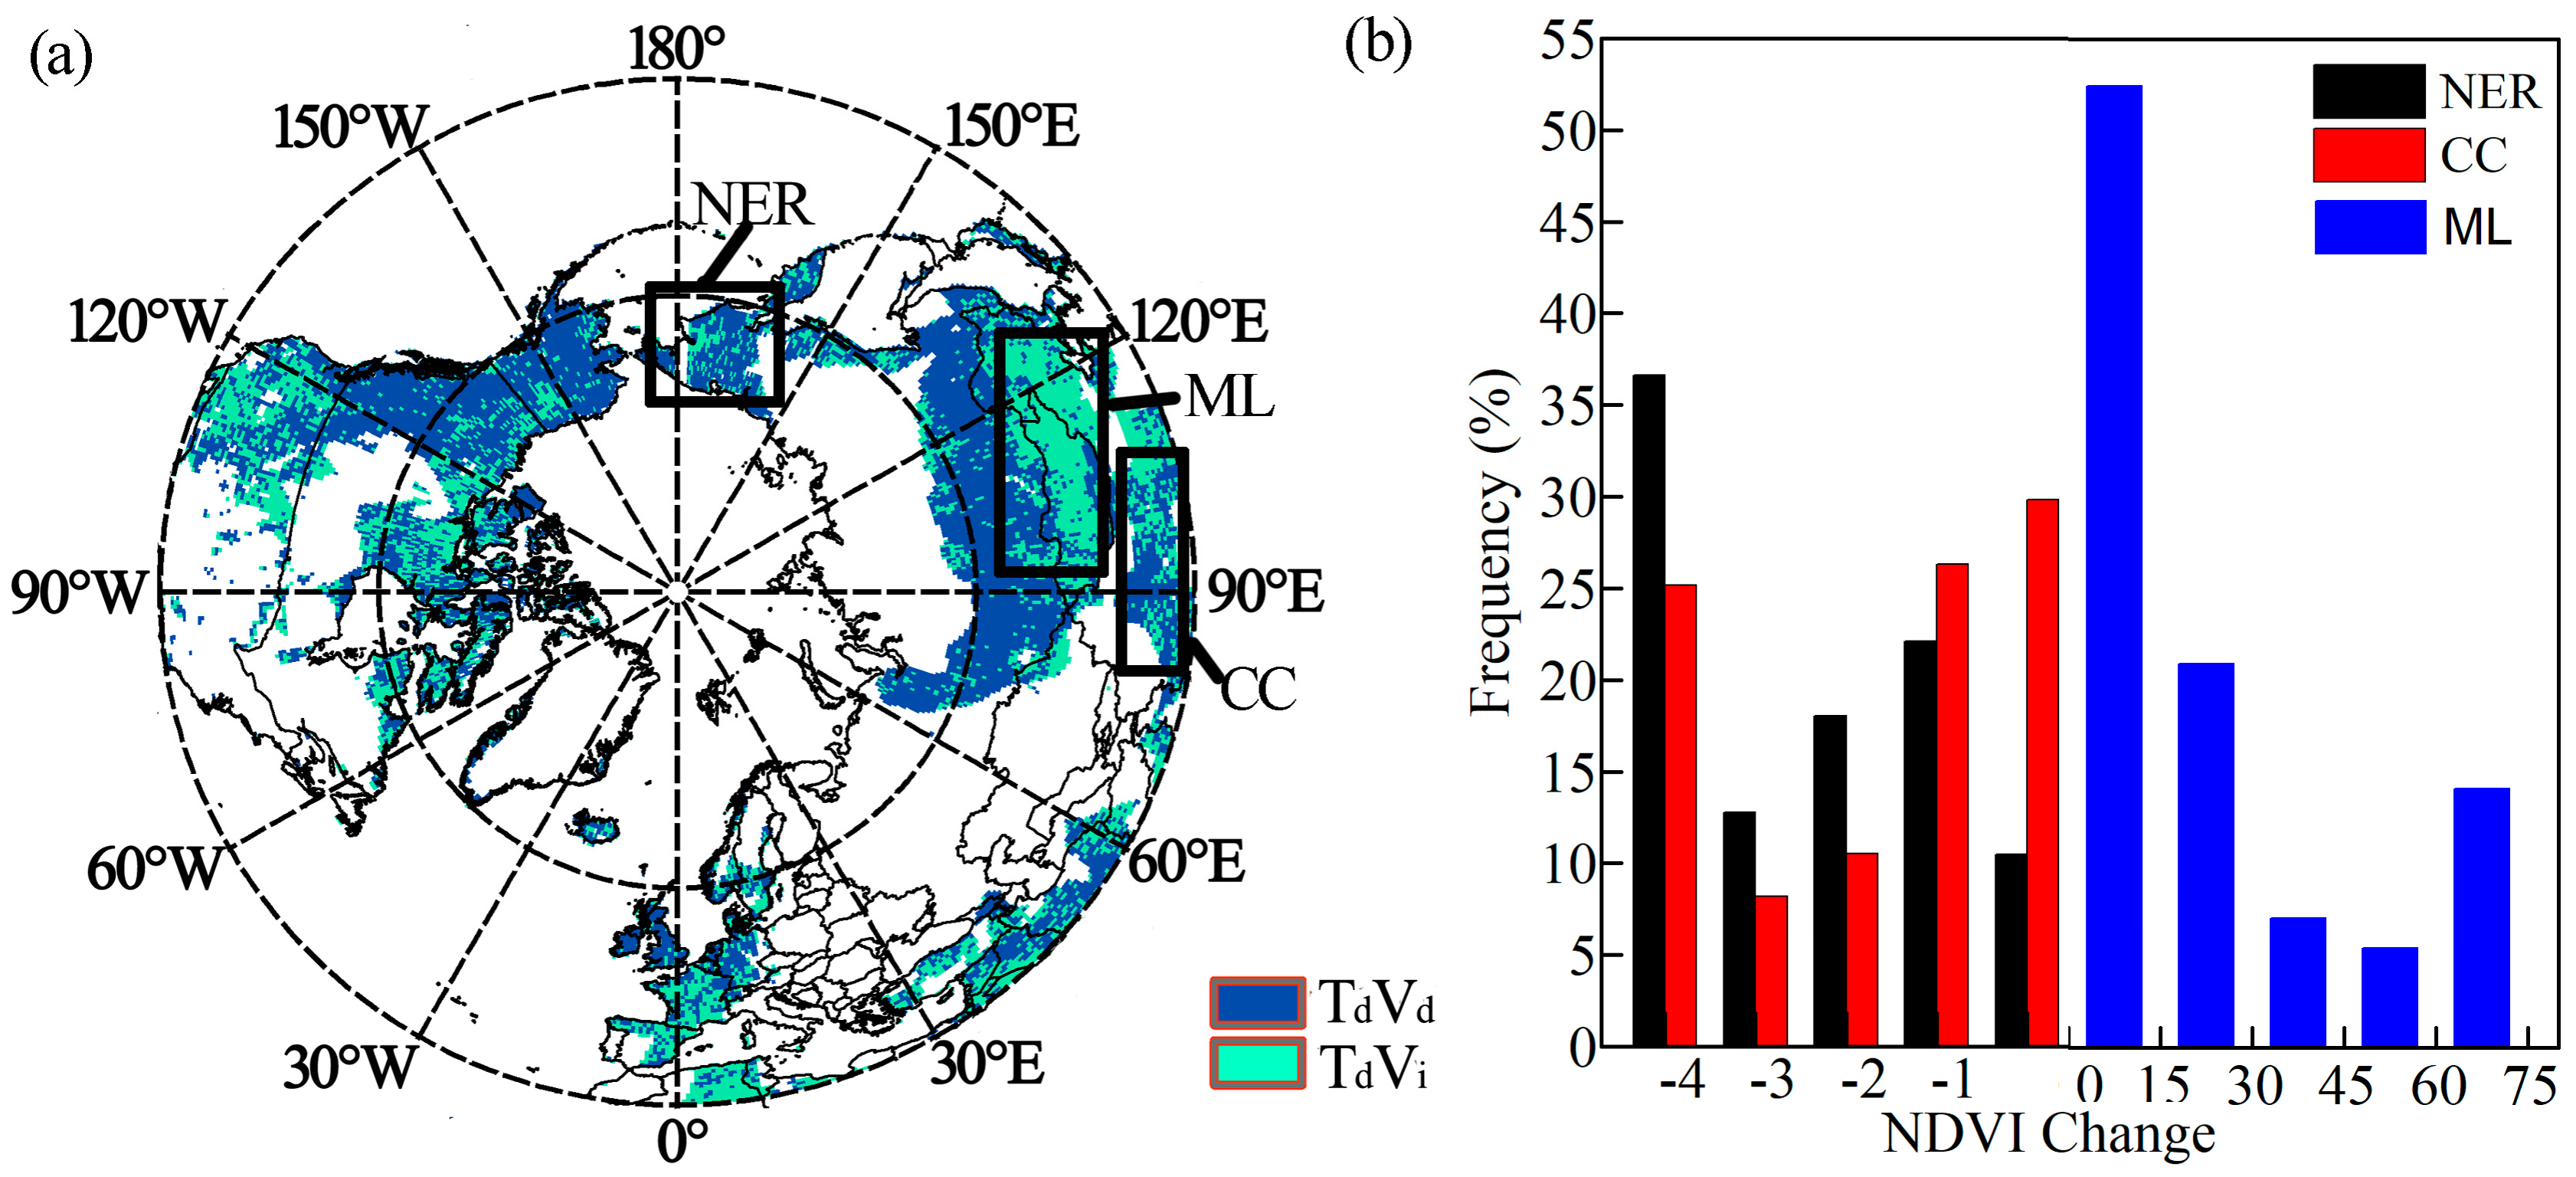
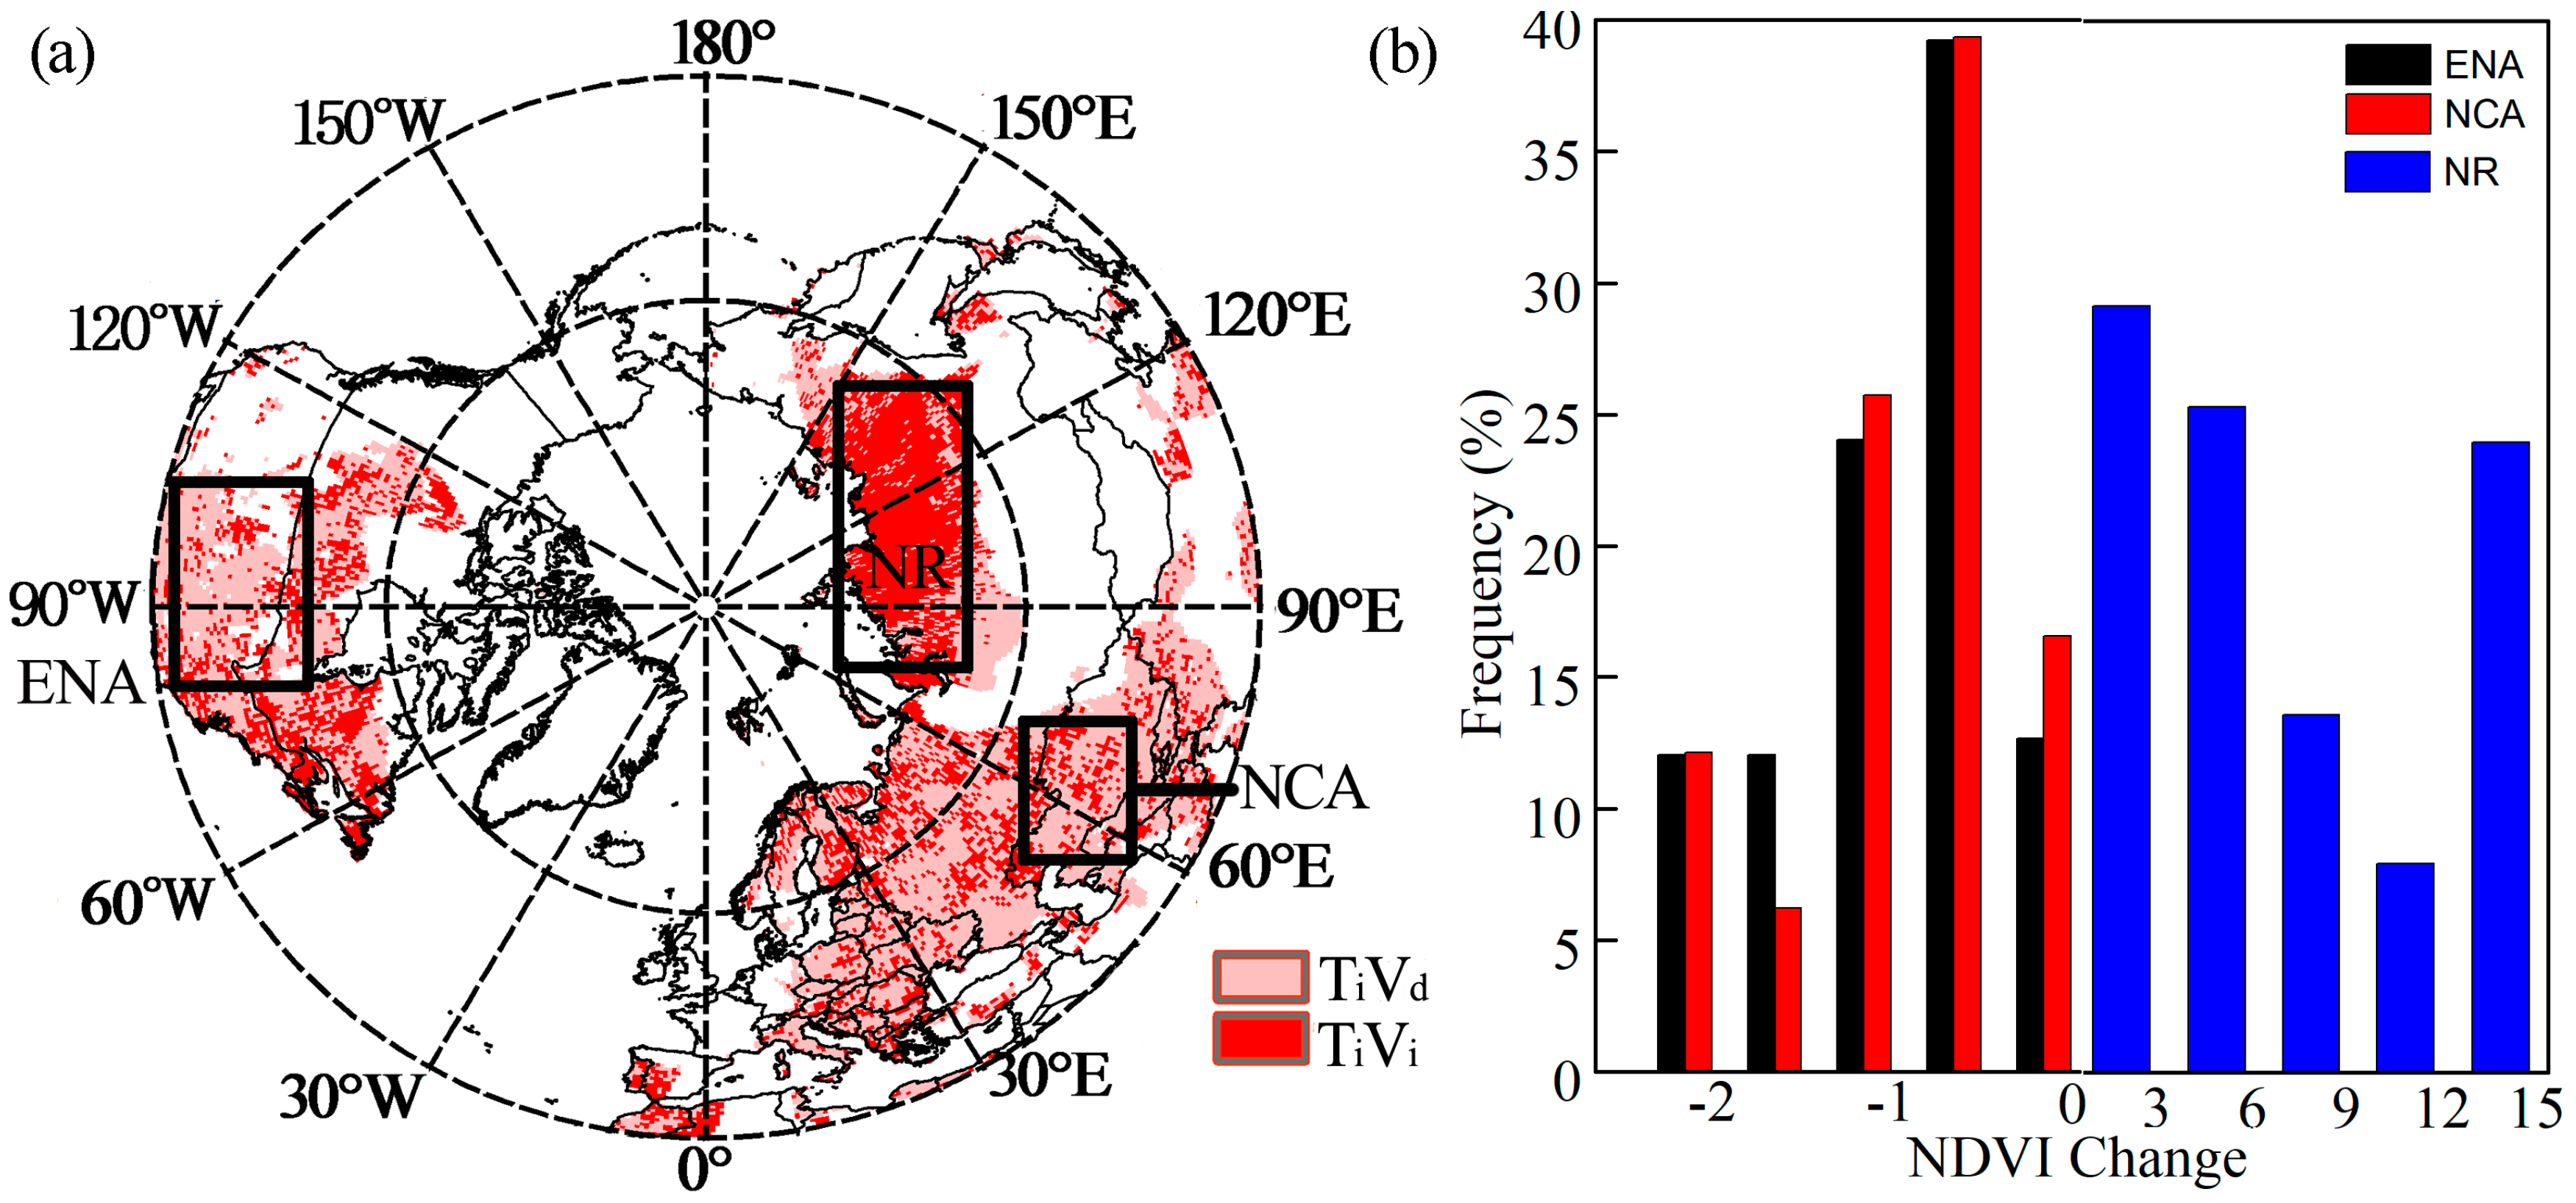
3.1. Distribution of Warming Hiatuses

The spatial distribution of warming hiatuses in the middle-high latitudes of the NH (30°N) was detected and is shown in Figure 1. The regions with a warming hiatus were mainly concentrated in northwestern North America, northeastern Russia, Mongolia, and central China, while the regions without a warming hiatus were distributed in eastern North America and in most parts of Europe, covering western Russia, northern Russia, and northern central Asia (Figure 1a).
The map of the distribution of warming hiatuses in Figure 1a shows that the overall temperature is still increasing. In actuality, there were large differences in the speed of warming with time and space. Figure 1b shows the temperature anomalies from 1982–2013. A trend analysis was performed for the temperature standardization index for every 10° of latitude in the middle-high latitudes of the NH. Based on the linear regression 4 years before and after the specific year, the variation trend in the temperature changes over time in each latitudinal zone was confirmed by the temperature anomaly trends. Figure 1c shows the variation trend of temperature anomalies in each latitudinal zone 4 years before and after each specific year from 1986–2009. For example, to calculate the variation in the temperature anomaly of 1986, the value from 1982–1990 is used. The temperature anomaly tended to decrease with time. Before 2000, the temperature anomaly tended to increase with time, but it generally decreased after the year 2000. With the exceptions of anomalies at certain times and latitudes, e.g., the severe warming hiatus phenomena at 40–60° northern latitude from 1992–1993 and at 80–90° northern latitude from 1997–2000, the warming slowed at 70–90° northern latitude from 2006–2008.
Figure 2 shows the percentage of each type of NDVI change at every 10° of north latitude in the middle-high latitudes of the NH (30°N). The results show that the regions with a warming hiatus in the NH accounted for 50.1% of the total area. Among these regions, over time, 18.8% of the vegetation was inhibited, but 31.3% of the vegetation grew faster. The regions without a warming hiatus accounted for 49.9% of the total area. Among these regions, 21.4% of the vegetation grew faster, and 28.5% of the vegetation was inhibited over time. The percentage of regions with vegetation greenness in the accelerated warming area (TiVi) increased with latitude. In the northern latitudes from 70–80°, the maximum proportion of vegetation greenness reached 50%, but in the range of 80–90°, this proportion decreased to 11%.

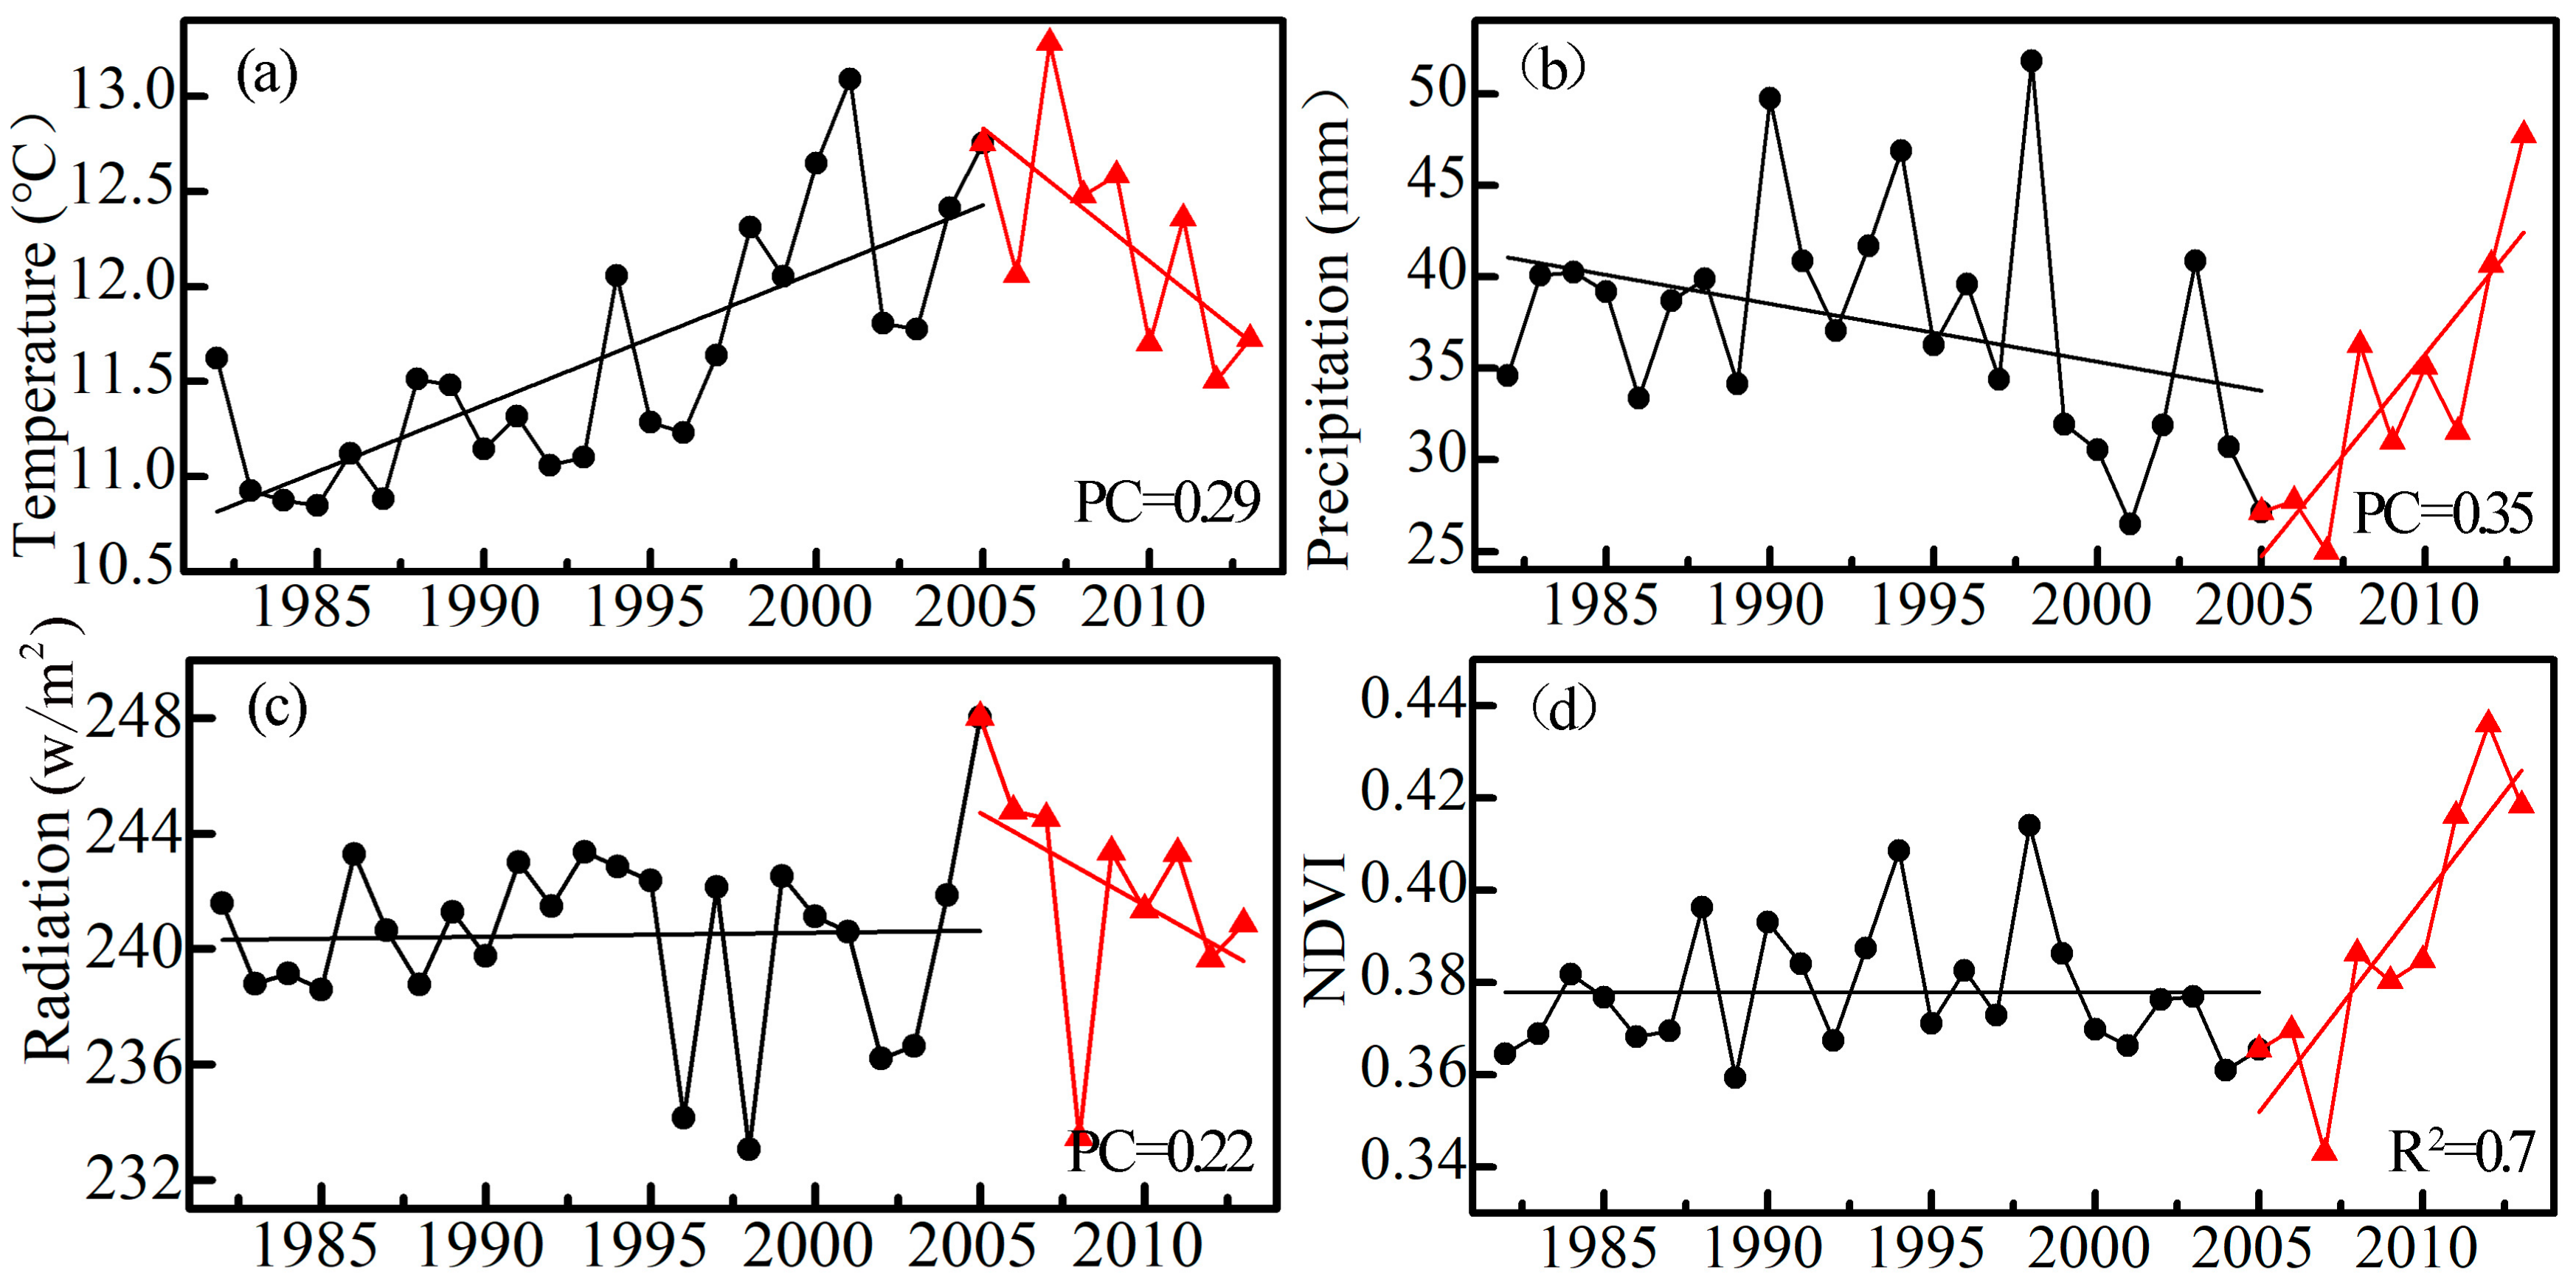
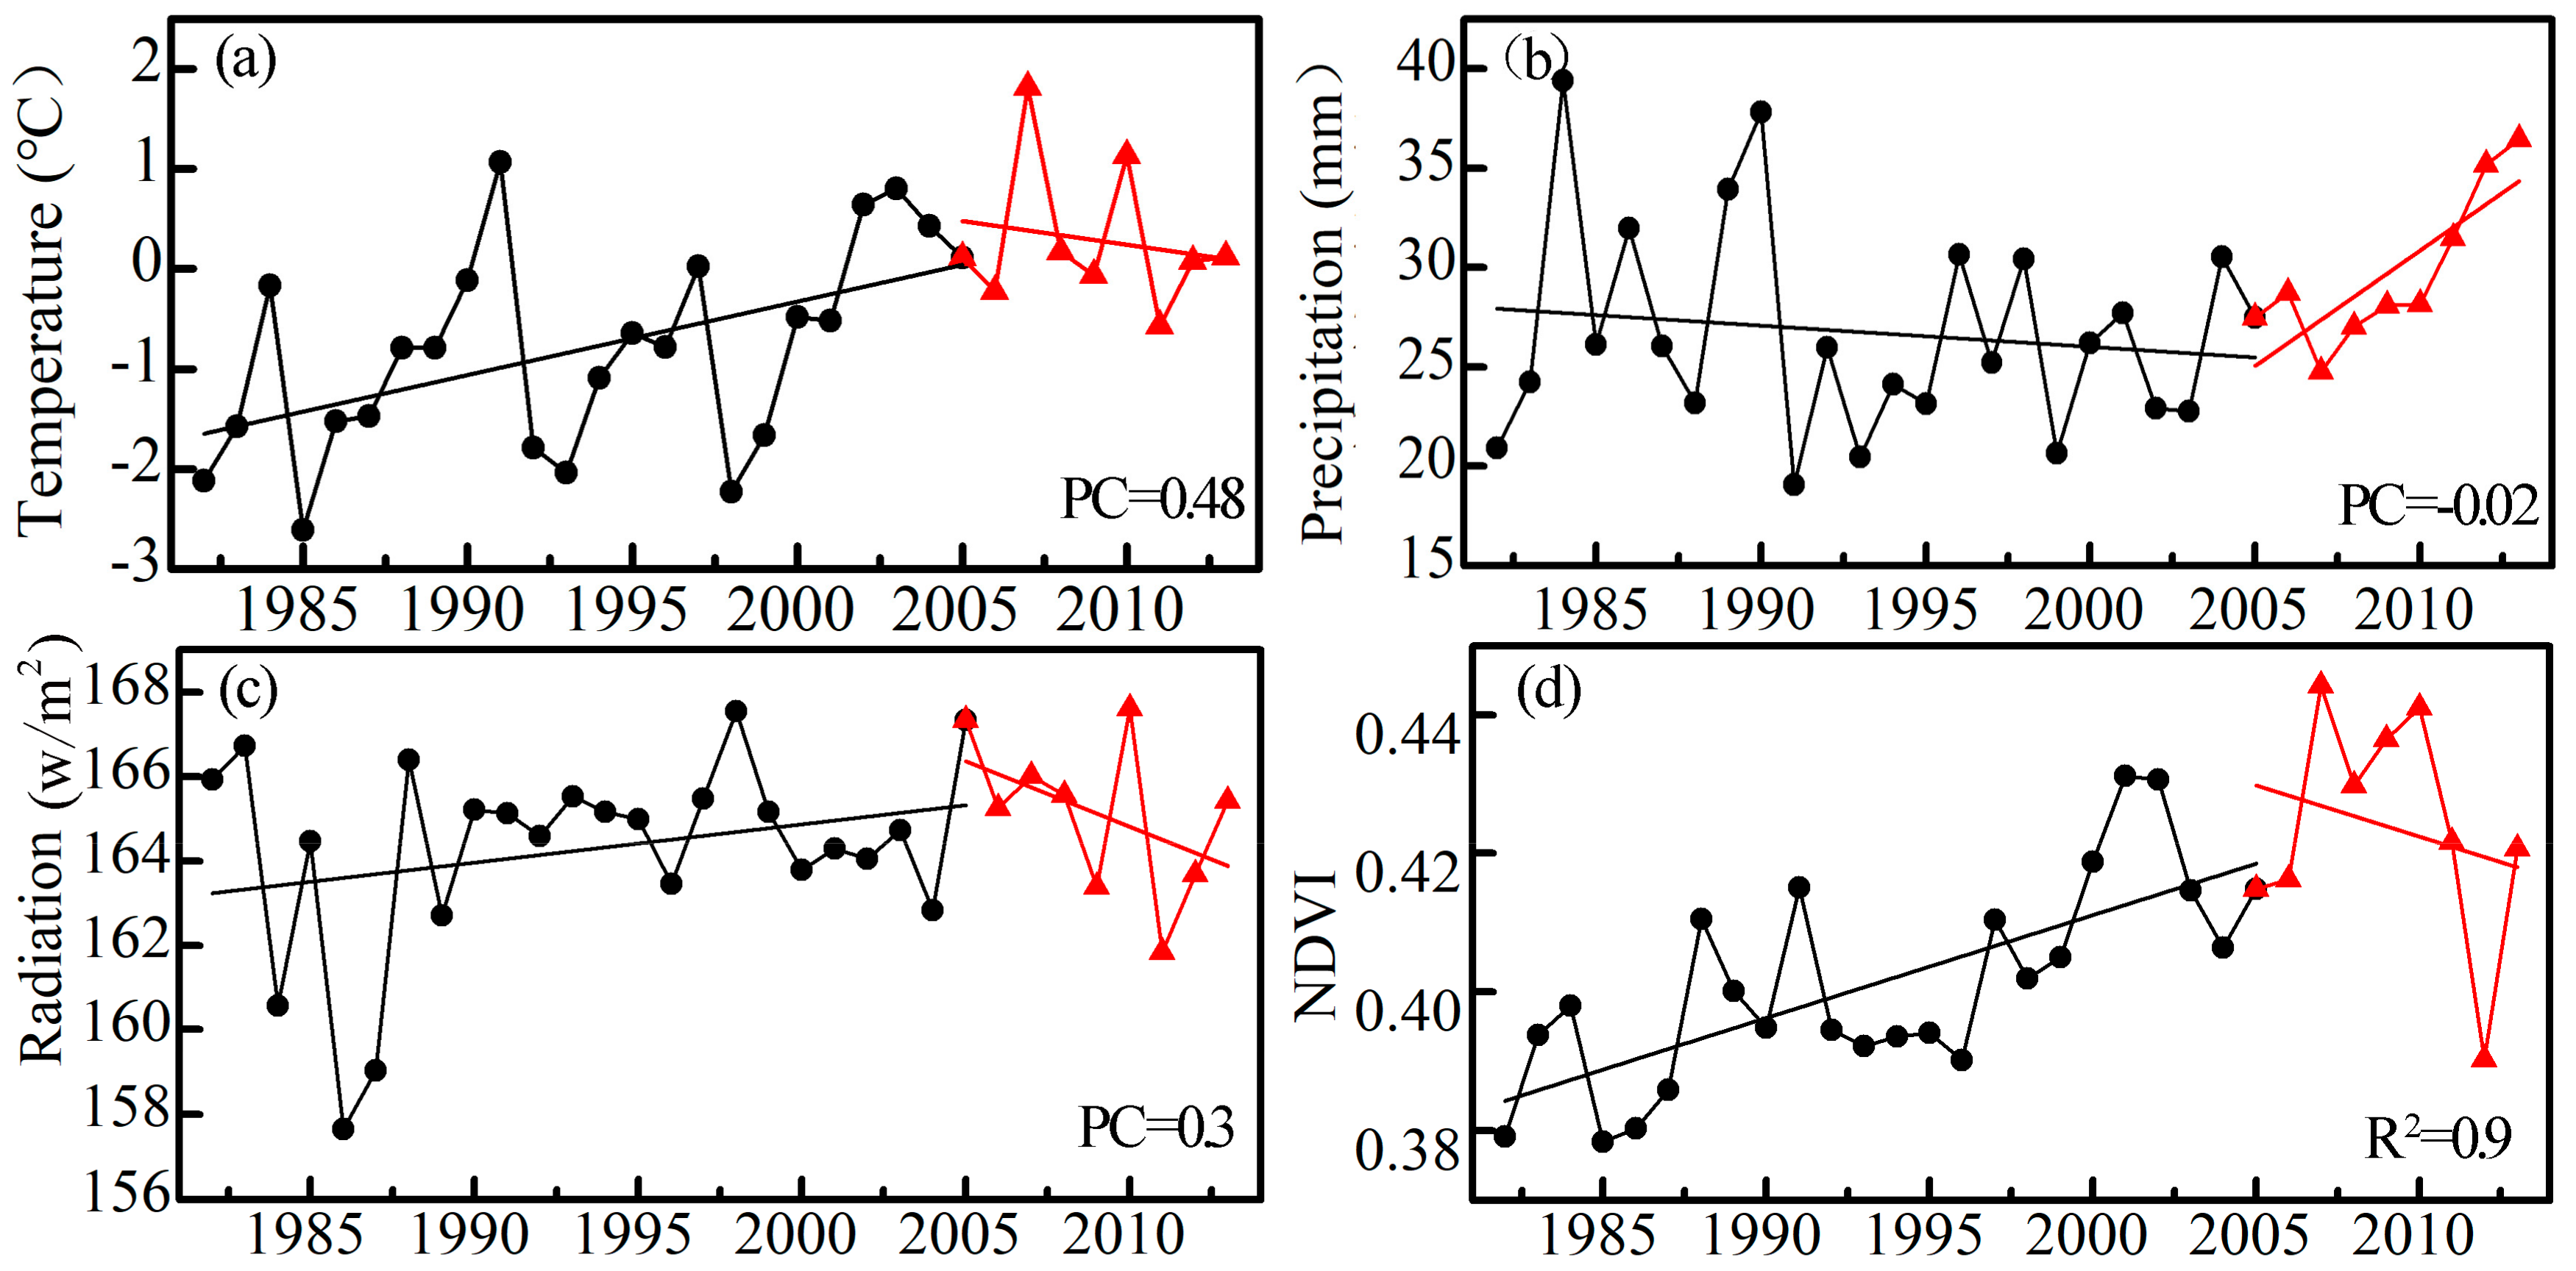
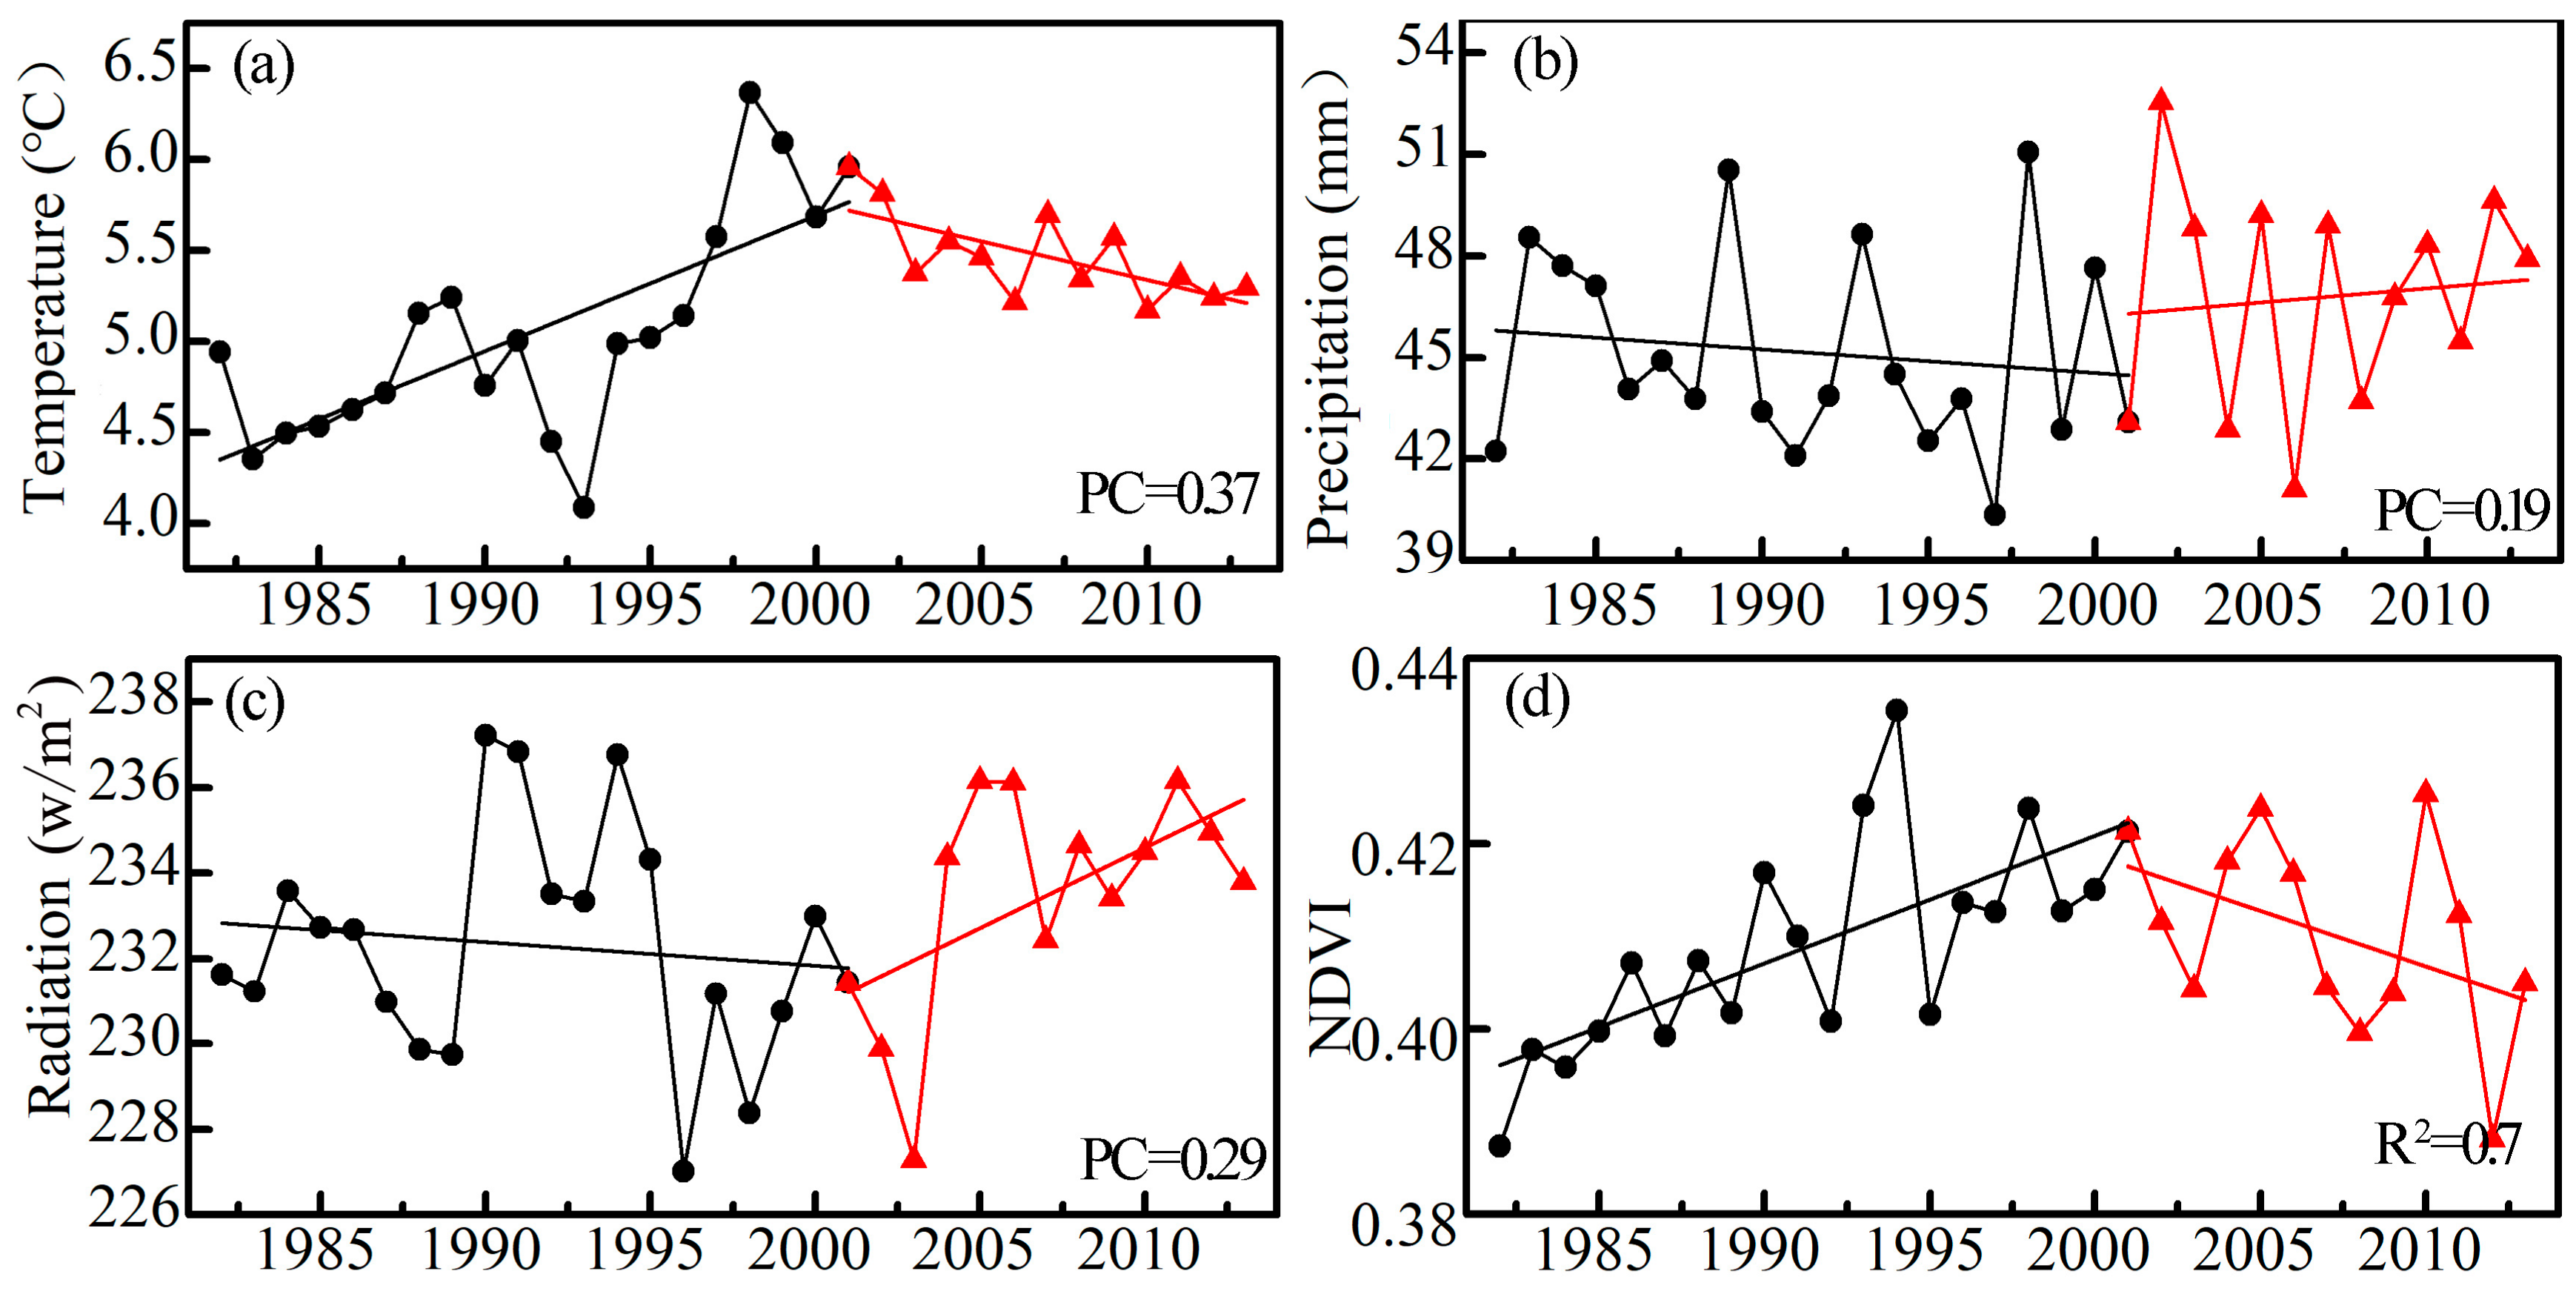
3.2. Effects of Warming Hiatuses on Vegetation Greenness

The regionally distributed warming hiatuses were mainly concentrated in northeastern Russia, Mongolia, and central China. Figure 3a shows the spatial distribution of the pixels of unchanged vegetation types in the regions that experienced a warming hiatus. The three regions with the most concentrated warming hiatuses were chosen for the attribution analysis. To find the drivers of the vegetation greenness change, an attribution analysis based on the relationship between vegetation greenness and the three climate variables (temperature, precipitation, and radiation) was used. Piecewise linear analysis showed that more than 80% of the pixels with the warm status in 2005 were located in northeastern Russia and Mongolia, but in 2000 they were concentrated in central China. Figure 3b shows the frequency distribution of the NDVI proportions in all regions. There is a much greater decrease in the vegetation greening in northeastern Russia than in central China, while the vegetation greening rate increased in Mongolia.
An attribution analysis was carried out for the pixels with the same warming hiatus time in all regions. The climatic variation and trend variation of the NDVI in Mongolia over time are shown in Figure 4. PC represents the partial correlation coefficient of each climatic factor with NDVI, excluding the other two meteorological variables. Based on the magnitude of the partial correlation coefficient, the impact of each climatic factor on the vegetation greenness can be explored. According to the positive and negative coefficients, the positive and negative correlations between the climatic elements and the vegetation greenness can be obtained.
In Mongolia, the vegetation type was mainly grassland. Precipitation was the main climatic element affecting vegetation greenness. Although the temperature and radiation both tended to decrease, the increase in precipitation could promote the greenness of grassland, resulting in the increase in the NDVI.
In northeastern Russia, the main vegetation type was open shrub. Although precipitation increased after the year 2000, the main influencing factors on vegetation greenness were temperature and radiation (Figure 5). Therefore, due to the warming hiatus and the decrease in radiation, the vegetation greenness was inhibited, and the vegetation greenness tendency was weakened.
The main vegetation type in central China was grassland. Using piecewise linear analysis, we concluded that the turning year of the temperature change in this region was 2001. The temperature and radiation changes and the NDVI trend in the central region of China shown in Figure 6 indicate that the temperature and the NDVI exhibited diametrically opposed trends after 2001. The partial correlation coefficient results show that the temperature was the main climatic factor affecting vegetation greenness in central China. These results indicate that the warming hiatus led to an inhibition of vegetation greenness.

3.3. Effects of Ongoing Warming on Vegetation Greenness

Figure 7a shows that the regions without a warming hiatus were mostly distributed in eastern North America, northern Russia, and northern central Asia. Similarly, the pixels indicating unchanged vegetation types that were relatively concentrated in these three areas were chosen for further analysis. Figure 7b shows the frequency of the NDVI proportion in the three regions. The vegetation greening rate decreased both in eastern North America and in northern central Asia, while the vegetation greening rate increased and became faster in northern Russia.
An attribution analysis was carried out for the pixels with the same acceleration time of warming in all regions. The climatic variation and trend variation of the NDVI in the three research regions are shown in Figure 8. In northern central Asia, grassland was the main vegetation type, and the main climatic element affecting the vegetation greenness was radiation. Figure 8 shows that the radiation clearly tended to decrease both before and after 1992; this decrease directly inhibited and slowed vegetation greenness. In Eastern North America, the main vegetation type was grassland. The partial correlation coefficient results show that the main climatic factor affecting vegetation greenness was radiation. Although the temperature and precipitation increased, the radiation tended to decrease, which led to the inhibition of vegetation greenness (Figure 9). In northern Russia, the main vegetation type was open shrub, which was mainly affected by the temperature. The acceleration of warming led to an increase in the NDVI, and the temperature change promoted vegetation greenness. The partial correlation coefficient results show that, in the northern region of Russia, the main factors affecting the greenness of the vegetation included temperature and radiation. Although precipitation decreased, temperature and radiation also simultaneously increased, which promoted the gradual increase in vegetation greenness (Figure 10).

4. Discussion

Based on the time series of the CRU temperature data and the results of the piecewise linear analysis, the regional distribution of warming hiatuses and their effects on vegetation trends in the middle-high latitudes of the NH were detected. Furthermore, the main climatic factors affecting vegetation trends were explored.
A warming hiatus occurred in the temperate zone of Eurasia, and the vegetation demonstrated different responses to warming hiatuses in 1988–2006 [19]. The present study showed that the regions with a warming hiatus in the NH accounted for 50.1% of the total area, and these regions were concentrated in Mongolia, central China, and other areas. On the other hand, the regions without a warming hiatus, which were mainly distributed in northern Russia, northern central Asia, and other areas accounted for 49.9% of the total area. These results were similar to the results of previous studies [6] that reported that regions in mid-latitude Eurasia were among those that experienced a warming hiatus, and that the phenomenon was especially apparent during the winter. However, there was a certain difference between the results of the current study and these previous studies; this difference was probably caused by the time lag effects of the response of vegetation to the climate [15].
The MsTMIP is a formal multi-scale synthesis that integrates model terms via a defined environment and meteorological drive, simulates standardization, and compares the results of the comprehensive assessment framework with other model results and observations [33]. In our study, the LAI produced by the BIOME-BGC and CLASS-CTEM-N models was used to validate the results of our study. Figure S1 (in supplementary material) shows that the LAI trends in northeastern Russia, Mongolia, and central China are the same as those for the NDVI. Similar results were found in eastern North America, northern Russia, and northern central Asia (Figure S2 in supplementary material). To verify the accuracy of our results, we used the Global Land Surface Satellite (GLASS) LAI data to test the trend in vegetation greenness. Figure S3 (in supplementary material) shows that the LAI trends in the majority of the six study areas with a stagnant temperature are consistent with the results in the present study.
The global temperature change affected the vegetation greenness to some extent, while the effects of warming hiatuses on the vegetation greenness also differed in both space and time [36]. The results show that there are differences in vegetation greenness among regions with the same hiatus time due to differences in the vegetation types and the main climate elements affecting vegetation greenness [21]. The vegetation greenness was inhibited, and the NDVI decreased in northwestern Russia. However, under the same warming hiatus background in Mongolia, the NDVI of the vegetation tended to increase after 2005. One reason for this is that the precipitation generally increased in Mongolia after 2005. As a result, the effects of precipitation and radiation on the vegetation were greater than the effects of temperature. As the precipitation and radiation increased, the effect of the warming hiatus on the vegetation was counteracted, promoting vegetation greenness [15]. Similarly, the regions with warming hiatuses include the borders of Eurasia and northern and southern Siberia in Eurasia and temperate regions [19]. In these regions, the vegetation responded differently to the warming hiatus. In the majority of these regions, the warming hiatus reduced the NDVI but promoted the vegetation greenness in eastern and northeastern Siberia. A possible reason for this is that a negative correlation existed between the soil moisture change and the temperature change during the growing season [19,37].
In regions that experienced a warming hiatus in the NH, there were different responses of vegetation greenness to the climatic change. In central North America and Russia, the vegetation greenness showed opposite trends. Warming did not always promote vegetation greenness. This phenomenon may be due to the increase in plant disease and insect pests caused by the warming, leading to the death of vegetation, which was subsequently consumed by the insects [38,39]. Wolfgang Buermann et al. suggested that the vegetation greenness was inhibited and the NDVI decreased in central Eurasia due to accelerated warming and dry conditions during the summer [36]. Moreover, the climatic elements of the NH were altered, and the vegetation greenness was not decided by only a single element [15]. When the main factor affecting vegetation greenness was positively correlated with the NDVI, the increasing trend of climatic elements promoted vegetation greenness. However, when the main factors affecting vegetation greenness and the NDVI were negatively correlated, the increasing trend in the climatic elements inhibited vegetation greenness. In the trend of global warming, temporal variations and spatial distributions are not unified. At the same time, human activity and extreme climatic event effects may occur. Therefore, it is necessary to comprehensively analyze the effects of various factors on the NDVI.

5. Conclusions

The results of the piecewise linear analysis enabled the study of the temperature variation trends in the NH from 1982–2013. Moreover, the differences in the temperature trends before and after the turning year were compared, thereby confirming the regions that had experienced both a warming hiatus and accelerated warming. The main driving factors affecting vegetation greenness in those spatial regions were then analyzed. Finally, the responses of vegetation to the climatic change were analyzed by integrating the turning time and the driving factors affecting vegetation greenness.
In summary, the results show that spatial differences in vegetation growth and greenness occurred for the regions that experienced a significant temperature change in the middle-high latitudes of the NH. The regions with a warming hiatus were mainly distributed in northwestern North America, including northwestern Canada, the western United States, southern and northeastern Russia, Mongolia, and the northeastern and central parts of China. Due to differences in vegetation types and their main influencing factors, the vegetation greening trends differed among the regions with or without a warming hiatus. Even under the same warming hiatus background, due to differences in vegetation types and the effects of various climatic elements over the dynamic process of climatic change, the responses of the vegetation to warming hiatuses also differed. Vegetation greenness was inhibited in northeastern Russia but was accelerated in Mongolia. Our results will promote a deeper understanding of the vegetation dynamics with respect to different climatic changes in different spatial regions.

Supplementary Materials

The following are available online at https://www.mdpi.com/2072-4292/10/5/683/s1, Figure S1: Comparison of model-simulated LAI trends in regions with warming hiatuses, Figure S2: Comparison of model-simulated LAI trends in regions without warming hiatuses, Figure S3: Trends of Global Land Surface Satellite (GLASS) LAI in six regions.

Author Contributions

H.W. and X.Z. conceived of and designed the experiments. H.W. performed the experiments and analyzed the data. All authors contributed to the ideas, writing, and discussion.

Acknowledgments

The authors thank three anonymous reviewers for their helpful comments, which improved this manuscript. This study was supported by the National Key Research and Development Program of China (No. 2016YFB0501404, No. 2016YFA0600103) and National Natural Science Foundation of China (No. 41331173).

Conflicts of Interest

The authors declare no conflict of interest.

References

  1. Dai, A.; Fyfe, J.C.; Xie, S.; Dai, X. Decadal modulation of global surface temperature by internal climate variability. Nat. Clim. Chang. 2015, 5, 555–559. [Google Scholar] [CrossRef]
  2. Easterling, D.R.; Wehner, M.F. Is the climate warming or cooling? Geophys. Res. Lett. 2009, 36, 262–275. [Google Scholar] [CrossRef]
  3. Stocker, T.; Qin, D.; Plattner, G-K.; Tignor, M.; Allen, S.K.; Boschung, J.; Nauels, A.; Xia, Y.; Bex, V.; Midgley, P.M. (Eds.) Climate Change 2013: The Physical Science Basis; Cambridge University Press: Cambridge, UK, 2014. [Google Scholar]
  4. Fyfe, J.C.; Meehl, G.A.; England, M.H.; Mann, M.E.; Santer, B.D.; Flato, G.M.; Hawkins, E.; Gillett, N.P.; Xie, S.P.; Yu, K.; et al. Making sense of the early-2000s warming slowdown. Nat. Clim. Chang. 2016, 6, 224–228. [Google Scholar] [CrossRef]
  5. Trenberth, K.E.; Fasullo, J.T.; Branstator, G.; Phillips, A.S. Seasonal aspects of the recent pause in surface warming. Nat. Clim. Chang. 2014, 4, 911–916. [Google Scholar] [CrossRef]
  6. Zhou, C.; Wang, K. Spatiotemporal divergence of the warming hiatus over land based on different definitions of mean temperature. Sci. Rep. 2016, 6, 1–12. [Google Scholar] [CrossRef] [PubMed]
  7. Schurer, A.P.; Hegerl, G.C.; Obrochta, S.P. Determining the likelihood of pauses and surges in global warming. Geophys. Res. Lett. 2015, 42, 5974–5982. [Google Scholar] [CrossRef]
  8. Chen, X.; Tung, K.K. Climate. Varying planetary heat sink led to global-warming slowdown and acceleration. Science 2014, 345, 897–903. [Google Scholar] [CrossRef] [PubMed]
  9. Trenberth, K.E. Has there been a hiatus? Science 2015, 349, 691–692. [Google Scholar] [CrossRef] [PubMed]
  10. Kosaka, Y.; Xie, S.P. Recent global-warming hiatus tied to equatorial Pacific surface cooling. Nature 2013, 501, 403–407. [Google Scholar] [CrossRef] [PubMed]
  11. Nieves, V.; Willis, J.; Patzert, W.C. Global warming. Recent hiatus caused by decadal shift in Indo-Pacific heating. Science 2015, 349, 532–535. [Google Scholar] [CrossRef] [PubMed]
  12. Yang, Y.; Guan, H.; Shen, M.; Liang, W.; Jiang, L. Changes in autumn vegetation dormancy onset date and the climate controls across temperate ecosystems in China from 1982 to 2010. Glob. Chang. Biol. 2015, 21, 652–665. [Google Scholar] [CrossRef] [PubMed]
  13. Seddon, A.W.; Macias-Fauria, M.; Long, P.R.; Benz, D.; Willis, K.J. Sensitivity of global terrestrial ecosystems to climate variability. Nature 2016, 531, 229–232. [Google Scholar] [CrossRef] [PubMed]
  14. Gao, S.; Zhou, T.; Zhao, X.; Wu, D.; Li, Z.; Wu, H.; Du, L.; Luo, H. Age and climate contribution to observed forest carbon sinks in East Asia. Environ. Res. Lett. 2016, 11, 1–11. [Google Scholar] [CrossRef]
  15. Wu, D.; Zhao, X.; Liang, S.; Zhou, T.; Huang, K.; Tang, B.; Zhao, W. Time-lag effects of global vegetation responses to climate change. Glob. Chang. Biol. 2015, 21, 3520–3531. [Google Scholar] [CrossRef] [PubMed]
  16. Piao, S.; Tan, J.; Chen, A.; Fu, Y.H.; Ciais, P.; Liu, Q.; Janssens, I.A.; Vicca, S.; Zeng, Z.; Jeong, S.J. Leaf onset in the Northern Hemisphere triggered by daytime temperature. Nat. Commun. 2015, 6, 1–8. [Google Scholar] [CrossRef] [PubMed]
  17. Wu, D.; Wu, H.; Zhao, X.; Zhou, T.; Tang, B.; Zhao, W.; Jia, K. Evaluation of spatiotemporal variations of global fractional vegetation cover based on GIMMS NDVI data from 1982 to 2011. Remote Sens. 2014, 6, 4217–4239. [Google Scholar] [CrossRef]
  18. Liu, Q.; Fu, Y.H.; Zeng, Z.; Huang, M.; Li, X.; Piao, S. Temperature, precipitation, and insolation effects on autumn vegetation phenology in temperate China. Glob. Chang. Biol. 2016, 22, 644–655. [Google Scholar] [CrossRef] [PubMed]
  19. Piao, S.; Wang, X.; Ciais, P.; Zhu, B.; Wang, T.; Liu, J. Changes in satellite-derived vegetation growth trend in temperate and boreal eurasia from 1982 to 2006. Glob. Chang. Biol. 2011, 17, 3228–3239. [Google Scholar] [CrossRef]
  20. Cong, N.; Shen, M.; Piao, S.; Chen, X.; An, S.; Yang, W.; Fu, Y.H.; Meng, F.; Wang, T. Little change in heat requirement for vegetation green-up on the Tibetan Plateau over the warming period of 1998–2012. Agric. For. Meteorol. 2017, 232, 650–658. [Google Scholar] [CrossRef]
  21. Bao, G.; Qin, Z.; Bao, Y.; Zhou, Y.; Li, W.; Sanjjav, A. NDVI-based long-term vegetation dynamics and its response to climatic change in the Mongolian Plateau. Remote Sens. 2014, 6, 8337–8358. [Google Scholar] [CrossRef]
  22. Li, Z.; Zhou, T. Responses of vegetation growth to climate change in China. Int. Arch. Photogram. Remote Sens. Spat. Inf. Sci. XL–7/W3, 225–229. [CrossRef]
  23. Peng, S.; Piao, S.; Ciais, P.; Myneni, R.B.; Chen, A.; Chevallier, F.; Dolman, A.J.; Janssens, I.A.; Peñuelas, J.; Zhang, G. Asymmetric effects of daytime and night-time warming on Northern Hemisphere vegetation. Nature 2013, 501, 88–92. [Google Scholar] [CrossRef] [PubMed]
  24. Beer, C.; Reichstein, M.; Tomelleri, E.; Ciais, P.; Jung, M.; Carvalhais, N.; Rödenbeck, C.; Arain, M.A.; Baldocchi, D.; Bonan, G.B. Terrestrial gross carbon dioxide uptake: Global distribution and covariation with climate. Science 2010, 329, 834–838. [Google Scholar] [CrossRef] [PubMed]
  25. Lotsch, A.; Friedl, M.A.; Anderson, B.T.; Tucker, C.J. Coupled vegetation-precipitation variability observed from satellite and climate records. Geophys. Res. Lett. 2003, 30, 107–218. [Google Scholar] [CrossRef]
  26. Harris, I.; Jones, P.; Osborn, T.; Lister, D. Updated high-resolution grids of monthly climatic observations-the CRU TS3. 10 dataset. Int J. Climatol. 2014, 34, 623–642. [Google Scholar] [CrossRef] [Green Version]
  27. New, M.; Hulme, M.; Jones, P. Representing twentieth-century space–time climate variability. J. Clim. 1999, 12, 2217–2238. [Google Scholar]
  28. Wei, Y.; Liu, S.; Huntzinger, D.N.; Michalak, A.; Viovy, N.; Post, W.; Schwalm, C.R.; Schaefer, K.; Jacobson, A.; Lu, C. The North American Carbon Program Multi-scale Synthesis and Terrestrial Model Intercomparison Project-Part 2: Environmental driver data. Geosci. Model Dev. 2014, 7, 2875–2893. [Google Scholar] [CrossRef]
  29. Tang, B.; Wu, D.; Zhao, X.; Zhou, T.; Zhao, W.; Wei, H. The observed impacts of wind farms on local vegetation growth in Northern China. Remote Sens. 2017, 9, 332. [Google Scholar] [CrossRef]
  30. Zhao, X.; Wei, H.; Liang, S.; Zhou, T.; He, B.; Tang, B.; Wu, D. Responses of natural vegetation to different stages of extreme drought during 2009–2010 in Southwestern China. Remote Sens. 2015, 7, 14039–14054. [Google Scholar] [CrossRef]
  31. Tucker, C.J.; Pinzon, J.E.; Brown, M.E.; Slayback, D.A.; Pak, E.W.; Mathoney, R.; Vermote, E.F.; Saleous, N.E. An extended AVHRR 8-km NDVI dataset compatible with MODIS and SPOR vegetation NDVI data. Int. J. Remote Sens. 2005, 26, 4485–4498. [Google Scholar] [CrossRef]
  32. Holben, B. Characteristics of maximum-value composite images from temporal AVHRR data. Int. J. Remote Sens. 1986, 7, 1417–1434. [Google Scholar] [CrossRef]
  33. Huntzinger, D.N.; Schwalm, C.; Michalak, A.M.; Schaefer, K.; King, A.W.; Wei, Y.; Jacobson, A.; Liu, S.; Cook, R.B.; Post, W.M. The North American carbon program multi-scale synthesis and terrestrial model intercomparison project—Part 1: Overview and experimental design. Geosci. Model Dev. 2013, 6, 2121–2133. [Google Scholar] [CrossRef]
  34. Chen, B.; Xu, G.; Coops, N.C.; Ciais, P.; Innes, J.L.; Wang, G.; Myneni, R.B.; Wang, T.; Krzyzanowski, J.; Li, Q. Changes in vegetation photosynthetic activity trends across the Asia–Pacific region over the last three decades. Remote Sens. Environ. 2014, 144, 28–41. [Google Scholar] [CrossRef]
  35. Wang, X.; Piao, S.; Xu, X.; Ciais, P.; Macbean, N.; Myneni, R.B.; Li, L. Has the advancing onset of spring vegetation green-up slowed down or changed abruptly over the last three decades? Glob. Ecol. Biogeogr. 2015, 24, 621–631. [Google Scholar] [CrossRef]
  36. Buermann, W.; Parida, B.; Jung, M.; Macdonald, G.M.; Tucker, C.J.; Reichstein, M. Recent shift in Eurasian boreal forest greening response may be associated with warmer and drier summers. Geophys. Res. Lett. 2014, 41, 1995–2002. [Google Scholar] [CrossRef]
  37. Zhou, L.; Tucker, C.J.; Kaufmann, R.K.; Slayback, D.; Shabanov, N.V.; Myneni, R.B. Variations in northern vegetation activity inferred from satellite data of vegetation index during 1981 to 1999. J. Geophys. Res. Atmospheres 2002, 106, 20069–20083. [Google Scholar] [CrossRef]
  38. Williams, D.W.; Liebhold, A.M. Climate change and the outbreak ranges of two North American bark beetles. Agric. For. Entomol. 2015, 4, 87–99. [Google Scholar] [CrossRef]
  39. Bale, J.S.; Masters, G.J.; Hodkinson, I.D.; Awmack, C.; Bezemer, T.M.; Brown, V.K.; Butterfield, J.; Buse, A.; Coulson, J.C.; Farrar, J.; et al. Herbivory in global climate change research: Direct effects of rising temperature on insect herbivores. Glob. Chang. Biol. 2002, 8, 1–16. [Google Scholar] [CrossRef]
Figure 1. Distribution of warming hiatuses. NER: northeastern Russia; ML: Mongolia; CC: central China; ENA: eastern North America; NR: northern Russia; NCA: northern central Asia. (a) Variations in temperature and Normalized Difference Vegetation Index (NDVI) before and after the turning year when the temperature trend started changing. TdVd represents the decrease in the NDVI caused by a warming hiatus. TdVi refers to the increase in the NDVI caused by a warming hiatus, while TiVd and TiVi represent the decrease and increase in the NDVI caused by accelerated warming; (b) The temperature anomaly from 1982–2013; (c) Variation trend of the temperature anomalies in each latitudinal zone. The x-axes of (b,c) represent the year, and the y-axes represent the latitude.
Remotesensing 10 00683 g001
Figure 2. Percent of each Normalized Difference Vegetation Index (NDVI) change type at every 10° of north latitude in the middle-high latitudes of the NH (30°N).
Remotesensing 10 00683 g002
Figure 3. Spatial distribution of regions with a warming hiatus. NER: northeastern Russia; ML: Mongolia; CC: central China; (a) spatial distribution of a warming hiatus in the middle-high latitudes of the NH; (b) frequency distribution of the NDVI proportion in all regions. TdVd indicates a decrease in the NDVI in conjunction with the warming hiatus; TdVi indicates an increase in the NDVI in conjunction with the warming hiatus.
Remotesensing 10 00683 g003
Figure 4. Climatic factors and NDVI variations in Mongolia from 1982–2013. (a) Temperature (T); (b) precipitation (P); (c) radiation (R); and (d) NDVI; the black line and the red line represent the changing trends before and after the temperature change. PC represents the partial correlation coefficient of each climatic factor with NDVI, excluding the other two meteorological variables, and R2 represents the coefficient of determination between the NDVI and the meteorological factors. The relationship between NDVI and the climate factors is NDVI = 0.01T + 0.002P + 0.0004R + 0.09.
Remotesensing 10 00683 g004
Figure 5. Climatic factors and NDVI variations in northeastern Russia from 1982–2013. (a) Temperature (T); (b) precipitation (P); (c) radiation (R); and (d) NDVI; the black line and the red line represent the changing trends before and after the temperature change. PC represents the partial correlation coefficient of each climatic factor with NDVI, excluding the other two meteorological variables, and R2 represents the coefficient of determination between the NDVI and the meteorological factors. The relationship between NDVI and the climate factors is NDVI = 0.01T − 0.0003P + 0.002R + 0.16.
Remotesensing 10 00683 g005
Figure 6. Climatic factors and NDVI variations in central China region from 1982–2013. (a) Temperature (T); (b) precipitation (P); (c) radiation (R); and (d) NDVI; the black line and the red line represent the changing trends before and after the temperature change. PC represents the partial correlation coefficient of each climatic factor with NDVI, excluding the other two meteorological variables, and R2 represents the coefficient of determination between the NDVI and the meteorological factors. The relationship between NDVI and the climate factors is NDVI = 0.01T + 0.00002P + 0.001R + 0.11.
Remotesensing 10 00683 g006
Figure 7. Spatial distribution of regions with ongoing warming. ENA: eastern North America; NR: northern Russia; NCA: northern central Asia. (a) Spatial distribution of regions without a warming hiatus in the middle-high latitudes of the NH. TiVi represents the increase in the NDVI in conjunction with ongoing warming. TiVd is the decrease in the NDVI in conjunction with ongoing warming; (b) Frequency distribution of the NDVI proportion in all regions.
Remotesensing 10 00683 g007
Figure 8. Climatic factors and NDVI variations in northern central Asia from 1982–2013. (a) Temperature (T); (b) precipitation (P); (c) radiation (R); and (d) NDVI; the black line and the red line represent the changing trends before and after the temperature change. PC represents the partial correlation coefficient of each climatic factor with NDVI, excluding the other two meteorological variables, and R2 represents the coefficient of determination between the NDVI and the meteorological factors. The relationship between NDVI and the climate factors is NDVI = 0.0005T + 0.0009P − 0.0006R + 0.43.
Remotesensing 10 00683 g008
Figure 9. Climatic factors and NDVI variations in eastern North America (ENA) from 1982–2013. (a) temperature (T); (b) precipitation (P); (c) radiation (R); and (d) NDVI; the black line and the red line represent the changing trends before and after the temperature change. PC represents the partial correlation coefficient of each climatic factor with NDVI, excluding the other two meteorological variables, and R2 represents the coefficient of determination between the NDVI and the meteorological factors. The relationship between NDVI and the climate factors is NDVI = 0.01T + 0.00026P − 0.002R + 1.01.
Remotesensing 10 00683 g009
Figure 10. Climatic factors and NDVI variations in northern Russia from 1982–2013. (a) Temperature (T); (b) precipitation (P); (c) radiation (R); and (d) NDVI; the black line and the red line represents the changing trends before and after the temperature change. The red line represents the changing trend after the temperature changes. PC represents the partial correlation coefficient of each climatic factor with NDVI, excluding the other two meteorological variables, and R2 represents the coefficient of determination between the NDVI and the meteorological factors. The relationship between NDVI and the climate factors is NDVI = 0.015T − 0.00055P + 0.003R − 0.07.
Remotesensing 10 00683 g010

