Article

Near Real-Time Ground-to-Ground Infrared Remote-Sensing Combination and Inexpensive Visible Camera Observations Applied to Tomographic Stack Emission Measurements

GeoRessources Laboratory, Université de Lorraine, CNRS, CREGU, BP 70239, F-54506 Vandoeuvre-lès-Nancy, France
*
Author to whom correspondence should be addressed.
Remote Sens. 2018, 10(5), 678; https://doi.org/10.3390/rs10050678
Submission received: 23 March 2018 / Revised: 19 April 2018 / Accepted: 24 April 2018 / Published: 26 April 2018
(This article belongs to the Section Atmospheric Remote Sensing)

Abstract

:
Evaluation of the environmental impact of gas plumes from stack emissions at the local level requires precise knowledge of the spatial development of the cloud, its evolution over time, and quantitative analysis of each gaseous component. With extensive developments, remote-sensing ground-based technologies are becoming increasingly relevant to such an application. The difficulty of determining the exact 3-D thickness of the gas plume in real time has meant that the various gas components are mainly expressed using correlation coefficients of gas occurrences and path concentration (ppm.m). This paper focuses on a synchronous and non-expensive multi-angled approach combining three high-resolution visible cameras (GoPro-Hero3) and a scanning infrared (IR) gas system (SIGIS, Bruker). Measurements are performed at a NH3 emissive industrial site (NOVACARB Society, Laneuveville-devant-Nancy, France). Visible data images were processed by a first geometrical reconstruction gOcad® protocol to build a 3-D envelope of the gas plume which allows estimation of the plume’s thickness corresponding to the 2-D infrared grid measurements. NH3 concentration data could thereby be expressed in ppm and have been interpolated using a second gOcad® interpolation algorithm allowing a precise volume visualization of the NH3 distribution in the flue gas steam.

Graphical Abstract

1. Introduction

Several epidemiological studies have found a short-term association between air pollution and mortality. These results were established in French, European and American multicenter studies as well as through the compilation of numerous studies [1]. This is an obvious and sufficient reason for air monitoring to become an essential element in any type of human or industrial activity at the local level [2,3]. Among the various techniques, ground-based infrared (IR) remote-sensing technologies are promising for the large-scale monitoring of atmospheric gas plume detection [4,5,6,7,8]. The potentialities of these technologies have been particularly demonstrated in volcanology [9,10,11,12]. Recently, Reiche et al. [13], by evaluating different techniques of ground-based optical remote sensing in field conditions by a gas tracer experiment, revealed that the passive Open Path–Fourier-transform infrared (FTIR) spectrometer is a valuable tool for rapid detection and imaging of emission sources and spatial tracer gas distribution [14,15]. However, three parameters are essential for imaging and evaluating the environmental impact of any atmospheric gas plume: (i) the exact spatial boundary of the cloud; (ii) its evolution over time; and (iii) quantitative analysis of each gaseous component present in the cloud. Determination of gas concentration (ppm) (parts per million) is a challenge because of the difficulty in determining in real time the exact size of the column density, i.e., the thickness of the cloud in three dimensions, in order to provide gas concentrations in ppm instead of correlation coefficient or path concentration (ppm.m), which are the units used in infrared remote-sensing monitoring [13]. Stereoscopic measurements, i.e., multi angle observations, in combination with a 3-D reconstruction modeler, are the only way to achieve this objective [16,17,18]. As for hyperspectral imaging [19,20,21,22], spectral data must be collected simultaneously by at least three different remote devices combined with a specific reconstruction procedure [23,24,25]. Without such an approach, the spatial distribution of the different gas components can only be expressed in terms of the correlation coefficients of gas occurrences and path concentration (ppm.m). Numerous papers are related to satellite remote-sensing studies but a smaller number has been devoted to ground-based infrared remote sensing. As cited earlier, the most advanced 3-D experimental simulation of gas plumes was conducted by [17,18]. In their work, the authors used, respectively, (i) two scanning imaging systems (SIGIS, Bruker) in two different locations in combination with a specific discretized model; and (ii) one scanning imaging system (SIGIS, Bruker,) quickly and successively located in three different positions in combination with a gOcad® reconstruction model (SKUA-GOCAD™—Paradigm® 14.1—http://www.pdgm.com/products/skua-gocad/). Because of ground-based measurements at the local scale, 3-D reconstruction models are less complicated than those used for a satellite or aerial data set [26,27,28,29].
The present paper has been written taking into account the three following observations:
-
from a technical point of view, there must be an inexpensive and quick remote-imaging monitoring system, easily transportable and adaptable to any type of land configuration;
-
from a scientific point of view, one must be able to determine the size of the column density to provide gas concentrations in ppm;
-
from a practical point of view, most mixed gaseous emissions have a visible atmospheric trace.
To do this, the paper presents a new advance in 3-D ground-based chemical monitoring of gas plumes. The study was mainly conducted on stack emissions with a visible atmospheric trace. Assuming that the atmospheric dispersion is equal for all the gases emitted at the same time by a chimney, the results lead to a new protocol of measurements combining, at the same time, visible observations at multiple angles (visible camera GoPro Hero3), scanning imaging IR measurements (SIGIS Bruker) and 3-D geometrical reconstruction of the gas plume using specific gOcad® protocols. The visible data set is used to geometrically reconstruct the volume of the gas plume using a first specific gOcad® procedure. This makes it possible to calculate, in the three dimensions, the exact thickness of the column density cut by each pixel measurements of the 2-D infrared grid. Consequently, the infrared grid can be converted to a 2-D matrix of the real gas concentrations in ppm. Finally, the gas concentration property propagates within the whole plume volume using a second gOcad® interpolation procedure. The volumic distribution of gas concentration can be calculated which allows, for example, determination of the proportions of gas components in the total volume of the gas plume. This methodology is applied to the monitoring of flue streams of an ammonia/water vapor (NH3/H2O) gas mixture (NOVACARB Society, Laneuveville-devant-Nancy, France). Interest in this approach for tomographic gas plumes measurements without any visible trace is also discussed.

2. Material and Methods

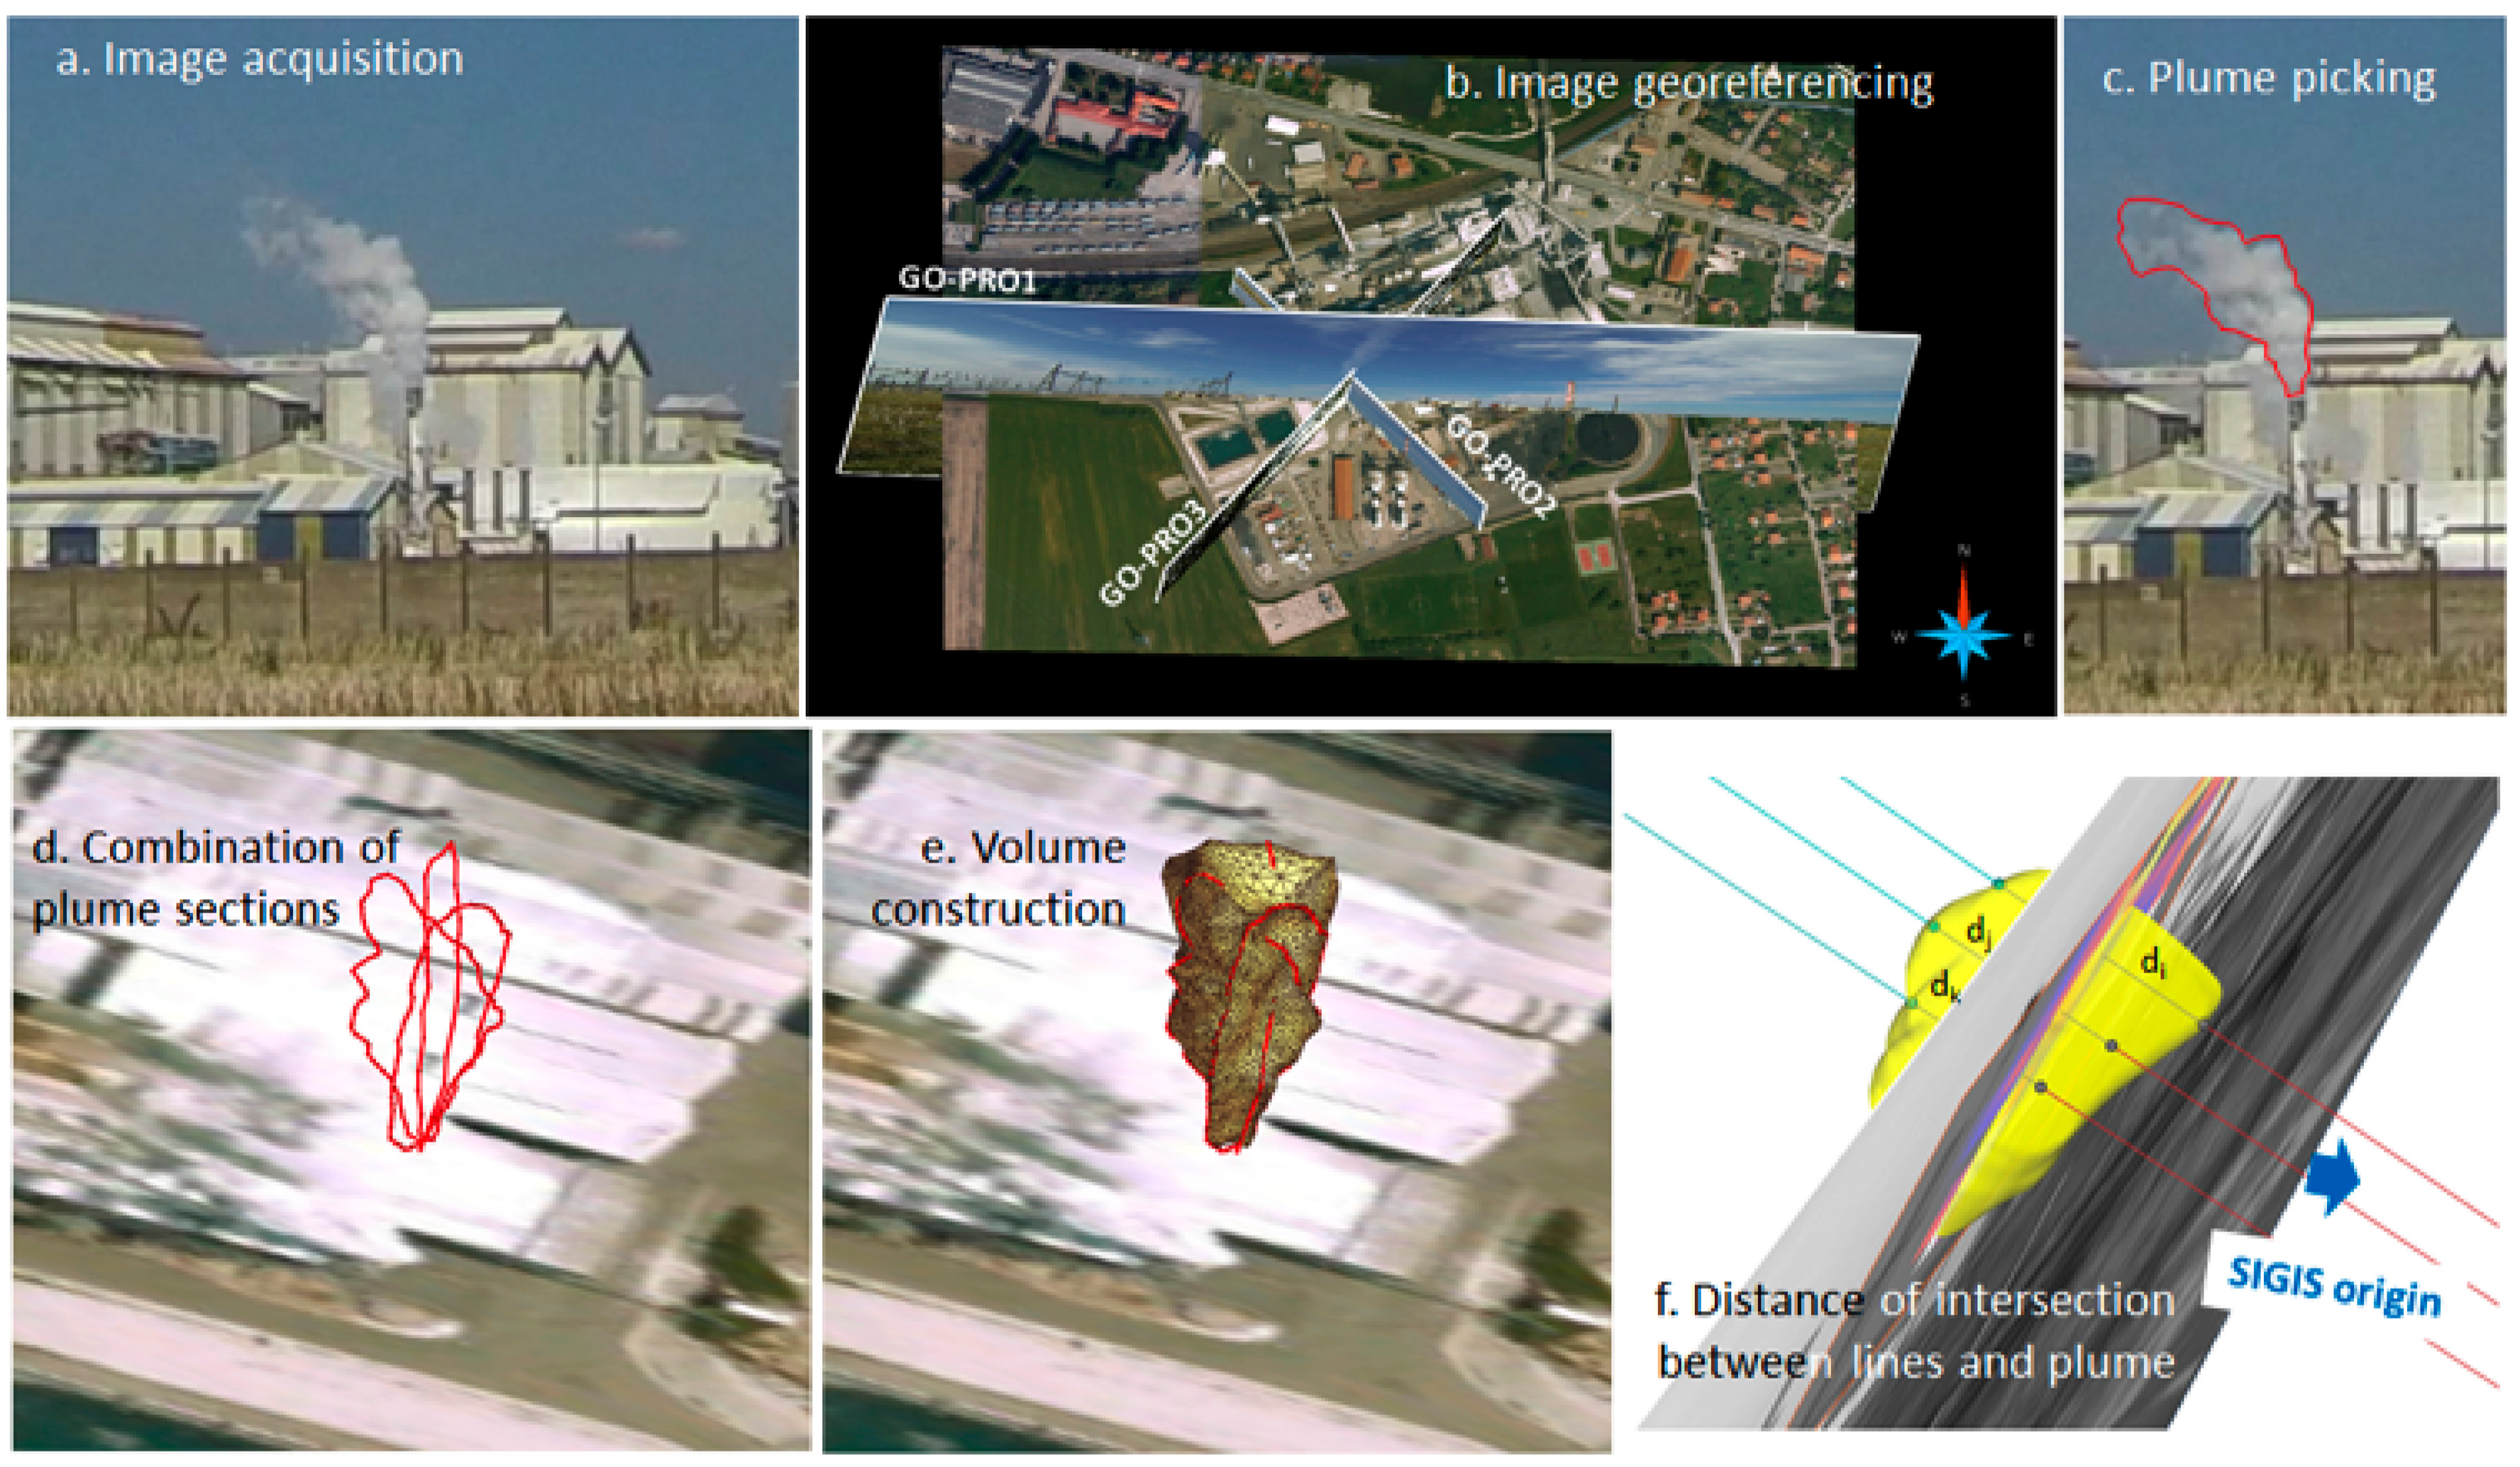
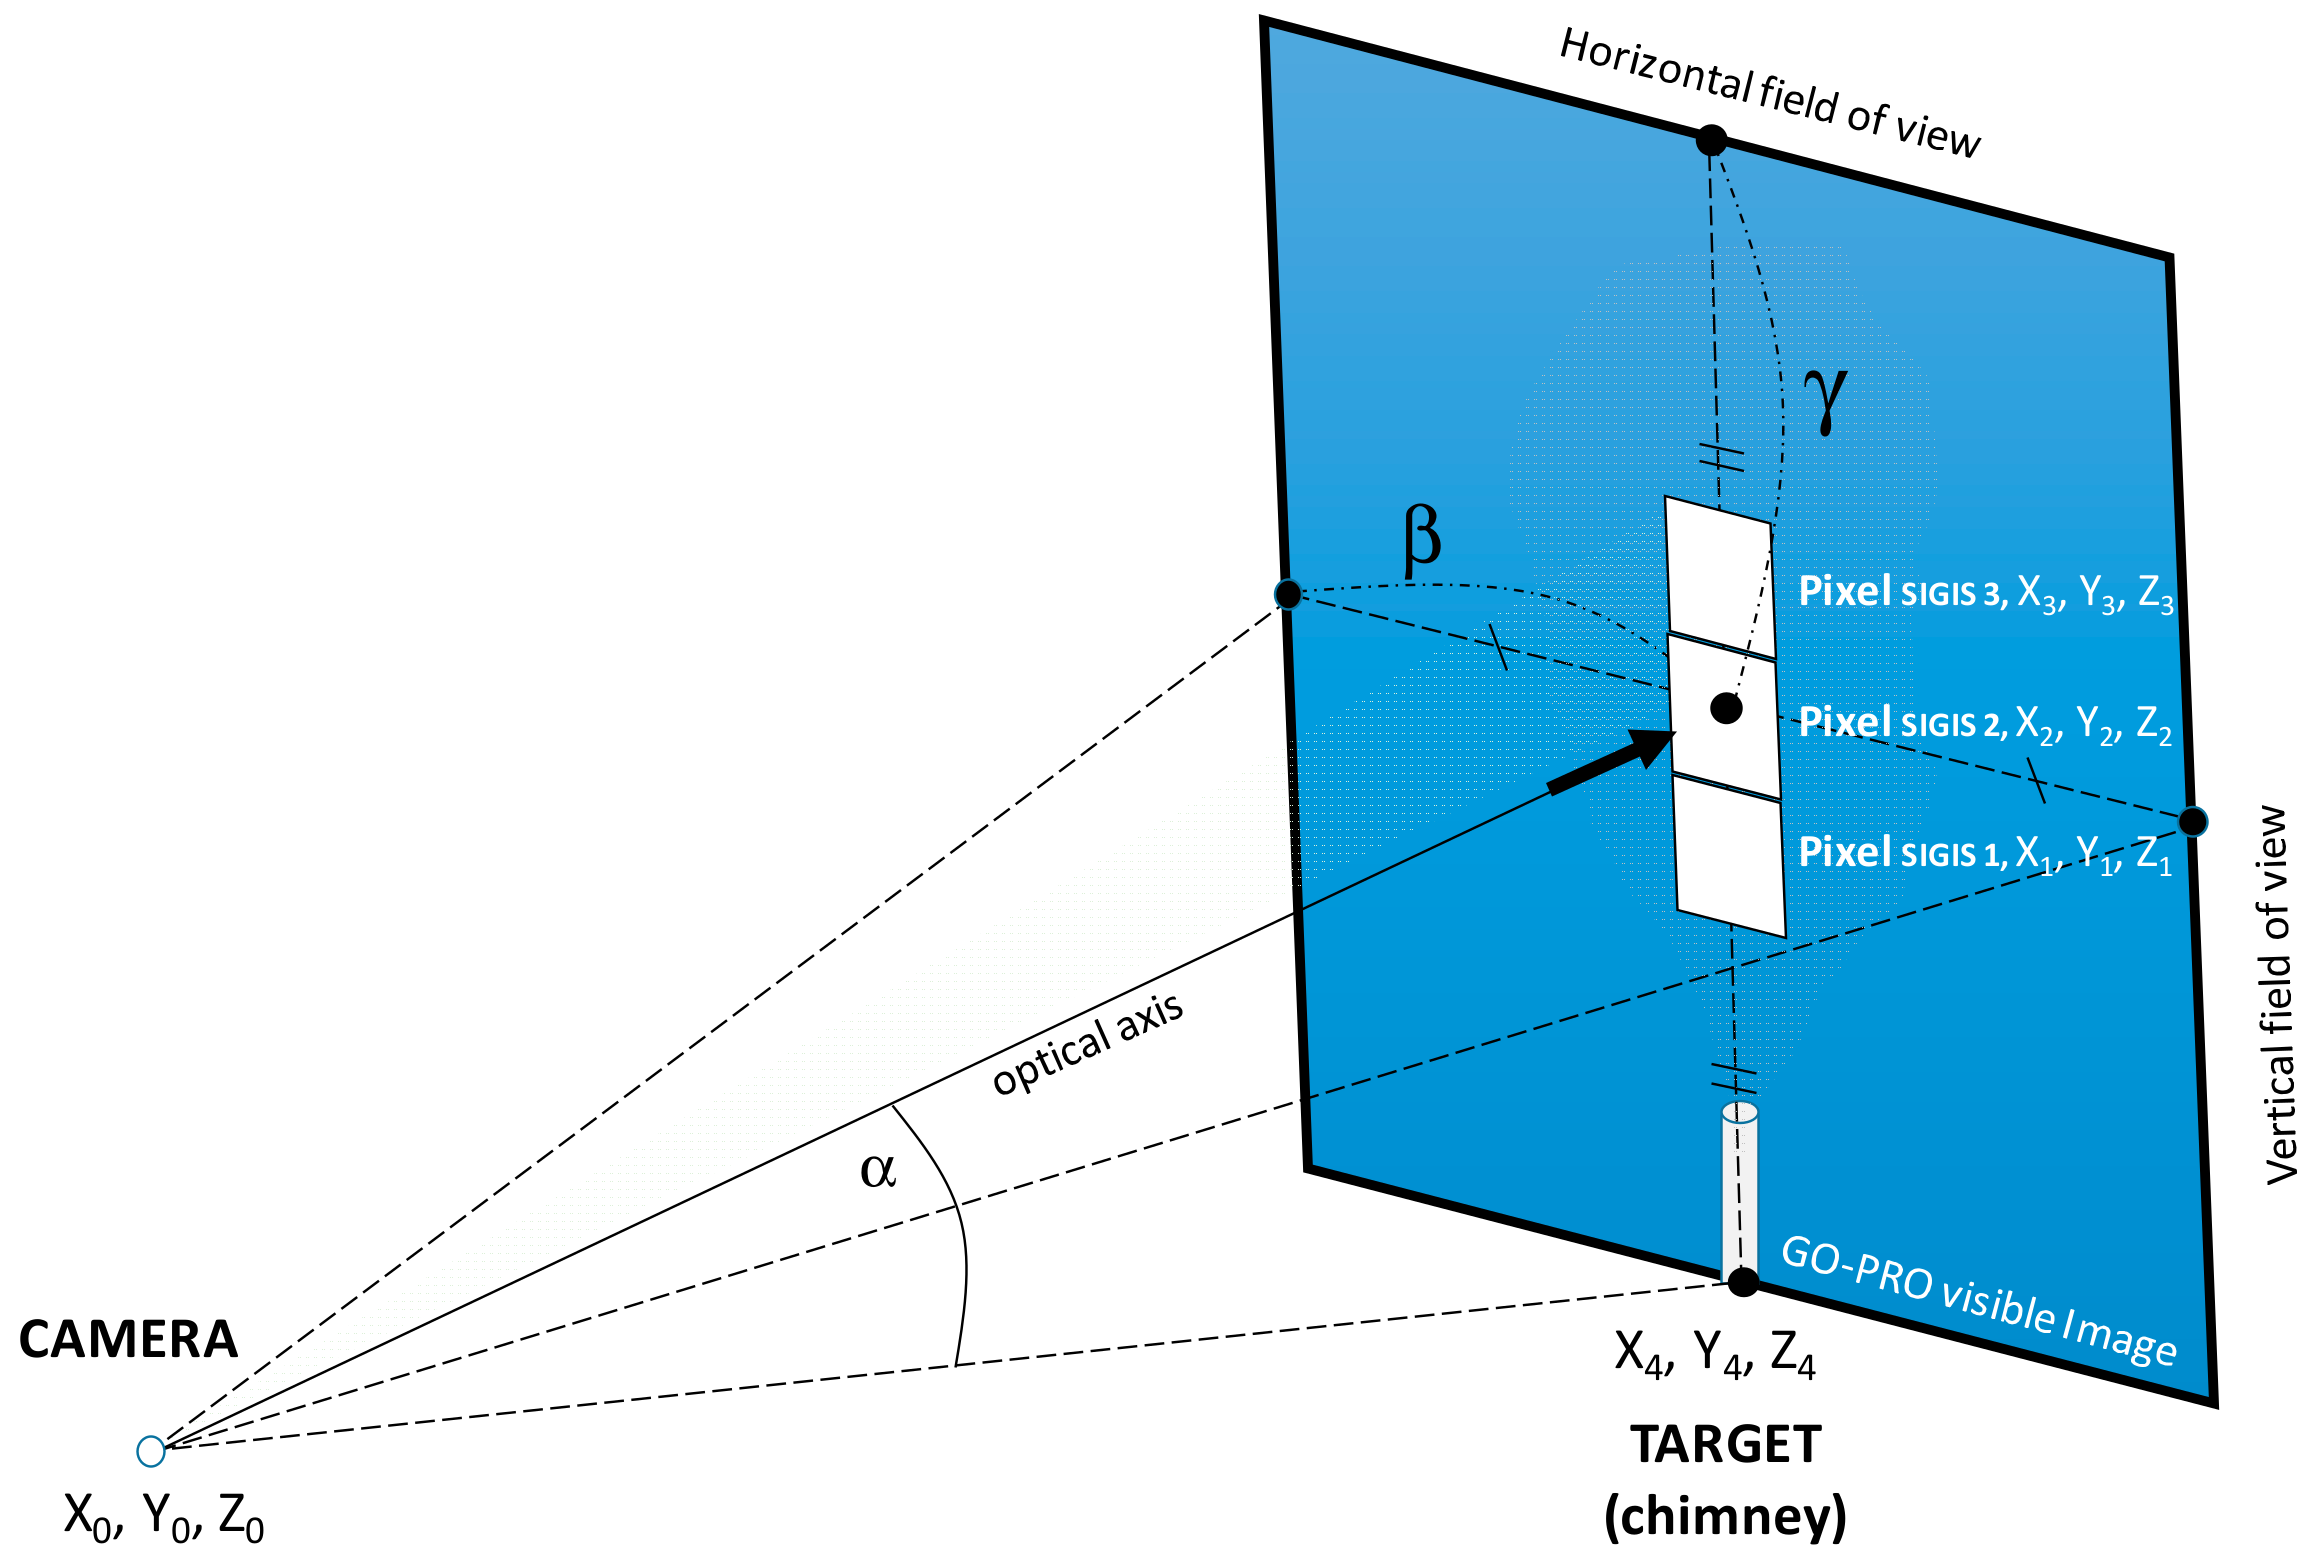
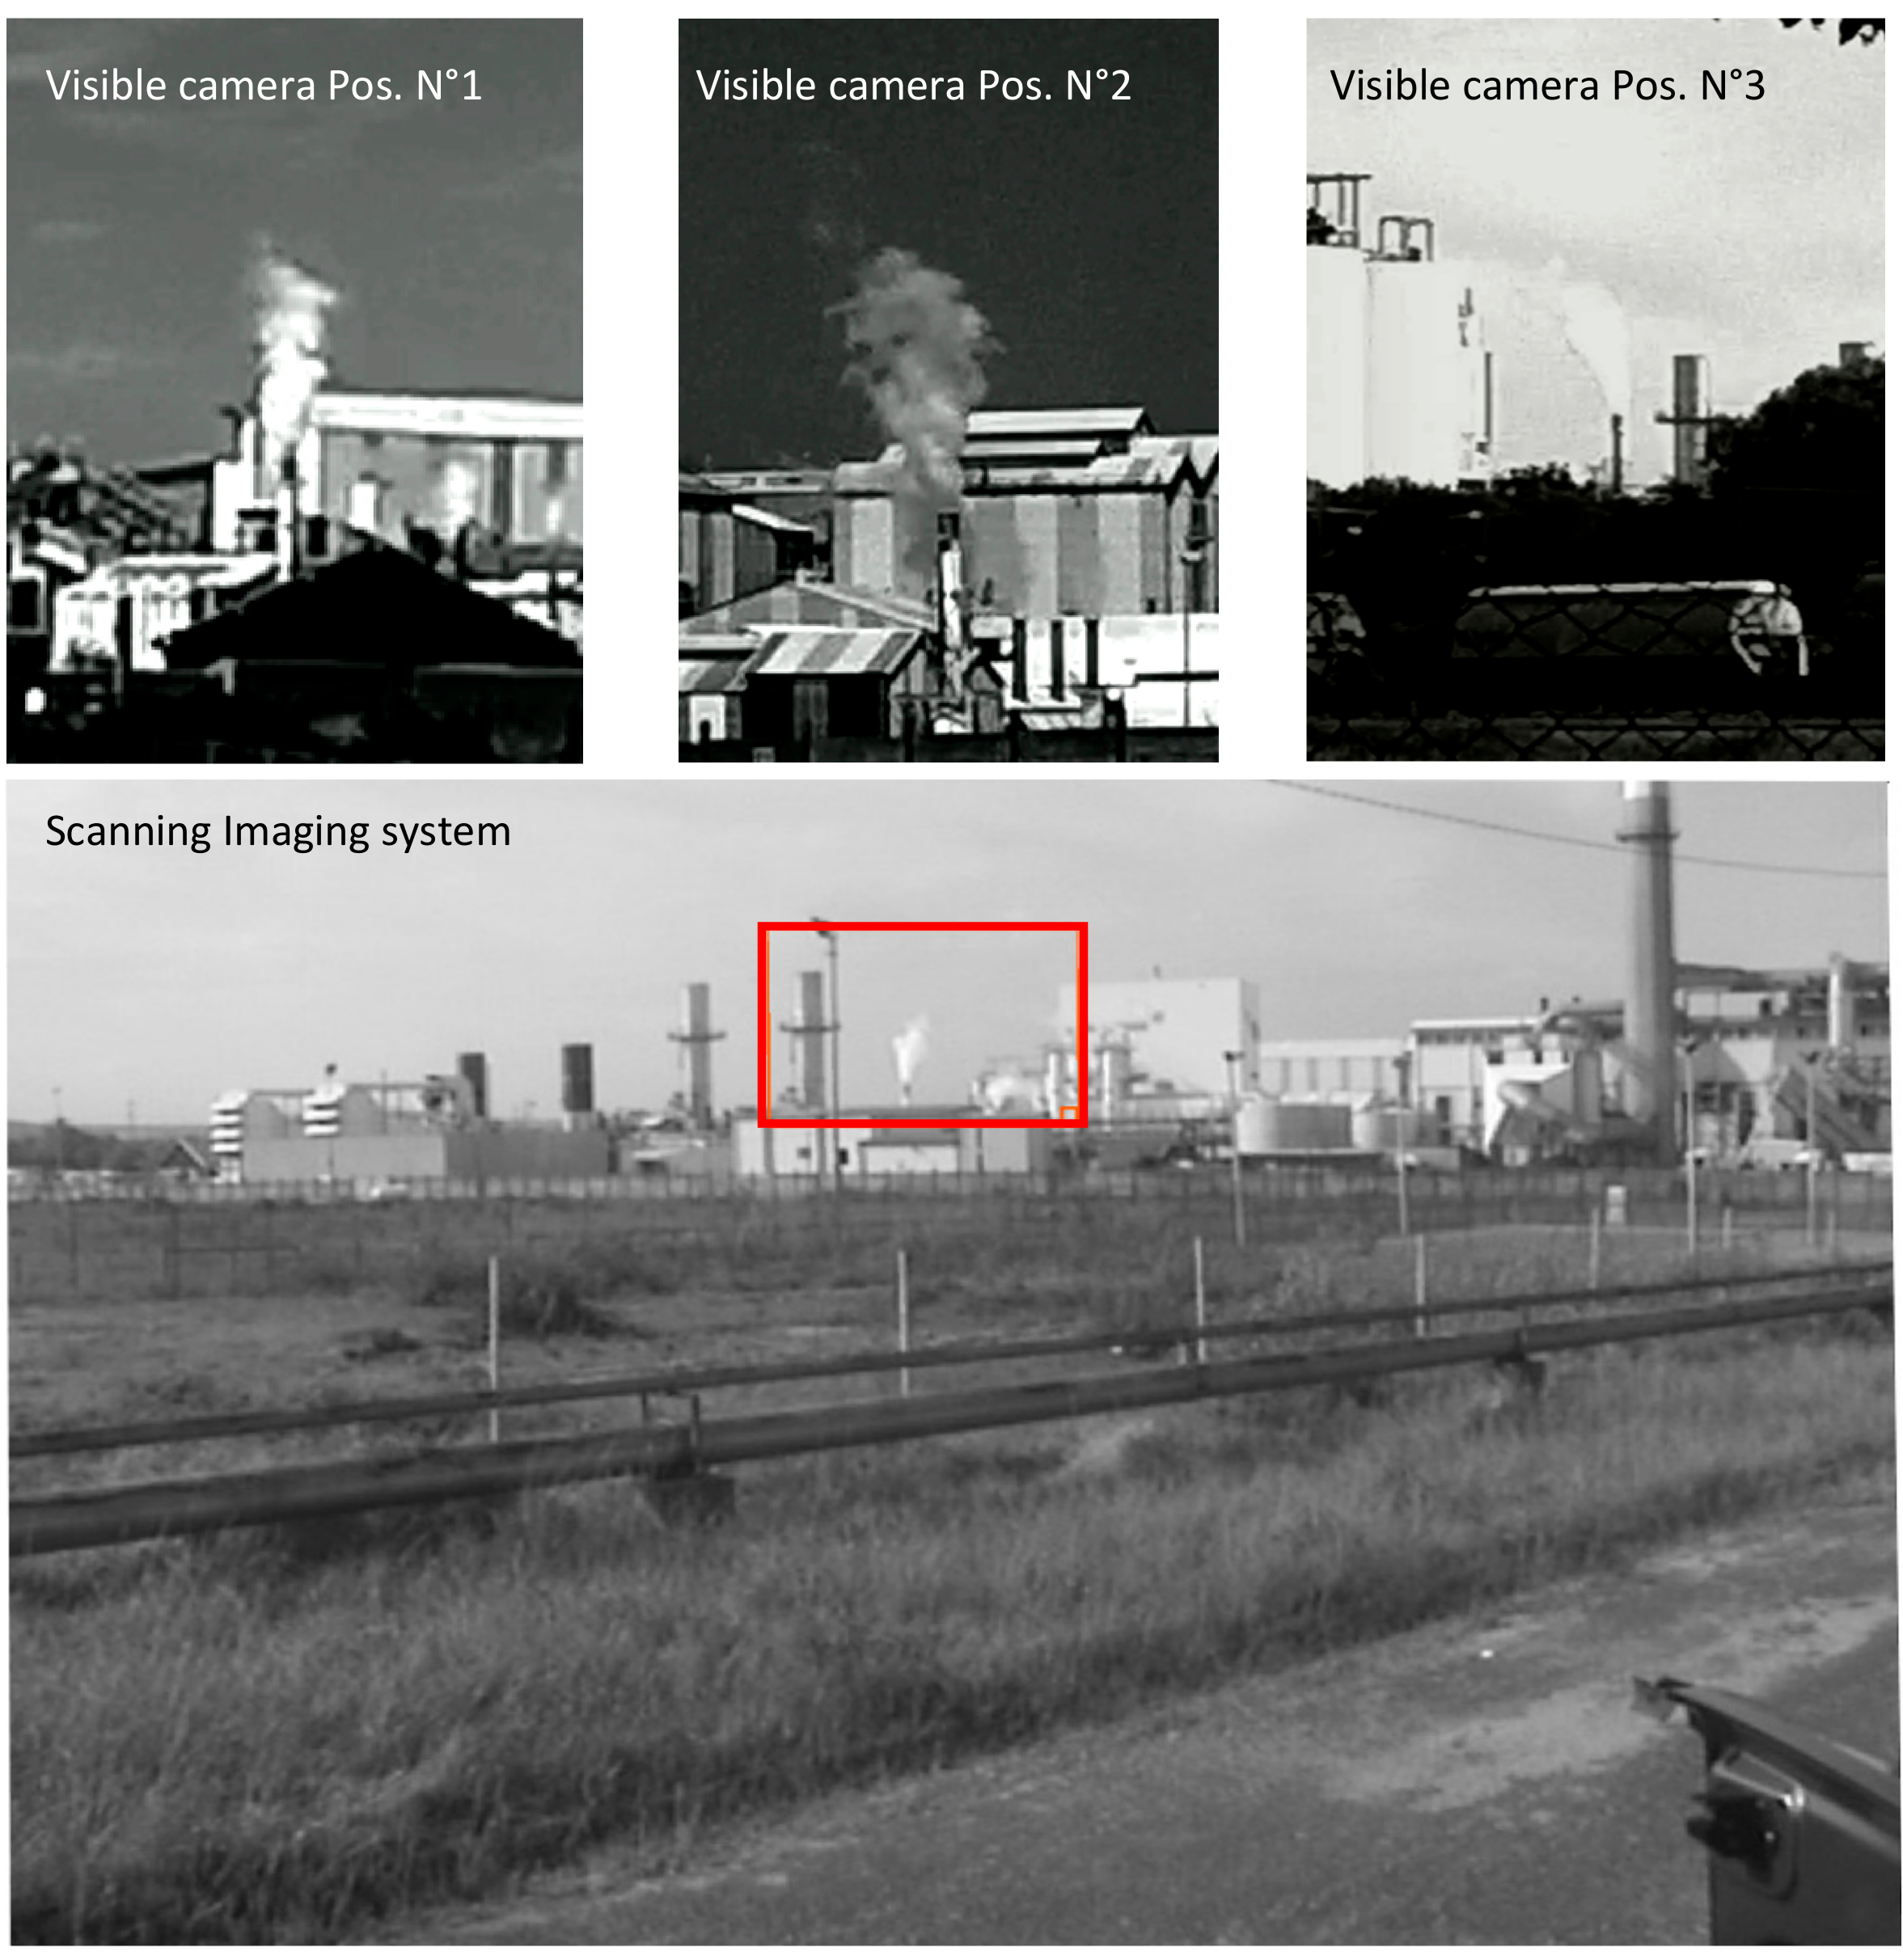
2.1. Stereoscopic Measurements (Multi-Angles) in Real Time by Visible Cameras

Real-time monitoring of the visible trace of a gaseous plume is achieved by the use of three visible cameras of the GoPro Hero3 type located at three different viewing angles. Such simultaneous stereoscopic measurements are necessary for a 3-D reconstruction of the gas plume. The cameras are remotely controlled via a Wi-Fi network using a digital tablet (HP Pro 10 EE GI Hewlett Packard). The optical parameters of the three cameras have been optimized and their configuration is given in Table 1. To fully appreciate the complete lateral extension of the industrial site, only the resolution of the GoPro 1 camera was set to 1920 × 1440 pixels resulting in 4:3. The other two camera views are defined with a 16:9 single full HD resolution of 1920 × 1080 pixels.
All the three cameras are fixed on an adjustable tripod to master precisely the elevation and horizontal tilt. The visible database is used for the 3-D reconstruction of the gas plume with the geomodeler gOcad® (Paradigm®). This software has led the industry for over 20 years in providing the most advanced capabilities for seismic, geological and reservoir modeling [30,31,32]. Among the main topics coming from the oil industry, the gOcad® software offers a maximum number of facilities to work with various types of 3-D data and a high workability that allow, when necessary, specific and manual construction and adjustment of 3-D models.
The geometrical model of the gas plume, represented by a 3-D surface envelope, allows definitions of local plume thicknesses that are used to quantitatively analyze gas concentrations in ppm. The detailed 3-D protocol is described in the following section.

2.2. Infrared (IR) Scanning System

Infrared emission spectra are collected using a scanning imaging IR system (SIGIS Bruker, called SIGIS in the text). Although this device has been described in detail by [6,18], the following quick reminder is done. The SIGIS spectrometer is based on the combination of a modified Michelson interferometer with cube-corner mirrors (interferometer OPAG 33, Bruker Daltonics, Leipzig, Germany) connected to a cooled single MCT (Mercury-Cadmium-Telluride) detector element and a scanning mirror. The system allows definition in an interactive way of the field of the infrared analysis constituted by a rectangular 2-D pixelated grid. Then, the rotating head is held at a fixed position and the scanning mirror is sequentially set to all positions or pixels from the upper left corner to the bottom right corner in the relevant area. The main specifications and measurements parameters are summarized in Table 2. The entire infrared imaging remote-sensing device has been adapted to a small van-type vehicle [18].
The normal analysis mode has been selected, which means that all the pixels of an infrared grid are measured and analyzed. The total analysis time was 15 min starting at 01:40 p.m. (GMT) and ending at 01:55 p.m. (GMT), corresponding to 39 analyzed grids.
The internal data-processing algorithm described by [16,33] makes it possible to express the corrected brightness temperature spectra of each gas in terms of the correlation coefficient (R). The calculation procedure is repeated successively for each pixel of the 2-D projection and can be repeated for all gas compounds of the spectral library. In this paper, we focused on NH3 dispersed in the flue gas streams to illustrate the reliability of the entire procedure. For this purpose, Figure 1 shows the measured and theoretical infrared emission (Bruker Gases Library, Opus Software, Ettlingen, Germany) profiles of NH3 corresponding to a correlation coefficient of 0.62 in the spectral detection window used in this study (1000 to 900 cm−1).
Due to the absence of NH3 in normal atmospheric composition, an atmospheric reference is required.

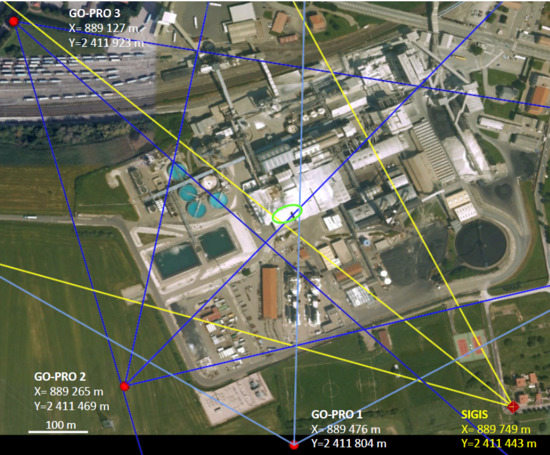
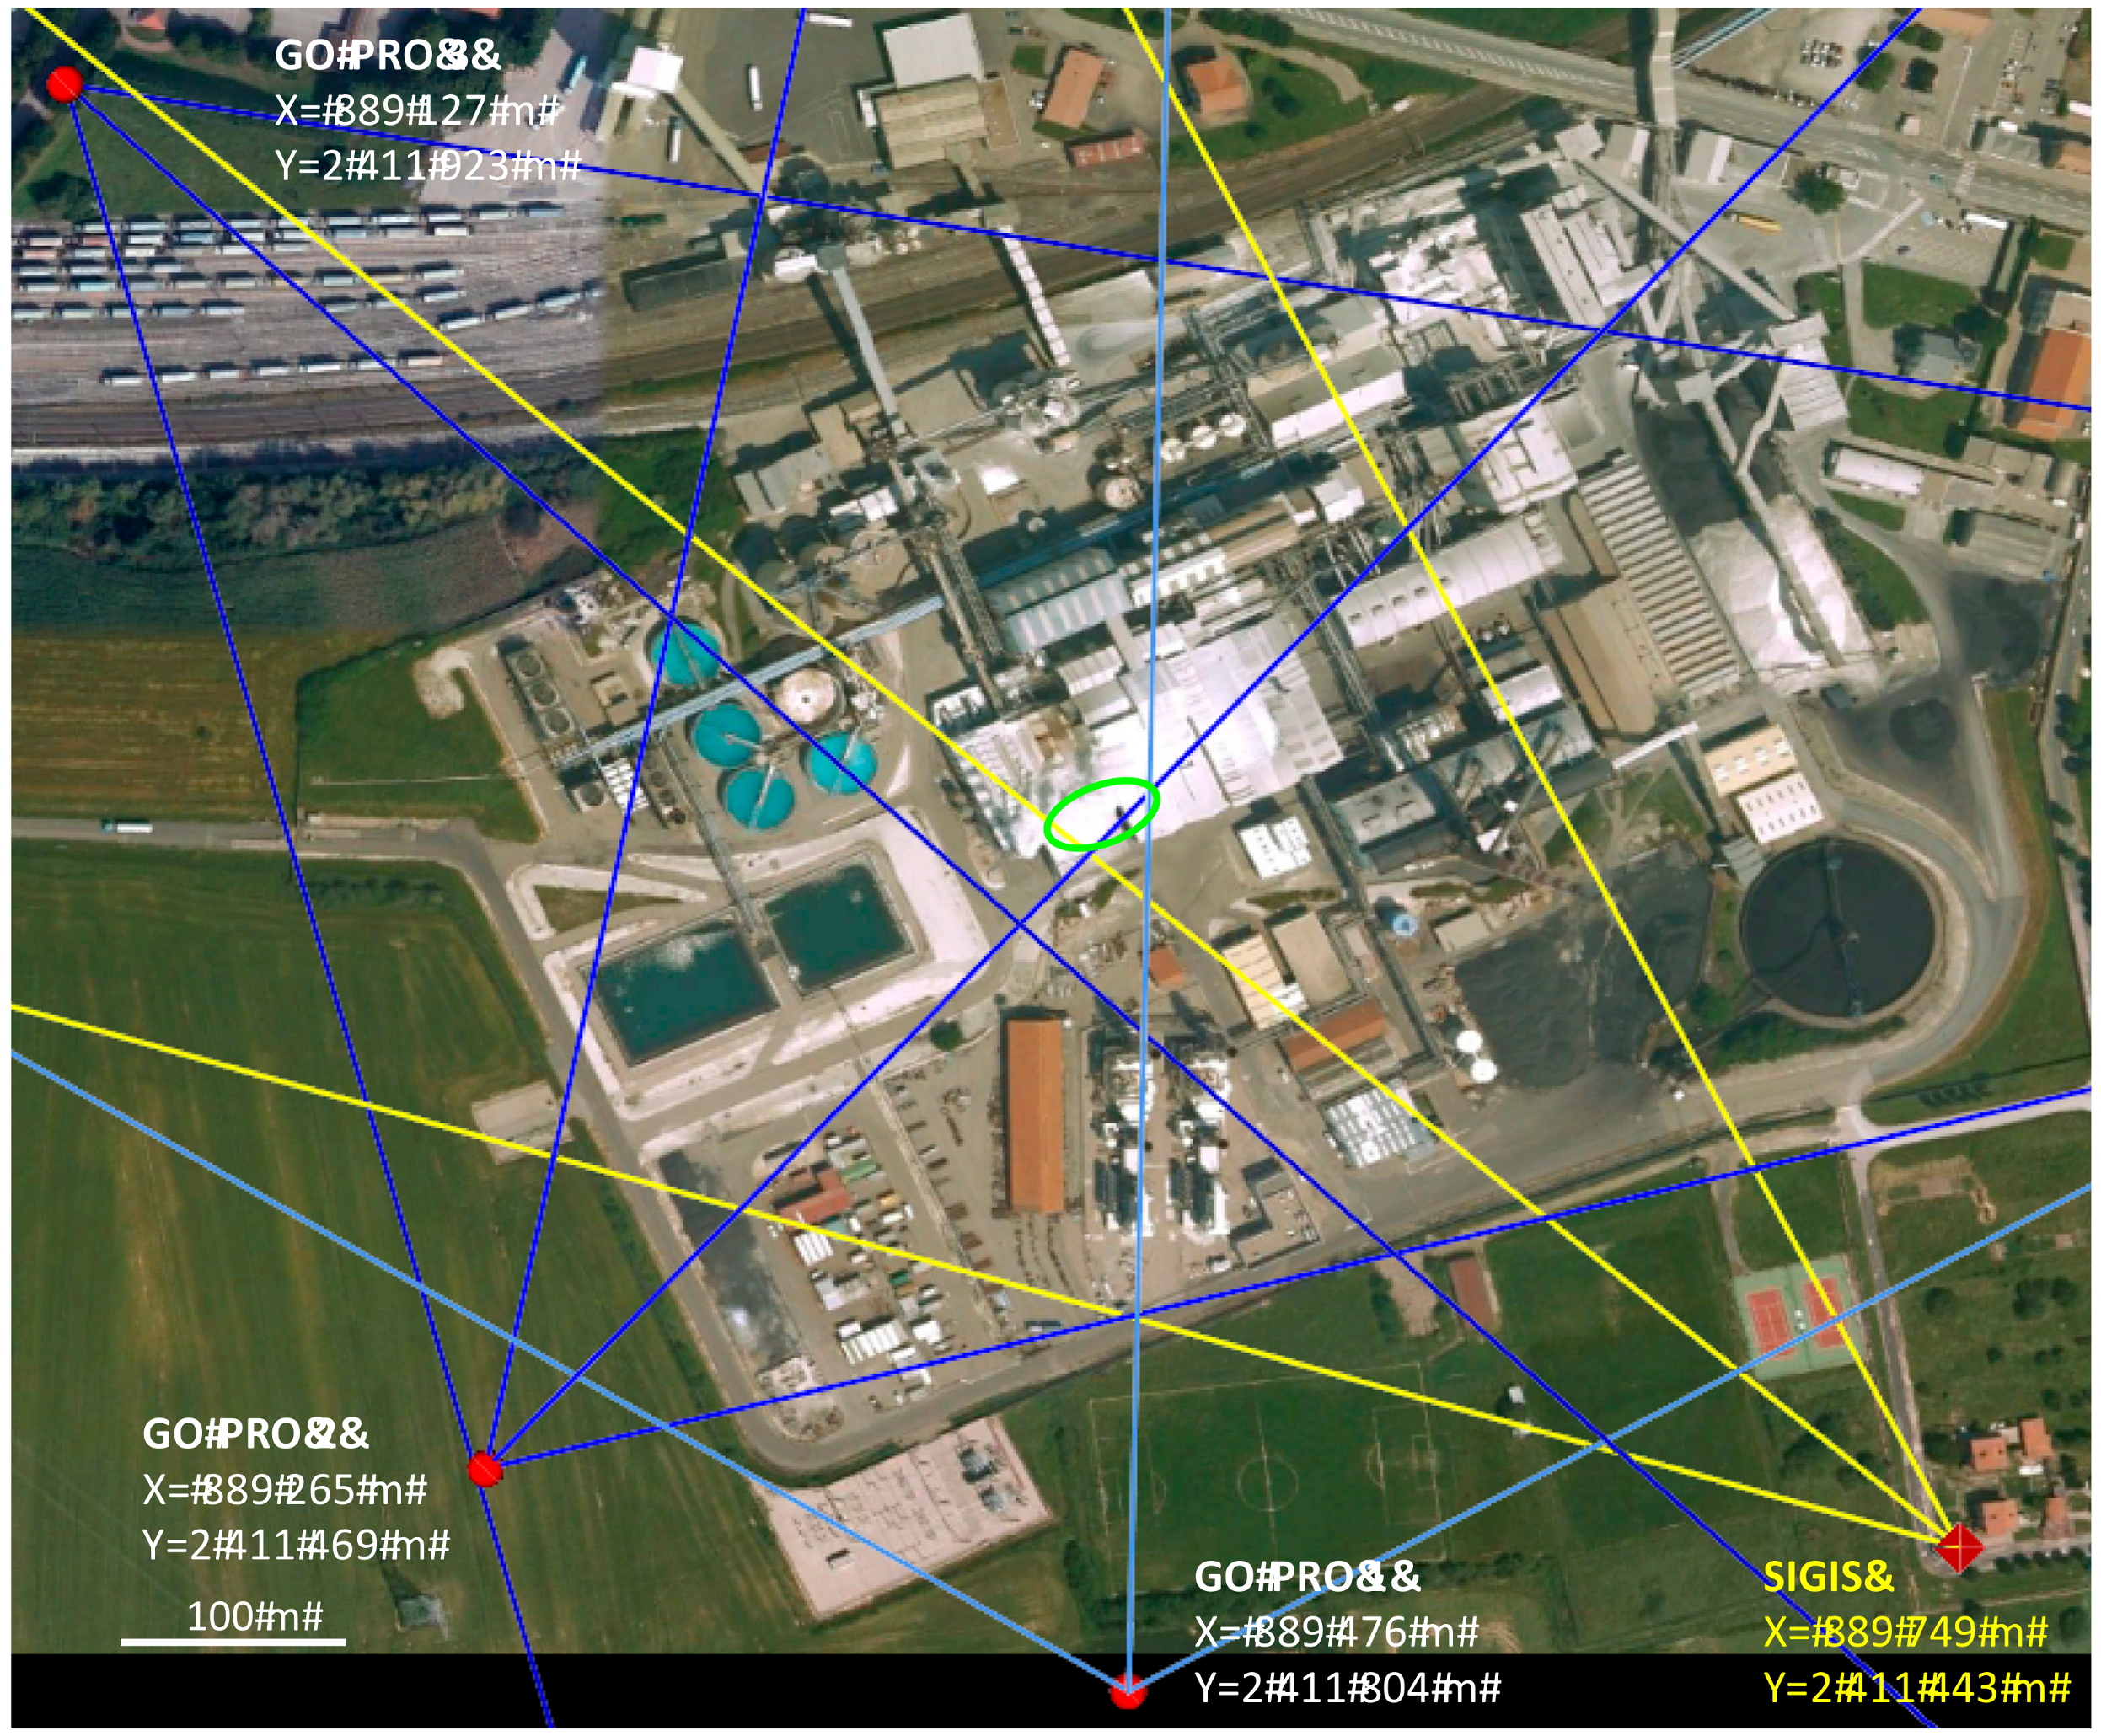
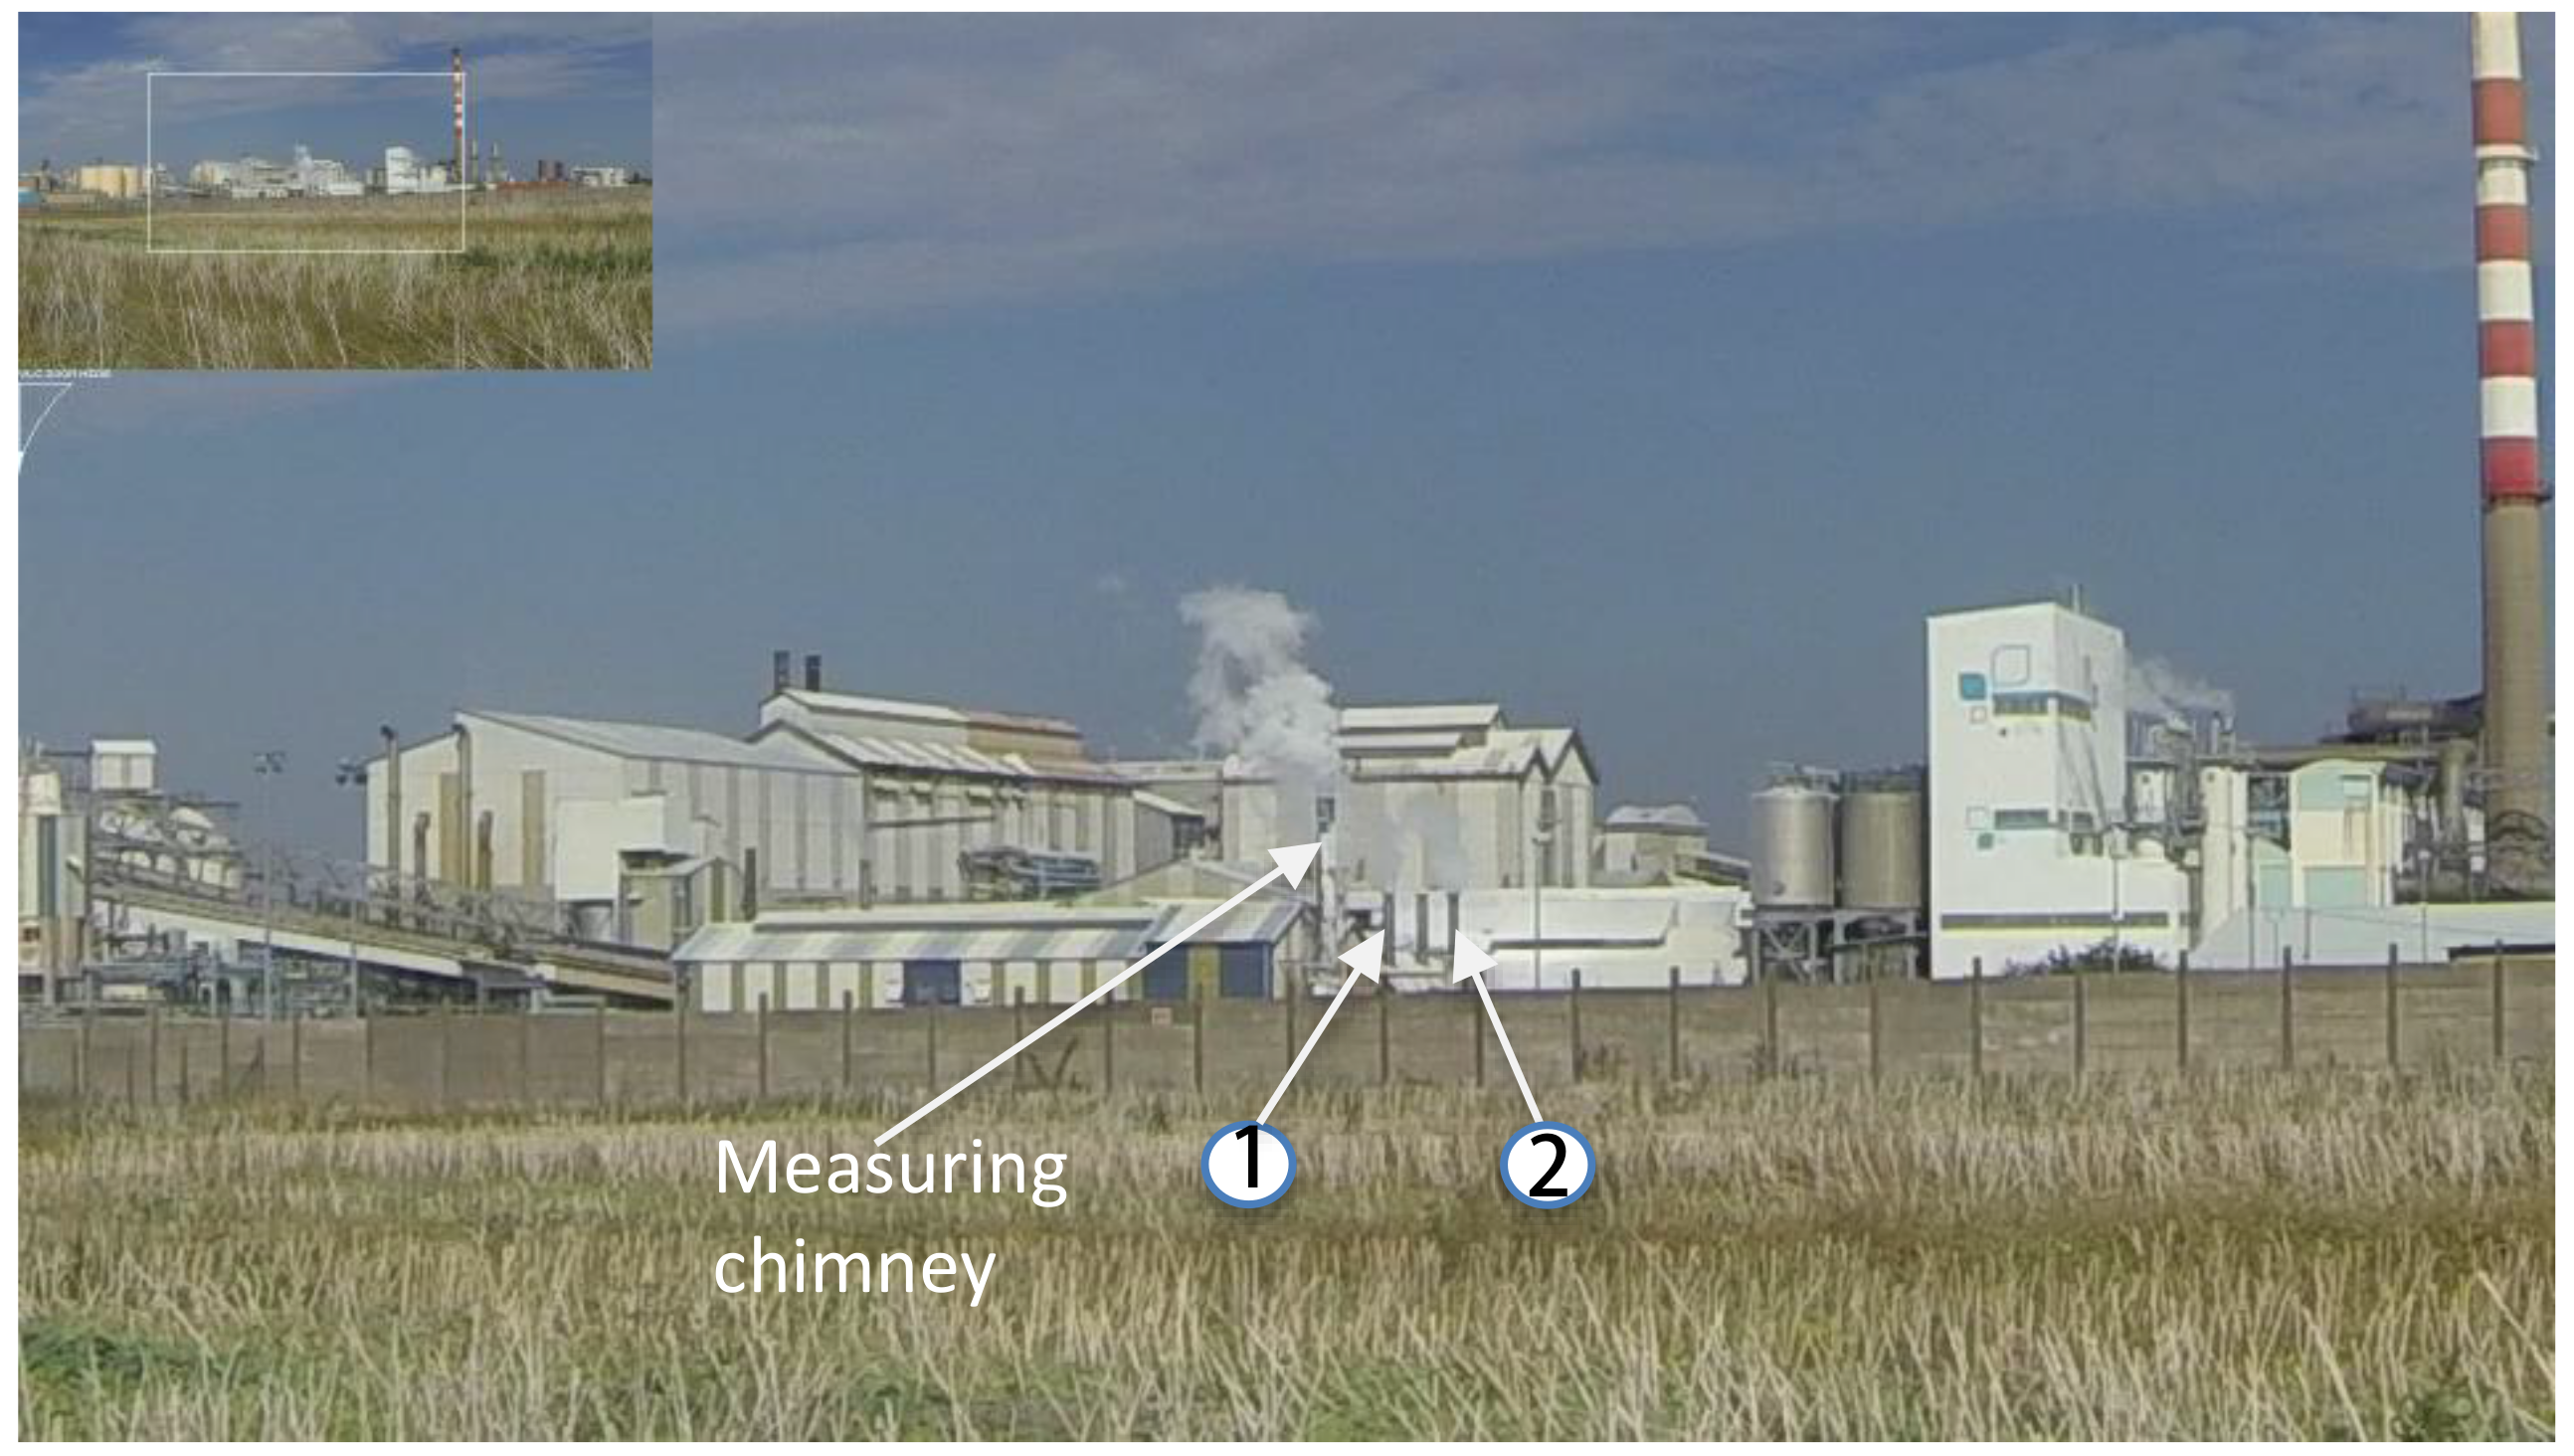
2.3. Positioning of the Various Devices on the Industrial Site

All experiments were carried out on a chemical industrial site (NOVACARB Society, Laneuveville-devant-Nancy, France) with specific emissions of NH3 in flue gas streams. These gas emissions can potentially come from four different chimneys depending on the upstream industrial process. Figure 2 gives an overview of the positioning of infrared and visible measurement systems on the industrial area. The location of the emissive chimneys is indicated (green oval) as well as the corresponding fields of view of each device (blue lines for visible cameras, yellow lines for the IR imaging system).
The vertical and horizontal tilts of the GoPro optical axes are measured, in degrees, with an accurate digital inclinometer at a resolution of 0.1 degrees. The GeDetekt (BRUKER) software is related to a user-defined measurement window (see Table 2) that directly controls the location of the SIGIS infrared system. The positioning parameters are summarized in Table 3 and the main atmospheric parameters during the measurements in Table 4. The Global Positioning System (GPS) parameters are recorded by a Magellan® eXplorist® 610 (MiTAC Digital Corp, Taipei, Taiwan).

2.4. 3-D Modeling Protocol Using the Paradigm gOcad® Software

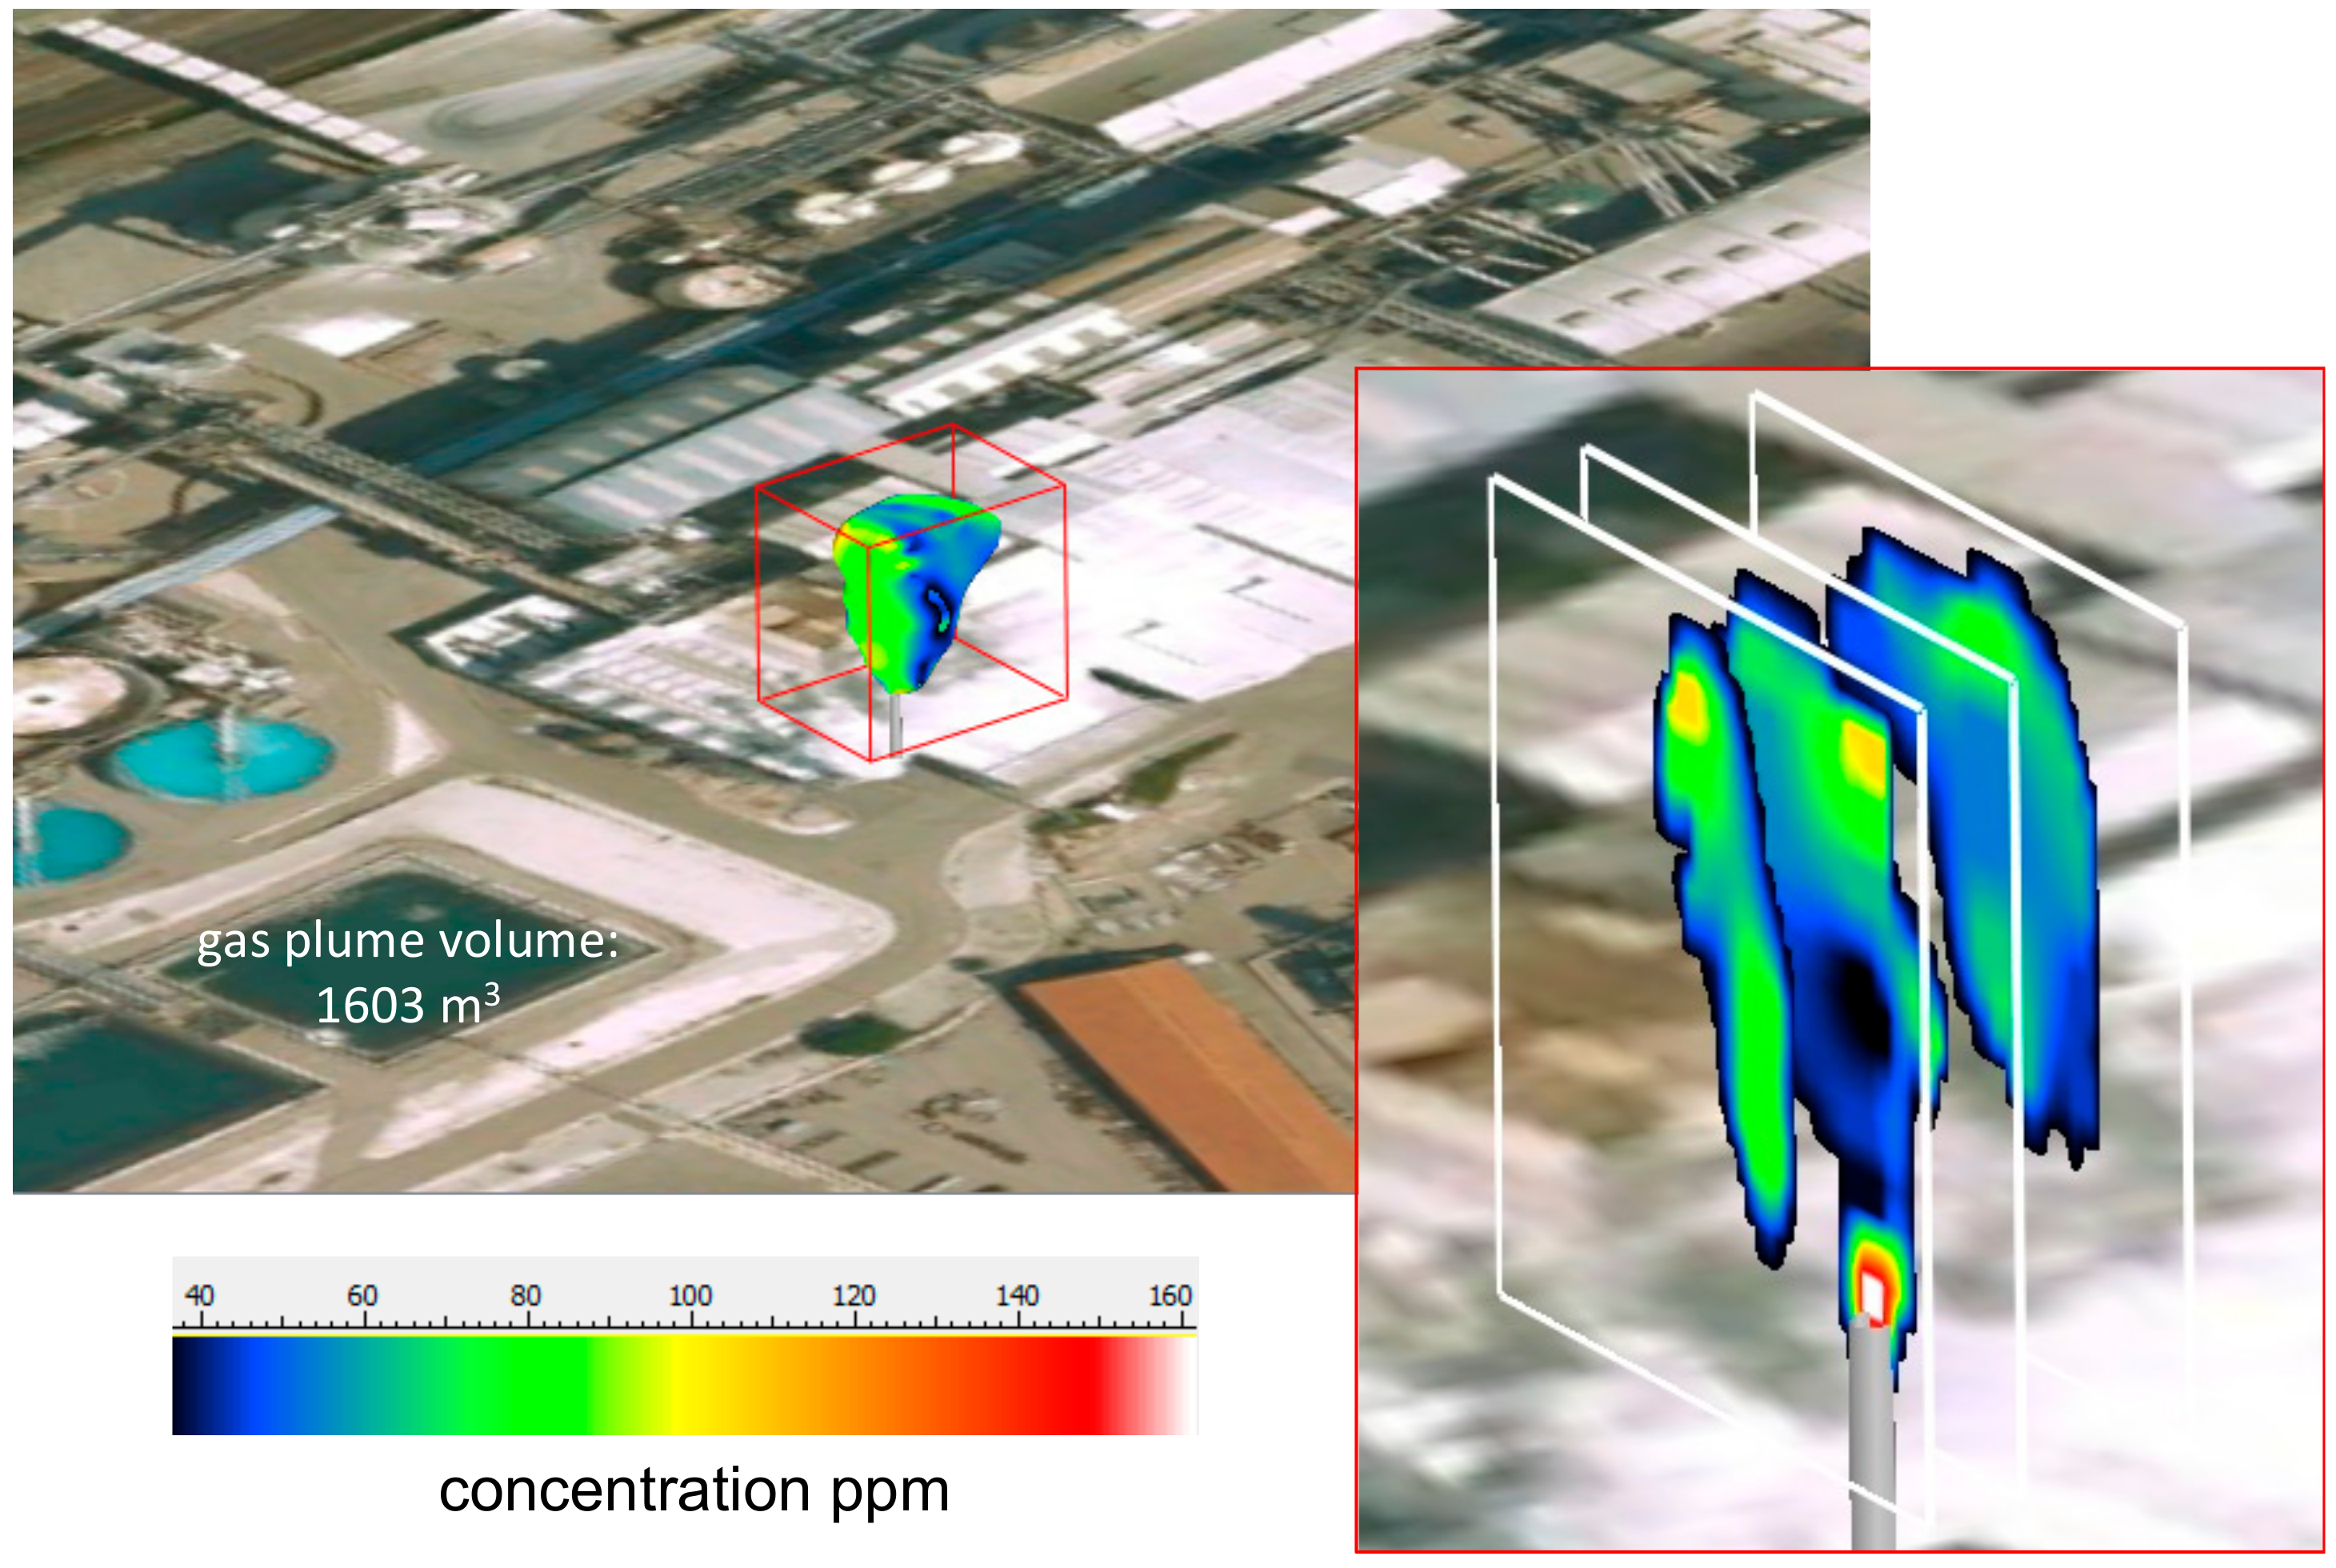
2.4.1. Gas-Plume Reconstruction

For the 3-D modeling approach, it has been assumed that the visible atmospheric dispersion is the total of all gases emitted at the same time by a chimney. The visible trace of the gas plume, mainly due to H2O vapor, delimits the entire envelope of all the gases emitted with various NH3 concentrations. The 3-D reconstruction is based on the combination of visible GoPro cameras and SIGIS images that are precisely relocated. The XYZ georeferencing of the images is realized using the geometrical and optical criteria of the different cameras (see Table 3). Figure 3 schematically shows all the geometrical and angular data, respecting the viewing angles, the heights of the cameras, the XYZ location of the cameras and the point of view of the shot.
A rectangular surface is defined and constrained by these angular data and the target of the shot: the NOVACARB chimney (bottom located at X4, Y4, Z4). The visible image is then precisely located, adapted and draped onto this surface using gOcad® abilities [34]. The IR image is also referenced using the same geometric and angular constraints. As an example, in Figure 3, 3 pixels of IR measurements are located (X1-2-3, Y1-2-3, Z1-2-3) and correspond to the concentration in ppm.m in the gas plume.
The 3-D reconstruction is now presented step by step in Figure 4. The first visible GoPro images of the gas plume are imported and adapted and draped on 3-D surfaces of specific sizes and orientations according to the position of the camera and the optical parameters (Figure 4a,b). This georeferencing is also done for the IR image. Then, the GoPro 3D images allow the picking of the gas plume envelope in the 3 image orientations (Figure 4c,d). An image treatment is done automatically to define the edge of the plume using a thresholding. This operation defines a binary image (black, plume; and white, edge of the plume). The edge picking is then done manually following the defined white line within the gOcad® project. On the basis of this picking a first volume is constructed that respects the three discrete sections of the plume. This initial raw volume (Figure 4e) is then defined and geometrically interpolated using the discrete smooth interpolation (DSI) algorithm of gOcad® [24] which makes it possible to obtain a smooth, objective and realistic final shape of the gas plume (Figure 4f). The difference of volumes between the raw envelop (1416 m3, Figure 4e) and the final interpolated plume envelope (1603 m3, Figure 4f) is equal to 187 m3. The interpolation operation impacts the final volume at an order of magnitude of 10%. The bounding box of the plume is a parallelepiped with a 19 m × 9.9 m × 19 m (height) size.
SIGIS IR measurements define path concentration (ppm.m) value for 11 × 17 pixels relocated in 3-D and which intersect or not the 3-D gas plume. For each pixel, a line can be drawn that connects the position of the SIGIS camera and one of the 11 × 17 pixels (Figure 4f). However, only lines that intersect the 3-D gas plume are now taken into account to define the intersecting distance within the plume. The choice of keeping only distances of plume intersections higher than one meter was done (see the black lines that intersect the plume between two red dots in Figure 4f).

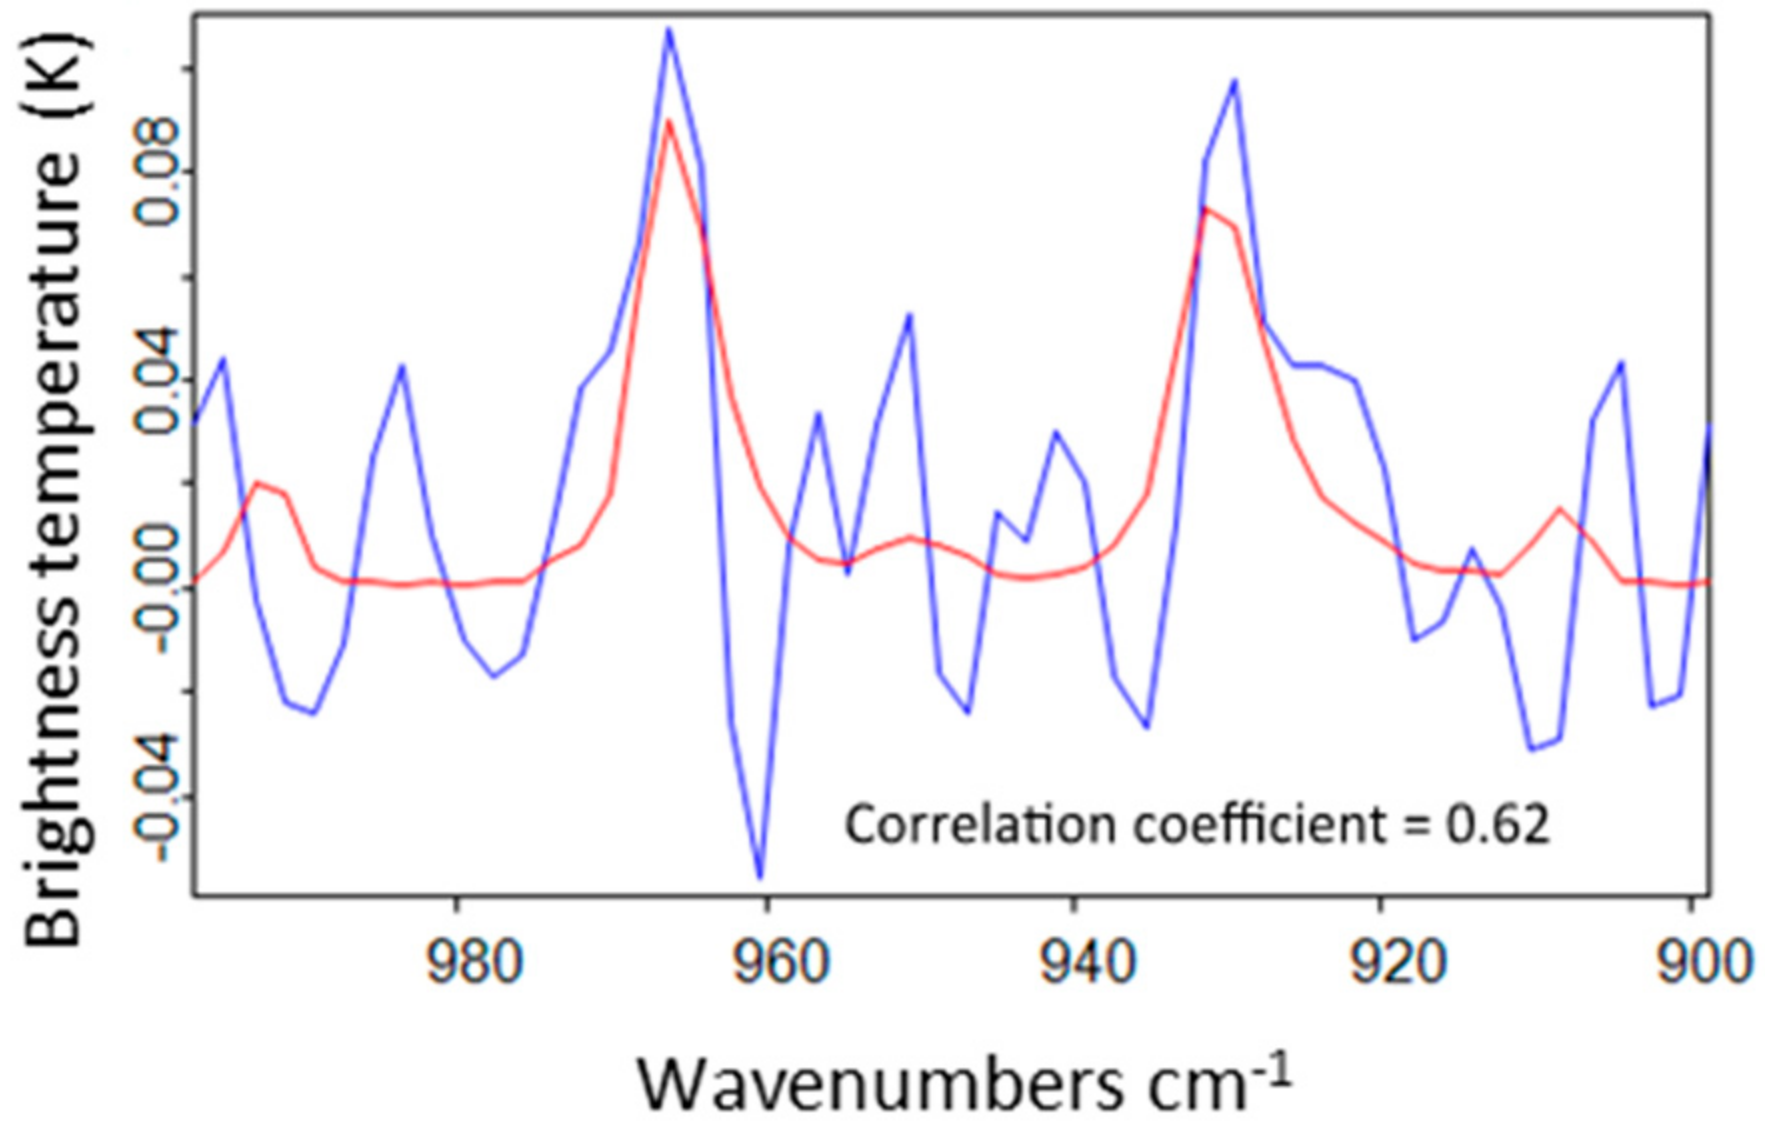
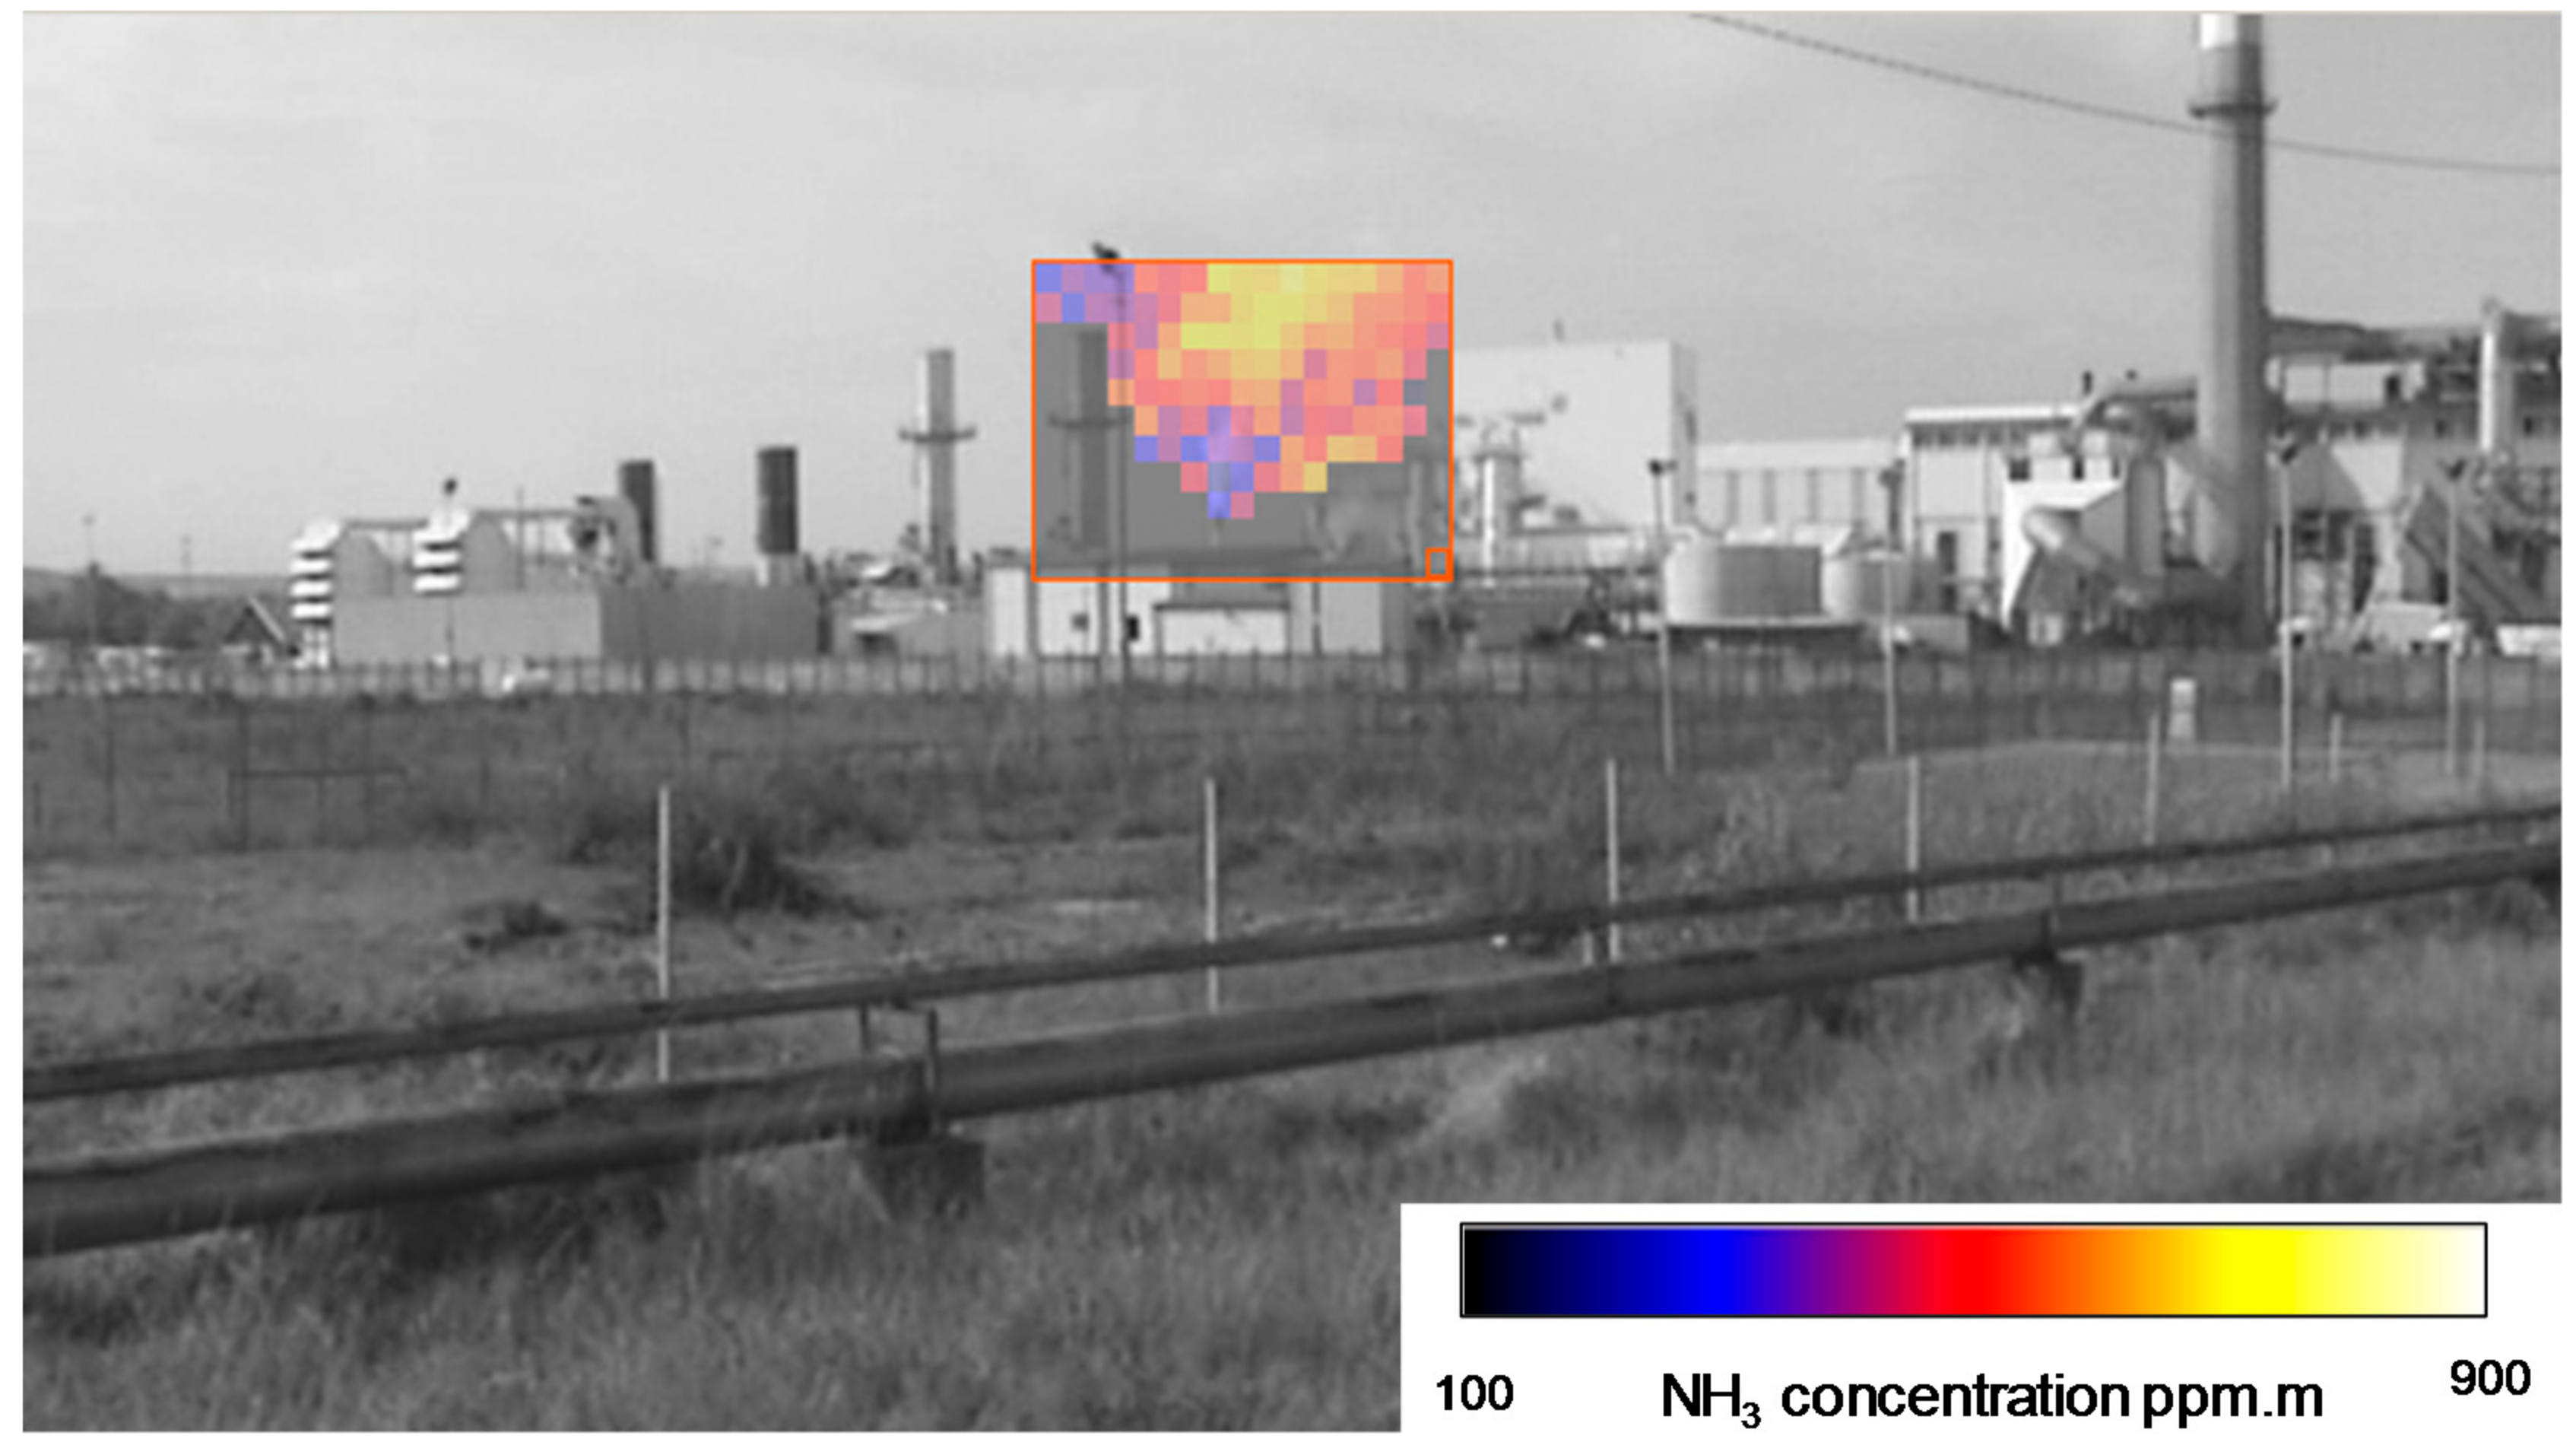
2.4.2. 3D NH3 Concentrations within the Plume

At this first step, only the 2D SIGIS grid supports the NH3 value of path concentration property value. However, this discrete property could be extended all along each line that intersects the plume and connects a pixel of the grid. The NH3 path concentration is thus an integrated value that characterizes a segment of specific length (Figure 4f).
In order to visualize the global volume, a regular 3D grid (gOcad® voxet object) is built with the same resolution as the SIGIS grid (2D-pixel size equivalent to 3D-voxel size). In this grid a volumic region is delimited using the plume surface envelope. A generic NH3 concentration property is created throughout the whole 3D regular grid and is equal to a value without date outside the the envelope area. The voxels within the region (gas plume) are then specifically defined with the NH3 property supported by each previous intersecting line: a line that intersects a voxel allows the transfer of its property value at the voxel center. This propagation of the NH3 properties in the 3D regular grid remains at this step discrete points within voxels, along the intersecting lines. A final DSI interpolation allows propagation (neighborhood propagation) and interpolation of the NH3 property within all the voxels within the gas-plume region.

3. Results and Discussion

3.1. Generality

In order to properly visualize all the measuring systems on the industrial site Figure 5 shows the different fields of view recorded by (i) the three visible cameras GoPro Hero3 cameras (Positions 1, 2 and 3); and (ii) the scanning infrared system (Figure 5, picture at the bottom right). A zoom of the picture is proposed for positions 1, 2 and 3 to appreciate and delimit the NH3 plume. The SIGIS image is presented without any zoom and the red rectangle represents the IR measurement grid. The exact distances between the images from the target chimney are 278 m, 273 m, 406 m and 380 m for GoPro 1, GoPro 2, GoPro 3 and SIGIS respectively.
Figure 6 shows a typical 2-D measurement plane where the NH3 concentrations are expressed in ppm.m for each of the 187 pixels. The SIGIS measurements (Figure 6) clearly show that several chimneys have atmospheric releases of ammonia. However, only the most important left-hand chimney plume was treated for the reconstruction of the 3-D plume (Figure 4f). According to the 3-D modeling protocol using the Paradigm gOcad® software presented in Figure 4, the final volume of the gas plume was calculated and is equal to 1603 m3.

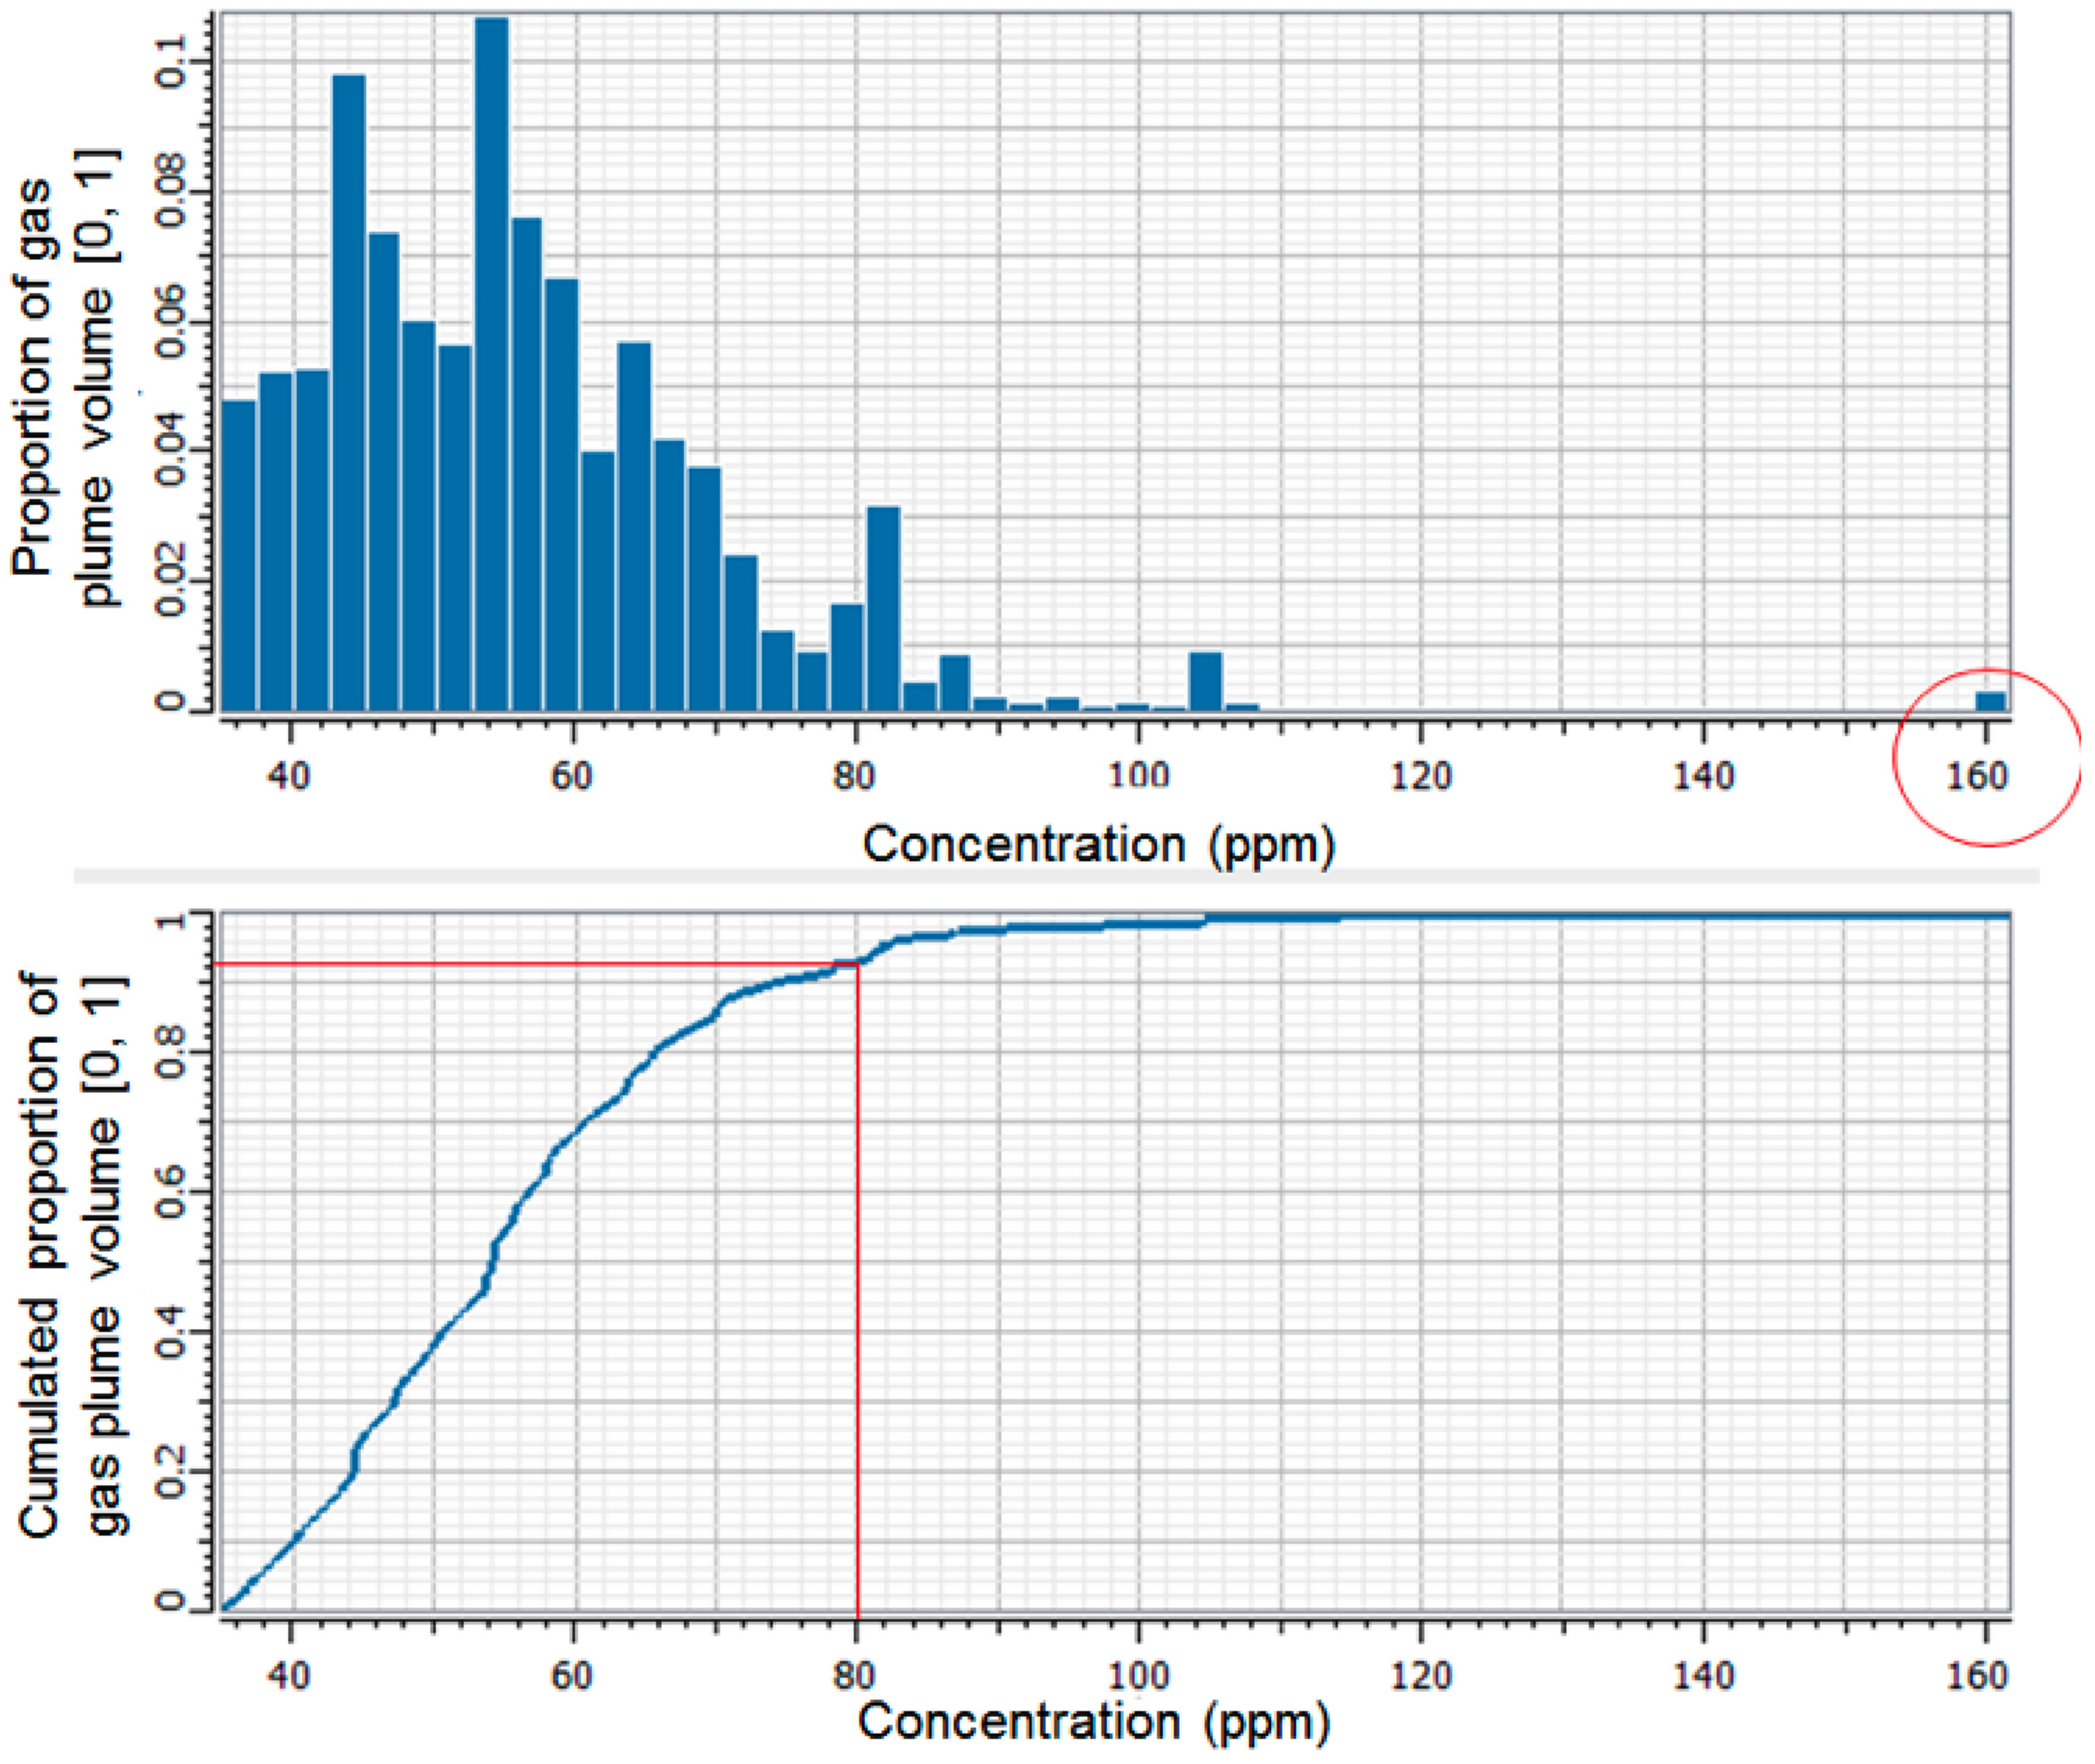
3.2. Distances within the Gas Plume

The final characteristic distances within the plume (Figure 4f) are summarized in Table 5. The gas concentrations in the plume are obtained by dividing the concentration in ppm.m by the intersecting distance (distance between two points of plume intersection, see Figure 4c,d). The results are shown in Table 5, and NH3 gas concentrations are distributed between a minimum value of 35 ppm (pixel F8) and maximum value of 162 ppm (point I8).
The uncertainty concerning the concentration calculations comes from the definition of the intersection distances and these distances are directly related to the shape of the plume. To estimate the uncertainty linked to this envelope definition, we have calculated intersection distances between the SIGIS lines and the raw envelope without any smoothing and interpolation (see Figure 4e), and compare them to the intersection distances after the DSI interpolation (see Figure 4f). The raw and interpolated volumes correspond, respectively, to a volume of 1603 m3 and 1416 m3. The difference between them is 187 m3 i.e., 11.6% of the plume volume. The intersection distances calculated for the raw volume and the interpolated one have been compared and concentrations are then recalculated using the two types of values. The main uncertainty could then be described regarding the concentration amplitudes (max–min) and the results are summarized in Table 6. The ppm concentrations coming from the raw volume intersections show a minimum value of 40 ppm and a maximum value of 159 ppm that are quite similar to the concentrationd used and finally proposed in Table 5. These extreme values are observed for the same pixel (F8 and I8).

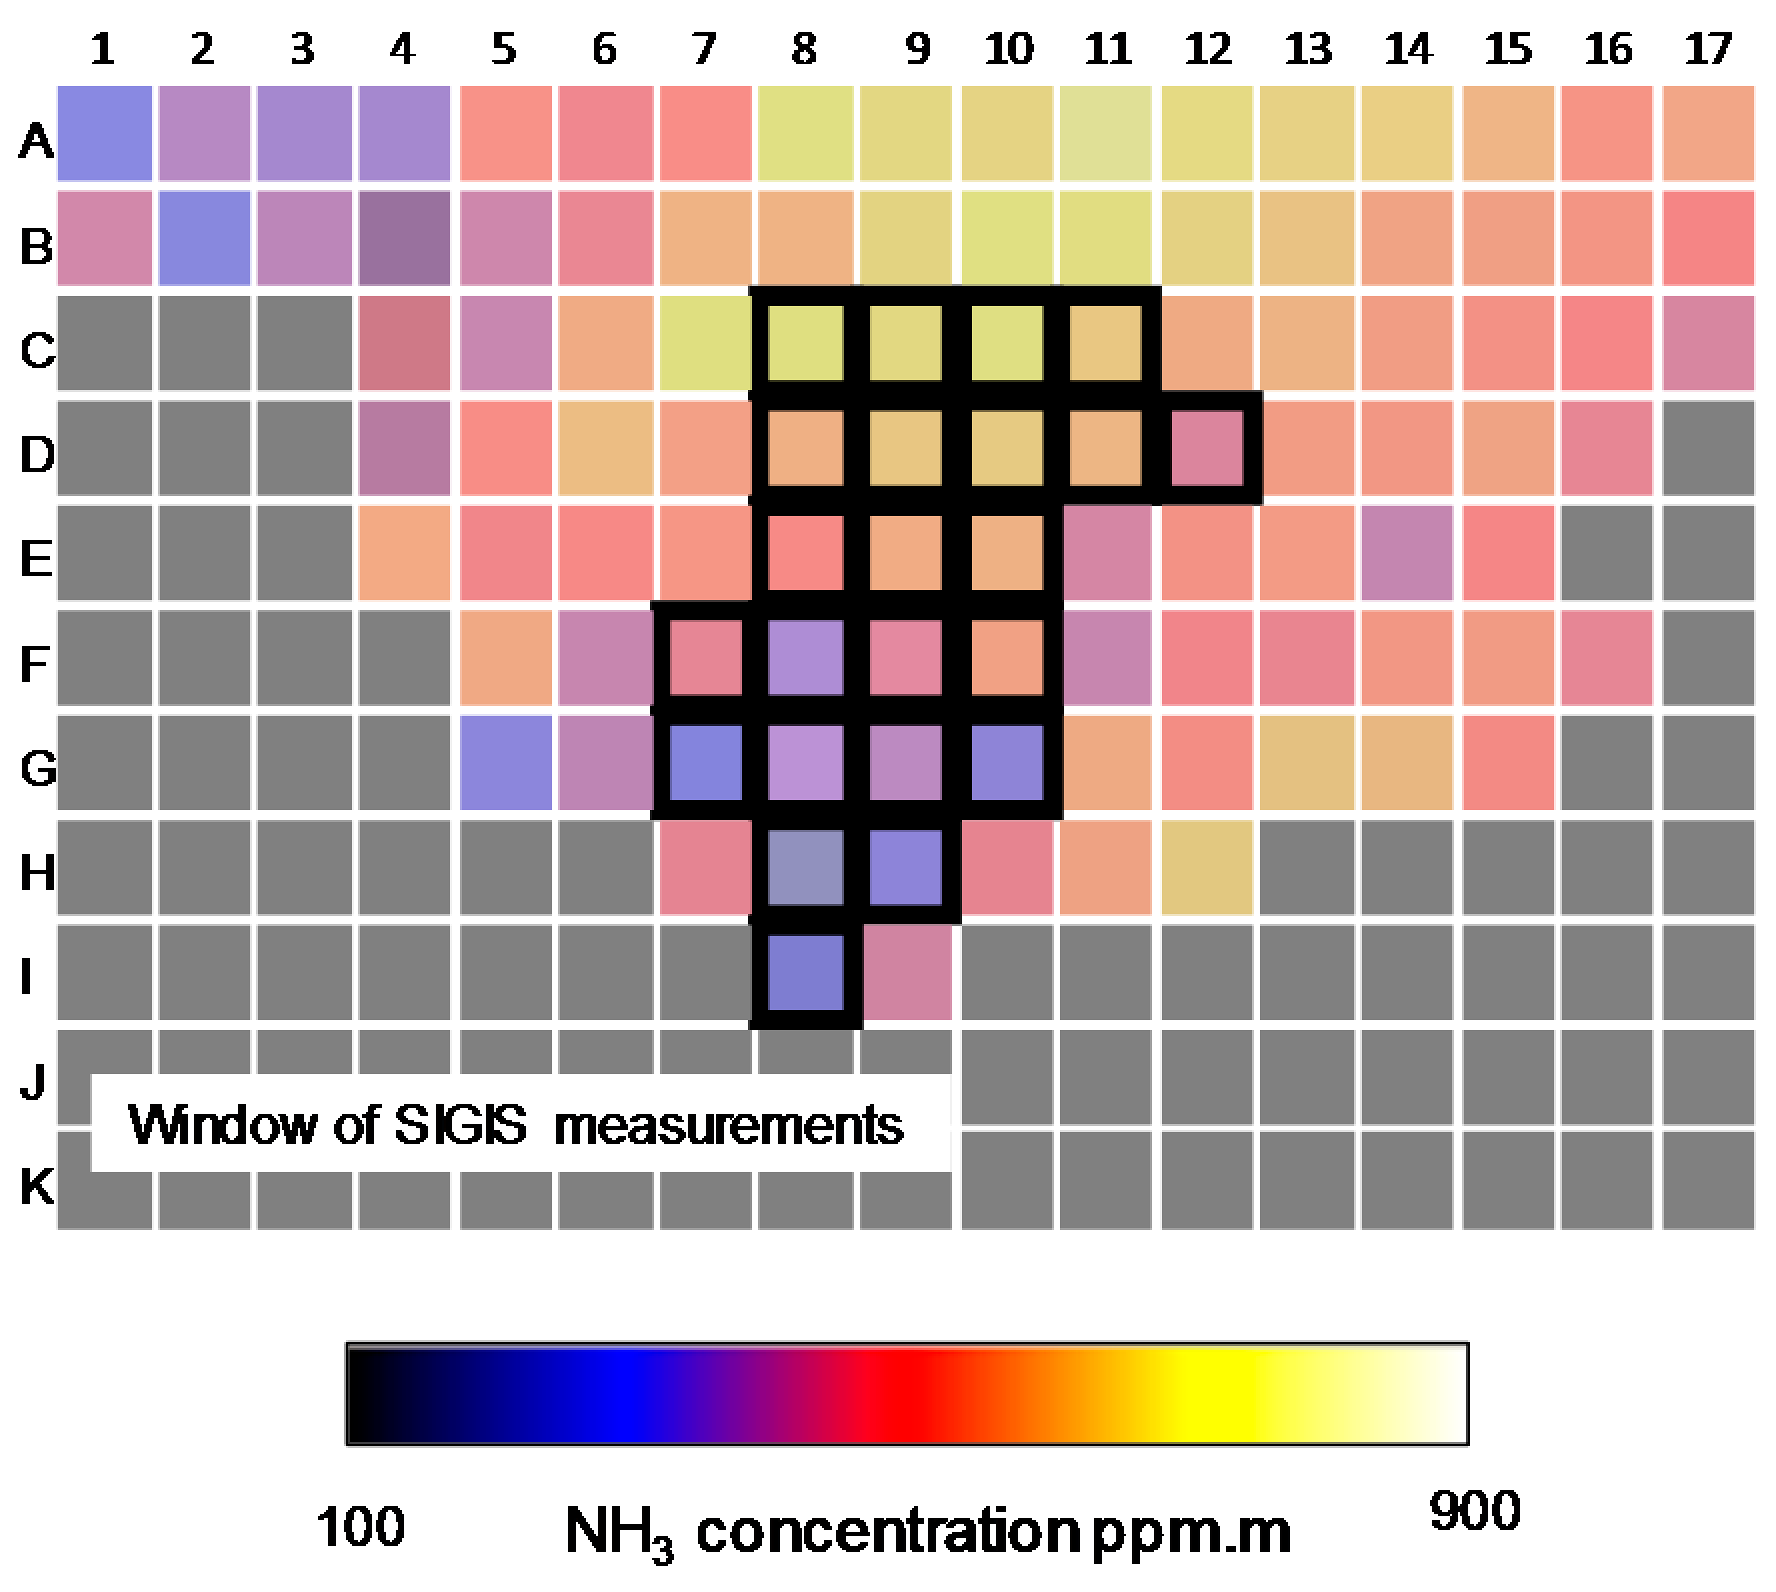
3.3. Quantitative Spatial Distribution of NH3 in the Gas Plume

Table 5 shows that the distribution of NH3 concentrations in the visible plume varies from 35 ppm to 162 ppm. At this specific industrial site, the maximum tolerance standard, defined by prefectural order (French Republic, Code of Environment, Art. R515-75, Decree n°2013-374 from 2 May 2013), is equal to 60 ppm. The proximity of other sources (Figure 7, chimneys 1 and 2), where the presence of surrounding NH3 plumes is demonstrated (see Figure 6 and Table 5), can easily explain higher NH3 values. Moreover, diffuse emissions are still present on the entire site. All these emissions (channeled and diffuse) combine with the measurement plume leading to a slight overestimation of the actual NH3 concentration in it.
By combining the data in Table 5 and the interpolated volume of the gas plume (Figure 4f), the experimental 3-D NH3 concentrations in the gases emitted from the chimney can be calculated. The result is given in Figure 8. The concentration values are extrapolated within the entire volume using gOcad® DSI interpolation and then can be determined in any point of the modeled plume. In order to appreciate the heterogeneity of the NH3 distribution, the right-hand part of Figure 8 corresponds to a zoom of three transverse cross-sections made at three different altitudes in the gas cloud. On these three sections, the highest NH3 values are mainly located on the right side of the gas plume, which corresponds to partial overlap with other additional emission sources, as shown in Figure 7 for example. Moreover, in the central cross-section, it is clear and logical that the highest emission value of NH3 (161.7 ppm, pixel I8 of Table 5) is detected only at the chimney exit.
The data presented in Figure 8 make it possible to calculate the different proportions of NH3 in the total volume of the gaseous plume (Figure 9). Figure 9 shows the distribution histogram of the relative concentrations of NH3 in the volume of the plume. The two most abundant surface isoconcentrations are, respectively, 44 ppm and 54 ppm, which represent about 30% (9.8% and 18% respectively) of the total gas volume. On the contrary, the gas-plume volume within a surface isoconcentration of 161 ppm represents less than 4% of the emitted ammonia. In addition, 94% of the gas plume is characterized by an NH3 concentration below 80 ppm (Figure 9 bottom). Such an analysis is of prime importance for the monitoring of air quality at an emissive industrial site and for the knowledge of the associated environmental impacts, whether in a normal or crisis situation.

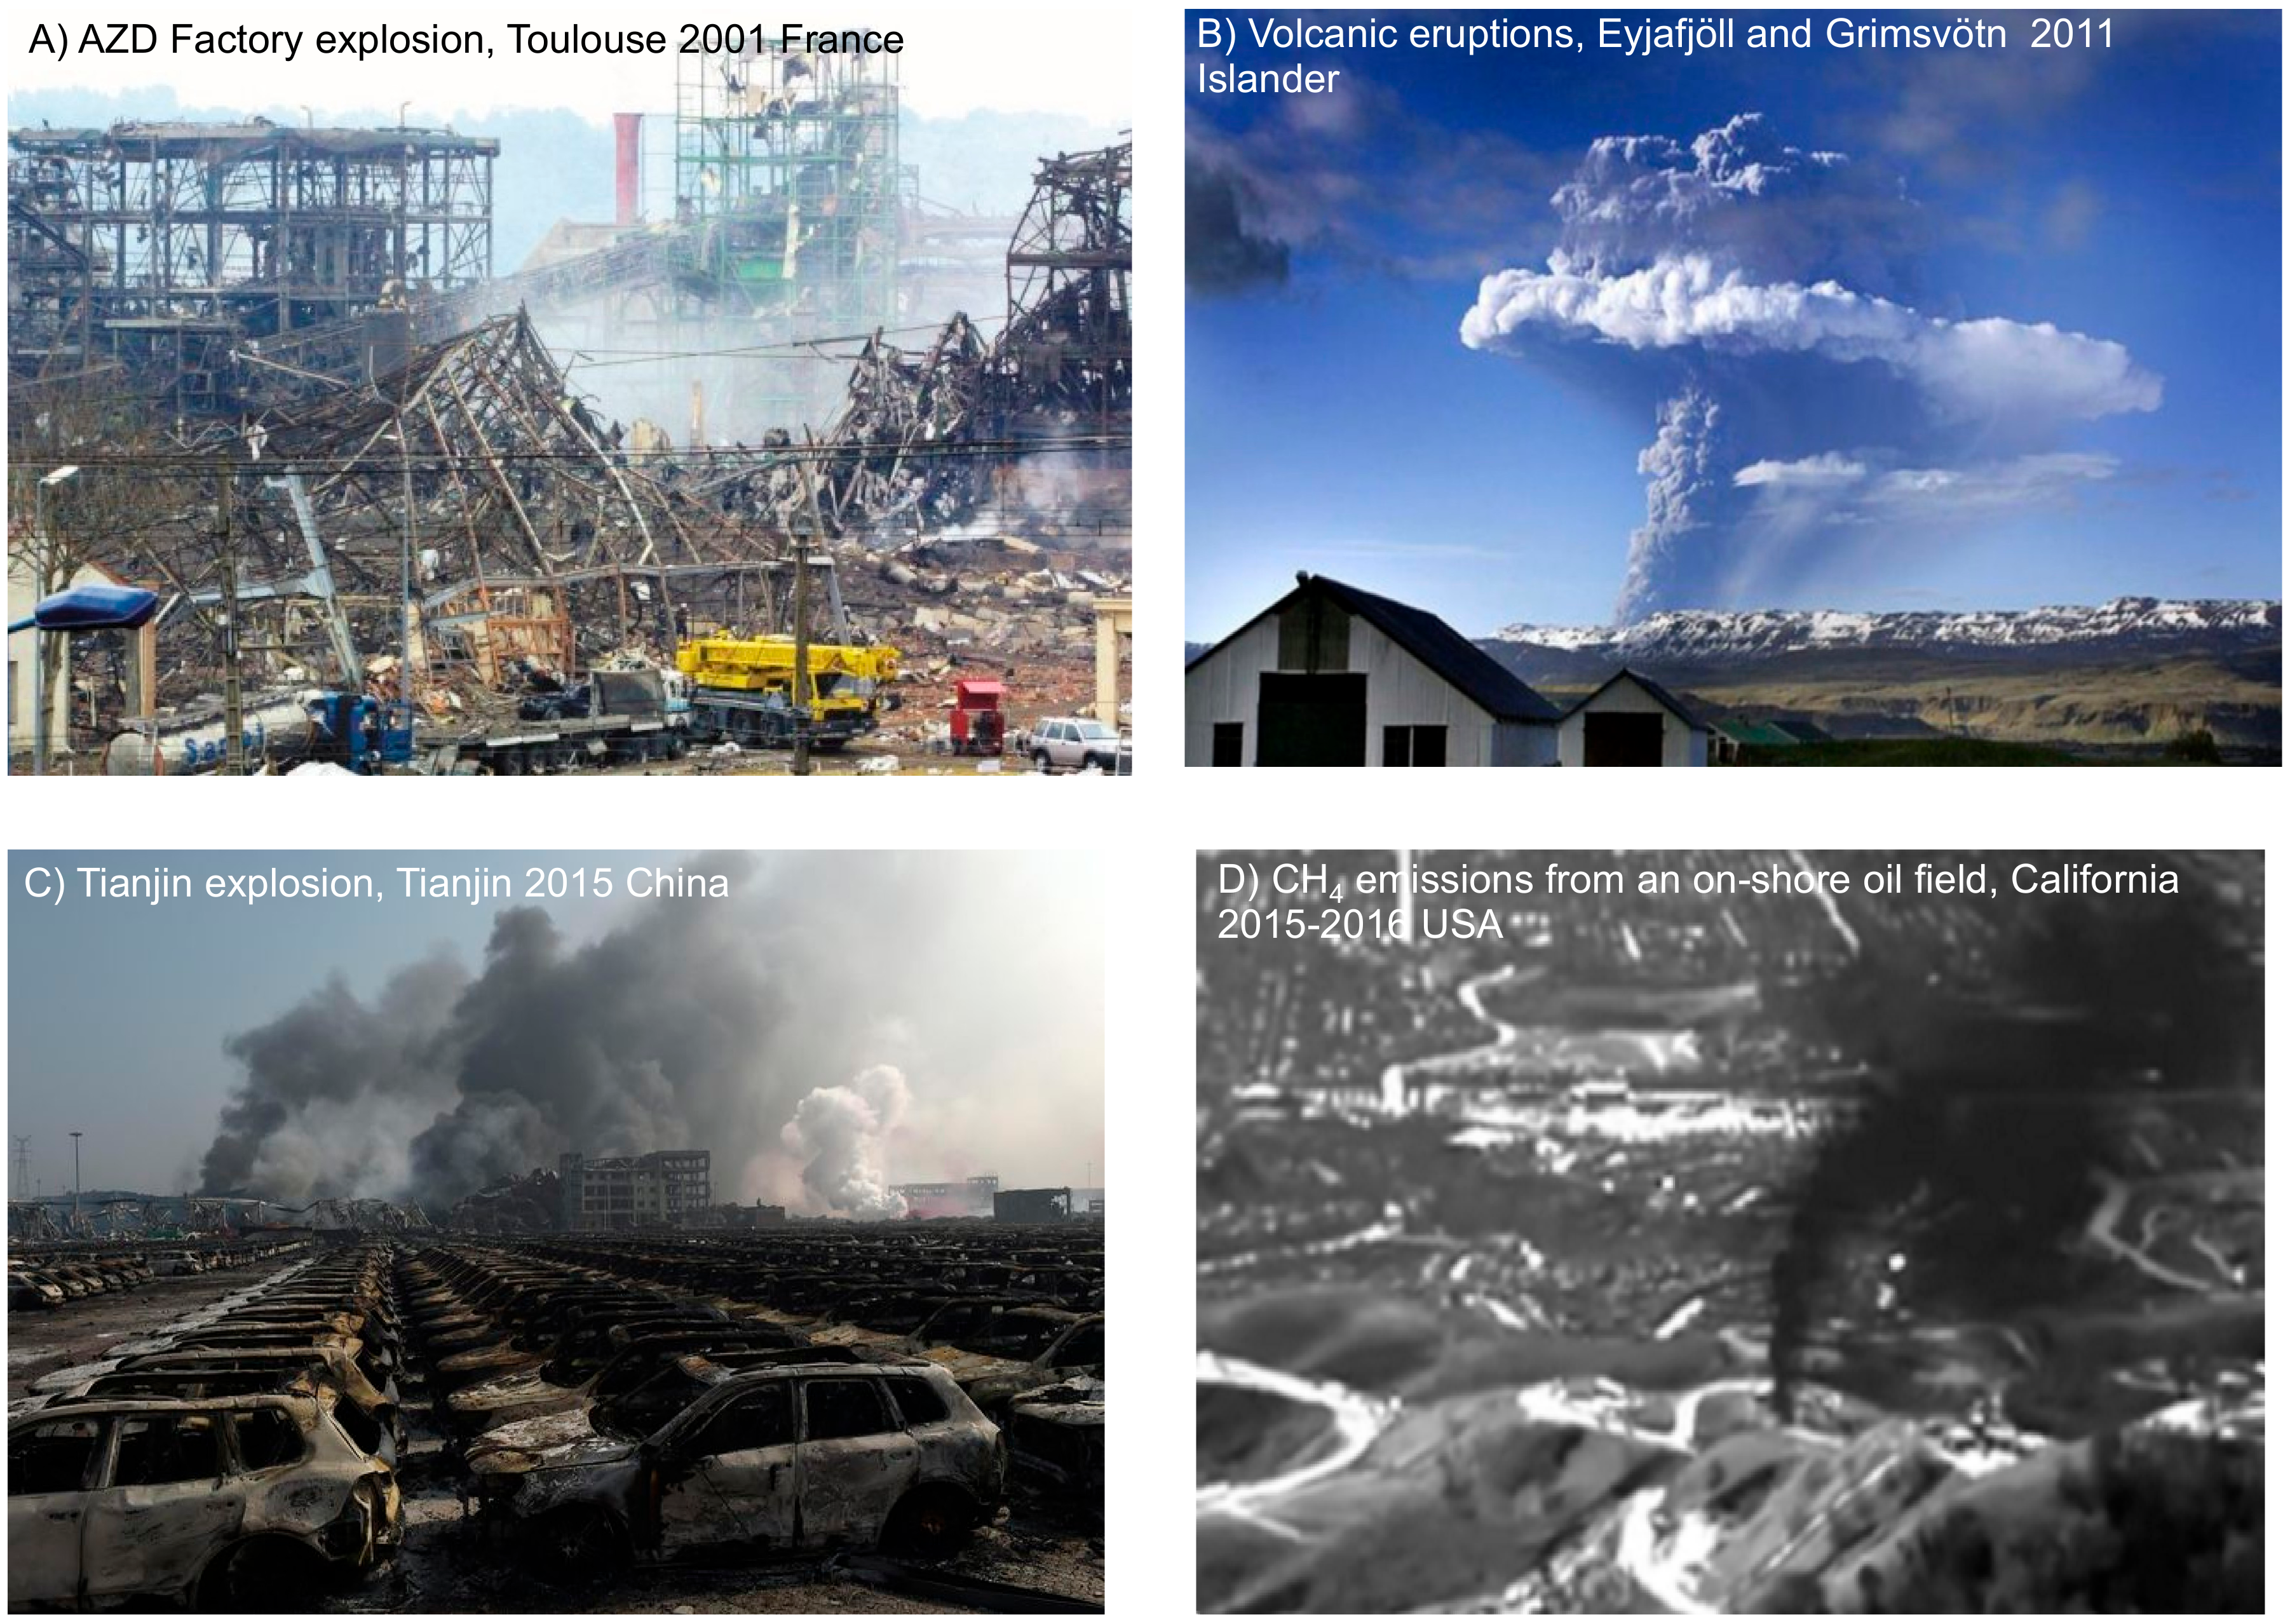
4. Applications to Other Types of Gas Plume

The association of infrared remote-sensing and visible cameras is only available for tomographic measurements of gas emissions having a visible trace. This visible trace can be due to the gas itself (for example SO2) or to other gas components (for example, water vapor, organic or mineral particles). By way of illustration, Figure 10 shows some past examples where these tomographic measurements could have been applied. The different events are related to some natural or anthropogenic crisis situations, respectively:
-
AZD Factory explosion, Toulouse 2001 France, where the visible trace is mainly associated with organic/mineral particles (Figure 10A);
-
volcanic eruptions where the visible trace is mainly associated with particles and water vapor, Eyjafjöll and Grimsvötn 2011 Iceland (Figure 10B);
-
Tianjin explosion, where the visible trace is a very complex association of particles and gases, Tianjin 2015 China (Figure 10C);
-
and CH4 emissions from an on-shore oil field where the visible trace is mainly associated with organic particles, California 2015–2016 (USA) (Figure 10D).
In the case of gas plumes without a visible trace, visible camera could be replaced by specific thermic cameras or by additional infrared remote-sensing systems [17,18]. In these situations, the cost of the measurements will be much higher. But in any case, the gOcad® approach developed in this paper is still fully transposable both for the 3-D reconstruction of the gas plume and for the 3-D modeling of gas concentrations (ppm). Also in economic terms, the use of satellite or airborne systems [13] should be chosen primarily for large-scale gas emissions, ie region-wide, country-wide or continent-wide [35].

5. Conclusions

An innovative (multi-angled), practical and inexpensive stereoscopic approach combining three high-resolution (GoPro-Hero3) cameras, a scanning infrared gas system (SIGIS, Bruker) and gOcad® geometric reconstruction protocols were used for the 3-D construction of a gas plume envelope for a quantitative (ppm) remote chemical analysis. The approach was carried out for the monitoring of flue streams of a gas NH3/H2O mixture coming from an emissive industrial site (NOVACARB Society, Laneuveville-devant-Nancy, France). A 3-D distribution of NH3 concentrations in the gaseous plume emitted from the chimney was calculated.
Although the distribution of ammonia concentrations is not homogeneous, the results showed that about 94% of the gas plume is characterized by an NH3 concentration below 80 ppm. The slight overestimation of NH3 concentration compared to the environmental tolerances set by government regulation can be explained by the vicinity of channeled and diffuse emissions. Such an approach can then be used as an inexpensive monitoring method for gas plumes having a visible trace. For gas emissions without visible traces, visible cameras can be replaced by other thermic or infrared remote-sensing systems, for example. The cost of the monitoring will, necessarily, increase. The information provided by such experimental 3-D modeling is very important for the human and environmental safety of all types of emissive sites under normal conditions or in a crisis situation.

Author Contributions

P.d.D. was involved in the combination of visible and IR data related to the tomographic aspects of the paper. O.B. was in charge of the IR remote sensing measurements in combination with visible data acquisition. She was also involved in the IR data treatments (path concentrations and concentrations). J.S. was in charge of the elaboration of the interpolation algorithms using gOcad® software. D.M. was in charge of the technical aspects related to the near real time observations with visible cameras.

Acknowledgments

The authors would like to thank NOVACARB Society (Laneuveville-devant-Nancy, France) for giving them access to their industrial site and Renaud DESCAMPS (NOVACARB) for his scientific contribution. The authors also associate the National French Agency (ANR, Program N° ANR-07-PCO2-007-08, SENTINELLE) and the European Fund of Regional Development (FEDER) for their financial support in the acquisition of the SIGIS remote-sensing system used in this study. They also thank the industrial and academic members of the gOcad® Consortium and ASGA for their support, especially Paradigm Geophysical for the supply of gOcad® software.

Conflicts of Interest

The authors declare no conflicts of interest.

References

  1. Pascal, L. Short-term health effects of air pollution on mortality. Rev. Mal. Respir. 2009, 26, 207–219. [Google Scholar] [CrossRef]
  2. Herget, W.F.; Brashers, J.D. Remote Fourier transform infrared air pollution studies. Opt. Eng. 1980, 19, 194508–194515. [Google Scholar] [CrossRef]
  3. Marshall, T.L.; Chaffin, C.T.; Hammaker, R.M.; Fately, W.G. An introduction to open-path FT-IR Atmospheric monitoring. Environ. Sci. Technol. 1994, 28, 224A–232A. [Google Scholar] [CrossRef] [PubMed]
  4. Beil, A.; Daum, R.; Harig, R.; Matz, G. Remote sensing of atmospheric pollution by passive FTIR spectrometry. Proc. SPIE 1998, 3493, 32–43. [Google Scholar] [CrossRef]
  5. Schütze, C.; Lau, S.; Reiche, N.; Sauer, U.; Borsdorf, H.; Diet, P. Ground-based remote sensing with open-path Fourier-transform infrared (OP-FTIR) spectroscopy for large-scale monitoring of greenhouse gases. Energy Procedia 2013, 37, 4276–4282. [Google Scholar] [CrossRef]
  6. Harig, R.; Rusch, P.; Dyer, C.; Jones, A.; Moseley, R.; Truscott, B. Remote measurement of highly toxic vapors by scanning imaging Fourier-transform spectrometry. Proc. SPIE 2005, 5995, 316–327. [Google Scholar] [CrossRef]
  7. Harig, R.; Matz, G.; Rusch, P.; Gerhard, H.; Gerhard, J.; Schlabs, V. Infrared remote sensing of hazardous vapours: Surveillance of public areas during the FIFA Football World Cup 2006. Proc. SPIE 2007, 6538, 65381Z:1–65381Z:10. [Google Scholar] [CrossRef]
  8. Bradley, K.S.; Brooks, K.B.; Hubbard, L.K.; Popp, P.J.; Stedman, D.H. Motor vehicle fleet emissions by OP-FTIR. Environ. Sci. Technol. 2000, 34, 897–899. [Google Scholar] [CrossRef]
  9. Burton, M.R.; Oppenheimer, C.; Horrocks, L.A.; Francis, P.W. Remote sensing of CO2 and H2O emission rates from Masaya volcano, Nicaragua. Geology 2000, 28, 915–918. [Google Scholar] [CrossRef]
  10. Goff, F.; Love, S.P.; Warren, R.G.; Counce, D.; Obenholzner, J.; Siebe, C.; Schmidt, S.C. Passive infrared remote sensing evidence for large intermittent CO2 emissions at Popocatépetl volcano, Mexico. Chem. Geol. 2001, 177, 133–156. [Google Scholar] [CrossRef]
  11. Allard, P.; Burton, M.; Muré, F. Spectroscopic evidence for a lava fountain driven by previously accumulated magmatic gas. Nature 2005, 433, 407–410. [Google Scholar] [CrossRef] [PubMed]
  12. Kenji, N.; Mori, T. Chemical monitoring of volcanic gas using remote FT-IR spectroscopy at several active volcanoes in Japan. Appl. Geochem. 2010, 25, 505–512. [Google Scholar] [CrossRef]
  13. Reiche, N.; Westerkamp, T.; Lau, S.; Borsdorf, H.; Dietrich, P.; Schütze, C. Comparative study to evaluate three ground-based optical remote sensing techniques under field conditions by a gas tracer experiment. Environ. Earth Sci. 2014, 72, 1435–1441. [Google Scholar] [CrossRef]
  14. La Spina, A.; Burton, M.; Allard, P.; Alparone, S.; Muré, F. Open-path FTIR spectroscopy of magma degassing processes during eight lava fountains on Mount Etna. Earth Planet. Sci. Lett. 2015, 413, 123–134. [Google Scholar] [CrossRef]
  15. Schütze, C.; Dietrich, P.; Schossland, A.; Möller, I.; Schlömer, S.; Martens, S.; Liebscher, A.; Möller, F.; Sauer, U. Application of monitoring methods for remote detection of atmospheric CO2-Concentration levels during a back-production test at the Ketzin Pilot Site. Energy Procedia 2015, 76, 528–535. [Google Scholar] [CrossRef]
  16. Harig, R.; Matz, G. Toxic cloud imaging by infrared spectrometry: A scanning FTIR system for identification and visualization. Field Anal. Chem. Technol. 2001, 5, 75–90. [Google Scholar] [CrossRef]
  17. Rusch, P.; Harig, R. 3-D reconstruction of gas clouds by scanning imaging IR spectroscopy and tomography. Sensors J. IEEE 2010, 10, 599–603. [Google Scholar] [CrossRef]
  18. De Donato, P.; Barres, O.; Sausse, J.; Taquet, N. Advances in 3-D infrared remote sensing gas monitoring. Application to an urban atmospheric environment. Remote Sens. Environ. 2016, 175, 301–309. [Google Scholar] [CrossRef]
  19. Thenkaball, P.S.; Enclona, E.A.; Ashton, M.S.; Legg, C.; De Dieu, M.J. Hyperion, IKONOS, ALI, and ETM+ sensors in the study of African rainforests. Remote Sens. Environ. 2004, 90, 23–43. [Google Scholar] [CrossRef]
  20. Plaza, A.; Benediktsson, J.A.; Boardman, J.W.; Brazile, J.; Bruzzone, L.; Camps-Valls, G.; Chanussot, J.; Fauvel, M.; Gamba, P.; Gualtieri, A.; et al. Recent advances in techniques for hyperspectral image processing. Remote Sens. Environ. 2009, 113 (Suppl. 1), S110–S122. [Google Scholar] [CrossRef]
  21. Gao, B.-C.; Li, R.-R.; Shettle, E.P. Cloud remote sensing using midwave IR CO2 and N2O slicing channels near 4.5 μm. Remote Sens. 2011, 3, 1006–1013. [Google Scholar] [CrossRef]
  22. Lorenz, S.; Salehi, S.; Kirsch, M.; Zimmermann, R.; Unger, G.; Vest Sørensen, E.; Gloaguen, R. Radiometric correction and 3D integration of long-range ground-based hyperspectral imagery for mineral exploration of vertical outcrops. Remote Sens. 2018, 10, 176. [Google Scholar] [CrossRef]
  23. Todd, L.A.; Ramanathan, M.; Mottus, K.; Katz, R.; Dodson, A.; Mihlan, G. Measuring chemical emissions using open-path Fourier transform infrared (OP-FTIR) spectroscopy and computer-assisted tomography. Atmos. Environ. 2001, 35, 1937–1947. [Google Scholar] [CrossRef]
  24. Schowengerdt, R.A. Remote Sensing: Models and Methods for Image Processing, 3rd ed.; Academic Press Elsevier: Burlington, MA, USA, 2007; 560p, ISBN 9780123694072. [Google Scholar]
  25. Brito Junior, A.M.; Neto, A.D.D.; de Melo, J.D.; Goncalves, L.M.G. An adaptive learning approach for 3-D surface reconstruction from point clouds. Neural Netw. Council 2008, 19, 1130–1140. [Google Scholar] [CrossRef] [PubMed]
  26. Ricciardelli, E.; Romano, F.; Cuom, V. Physical and statistical approaches for cloud identification using Meteosat Second Generation-Spinning Enhanced Visible and Infrared Imager Data. Remote Sens. Environ. 2008, 112, 2741–2760. [Google Scholar] [CrossRef]
  27. Schneider, A.; Friedl, M.A.; Potere, D. Mapping global urban areas using MODIS 500-m data: New methods and datasets based on urban ecoregions. Remote Sens. Environ. 2010, 114, 1733–1746. [Google Scholar] [CrossRef]
  28. Liua, B.; Chena, X.G.; Guoa, L.P.; Yub, X.Q. A MPB-based remote sensing image 3-D reconstruction system. Optik 2015, 126, 1994–1998. [Google Scholar] [CrossRef]
  29. Zhang, W.; Sunb, X.; Wangb, H.; Fu, K. A generic discriminative part-based model for geospatial object detection in optical remote sensing images. ISPRS J. Photogramm. Remote Sens. 2015, 99, 30–44. [Google Scholar] [CrossRef]
  30. Mallet, J.L. Discrete smooth interpolation in geometric modeling. Comput. Aided Des. 1992, 24, 178–191. [Google Scholar] [CrossRef]
  31. Mallet, J.L. Discrete modeling for natural objects. Math. Geol. 1997, 29, 199–219. [Google Scholar] [CrossRef]
  32. Mallet, J.L. Geomodeling. In Applied Geostatistics; Oxford University Press: New York, NY, USA, 2002; ISBN 0-19-514460. [Google Scholar]
  33. Harig, R. Passive remote sensing of pollutants clouds by Fourier transform infrared spectrometry: Signal to noise ratio as a function of spectral resolution. Appl. Opt. 2004, 43, 4603–4610. [Google Scholar] [CrossRef] [PubMed]
  34. Caumon, G.; Collon-Drouaillet, P.; Le Carlier de Veslud, C.; Viseur, S.; Sausse, J. Surface-based 3D modeling of geological structures. Math. Geosci. 2009, 41, 927–945. [Google Scholar] [CrossRef]
  35. Houlton, B.Z.; Morford, S.L.; Dahlgren, R.A. Convergent evidence for widespread rock nitrogen sources in Earth’s surface environment. Science 2018, 360, 58–62. [Google Scholar] [CrossRef] [PubMed]
Figure 1. Comparison of the typical infrared emission profiles of NH3 for a correlation coefficient of 0.62 (measured emission spectrum in blue, reference emission spectrum in red).
Remotesensing 10 00678 g001
Figure 2. Aerial view of the chemical industrial site (NOVACARB, Laneuveville-devant-Nancy, France) with the location of the potential NH3 emissive chimneys (green oval). The extended French Lambert II coordinates of the visible and infrared systems are indicated as well as their corresponding field of view (visible cameras: dark blue lines for tight field of view and light blue for large field of view, Table 1, IR imaging system: yellow lines, for numerical values see Table 1) and their optical axes (bisecting lines).
Remotesensing 10 00678 g002
Figure 3. Schematic view of shot angles of GoPro or SIGIS cameras. From the origin of the camera (X0, Y0, Z0) an optical axis is defined which respects the tilt and the horizontal and vertical field of view whose values are indicated in Table 3 and Table 4. Only three pixels (Pixeli), of the infrared measurement grid have been shown as an example.
Remotesensing 10 00678 g003
Figure 4. Different steps of 3-D reconstruction of the gas plume using gOcad® abilities. See the text for more details.
Remotesensing 10 00678 g004
Figure 5. The different raw images at the same time of the 3 visible cameras (GoPro Hero3 with zoom) and the scanning imaging system (SIGIS Bruker without zoom) during the measurements. The infrared measurement grid is also indicated (red rectangle).
Remotesensing 10 00678 g005
Figure 6. Illustration of a two-dimensional distribution of ammonia path concentration (ppm.m). (Date: 12 September 2016 at 01:45 p.m. GMT). View from SIGIS position as illustrated in Figure 2 and Figure 5 (48°38′11.1″N and 6°16′04.4″E).
Remotesensing 10 00678 g006
Figure 7. Location of other measured sources of ammonia (chimneys 1 and 2) near the measured plume (view from the GoPro camera in position 2).
Remotesensing 10 00678 g007
Figure 8. Experimental 3-D gOcad® modeling of the concentration of NH3 (ppm) in the gases emitted by the chimney. The right part corresponds to a zoom of three transverse cross-sections made at three different depths in the gas cloud.
Remotesensing 10 00678 g008
Figure 9. Analysis of the spatial distribution of NH3 in the gas plume: (top) relative proportion for different concentrations in the volume of the gas plume, (bottom) cumulative proportion for different concentrations in the volume of the gas plume.
Remotesensing 10 00678 g009
Figure 10. Different natural or anthropic crisis situations with high atmospheric impact, where such a multi-angle remote-sensing approach could have been used: (A) AZD factory explosion, Toulouse 2001 France; (B) volcanic eruptions, Eyjafjöll and Grimsvötn 2011 Iceland; (C) Tianjin explosion, Tianjin 2015 China and (D) CH4 emissions from an on-shore oil field, California 2015–2016 USA.
Remotesensing 10 00678 g010
Table 1. Main characteristics of the GoPro Hero3 visible cameras.
Resolution
(pixels)
Fps (Images/s)FOV
(Field of View)
Size ScreenHorizontal Angle of Opening *Vertical Angle of Opening (Azimuth) *
1920 × 1440
GoPro 1
48Narrow4:3122.6°94.4°
1920 × 1080
GoPro 2 and 3
48Narrow16:964.4°37.2°
* Experimental data determined in the laboratory after positioning horizontally the camera in front of a plane vertical surface at one meter high on a tripod.
Table 2. Main characteristics and measurement parameters of scanning imaging scanning infrared gas system (SIGIS) system applied to NH3 detection.
ParameterValue/Type
Interferometer typeBruker OPAG 33
Spectral range3900–600 cm−1
NH3 detection window1050–900 cm−1
Spectral resolution4 cm−1
Apodization functionTriangular
Zero filling1
Phase correctionPower spectrum
Maximum spectral rate (Resolution: 4 cm−1)16 spectra/s
Field of view10 mrad
Maximal horizontal field of regard360°
Maximal vertical field of regard60°
Horizontal field of view (SIGIS visible camera)46°
Vertical field of view (SIGIS visible camera)30°
Number of pixels in a measurement grid187 (17 × 11)
Acquisition time for one grid (s)23
Table 3. Main parameters of positioning of measuring systems.
TypeGlobal Positioning System (GPS) CoordinatesGPS Altitude (m)Horizontal Tilt (°)Tilt of the Optical Axis (°)
SIGIS BRUKERN 48°38’11.1”
O 06°15’04.4”
X = 889,749 m
Y = 2,411,443 m
22200
Camera GoPro
Position 1
N 48°38’10.0”
O 06°15’51.1”
X = 889,476 m
Y = 2,411,804 m
22602.3
Camera GoPro
Position 2
N 48°38’12.7”
O 06°15’40.8”
X = 889,265 m
Y = 2,411,469 m
22601.7
Camera GoPro
Position 3
N 48°38’27.6”
O 06°15’35.2”
X = 889,127 m
Y = 2,411,923 m
213−4.60.6
Table 4. Main atmospheric parameters during measurements (12 September 2016).
DataStarting Time
1:40 p.m. (GMT)
Ending Time
1:55 p.m. (GMT)
Atmospheric CO2 (ppm)416396
Temperature (°C)3131
Relative humidity (%)3433
Atmospheric pressure (hPa)10151015
Wind velocity (km/h)415
Wind direction (°)210180
Visibility (km)3518
Precipitation (mm/h)00
Table 5. The SIGIS measurement window showing the path concentration (ppm.m) measured for the 11 × 17 pixels. The table mentions the intersection distances between the gas plume and the lines defined between the location of the SIGIS and the pixel (pixels G7, F7, etc.) in the gas plume (dark square around pixels on the SIGIS window).
Intersection Distance (m)Concentration (ppm)
ppm.m
Remotesensing 10 00678 i001C86996.68104.61
C96879.8070.08
C107078.7580.79
C116478.2678.33
D85947.2881.61
D964711.1657.99
D1065812.1454.21
D1161112.9147.31
D124518.3454.06
E85118.0163.80
E958610.5455.60
E1059811.1753.55
F74695.6782.75
F835110.0235.02
F945210.1844.38
F105678.6565.54
G72993.4387.21
G83648.2244.28
G93858.6744.39
G103195.0363.42
H81925.2336.69
H93164.4870.58
I83051.89161.71
Table 6. Main uncertainties described in terms of distance and concentration amplitudes before and after interpolation.
Distance (m)Concentration (ppm)
Raw VolumeInterpolated VolumeRaw VolumeInterpolated Volume
mean8.16.966.981.0
standard deviation2.83.026.536.5
min1.890.835.0239.7
max12.9112.2161.71170.3

