New Tropical Peatland Gas and Particulate Emissions Factors Indicate 2015 Indonesian Fires Released Far More Particulate Matter (but Less Methane) than Current Inventories Imply
Abstract
1. Introduction
1.1. Landscape Burning in Southeast Asia
1.2. Indonesian Peatland Fires and Air Quality in 2015
2. Methodology
2.1. Field Sampling Approaches
2.1.1. Smoke Measurements at Fixed Locations
2.1.2. Physio-Chemical Measurements of Peat
2.2. Atmospheric Data Processing
2.2.1. Point-Sampled Data (DustTrak™ and Laser Absorption Spectrometer)
2.2.2. Open Path FTIR Spectroscopy Data
3. Field Campaign Results
3.1. Peat Physio-Chemical Characteristics
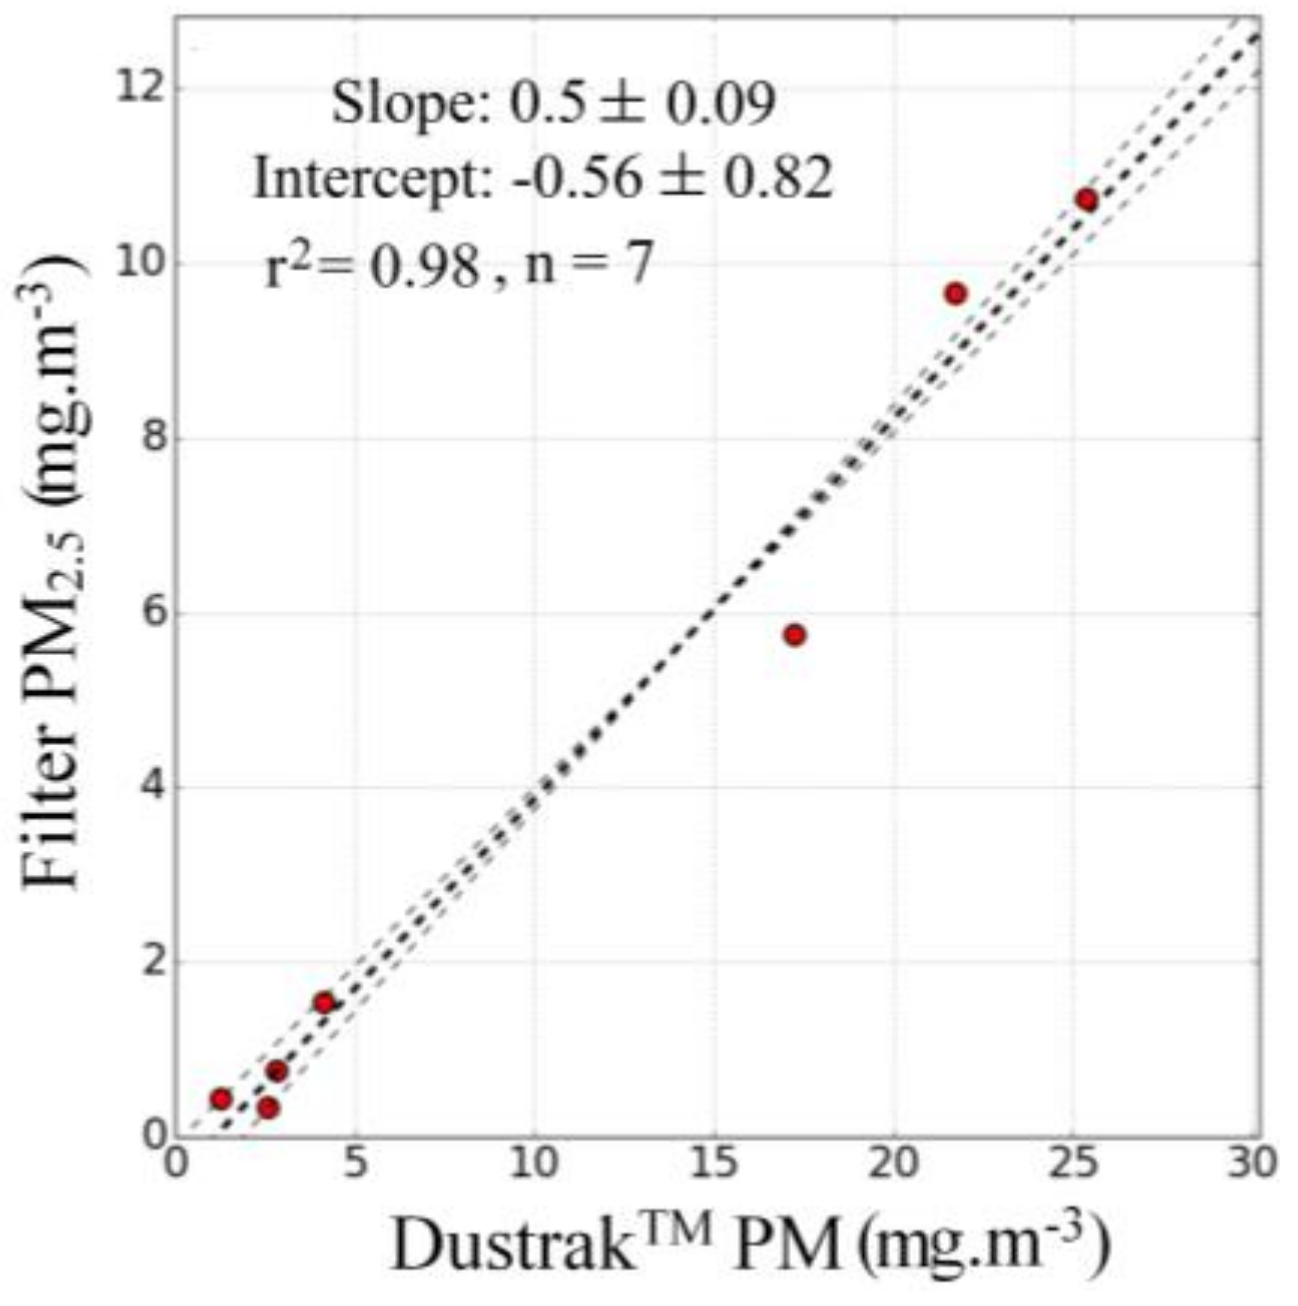
3.2. Calibration of the DustTrak™ PM2.5 Measures
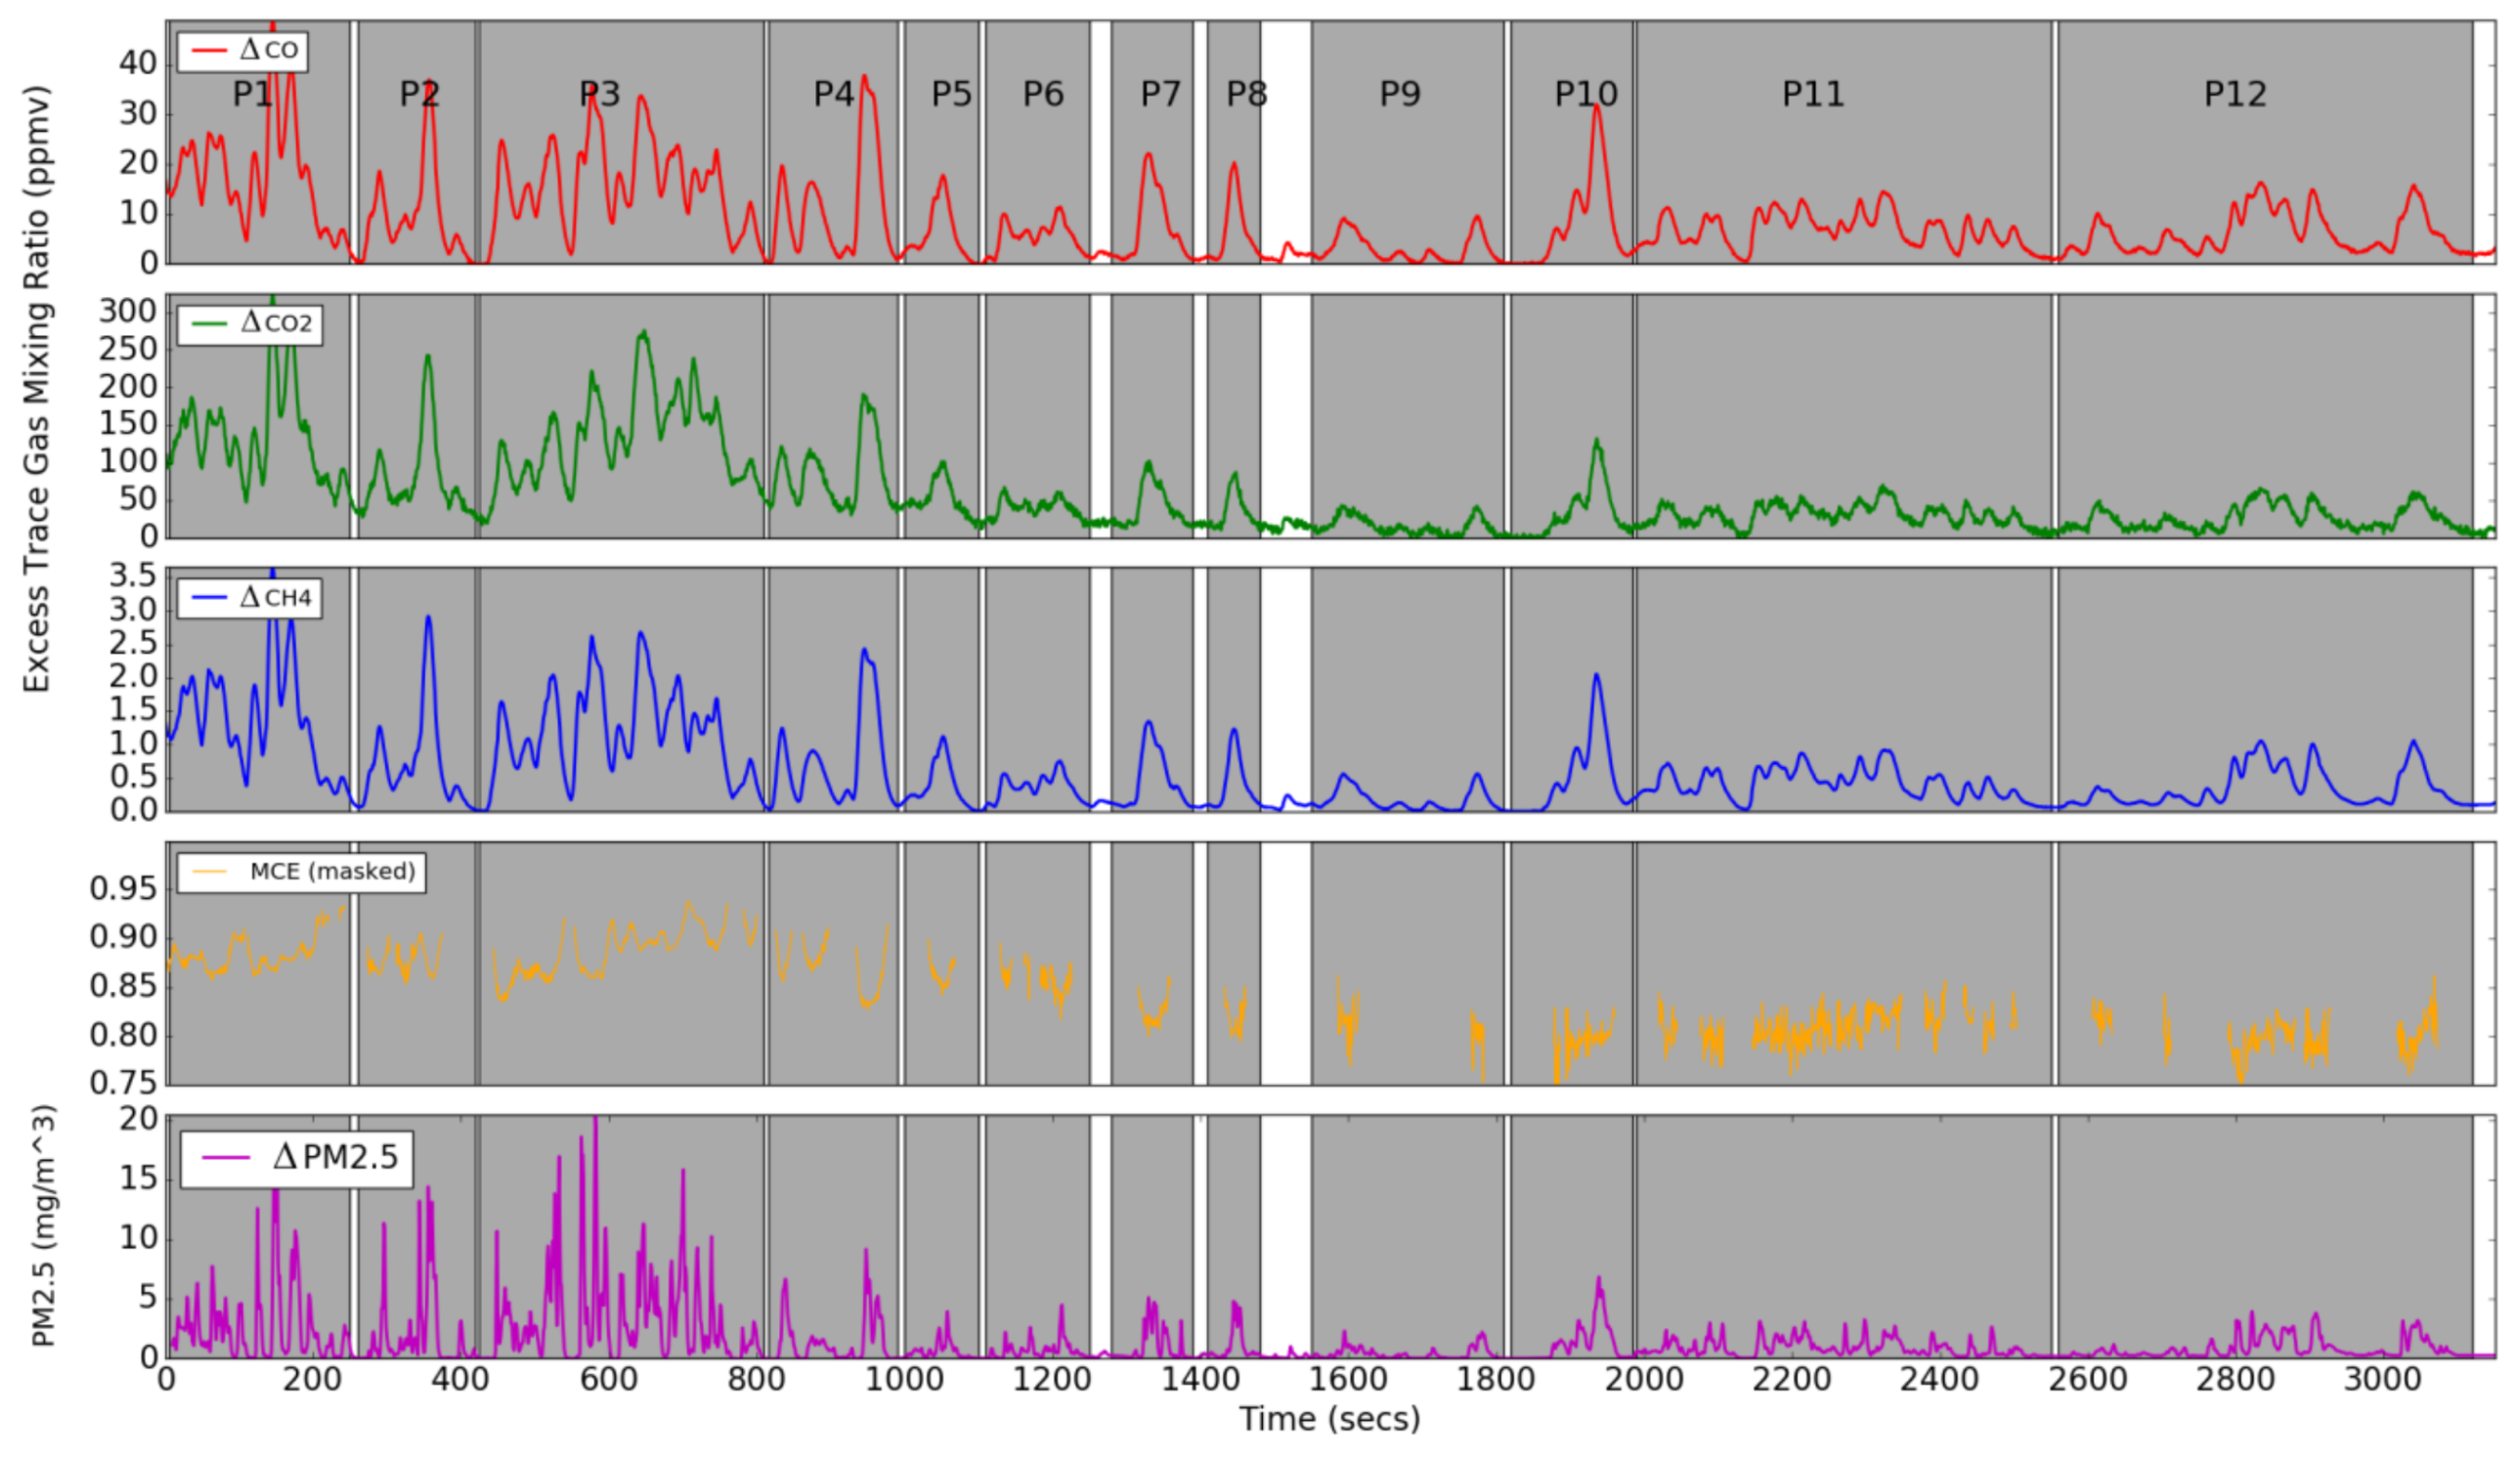
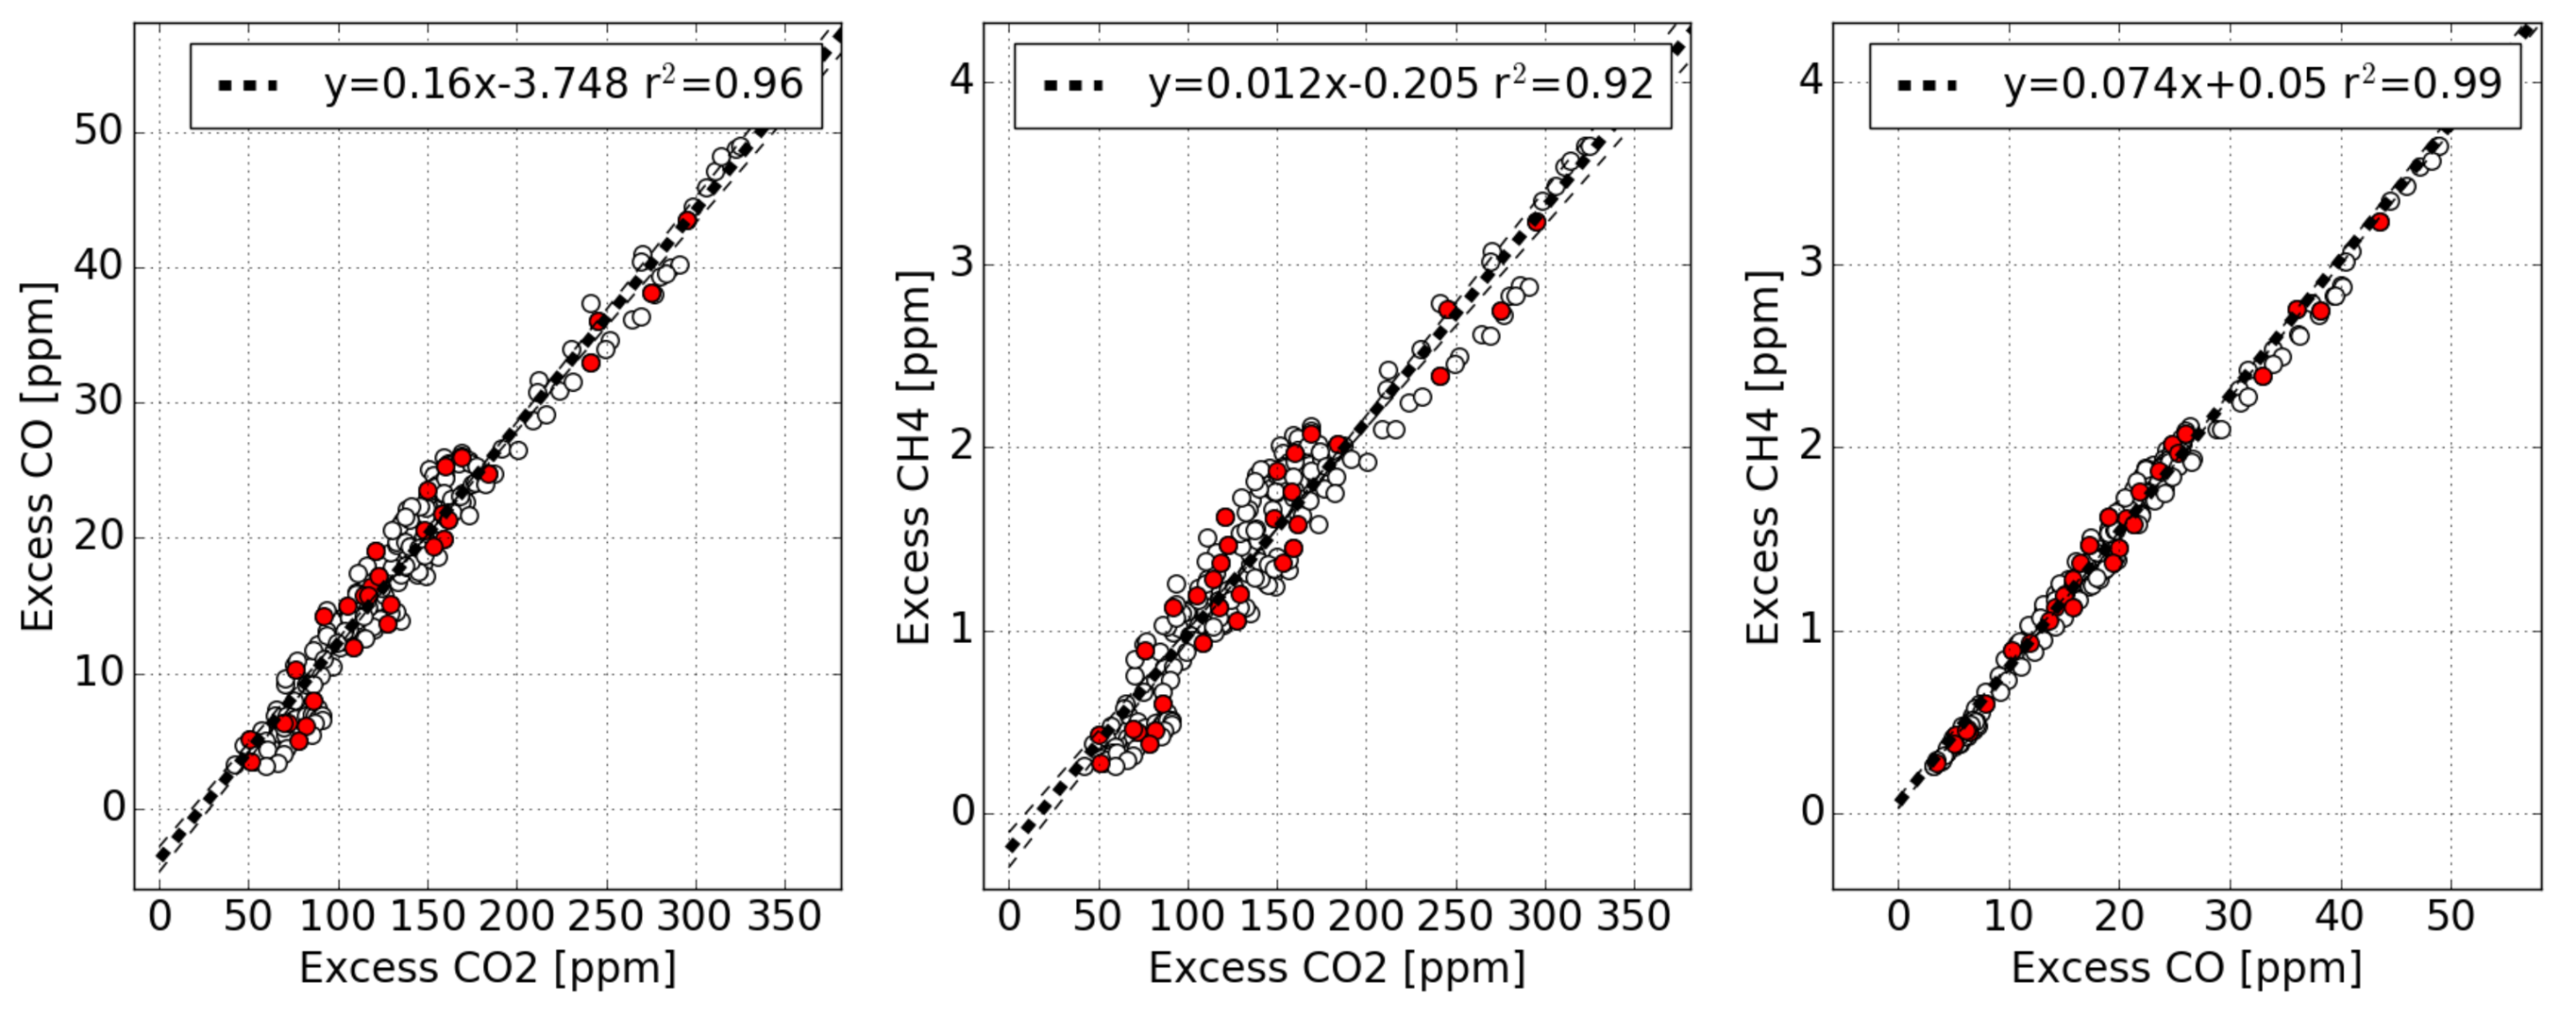
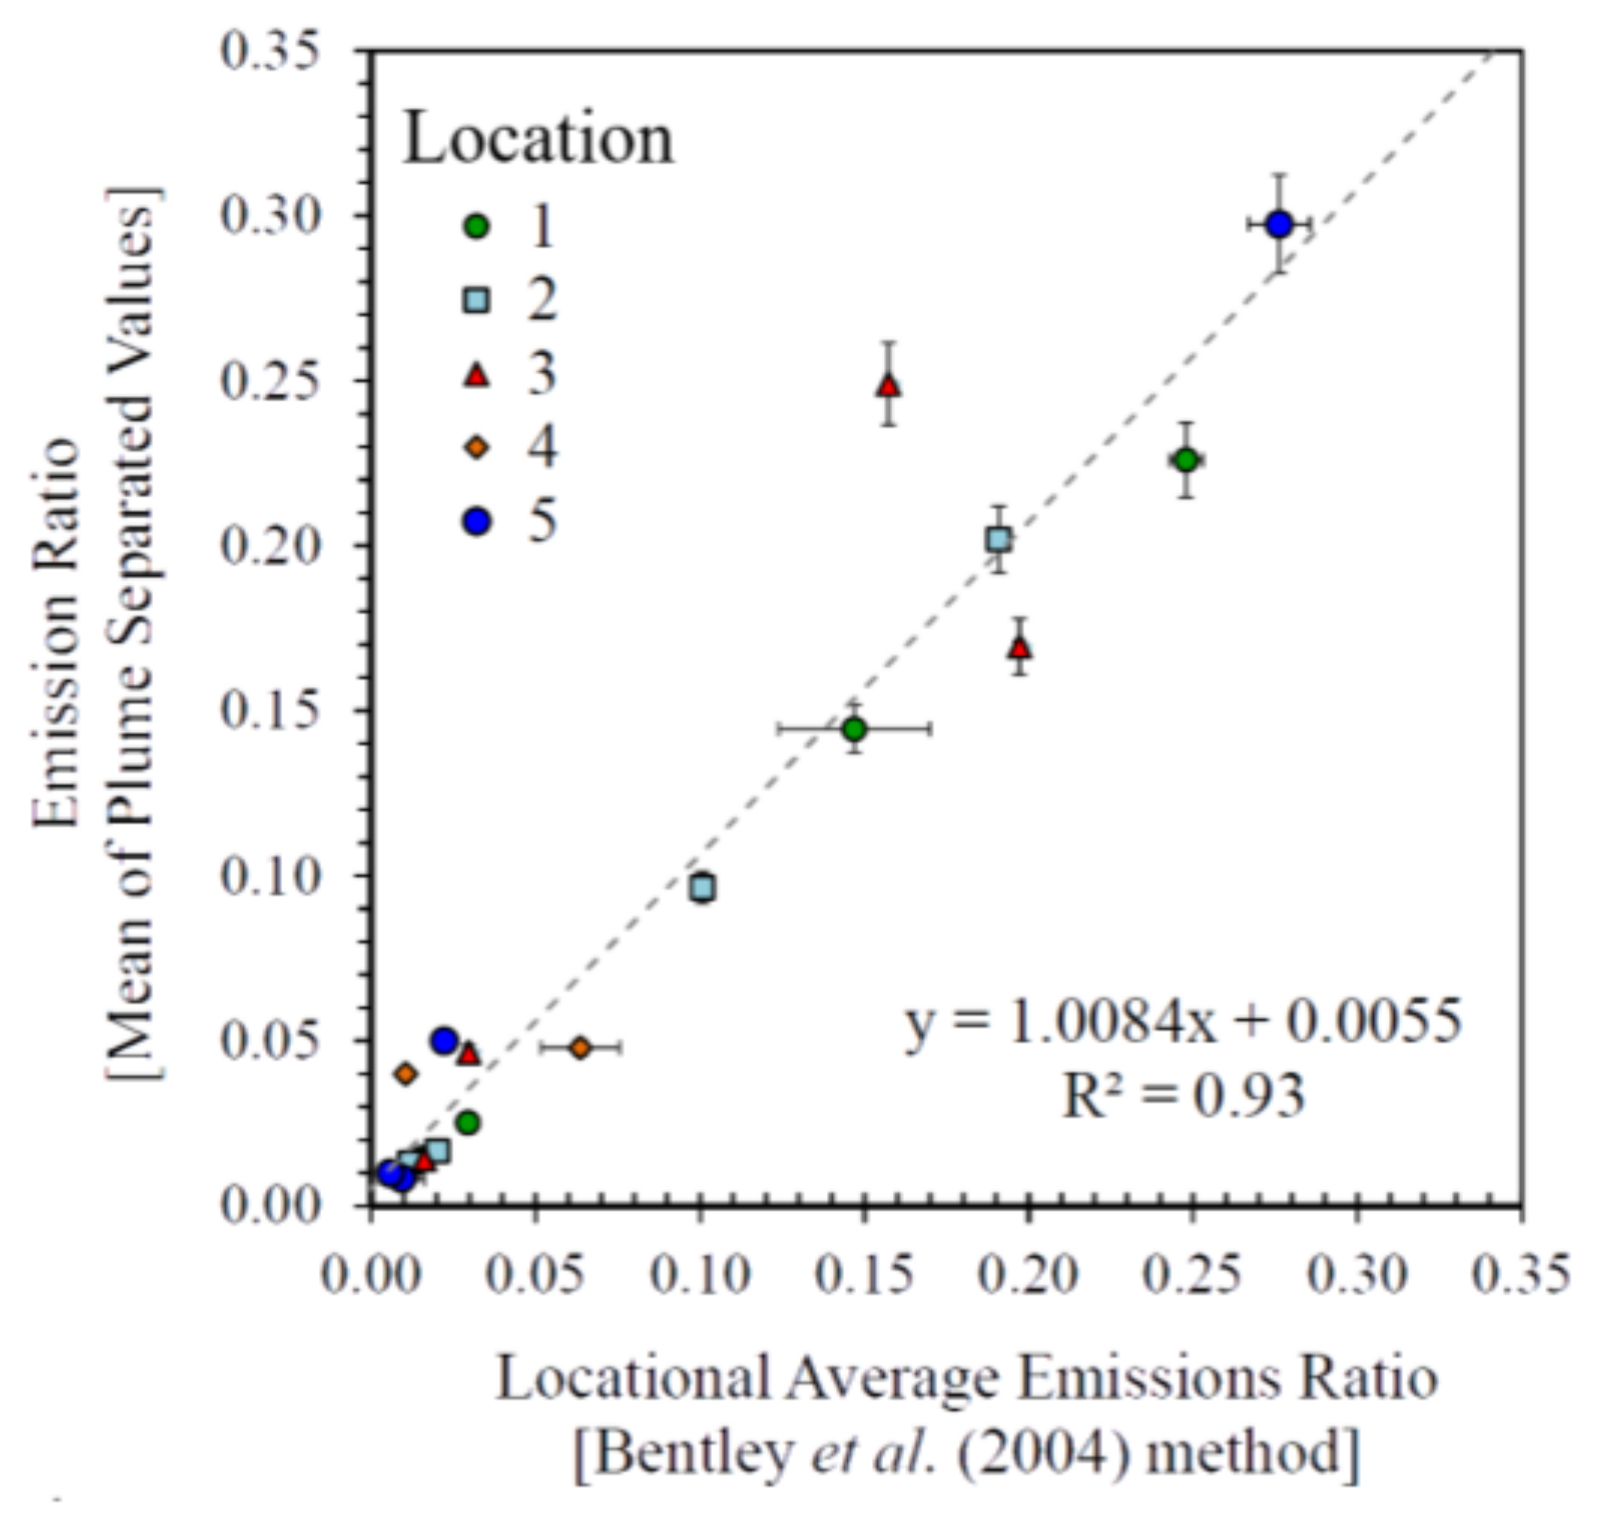
3.3. Trace Gas and Particulate Emissions Ratios
3.4. Trace Gas and Particulate Emissions Factors
3.5. Transect Measurement Results
4. New Large-Scale Emissions Estimates
4.1. Peatland EF’s, Gaseous Emissions Totals and Dry Matter Fuel Consumption
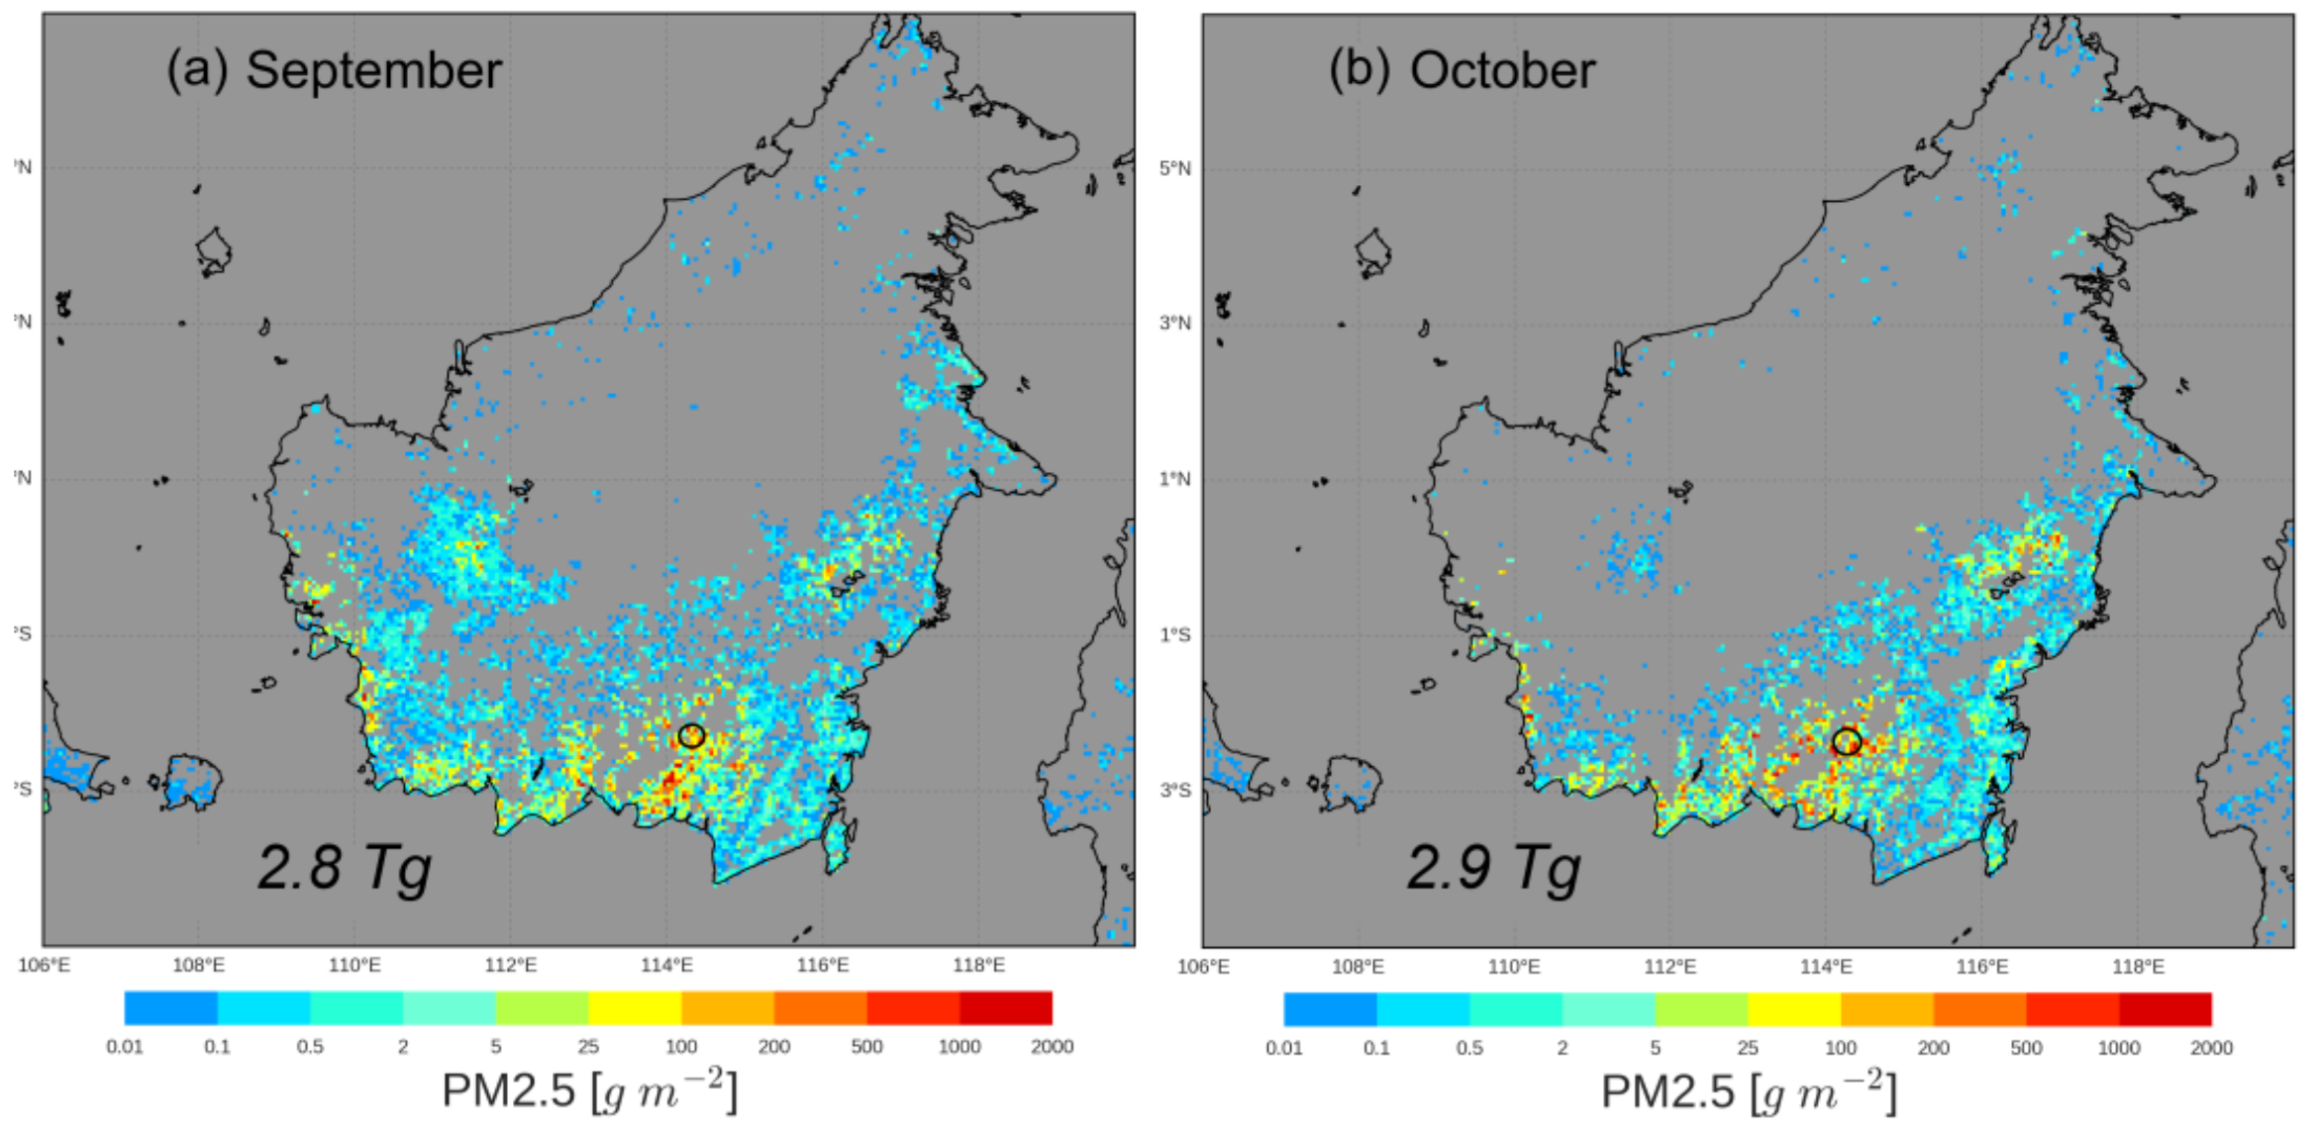
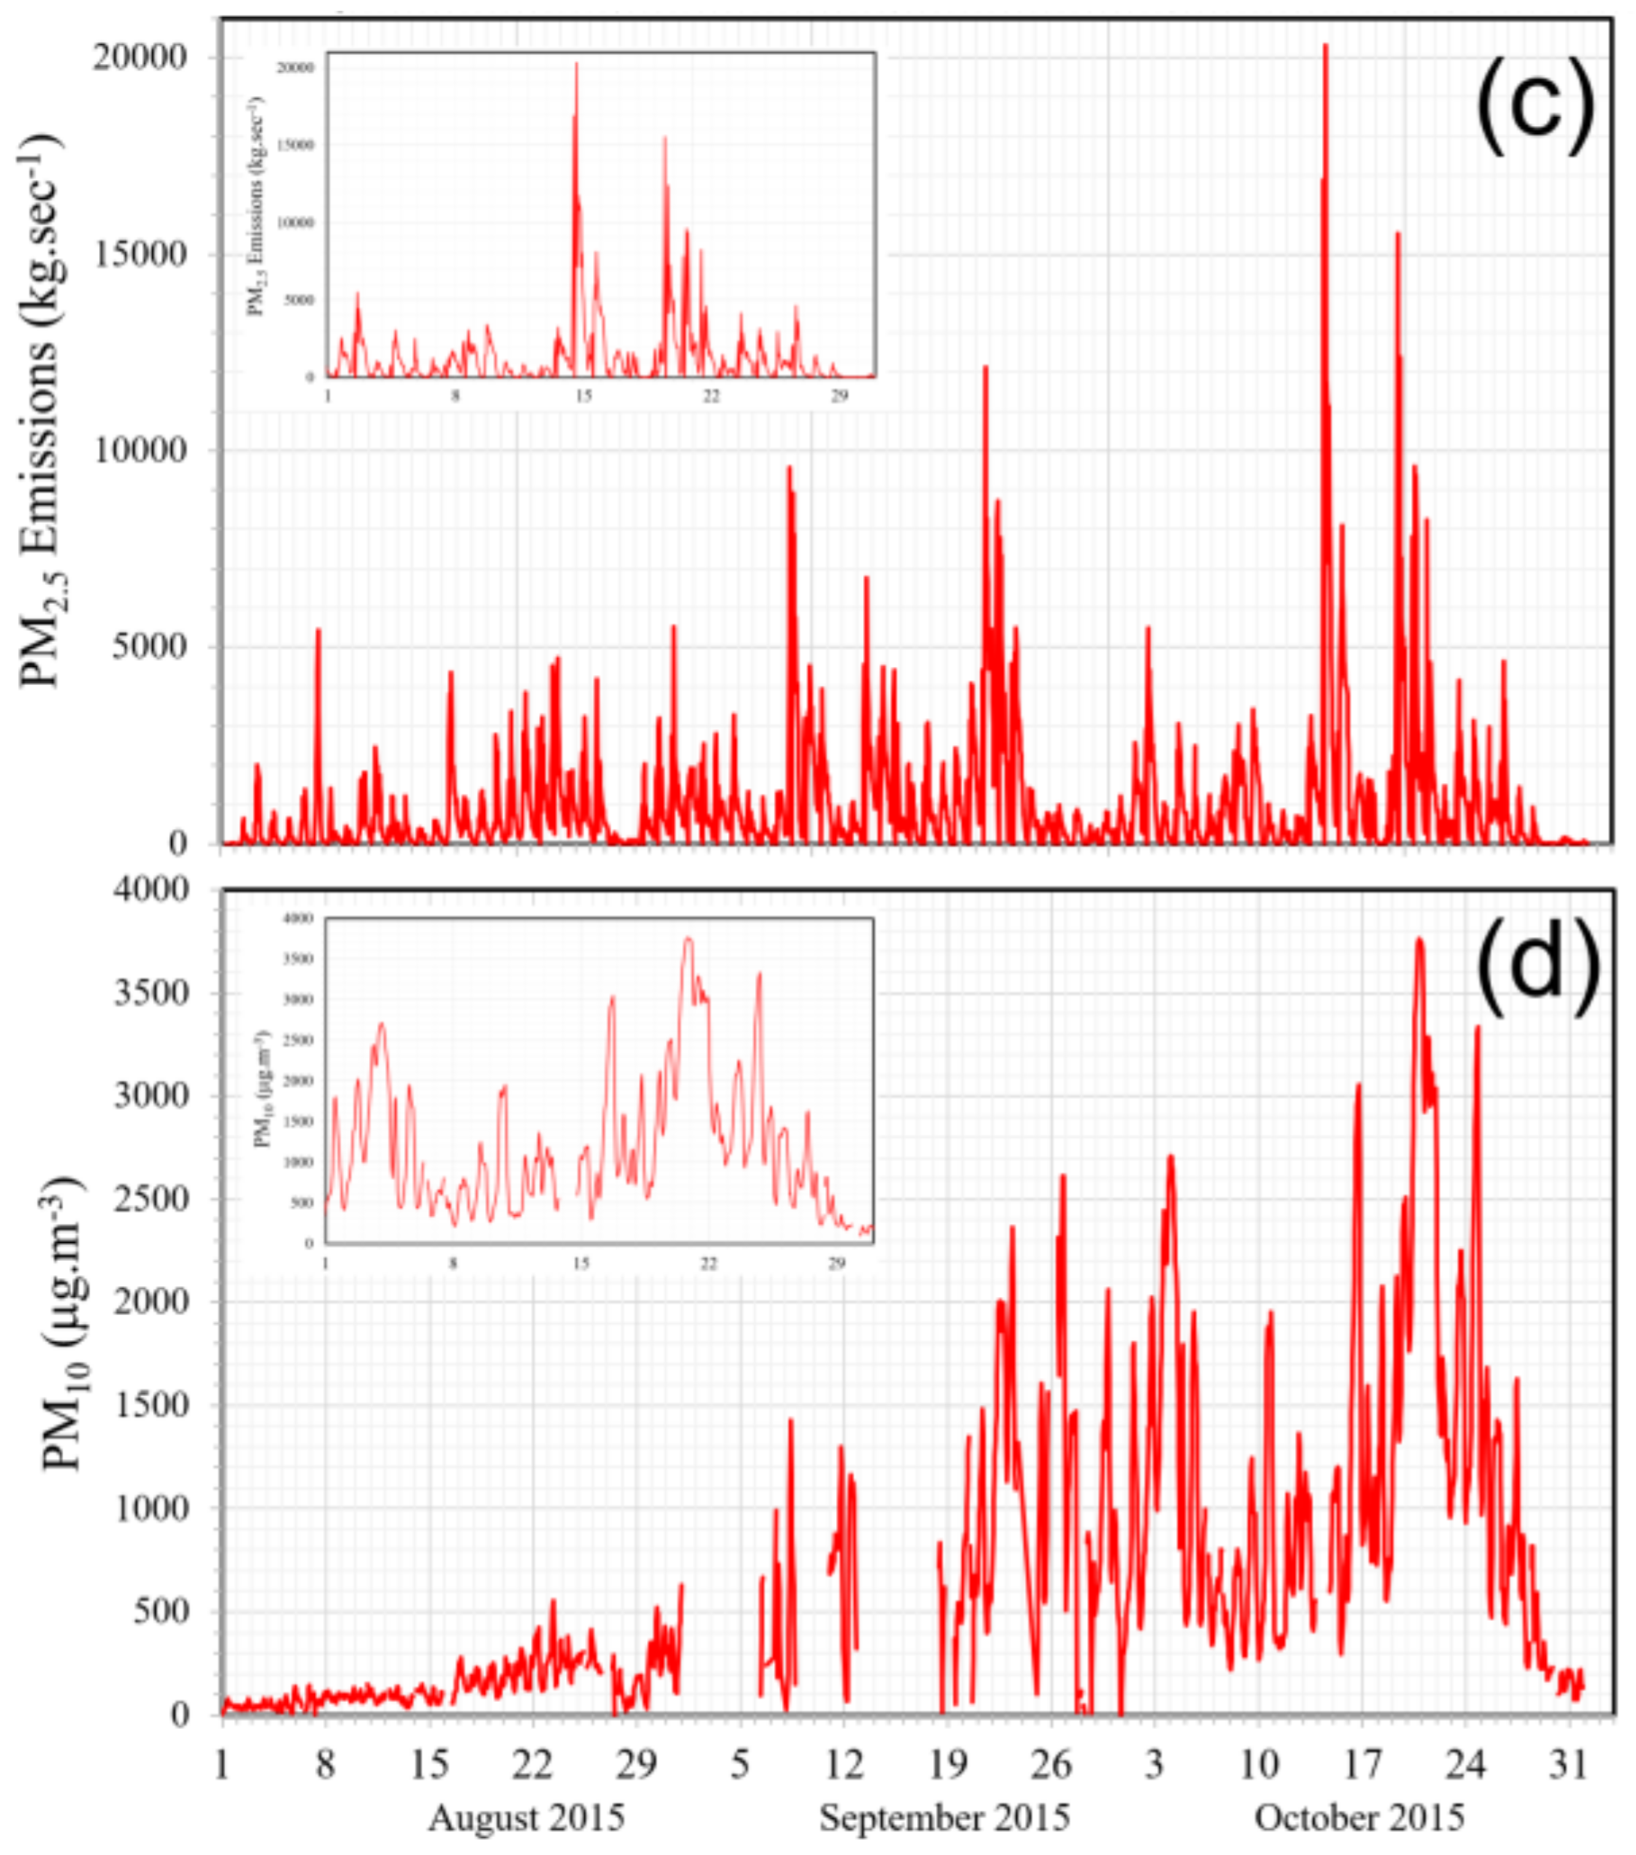
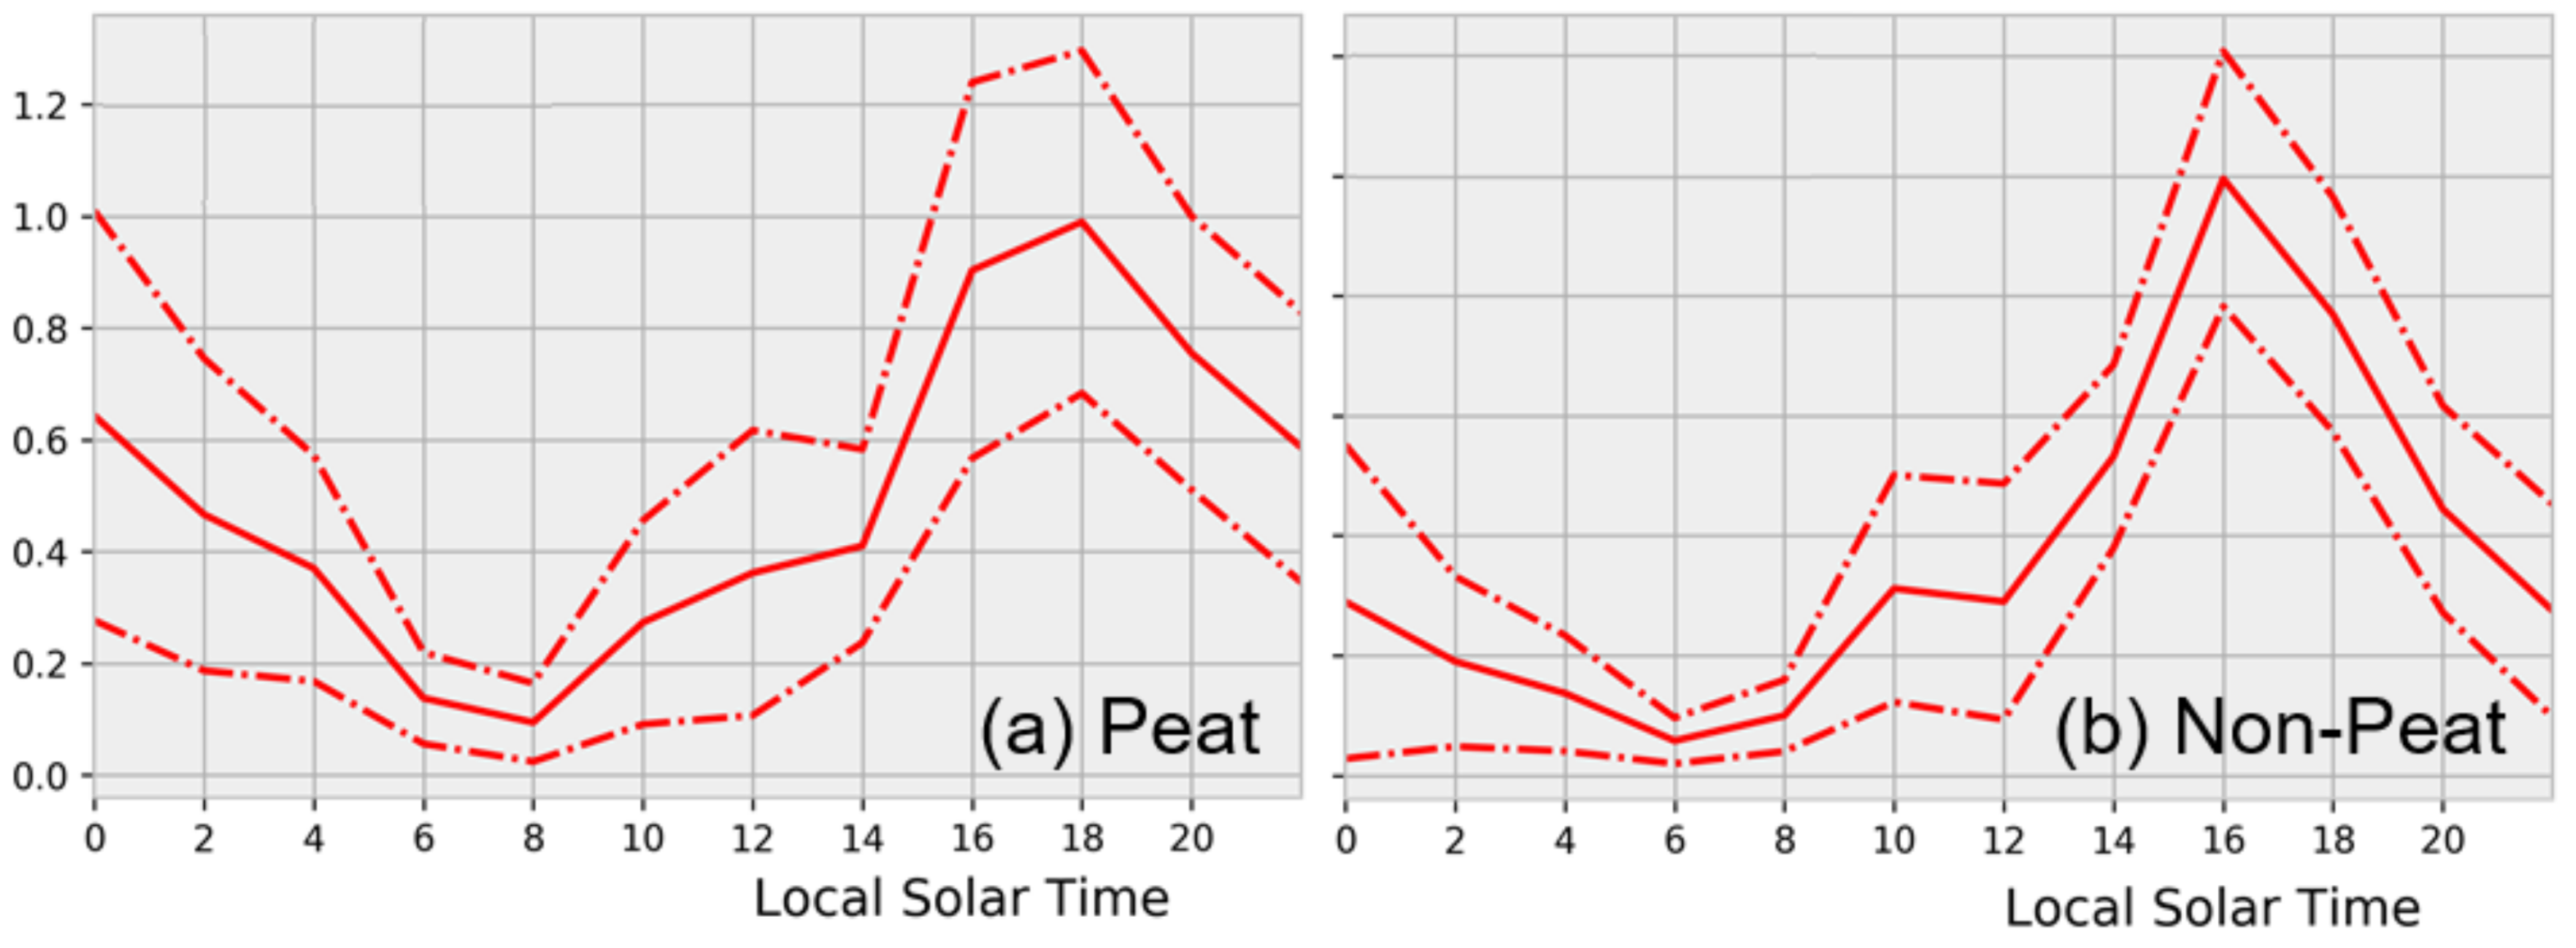
4.2. High Temporal Resolution Emissions
5. Summary and Conclusions
Supplementary Materials
Acknowledgments
Author Contributions
Conflicts of Interest
Appendix A
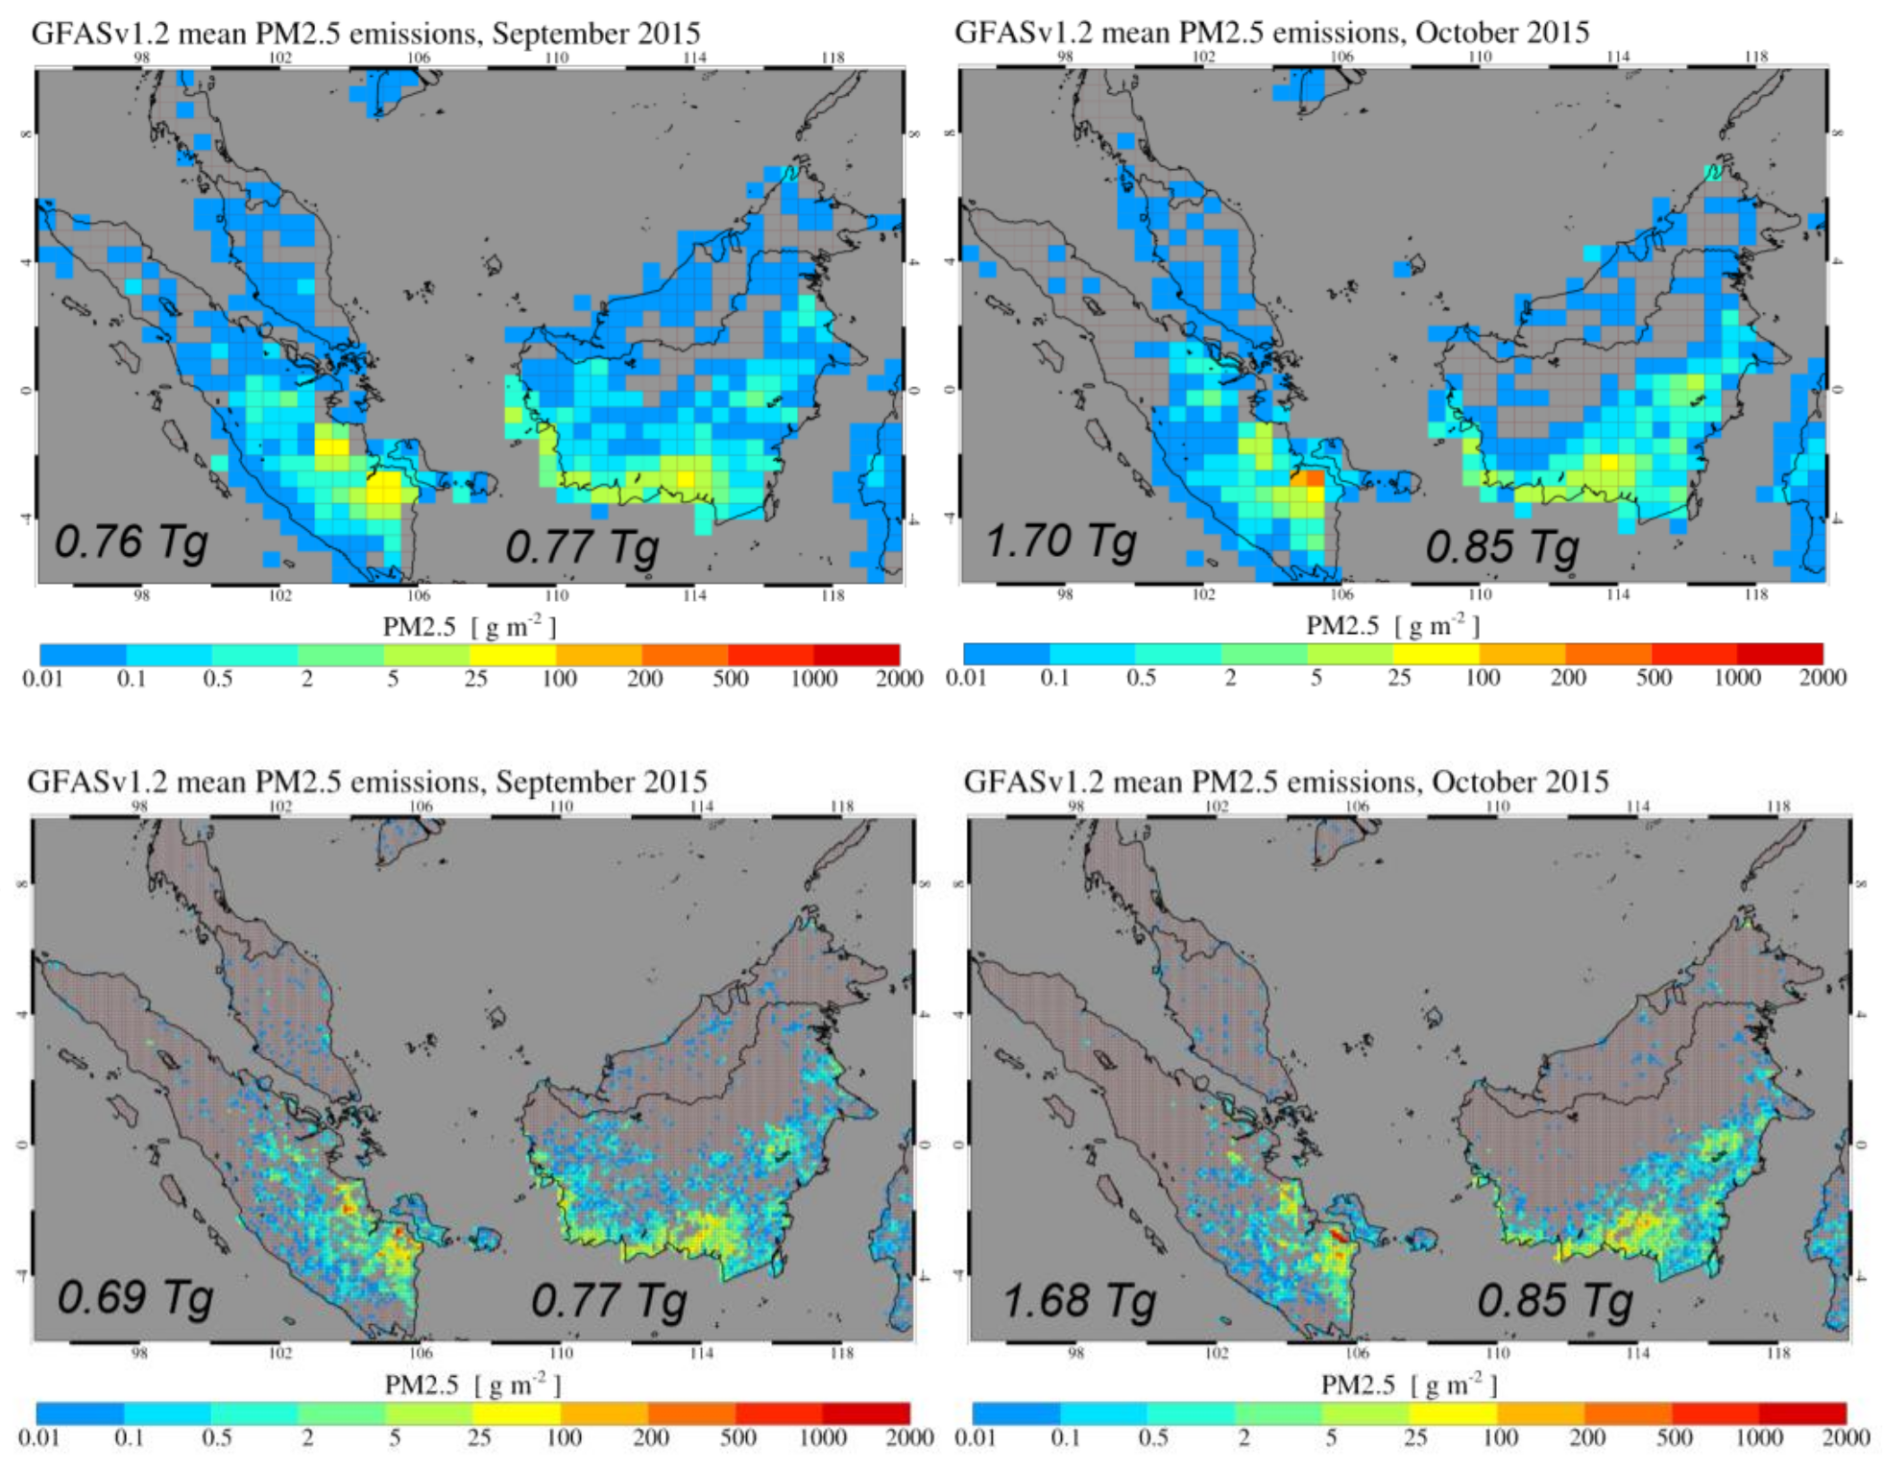

References
- Field, R.D.; Werf, G.R.V.D.; Shen, S.S.P. Human amplification of drought-Induced biomass burning in Indonesia since 1960. Nat. Geosci. 2009, 2, 185–188. [Google Scholar] [CrossRef]
- Gaveau, D.L.; Pirard, R.; Salim, M.A.; Tonoto, P.; Yaen, H.; Parks, S.A.; Carmenta, R. Overlapping land claims limit the use of satellites to monitor no-deforestation commitments and no-burning compliance. Conserv. Lett. 2016, 10, 257–264. [Google Scholar] [CrossRef]
- Aditama, T.Y. Impact of haze from forest fire to respiratory health: Indonesian experience. Respirology 2000, 5, 169–174. [Google Scholar] [CrossRef] [PubMed]
- Reisen, F.; Duran, S.M.; Flannigan, M.; Elliott, C.; Rideout, K. Wildfire smoke and public health risk. Int. J. Wildland Fire 2015, 24, 1029–1044. [Google Scholar] [CrossRef]
- Keywood, M.; Kanakidou, M.; Stohl, A.; Dentener, F.; Grassi, G.; Meyer, C.P.; Torseth, K.; Edwards, D.; Thompson, A.M.; Lohmann, U.; et al. Fire in the Air: Biomass Burning Impacts in a Changing Climate. Crit. Rev. Environ. Sci. Technol. 2013, 43, 40–83. [Google Scholar] [CrossRef]
- Jaenicke, J.; Rieley, J.; Mott, C.; Kimman, P.; Siegert, F. Determination of the amount of carbon stored in Indonesian peatlands. Geoderma 2008, 147, 151–158. [Google Scholar] [CrossRef]
- Couwenberg, J.; Dommain, R.; Joosten, H. Greenhouse gas fluxes from tropical peatlands in south-East Asia. Glob. Chang. Biol. 2009, 16, 1715–1732. [Google Scholar] [CrossRef]
- Page, S.E.; Rieley, J.O.; Banks, C.J. Global and regional importance of the tropical peatland carbon pool. Glob. Chang. Biol. 2011, 17, 798–818. [Google Scholar] [CrossRef]
- Usup, A.; Hashimoto, Y.; Takahashi, H.; Hayasaka, H. Combustion and thermal characteristics of peat fire in tropical peatland in Central Kalimantan, Indonesia. Tropics 2004, 14, 1–19. [Google Scholar] [CrossRef]
- Murdiyarso, D.; Adiningsih, E.S. Climate anomalies, Indonesian vegetation fires and terrestrial carbon emissions. Mitig. Adapt. Strateg. Glob. Chang. 2006, 12, 101–112. [Google Scholar] [CrossRef]
- Wooster, M.J.; Perry, G.L.W.; Zoumas, A. Fire, drought and El Niño relationships on Borneo (Southeast Asia) in the pre-MODIS era (1980–2000). Biogeosciences 2012, 9, 317–340. [Google Scholar] [CrossRef]
- Huijnen, V.; Wooster, M.J.; Kaiser, J.W.; Gaveau, D.L.A.; Flemming, J.; Parrington, M.; Inness, A.; Murdiyarso, D.; Main, B.; Weele, M.V. Fire carbon emissions over maritime southeast Asia in 2015 largest since 1997. Sci. Rep. 2016, 6. [Google Scholar] [CrossRef] [PubMed]
- Leeuwen, T.T.V.; Werf, G.R.V.D.; Hoffmann, A.A.; Detmers, R.G.; Rücker, G.; French, N.H.F.; Archibald, S.; Carvalho, J.A.; Cook, G.D.; Groot, W.J.D.; et al. Biomass burning fuel consumption rates: A field measurement database. Biogeosciences 2014, 11, 7305–7329. [Google Scholar] [CrossRef]
- Simpson, J.; Wooster, M.; Smith, T.; Trivedi, M.; Vernimmen, R.; Dedi, R.; Shakti, M.; Dinata, Y. Tropical Peatland Burn Depth and Combustion Heterogeneity Assessed Using UAV Photogrammetry and Airborne LiDAR. Remote Sens. 2016, 8, 1000. [Google Scholar] [CrossRef]
- Werf, G.R.V.D.; Morton, D.C.; Defries, R.S.; Olivier, J.G.J.; Kasibhatla, P.S.; Jackson, R.B.; Collatz, G.J.; Randerson, J.T. CO2 emissions from forest loss. Nat. Geosci. 2009, 2, 737–738. [Google Scholar] [CrossRef]
- Christian, T.J. Comprehensive laboratory measurements of biomass-Burning emissions: 1. Emissions from Indonesian, African, and other fuels. J. Geophys. Res. 2004, 108. [Google Scholar] [CrossRef]
- Ward, D.E. Factors Influencing the Emissions of Gases and Particulate Matter from Biomass Burning. Ecol. Stud. Fire Trop. Biota 1990, 84, 418–436. [Google Scholar]
- Rein, G. Smouldering Fires and Natural Fuels. In Fire Phenomena and the Earth System; John Wiley and Sons, Ltd.: Chichester, UK, 2013; pp. 15–33. [Google Scholar]
- Whitburn, S.; Damme, M.V.; Clarisse, L.; Turquety, S.; Clerbaux, C.; Coheur, P.-F. Doubling of annual ammonia emissions from the peat fires in Indonesia during the 2015 El Niño. Geophys. Res. Lett. 2016, 43, 11007–11014. [Google Scholar] [CrossRef]
- Reid, J.S.; Koppmann, R.; Eck, T.F.; Eleuterio, D.P. A review of biomass burning emissions, part II: Intensive physical properties of biomass burning particles. Atmos. Chem. Phys. 2004, 5, 799–825. [Google Scholar] [CrossRef]
- Haikerwal, A.; Akram, M.; Monaco, A.D.; Smith, K.; Sim, M.R.; Meyer, M.; Tonkin, A.M.; Abramson, M.J.; Dennekamp, M. Impact of Fine Particulate Matter (PM2.5) exposure during wildfires on cardiovascular health outcomes. J. Am. Heart Assoc. 2015, 4, e001653. [Google Scholar] [CrossRef] [PubMed]
- Liu, J.C.; Pereira, G.; Uhl, S.A.; Bravo, M.A.; Bell, M.L. A systematic review of the physical health impacts from non-occupational exposure to wildfire smoke. Environ. Res. 2015, 136, 120–132. [Google Scholar] [CrossRef] [PubMed]
- Chisholm, R.A.; Wijedasa, L.S.; Swinfield, T. The need for long-Term remedies for Indonesia’s forest fires. Conserv. Biol. 2016, 30, 5–6. [Google Scholar] [CrossRef] [PubMed]
- Adetona, O.; Reinhardt, T.E.; Domitrovich, J.; Broyles, G.; Adetona, A.M.; Kleinman, M.T.; Ottmar, R.D.; Naeher, L.P. Review of the health effects of wildland fire smoke on wildland firefighters and the public. Inhal. Toxicol. 2016, 28, 95–139. [Google Scholar] [CrossRef] [PubMed]
- Tacconi, L. Preventing fires and haze in Southeast Asia. Nat. Clim. Chang. 2016, 6, 640. [Google Scholar] [CrossRef]
- Koplitz, S.N.; Mickley, L.J.; Marlier, M.E.; Buonocore, J.J.; Kim, P.S.; Liu, T.; Sulprizio, M.P.; Defries, R.S.; Jacob, D.J.; Schwartz, J.; et al. Public health impacts of the severe haze in Equatorial Asia in September–October 2015: Demonstration of a new framework for informing fire management strategies to reduce downwind smoke exposure. Environ. Res. Lett. 2016, 11, 094023. [Google Scholar] [CrossRef]
- Betha, R.; Behera, S.N.; Balasubramanian, R. 2013 Southeast Asian smoke haze: Fractionation of particulate-bound elements and associated health risk. Environ. Sci. Technol. 2014, 48, 4327–4335. [Google Scholar] [CrossRef] [PubMed]
- Kunii, O.; Kanagawa, S.; Yajima, I.; Hisamatsu, Y.; Yamamura, S.; Amagai, T.; Ismail, I.T.S. The 1997 haze disaster in Indonesia: Its air quality and health effects. Arch. Environ. Health 2002, 57, 16–22. [Google Scholar] [CrossRef] [PubMed]
- Marlier, M.E.; Defries, R.S.; Voulgarakis, A.; Kinney, P.L.; Randerson, J.T.; Shindell, D.T.; Chen, Y.; Faluvegi, G. El Niño and health risks from landscape fire emissions in southeast Asia. Nat. Clim. Chang. 2012, 3, 131–136. [Google Scholar] [CrossRef] [PubMed]
- Aouizerats, B.; Werf, G.R.V.D.; Balasubramanian, R.; Betha, R. Importance of transboundary transport of biomass burning emissions to regional air quality in Southeast Asia during a high fire event. Atmos. Chem. Phys. 2015, 15, 363–373. [Google Scholar] [CrossRef]
- Crippa, P.; Castruccio, S.; Archer-Nicholls, S.; Lebron, G.B.; Kuwata, M.; Thota, A.; Sumin, S.; Butt, E.; Wiedinmyer, C.; Spracklen, D.V. Population exposure to hazardous air quality due to the 2015 fires in Equatorial Asia. Sci. Rep. 2016, 6. [Google Scholar] [CrossRef] [PubMed]
- Yorifuji, T.; Bae, S.; Kashima, S.; Tsuda, T.; Doi, H.; Honda, Y.; Kim, H.; Hong, Y.-C. Health Impact Assessment of PM10 and PM2.5 in 27 Southeast and East Asian Cities. J. Occup. Environ. Med. 2015, 57, 751–756. [Google Scholar] [CrossRef] [PubMed]
- Kaiser, J.W.; Heil, A.; Andreae, M.O.; Benedetti, A.; Chubarova, N.; Jones, L.; Morcrette, J.-J.; Razinger, M.; Schultz, M.G.; Suttie, M.; et al. Biomass burning emissions estimated with a global fire assimilation system based on observed fire radiative power. Biogeosciences 2012, 9, 527–554. [Google Scholar] [CrossRef]
- Van Der Werf, G.R.; Randerson, J.T.; Giglio, L.; Van Leeuwen, T.T.; Chen, Y.; Rogers, B.M.; Mu, M.; Van Marle, M.J.; Morton, D.C.; Collatz, G.J.; et al. Global fire emissions estimates during 1997–2016. Earth Syst. Sci. Data 2017, 9, 697–720. [Google Scholar] [CrossRef]
- Mota, B.; Wooster, M.J. A new top-Down approach for directly estimating biomass burning emissions and fuel consumption rates and totals from geostationary satellite fire radiative power (FRP). Remote Sens. Environ. 2018, 206, 45–62. [Google Scholar] [CrossRef]
- Gaveau, D.L.A.; Salim, M.A.; Hergoualch, K.; Locatelli, B.; Sloan, S.; Wooster, M.; Marlier, M.E.; Molidena, E.; Yaen, H.; Defries, R.; et al. Major atmospheric emissions from peat fires in Southeast Asia during non-Drought years: Evidence from the 2013 Sumatran fires. Sci. Rep. 2014, 4, 6112. [Google Scholar] [CrossRef] [PubMed]
- Stockwell, C.E.; Yokelson, R.J.; Kreidenweis, S.M.; Robinson, A.L.; Demott, P.J.; Sullivan, R.C.; Reardon, J.; Ryan, K.C.; Griffith, D.W.T.; Stevens, L. Trace gas emissions from combustion of peat, crop residue, biofuels, grasses, and other fuels: Configuration and FTIR component of the fourth Fire Lab at Missoula Experiment (FLAME-4). Atmos. Chem. Phys. 2014, 14, 9727–9754. [Google Scholar] [CrossRef]
- Delmas, R.; Lacaux, J.P.; Brocard, D. Determination of Biomass Burning Emission Factors: Methods and Results. Environ. Monit. Assess. 1995, 38, 181–204. [Google Scholar] [CrossRef] [PubMed]
- Stockwell, C.E.; Jayarathne, T.; Cochrane, M.A.; Ryan, K.C.; Putra, E.I.; Saharjo, B.H.; Nurhayati, A.D.; Albar, I.; Blake, D.R.; Simpson, I.J.; et al. Field measurements of trace gases and aerosols emitted by peat fires in Central Kalimantan, Indonesia during the 2015 El Niño. Atmos. Chem. Phys. 2016, 16, 11711–11732. [Google Scholar] [CrossRef]
- Xu, W.; Wooster, M.J.; Kaneko, T.; He, J.; Zhang, T.; Fisher, D. Major advances in geostationary fire radiative power (FRP) retrieval over Asia and Australia stemming from use of Himarawi-8 AHI. Remote Sens. Environ. 2017, 193, 138–149. [Google Scholar] [CrossRef]
- Blake, D.; Hinwood, A.; Horwitz, P. Peat fires and air quality: Volatile organic compounds and particulates. Chemosphere 2009, 76, 419–423. [Google Scholar] [CrossRef] [PubMed]
- Field, R.D.; Werf, G.R.V.D.; Fanin, T.; Fetzer, E.J.; Fuller, R.; Jethva, H.; Levy, R.; Livesey, N.J.; Luo, M.; Torres, O.; et al. Indonesian fire activity and smoke pollution in 2015 show persistent nonlinear sensitivity to El Niño-Induced drought. Proc. Natl. Acad. Sci. USA 2016, 113, 9204–9209. [Google Scholar] [CrossRef] [PubMed]
- Emmanuel, S.C. Impact to lung health of haze from forest fires: The Singapore experience. Respirology 2000, 5, 175–182. [Google Scholar] [CrossRef] [PubMed]
- Statheropoulos, M.; Karma, S. Complexity and origin of the smoke components as measured near the flame-Front of a real forest fire incident: A case study. J. Anal. Appl. Pyrolysis 2007, 78, 430–437. [Google Scholar] [CrossRef]
- Zhang, T.; Wooster, M.J.; Green, D.C.; Main, B. New field-Based agricultural biomass burning trace gas, PM 2.5, and black carbon emission ratios and factors measured in situ at crop residue fires in Eastern China. Atmos. Environ. 2015, 121, 22–34. [Google Scholar] [CrossRef]
- Cheng, Y.-H. Real-Time Performance of the microAeth® AE51 and the Effects of Aerosol Loading on Its Measurement Results at a Traffic Site. Aerosol Air Qual. Res. 2013, 13, 1853–1863. [Google Scholar] [CrossRef]
- Nussbaum, N.J.; Zhu, D.; Kuhns, H.D.; Mazzoleni, C.; Chang, M.-C.O.; Moosmüller, H.; Watson, J.G. The in-plume emission test stand: An instrument platform for the real-time characterization of fuel-based combustion emissions. J. Air Waste Manag. Assoc. 2009, 59, 1437–1445. [Google Scholar] [CrossRef] [PubMed]
- McNamara, M.L. Correction Factor for Continuous Monitoring of Wood Smoke Fine Particulate Matter. Aerosol Air Qual. Res. 2011, 11, 315. [Google Scholar] [CrossRef] [PubMed]
- Yokelson, R.J.; Griffith, D.W.; Ward, D.E. Open-path Fourier transform infrared studies of large-scale laboratory biomass fires. J. Geophys. Res. Atmos. 1996, 101, 21067–21080. [Google Scholar] [CrossRef]
- Oshea, S.J.; Bauguitte, S.J.-B.; Gallagher, M.W.; Lowry, D.; Percival, C.J. Development of a cavity-Enhanced absorption spectrometer for airborne measurements of CH4 and CO2. Atmos. Meas. Tech. 2013, 6, 1095–1109. [Google Scholar] [CrossRef]
- Roberts, T.; Saffell, J.; Oppenheimer, C.; Lurton, T. Electrochemical sensors applied to pollution monitoring: Measurement error and gas ratio bias—A volcano plume case study. J. Volcanol. Geotherm. Res. 2014, 281, 85–96. [Google Scholar] [CrossRef]
- Wooster, M.J.; Freeborn, P.H.; Archibald, S.; Oppenheimer, C.; Roberts, G.J.; Smith, T.E.L.; Govender, N.; Burton, M.; Palumbo, I. Field determination of biomass burning emission ratios and factors via open-Path FTIR spectroscopy and fire radiative power assessment: Headfire, backfire and residual smouldering combustion in African savannahs. Atmos. Chem. Phys. 2011, 11, 11591–11615. [Google Scholar] [CrossRef]
- Yokelson, R.J.; Goode, J.G.; Ward, D.E.; Susott, R.A.; Babbitt, R.E.; Wade, D.D.; Bertschi, I.; Griffith, D.W.T.; Hao, W.M. Emissions of formaldehyde, acetic acid, methanol, and other trace gases from biomass fires in North Carolina measured by airborne Fourier transform infrared spectroscopy. J. Geophys. Res. Atmos. 1999, 104, 30109–30125. [Google Scholar] [CrossRef]
- Akagi, S.K.; Yokelson, R.J.; Wiedinmyer, C.; Alvarado, M.J.; Reid, J.S.; Karl, T.; Crounse, J.D.; Wennberg, P.O. Emission factors for open and domestic biomass burning for use in atmospheric models. Atmos. Chem. Phys. Discuss. 2010, 11, 4039–4072. [Google Scholar] [CrossRef]
- Goode, J.G.; Yokelson, R.J.; Ward, D.E.; Susott, R.A.; Babbitt, R.E.; Davies, M.A.; Hao, W.M. Measurements of excess O3, CO2, CO, CH4, C2H4, C2H2, HCN, NO, NH3, HCOOH, CH3COOH, HCHO, and CH3OH in 1997 Alaskan biomass burning plumes by airborne Fourier transform infrared spectroscopy (AFTIR). J. Geophys. Res. Atmos. 2000, 105, 22147–22166. [Google Scholar] [CrossRef]
- May, A.A.; Lee, T.; Mcmeeking, G.R.; Akagi, S.; Sullivan, A.P.; Urbanski, S.; Yokelson, R.J.; Kreidenweis, S.M. Observations and analysis of organic aerosol evolution in some prescribed fire smoke plumes. Atmos. Chem. Phys. 2015, 15, 6323–6335. [Google Scholar] [CrossRef]
- Bentley, S. Graphical techniques for constraining estimates of aerosol emissions from motor vehicles using air monitoring network data. Atmos. Environ. 2004, 38, 1491–1500. [Google Scholar] [CrossRef]
- Grange, S.K.; Lewis, A.C.; Carslaw, D.C. Source apportionment advances using polar plots of bivariate correlation and regression statistics. Atmos. Environ. 2016, 145, 128–134. [Google Scholar] [CrossRef]
- Ayers, G. Comment on regression analysis of air quality data. Atmos. Environ. 2001, 35, 2423–2425. [Google Scholar] [CrossRef]
- Hagler, G.S. Post-processing method to reduce noise while preserving high time resolution in aethalometer real-time black carbon data. Aerosol Air Qual. Res. 2011, 11, 539–546. [Google Scholar] [CrossRef]
- Balasubramanian, R. Comprehensive characterization of PM2.5 aerosols in Singapore. J. Geophys. Res. 2004, 108, 2022–2156. [Google Scholar]
- Briz, S.; Castro, A.J.D.; Díez, S.; López, F.; Schäfer, K. Remote sensing by open-Path FTIR spectroscopy. Comparison of different analysis techniques applied to ozone and carbon monoxide detection. J. Quant. Spectrosc. Radiat. Transf. 2007, 103, 314–330. [Google Scholar] [CrossRef]
- Osaki, M.; Hirose, K.; Segah, H.; Helmy, F. Tropical Peat and Peatland Definition in Indonesia. Trop. Peatl. Ecosyst. 2016, 137–147. [Google Scholar]
- Sokal, R.R.; James, R.F. The Principles and Practice of Statistics in Biological Research, 3rd ed.; W.H. Freeman and Company: New York, NY, USA, 1995. [Google Scholar]
- Kingham, S.; Durand, M.; Aberkane, T.; Harrison, J.; Wilson, J.G.; Epton, M. Winter comparison of TEOM, MiniVol and DustTrak PM10 monitors in a woodsmoke environment. Atmos. Environ. 2006, 40, 338–347. [Google Scholar] [CrossRef]
- Sinha, P.; Hobbs, P.V.; Yokelson, R.J.; Bertschi, I.T.; Blake, D.R.; Simpson, I.J.; Gao, S.; Kirchstetter, T.W.; Novakov, T. Emissions of trace gases and particles from savanna fires in southern Africa. J. Geophys. Res. Atmos. 2004, 108. [Google Scholar] [CrossRef]
- Kuwata, M.; Kai, F.M.; Yang, L.; Itoh, M.; Gunawan, H.; Harvey, C.F. Temperature and burning history affect emissions of greenhouse gases and aerosol particles from tropical peatland fire. J. Geophys. Res. Atmos. 2017, 122, 1281–1292. [Google Scholar] [CrossRef]
- Yokelson, R.J.; Karl, T.; Artaxo, P.; Blake, D.R.; Christian, T.J.; Griffith, D.W.T.; Guenther, A.; Hao, W.M. The Tropical Forest and fire emissions experiment: Overview and airborne fire emission factor measurements. Atmos. Chem. Phys. 2007, 7, 5175–5196. [Google Scholar] [CrossRef]
- Geron, C.; Hays, M. Air emissions from organic soil burning on the coastal plain of North Carolina. Atmos. Environ. 2013, 64, 192–199. [Google Scholar] [CrossRef]
- Zhang, T.; Wooster, M.J.; Xu, W. Approaches for synergistically exploiting VIIRS I-and M-Band data in regional active fire detection and FRP assessment: A demonstration with respect to agricultural residue burning in Eastern China. Remote Sens. Environ. 2017, 198, 407–424. [Google Scholar] [CrossRef]
- Afroz, R.; Hassan, M.N.; Ibrahim, N.A. Review of air pollution and health impacts in Malaysia. Environ. Res. 2004, 92, 71–77. [Google Scholar] [CrossRef]
- Roberts, G.; Wooster, M.J.; Xu, W.; Freeborn, P.H.; Morcrette, J.-J.; Jones, L.; Benedetti, A.; Jiangping, H.; Fisher, D.; Kaiser, J.W. LSA SAF Meteosat FRP products—Part 2: Evaluation and demonstration for use in the Copernicus Atmosphere Monitoring Service (CAMS). Atmos. Chem. Phys. 2015, 15, 13241–13267. [Google Scholar] [CrossRef]
- Page, S.E.; Siegert, F.; Rieley, J.O.; Boehm, H.-D.V.; Jaya, A.; Limin, S. The amount of carbon released from peat and forest fires in Indonesia during 1997. Nature 2002, 420, 61–65. [Google Scholar] [CrossRef] [PubMed]
- Giglio, L. Characterization of the tropical diurnal fire cycle using VIRS and MODIS observations. Remote Sens. Environ. 2007, 108, 407–421. [Google Scholar] [CrossRef]
- Mu, M.; Randerson, J.T.; Van der Werf, G.R.; Giglio, L.; Kasibhatla, P.; Morton, D.; Collatz, G.J.; DeFries, R.S.; Hyer, E.J.; Prins, E.M.; et al. Daily and 3-hourly variability in global fire emissions and consequences for atmospheric model predictions of carbon monoxide. J. Geophys. Res. Atmos. 2011, 116. [Google Scholar] [CrossRef]
- Roberts, G.; Wooster, M.J.; Lagoudakis, E. Annual and diurnal African biomass burning temporal dynamics. Biogeosciences 2009, 6, 849–866. [Google Scholar] [CrossRef]
- Wiedinmyer, C.; Akagi, S.K.; Yokelson, R.J.; Emmons, L.K.; Al-Saadi, J.A.; Orlando, J.J.; Soja, A.J. The Fire INventory from NCAR (FINN)—A high resolution global model to estimate the emissions from open burning. Geosci. Model Dev. 2011, 4, 625–641. [Google Scholar] [CrossRef]
- Saide, P.E.; Peterson, D.A.; Silva, A.; Anderson, B.; Ziemba, L.D.; Diskin, G.; Sachse, G.; Hair, J.; Butler, C.; Fenn, M.; et al. Revealing important nocturnal and day-to-day variations in fire smoke emissions through a multiplatform inversion. Geophys. Res. Lett. 2015, 42, 3609–3618. [Google Scholar] [CrossRef]
- Brown, J.S.; Gordon, T.; Price, O.; Asgharian, B. Thoracic and respirable particle definitions for human health risk assessment. Part. Fibre Toxicol. 2013, 10, 12. [Google Scholar] [CrossRef] [PubMed]
- May, A.A.; Levin, E.J.; Hennigan, C.J.; Riipinen, I.; Lee, T.; Collett, J.L.; Jimenez, J.L.; Kreidenweis, S.M.; Robinson, A.L. Gas-particle partitioning of primary organic aerosol emissions: 3. Biomass burning. J. Geophys. Res. Atmos. 2013, 118, 11327–11338. [Google Scholar] [CrossRef]
- Arceo-Gomez, E.; Hanna, R.; Oliva, P. Does the effect of pollution on infant mortality differ between developing and developed countries? Evidence from Mexico City. Econ. J. 2012, 126, 257–280. [Google Scholar] [CrossRef]
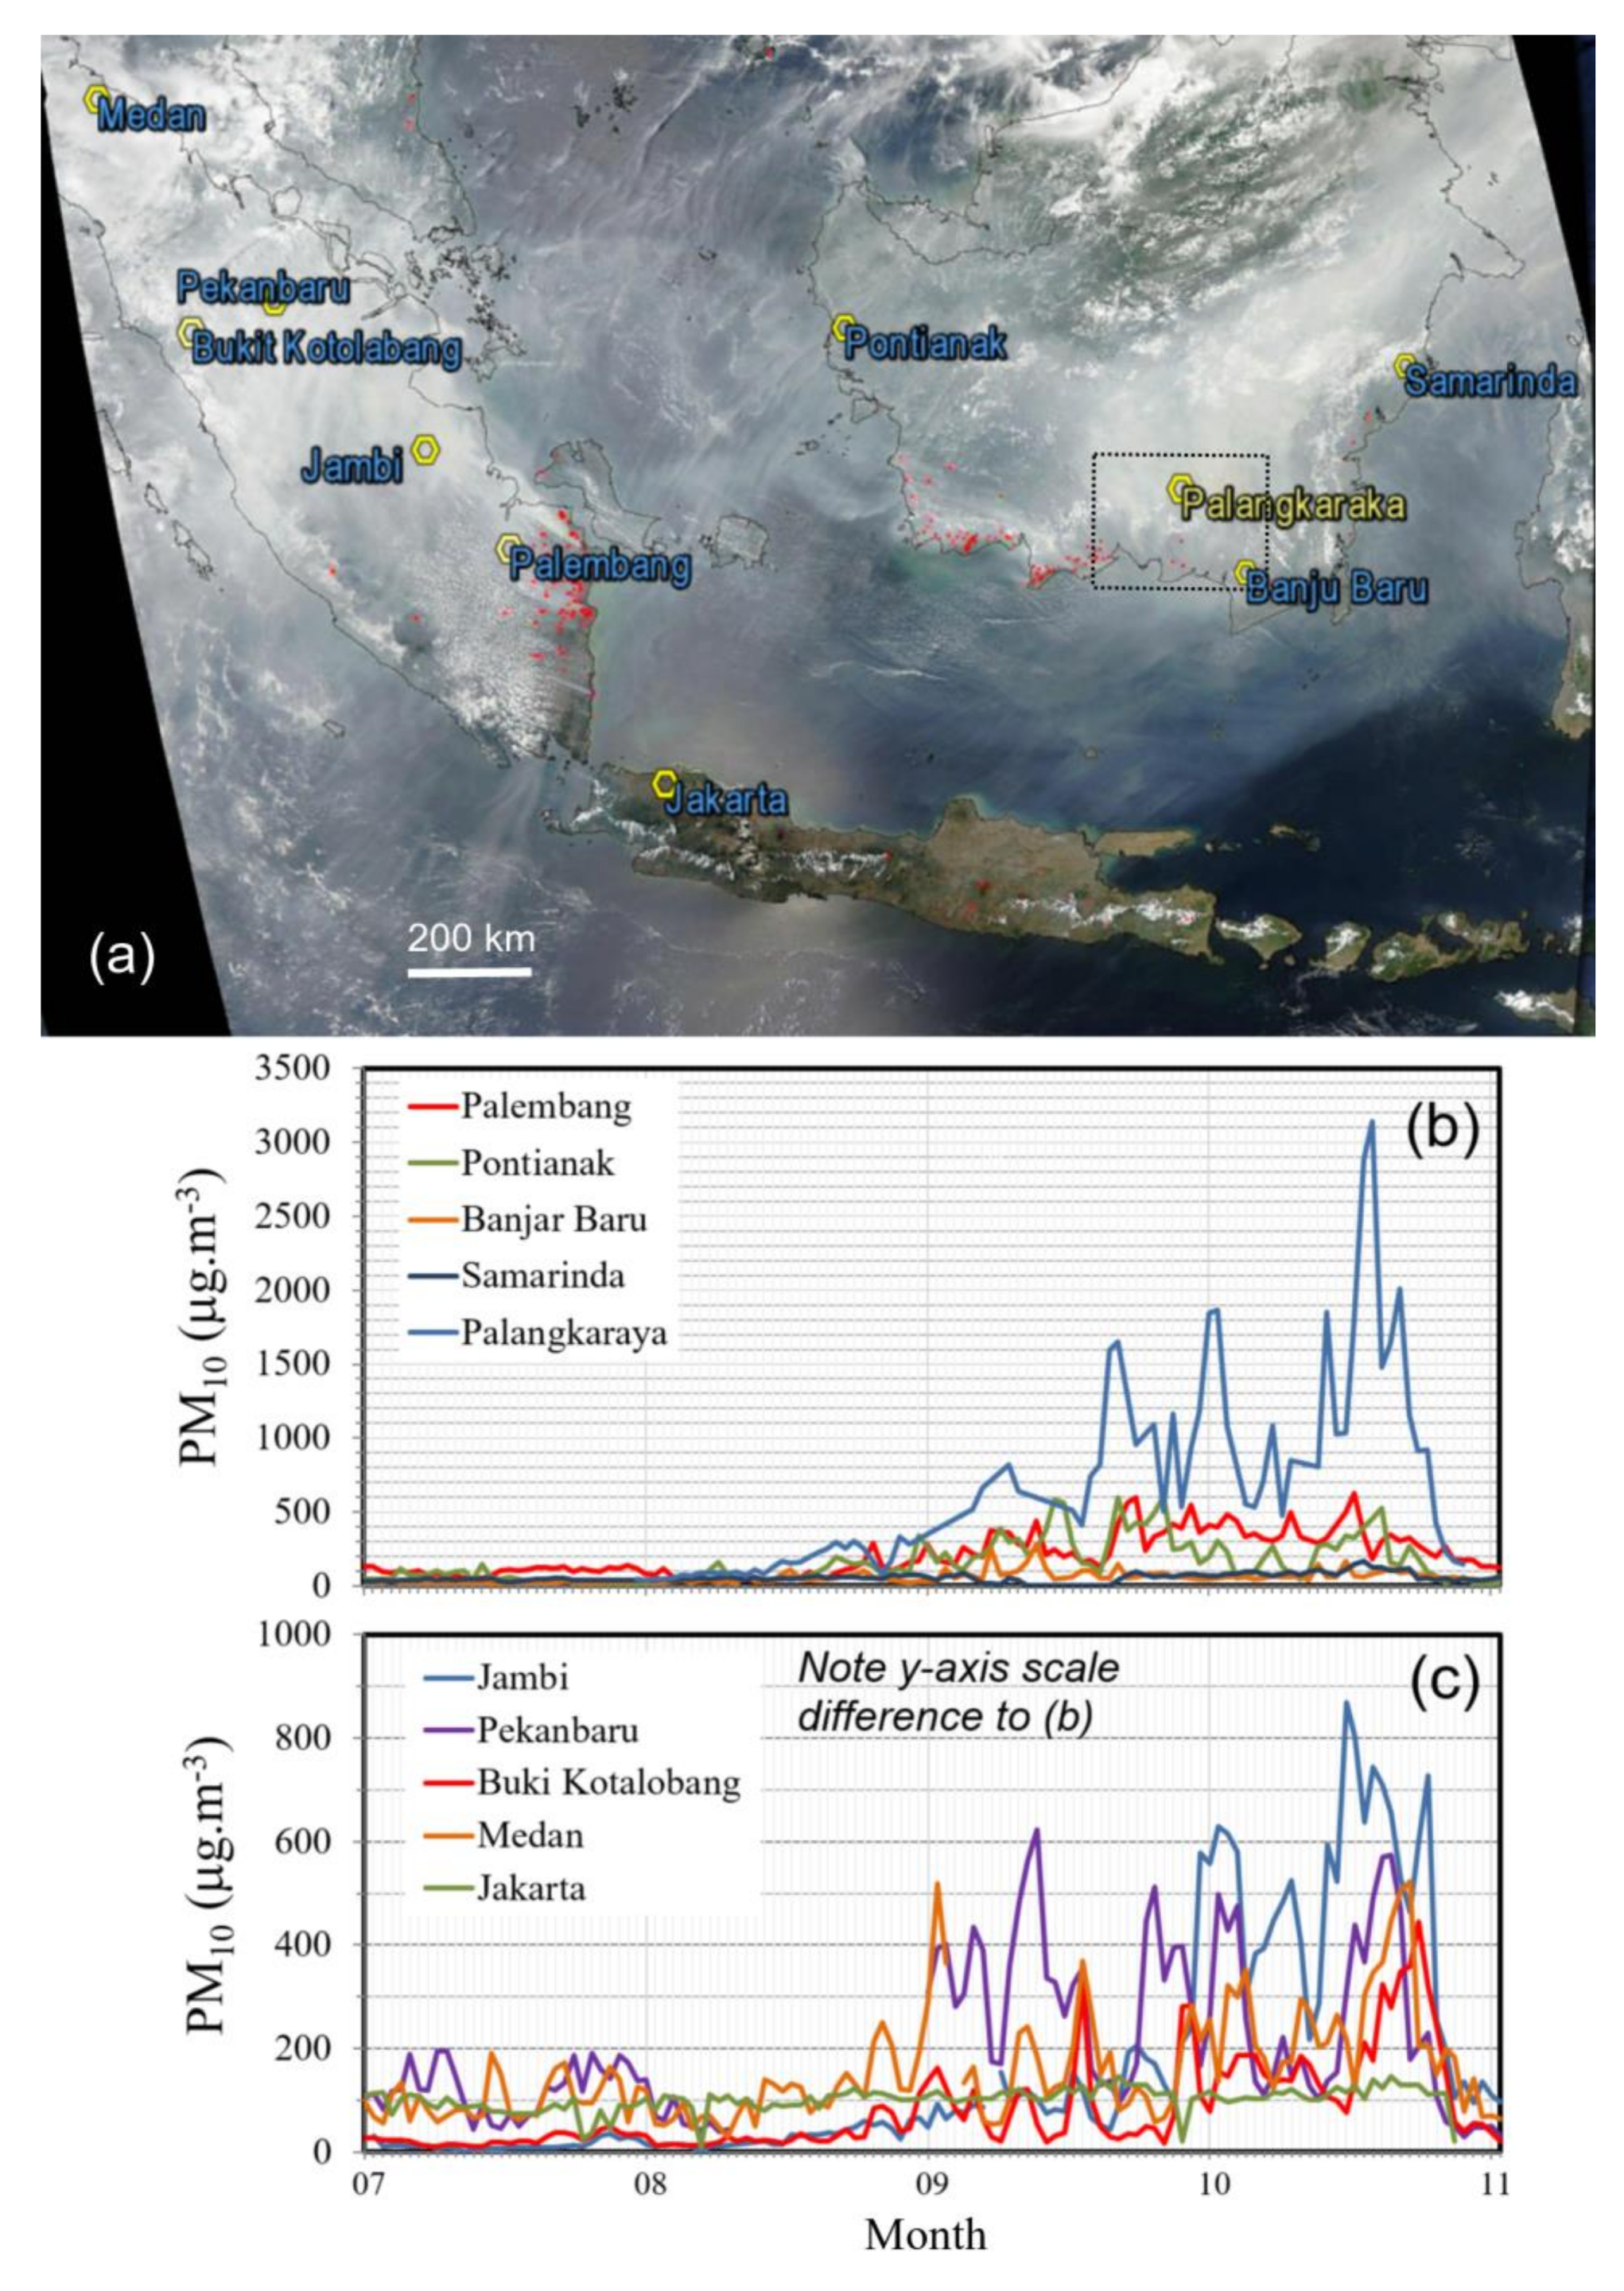
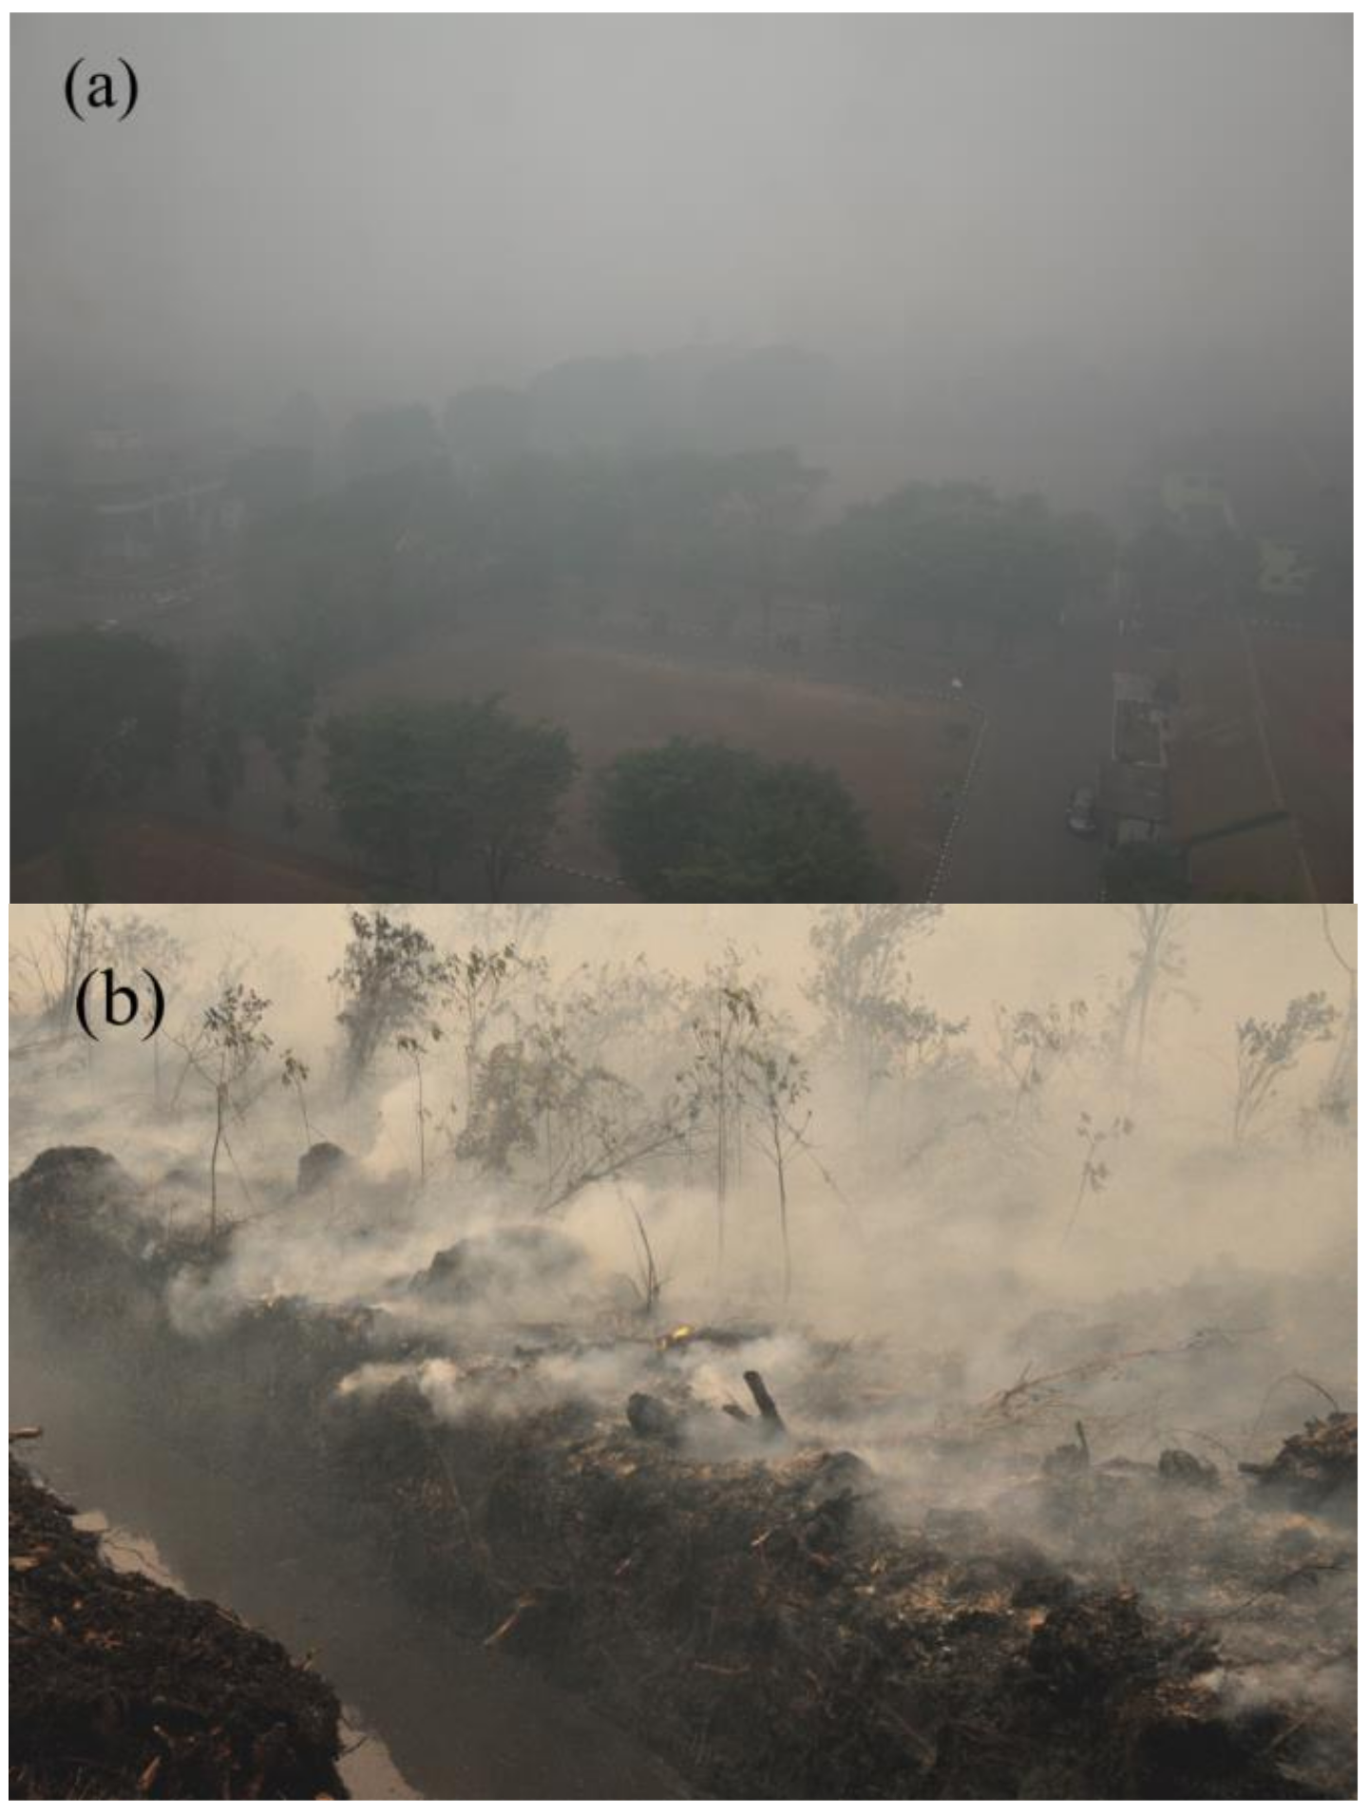
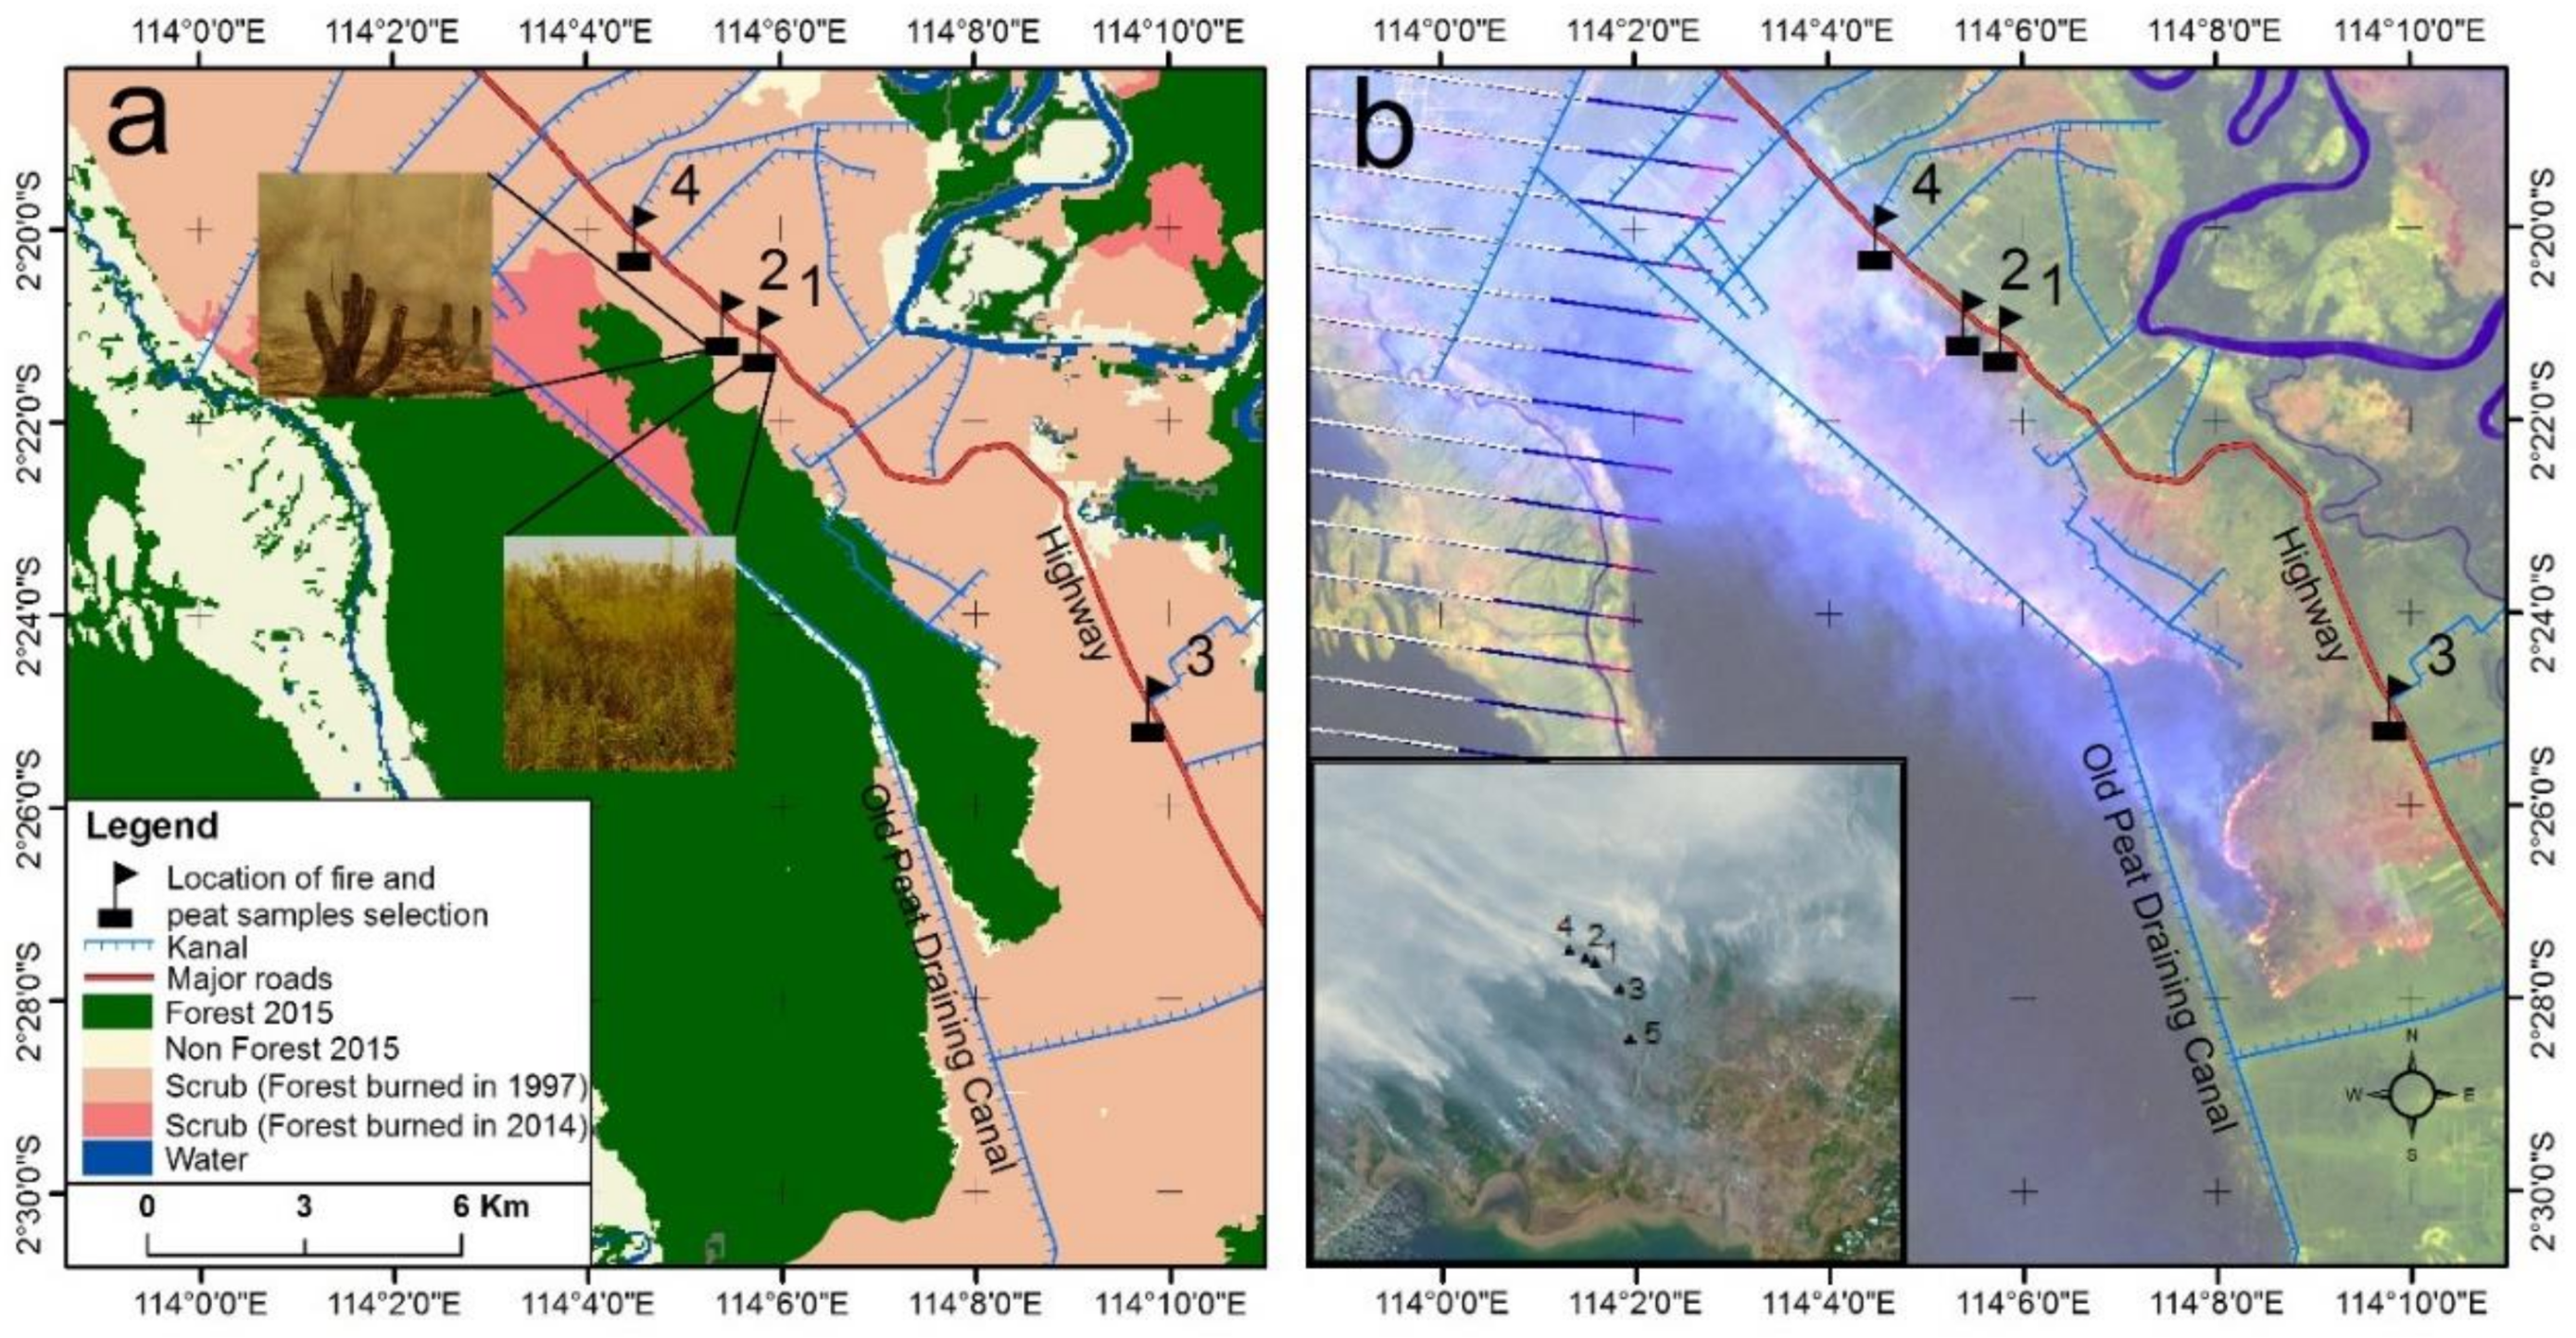
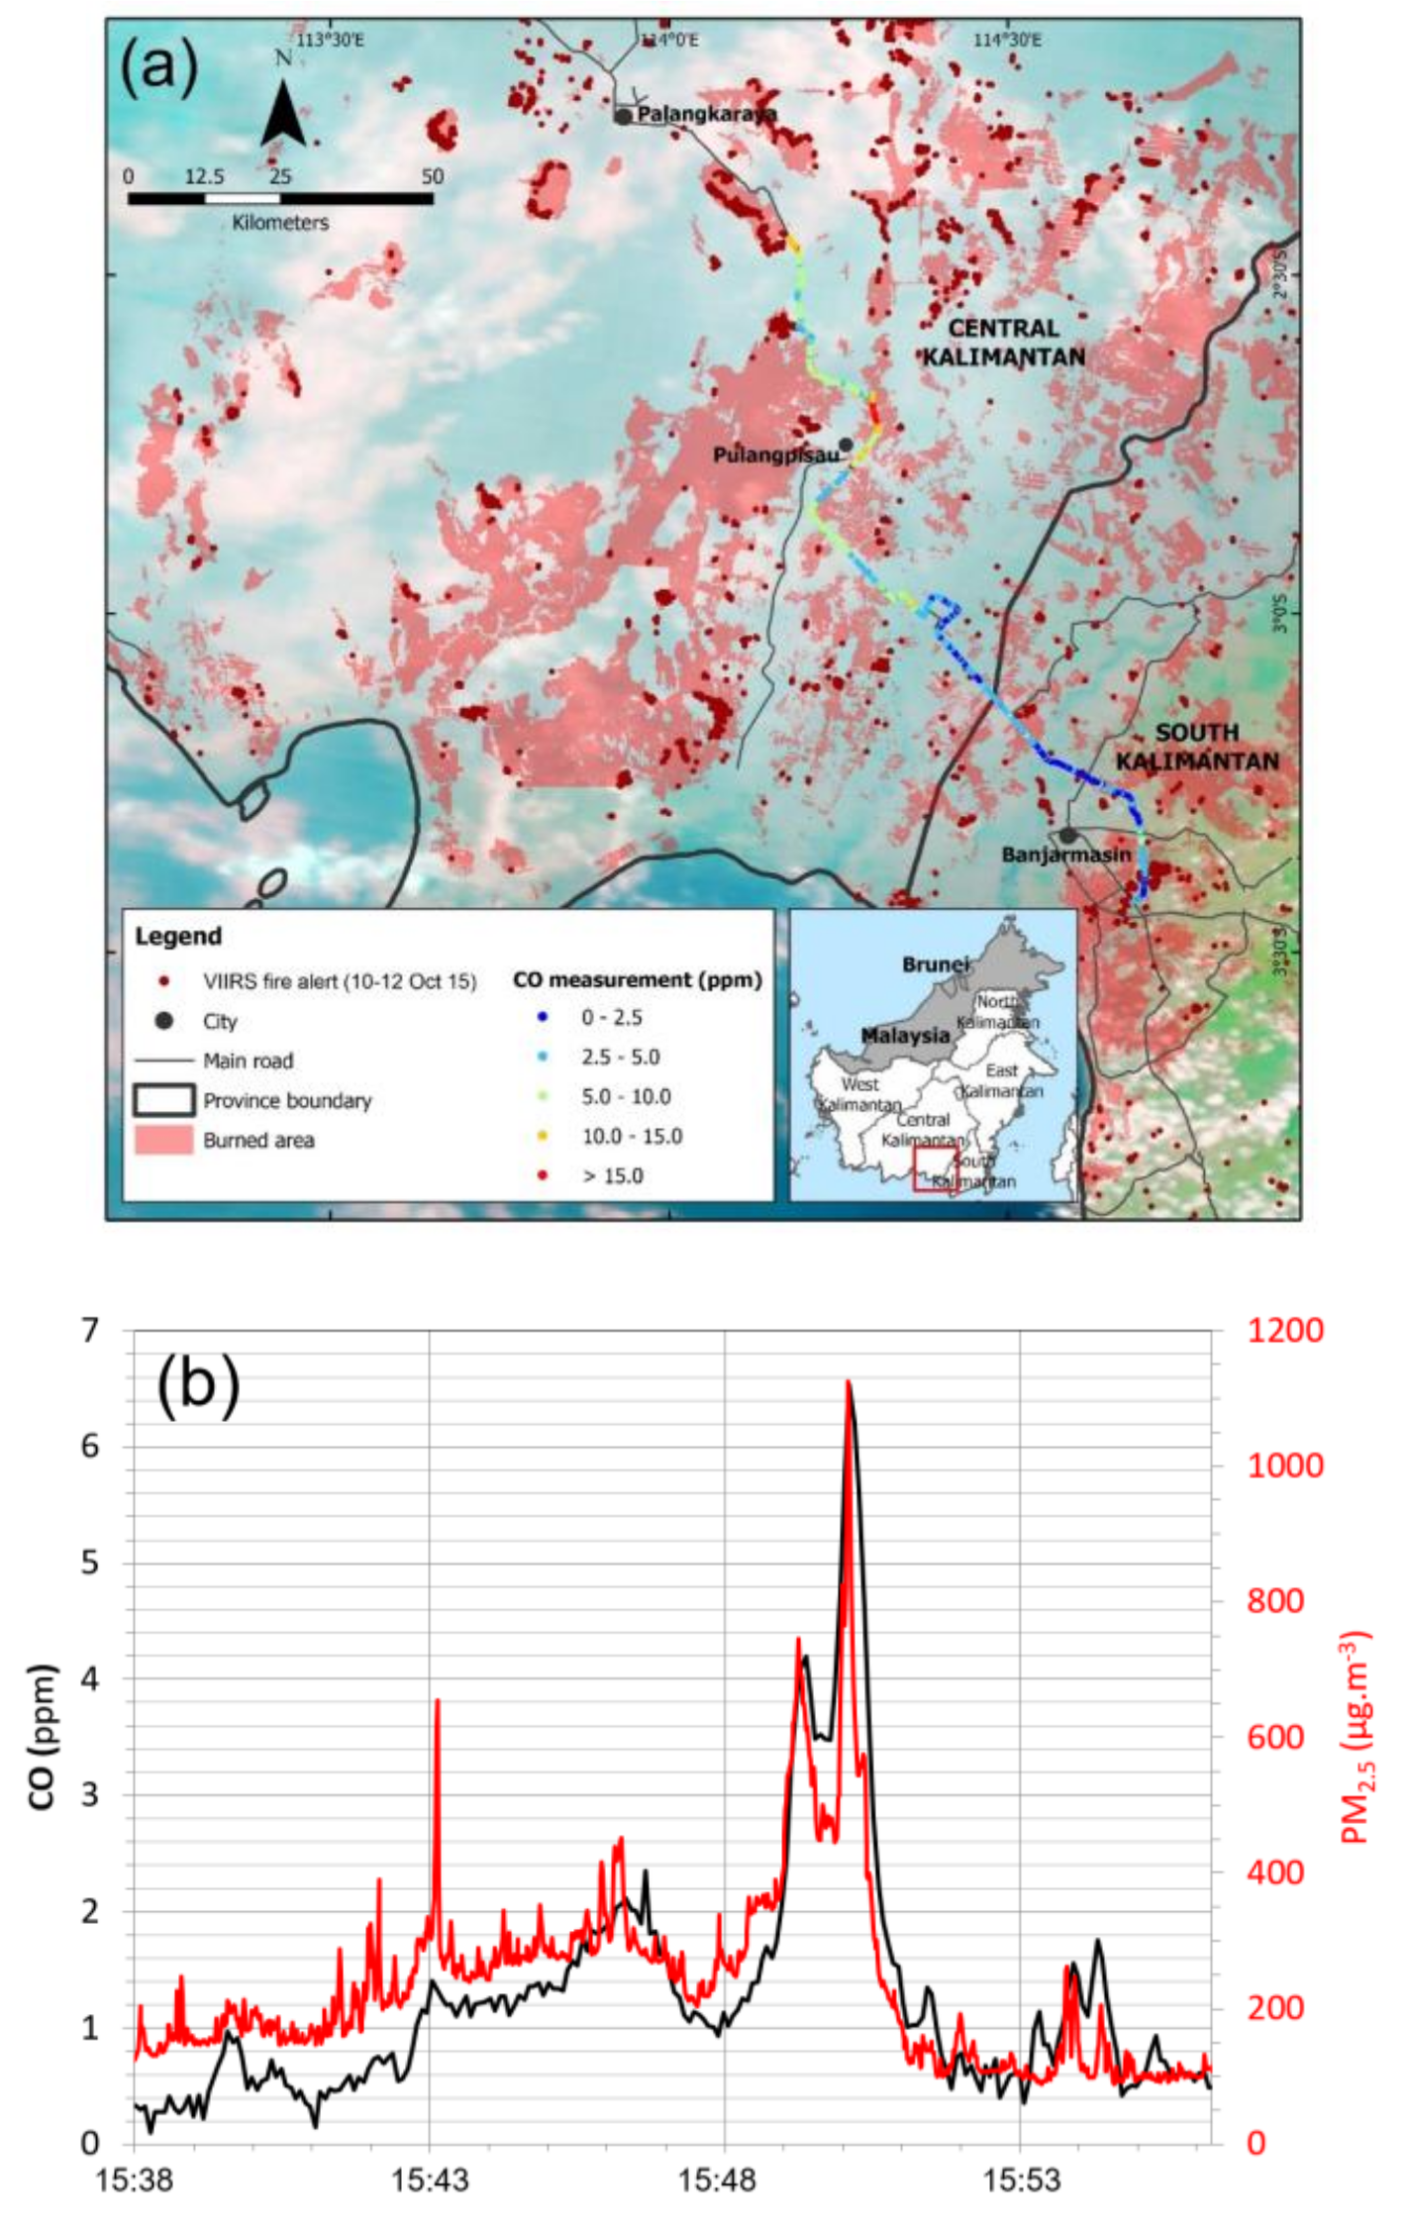
| Location No. (Figure 3) and Sampling Date | Source of Smoke Sample | Pre-Fire Land Use | Fire History (Mapping Back to 1997–1998 Fires) |
|---|---|---|---|
| Loc. 1: 12 October Close to source smoke sampling. | Sub-surface peat burn. Occasional flaming from dead surface vegetation during early period. | Degraded lands, left idle (not active agriculture), dominated by scrub and ferns. See left inset in Figure 3. | Peat-forest burned in 1997 and ~every 3 years since. |
| Loc. 2: 14 October Close to source smoke sampling. | Sub-surface peat fire. Occasional flaming from dead surface vegetation during early period. | Young forest regrowth. | Peat-swamp forest burned in 1997. No reoccurrence. |
| Loc. 3: 14 October Downwind smoke sampling. | Large-scale fire burning in peat forest block. | Peat forest | No previous evidence of burning. |
| Loc. 4: 15 October Downwind smoke sampling. | Flaming fire burning scrubby vegetation atop peat. | Degraded idle lands, dominated by scrub and ferns. See left inset in Figure 3 | Peat-forest burned in 1997 and ~every 3 years since. |
| Loc. 5: 16 October Close to source smoke sampling. | Sub-surface peat fire. | Degraded idle lands, dominated by scrub and ferns. See left inset in Figure 3 | Peat-forest burned in 1991. Burned ~every 3 years since. |
| Location | Carbon (g·kg−1) @ Peat Depth (cm) | Nitrogen (g·kg−1) @ Peat Depth (cm) | C:N Ratio @ Peat Depth (cm) | Gravimetric Moisture (g·g−1) @ Peat Depth (cm) | ||||||||
|---|---|---|---|---|---|---|---|---|---|---|---|---|
| Surface | 0–10 | 10–30 | Surface | 0–10 | 10–30 | Surface | 0–10 | 10–30 | Surface | 0–10 | 10–30 | |
| 1 | -/- | 631 ± 23 | 617 ± 7 | -/- | 18 ± 5 | 15 ± 0 | -/- | 42 ± 10 | 43 ± 0 | -/- | 245 ± 30 | 459 ± 43 |
| 2 | 564 ± 10 | 583 ± 9 ‡ | 641 † | 28 ± 1 | 25 ± 1 ‡ | 16 † | 20 ± 1 | 23 ± 2 ‡ | 39 † | 165 ± 6 | 364 ± 16 | 350 ± 13 |
| 4 | -/- | 678 ± 4 | 645 ± 9 | -/- | 12 ± 1 | 15 ± 1 | -/- | 56 ± 4 | 43 ± 2 | -/- | 206 ± 19 | 259 ± 9 |
| 5 | -/- | 571 ± 50 ‡ | 585 † | -/- | 16 ± 1 ‡ | 15 † | -/- | 36 ± 6 ‡ | 39 † | -/- | 258 ± 1 | 223 ± 2 ‡ |
| Mean (n = 4) | 564 ± 10 | 616 ± 21 | 622 ± 12 | 28 ± 1 | 18 ± 2 | 15 ± 0 | 20 ± 1 | 39 ± 6 | 41 ± 1 | 165 ± 6 | 268 ± 29 | 322 ± 46 |
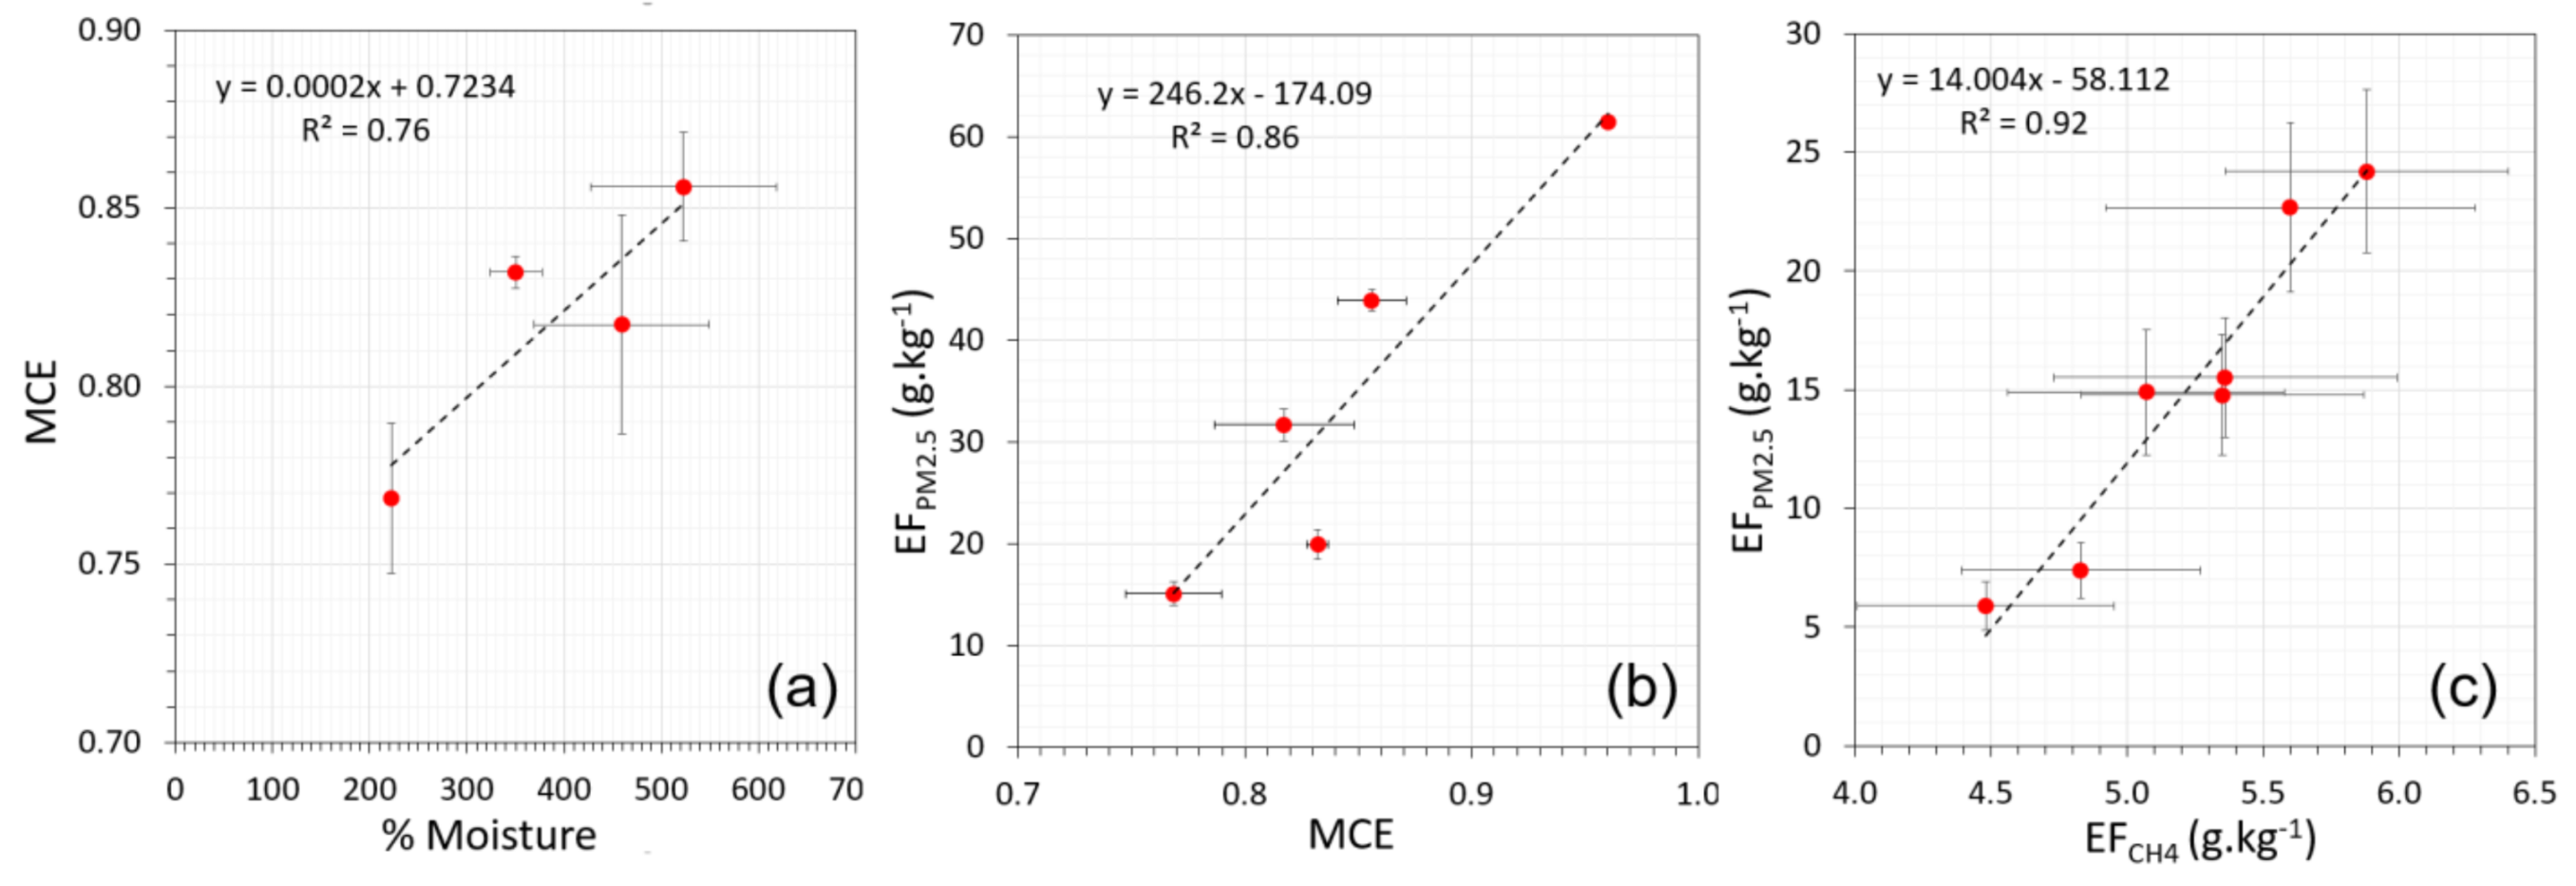
| Trace Gas Emissions Ratio (ER) [mol·mol−1] | Particulate Emissions Ratio [mg·mg1] | ||||||
|---|---|---|---|---|---|---|---|
| Plume | CO to CO2 ER × 100 | CH4 to CO2 ER ×1000 | CH4 to CO ER ×100 | PM2.5 to CO | PM2.5 to CO2 | BC to PM2.5 | |
| Location 1 | 1 | 16.17 ± 1.06 | 12.82 ± 0.57 | 7.77 ± 0.21 | 0.173 | 0.0135 | - |
| 2 | 12.50 ± 1.16 | 9.80 ± 0.79 | 7.54 ± 0.16 | 0.182 | 0.0138 | - | |
| 3 | 24.20 ± 0.81 | 15.11 ± 0.74 | 6.28 ± 0.14 | 0.105 | 0.0092 | - | |
| 4 | 23.76 ± 1.68 | 14.47 ± 1.01 | 6.08 ± 0.13 | 0.090 | 0.0069 | - | |
| 5 | 23.60 ± 2.49 | 14.63 ± 2.07 | 6.39 ± 0.32 | 0.112 | 0.0103 | - | |
| 6 | 26.64 ± 0.98 | 16.15 ± 0.65 | 6.07 ± 0.06 | 0.117 | 0.0138 | - | |
| 7 | 26.49 ± 1.13 | 16.26 ± 0.66 | 6.13 ± 0.11 | 0.126 | 0.0160 | - | |
| 8 | 21.96 ± 1.20 | 12.98 ± 0.71 | 5.89 ± 0.10 | 0.119 | 0.0152 | - | |
| 9 | 25.43 ± 0.73 | 16.23 ± 0.43 | 6.38 ± 0.04 | 0.132 | 0.0209 | - | |
| 10 | 22.73 ± 0.98 | 14.68 ± 0.77 | 6.46 ± 0.18 | 0.115 | 0.0165 | - | |
| 11 | 25.06 ± 0.84 | 16.53 ± 0.84 | 6.72 ± 0.18 | 0.119 | 0.0181 | - | |
| Mean ± 1σ | 22.59 ± 4.41 = 0.82 | 14.52 ± 2.01 | 6.52 ± 0.08 | 0.127 ± 0.028 | 0.014 ± 0.004 | - | |
| Location 2 | 1 | 18.42 ± 0.40 | 11.98 ± 0.22 | 6.42 ± 0.09 | 0.073 | 0.0076 | 0.0099 |
| 2 | 20.61 ± 0.92 | 11.91 ± 0.60 | 5.82 ± 0.05 | 0.097 | 0.0108 | 0.0065 | |
| 3 | 21.13 ± 1.06 | 14.64 ± 0.59 | 6.81 ± 0.13 | 0.079 | 0.0092 | 0.0061 | |
| 4 | 20.55 ± 0.92 | 14.76 ± 0.58 | 7.08 ± 0.15 | 0.081 | 0.0092 | 0.0054 | |
| 5 | 20.21 ± 0.79 | 11.47 ± 0.42 | 5.65 ± 0.07 | 0.091 | 0.0096 | 0.0044 | |
| Mean ± 1σ | 20.18 ± 1.04 = 0.83 | 12.95 ± 1.61 | 6.36 ± 0.62 | 0.084 ± 0.010 | 0.0167 ± 0.0020 | 0.0064 ± 0.0023 | |
| Location 3 | 1 | 15.59 ± 1.03 | 13.90 ± 0.92 | 8.81 ± 0.27 | 0.200 | 0.0253 | - |
| 2 | 14.70 ± 0.87 | 12.12 ± 0.97 | 8.57 ± 0.19 | 0.263 | 0.0290 | 0.0134 | |
| 3 | 16.64 ± 0.61 | 13.67 ± 0.63 | 8.27 ± 0.16 | 0.238 | 0.0275 | 0.0191 | |
| 4 | 19.44 ± 0.85 | 16.75 ± 0.72 | 8.57 ± 0.13 | 0.187 | 0.0249 | 0.0180 | |
| 5 | 18.36 ± 0.94 | 14.57 ± 1.08 | 8.13 ± 0.28 | 0.200 | 0.0225 | 0.0099 | |
| Mean ± 1σ | 16.95 ± 1.95 = 0.86 | 14.18 ± 1.68 | 8.47 ± 0.06 | 0.217± 0.031 | 0.0465± 0.0045 | 0.0121± 0.0077 | |
| Location 4 | 1 | 3.95 ± 0.27 | 4.01 ± 0.48 | 10.08 ± 0.34 | - | - | - |
| 2 | 5.64 ± 0.30 | 11.99 ± 0.51 | 20.98 ± 0.71 | 0.817 | 0.0233 | 0.0136 | |
| Mean ± 1σ | 4.80 ± 1.20 = 0.95 | 8.00 ± 5.64 | 15.53 ± 7.79 | 0.817 | 0.0419 | 0.0136 | |
| Location 5 | 1 | 25.99 ± 1.77 | 7.88 ± 0.46 | 2.95 ± 0.07 | 0.051 | 0.0067 | 0.0264 |
| 2 | 30.83 ± 1.80 | 9.05 ± 0.80 | 2.97 ± 0.15 | 0.068 | 0.0117 | 0.0104 | |
| 3 | 36.48 ± 1.00 | 9.92 ± 0.33 | 2.74 ± 0.08 | 0.064 | 0.0086 | 0.0112 | |
| 4 | 29.33 ± 1.73 | 8.57 ± 0.70 | 2.99 ± 0.11 | 0.048 | 0.0071 | 0.0104 | |
| 5 | 27.66 ± 1.09 | 7.06 ± 0.46 | 2.61 ± 0.91 | 0.019 | 0.0032 | 0.0178 | |
| 6 | 30.77 ± 0.74 | 7.80 ± 0.30 | 2.50 ± 0.09 | 0.022 | 0.0030 | 0.0201 | |
| 7 | 27.14 ± 1.46 | 8.40 ± 0.44 | 3.04 ± 0.09 | 0.049 | 0.0063 | 0.0119 | |
| Mean ± 1σ | 29.74 ± 3.48 = 0.77 | 8.38 ± 0.84 | 2.82 ± 0.22 | 0.045 ± 0.019 | 0.0120 ± 0.0055 | 0.0154 ± 0.0062 | |
| Mean of All Locations | 18.85 ± 9.16 = 0.84 | 11.61 ± 3.17 | 7.94 ± 4.70 | 0.225 ± 0.279 | 0.0285 ± 0.0151 | 0.012 ± 0.004 | |
| Mean of Peat Only Fires (Locations. 1, 2 and 5) | 24.17 ± 4.97 = 0.81 | 11.94 ± 3.20 | 5.23 ± 2.09 | 0.085 ± 0.041 | 0.018 ± 0.007 | 0.011 ± 0.006 | |
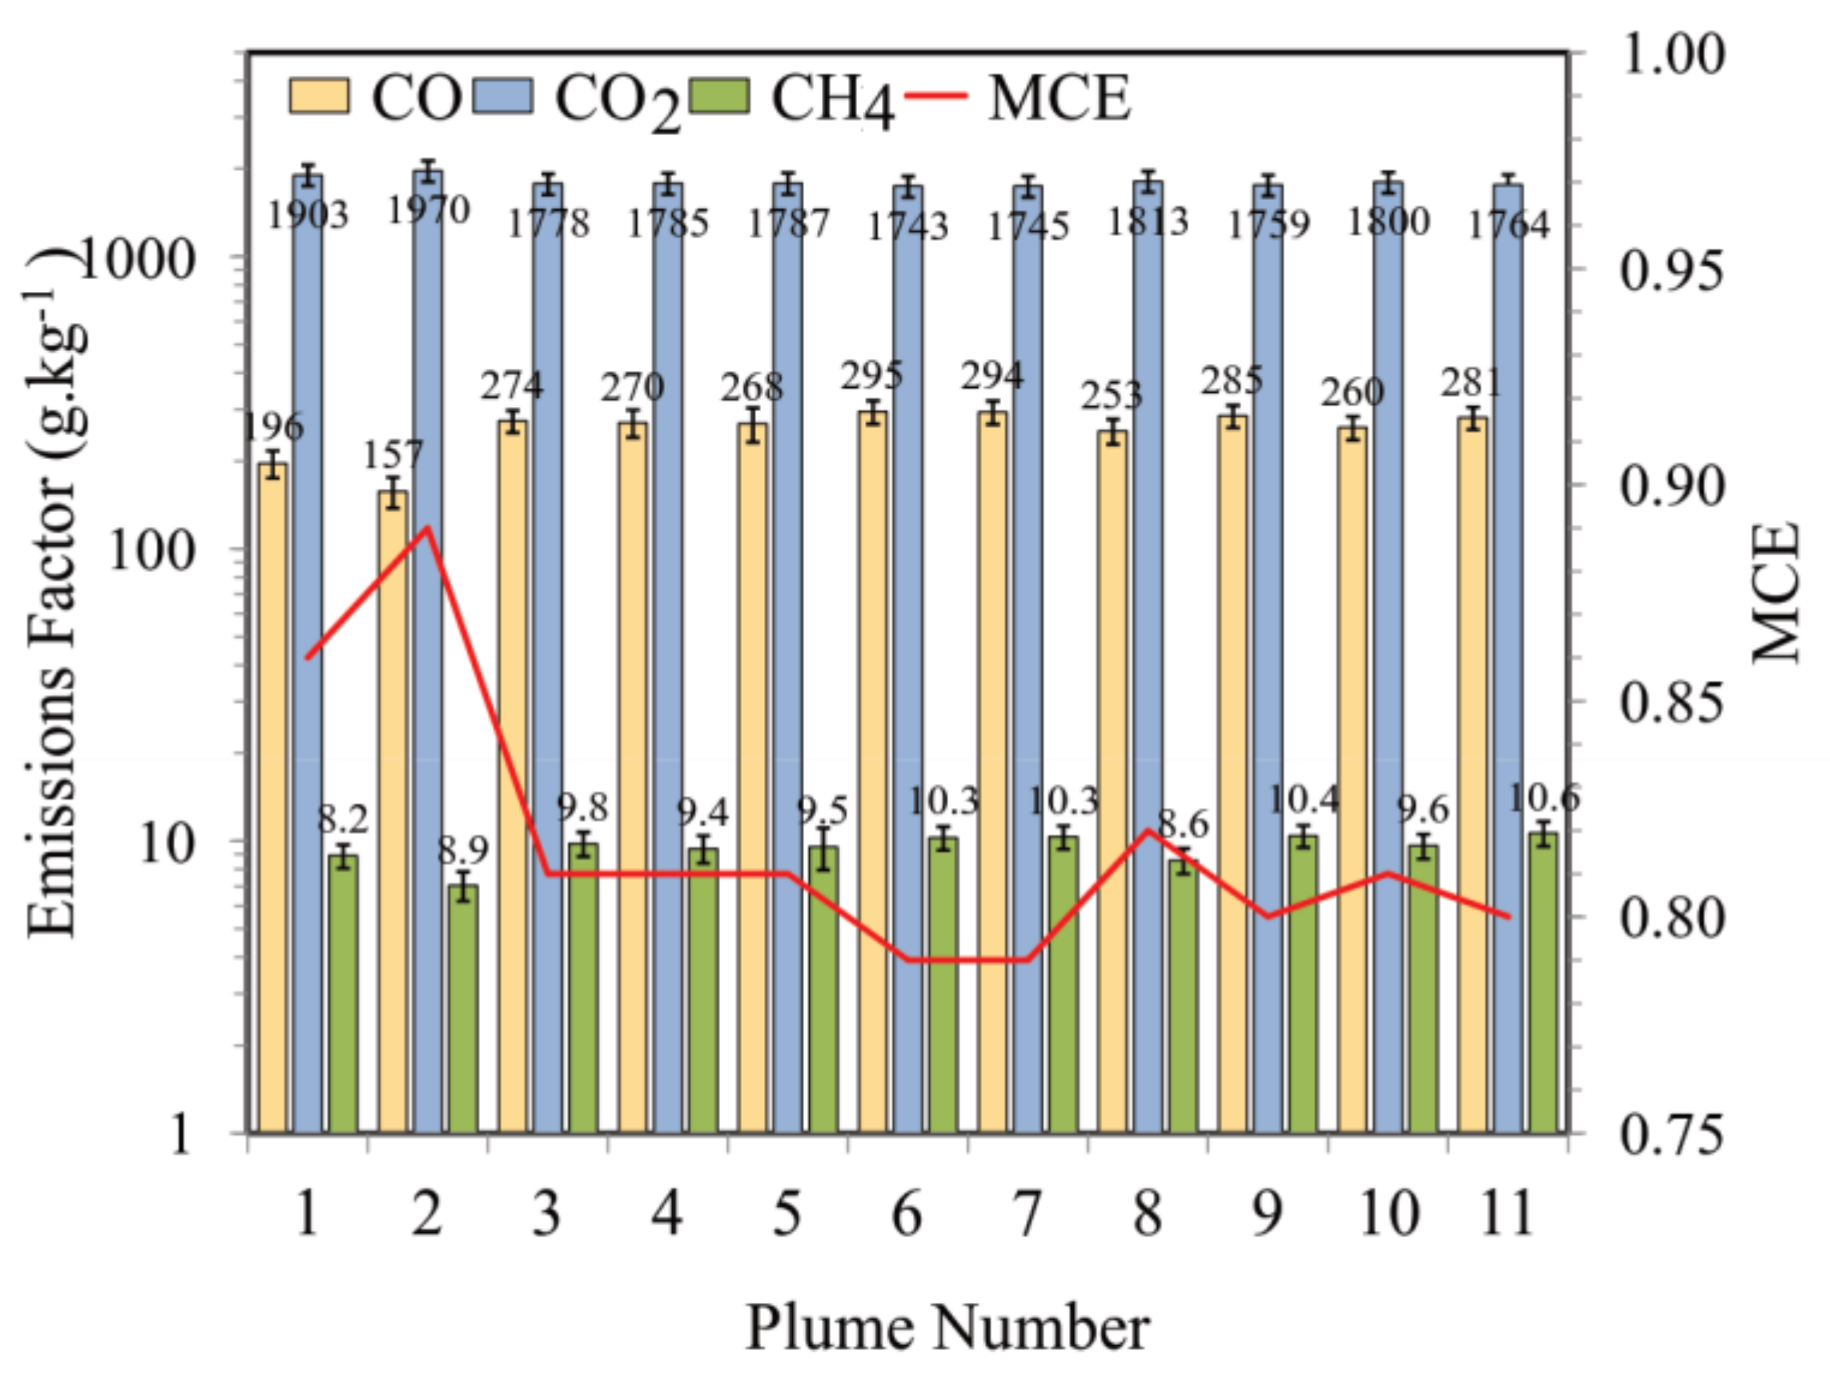
| Trace Gas Emissions Factors [g·kg−1] | Particulate Emissions Factors [g·kg−1] | |||||||
|---|---|---|---|---|---|---|---|---|
| Plume | CO2 | CO | CH4 | PM2.5 (with CO as Reference Species) | PM2.5 (CO2 as Reference) | BC (CO as Reference) | BC (CO2 as Reference) | |
| Location 1 | 1 | 1903 ± 157 | 196 ± 21 | 8.89 ± 0.83 | 33.92 ± 8.93 | 25.68 ± 4.40 | - | - |
| 2 | 1970 ± 163 | 157 ± 19 | 7.04 ± 0.81 | 28.40 ± 9.93 | 27.27 ± 4.67 | - | - | |
| 3 | 1778 ± 146 | 274 ± 24 | 9.80 ± 0.94 | 28.68 ± 5.14 | 16.33 ± 2.79 | - | - | |
| 4 | 1785 ± 148 | 270 ± 29 | 9.42 ± 1.02 | 24.47 ± 4.73 | 12.41 ± 2.13 | - | - | |
| 5 | 1787 ± 151 | 268 ± 36 | 9.53 ± 1.57 | 30.12 ± 8.93 | 18.53 ± 3.19 | - | - | |
| 6 | 1743 ± 143 | 295 ± 27 | 10.26 ± 0.94 | 34.62 ± 9.93 | 24.2 ± 4.14 | - | - | |
| 7 | 1745 ± 144 | 294 ± 27 | 10.34 ± 0.95 | 37.17 ± 6.27 | 27.94 ± 4.78 | - | - | |
| 8 | 1813 ± 150 | 253 ± 25 | 8.58 ± 0.85 | 30.27 ± 6.04 | 27.2 ± 4.74 | - | - | |
| 9 | 1759 ± 145 | 285 ± 25 | 10.41 ± 0.90 | 37.58 ± 6.44 | 36.79 ± 6.29 | - | - | |
| 10 | 1800 ± 148 | 260 ± 24 | 9.63 ± 0.94 | 29.97 ± 5.72 | 29.85 ± 5.11 | - | - | |
| 11 | 1764 ± 145 | 281 ± 25 | 10.63 ± 1.03 | 33.43 ± 5.83 | 31.99 ± 5.47 | - | - | |
| Mean EF ± 1σ [MCE = 0.82] | 1775 ± 24 | 275.6 ± 14.5 | 9.8 ± 0.6 | 31.8 ± 0.6 | 25.0 ± 7.9 | - | - | |
| OP-FTIR | ||||||||
| Flaming fire | 1793 ± 226 | 271 ± 34 | 6.39 ± 0.81 | |||||
| Smolder fire | 1764 ± 223 | 285 ± 36 | 8.60 ± 1.09 | |||||
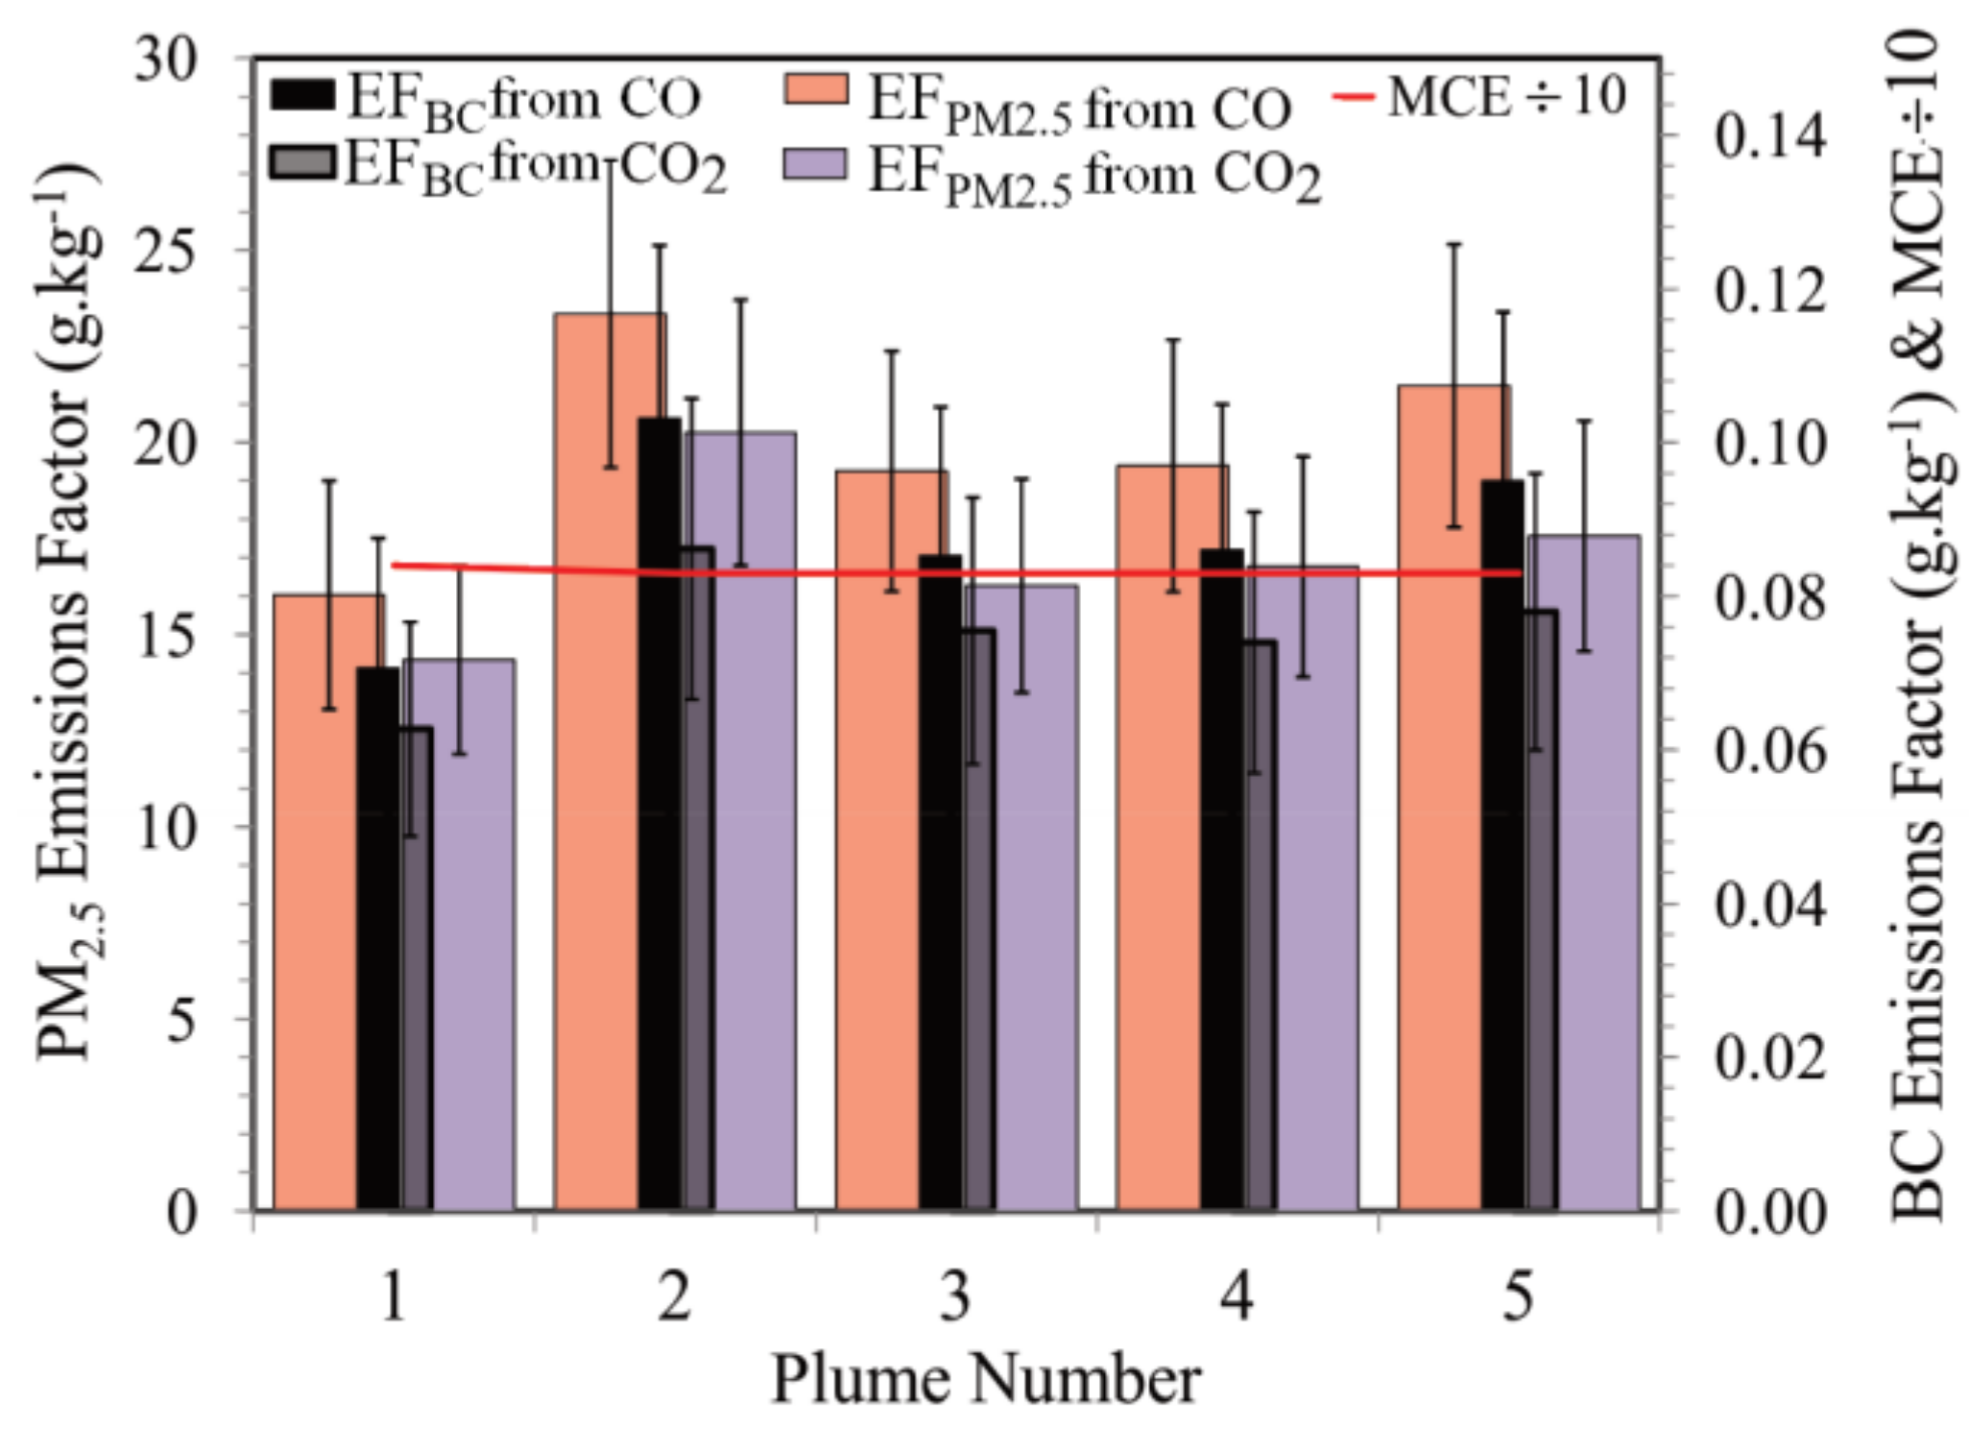
| Location 2 | 1 | 1868 ± 153 | 219 ± 19 | 8.16 ± 0.69 | 16.03 ± 2.97 | 14.35 ± 2.45 | 0.071 ± 0.017 | 0.063 ± 0.014 |
| 2 | 1835 ± 151 | 241 ± 23 | 7.97 ± 0.98 | 23.35 ± 4.00 | 20.26 ± 3.46 | 0.103 ± 0.023 | 0.086 ± 0.020 | |
| 3 | 1823 ± 150 | 245 ± 24 | 9.73 ± 0.89 | 19.26 ± 3.13 | 16.28 ± 2.79 | 0.085 ± 0.019 | 0.076 ± 0.017 | |
| 4 | 1832 ± 151 | 240 ± 22 | 9.86 ± 0.90 | 19.40 ± 3.28 | 16.77 ± 2.87 | 0.086 ± 0.019 | 0.074 ± 0.017 | |
| 5 | 1842 ± 151 | 237 ± 22 | 7.77 ± 0.69 | 21.48 ±3.68 | 17.57 ± 3.00 | 0.095 ± 0.022 | 0.078 ± 0.018 | |
| Mean EF ±1σ [MCE = 0.83] | 1840 ± 17 | 236.4 ± 10.1 | 8.68 ± 1.03 | 19.90 ± 2.74 | 17.04 ± 2.15 | 0.0880 ± 0.0121 | 0.0753 ± 0.0085 | |
| OP-FTIR | 1801 ± 216 | 264.2 ± 31.7 | 6.09 ± 0.72 | |||||
| Location 3 | 1 | 1911 ± 158 | 190 ± 29 | 9.68 ± 1.02 | 37.98 ± 7.20 | 46.94 ± 8.02 | 0.378 ± 0.096 | 0.492 ± 0.112 |
| 2 | 1928 ± 159 | 180 ± 18 | 8.52 ± 0.98 | 47.20 ± 9.60 | 55.30 ± 9.45 | 0.469 ± 0.121 | 0.562 ± 0.127 | |
| 3 | 1894 ± 156 | 201 ± 18 | 9.44 ± 0.89 | 47.78 ± 8.94 | 53.35 ± 9.12 | 0.475 ± 0.110 | 0.510 ± 0.116 | |
| 4 | 1845 ± 152 | 228 ± 21 | 11.27 ± 1.05 | 42.74 ± 6.88 | 45.69 ± 7.81 | 0.425 ± 0.094 | 0.458 ± 0.104 | |
| 5 | 1866 ± 154 | 218 ± 21 | 9.84 ± 1.09 | 43.71 ± 7.50 | 43.59 ± 7.28 | 0.435 ± 0.097 | 0.412 ± 0.994 | |
| Mean ± 1σ [MCE = 0.86] | 1889 ± 34 | 203.4 ± 19.7 | 9.73 ± 1.14 | 43.88 ± 3.95 | 50.32 ± 4.72 | 0.437 ± 0.045 | 0.487 ± 0.013 | |
| OP-FTIR | 1915 ± 214 | 192 ± 24 | 6.82 ± 0.86 | |||||
| Location 4 | 1 | 2141 ± 176 | 54 ± 6 | 3.46 ± 0.36 | - | - | - | - |
| 2 | 2092 ± 172 | 75 ± 7 | 9.14 ± 0.84 | 61.39 ± 10.99 | 48.71 ± 8.33 | 0.837 ± 0.196 | 0.665 ± 0.151 | |
| Mean EF ± 1σ [MCE = 0.95] | 2117 *2 ± 35 | 64.5 *2 ± 14.9 | 6.30 *2 ± 4.02 | 61.39 *2 ± 10.99 | 48.71 *2 ± 8.33 | 0.837 ± 0.196 | 0.665 ± 0.151 | |
| OP-FTIR | 2180 ± 275 | 21.94 ± 2.77 | 7.77 ± 0.98 | |||||
| Location 5 | 1 | 1763 ± 147 | 292 ± 31 | 5.07 ± 0.51 | 14.89 ± 2.65 | 11.56 ± 1.98 | 0.178 ± 0.043 | 0.142 ± 0.033 |
| 2 | 1697 ± 142 | 333 ± 34 | 5.60 ± 0.68 | 22.66 ± 3.56 | 19.95 ± 3.41 | 0.271 ± 0.059 | 0.238 ± 0.054 | |
| 3 | 1626 ± 144 | 378 ± 33 | 5.88 ± 0.52 | 24.20 ± 3.42 | 14.44 ± 2,47 | 0.289 ± 0.056 | 0.164 ± 0.037 | |
| 4 | 1717 ± 143 | 321 ± 33 | 5.36 ± 0.63 | 15.51 ± 2.51 | 12.15 ± 2.08 | 0.185 ± 0.041 | 0.147 ± 0.033 | |
| 5 | 1741 ± 143 | 307 ± 28 | 4.48 ± 0.47 | 5.89 ± 1.01 | 5.57 ± 0.95 | 0.070 ± 0.016 | 0.066 ± 0.015 | |
| 6 | 1699 ± 140 | 333 ± 28 | 4.83 ± 0.44 | 7.39 ± 1.16 | 5.07 ± 0.87 | 0.088 ± 0.019 | 0.061 ± 0.014 | |
| 7 | 1747 ± 145 | 302 ± 30 | 5.35 ± 0.52 | 14.78 ± 2.54 | 10.91 ± 1.87 | 0.177 ± 0.041 | 0.132 ± 0.032 | |
| Mean EF ± 1σ [MCE = 0.77] | 1713 ± 46 | 323.7 ± 28.5 | 5.22 ± 0.47 | 15.05 ± 6.88 | 11.38 ± 5.12 | 0.180 ± 0.082 | 0.136 ± 0.060 | |
| OP-FTIR | 1716 ± 214 | 321 ± 42 | 5.21 ± 65 | |||||
| Mean of all Locations *3 | 1866 ± 154 | 220.7 ± 98.2 | 8.0 ± 2.1 | 34.41 ± 18.77 | 30.19 ± 17.62 | 0.385 ± 0.336 | 0.341 ± 0.282 | |
| Mean of Close-to-Source “Peat Only” Fires (Locations. 1, 2 and 5) | 1775 ± 64 | 279 ± 44 | 7.9 ± 2.4 | 22.25 ± 8.63 | 17.82 ± 6.86 | 0.134 ± 0.065 | 0.106 ± 0.043 | |
| Trace Gas Emissions (Tg) | |||
|---|---|---|---|
| CO2 | CO | CH4 | |
| Top-down MOPITT and GFAS optimized, see [12] | 692 ± 213 | 84 ± 18 | 3.2 ± 1.2 |
| GFEDv4.1s | 786 | 97 | 9.6 |
| GFASv1.2 | 922 | 111 | 10.9 |
| Dry Matter Fuel Consumption (Tg) *1 | |||||
|---|---|---|---|---|---|
| Kalimantan | Sumatra | Total | |||
| Sept. | Oct. | Sept. | Oct. | September–October | |
| Derived herein, based on [12] and new in situ gaseous emissions factors | 100 | 122 | 54 | 82 | 358 |
| Values from [12], based on MOPITT CO and GFAS emissions and previous gaseous EFs | 108 | 132 | 58 | 89 | 387 |
| GFASv1.2 | 94 | 95 | 139 | 214 | 541 |
| GFEDv4.1s | 208 | 42 | 145 | 66 | 461 |
© 2018 by the authors. Licensee MDPI, Basel, Switzerland. This article is an open access article distributed under the terms and conditions of the Creative Commons Attribution (CC BY) license (http://creativecommons.org/licenses/by/4.0/).
Share and Cite
Wooster, M.J.; Gaveau, D.L.A.; Salim, M.A.; Zhang, T.; Xu, W.; Green, D.C.; Huijnen, V.; Murdiyarso, D.; Gunawan, D.; Borchard, N.; et al. New Tropical Peatland Gas and Particulate Emissions Factors Indicate 2015 Indonesian Fires Released Far More Particulate Matter (but Less Methane) than Current Inventories Imply. Remote Sens. 2018, 10, 495. https://doi.org/10.3390/rs10040495
Wooster MJ, Gaveau DLA, Salim MA, Zhang T, Xu W, Green DC, Huijnen V, Murdiyarso D, Gunawan D, Borchard N, et al. New Tropical Peatland Gas and Particulate Emissions Factors Indicate 2015 Indonesian Fires Released Far More Particulate Matter (but Less Methane) than Current Inventories Imply. Remote Sensing. 2018; 10(4):495. https://doi.org/10.3390/rs10040495
Chicago/Turabian StyleWooster, Martin J., David. L. A. Gaveau, Mohammad A. Salim, Tianran Zhang, Weidong Xu, David C. Green, Vincent Huijnen, Daniel Murdiyarso, Dodo Gunawan, Nils Borchard, and et al. 2018. "New Tropical Peatland Gas and Particulate Emissions Factors Indicate 2015 Indonesian Fires Released Far More Particulate Matter (but Less Methane) than Current Inventories Imply" Remote Sensing 10, no. 4: 495. https://doi.org/10.3390/rs10040495
APA StyleWooster, M. J., Gaveau, D. L. A., Salim, M. A., Zhang, T., Xu, W., Green, D. C., Huijnen, V., Murdiyarso, D., Gunawan, D., Borchard, N., Schirrmann, M., Main, B., & Sepriando, A. (2018). New Tropical Peatland Gas and Particulate Emissions Factors Indicate 2015 Indonesian Fires Released Far More Particulate Matter (but Less Methane) than Current Inventories Imply. Remote Sensing, 10(4), 495. https://doi.org/10.3390/rs10040495


