Permafrost Presence/Absence Mapping of the Qinghai-Tibet Plateau Based on Multi-Source Remote Sensing Data

Abstract
:1. Introduction
2. Regional Conditions
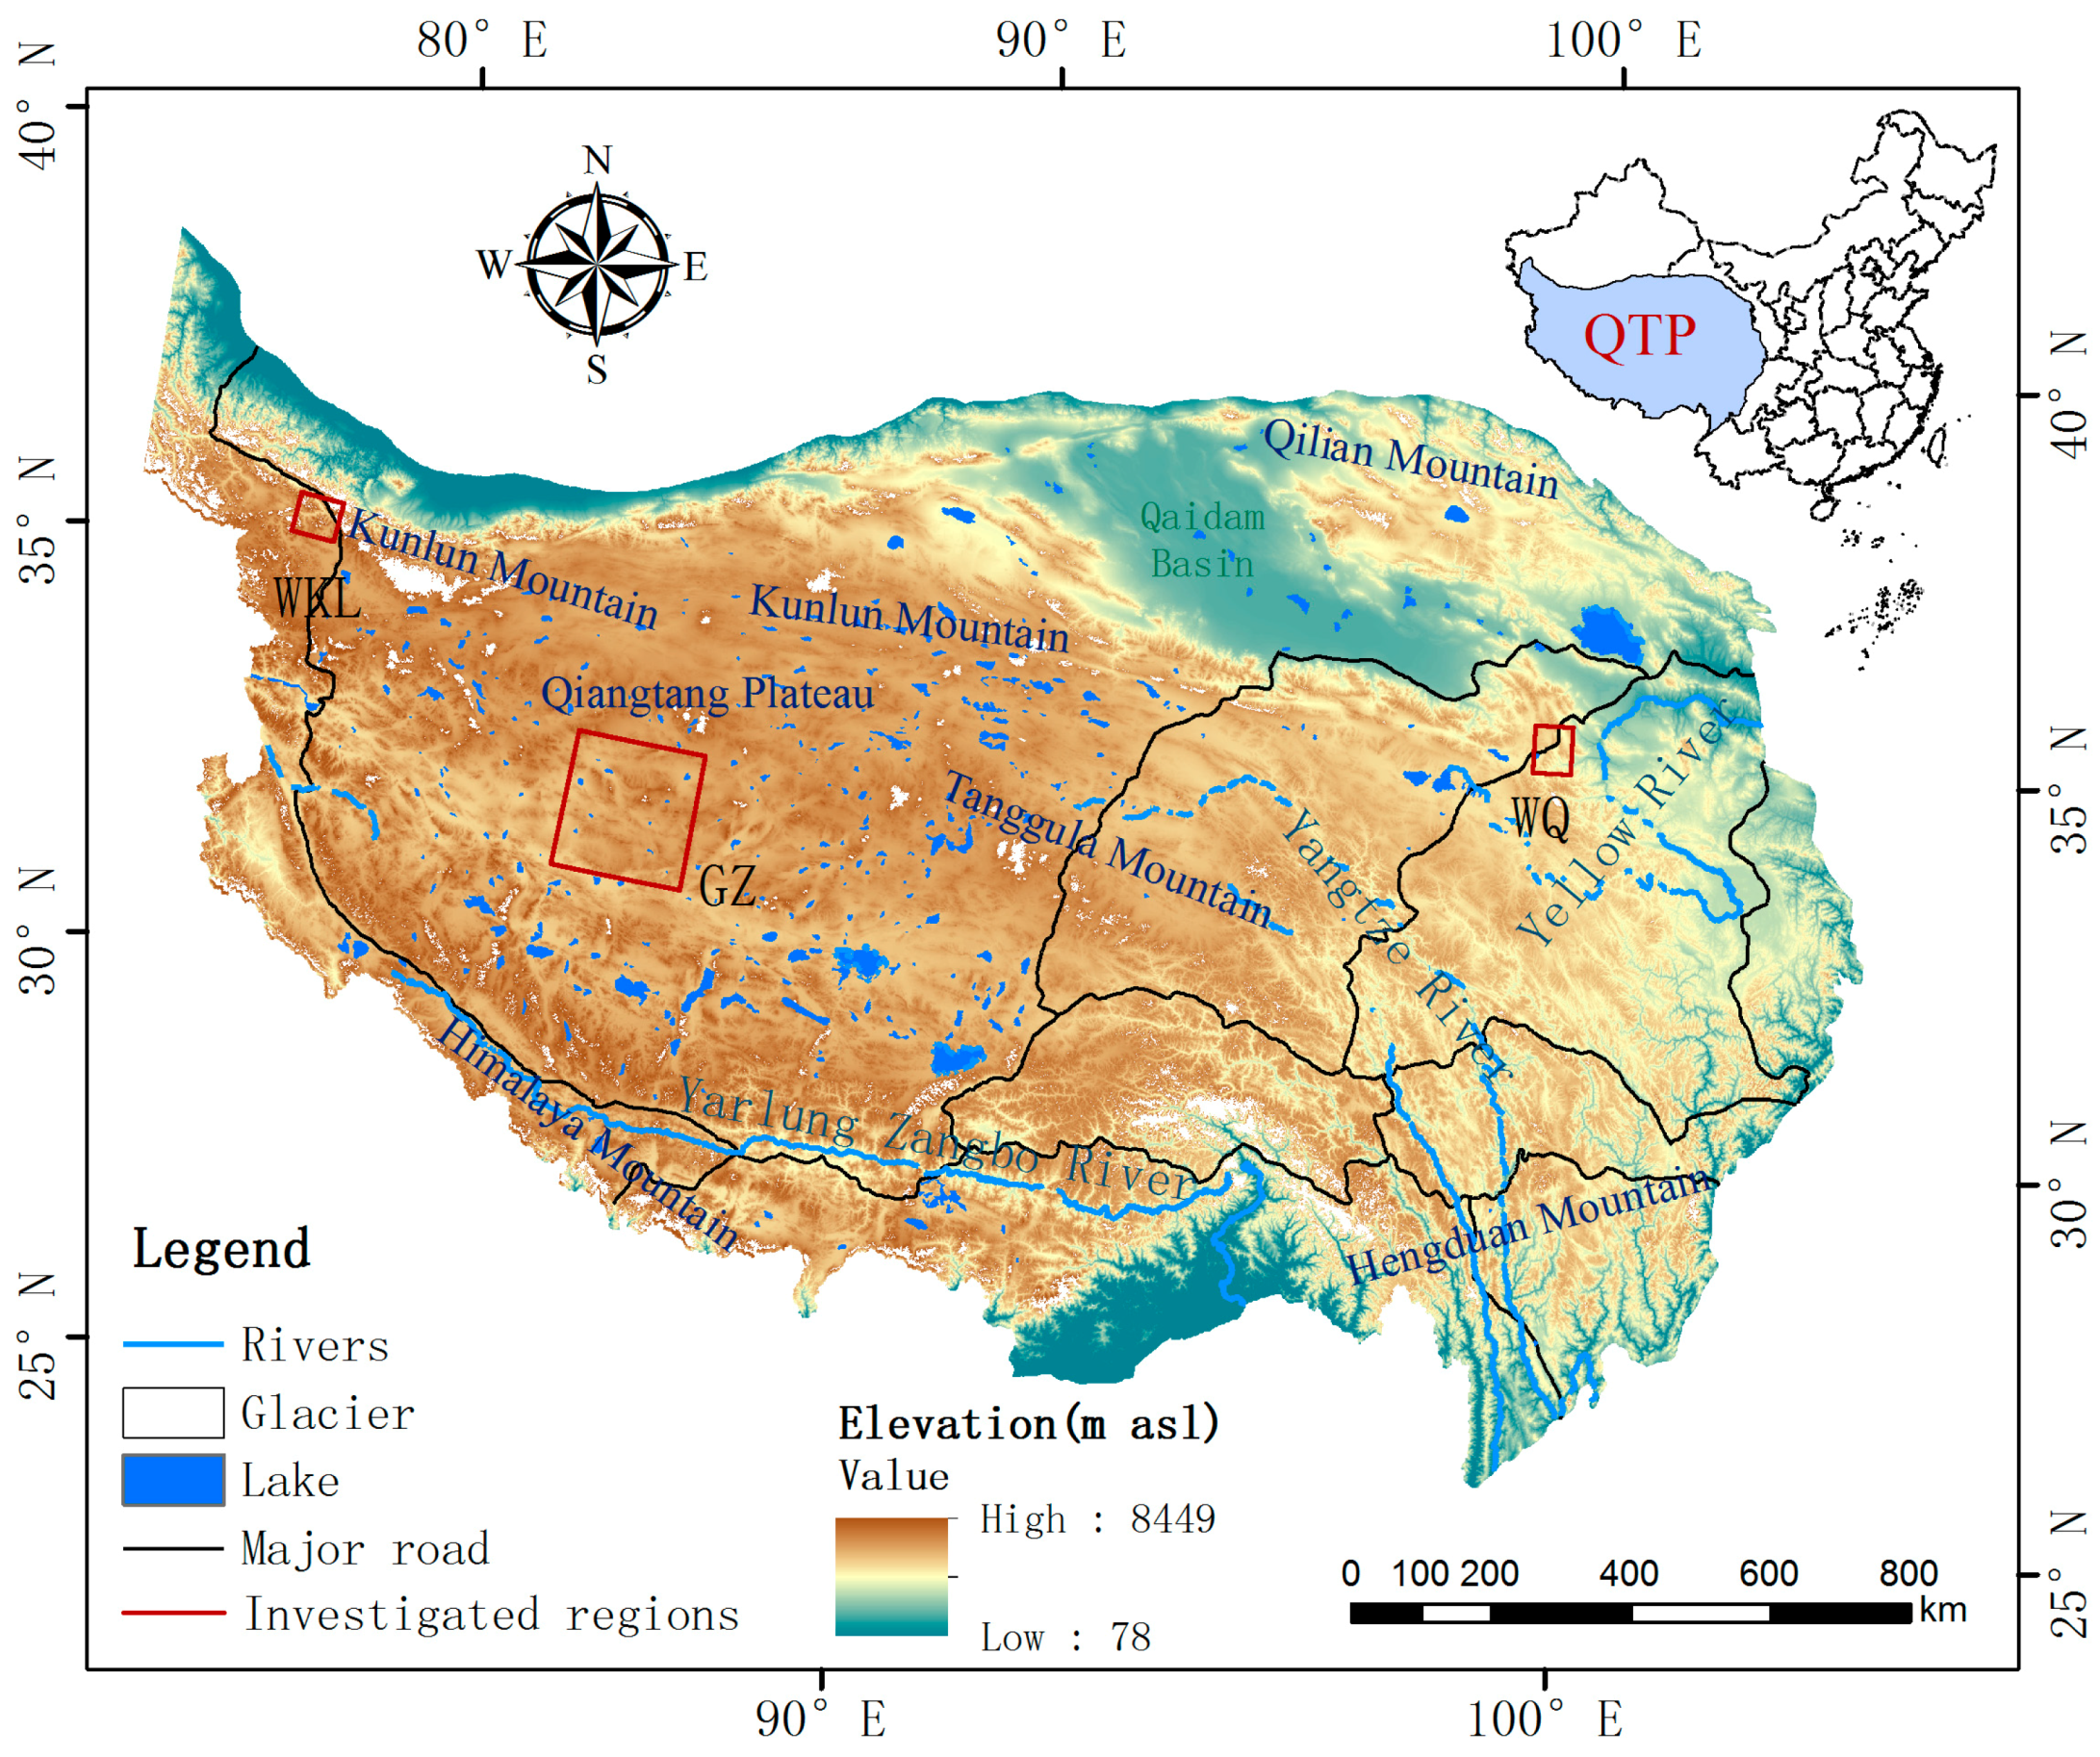
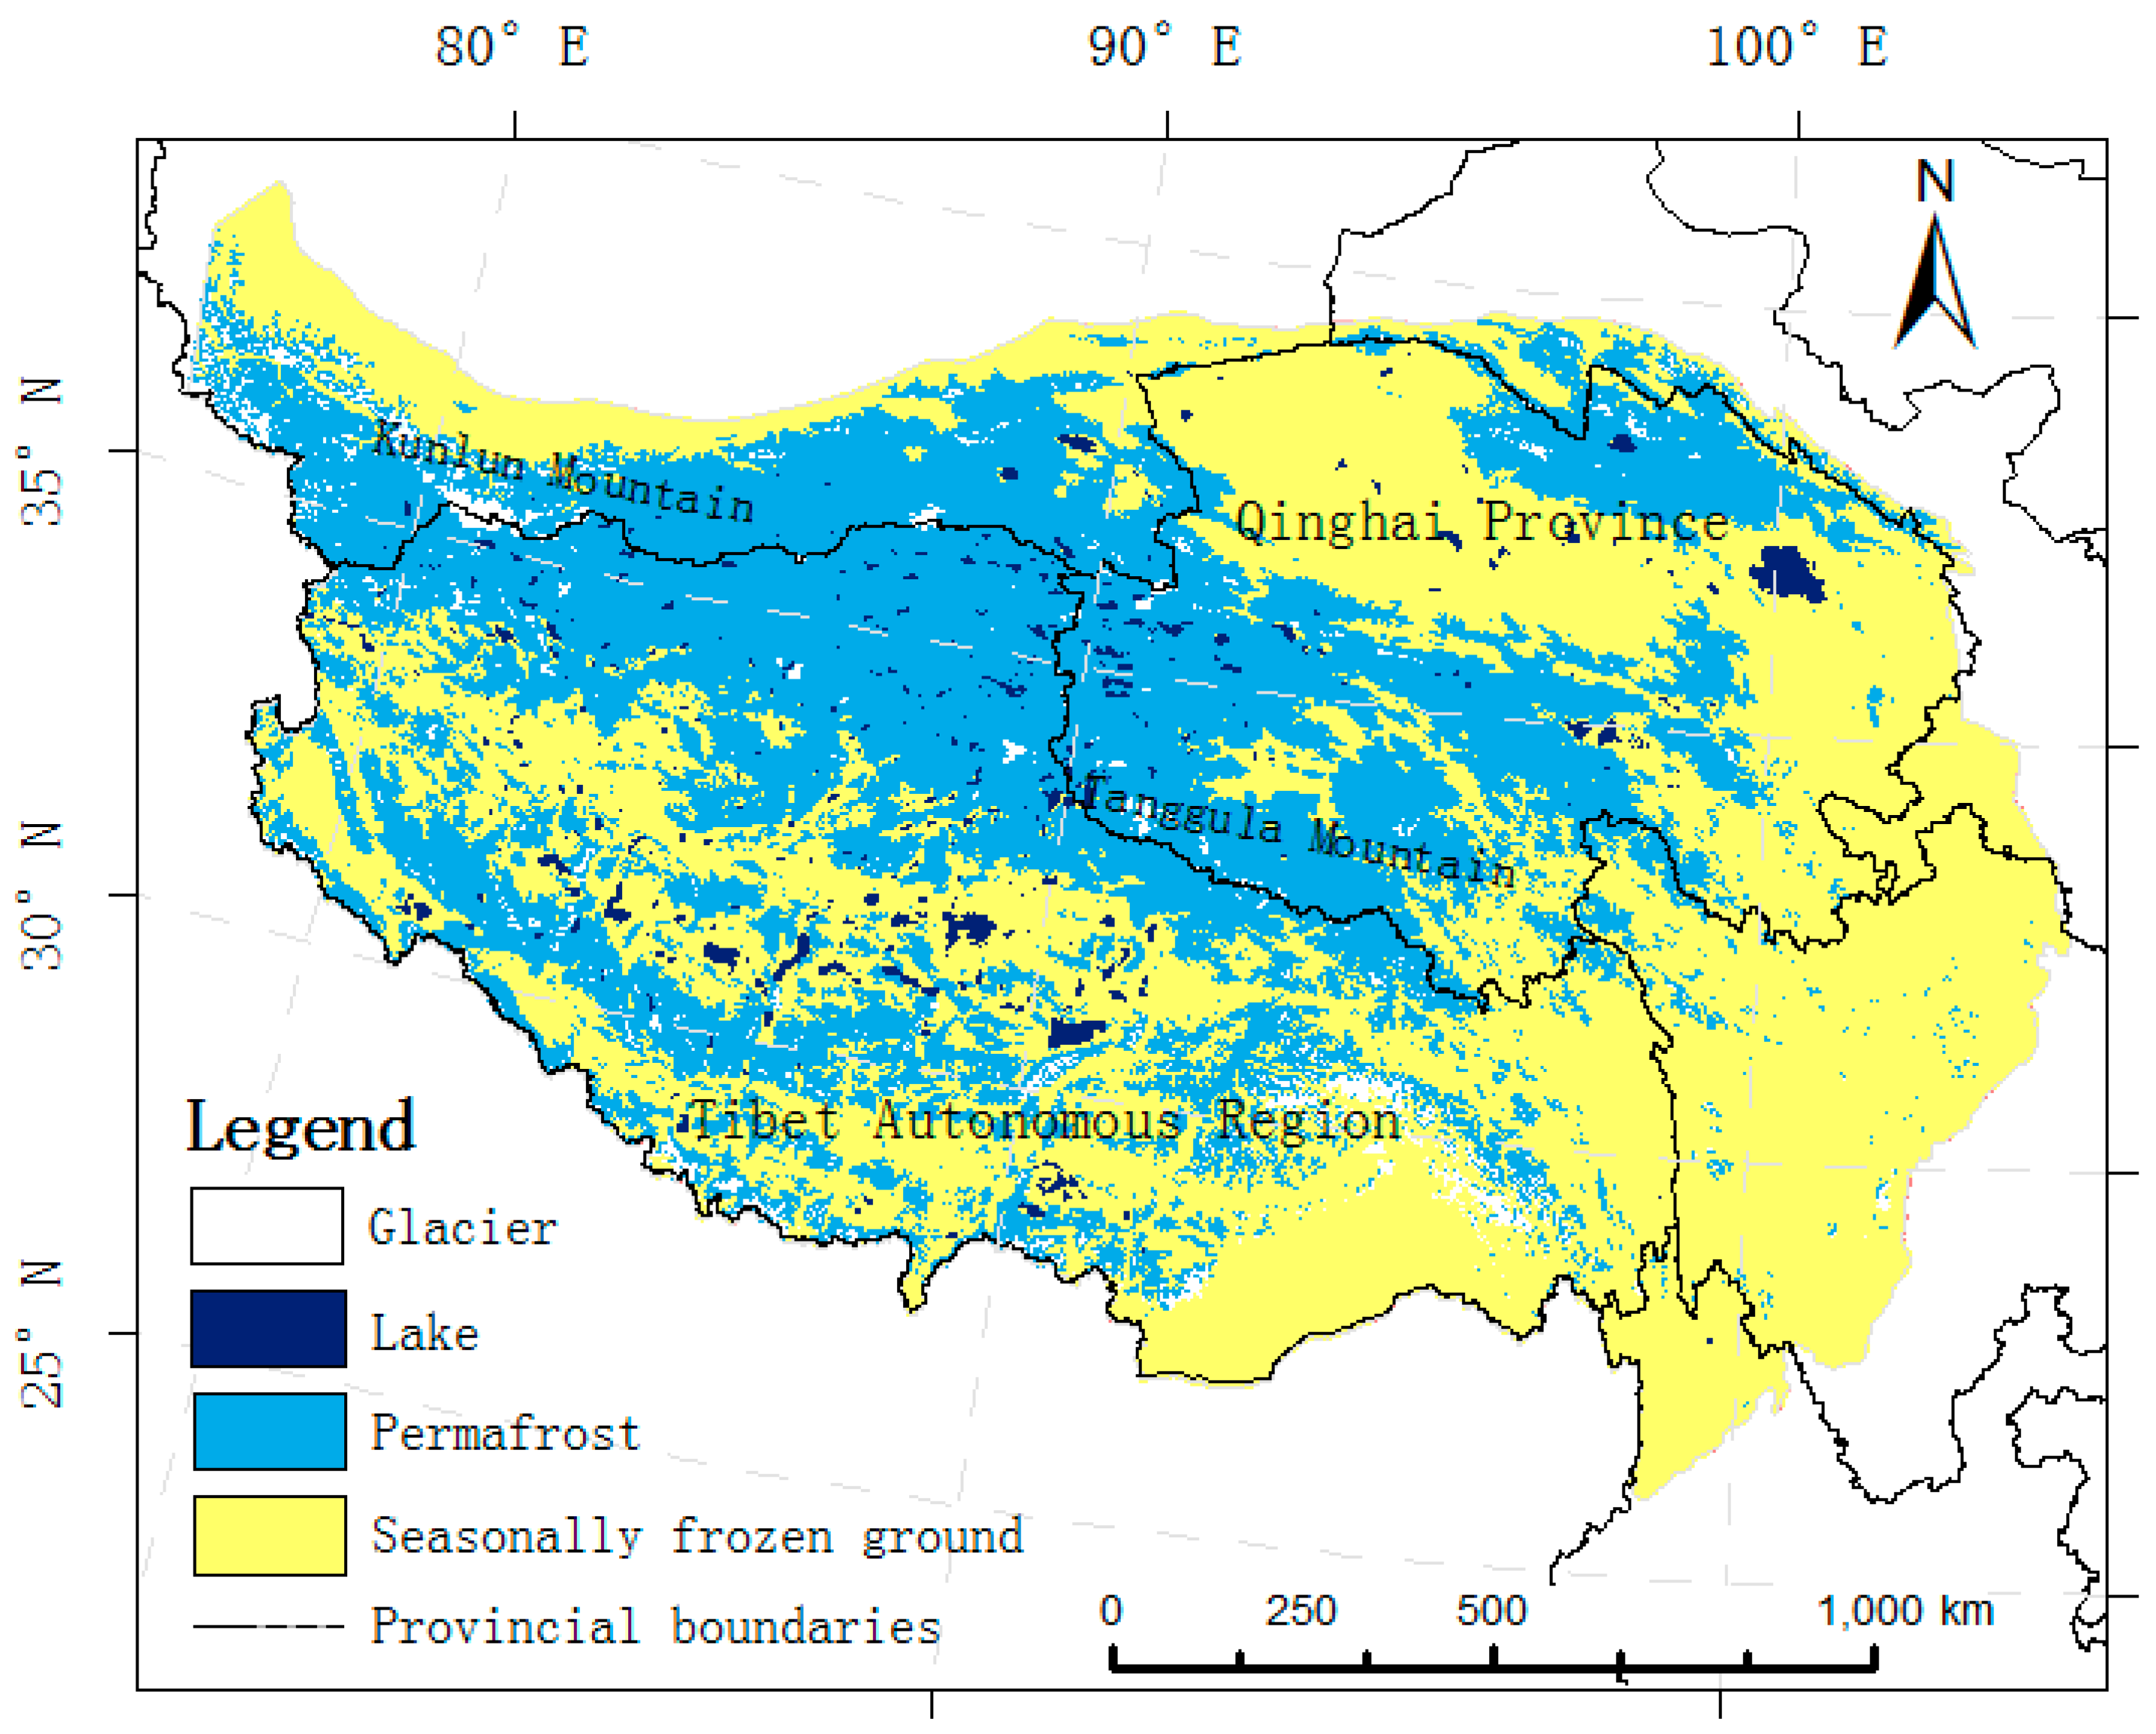
2.1. Study Area
2.2. Investigated Regions and Its Permafrost Maps
2.3. Spatial Datasets
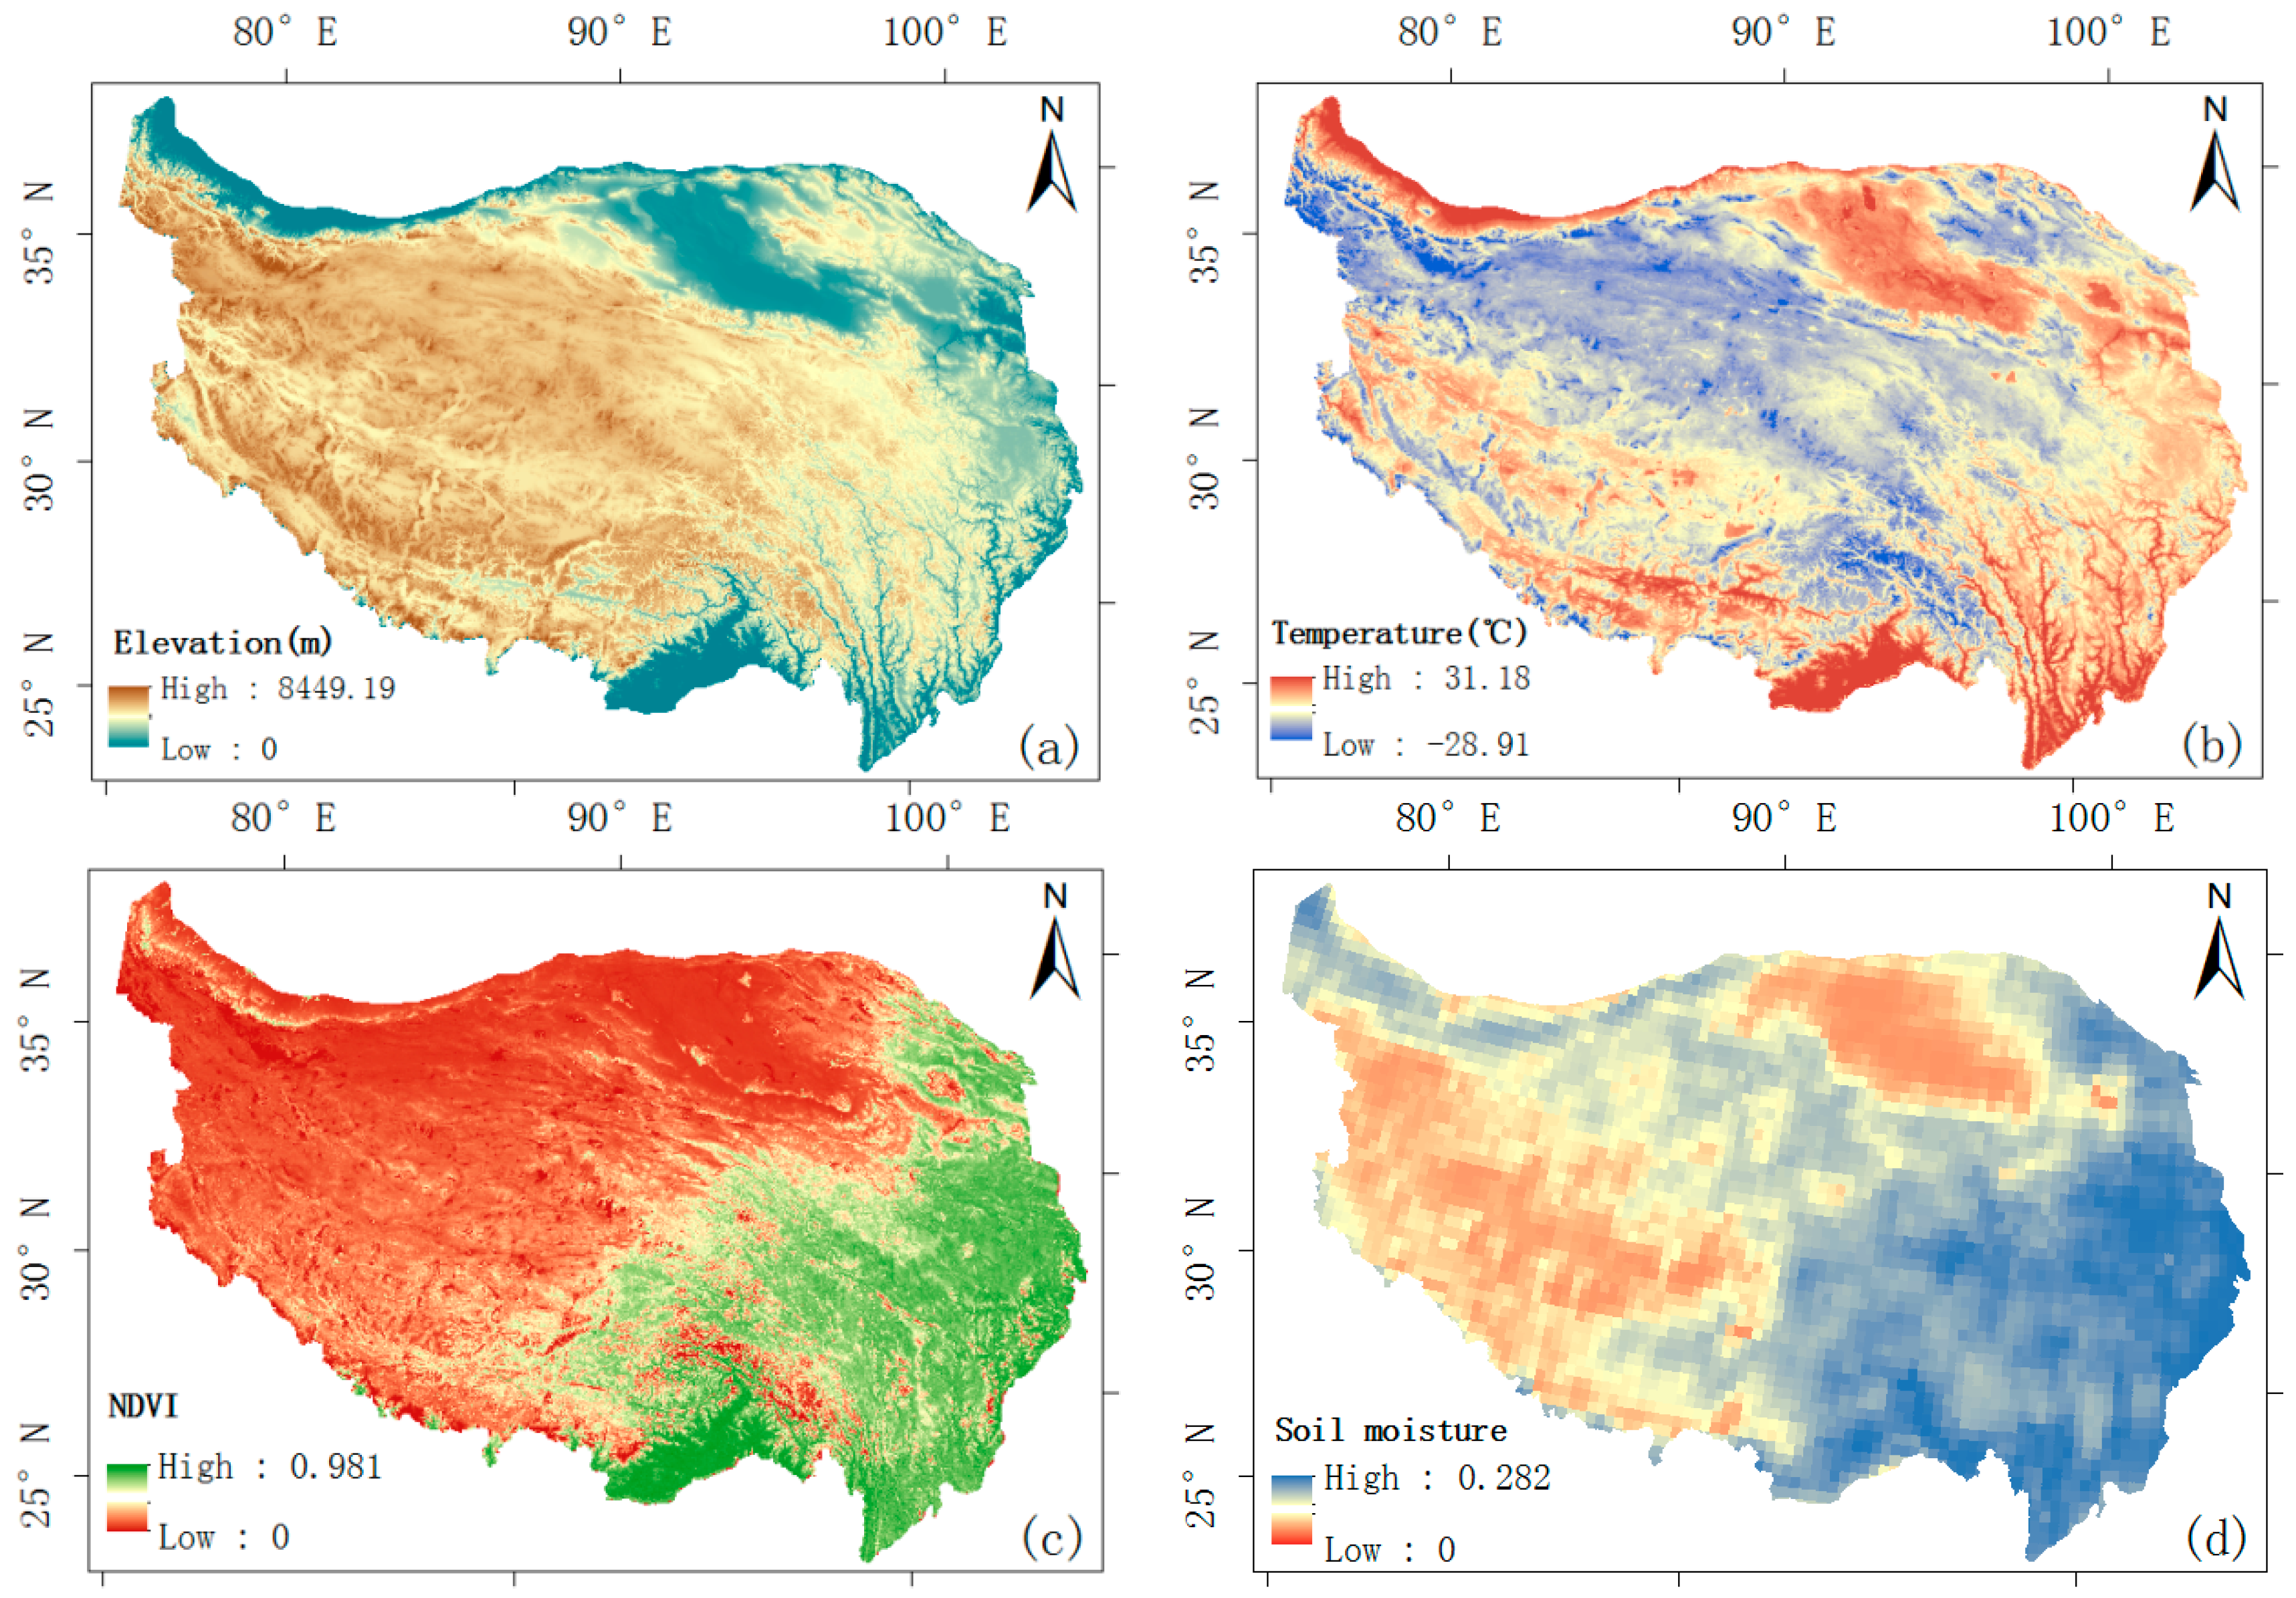
2.3.1. Elevation
2.3.2. MODIS LST Products
2.3.3. NDVI
2.3.4. Soil Moisture
3. Methods
3.1. Decision Tree Establishment Process
3.1.1. Classification Threshold Value
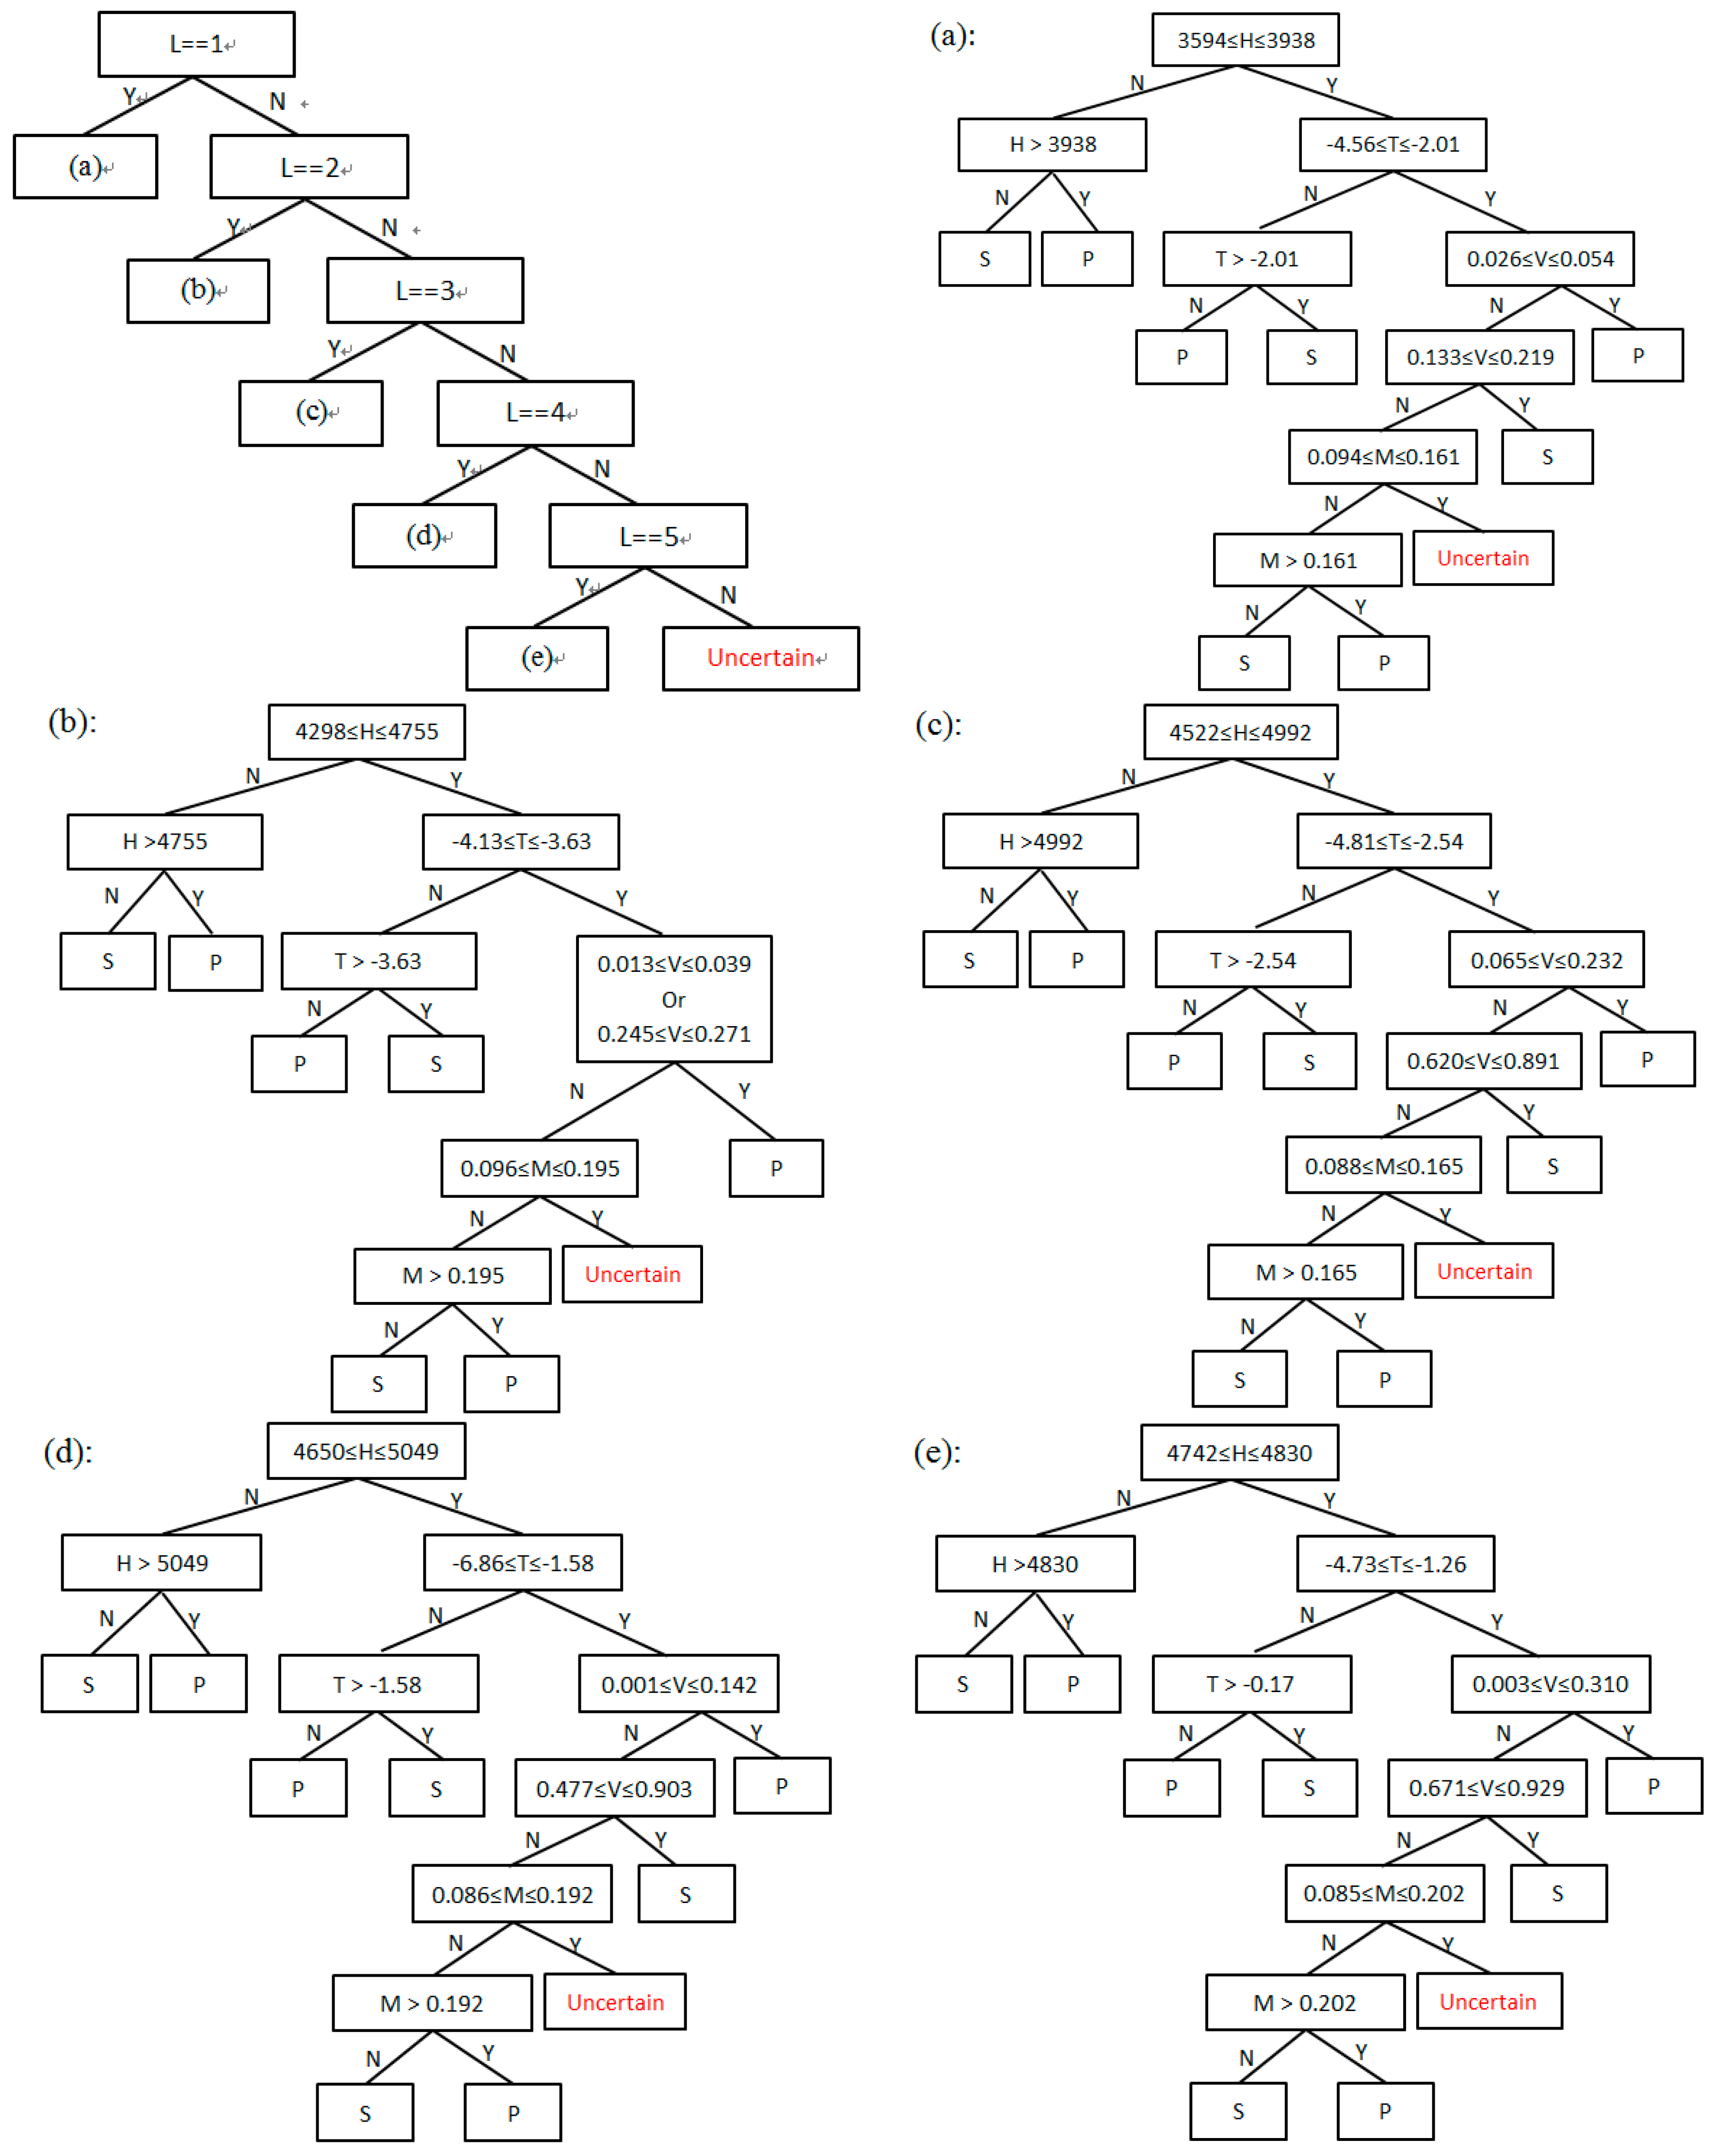
3.1.2. Classification Decision Tree
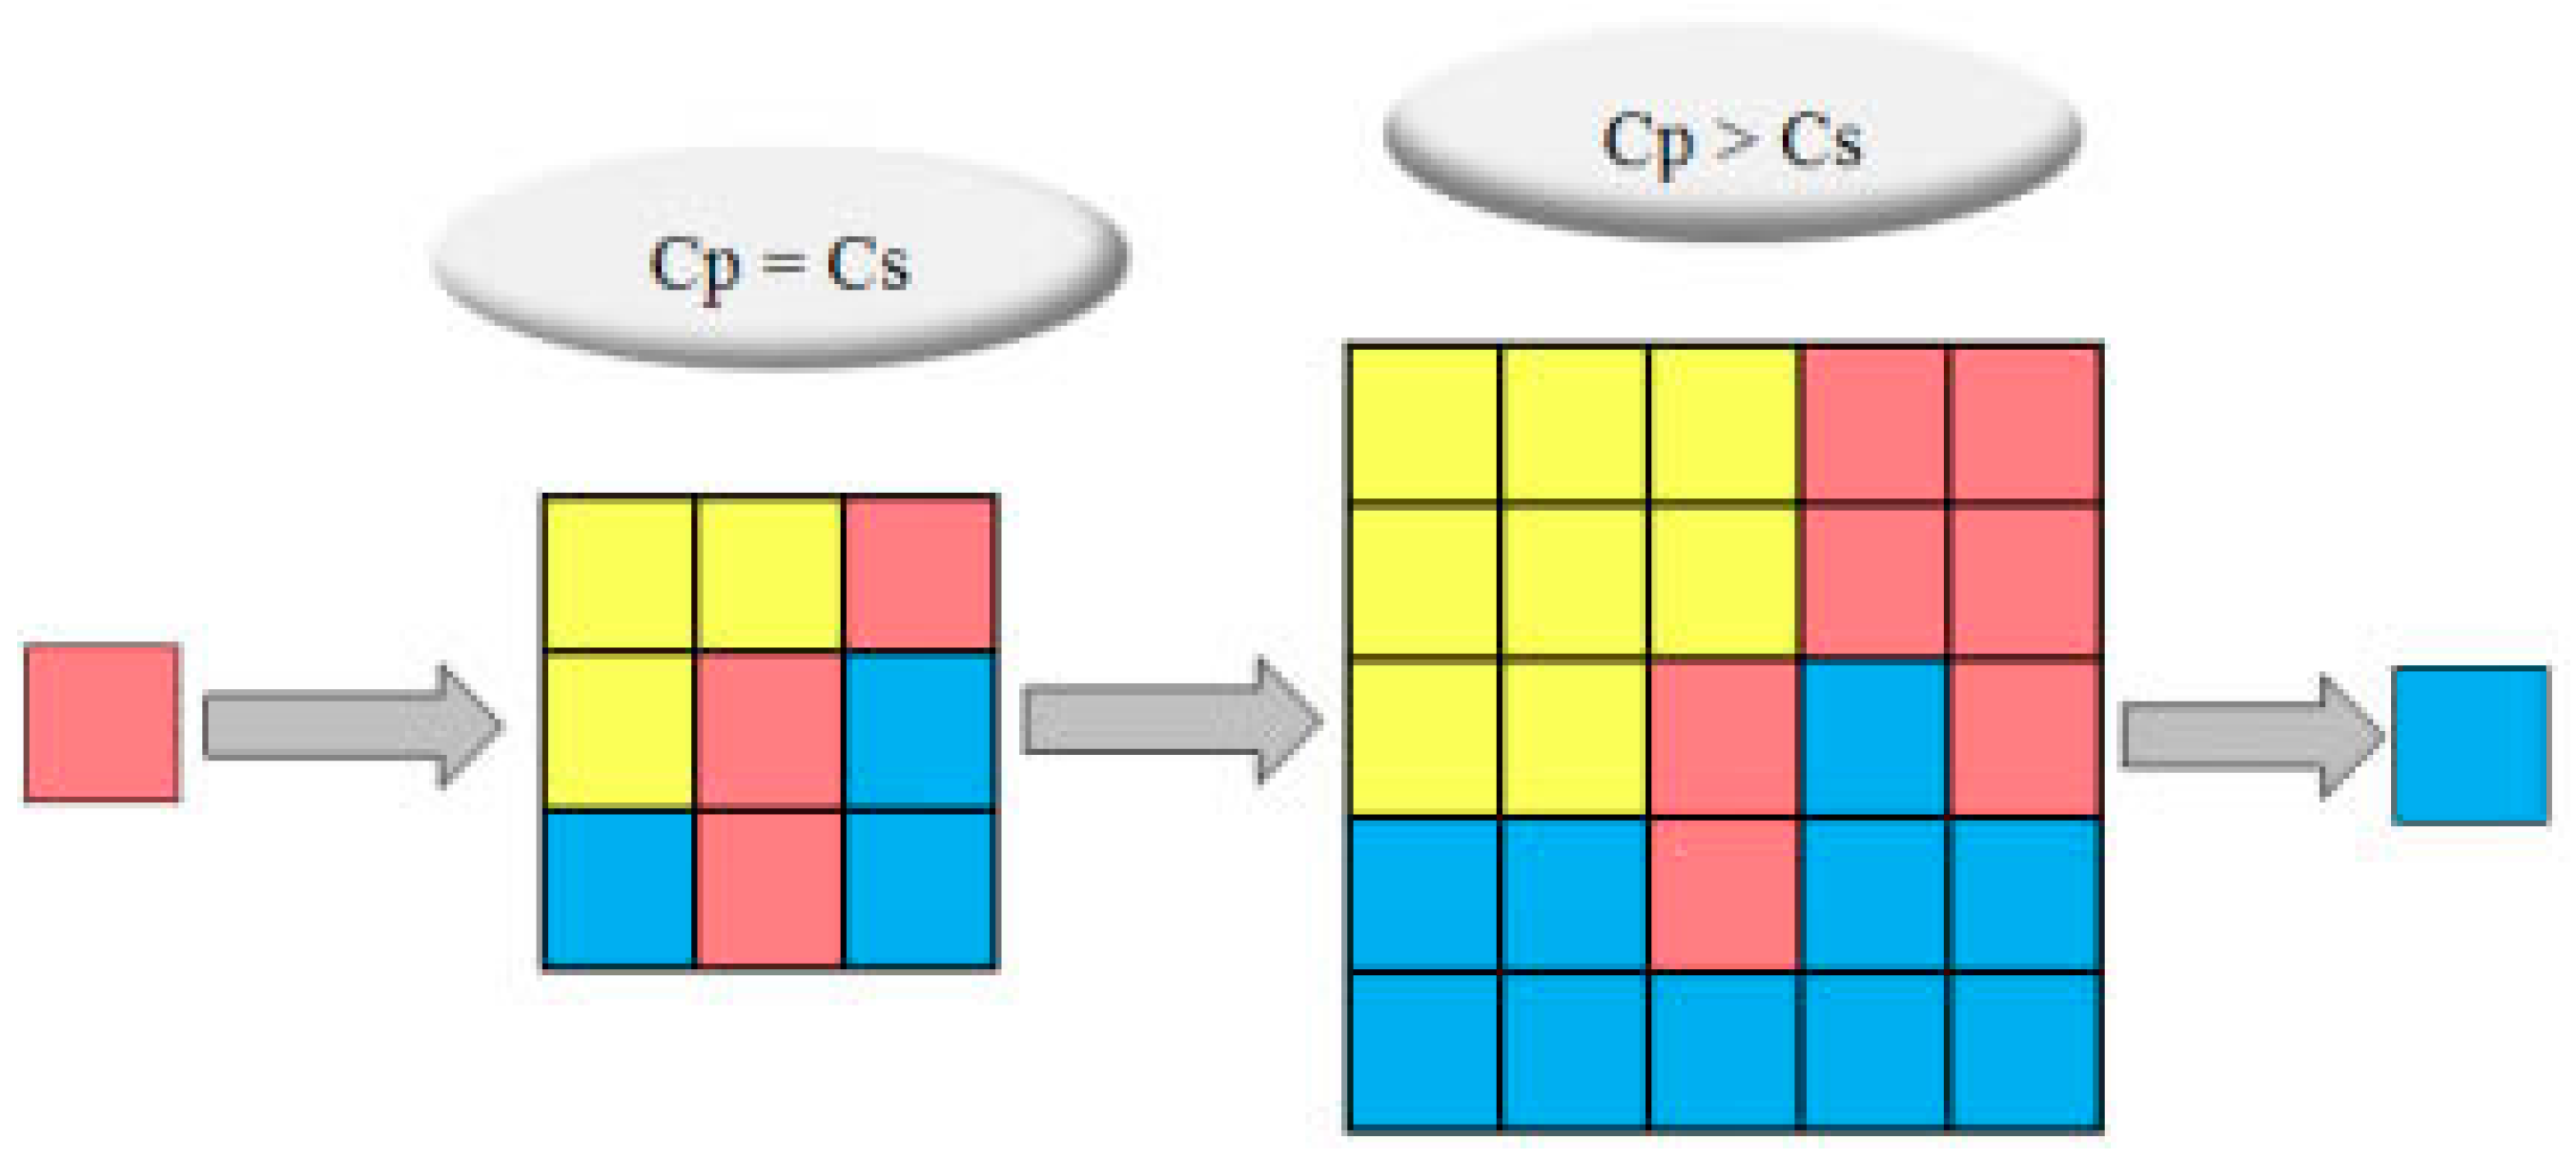
3.2. Post Classification Processing
3.3. Accuracy Evaluation Method
4. Results
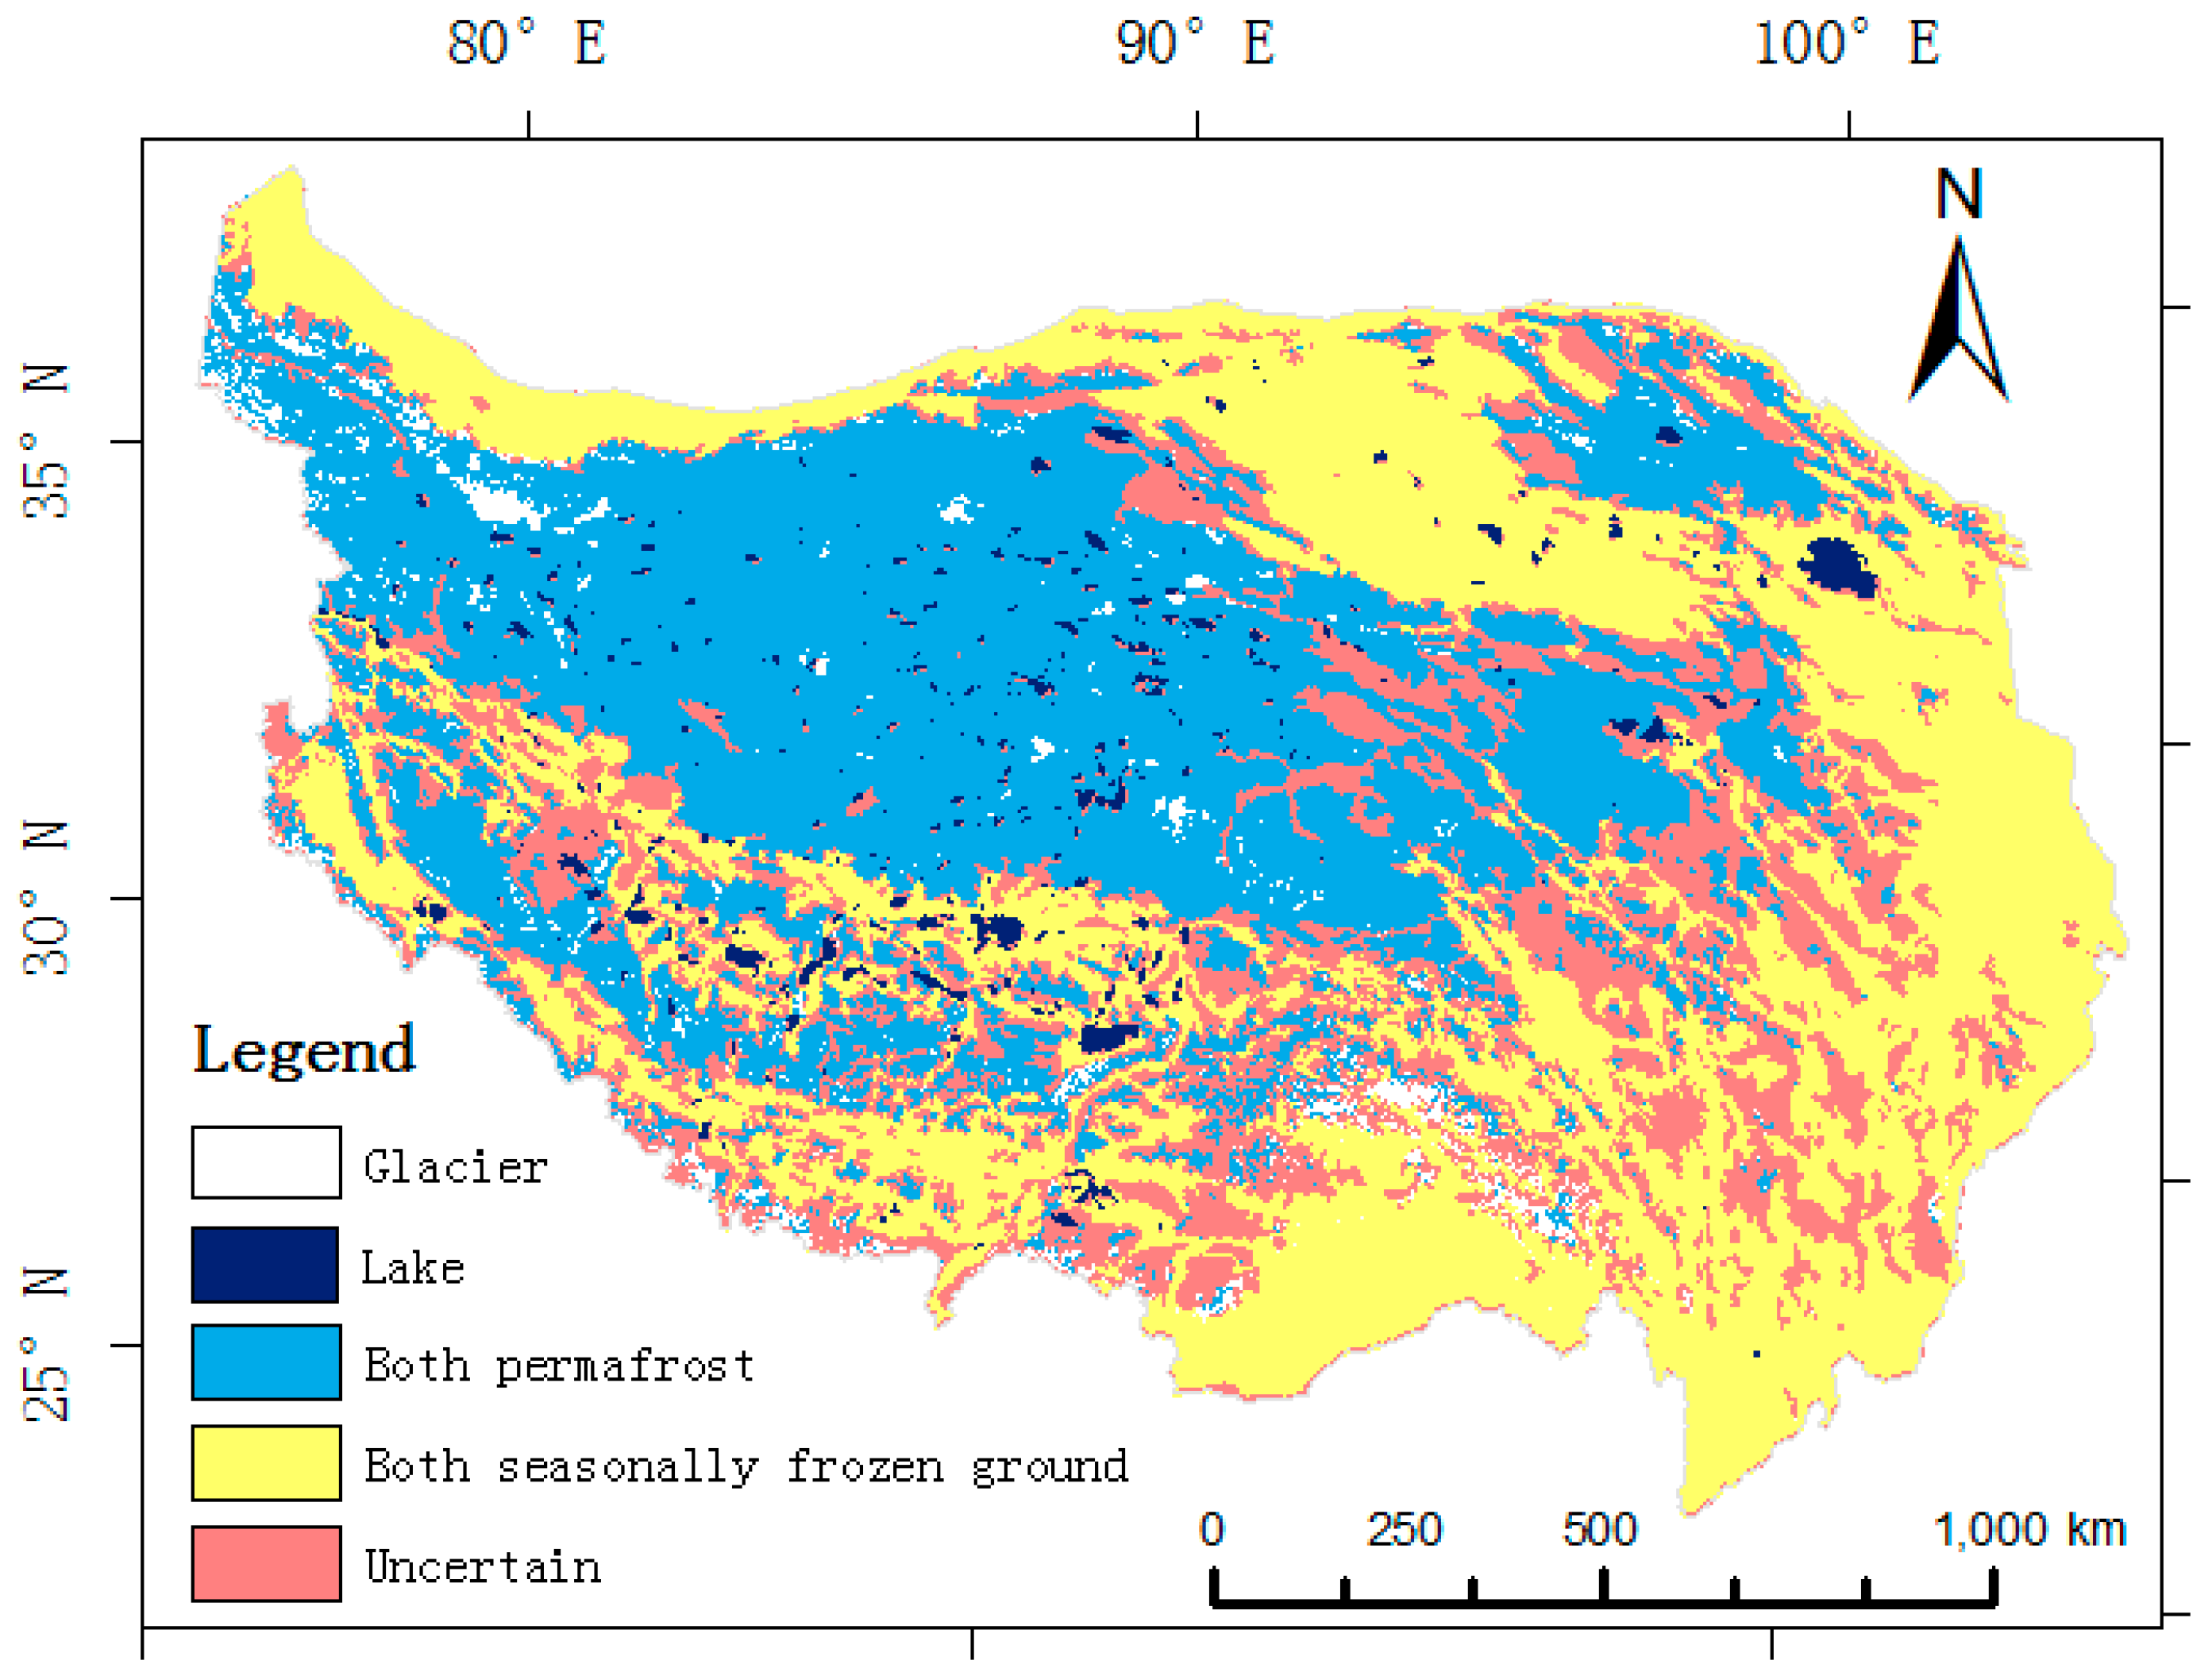
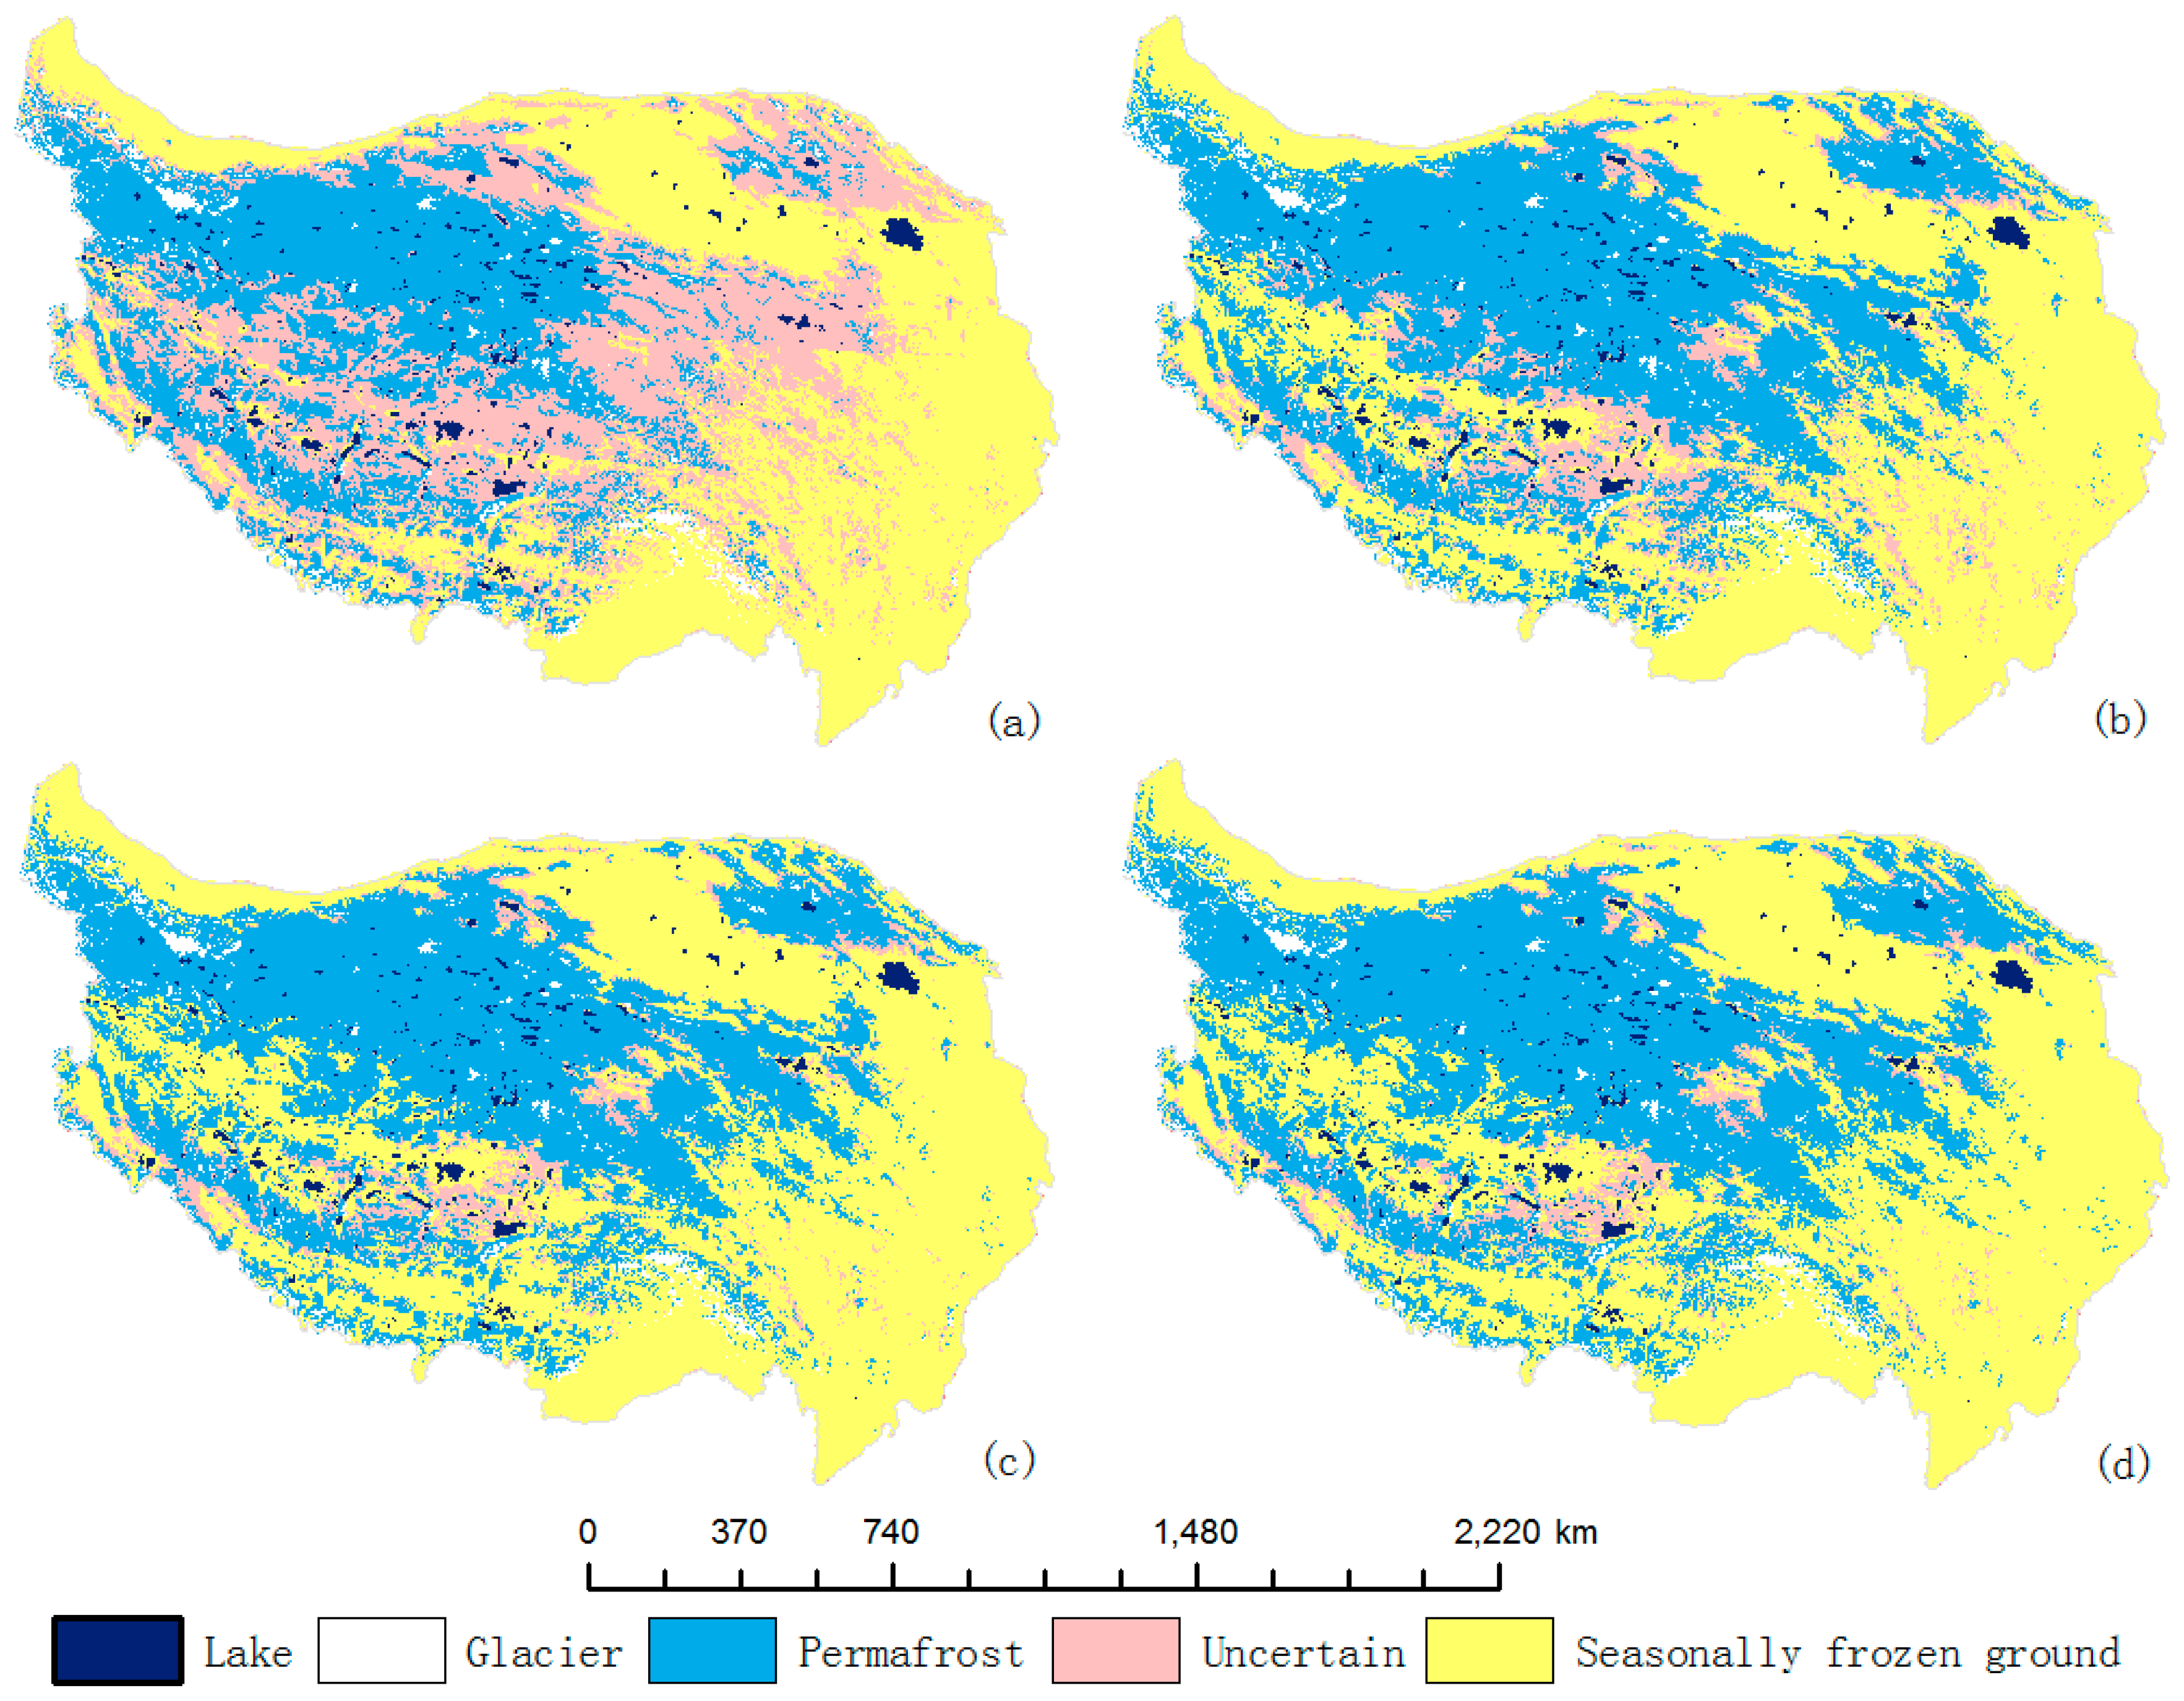
4.1. Mapping Result Based on Decision Tree
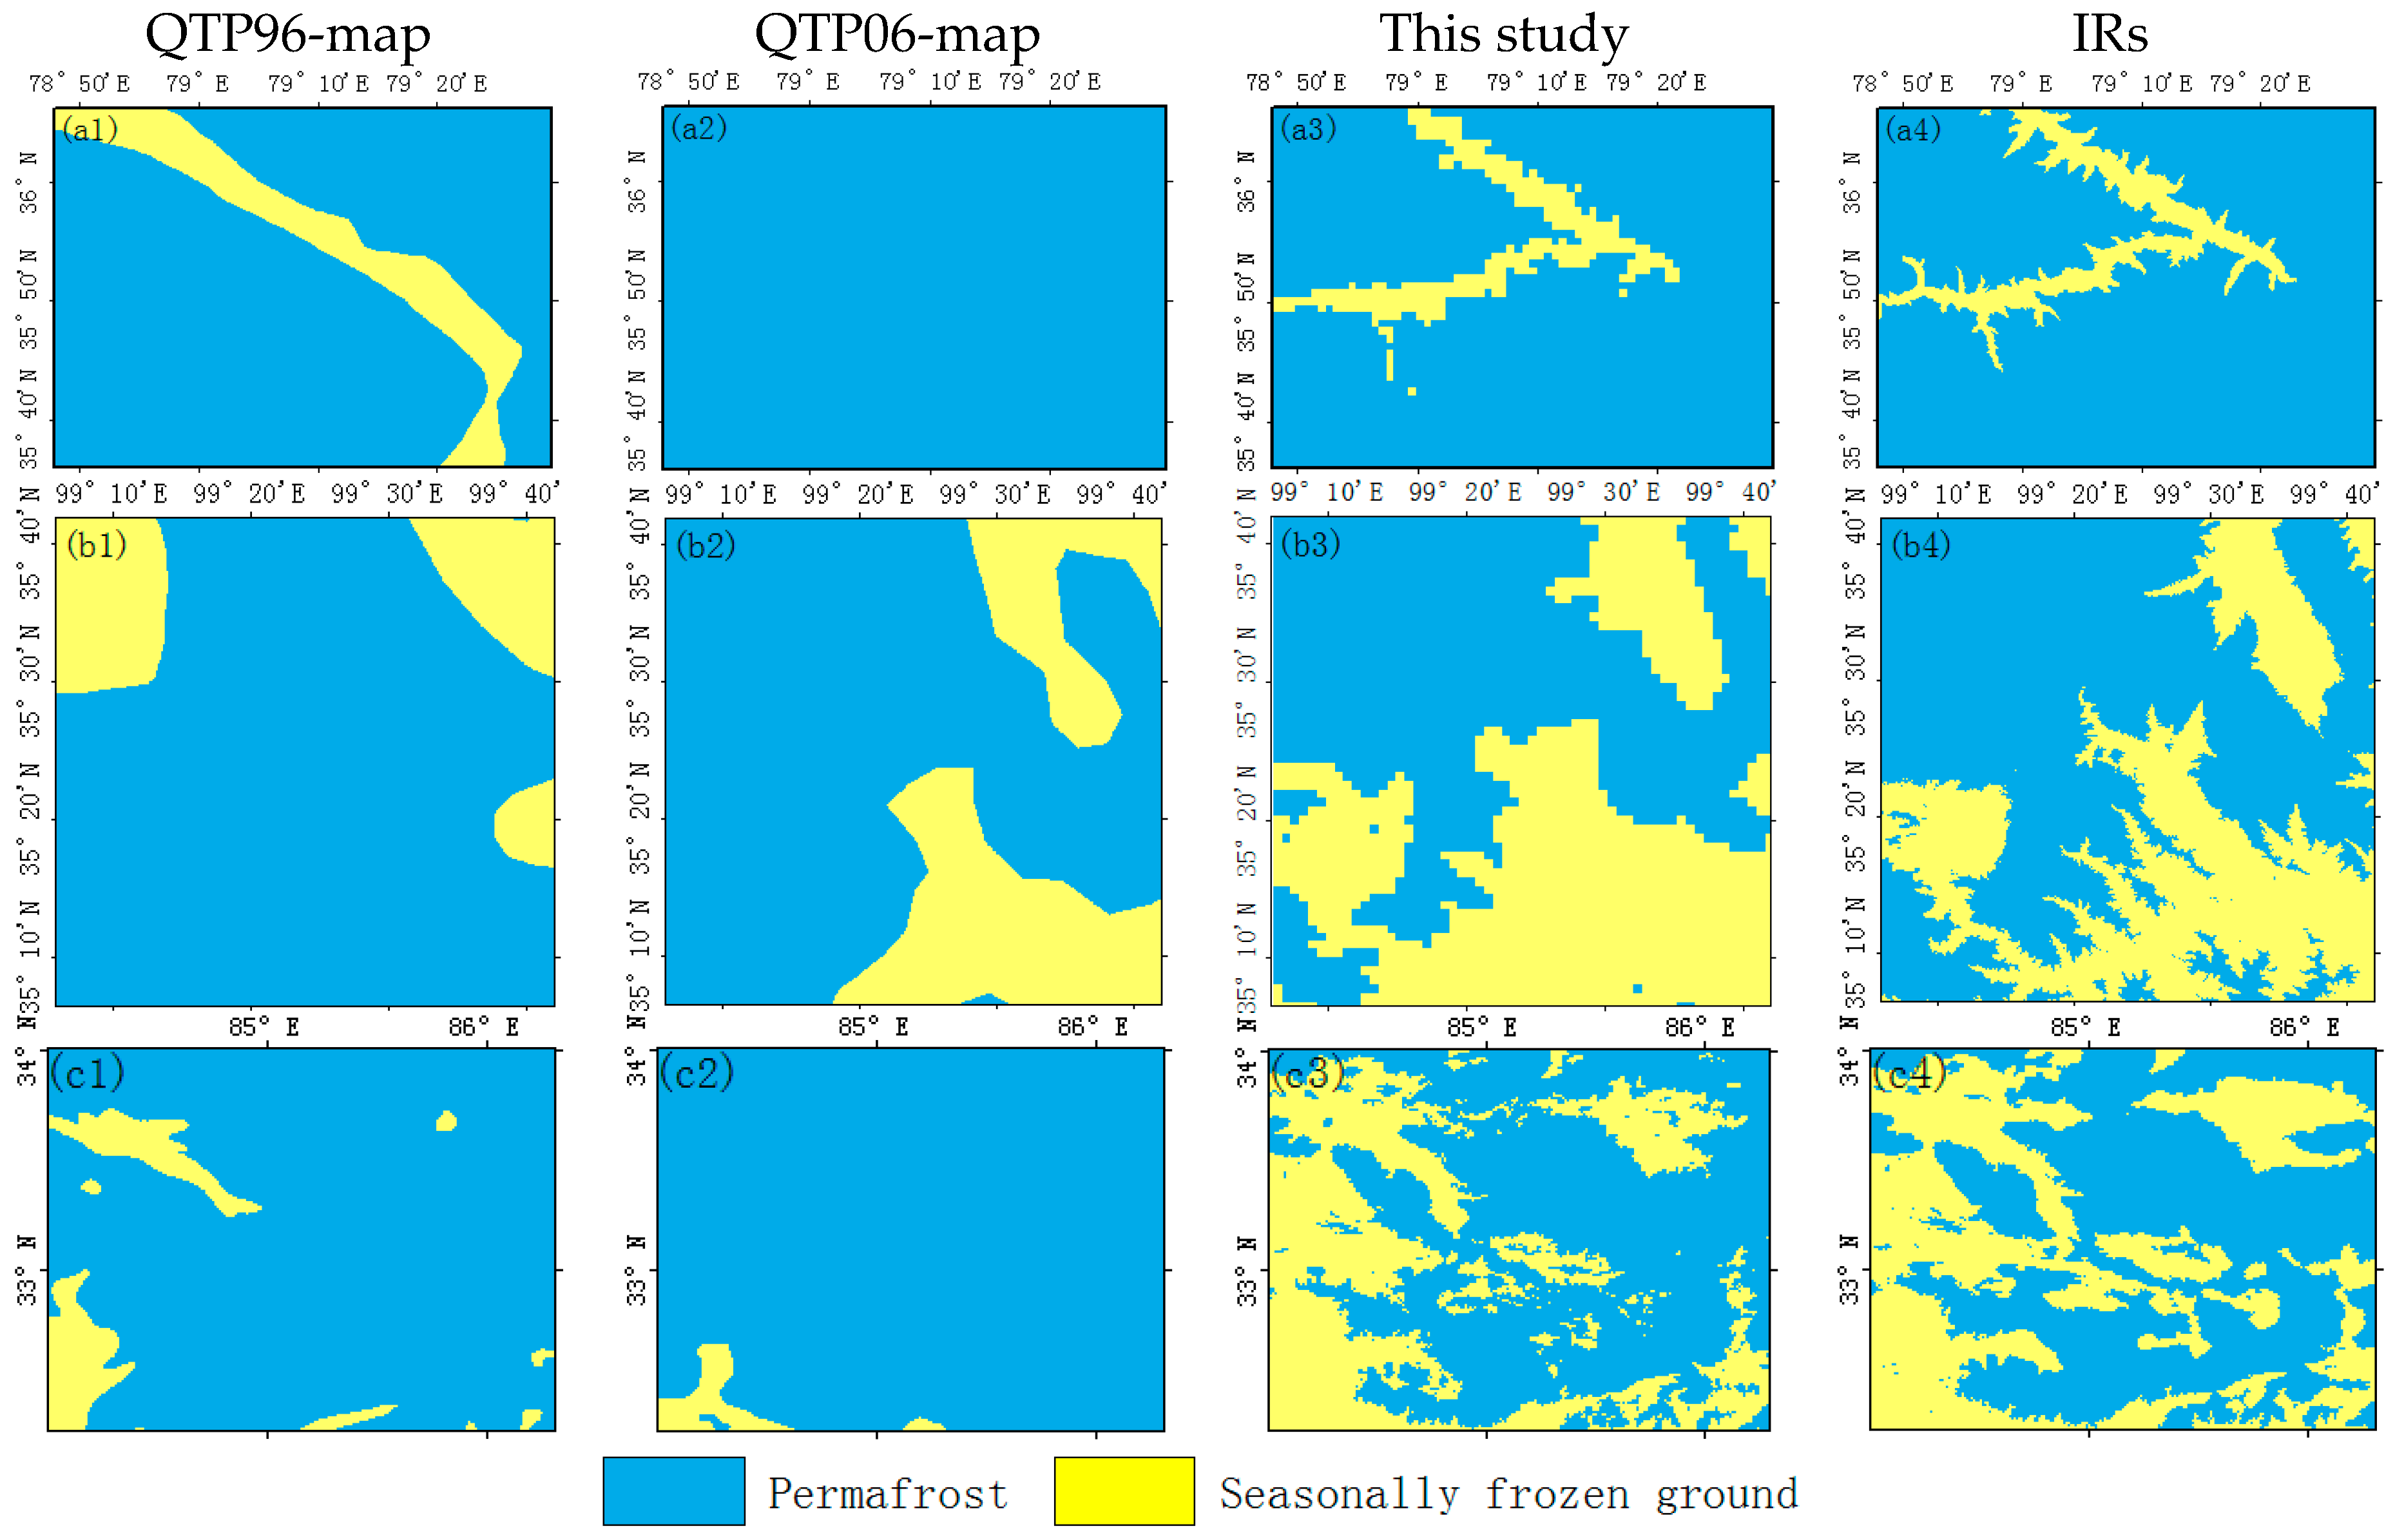
4.2. Validation at Investigated Regions
5. Discussion
- (1)
- The input parameter of elevation model is not enough and the resolution is coarser, which affect the accuracy of the result;
- (2)
- The MAGT is short of consecutive ground temperature observations, so there is much error in Southeast Tibet permafrost regions, North Gangdise and near Himalaya Range;
- (3)
- The inversion accuracy of the emissivity ratio in Emissivity Model is limited because of the influence of elevation and MAST Model cannot reflect the distribution of frozen soil in south and southeast Tibet due to scarcity of ground surface temperature observation data.
6. Conclusions
Acknowledgments
Author Contributions
Conflicts of Interest
References
- Washburn, A.L. Geocryology: A Survey of Periglacial Processes and Environments; Edward Arnold: London, UK, 1979; p. 43. [Google Scholar]
- Kozarski, S.; Marks, L.; Repelewska-Pękalowa, J. Multi-Language Glossary of Permafrost and Related Ground-Ice Terms; International Permafrost Association: Longyearbyen, Svalbard, 1998. [Google Scholar]
- Ran, Y.H.; Li, X. Evaluation of the permafrost stability degradation from 1980 to 2010 in china. Sci. Cold Arid Reg. 2016, 8, 359–366. [Google Scholar] [CrossRef]
- Gao, R.; Dong, W.J.; Wei, Z.G. The features of temporal and spatial distributions of seasonal frozen soil in the tibetan plateau. J. Glaciol. Geocryol. 2008, 30, 740–744. [Google Scholar]
- Song, M.; Ma, Y.; Zhang, Y.; Li, M.; Ma, W.; Sun, F. Climate change features along the brahmaputra valley in the past 26 years and possible causes. Clim. Chang. 2011, 106, 649–660. [Google Scholar] [CrossRef]
- Collett, T.S. Energy resource potential of natural gas hydrates. AAPG Bull. 2002, 86, 1971–1992. [Google Scholar]
- Cheng, G.; Wu, T. Responses of permafrost to climate change and their environmental significance, qinghai-tibet plateau. J. Geophys. Res. Earth Surf. 2007, 112, 93–104. [Google Scholar] [CrossRef]
- Schuur, E.A.G.; Vogel, J.G.; Crummer, K.G.; Lee, H.; Sickman, J.O.; Osterkamp, T.E. The effect of permafrost thaw on old carbon release and net carbon exchange from tundra. Nature 2009, 459, 556–559. [Google Scholar] [CrossRef] [PubMed]
- Ran, Y.; Li, X.; Cheng, G.; Zhang, T.; Wu, Q.; Jin, H.; Jin, R. Distribution of permafrost in china: An overview of existing permafrost maps. Permafr. Periglac. Process. 2012, 23, 322–333. [Google Scholar] [CrossRef]
- Mu, C.; Zhang, T.; Wu, Q.; Peng, X.; Cao, B.; Zhang, X.; Cao, B.; Cheng, G. Editorial: Organic carbon pools in permafrost regions on the qinghai-xizang (tibetan) plateau. Cryosphere 2015, 9, 479–486. [Google Scholar] [CrossRef]
- Lin, Z.; Wu, Q.; Marchenko, S.S.; Sharkhuu, N. Thermal state of permafrost and active layer in Central Asia during the international polar year. Permafr. Periglac. Process. 2010, 21, 198–207. [Google Scholar] [CrossRef]
- Zhang, Z.; Rinke, A.; Moore, J.C. Permafrost dynamic change on the tibetan plateau under climatic warming since 1950s. Maejo Int. J. Sci. Technol. 2016, 10, 242–255. [Google Scholar]
- Guo, D.X. Permafrost map along the Qinghai Tibet highway. J. Glaciol. Geocryol. 1981, V3, 77. [Google Scholar]
- Shi, Y.F.; Mi, D.S. 1:4000000 Map of Snow, Ice and Frozen Ground in China; China Cartographic Publishing House: Beijing, China, 1988. [Google Scholar]
- Li, S.D.; Cheng, G.D. Map of Frozen Ground on Qinghai-Xizang Plateau; Gansu Culture Press: Lanzhou, China, 1996. [Google Scholar]
- Zou, D.; Zhao, L.; Sheng, Y.; Chen, J.; Hu, G.; Wu, T.; Wu, J.; Xie, C.; Wu, X.; Pang, Q. A new map of the permafrost distribution on the tibetan plateau. Chin. Pharm. Aff. 2016, 1–28. [Google Scholar] [CrossRef]
- Hoelzle, M.; Mittaz, C.; Etzelmüller, B.; Haeberli, W. Surface energy fluxes and distribution models of permafrost in european mountain areas: An overview of current developments. Permafr. Periglac. Process. 2001, 12, 53–68. [Google Scholar] [CrossRef]
- Oelke, C.; Zhang, T.; Serreze, M.C. Modeling evidence for recent warming of the arctic soil thermal regime as derived with a finite-difference heat-conduction model. In Proceedings of the ACSYS Final Science Conference, St. Petersburg, Russia, 11–14 November 2003. [Google Scholar]
- Zhang, Y.; Chen, W.; Smith, S.L.; Riseborough, D.W.; Cihlar, J. Soil temperature in canada during the twentieth century: Complex responses to atmospheric climate change. J. Geophys. Res. 2005, 110. [Google Scholar] [CrossRef]
- Zhang, Y.; Chen, W.; Riseborough, D.W. Temporal and spatial changes of permafrost in canada since the end of the little ice age. J. Geophys. Res. Atmos. 2006, 111, 5225–5246. [Google Scholar] [CrossRef]
- Morrissey, L.A.; Strong, L.L.; Card, D.H. Mapping permafrost in the boreal forest with thematic mapper satellite data. Photogramm. Eng. Remote Sens. 1986, 52, 1513–1520. [Google Scholar]
- Peddle, D.R. Evidential Classification of Landcover and Permafrost from Multisource Remote Sensing Imagery in Mountainous Terrain, Yukon; University of Calgary: Calgary, AB, Canada, 1991. [Google Scholar]
- Frauenfelder, R.; Allgöwer, B.; Haeberli, W.; Hoelzle, M. Permafrost investigations with gis—A case study in the fletschhorn area, wallis, swiss alps. In Proceedings of the 7th International Conference on Permafrost, Yellowknife, NT, Canada, 23–27 June 1998. [Google Scholar]
- Etzelmüller, B.; Ødegård, R.S.; Berthling, I.; Sollid, J.L. Terrain parameters and remote sensing data in the analysis of permafrost distribution and periglacial processes: Principles and examples from southern norway. Permafr. Periglac. Process. 2001, 12, 79–92. [Google Scholar] [CrossRef]
- Etzelmüller, B.; Heggem, E.S.F.; Sharkhuu, N.; Frauenfelder, R.; Kääb, A.; Goulden, C. Mountain permafrost distribution modelling using a multi-criteria approach in the hövsgöl area, northern mongolia. Permafr. Periglac. Process. 2006, 17, 91–104. [Google Scholar] [CrossRef]
- Nguyen, T.N.; Burn, C.R.; King, D.J.; Smith, S.L. Estimating the extent of near-surface permafrost using remote sensing, mackenzie delta, northwest territories. Permafr. Periglac. Process. 2009, 20, 141–153. [Google Scholar] [CrossRef]
- Panda, S.K.; Prakash, A.; Solie, D.N.; Romanovsky, V.E.; Jorgenson, M.T. Remote sensing and field-based mapping of permafrost distribution along the alaska highway corridor, interior alaska. Permafr. Periglac. Process. 2010, 21, 271–281. [Google Scholar] [CrossRef]
- Duguay, C.R.; Pietroniro, A. Satellite Remote Sensing of Permafrost and Seasonally Frozen Ground; American Geophysical Union: Washington, DC, USA, 2013; pp. 91–118. [Google Scholar]
- Westermann, S.; Østby, T.; Gisnås, K.; Schuler, T.V.; Etzelmüller, B. A ground temperature map of the north atlantic permafrost region based on remote sensing and reanalysis data. Cryosph. Discuss. 2015, 9, 753–790. [Google Scholar] [CrossRef]
- Leverington, D.W.; Duguay, C.R. A neural network method to determine the presence or absence of permafrost near mayo, yukon territory, canada. Permafr. Periglac. Process. 2015, 8, 205–215. [Google Scholar] [CrossRef]
- Ou, C.; Leblon, B.; Zhang, Y.; Larocque, A.; Webster, K.; Mclaughlin, J. Modelling and mapping permafrost at high spatial resolution using landsat and radarsat images in northern ontario, canada: Part 1—Model calibration. Int. J. Remote Sens. 2016, 1–24. [Google Scholar] [CrossRef]
- Ran, Y.H. Mapping Permafrost Distribution based on Remote Sensing and GIS. Ph.D. Thesis, Northwest Institute of Eco-Environment and Resources, Chinese Academy of Sciences, Lanzhou, China, 2017. [Google Scholar]
- Wang, Y.L. Analyses of Modern Snowline and Its Influential Factors in the Tibet. Master’s Thesis, Lanzhou University, LanZhou, China, 2010. [Google Scholar]
- Yao, Y.H.; Zhang, B.P. The spatial pattern of monthly air temperature of the Tibetan Plateau and its implications for the geo-ecology pattern of the Plateau. Geogr. Res. 2015, 34, 2084–2094. [Google Scholar] [CrossRef]
- Wang, G.X.; Li, Y.S.; Wu, Q.B.; Wang, Y.B. The relationship between the permafrost and the vegetation in the permafrost region of the Qinghai Tibet Plateau and its influence on the Alpine Ecosystem. Sci. China 2006, 36, 743–754. [Google Scholar] [CrossRef]
- Wang, Z.W.; Wang, Q.; Zhao, L.; Wu, X.D.; Yue, G.Y.; Zou, D.F.; Nan, Z.T.; Liu, G.Y.; Pang, Q.Q.; Fang, H.B.; et al. Mapping the vegetation distribution of the permafrost zone on the Qinghai-Tibet Plateau. J. Mt. Sci. 2016, 13, 1035–1046. [Google Scholar] [CrossRef]
- Li, K.; Chen, J.; Zhao, L.; Zhang, X.M.; Pang, Q.Q.; Fang, H.B.; Liu, G.Y. Permafrost distribution in typical area of west kunlun mountains derived from a comprehensive survey. J. Glaciol. Geocryol. 2012. [Google Scholar] [CrossRef]
- Chen, J.; Zhao, L.; Sheng, Y.; Li, J.; Wu, X.D.; Du, E.J.; Liu, G.Y.; Pang, Q.Q. Some characteristics of permafrost and its distribution in the gaize area on the qinghai—Tibet plateau, china. Arct. Antarct. Alp. Res. 2016, 48, 395–409. [Google Scholar] [CrossRef]
- Zhang, X.M.; Nan, Z.T.; Wu, J.C.; Du, E.J.; Wang, T.; You, Y.H. Modeling permafrost distribution in Wenquan Area over Qinghai-Tibet Plateau by using multivariate adaptive regression splines. J. Glaciol. Geocryol. 2011, 33, 1088–1097. [Google Scholar]
- Zhang, X.M.; Sheng, Y.; Zhao, L.; Wu, J.C.; Chen, J.; Du, E.J.; You, Y.H. Permafrost distribution using sub-region classification and multivariate data in the Wenquan area over the Qinghai-Tibet Plateau. Sci. Geogr. Sin. 2012, 32, 1513–1520. [Google Scholar]
- Wan, Z.; Dozier, J. A generalized split-window algorithm for retrieving land-surface temperature from space. IEEE Trans. Geosci. Remote Sens. 1996, 34, 892–905. [Google Scholar]
- Wan, Z. New refinements and validation of the modis land-surface temperature/emissivity products. Remote Sens. Environ. 2008, 112, 59–74. [Google Scholar] [CrossRef]
- Ou, Y.B.; Che, T.; Dai, L.Y.; Wang, Z.Y. Estimating Mean Daily Surface Temperature over the Tibetan Plateau based on MODIS LST Products. J. Glaciol. Geocryol. 2012, V, 296–303. [Google Scholar]
- Chang, X.L.; Jin, H.J.; Wang, Y.P.; Zhang, Y.L.; Zhou, G.Y.; Che, F.Q.; Zhao, Y.M. Influences of vegetation on permafrost: A review. Acta Ecol. Sin. 2012, 32, 7981–7990. [Google Scholar] [CrossRef]
- Grams, G.W. Corrigendum: Relations among vegetation, permafrost, and potential insolation in central alaska. Arct. Alp. Res. 1974, 6, 327. [Google Scholar] [CrossRef]
- Zhao, L.; Cheng, G.D.; Li, S.X.; Zhao, X.M.; Wang, S.L. The freezing and melting process of the permafrost active layer near Wu Dao Liang region on Tibetan Plateau. Chin. Sci. Bull. 2000, 45, 1205–1211. [Google Scholar] [CrossRef]
- Wang, K. A Study on Simulation of the Permafrost Distribution in Qinghai Tibet Plateau Based on RS/GIS. Ph.D. Thesis, Jilin University, Jilin, China, 2009. [Google Scholar]
- Quinlan, J.R. Induction of Decision Trees; Kluwer Academic Publishers: Dordrecht, The Netherlands, 1986; pp. 81–106. [Google Scholar]
- Li, D.R.; Wang, S.L.; Li, D.Y.; Wang, X.Z. Theories and Technologies of Spatial Data Mining and Knowledge Discovery. Geomat. Inf. Sci. Wuhan Univ. 2002, 27, 221–233. [Google Scholar] [CrossRef]
- Yang, M.X.; Nelson, F.E.; Shiklomanov, N.I.; Guo, D.L.; Wan, G.N. Permafrost degradation and its environmental effects on the tibetan plateau: A review of recent research. Earth Sci. Rev. 2010, 103, 31–44. [Google Scholar] [CrossRef]
- Wang, W.; Rinke, A.; Moore, J.C.; Cui, X.; Ji, D.; Li, Q.; Zhang, N.; Wang, C.; Zhang, S.; Lawrence, D.M. Diagnostic and model dependent uncertainty of simulated tibetan permafrost area. Cryosph. Discuss. 2016, 9, 1769–1810. [Google Scholar] [CrossRef]
- Zhao, S.P.; Nan, Z.T.; Huang, Y.B.; Zhao, L. The application and evaluation of simple permafrost distribution models on the qinghai-tibet plateau. Permafr. Periglac. Process. 2017, 28. [Google Scholar] [CrossRef]
- Mi, D.S. 1:400 0000 Map of Snow, Ice and Frozen Ground in China. J. Glaciol. Geocryol. 1990, 12, 175–181. [Google Scholar]
- Nan, Z.T.; Li, S.X.; Liu, Y.Z. Mean annual ground temperature distribution on the tibetan plateau:Permafrost distribution mapping and further application. J. Glaciol. Geocryol. 2002, 24, 142–148. [Google Scholar]
- Cheng, G.D. Problems on zonation of high-altitude permafrost. Acta Geogr. Sin. 1984. [Google Scholar] [CrossRef]
- Tobler, W.R. A computer movie simulating urban growth in the detroit region. Econ. Geogr. 1970, 46, 234–240. [Google Scholar] [CrossRef]
- Xu, H.Y. Classification of Land Categories based on High-resoulution Remote Senisng Imagies. Master’s Thesis, Nanjing Forestry University, Nanjing, China, 2015. [Google Scholar]
- Ran, Y.H.; Li, X.; Lu, L. Accuracy Evaluation of the Four Remote Sensing Based Land Cover Products over China. J. Glaciol. Geocryol. 2009, 31, 490–500. [Google Scholar] [CrossRef]
- Cohen, J. A coefficient of agreement for nominal scales. Educ. Psychol. Meas. 1960, 20, 37–46. [Google Scholar] [CrossRef]
- Nan, Z.; Huang, P.; Lin, Z. Permafrost distribution modeling and depth estimation in the western qinghai-tibet plateau. Acta Geogr. Sin. 2013, 68, 318–327. [Google Scholar]
- Chen, S. Permafrost classification on the tibet plateau based on surface emissivity retrieval from terra-modis data. In Proceedings of the Geoscience and Remote Sensing Symposium, Anchorage, AK, USA, 20–24 September 2004; Volume 2694, pp. 2699–2702. [Google Scholar]
- Pang, Q.Q.; Li, S.X.; Wu, T.H.; Zhang, W.G. Simulated distribution of active layer depths in the frozen ground regions of tibetan plateau. J. Glaciol. Geocryol. 2006, 28, 390–395. [Google Scholar]
- Nelson, F.E.; Outcalt, S.I. A computational method for prediction and regionalization of permafrost. Arct. Alp. Res. 1987, 19, 279–288. [Google Scholar] [CrossRef]
- Smith, M.W.; Riseborough, D.W. Permafrost monitoring and detection of climate change. Permafr. Periglac. Process. 2015, 7, 301–309. [Google Scholar] [CrossRef]
- Li, X.; Cheng, G.D. A gis-aided response model of high-altitude permafrost to global change. Sci. China Earth Sci. 1999, 42, 72–79. [Google Scholar] [CrossRef]
- Ran, Y.; Li, X.; Cheng, G. Climate warming has led to the degradation of permafrost stability in the past half century over the qinghai-tibet plateau. Cryosph. Discuss. 2017, 1–30. [Google Scholar] [CrossRef]
- Guo, D.; Wang, H.; Li, D. A projection of permafrost degradation on the tibetan plateau during the 21st century. J. Geophys. Res. Atmos. 2012, 117. [Google Scholar] [CrossRef]
- Guo, D.; Wang, H. Simulation of permafrost and seasonally frozen ground conditions on the tibetan plateau, 1981–2010. J. Geophys. Res. Atmos. 2013, 118, 5216–5230. [Google Scholar] [CrossRef]
- Zhou, Y.W.; Guo, D.X. Principal characteristics of permafrost in china. J. Glaciol. Geocryol. 1982, 4, 1–19. [Google Scholar]
- Nan, Z.T. Study of the characteristics of permafrost distribution on the Qinghai-Tibet Plateau and construction of digital roadbed of the Qinghai-Tibet railway. Arct. Antarct. Alp. Res. 2018. [Google Scholar] [CrossRef]
- Jin, H.J.; Wang, S.L.; He, R.X.; Lv, L.Z.; Yu, S.P. Dual Influences of Local Environmental Variables on Temperatures on the Interior-Eastern Qinghai-Tibet; (1): Vegetation and snow cover. J. Glaciol. Geocryol. 2008, 30, 535–545. [Google Scholar]

| 1 | 2 | 3 | 4 | 5 | ||
|---|---|---|---|---|---|---|
| H (m) | Both permafrost (>) | 3938 | 4755 | 4992 | 5049 | 4830 |
| Both seasonally frozen ground (<) | 3594 | 4298 | 4522 | 4650 | 4742 | |
| T (°) | Both permafrost (<) | −4.56 | −4.13 | −4.81 | −6.86 | −4.73 |
| Both seasonally frozen ground (>) | −2.01 | −3.63 | −2.54 | −1.58 | −1.26 | |
| NDVI | Both permafrost | 0.026–0.054 | 0.013–0.0390.245–0.271 | 0.065–0.232 | 0.001–0.142 | 0.003–0.310 |
| Both seasonally frozen ground | 0.133–0.219 | / | 0.620–0.891 | 0.477–0.903 | 0.671–0.929 | |
| SM | Both permafrost (>) | 0.161 | 0.195 | 0.165 | 0.192 | 0.202 |
| Both seasonally frozen ground (<) | 0.094 | 0.096 | 0.088 | 0.086 | 0.085 |
| Range | 1 | 2 | 3 | 4 | 5 |
|---|---|---|---|---|---|
| Both permafrost | 0.054–0.133 | 0.013–0.271 | 0.065–0.232 | 0.001–0.477 | 0.003–0.310 |
| Both seasonally frozen ground | 0.026–0.219 | 0.039–0.245 | 0.620–0.891 | 0.142–0.903 | 0.671–0.929 |
| Percentage of Total Area (%) | |||
|---|---|---|---|
| Permafrost | Seasonally Frozen Ground | Uncertain | |
| DEM | 26.3 | 39.2 | 30.7 |
| LST | 38.6 | 46.7 | 10.8 |
| NDVI | 39.1 | 50.8 | 6.2 |
| SM | 40.4 | 51.4 | 4.3 |
| Final-class | 42.5 | 53.8 | 0.0 |
| West Kunlun | Wenquan | Gaize | ||||
|---|---|---|---|---|---|---|
| OA (%) | Ka | OA (%) | Ka | OA (%) | Ka | |
| QTP96_map | 79.98 | −0.0018 | 54.38 | −0.15 | 63.49 | 0.15 |
| QTP06_map | 90.37 | 0 | 76.49 | 0.45 | 60.71 | 0.06 |
| This study | 94.73 | 0.70 | 85.76 | 0.71 | 85.15 | 0.69 |
| QTP88_map | QTP96_map | QTP06_map | QTP16_map | MRSD_QTP map | |
|---|---|---|---|---|---|
| QTP88_map | - | 76.26 (0.51) | 79.36 (0.59) | 74.42 (0.50) | 77.45 (0.56) |
| QTP96_map | - | - | 78.02 (0.56) | 75.90 (0.52) | 78.09 (0.56) |
| QTP06_map | - | - | - | 81.46 (0.63) | 84.82 (0.70) |
| QTP16_map | - | - | - | - | 87.52 (0.74) |
| MRSD_QTP map | - | - | - | - | - |
| Methods | Permafrost Area | Seasonal Frozen Soil Area | Data Sources |
|---|---|---|---|
| RegCM3/CLM4 | 122.2 | 127.9 | 1980–2000 average [67] |
| HY/CLM4 | 151.5 | 87.1 | 1981–2000 average [68] |
| K-model | 126.8 | 125.5 | [52] |
| Regional statistical survey | 150 | [69] | |
| Elevation model | 138.9 | 113.3 | [52] |
| Mean annual ground temperature model | 111.8 | [70] | |
| The surface frost number | 127.8 | 123.6 | [70] |
| TTOP | 138.7 | [70] | |
| QTP16_map | 106 | 146 | [16] |
| QTP96_map | 129.8 | 122.4 | [52] |
| MRSD_QTP map | 111.3 | 140.9 | This study |
© 2018 by the authors. Licensee MDPI, Basel, Switzerland. This article is an open access article distributed under the terms and conditions of the Creative Commons Attribution (CC BY) license (http://creativecommons.org/licenses/by/4.0/).
Share and Cite
Shi, Y.; Niu, F.; Yang, C.; Che, T.; Lin, Z.; Luo, J. Permafrost Presence/Absence Mapping of the Qinghai-Tibet Plateau Based on Multi-Source Remote Sensing Data. Remote Sens. 2018, 10, 309. https://doi.org/10.3390/rs10020309
Shi Y, Niu F, Yang C, Che T, Lin Z, Luo J. Permafrost Presence/Absence Mapping of the Qinghai-Tibet Plateau Based on Multi-Source Remote Sensing Data. Remote Sensing. 2018; 10(2):309. https://doi.org/10.3390/rs10020309
Chicago/Turabian StyleShi, Yaya, Fujun Niu, Chengsong Yang, Tao Che, Zhanju Lin, and Jing Luo. 2018. "Permafrost Presence/Absence Mapping of the Qinghai-Tibet Plateau Based on Multi-Source Remote Sensing Data" Remote Sensing 10, no. 2: 309. https://doi.org/10.3390/rs10020309
APA StyleShi, Y., Niu, F., Yang, C., Che, T., Lin, Z., & Luo, J. (2018). Permafrost Presence/Absence Mapping of the Qinghai-Tibet Plateau Based on Multi-Source Remote Sensing Data. Remote Sensing, 10(2), 309. https://doi.org/10.3390/rs10020309