Article

The Archaeology and Remote Sensing of Santa Elena’s Four Millennia of Occupation

by
Victor D. Thompson
1,2,*,
Chester B. DePratter
3,
Jacob Lulewicz
1,
Isabelle H. Lulewicz
1,
Amanda D. Roberts Thompson
2,
Justin Cramb
1,
Brandon T. Ritchison
1 and
Matthew H. Colvin
1
1
Department of Anthropology, University of Georgia, Athens, GA 30602, USA
2
Laboratory of Archaeology, University of Georgia, Athens, GA 30605, USA
3
South Carolina Institute of Archaeology and Anthropology, University of South Carolina, Columbia, SC 29208, USA
*
Author to whom correspondence should be addressed.
Remote Sens. 2018, 10(2), 248; https://doi.org/10.3390/rs10020248
Submission received: 10 January 2018 / Revised: 27 January 2018 / Accepted: 2 February 2018 / Published: 6 February 2018
(This article belongs to the Special Issue Advances in Remote Sensing for Archaeological Heritage)

Abstract

:
In this study, we present the results of a comprehensive, landscape-scale remote sensing project at Santa Elena on Parris Island, South Carolina. Substantial occupation at the site extends for over 4000 years and has resulted in a complex array of features dating to different time periods. In addition, there is a 40-year history of archaeological research at the site that includes a large-scale systematic shovel test survey, large block excavations, and scattered test units. Also, modern use of the site included significant alterations to the subsurface deposits. Our goals for this present work are threefold: (1) to explicitly present a logical approach to examine sites with long-term occupations; (2) to examine changes in land use at Santa Elena and its implications for human occupation of this persistent place; and (3) to use the remote sensing program and past archaeological research to make substantive suggestions regarding future research, conservation, and management of the site. Our research provides important insight into the distribution of cultural features at this National Historic Landmark. While the majority of archaeological research at the site has focused on the Spanish period, our work suggests a complex and vast array of archaeological features that can provide insight into over 4000 years of history in the region. At a gross level, we have identified possible Late Archaic structures, Woodland houses and features, Late Prehistoric and early Historic council houses, and a suite of features related to the Spanish occupation which builds on our previous research at the site. In addition to documenting possible cultural features at the site, our work illustrates the value of multiple remote sensing techniques used in conjunction with close-interval shovel test data.

Graphical Abstract

1. Introduction

At the crux of every archaeological remote sensing project is the ability to differentiate significant signals from surrounding noise. The more complicated the noise, the more difficult it is to evaluate meaningful patterns within a given dataset. This is true whether one is looking at aerial or ground-based shallow geophysical surveys. In terms of archaeological research, the surrounding noise frequently comes in the form of modern intrusions and alterations to an archaeological site (e.g., water pipes, modern ditches). In other cases, archaeological features are diffused or have suffered greatly from taphonomic processes that render them invisible within their surrounding matrix to various methods of prospection. Still, in other cases, archaeologists deal with landscapes that have been occupied by various people for millennia which have yielded complex palimpsests of features and landscape modifications. Of these, the last situation presents perhaps the most challenging, but also potentially the most rewarding in terms of understanding long-term human use of specific landscapes, as well as the management of these resources.
In this study, we present the results of a comprehensive, landscape-scale remote sensing project at Santa Elena on Parris Island, South Carolina (Figure 1). Substantial occupation at the site extends for over 4000 years and has resulted in a complex array of features dating to different time periods. In addition, there is a 40-year history of archaeological research at the site that includes a large-scale systematic shovel test survey, large block excavations, and scattered test units (Figure 2). In addition, modern use of the site included significant alterations to the subsurface deposits. Our goals for this present work are threefold: (1) to explicitly present a logical approach to examine sites with long-term occupations; (2) to examine changes in land use at Santa Elena and its implications for human occupation of this persistent place; and (3) to use the remote sensing program and past archaeological research to make substantive suggestions regarding future research, conservation, and management of the site.

2. The Santa Elena Landscape

Santa Elena is located on the United States Marine Corps Recruit Depot on Parris Island but the name Santa Elena comes from the sixteenth century Spanish capital that existed from AD 1566 to 1587. This 21-year occupation is what thrust Santa Elena into the archaeological spotlight and has largely been the focus of research at the site for the last 40 years. That said, this portion of Parris Island also had a substantial Native American presence beginning around 4000 years ago with occupation up until the arrival of Europeans. In addition to the Native and Spanish occupations, there were also early French settlers in the 16th century, occupation again by Native Americans in the 17th century, an antebellum plantation, a Marine Corps base beginning in 1915, and finally the land served as a golf course beginning in 1947 before becoming a National Historic Landmark. Here, we present a brief summary of each of these periods as they relate to the current project (see [1,2,3,4,5,6,7,8,9,10,11,12,13] for more in depth discussions of each of these occupations).

2.1. Native American Histories

The earliest substantial occupation of Santa Elena dates to around 4000 years ago during the Late Archaic and is identified by Stallings series pottery, referred to as the St. Simons period on the coast (cal. 2750–2860 BC–1360 BC). These fiber-tempered ceramics are associated with some of the first sedentary villages along the Georgia and South Carolina coasts. Shell ring sites, the most well-known site-type of this period, are found throughout the lower Atlantic coast (see [14,15,16,17]). These large arcuate and circular piles of shell represent some of the earliest villages in the United States [18,19,20,21]. Along the Georgia Coast, these sites began to be abandoned around 3800 BP; however, populations continued to occupy the region as evidenced by occupations at non-shell ring-bearing sites [22,23].
The following Woodland period includes several sub-periods: Refuge (1360 BC–400 BC), Deptford (400 BC–AD 630), and Wilmington (AD 630–AD 1050–1100). During the early part of the time period (the Refuge period), there is a reduction in the number of sites along the northern Georgia Coast [22]. Following this, there seems to have been a population rebound with people occupying sites that were formerly occupied during the St. Simons period [22]. The number of sites continued to increase throughout the Woodland period and settlements became located closer to the coastal and marsh edge landforms [22]. Social organization throughout both the Late Archaic and Woodland period in general was egalitarian with little differentiation beyond what is considered typical for “tribally” organized societies, although Thomas [24] suggests that inherited statuses emerged towards the end of the Woodland period (ca. AD 800) for St. Catherines Island, Georgia.
The Mississippian period saw the emergence of regional polities and mound centers with public architecture, such as council houses [24,25,26]. This time frame includes three sub-periods: St. Catherines (AD 1000–1200), Savannah (AD 1200–1350), and Irene (AD 1350–1550). The Irene overlaps with European contact, eventually transitioning into the Altamaha period (1550–1700) (see [24,27,28]). Here, we follow DePratter [29] in identifying the Irene-Altamaha occupations. It is during this late period that sites increase in both number and size [30]. Based mainly on work related to the northern Georgia coast, consumption of maize increases throughout this period and reaches its apex during the early Spanish contact period—the late Irene and Altamaha periods—likely due to Spanish colonial desire for maize surpluses [31,32].

2.2. Spanish Colonial Period

While there was intermittent European contact by the early sixteenth century across the Georgia and South Carolina coasts, it wasn’t until 1562 when Jean Ribault of France established Charlesfort with a garrison of 27 men that the area became the focus for European colonization [7,33]. This occupation would not last long and the men eventually mutinied with some of the men eventually making it back to France. Due in part to subsequent settlement attempts by France in the region, Spain set out to establish a foothold in the area (see [34,35]). In 1565, Pedro Menéndez de Avilés, the Adelantado of La Florida, arrived in the region and began by capturing and killing almost all the soldiers at the newly established French occupation of Fort Caroline, located somewhere along the banks of the modern St. Johns river in northeastern Florida [33,36,37,38]. Following this, Menéndez went on to establish both St. Augustine (1565) and Santa Elena (1566).
The Spanish occupation of Santa Elena lasted 21 years, characterized by a continued sequence of forts, buildings, and occupational shifts before it was eventually abandoned in 1587. The first fort in this sequence was San Salvador, whose location remains unknown to archaeologists [33]. Fort San Felipe (I) was the next fort constructed in 1566, which was superimposed over the remains of the French Charlesfort [39]. It was during this early occupation that Santa Elena began to grow as a town and by 1569 it had over 200 settlers and more than 40 houses [33,37].
All was not well during this early occupation and by 1570–71, the settlement suffered considerably due to drought and epidemic diseases [33]. Fort San Felipe (I) burned in 1570 and the colonists constructed a new fort, San Felipe (II). At this time (July of 1571), Menéndez arrived with his family at Santa Elena. He would later depart for Spain in 1574 and perish on this trip [37].
Now under new leadership, first by an interim governor, Diego de Velasco, and then by a newly appointed Governor, Hernando de Miranda, the colony continued to be beset by hardships, most notably because of attacks by Native Americans due to their poor treatment by the interim governor [33,37,39]. The sacking of fort San Felipe (II) and the burning of the town by Native groups at this time resulted in a brief abandonment in 1576 [33,37].
One year after this abandonment, a new fort, San Marcos (I), was constructed with prefabricated materials boated in from St. Augustine [1,12,37,40]. After several years, this fort was dismantled and a new one constructed (San Marcos II) facing the river to defend against the increasing threat posed by the British [37]. By 1587, the Spanish colonists decided to abandon Santa Elena and consolidate their holdings at St. Augustine in what is now extreme northeastern Florida [33,37].

2.3. Santa Elena’s Post-Spanish Occupation

The period directly following the Spanish colonists’ abandonment of Santa Elena is not well documented; however, there is one interesting early account from 1663 by William Hilton. During this visit, he observed two larger structures constructed by the native people of the area at what appears to be the former site of Santa Elena. He described lumber about the site and the ruins of an old fort, which he assumed to be that of Charlesfort [41]. The two native structures were substantial and he described one as having a 200-foot (ca. 61-m) circumference, with another large house, like a sentinel house constructed with spikes and nails [41]. Around these structures are smaller houses, likely the domiciles of the settlement’s occupants. Exactly when these Native peoples abandoned the Santa Elena site is uncertain. However, by the 1700s, as with much of the South Carolina and Georgia Coast, the area had become depopulated due to Old World diseases, forced relocations, and the mounting pressure of slaving along the coast [17,42].
During the early 1700 and 1800s, Santa Elena became a working plantation growing both indigo and cotton, garnering the name Parris Island at this time [12]. Enslaved Africans worked the plantation, bringing with them their history and cultural practices [12]. Following the Civil War, the site became the location of a freedman community, totaling over 200 years of African American presence at the site [12]. As such, the plantation occupation, and the occupation persisting through the 18th and 19th centuries, is primarily characterized archaeologically by at least one extant structure (i.e., a tabby structure in a row of houses for the enslaved), materials (e.g., 18th and 19th century pottery), and burials.
Beginning at the turn of the 20th century, the U.S. government began to increase its holdings on Parris Island. However, it was not until just before the U.S. entered World War I that the military presence at Santa Elena expanded, ca. 1917. By 1918, the Marine Corps were training thousands of recruits at Parris Island and hundreds of buildings were constructed [43]. At the Santa Elena site itself, the Marines had rows of tents and other smaller structures with wooden footings. The use of the Santa Elena site ceased around 1947 upon the construction of a golf course. Use of the area continued as a golf course until its archaeological significance was recognized in 2001, when the site was granted the status of National Historic Landmark and the United State Marine Corps relocated portions of the golf course to protect features of the Santa Elena site.

3. The Santa Elena Landscape Project

In 2014, we (DePratter and Thompson) initiated the Santa Elena Landscape Project. The focus of this work was to conduct a large-scale remote sensing project to compliment the 40 plus years of excavation and traditional archaeological shovel test surveys at Santa Elena. The work began as a proof of concept as previous attempts at surveying the site had produced little to no useful results; however, based on DePratter’s projections of where structures should be, we had some clear ideas of where to begin our survey (see [12,33]). Our initial day visit and testing of the viability of ground-penetrating radar proved useful and we returned with a suite of equipment (i.e., GPR, gradiometer, resistance meter). The specific goals of this follow up visit were to conduct a preliminary assessment to define some of Santa Elena’s Spanish features. Two of our more interesting finds were the location of Fort San Marcos (I) and a possible structure associated with an area that was suspected by DePratter to have been occupied by Menéndez [1]. After the completion of our preliminary survey, it soon became clear that an evaluation of the entire site with a range of techniques would provide a robust dataset to evaluate long-term human use of the landscape.
During the summer of 2016, we returned to the site with the University of Georgia Archaeological Field School to complete a full coverage survey of Santa Elena. We largely accomplished this with both the gradiometer and the GPR as the resistance meter frame broke roughly midway through our survey. In total, we surveyed roughly 3.5 hectares (Figure 3 and Figure 4). In addition, we were also able to obtain Light Detection and Ranging (LiDAR) data for the entire site (Figure 2). The result of this work is the largest, most intensive, remote sensing survey, to our knowledge, of a Spanish Colonial site in the United States.
Compared to many other densely vegetated sites along the coast of the American Southeast, surveying the still-maintained golf course of the Santa Elena site was easy. However, given its long history of occupation, the dataset is extremely complex in terms of the number of potentially significant signals and the long-term nature of its occupational history. Luckily, previous archaeological research at the site included a close interval (30 ft. or 9.15 m) shovel test survey (see [33] (Figure 2). When combined with our remote sensing maps, these data provide a powerful tool for interpreting the geophysical data and for assigning temporal periods to potential archaeological features. While not a usual form of “ground truthing”, shovel test data are, in some ways, superior to small test units for examining such features. What follows is a detailed account of this process, the results, and the broader methodological implications of this work.

4. Materials and Methods

4.1. Shovel Test Survey, Global Positioning Systems (GPS), and Geographic Information Systems (GIS)

In the spring of 1994, Chester DePratter and Stanley South set out to define the spatial extent of Santa Elena. To this end, they conducted a systematic shovel test survey at 30-foot (9.15 m) intervals over the entire site. This resulted in a total of 1383 shovel test pits (shovel test dimensions 0.9′ × 1.8′) (Figure 2) that were excavated in natural levels to the base of occupation and screened through ¼” mesh [33]. All materials recovered from the shovel test survey were analyzed and then categorized into major time periods. DePratter and South [33] present distribution maps of these data in their original report. The vast majority of the cultural deposits at Santa Elena lie within the first meter or less, usually the first 30 cm, below the surface, and therefore this precluded an in-depth evaluation or discussion of how changes in stratigraphy correspond to the geophysical data.
One of the practical problems that we encountered is that our shallow geophysical and LiDAR surveys are based on a metric grid system, whereas the shovel test survey was based on the English system of measurement. As an additional problem, the digital files with all the counts and weights of the artifacts were stored in file formats that were currently unusable on modern computers. To get all the datasets to where they could be overlaid with one another in ArcMap, we obtained UTM coordinates for the original site datum in the field with an RTK GPS (Real Time Kinematic GPS) using the NAD 83 datum. We used this to geo-reference the boundary survey map with all the locations of the shovel tests in order to obtain UTM coordinates for each shovel test pit. The artifact data was then hand-entered into an excel spreadsheet with the shovel test number and the new UTM coordinates. Using this data, we created new distribution maps based on a kriging statistical interpolation for each major occupation at the site.
For the ground-based geophysical survey, we established a 20-m interval grid over the entire site with the RTK GPS (Figure 3). For those areas under tree cover, we used the RTK GPS to establish base points and then set in grid points using a total station. We used this grid for all three of the ground-based geophysical survey instruments.
The method described above allowed us to include all survey results, including LiDAR (see below) and previous archaeological excavations (including the shovel test data, as well as block excavations and trenches) in one ArcMap geodatabase that allowed for the evaluation of datasets in the context of each of the other datasets. In some cases, the shallow-geophysical survey allowed us to reposition some of the excavations and shovel test pits more accurately, as we will outline in our results.

4.2. LiDAR

In eastern North America, there is a boon in the amount of publicly available LiDAR and while such data was not created with archaeology in mind, researchers have been making full use of this resource [44,45,46,47,48]. LiDAR, briefly, uses an instrument that emits and receives a laser that records spatial information via a high precision global positioning system (see [46]). The scanner sends out thousands of pulses that are measured in the time it takes to reflect back to the receiver. These measurements along with their spatial coordinates can then be used to compute distances to objects. This information then can be used to create maps of ground surface, vegetation, roads, and archaeological features (see [49,50]). We obtained the Santa Elena LiDAR data from the State Government of South Carolina. We processed the data using the ArcMap 10.5 LAS toolset by ESRI (Redlands, California, USA) (Figure 2).

4.3. Resistance Survey

Kvamme [51] and Gater and Gaffney [52] provide in-depth discussions of resistance surveys in archaeology. Our expanded survey used the same setup as our previous surveys at Santa Elena [1]. We employed a Geoscan (West Yorkshire, UK) RM85 Advanced Resistance Meter (see [53]). We configured the instrument to be used as a parallel twin probe array with a multiplexer, allowing for the collection of two readings per insertion on either side using three probes of the one-meter traverse transects (see [1]). This setup results in the collection of samples along effectively 50-cm spaced transects. The probe separation for both sides was 50-cm, allowing for the recording of information approximately 50-cm below the surface. We processed all data using TerraSurveyor 3.0.336 by DW Consulting (Barneveld, The Netherlands) following Gater and Gaffney [52]. We then georeferenced all resistance maps in ArcMap for comparison with other data sets (Figure 4).

4.4. Gradiometer Survey

Kvamme [51] and Gater and Gaffney [52] provide in-depth discussions for magnetic surveys in archaeology. Our work at Santa Elena used a Bartington (Oxon, UK) Grad-601 Fluxgate Gradiometer. Our survey methods did not deviate from our previous research at the site [1]. We collected data in 50 cm transects at eight samples per meter. Early in the planning for our large-scale survey we considered using one of the large cart arrays commonly employed in landscape surveys across the UK and increasingly in the Midwestern and Southeast United States [54,55,56,57,58,59,60,61,62]; however, due to funding constraints and the fact we had enough labor and time, we ultimately decided against this method. We processed all data using TerraSurveyor, following Gater and Gaffney [52]. We then georeferenced all magnetic survey maps in GIS for assessment with other data sets (Figure 4).

4.5. GPR

Conyers [63,64,65,66,67] provides an in-depth discussion for GPR surveys in archaeology. Our GPR survey used a Geophysical Survey Systems Inc. SIR 3000 (Nashua, New Hampshire, USA) ground penetrating radar system. Data were collected using a 400 MHz antenna. Collection of GPR data followed 50 cm spaced transect lines. As GPR is a bit more flexible, the size of our collection grids varied (i.e., we did not collect all data in 20 m × 20 m squares). Instead, we combined adjacent grids into larger survey areas to make collecting and processing the larger datasets easier and quicker. As we detail in other publications (e.g., [68,69]), we processed all data in GPR-SLICE (Woodland Hills, California, USA) and GPR viewer, presenting the data as either amplitude time slices or individual profile slices depending on the nature of the phenomena represented (see [1]). Following Conyers’ [66] suggestions, all GPR data was “processed, re-evaluated, [and] re-processed” to draw out specific culturally significant radar reflections. We then georeferenced all the amplitude time slice maps in GIS to stitch the independent survey areas together and to compare with the other data sets (Figure 4).

5. Results

We present our results of the larger survey by time period for ease of interpretation. Obviously, however, some of these features overlap and necessitate mention beyond their specific temporal section. In each section, we start with an overview of the artifact distribution and then focus on specific geophysical patterns of interest to that period. Given the size of the dataset, we cannot discuss each individual pattern or potential cultural feature. Instead, our purpose here is the focus on the most obvious and clear patterns in the data. As Conyers [67] notes, it is important to first consider remote sensing data at a smaller scale, discuss magnetic and GPR data, and then consider how such configurations manifest at the landscape level. One issue that should become clear to the reader is that the shovel test data provide an important independent line of evidence for the interpretation of the remote sensing data, a point we return to at the end of this paper.

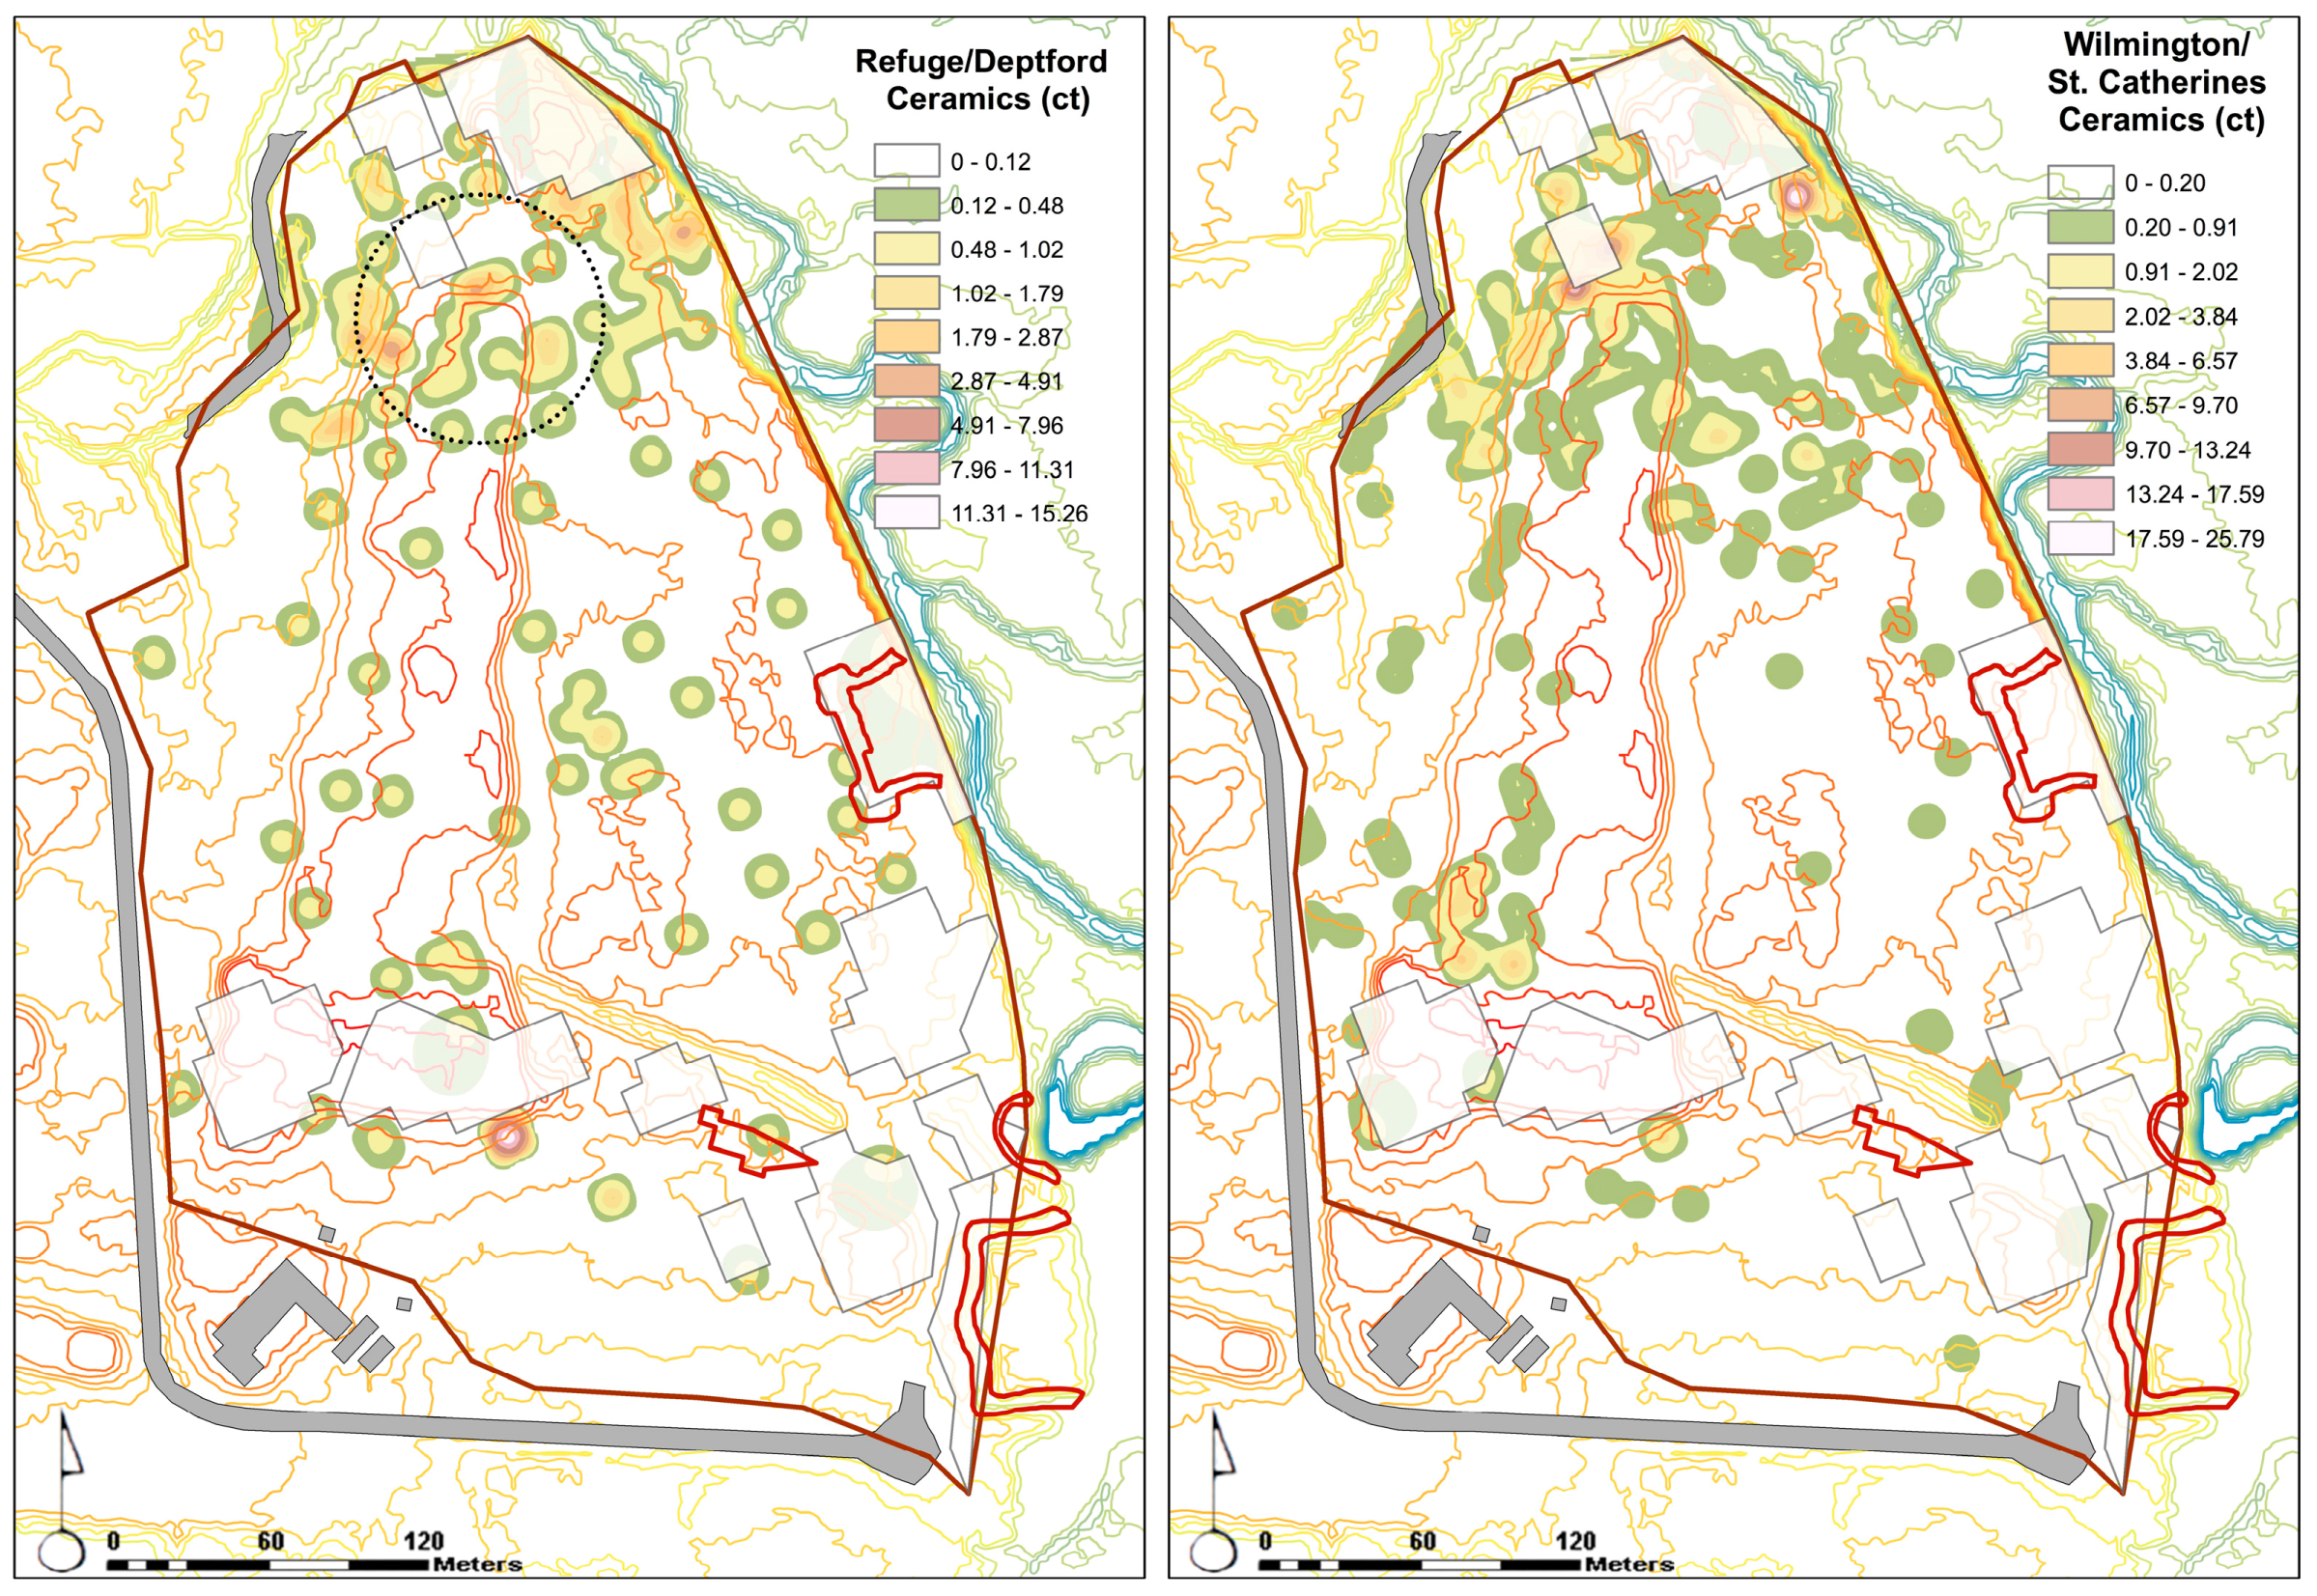
5.1. Late Archaic-Early/Middle Woodland

Although there are isolated ceramics from both the Late Archaic and Early/Middle Woodland period across the entire site, the vast majority of the artifacts appear to be concentrated towards the northern end of Santa Elena (Figure 5 and Figure 6). In the Late Archaic Stallings distribution (Figure 5), there appear to be two circular concentrations that are just west of the shoreline (Figure 7). These circular patterns are between 50–60 m in diameter. We are fairly confident that these patterns are not just random chance, as we know that Late Archaic peoples in the region did typically organize themselves in space in this way. This is roughly the same diameter (ca. 69 m) of the average size of shell rings in the region [70]. In addition, it is not uncommon to find multiple shell rings directly adjacent to one another, and even sometimes overlapping. Finally, shell rings and other circular village layouts elsewhere are commonly defined by close interval shovel testing. While we are not sure if the occupation of Santa Elena dates to the terminal Late Archaic, it could be that this occupation represents a continuation of circular villages after the decline in shellfishing across the region (see [23]). In addition to the two circular concentrations, Late Archaic peoples heavily used the shoreline area adjacent to them. The argument for a possible Stallings period circular village is bolstered by DePratter’s excavation data. In unit 38BU162Y, located right on the edge of the more southerly circular pattern (Figure 7), DePratter likely excavated through what he believes to have been a Stallings period house floor. Given the density of Stallings and Woodland period artifacts recovered from shovel tests in this northern part of the site, combined with the paucity of later artifact types in this area (discussed below), it is probable that many of the anomalies apparent in the geophysical data date to these periods. At the very least, of all the geophysical anomalies identified at the site, the anomalies concentrated in the northern part of the site corresponding to the distribution of Late Archaic and Early/Middle Woodland artifacts have the highest probability of dating to these two periods.
The Early/Middle Woodland ceramic distributions at Santa Elena (Figure 6) share some similarities with the Late Archaic use of the landscape. As with the Late Archaic, later people used the same northern shoreline area. In addition, there is a circular pattern in the shovel test data; however, instead of two as the Late Archaic distribution, there is only one, more diffuse pattern. It is, however, much larger, having a diameter of around 100 m. Circular villages are not unknown for this period and several have been identified along the Florida Gulf and Georgia coasts (see [22,27,70]).

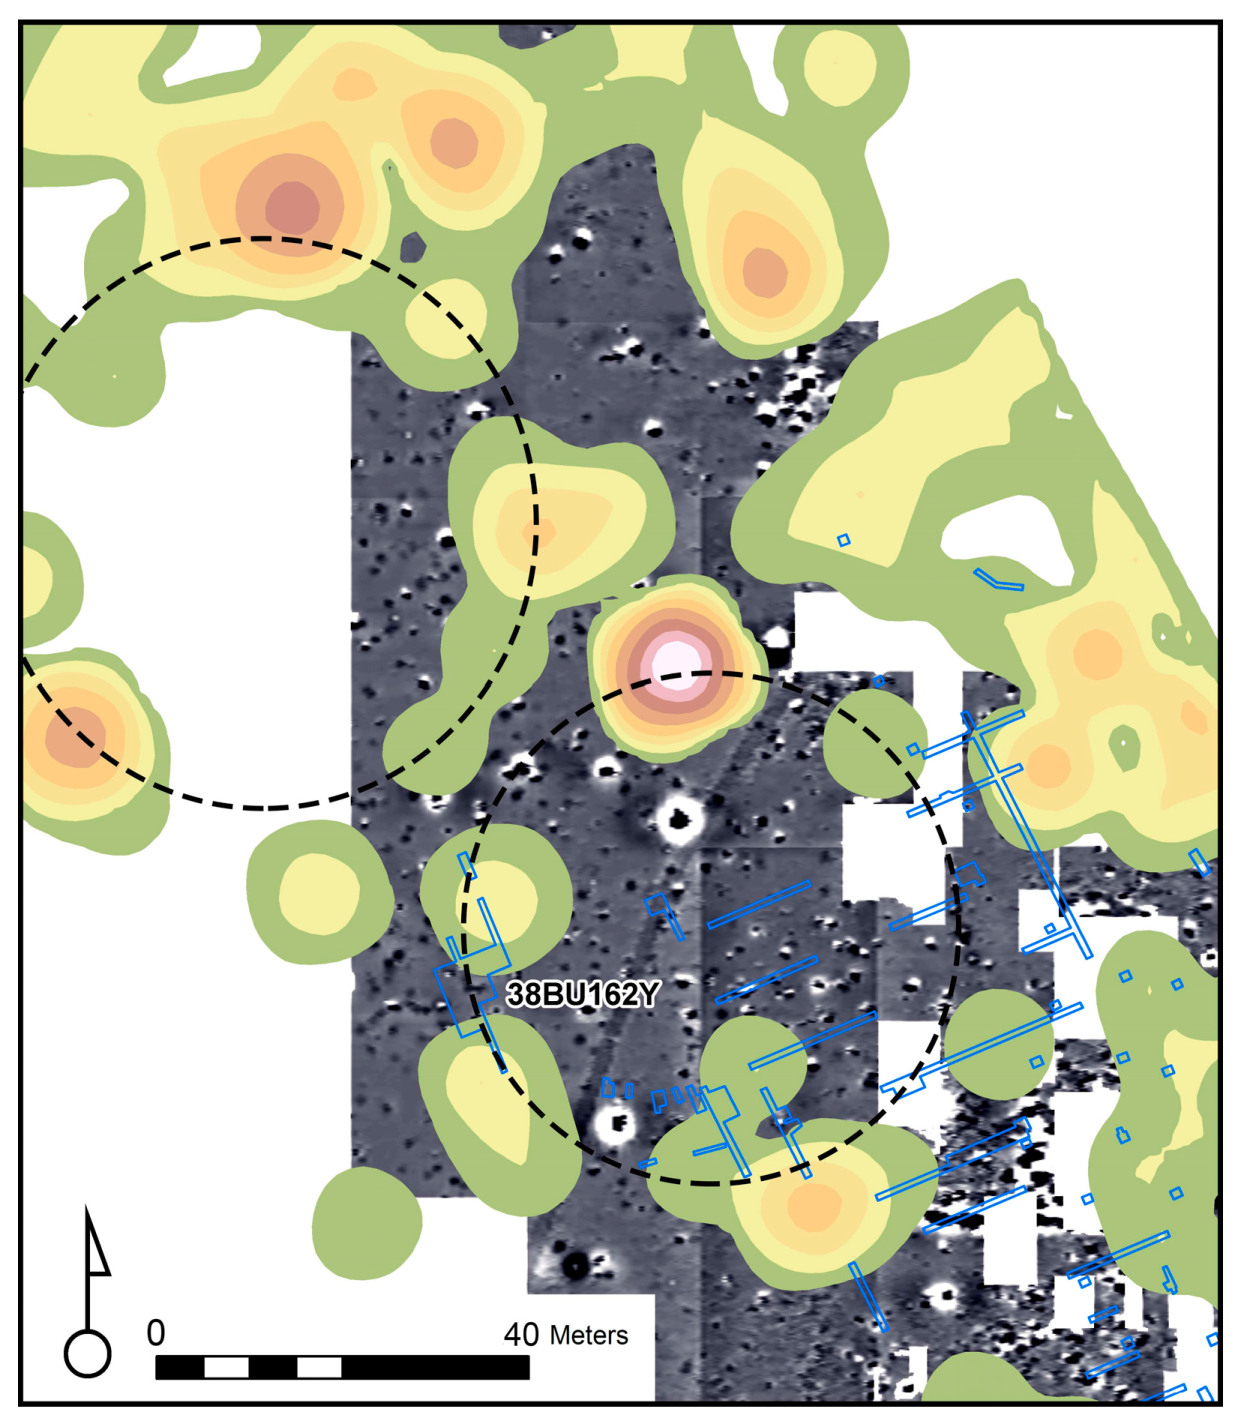
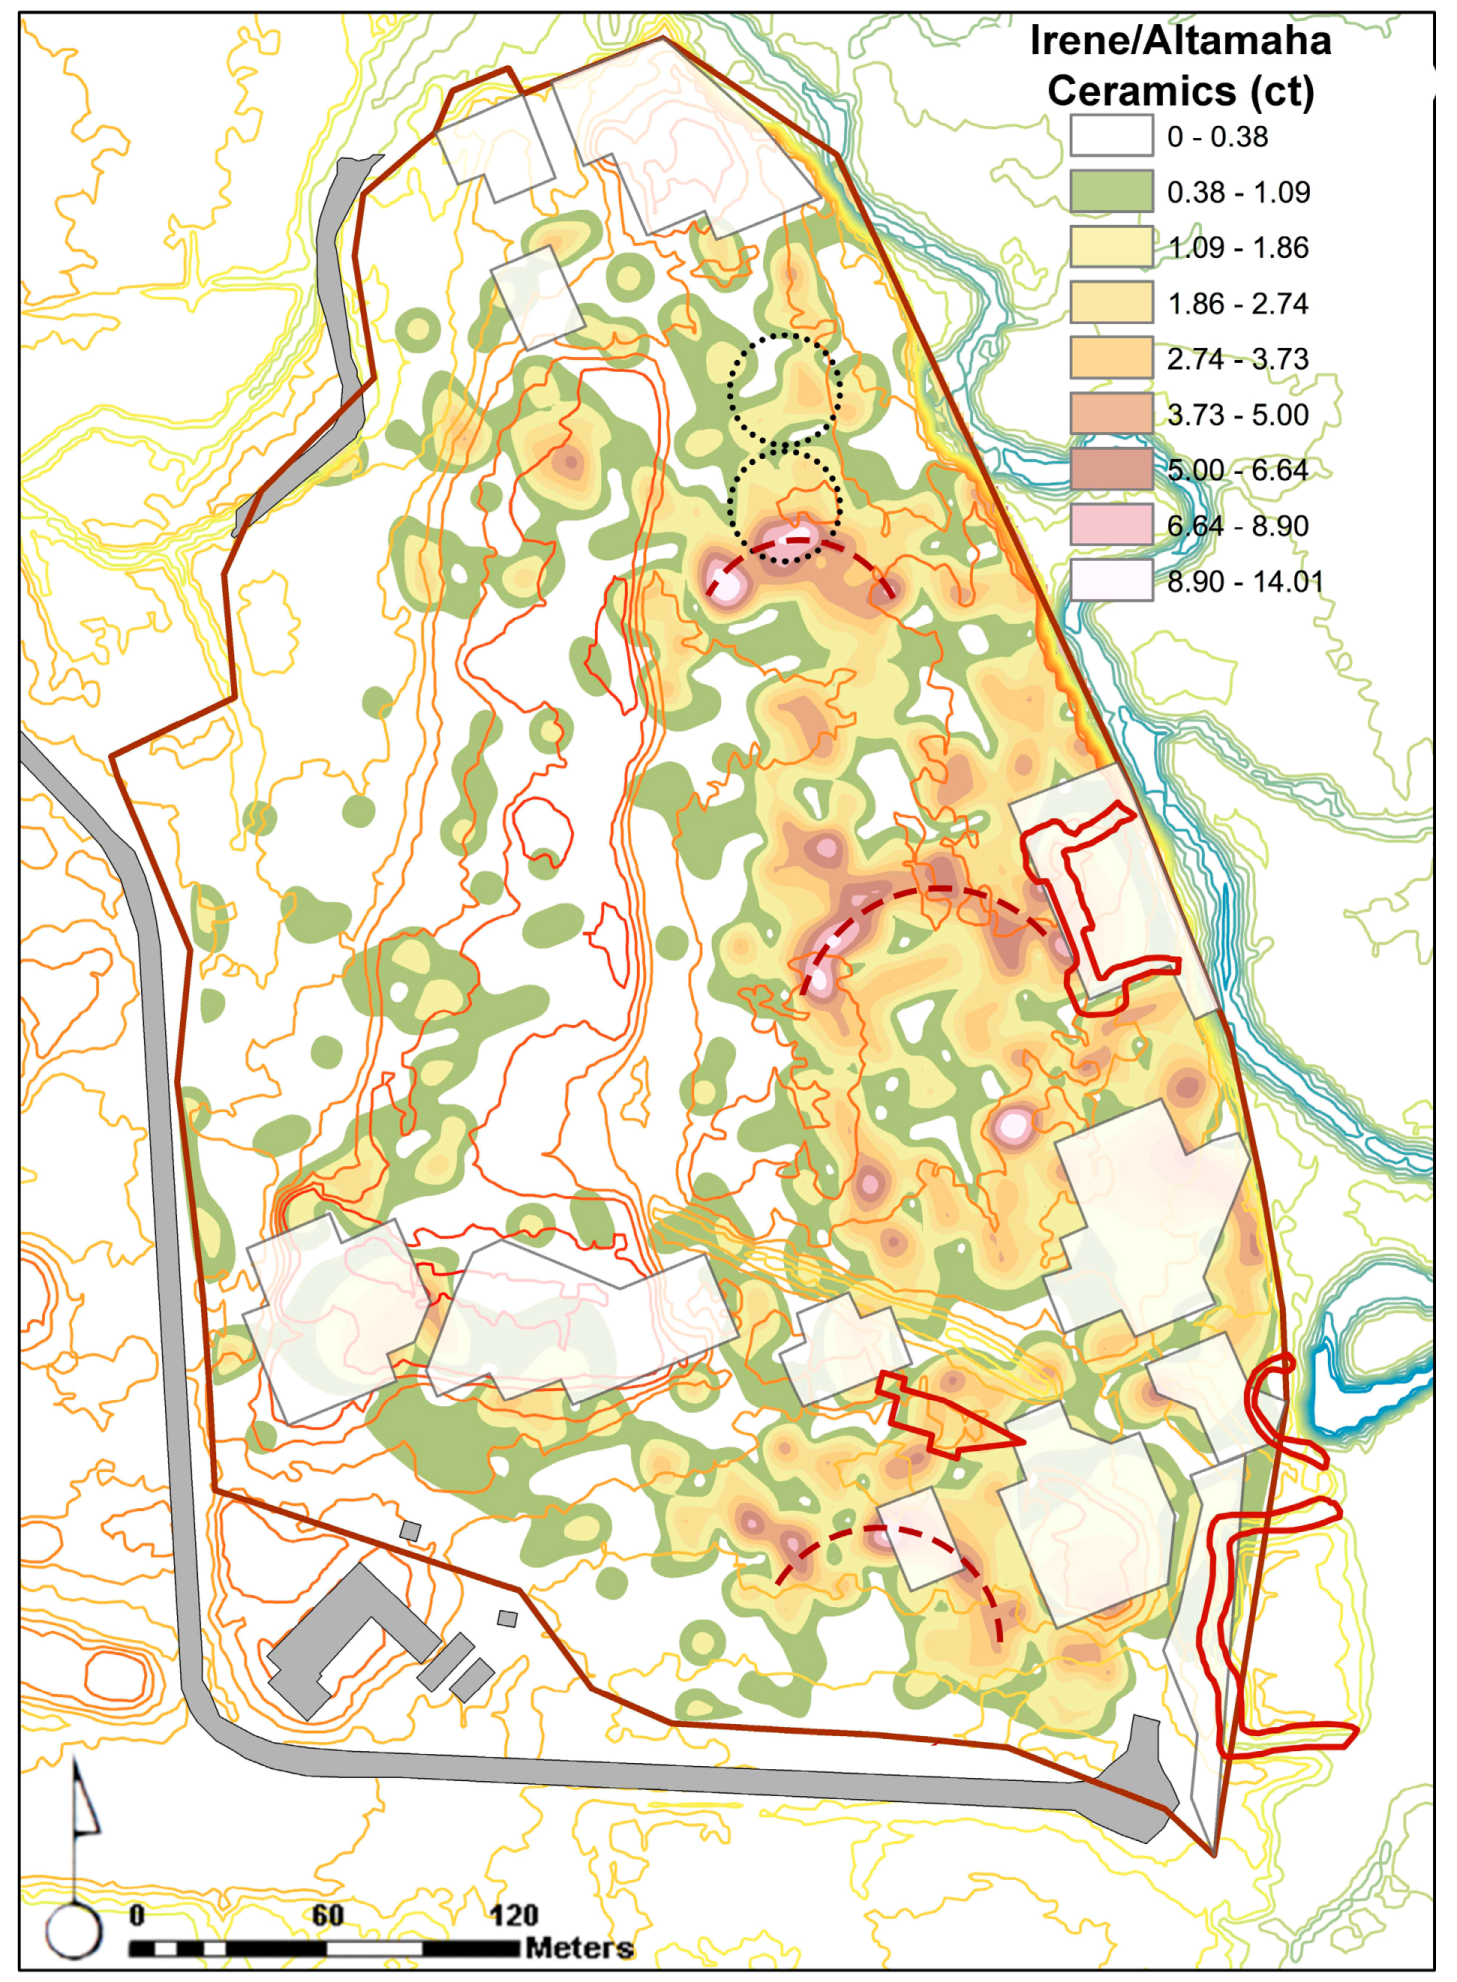
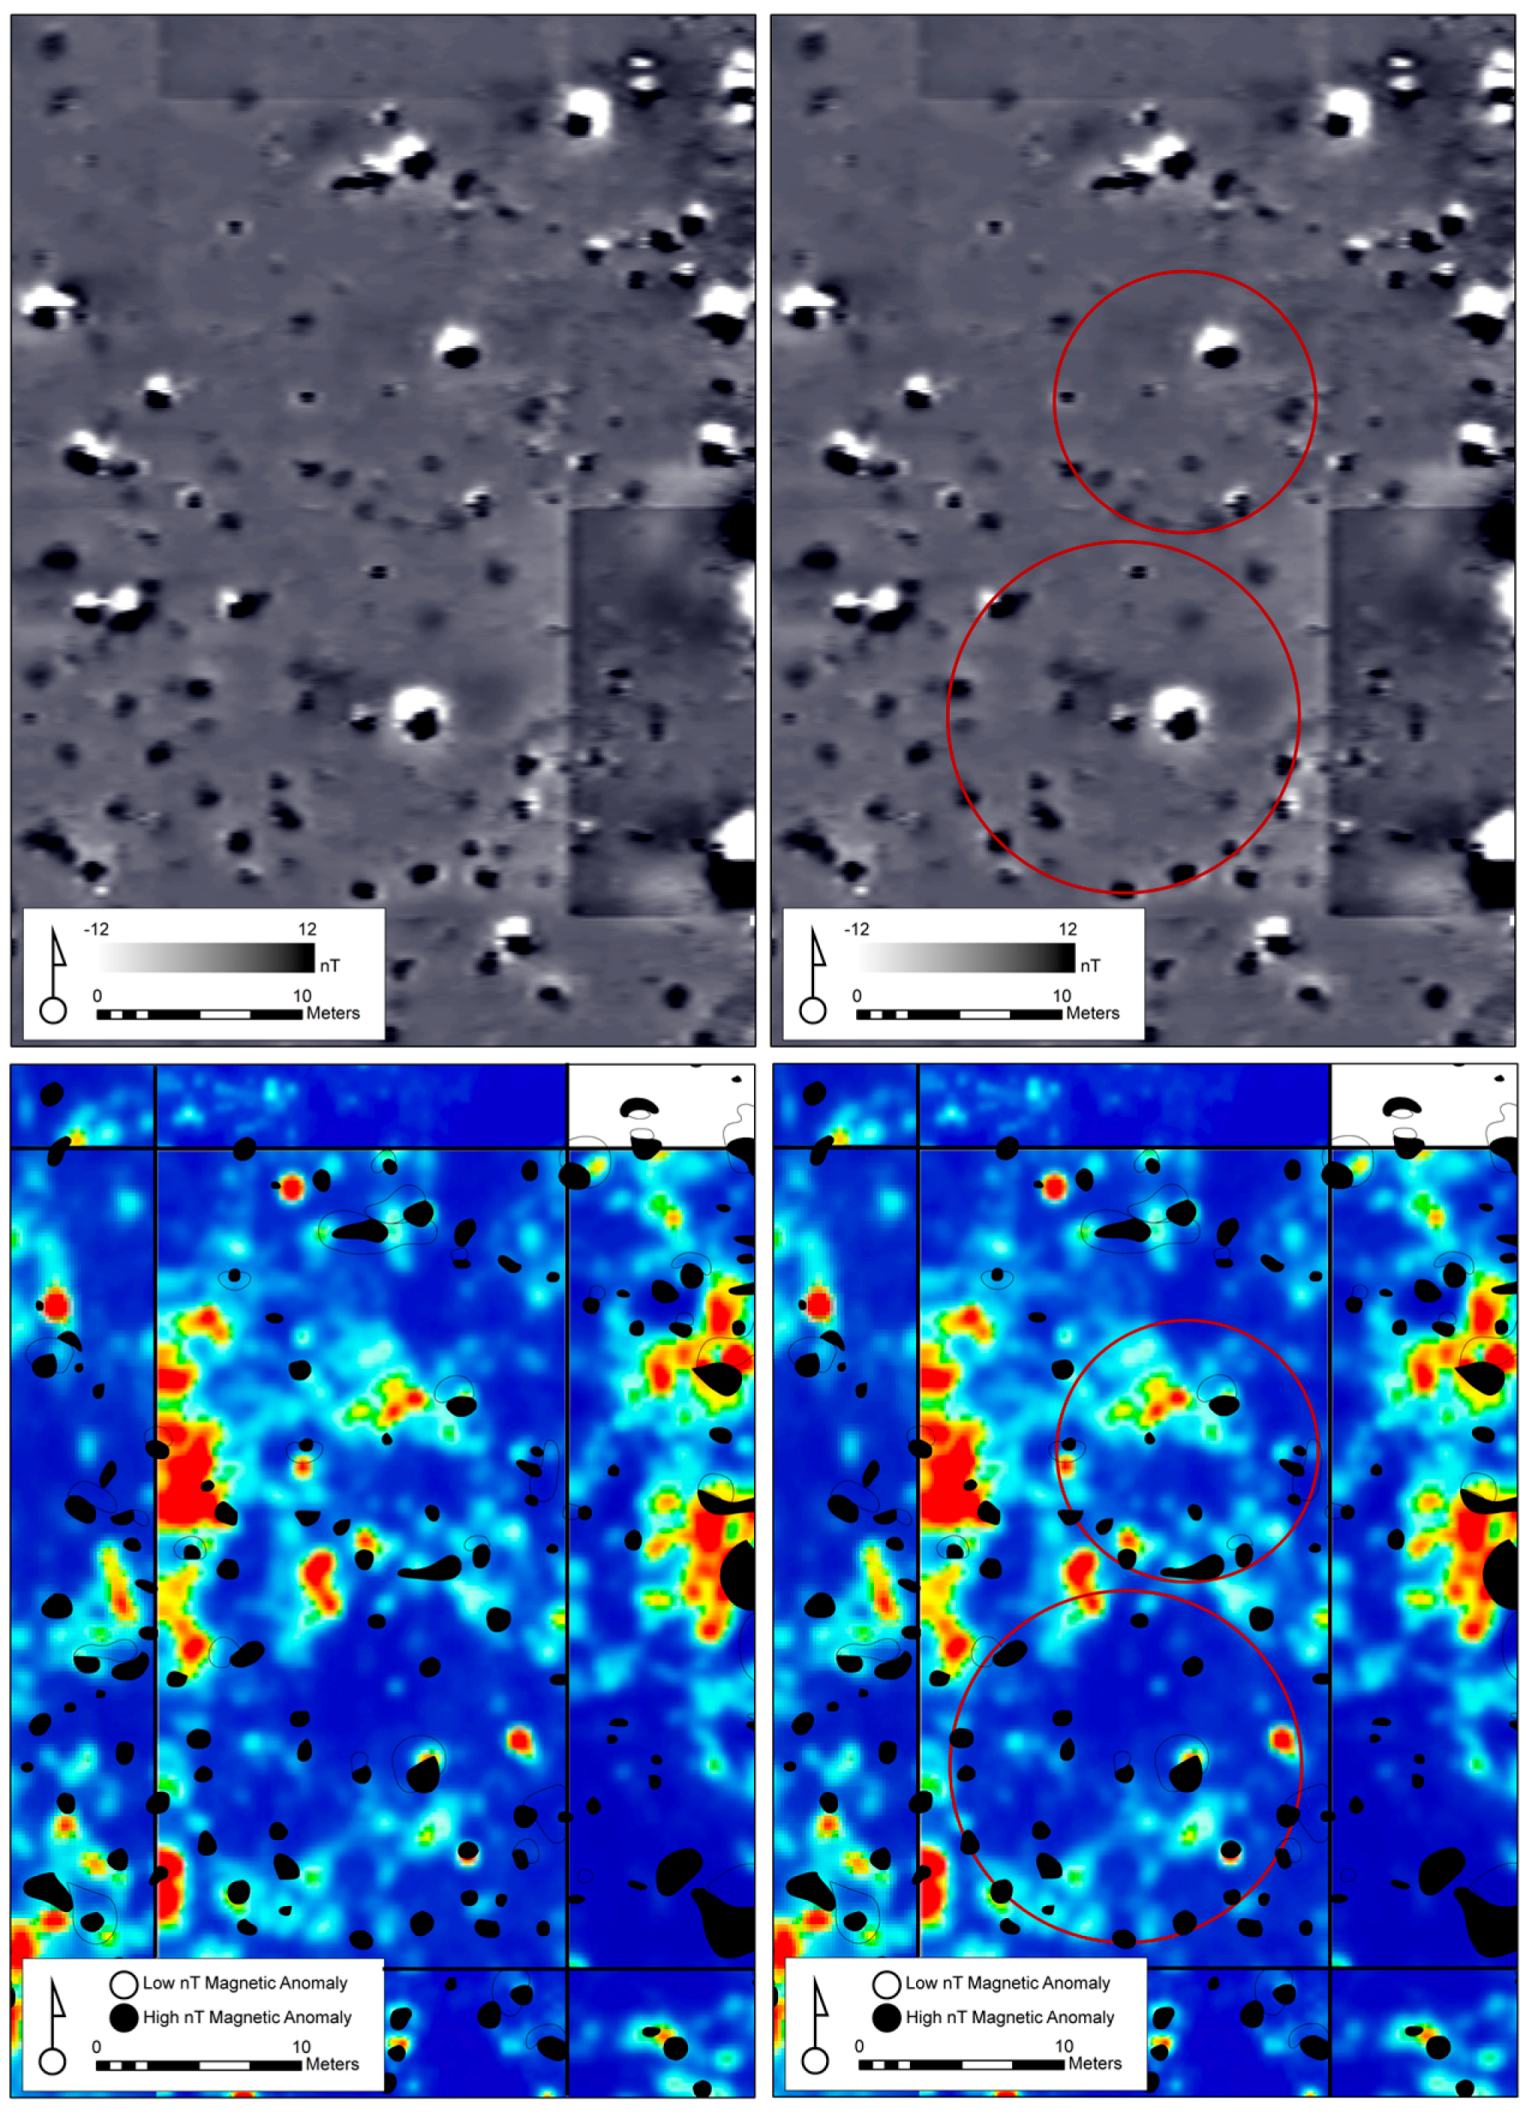
5.2. Late Woodland-Mississippian/Post-Spanish Native American Occupation

The Late-Woodland Early Mississippian distributions (i.e., Wilmington and St. Catherines ceramic types) appear to follow a similar pattern to the Middle Woodland distributions; however, the circular distributions of the artifacts are slightly less clear (Figure 6). There still seems to be an area within the heart of the occupation that is clear of artifacts, which roughly corresponds to the same area of the preceding period. This space on the landscape may be a continuation of a plaza-type configuration, given the continued lack of artifacts and features in this area.
There appears to be a light Savannah phase occupation at Santa Elena. One of the core issues is that it is difficult to separate Savannah from the sand-tempered Colonowares of the Plantation period. The distribution of these wares appears to conform closely to other plantation period artifact distributions, suggesting that almost all of these may be Colonoware and not Savannah (see the Plantation period discussion below). The exception may be in the southwestern portion of the Colonoware distribution where there seems to be a roughly circular pattern approximately 60-m in diameter. The westernmost edge of this circular pattern is located just 30 m east of a known sinkhole, just across the modern-day road. Surrounding this sinkhole are a number of low earthen mounds that are currently thought to date to the Mississippian period. The relationships between these mounds, the sinkhole, and the possible circular Savannah settlement remain ambiguous and deserve the attention of future research.
In yet another dramatic turn in spatial organization, the Irene and Altamaha distribution of ceramics appears to cover the entire site, representing the most intensive and expansive native occupation at Santa Elena (Figure 8). The reason for this is twofold. The first is that, at this point, we cannot differentiate Irene and Altamaha ceramics, as this was not done in the original analysis of the ceramic sherds. Therefore, this time frame includes occupation prior to the European occupation of Santa Elena and a second post-Spanish Native American occupation of the locale, possibly lasting through to the 1700s. The second reason for this distribution is that the Irene phase for much of the Georgia and South Carolina coast represents a dramatic increase in site size and number, and large sites are common during this period. Also, they tend to be characterized by numerous household clusters with some sites having up to 600 individual middens associated with household groups [30,71,72,73,74].
While the Irene/Altamaha distribution map seems to be saturated, a number of interesting patterns can be identified in the shovel test data, the most significant being a series of arcs representing higher concentrations of ceramic materials. Each of these arcs can be easily identified as red, pink, and white areas on the map where the concentrations of Irene/Altamaha materials are highest. The first is towards the northern quarter of the site and is roughly 60 m long. The second, moving south, is just to the west of fort San Felipe (I) and represents a semi-circular formation roughly 60 m wide. The last noticeable arc is located just south of San Marcos (I), forming a semi-circular pattern roughly 60 m in diameter. The uniformity of these patterns suggests multiple, either sequential or contemporaneous occupations at the site. However, it is safe to say, based on historic documents, that during the Spanish occupation, native villages were not located at the capital. As such, if any of these arcs represent native occupations, they were likely produced either before or after the Spanish occupation. Confounding the patterns within the Spanish colonial area is the fact that there is native pottery in Spanish features, likely the result of trade and tribute from these groups to the capital during its occupation. Therefore, these distributions represent the discard of native pottery by the Spanish.
It is interesting to point out that both the distribution of Spanish artifacts (discussed below) and the distribution of Irene/Altamaha materials leave a space of lower concentration just north and east of San Marcos (I). DePratter and South [33] argue that this area was the location of the plaza associated with the Spanish village, and this seems to be borne out by our interpretations (discussed below). The absence of Irene/Altamaha ceramics from this space suggests that it was not utilized in any intensive way before or after the Spanish contact. This could mean that this space served as a public venue before Spanish occupation and its use as a plaza may have continued after the Spanish colonists left. A higher-resolution temporal framework would allow us to address this issue in more detail.
Finally, two of the most prominent features of the native occupation were identified in the gradiometer data, and to a lesser extent, the GPR, where the patterning is subtler. These two features, illustrated in Figure 9, are two circular series of high magnetic anomalies with even higher signals located in the center of each circular pattern. It is possible that these two features represent the two structures mentioned by William Hilton when he visited the settlement [41]. The location of these two features corresponds well with the distribution of Irene/Altamaha ceramics and especially the northern concentration of these materials; however, due to the long time span during which these ceramics were used, the patterns are only generally correlated. DePratter excavated the 38BU162Y block (shown in Figure 7) while searching for this council house. These anomalies are also in the exact region of the site described by Hilton. Finally, one of the patterns that we would expect for such structures given historic descriptions and archaeological excavations would be lower, smaller, signals surrounding a large, central, highly magnetic signal. This signal would represent the central hearth that was usually in the center of these buildings. This is the exact pattern that we observe here; however, future work will need to verify if this interpretation is correct.

5.3. Spanish Colonial

There are several identifiable patterns in the shovel test data related to the Spanish occupation of Santa Elena. First, when we look at the total Spanish produced artifacts (i.e., all ceramics, architectural materials, etc.), the occupation appears to be concentrated on the eastern side of the landform and it appears that the Spanish did not heavily utilize the northern most areas of the site (Figure 10). Also in concert with the patterns identified for the Irene/Altamaha ceramics is the absence of Spanish artifacts from the potential plaza space. In addition to the absence of artifacts from this plaza space is the much lower concentration of anomalies identified in the magnetic gradiometry data (Figure 11).
When we break down the distribution of Spanish artifacts into ceramic and non-ceramic/architectural materials (which include both magnetic and non-magnetic artifacts, e.g., glass, lead shot, nails, daub, barrel parts, among others), more interesting patterns begin to emerge. In reviewing the distribution of non-ceramic artifacts (Figure 12), some of the highest concentrations of these materials are found just outside and around the known Spanish forts. The same pattern is borne out in the distribution of daub across the site (Figure 13). Beyond these distributions, we were also able to evaluate the actual architectural features associated with the prefabricated fort, San Marcos (I) (Figure 14). Our magnetic gradiometry and GPR results match surprisingly well with ethnohistoric documents outlining the form and structure of San Marcos (I) (Figure 15). The distances between the fort and other structures are idealized in the drawing which is why they are not represented in the data. We recognize that historic drawings are rarely isomorphic with geophysical data; however, the superposition of the outline of the fort onto the data provides a quick way to evaluate where the data correspond and diverge from what the fort might have looked like at one time. In addition, we do know that modifications were made over the time the fort was used, and that in the end, the Spaniards dismantled portions of it, so we do not expect the geophysical data to be an exact representation of this structure as it appears in the drawing.
In evaluating the spatial relationships between the locations of known Spanish forts and the distributions of Spanish ceramics, it is clear that the highest concentrations of Spanish ceramics are normally found just inside and abutting the walls of the Spanish forts, as well as in areas hypothesized to have been house lots (discussed below). Given the distributions of Spanish earthenware and olive jars (Figure 16) and the distributions of finer wares such as Majolica and micaceous red wares (Figure 17), we can begin to build an argument for the location of San Felipe (II). Each of these artifact classes show an area of higher concentration just north of San Marcos (II) but not associated with any known fort locations. When reviewing the LiDAR and GPR data for this area, there appears to be a curved anomaly that may represent the remains of San Felipe (II) (Figure 18), likely the remains of a ditch feature like that characterizing the structure of San Felipe (I) to the north. If we accept this proposed location for San Felipe (II), the relational pattern between known Spanish forts and the distribution of Spanish artifacts is once again replicated (Figure 19). We, however, remain cautious in identifying this as the fort, as it is possible that this feature could simply represent a former creek meander scar. It is also possible that this represents a USMC feature, as excavations in the area recovered fill related to this occupation. Future work should focus on exploring this feature more fully.
The last Spanish feature at the site that warrants discussion is the area located just south of San Marcos (I). This area likely served as the location for a number of Spanish house lots, most notably the house lot of Pedro Menéndez de Avilés. We believe that this was possibly his house lot due to the fact that DePratter recovered [33] a large number of high status pottery isolated south of the postulated plaza location and in close proximity to the landing. Figure 20 illustrates the clear pattern of Spanish artifacts and geophysical anomalies in relation to the probable location of Pedro Menéndez de Avilés’s house. On closer inspection, anomalies identified in all three geophysical datasets correspond to one another and likely represent the remains of a structure (Figure 21). As a final layer of data, Figure 22 illustrates the locations of the high status ceramic wares found at the site, whose consumption and use would have been highly restricted. These include Italian Blue wares, Mexican or Aztec red wares, and Ming dynasty Chinese pottery. Each of these materials was found in shovel tests around the area identified as the potential location of Pedro Menéndez de Avilés’s home.

5.4. The Antebellum and Postbellum Periods

The distributions of both plantation period ceramics and architectural materials conform generally to the same pattern (Figure 23 and Figure 24) (see [75]). Plantation period activities are generally concentrated near the center of the site, and generally follow a SW-NE pattern. These concentrations likely correspond to main domestic areas of the site, with agricultural fields surrounding them. The main plantation house was likely located just to the west of where San Felipe (I) once stood and is indicated by a high-density circular pattern in the distribution of plantation era architectural materials recovered from shovel tests. The distribution of Colonware corresponds to the other artifact categories and this distribution appears to be linearly organized along a slight NE-SW axis across the central portion, likely representing rows of dwellings for enslaved peoples. Another significant area of plantation era activity seems to have been located northwest of the main house. This area has a moderate amount of architectural materials, but is most characterized by the dense concentration of plantation era ceramics. The general spatial orientation and extent of the plantation era occupation generally corresponds directly with the Savannah period occupation. As such, it would likely be difficult to parse out geophysical anomalies corresponding to each period from this shovel test data alone.

6. Discussion

6.1. Four Millennia of Occupation at Santa Elena

While the site of Santa Elena was occupied for over four millennia, our analyses have revealed significant variability in the use of space and the landscape throughout this four thousand year occupation. Beginning with the Late Archaic and Early Woodland periods, the occupation of the site appears to be limited to the northernmost portions directly abutting the shoreline. As discussed above, this is consistent with settlement and occupation patterns identified elsewhere along the coast during this time period. Moving into the Middle and Late Woodland periods, we see the breakdown of two well defined circular settlement patterns towards a more diffuse, less integrated pattern of occupation. While this temporal threshold does represent a shift in the organization of settlement, occupants continued to use the northern portion and shorelines of the site most intensively. By the Savannah period, the site seems to have been almost completely abandoned, as the main Savannah period settlement is small compared to all other time periods. This represents a significant break in the occupational histories of the site and likely represents an intentional shift in settlement organization or the abandonment and eventual reoccupation of the site.
The Irene and Altamaha periods saw intensive occupations across the entire spatial extent of the site. Given our inability to separate the earlier Irene ceramics from the later Altamaha ceramics it remains difficult to elucidate in detail the settlement organization and history for this time period. In addition, the Spanish colonists consumed Irene and Altamaha ceramics and discarded them in features, further compounding our inability to disentangle the use of space at Santa Elena. The other areas of major Irene/Altamaha concentrations, separate from the Spanish artifact distributions, were likely occupied either before or after the Spanish occupation. In addition, we have revealed, through geophysical data, the probable location of the remains of two native council houses that date to the mid-17th century.
The Spanish occupation at Santa Elena was mostly restricted to the southern three-fourths of the site. There are clear relationships between the distribution of Spanish artifacts, the location of Spanish forts, and the patterning of anomalies identified in the geophysical data. Using these three lines of evidence, we have made an argument for the location of San Felipe (II), just north of San Marcos (II), although again this could be a former creek channel. This locality fits the general layout of the site with respect to the distribution of artifacts, locations of the other forts, and the location of the Spanish plaza area which is known from the paucity of artifacts and the lower concentration of geophysical anomalies in the area north of San Marcos (I). We have also presented data that support the general location of Pedro Menéndez de Avilés’s house lot at the site, located just south of San Marcos (I).
Given the complex occupational history manifest in the archaeological record of the Santa Elena site, the use of traditional “ground truthing” would have had difficulty in yielding the interpretations we present. It is only through the full-coverage, multi-method geophysical survey reported here, contextualized and evaluated in the context of a close-interval shovel test survey, that we are able to begin to unravel the deep historical palimpsests of occupation and activity at Santa Elena.

6.2. Implications for Research Methods

As we note at the outset of this paper, interpreting remote sensing datasets over large sites with substantial histories of occupation is often quite difficult. The continued occupation and the making and remaking of deposits, features, and landscapes create various types of archaeological palimpsests (see [76]), all of which impede the clarity by which cultural features and human modification of the land can be identified in both ground-based and aerial surveys. To solve this problem for the Santa Elena research, we did what any good researcher would do and looked to the previous work at the site—in particular the shovel test survey. Through this process, we discovered the efficacy of a close interval (<10 m) shovel test data as a complimentary dataset to large-scale remote sensing surveys. Surprisingly there has been no formal evaluation of how these two different types of archaeological data articulate with one another. Johnson and Haley (2006) provide a nice overview of the cost-effectiveness of the two methods, suggesting that cultural resource management (CRM) costs can be offset with the use of remote sensing. In addition, there are many examples from eastern North America where researchers have combined these two datasets; however, these are largely from research reports and CRM archaeology (e.g., [77,78,79,80]). The explicit articulation of these two kinds of datasets and how they work together from a research standpoint, on the other hand, has not been adequately addressed to our knowledge outside of CRM, with only minimal formal comparisons (see [81,82] for exceptions). Additionally, in cases where these two types of data have been combined, they are largely focused on a specific component, or single-component sites, and not on large, continuously occupied sites with complex settlement histories.
So why are formal comparisons of remote sensing and close-interval shovel test data so rare in the archaeological literature? Using them together makes intuitive sense, as illustrated by the few cases we found that do employ both methodologies. We feel it is productive to pause and consider just why it is that these two datasets are particularly complementary, especially for long-term site occupations. In addition, it is also useful to consider how close-interval shovel test data is different from more traditional types of “ground truthing” in the context of interpreting remote sensing data. In general, we learned five important lessons that, while in hindsight are quite obvious, deserve stating directly:
  • Remote sensing data and close-interval shovel testing surveys provide complimentary, but independent, datasets by which the changing nature of space and architecture can be evaluated in high-resolution.
  • Even when cultural features (e.g., houses, walls) are clearly discernible in remote sensing data, shovel test data provide information on the distribution of geophysically invisible activity areas that can then be connected to more formal features.
  • Shovel testing on a close (<10 m), fixed interval grid provides a different kind of “ground truthing” than what is traditionally employed. Instead of placing units directly over a given “anomaly,” shovel testing can provide a much more complete context for the interpretation of the relationships between anomalies and identifiable culture features, including spaces that contain no signatures in the remote sensing data. Thus, while traditional ground truthing only tests identifiable patterns and signals in the data, fixed interval shovel testing provides information on how these signals articulate with one another given the distribution of activities across the site, including areas that may be avoided or kept clean of refuse and other features.
  • Given that the usual employment of ground-based instruments provides mostly two-dimensional datasets, shovel testing, especially ones that are excavated in levels, provide information on the distribution of artifacts and features at varying depths. For sites with long-term histories this is especially important as it allows researchers to tease apart which patterns in geophysical data are associated with specific components.
  • Although researchers often use GPR on a much smaller scale than other methods, we found that a large-scale GPR survey and close-interval shovel tests, excavated in levels, provide perhaps one of the best ways to evaluate space and architecture at multi-component sites. The reason for this is that both datasets provide information not only on the horizontal distribution of features and artifacts, but also their vertical position vis-à-vis one another. Admittedly, a large-scale GPR survey and shovel testing at close intervals over an entire site, especially a large one, are perhaps some of the more labor-intensive methods of archaeological survey. Nevertheless, our estimate is that, in many cases, this is well worth the cost in time and funds.

6.3. Management Implications and Recommendations

As we write this paper, one of the largest Atlantic hurricanes (Irma) in recorded history just hit Florida and has battered parts of Georgia and South Carolina with tropical storm force winds and storm surges. Hurricane Matthew recently impacted Santa Elena in 2016, promoting the temporary closure of the Charlesfort Santa Elena National Historic Landmark (http://www.mcrdpi.marines.mil/News/Press-Release-View/Article/992791/charlesfort-santa-elena-national-historic-landmark-temporarily-closed/). Climate scientists predict that the frequency of such storms is likely to increase due to anthropogenic impacts on global climate (IPCC 2014). These storms contribute to the continued erosion of the site’s cultural resources—including some of its more significant structures. Thus, in the coming years, Santa Elena will see more and more damage from such events.
Sea level rise will also impact and exacerbate the vulnerability of the site to large-scale storms. Some current projections by the IPCC conservatively suggest a 1 m rise in sea level by the year 2100 [83]. The current elevation of the Charlesfort/Santa Elena National Historic Landmark is at its highest point only about 3-m above mean sea level, meaning that even with the conservative estimates put forth, global sea level rise and its local impacts will affect this area with increased flood events from higher than normal amplitude tides. Furthermore, these effects are not simply hypothetical or future projections; the cultural resources of the site are already being impacted yearly.
Based on historical documents, previous archaeological research by DePratter and South, and our LiDAR imaging of the forts, approximately 60% of Fort San Marcos (II) has eroded away, while 50% of Fort San Felipe (I) has been lost. Additionally, if we are correct regarding the location of Fort San Felipe (II), roughly 99% of this fort is now gone (Figure 19). These are among the earliest Spanish forts in the United States. Once these structures are gone, then the opportunity to learn from them is gone as well. Based on these observations, we estimate that these structures, along with other near shoreline cultural resources, will be lost in the near future (i.e., by the end of this century, but likely earlier).
Given these predictions, we suggest that a concerted effort be made to conduct large-scale recovery excavations along the shoreline edge of the site. The shovel test results and our new remote sensing maps provide information on where dense concentrations of features and artifacts are found in this area of the site. We identify the now eroding Fort San Marcos (II) and San Felipe (I), along with Charlesfort which is under San Felipe (I) (see [84]), as high-priority areas and suggest the need to conduct excavation of these structures to armor against further erosion. In addition, the possible location of San Felipe (II) should be immediately evaluated as it appears that the vast majority of this structure is eroded and will be gone in a relatively short amount of time. Finally, while the shovel test survey provided a robust dataset to evaluate the remote sensing data, we are still left with many questions due to the enormity of the remote sensing data and the number of potentially significant features in these data. As such, we suggest minimally invasive coring of GPR, magnetic, and resistance features identified in the survey. This, along with the shovel test data, will aid in the identification of these features and the cultural component to which they belong (e.g., Spanish wells). Coring is a fast, inexpensive, and relatively non-invasive technique [85]. We recommend that these be done as soon as possible as these data will also inform future management strategies of the site’s cultural resources.

7. Conclusions

Our recent research at Charlesfort/Santa Elena provides important insight into the distribution of cultural features at this National Historic Landmark. While the majority of archaeological research at the site has focused on the Spanish period, our work suggests a complex and vast array of archaeological features that can provide insight into over 4000 years of history in the region. At a gross level, we have identified possible Late Archaic structures, Woodland houses and features, Late Prehistoric and early Historic council houses, and a suite of features related to the Spanish occupation, which builds on our previous research at the site.
In addition to documenting possible cultural features at the site, our work illustrates the value of multiple remote sensing techniques used in conjunction with close-interval shovel test data. While researchers have used both types of datasets together implicitly, this work represents the first formal evaluation on the utility of their use in conjunction with sites occupied over long spans of time. Our summary evaluation is that even though such work is time consuming, it provides some of the best data to evaluate complex geophysical data. Finally, we also argue that in addition to research, these two datasets provide important guidance regarding the management of sites and cultural resources that fall short with targeted archaeological excavation, or with either of these as stand-alone datasets. Therefore, we suggest that, from a research and management perspective, archaeologists should use both of these methods to properly assess both localized areas of importance and the larger landscape in which they are situated.

Acknowledgments

This research is based upon work supported by the Santa Elena Foundation. The South Carolina Institute for Archaeology and Anthropology (SCIAA), University of South Carolina, SCIAA’s Archaeological Research Trust, and the Department of Anthropology and Laboratory of Archaeology at the University of Georgia provided additional support for this work. We thank Chris Rodning, Dean Goodman, Jarod Burks, Larry Conyers, Jim Legg, Heathley Johnson, Kimberly Zawacki, and many others who advised us on this project. We thank the U.S. Marine Corps of Parris Island for allowing us access to the site. The University of Georgia Archaeology Field School students helped and made possible the scale of the remote sensing survey. Without them, the work would not have been possible. Finally, we thank the four anonymous reviewers who provided substantive comments on this manuscript.

Author Contributions

Victor D. Thompson, Chester B. DePratter, and Amanda D. Roberts Thompson conceived and designed the shallow geophysical survey at the site; Chester B. DePratter directed archaeological excavations at the site and provided historic data; Amanda D. Roberts Thompson and Jacob Lulewicz analyzed all composite datasets; Victor D. Thompson, Jacob Lulewicz, Isabelle H. Lulewicz, Brandon T. Ritchison, Justin Cramb, Amanda D. Roberts Thompson, Chester B. DePratter, and Matt H. Colvin aided in the collection and processing, and interpretation of all geophysical data; Jacob Lulewicz produced all figures; Thompson wrote the first draft of the paper and substantive edits and additions were made by Jacob Lulewicz, Chester B. DePratter, and Amanda D. Roberts Thompson.

Conflicts of Interest

The authors declare no conflict of interest. The founding sponsors had no role in the design of the study; in the collection, analyses, or interpretation of data; in the writing of the manuscript, nor in the decision to publish the results.

References

  1. Thompson, V.D.; DePratter, C.B.; Roberts Thompson, A.D. Defining Santa Elena’s Colonial Landscape through Shallow Geophysics. J. Archaeol. Sci. Rep. 2016, 9, 178–190. [Google Scholar]
  2. Manucy, A. Report on Relics from 1923 Excavation of Fortification Site on Parris Island, South Carolina; National Park Service: St. Augustine, FL, USA, 1957.
  3. Osterhout, G. After Three Hundred and Fifty Years—Being the Story of Charles’ Fort, Built by Jean Ribault in 1562 on What Is now Known as Parris Island, South Carolina; Marine Corps Association: Quantico, VA, USA, 1923; pp. 98–109. [Google Scholar]
  4. Rowland, L.S.; Wise, S.R. Bridging the Sea Islands’ Past and Present, 1893–2006: The History of Beaufort County, South Carolina; University of South Carolina Press: Columbia, SC, USA, 2015; Volume 3. [Google Scholar]
  5. Salley, A.S., Jr. The Spanish Settlementat Port Royal, 1565–1586. South Carol. Hist. Geneal. Mag. 1925, 26, 31–40. [Google Scholar]
  6. Salley, A.S., Jr. The Site of Charlesfort. In The Whole and True Discovery of Florida; Connor, J.T., Ed.; Florida State Hsitorical Society: Deland, FL, USA, 1927; pp. 113–124. [Google Scholar]
  7. South, S. A Search for the French Charlesfort of 1562; South Carolina Institute of Archaeology and Anthropology Resarch Manuscript 177; University of South Carolina: Columbia, SC, USA, 1982. [Google Scholar]
  8. South, S. Exploring Santa Elena 1981; South Carolina Institute of Archaeology and Anthropology Research Manuscript 184; University of South Carolina: Columbia, SC, USA, 1982. [Google Scholar]
  9. South, S. Revealing Santa Elena 1982; South Carolina Institute of Archaeology and Anthropology Research Manuscript Series 188; University of South Carolina: Columbia, SC, USA, 1983. [Google Scholar]
  10. South, S. Testing Archaeological Sampling Methods at Fort San Felipe 1983; South Carolina Institute of Archaeology and Anthropology Research Manuscript Series 190; University of South Carolina: Columbia, SC, USA, 1984. [Google Scholar]
  11. South, S. Excavation of the Casa Fuerte and Wells at Fort San Felipe 1984; South Carolina Institute of Archaeology and Anthropology Research Manuscript Series 196; University of South Carolina: Columbia, SC, USA, 1985. [Google Scholar]
  12. South, S.; DePratter, C.B. Discovery at Santa Elena: Block Excavation 1993; South Carolina Institute of Archaeology and Anthropology Research Manuscript Series 222; University of South Carolina: Columbia, SC, USA, 1996. [Google Scholar]
  13. Wise, S.R.; Rowland, L.S. Rebellion, Reconstruction, and Redemption, 1861–1893; University of South Carolina Press: Columbia, SC, USA, 2015; Volume 2. [Google Scholar]
  14. Sanger, M.C. Leaving the rings: Shell ring abandonment and the end of the Late Archaic. In Trend, Tradition, and Turmoil: What Happened to the Southeastern Archaic; Thomas, D.H., Sanger, M., Eds.; American Museum of Natural History Anthropological Papers, Number 93; American Museum of Natural History: New York, NY, USA, 2010; pp. 201–216. [Google Scholar]
  15. Sanger, M.C. Life in the Round: Shell Rings of the Georgia Bight; Columbia University: New York, NY, USA, 2015. [Google Scholar]
  16. Thomas, D.H. “What happened to the southeastern Archaic?” A perspective from St. Catherines Island. In Trend, Tradition, and Turmoil: What Happened to the Southeastern Archaic; Thomas, D.H., Sanger, M., Eds.; Anthropological Papers; American Museum of Natural History: New York, NY, USA, 2010; pp. 173–199. [Google Scholar]
  17. Thompson, V.D.; Worth, J.E. Dwellers by the Sea: Native American Adaptations along the Southern Coasts of Eastern North America. J. Archaeol. Res. 2011, 19, 51–101. [Google Scholar] [CrossRef]
  18. DePratter, C.B. Shellmound Archaic on the Georgia Coast. South Carol. Antiq. 1979, 11, 1–69. [Google Scholar]
  19. DePratter, C.B. Thoughts on the Late Archaic-Early Woodland Transition on the Georgia and South Carolina Coasts. In Trend, Tradition, and Turmoil: What Happened to the Southeastern Archaic; Thomas, D.H., Sanger, M.C., Eds.; Anthropological Papers, Number 93; American Museum of Natural History: New York, NY, USA, 2010; pp. 247–252. [Google Scholar]
  20. Thompson, V.D. The rhythms of space-time and the making of monuments and places during the Archaic. In Trend, Tradition, and Turmoil: What Happened to the Southeastern Archaic; Thomas, D.H., Sanger, M.C., Eds.; Anthropological Papers, Number 93; American Museum of Natural History: New York, NY, USA, 2010; pp. 217–227. [Google Scholar]
  21. Thompson, V.D.; Andrus, C.F.T. Evaluating Mobility, Monumentality, and Feasting at the Sapelo Island Shell Ring Complex. Am. Antiq. 2011, 76, 315–343. [Google Scholar] [CrossRef]
  22. Thompson, V.D.; Turck, J.A. Adaptive Cycles of Coastal Hunter-Gatherers. Am. Antiq. 2009, 74, 255–278. [Google Scholar] [CrossRef]
  23. Turck, J.A.; Thompson, V.D. Revisiting the Resilience of Late Archaic Hunter-gatherers along the Georgia Coast. J. Anthropol. Archaeol. 2016, 43, 39–55. [Google Scholar] [CrossRef]
  24. Thomas, D.H. Native American Landscapes of St. Catharines Island, Georgia, Vol. III. Synthesis and Implications; Anthropological Papers, Number 88; American Museum of Natural History: New York, NY, USA, 2008. [Google Scholar]
  25. Pluckhahn, T.J.; McKivergan, D.A. A Critical Appraisal of Middle Mississippian Settlement and Social Organization on the Georgia Coast. Southeast. Archaeol. 2002, 21, 149–161. [Google Scholar]
  26. Thompson, V.D. The Mississippian Production of Space through Earthen Pyramids and Public Buildings on the Georgia Coast, USA. World Archaeol. 2009, 41, 445–470. [Google Scholar] [CrossRef]
  27. DePratter, C.B. W.P.A. Archaeological Excavations in Chatham County, Georgia: 1937–1942; Series No. 29; Univerity of Georgia, Laboratory of Archaeology: Athens, Georgia, 1991. [Google Scholar]
  28. Ritchison, B.T. Exploring a Bayesian method for examining the regional ceramic sequence along the Georgia Coast. Southeast. Archaeol. 2017, 1–10. [Google Scholar] [CrossRef]
  29. DePratter, C.B. Irene and Altamaha Ceramics from the Charlesfort/Santa Elena Site, Parris Island, South Carolina. In From Santa Elena to St. Augustine: Indigenous Ceramic Variability (AD1400-1700); Deagan, K., Thomas, D.H., Eds.; Anthropological Papers, Number 90; American Museum of Natural History: New York, NY, USA, 2009; pp. 19–48. [Google Scholar]
  30. Thompson, V.D.; Turck, J.A. Island Archaeology and the Native American Economies (2500 B.C.-A.D. 1700) of the Georgia Coast. J. Field Archaeol. 2010, 35, 283–297. [Google Scholar] [CrossRef]
  31. Hutchinson, D.L.; Larsen, C.S.; Schoeninger, M.J.; Norr, L. Regional variation in the pattern of maize adoption and use in Florida and Georgia. Am. Antiq. 1998, 63, 397–416. [Google Scholar] [CrossRef]
  32. Larsen, C.S.; Griffin, M.C.; Hutchinson, D.L.; Noble, V.E.; Norr, L.; Pastor, R.F.; Ruff, C.B.; Russell, K.F.; Schoeninger, M.J.; Schultz, M. Frontiers of contact: Bioarchaeology of Spanish Florida. J. World Prehist. 2001, 15, 69–123. [Google Scholar] [CrossRef]
  33. DePratter, C.B.; South, S. Discovery at Santa Elena: Boundary Survey; South Carolina Institute of Archaeology and Anthropology Research Manuscript Series 221; University of South Carolina: Columbia, SC, USA, 1995. [Google Scholar]
  34. Hoffman, P.E. A New Andalucia and a Way to the Orient: The American Southeast during the Sixteenth Century; LSU Press: Baton Rouge, LA, USA, 1990. [Google Scholar]
  35. Hoffman, P.E. Florida’s Frontiers; Indiana University Press: Bloomington, IN, USA, 2001. [Google Scholar]
  36. Lyon, E. The Enterprise of Florida: Pedro Menéndez de Avilés and the Spanish Conquest of 1565–1568; University Presses of Florida: Gainesville, FL, USA, 1983. [Google Scholar]
  37. Lyon, E. Santa Elena: A Brief History of the Colony; South Carolina Institute of Archaeology and Anthropology Research Manuscript Series 193; University of South Carolina: Columbia, SC, USA, 1984. [Google Scholar]
  38. McGrath, J.T. The French in Early Florida: In the Eye of the Hurricane; University Press of Florida: Gainesville, FL, USA, 2000. [Google Scholar]
  39. DePratter, C.B.; South, S.; Legg, J.B. The Discovery of Charlesfort. Trans. Huguenot Soc. South Carol. 1996, 101, 39–48. [Google Scholar]
  40. Connor, J.T. Colonial Records of Spanish Florida-Volume 1: 1570–1577; Florida State Historical Society: Cocoa, FL, USA, 1925. [Google Scholar]
  41. Hilton, W. Narrative of Discovery. In Narratives of Early Carolina (1650–1708); Salley, A.S., Jr., Ed.; Charles Scribner’ss Sons: New York, NY, USA, 1911; pp. 31–61. [Google Scholar]
  42. Worth, J.E. The Struggle for the Georgia Coast: An Eighteenth-Century Spanish Retrospective on Guale and Mocama; Anthropological Papers, Number 75; American Museum of Natural History: New York, NY, USA, 1995. [Google Scholar]
  43. Legg, J.B. The Great War at Santa Elena: The Incidental Archaeology of World War I Marine Corps training on Parris Island. In Praise of the Poet Archaeologist: Papers in Honor of Stanley South and His Five Decades of Historical Archaeology; Carnes-McNaughton, L.F., Steen, C., Eds.; Council of South Carolina Professional Archaeologists: Columbia, SC, USA, 2005; Volume 1, pp. 120–140. [Google Scholar]
  44. Harmon, J.M.; Leone, M.P.; Prince, S.D.; Snyder, M. Lidar for archaeological landscape analysis: A case study of two eighteenth-century Maryland plantation sites. Am. Antiq. 2006, 71, 649–670. [Google Scholar] [CrossRef]
  45. Gallagher, J.M.; Josephs, R.L. Using LiDAR to detect cultural resources in a forested environment: An example from Isle Royale National Park, Michigan, USA. Archaeol. Prospect. 2008, 15, 187–206. [Google Scholar] [CrossRef]
  46. Pluckhahn, T.J.; Thompson, V.D. Integrating LiDAR data and conventional mapping of the Fort Center site in south-central Florida: A comparative approach. J. Field Archaeol. 2012, 37, 289–301. [Google Scholar] [CrossRef]
  47. Thompson, V.D. Conceptualizing Anthropogenic Islands through LiDAR in Southern Florida. In New Approaches to Anthropological Remote Sensing; McKinnon, D., Haley, B.S., Eds.; The University of Alabama Press: Tuscaloosa, AL, USA, 2017; pp. 127–140. [Google Scholar]
  48. Thompson, V.D.; Marquardt, W.H.; Walker, K.J. A remote sensing perspective on shoreline modification, canal construction and household trajectories at Pineland along Florida’s southwestern Gulf Coast. Archaeol. Prospect. 2014, 21, 59–73. [Google Scholar] [CrossRef]
  49. Ackermann, F. Airborne laser scanning—Present status and future expectations. ISPRS J. Photogramm. Remote Sens. 1999, 54, 64–67. [Google Scholar] [CrossRef]
  50. Doneus, M.; Briese, C.; Fera, M.; Janner, M. Archaeological prospection of forested areas using full-waveform airborne laser scanning. J. Archaeol. Sci. 2008, 35, 882–893. [Google Scholar] [CrossRef]
  51. Kvamme, K.L. Magnetometry: Nature’s gift to archaeology. In Remote Sensing in Archaeology: An Explicitly North American Perspective; Johnson, J.K., Ed.; The University of Alabama Press: Tuscaloosa, AL, USA, 2006; pp. 251–268. [Google Scholar]
  52. Gater, J.; Gaffney, C. Revealing the Buried Past: Geophysics for Archaeologists; Tempus: Wiltshire, UK, 2003. [Google Scholar]
  53. Sommers, L. Resistivity Survey. In Remote Sensing in Archaeology: An Explicitly North American Perspective; Johnson, J.K., Ed.; University of Alabama Press: Tuscaloosa, AL, USA, 2006; pp. 109–130. [Google Scholar]
  54. Bigman, D.P.; Lanzarone, P.M. Investigating Construction History, Labour Investment and Social Change at Ocmulgee National Monument’s Mound A, Georgia, USA, Using Ground-penetrating Radar. Archaeol. Prospect. 2014, 21, 213–224. [Google Scholar] [CrossRef]
  55. Bigman, D.P.; King, A.; Walker, C.P. Recent geophysical investigations and new interpretations of Etowah’s Palisade. Southeast. Archaeol. 2011, 30, 38–50. [Google Scholar] [CrossRef]
  56. Burks, J. Geophysical survey at Ohio earthworks: Updating nineteenth century maps and filling the ‘empty’ spaces. Archaeol. Prospect. 2014, 21, 5–13. [Google Scholar] [CrossRef]
  57. Burks, J.; Cook, R.A. Beyond Squier and Davis: Rediscovering Ohio’s earthworks using geophysical remote sensing. Am. Antiq. 2011, 76, 667–689. [Google Scholar] [CrossRef]
  58. Davis, J.R.; Walker, C.P.; Blitz, J.H. Remote sensing as community settlement analysis at Moundville. Am. Antiq. 2015, 80, 161–169. [Google Scholar] [CrossRef]
  59. Gaffney, C.F.; Gaffney, V.; Neubauer, W.; Baldwin, E.; Chapman, H.; Garwood, P.; Moulden, H.; Sparrow, T.; Bates, R.; Löcker, K. The Stonehenge hidden landscapes project. Archaeol. Prospect. 2012, 19, 147–155. [Google Scholar] [CrossRef]
  60. Haley, B.S. The big picture at Hollywood: Geophysical and archaeological investigations at a Mississippian mound centre. Archaeol. Prospect. 2014, 21, 39–47. [Google Scholar] [CrossRef]
  61. Kvamme, K.L. Geophysical surveys as landscape archaeology. Am. Antiq. 2003, 68, 435–457. [Google Scholar] [CrossRef]
  62. Kvamme, K.L. Archaeological prospecting at the double ditch state historic site, North Dakota, USA. Archaeol. Prospect. 2008, 15, 62–79. [Google Scholar] [CrossRef]
  63. Conyers, L.B. Ground-penetrating radar for landscape archaeology: Method and applications. In Seeing the Unseen; Campana, S., Piro, S., Eds.; Taylor and Francis: London, UK, 2006; pp. 245–255. [Google Scholar]
  64. Conyers, L.B. Ground-penetrating radar for anthropological research. Antiquity 2010, 84, 175–184. [Google Scholar] [CrossRef]
  65. Conyers, L.B. Interpreting Ground-Penetrating Radar for Archaeology; Left Coast Press: Walnut Creek, CA, USA, 2012. [Google Scholar]
  66. Conyers, L.B. Ground-Penetrating Radar for Geoarchaeology; John Wiley & Sons: Hoboken, NJ, USA, 2016. [Google Scholar]
  67. Conyers, L.B. Ground-Penetrating Radar and Magnetometry for Buried Landscape Analysis; Springer Press: Cham, Switzerland, 2017. [Google Scholar]
  68. Gragson, T.L.; Thompson, V.D.; Leigh, D.S.; Hautefeuille, F. Ground penetrating radar data used in discovery of the early Christian church of Notre Dame de Baudes near Labastide-du-Temple, France. Data Brief 2016, 7, 1588–1593. [Google Scholar] [CrossRef] [PubMed]
  69. Thompson, V.D.; Pluckhahn, T.J. History, complex hunter-gatherers, and the mounds and monuments of Crystal River, Florida, USA: A geophysical perspective. J. Island Coast. Archaeol. 2010, 5, 33–51. [Google Scholar] [CrossRef]
  70. Russo, M. Ringed shell features of the southeast United States: Architecture and midden. In The Cultural Dynamics of Shell-Matrix Sites; Roksanndik, M., Mendonça de Souza, S., Eggers, S., Burchell, M., Klokler, D., Eds.; University of New Mexico Press: Albuquerque, NM, USA, 2014; pp. 21–39. [Google Scholar]
  71. Crook, M.R. Mississippi Period Archaeology of the Georgia Coastal Zone; Series No. 23; University of Georgia, Laboratory of Archaeology: Athens, Georgia, 1986. [Google Scholar]
  72. DePratter, C.B. An Archaeological Survey of Ossabaw Island, Chatham County, Georgia: Preliminary Report; Report on File at the University of Georgia, Laboratory of Archaeology; University of Georgia, Laboratory of Archaeology: Athens, Georgia, 1974. [Google Scholar]
  73. DePratter, C.B. Environmental Changes on the Georgia Coast during the Prehistoric Period. Early Ga. 1977, 5, 1–14. [Google Scholar]
  74. Pearson, C.E. Prehistoric Settlement and Sites on Ossabaw Island, Georgia: An Atlas; Manuscript 614; University of Georgia, Laboratory of Archaeology: Athens, Georgia, 2014. [Google Scholar]
  75. DePratter, C.B.; Legg, J.B.; South, S. “Gone but Not Forgotten” African American Cemeteries on the United States Marine Corps Recruit Depot, Parris Island, South Carolina; South Carolina Institute of Archaeology and Anthropology Research Manuscript Series 234; University of South Carolina: Columbia, SC, USA, 2016. [Google Scholar]
  76. Bailey, G. Time perspectives, palimpsests and the archaeology of time. J. Anthropol. Archaeol. 2007, 26, 198–223. [Google Scholar] [CrossRef] [Green Version]
  77. Burks, J. The Highland County Gist Settlement (33HI417): Archaeological Investigation into the Results of Manumission at a Settlement of Freedmen in Southern Ohio; Contract Report #2014-03; Ohio Valley Archaeology, Inc.: Columbus, OH, USA, 2016. [Google Scholar]
  78. Pecora, A.M.; Burks, J. Phase II Archaeological Assessments of Sites 33DL1831 and 33DL1837, Delaware County, Ohio; Ohio Valley Archaeology, Inc.: Columbus, OH, USA, 2006. [Google Scholar]
  79. Pecora, A.M.; Burks, J. Phase III Archaeological Data Recovery of Site 33DL1837, Delaware County, Ohio; Ohio Valley Archaeology, Inc.: Columbus, OH, USA, 2007. [Google Scholar]
  80. Pecora, A.M.; Burks, J. Phase II Archaeological Assessment of the Manns Site (33LE736) within the Proposed 80-Acre Riverwalk Planned Community and Marina near Proctorville, Union Township, Lawrence County, Ohio; Ohio Valley Archaeology, Inc.: Columbus, OH, USA, 2008. [Google Scholar]
  81. Cook, R.A.; Burks, J. Determining Site Size and Structure in Cases of Low Surface Visibility: A Fort Ancient Example. Am. Antiq. 2011, 76, 145–162. [Google Scholar] [CrossRef]
  82. Meyers, M. Political Economy of Exotic Trade on the Mississippian Frontier: A Case Study of a Fourteenth Century Chiefdom in Southwestern Virginia; University of Kentucky: Lexington, KY, USA, 2011. [Google Scholar]
  83. Intergovernmental Panel on Climate Change. Climate Change 2014: Synthesis Report; IPCC: Geneva, Switzerland, 2014. [Google Scholar]
  84. DePratter, C.B.; South, S. Charlesfort: The 1989 Search Project; South Carolina Institute of Archaeology and Anthropology Research Manuscript Series 210; University of South Carolina: Columbia, SC, USA, 1990. [Google Scholar]
  85. Martindale, A.; Letham, B.; McLaren, D.; Archer, D.; Burchell, M.; Schöne, B.R. Mapping of subsurface shell midden components through percussion coring: Examples from the Dundas Islands. J. Archaeol. Sci. 2009, 36, 1565–1575. [Google Scholar] [CrossRef]
Figure 1. Location of Santa Elena, Parris Island, South Carolina, United States.
Remotesensing 10 00248 g001
Figure 2. LiDAR map of the Santa Elena site with known Spanish forts and modern features labeled. The red outline indicates the extent of the shovel test survey. The map to the right includes the locations of each shovel test and the locations of previous block excavations at the site. Red indicates higher elevations. Green indicates lower elevations. LiDAR data were processed in ArcMap 10.2 with the LAS toolset using the NAD 1983 and NAV 1988 horizontal and vertical datum, respectively.
Remotesensing 10 00248 g002
Figure 3. Aerial view of the Santa Elena site overlain with the 20 m × 20 m grid used to conduct the geophysical surveys. Interpretations of Spanish settlement features are adapted from DePratter and South (1995:83–87).
Remotesensing 10 00248 g003
Figure 4. Maps showing the coverage of each geophysical survey method. From left to right: magnetic gradiometry, ground penetrating radar, and electrical resistivity. Contour spacing is 1 m. Contours are based on the LiDAR dataset and use the NAD 1983 and NAV 1988 horizontal and vertical datum, respectively.
Remotesensing 10 00248 g004
Figure 5. The distribution of Stallings period ceramics recorded through a shovel test survey. Circular patterns discussed in the text are indicated by dashed circles. Areas whited-out were not shovel tested. Contour spacing is 1 m. Contours are based on the LiDAR dataset and use the NAD 1983 and NAV 1988 horizontal and vertical datum, respectively.
Remotesensing 10 00248 g005
Figure 6. The distribution of Refuge/Deptford period (left) and Wilmington/St. Catherine’s period (right) ceramics recorded through a shovel test survey. Circular pattern referenced in the text is indicated by a dashed circle. Areas whited-out were not shovel tested. Contour spacing is 1 m. Contours are based on the LiDAR dataset and use the NAD 1983 and NAV 1988 horizontal and vertical datum, respectively.
Remotesensing 10 00248 g006
Figure 7. Two circular patterns identified in the distribution of Stallings ceramics as recorded through a shovel test survey including the location of excavation unit 38BU162Y where a potential Stallings period house floor was identified. The legend for the distribution of Stallings period ceramics is the same as that used in Figure 5. Distribution data is underlain by a gradiometer survey.
Remotesensing 10 00248 g007
Figure 8. The distribution of Irene and Altamaha period ceramics recorded through a shovel test survey. Two potential council houses are identified by black dotted circles. Areas whited-out were not shovel tested. Dashed red lines indicate arcs mentioned in text. Contour spacing is 1 m. Contours are based on the LiDAR dataset and use the NAD 1983 and NAV 1988 horizontal and vertical datum, respectively.
Remotesensing 10 00248 g008
Figure 9. Two circular features identified in magnetic gradiometry (top) and GPR (bottom) data that possibly represent the remains of two post-Spanish occupation, native council houses.
Remotesensing 10 00248 g009
Figure 10. The distribution of all Spanish period artifacts recorded through a shovel test survey. Areas whited-out were not shovel tested. Contour spacing is 1 m. Contours are based on the LiDAR dataset and use the NAD 1983 and NAV 1988 horizontal and vertical datum, respectively.
Remotesensing 10 00248 g010
Figure 11. The proposed plaza area showing the paucity of both Spanish artifacts (left), magnetic anomalies (center) and an overlay of magnetic anomalies superimposed on artifact distributions (right). The legend for the distribution of total Spanish artifacts is the same as that in Figure 10. Areas whited-out were not shovel tested.
Remotesensing 10 00248 g011
Figure 12. The distribution of Spanish period non-ceramic materials recorded through a shovel test survey. Areas whited-out were not shovel tested. Contour spacing is 1 m. Contours are based on the LiDAR dataset and use the NAD 1983 and NAV 1988 horizontal and vertical datum, respectively.
Remotesensing 10 00248 g012
Figure 13. The distribution of Spanish period non-ceramic materials and the location of shovel tests yielding daub, likely of Spanish origin. Areas whited-out were not shovel tested. Contour spacing is 1 m. Contours are based on the LiDAR dataset and use the NAD 1983 and NAV 1988 horizontal and vertical datum, respectively.
Remotesensing 10 00248 g013
Figure 14. Magnetic gradiometry (top) and GPR (bottom) maps showing the architecture of San Marcos (I).
Remotesensing 10 00248 g014
Figure 15. A composite magnetic gradiometry and GPR map (top) of the architecture of San Marcos (I) accompanied by an historic map of the layout of San Marcos (I) (bottom).
Remotesensing 10 00248 g015aRemotesensing 10 00248 g015b
Figure 16. The distribution of Spanish period earthenware (left) and olive jar (right) ceramics recorded through a shovel test survey. Areas whited-out were not shovel tested. Contour spacing is 1 m. Contours are based on the LiDAR dataset and use the NAD 1983 and NAV 1988 horizontal and vertical datum, respectively.
Remotesensing 10 00248 g016
Figure 17. The distribution of Spanish period Majolica (left) and micaceous red ware (right) ceramics recorded through a shovel test survey. Areas whited-out were not shovel tested. Contour spacing is 1 m. Contours are based on the LiDAR dataset and use the NAD 1983 and NAV 1988 horizontal and vertical datum, respectively.
Remotesensing 10 00248 g017
Figure 18. LiDAR map overlain with GPR data showing a feature that may potentially represent the remains of San Felipe (II). LiDAR data were processed in ArcMap 10.2 with the LAS toolset using the NAD 1983 and NAV 1988 horizontal and vertical datum, respectively.
Remotesensing 10 00248 g018
Figure 19. Map showing the spatial relationships between known Spanish forts, the plaza area, and the distribution of all Spanish artifacts. The legend for the distribution of Spanish artifacts is the same as that used in Figure 10. Areas whited-out were not shovel tested.
Remotesensing 10 00248 g019
Figure 20. Spanish artifact distribution (left) and magnetic gradiometry (center) maps of the potential area within which Pedro Menéndez de Avilés’s house may have been located. Magnetic anomalies are overlain on top of the distribution of Spanish artifacts in the figure to the right. The legend for the distribution of total Spanish artifacts is the same as that used in Figure 10. Areas whited-out were not shovel tested.
Remotesensing 10 00248 g020
Figure 21. Magnetic gradiometry (left), electrical resistivity (center), and GPR (right) maps showing anomalies that may represent the remains of the house of Pedro Menéndez de Avilés.
Remotesensing 10 00248 g021
Figure 22. The distribution of all Spanish period artifacts and the location of shovel tests yielding Italian Blue ceramics (left), Mexican Red ceramics (center), and Chinese Ming Dynasty ceramics (right). Areas whited-out were not shovel tested. Contour spacing is 1 m. Contours are based on the LiDAR dataset and use the NAD 1983 and NAV 1988 horizontal and vertical datum, respectively.
Remotesensing 10 00248 g022
Figure 23. The distribution of Plantation period ceramics (left) and architectural materials (right) recorded through a shovel test survey. Areas whited-out were not shovel tested. Contour spacing is 1 m. Contours are based on the LiDAR dataset and use the NAD 1983 and NAV 1988 horizontal and vertical datum, respectively.
Remotesensing 10 00248 g023
Figure 24. The distribution of Colonoware ceramics recorded through a shovel test survey. Areas whited-out were not shovel tested. Contour spacing is 1 m. Contours are based on the LiDAR dataset and use the NAD 1983 and NAV 1988 horizontal and vertical datum, respectively.
Remotesensing 10 00248 g024

