Seismic Remote Sensing of Super Typhoon Lupit (2009) with Seismological Array Observation in NE China

 , ,
, , 
Abstract
1. Introduction
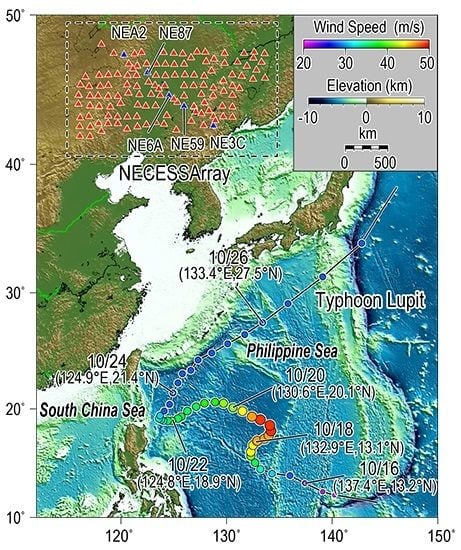
2. Data
3. Methods
4. Results and Discussions
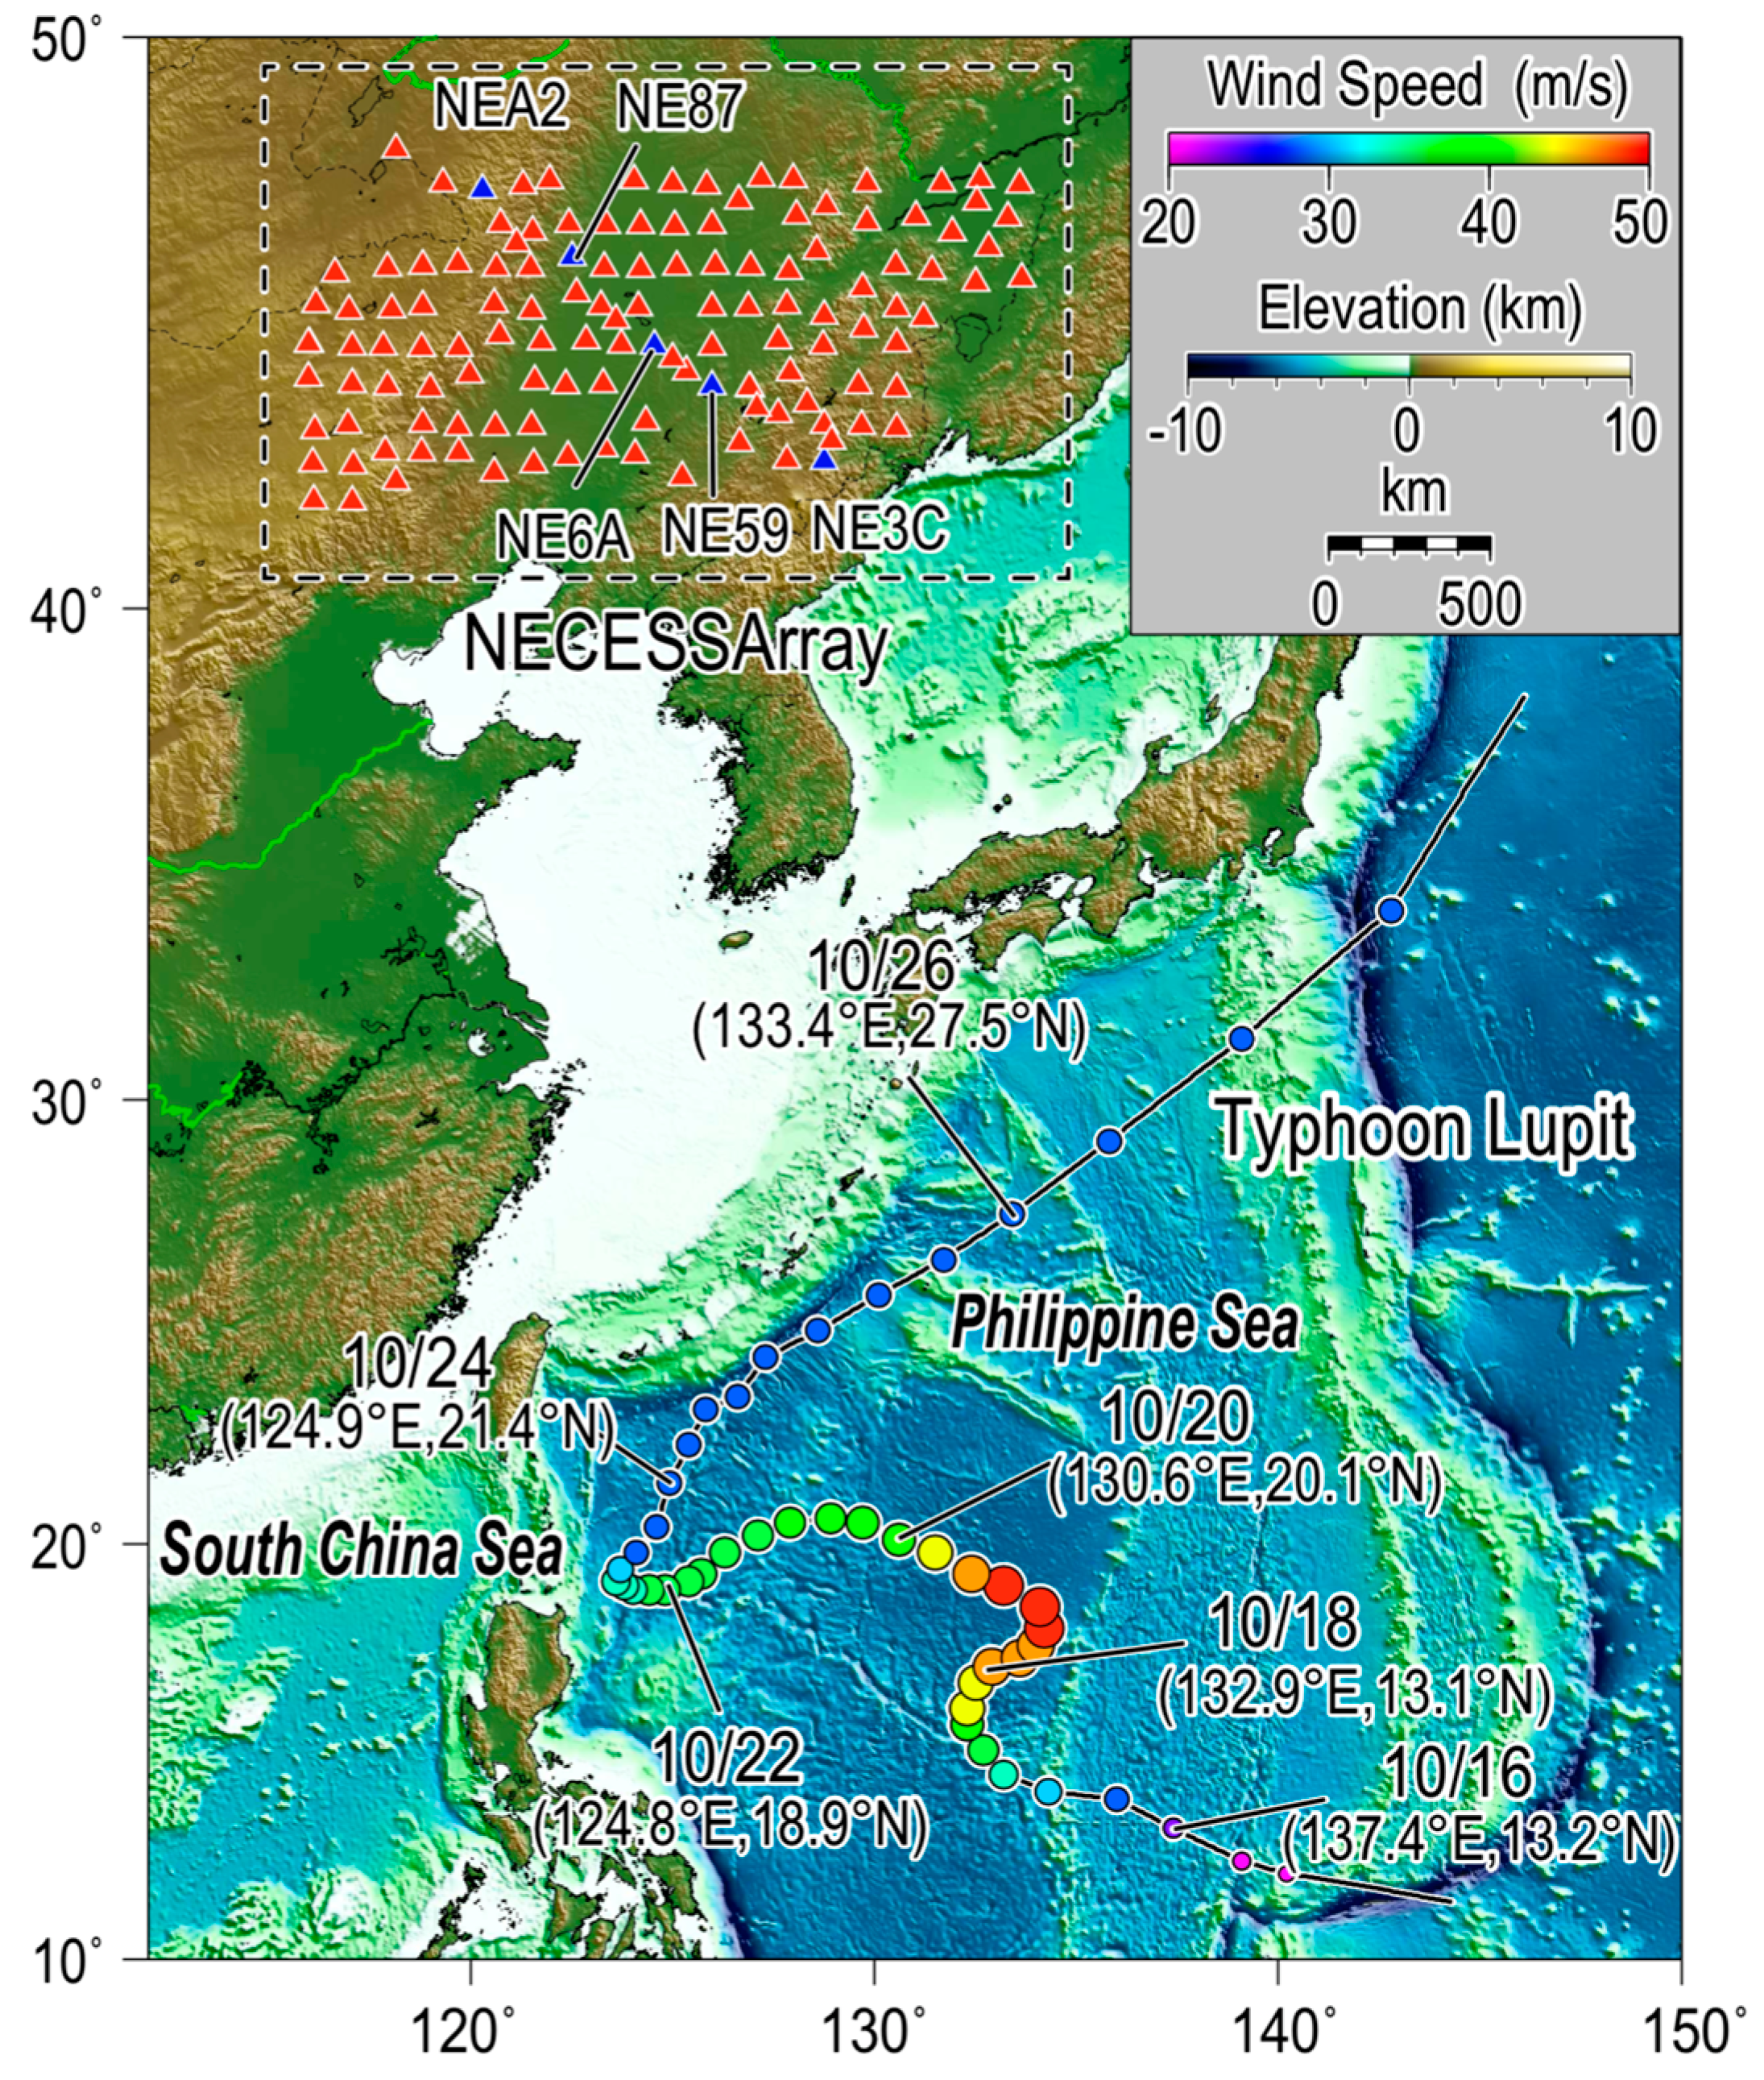
4.1. Beamformer Output
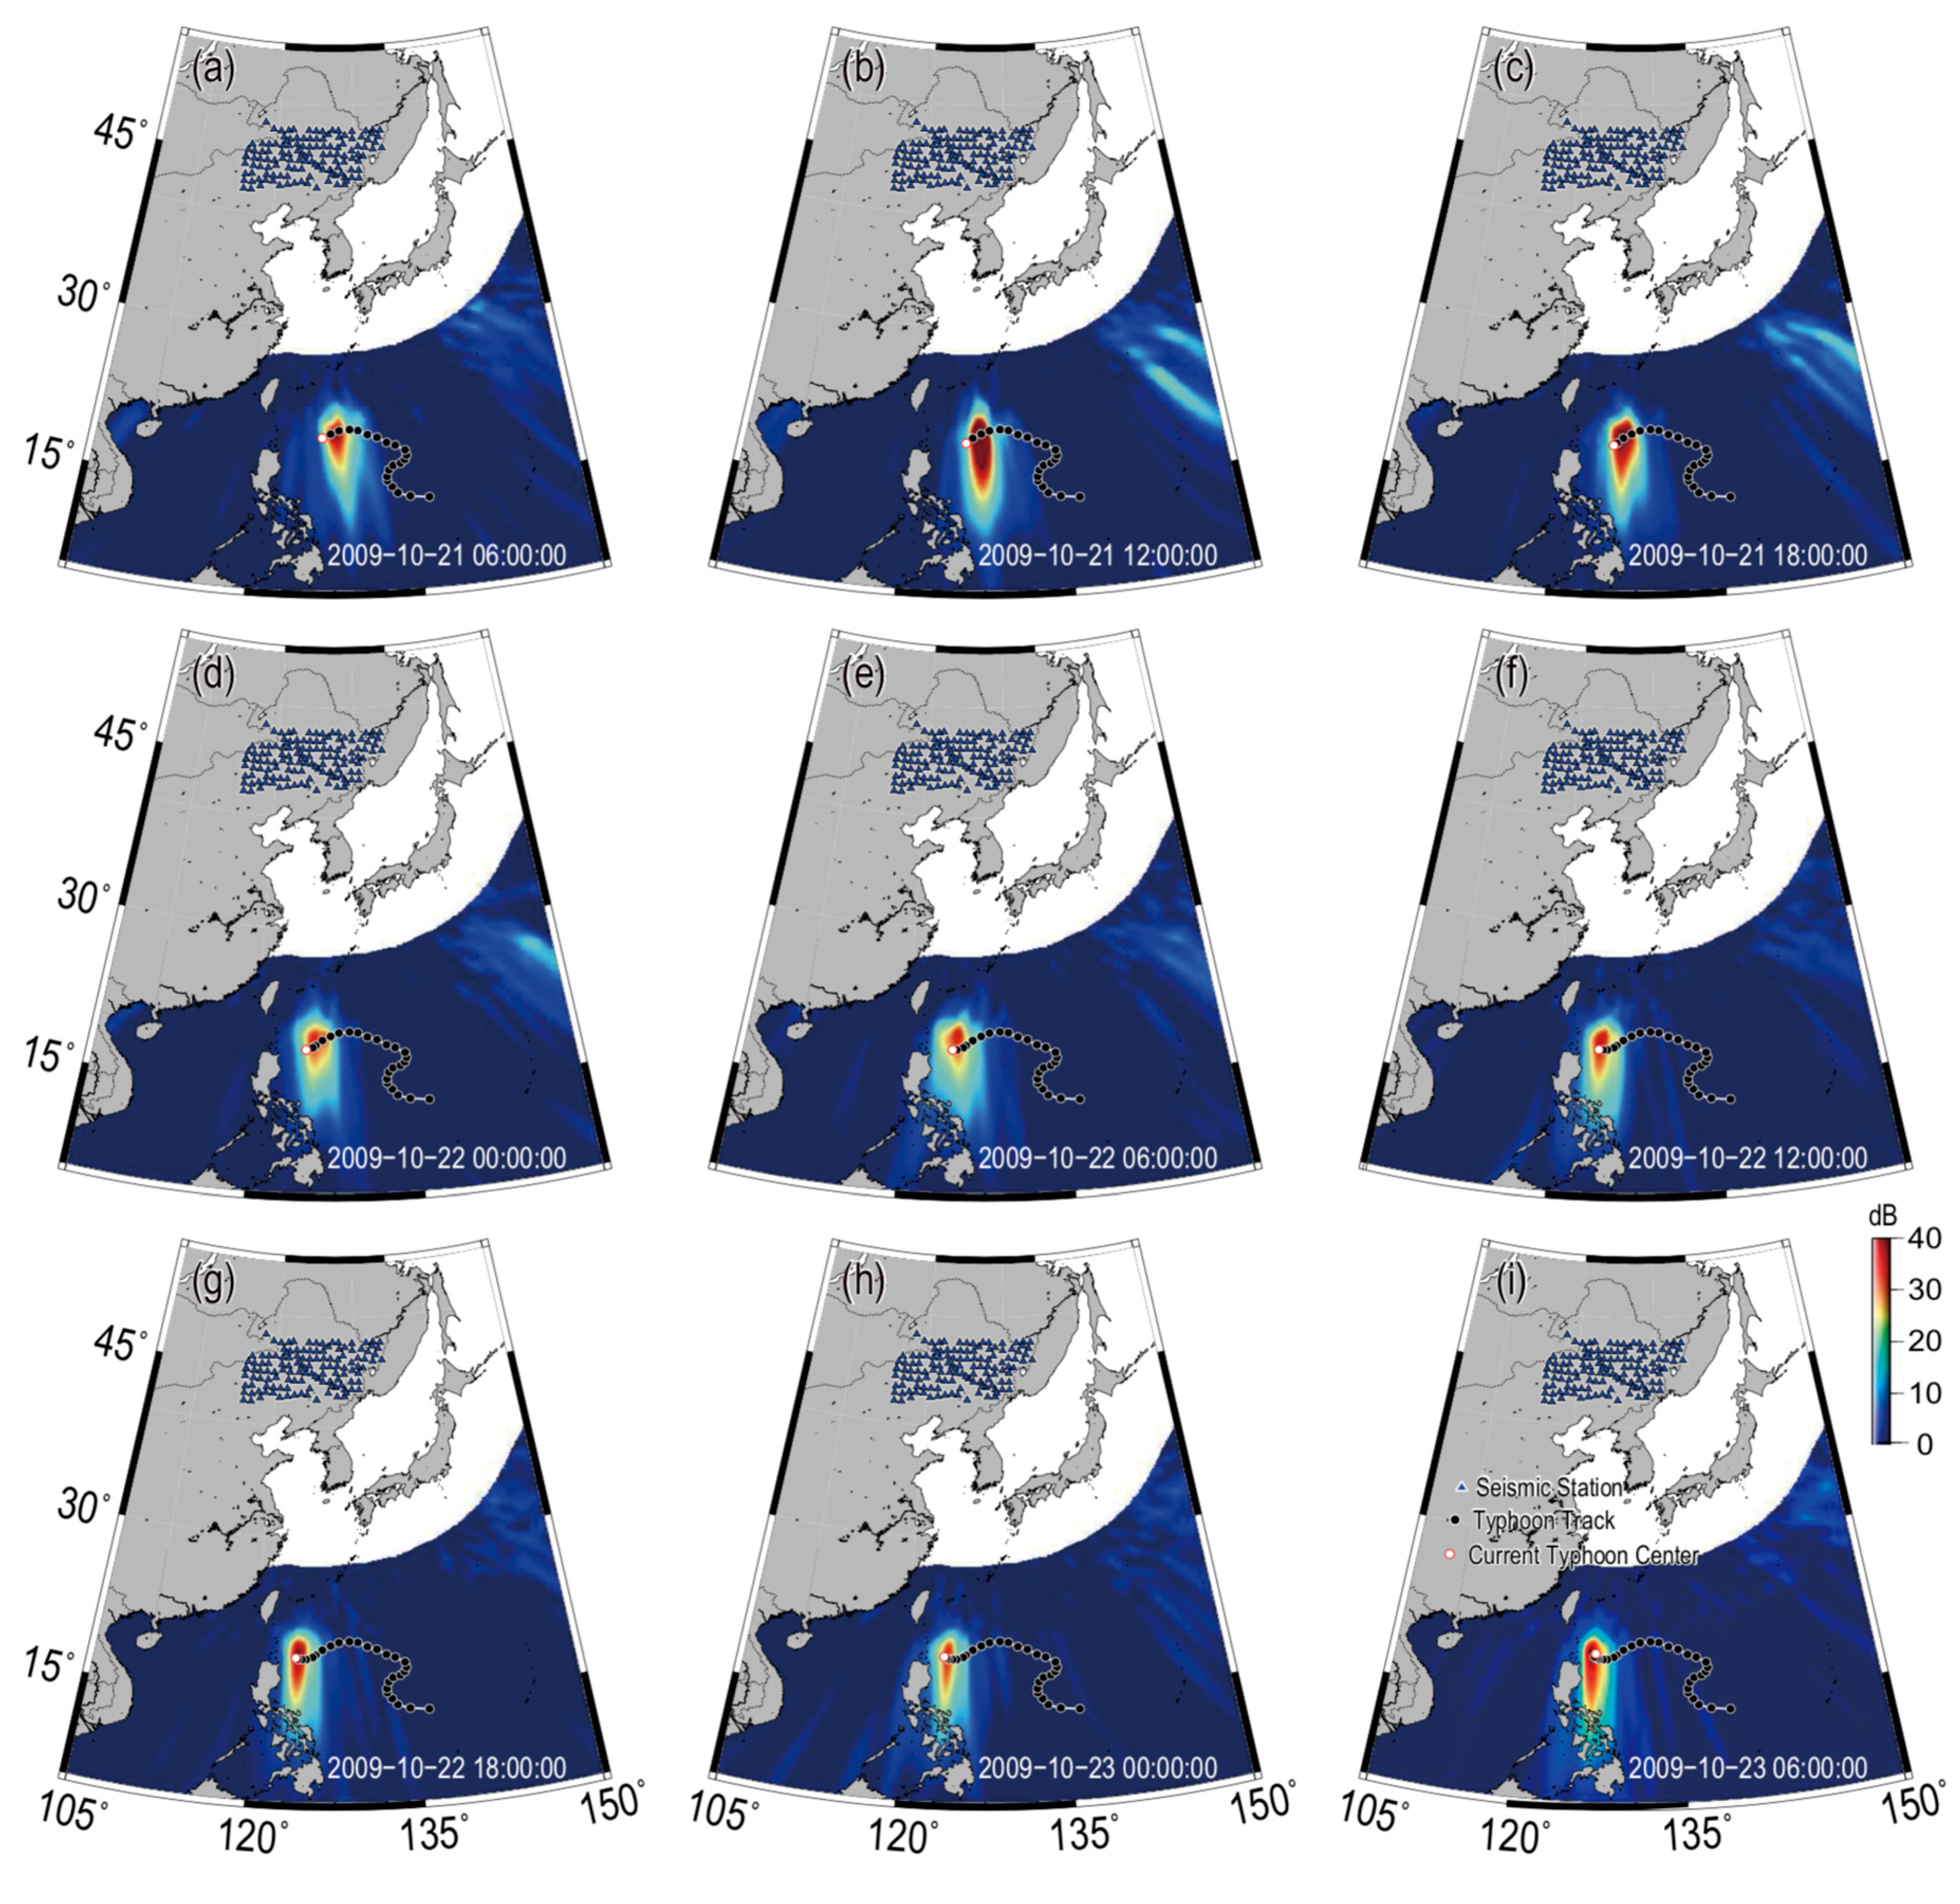
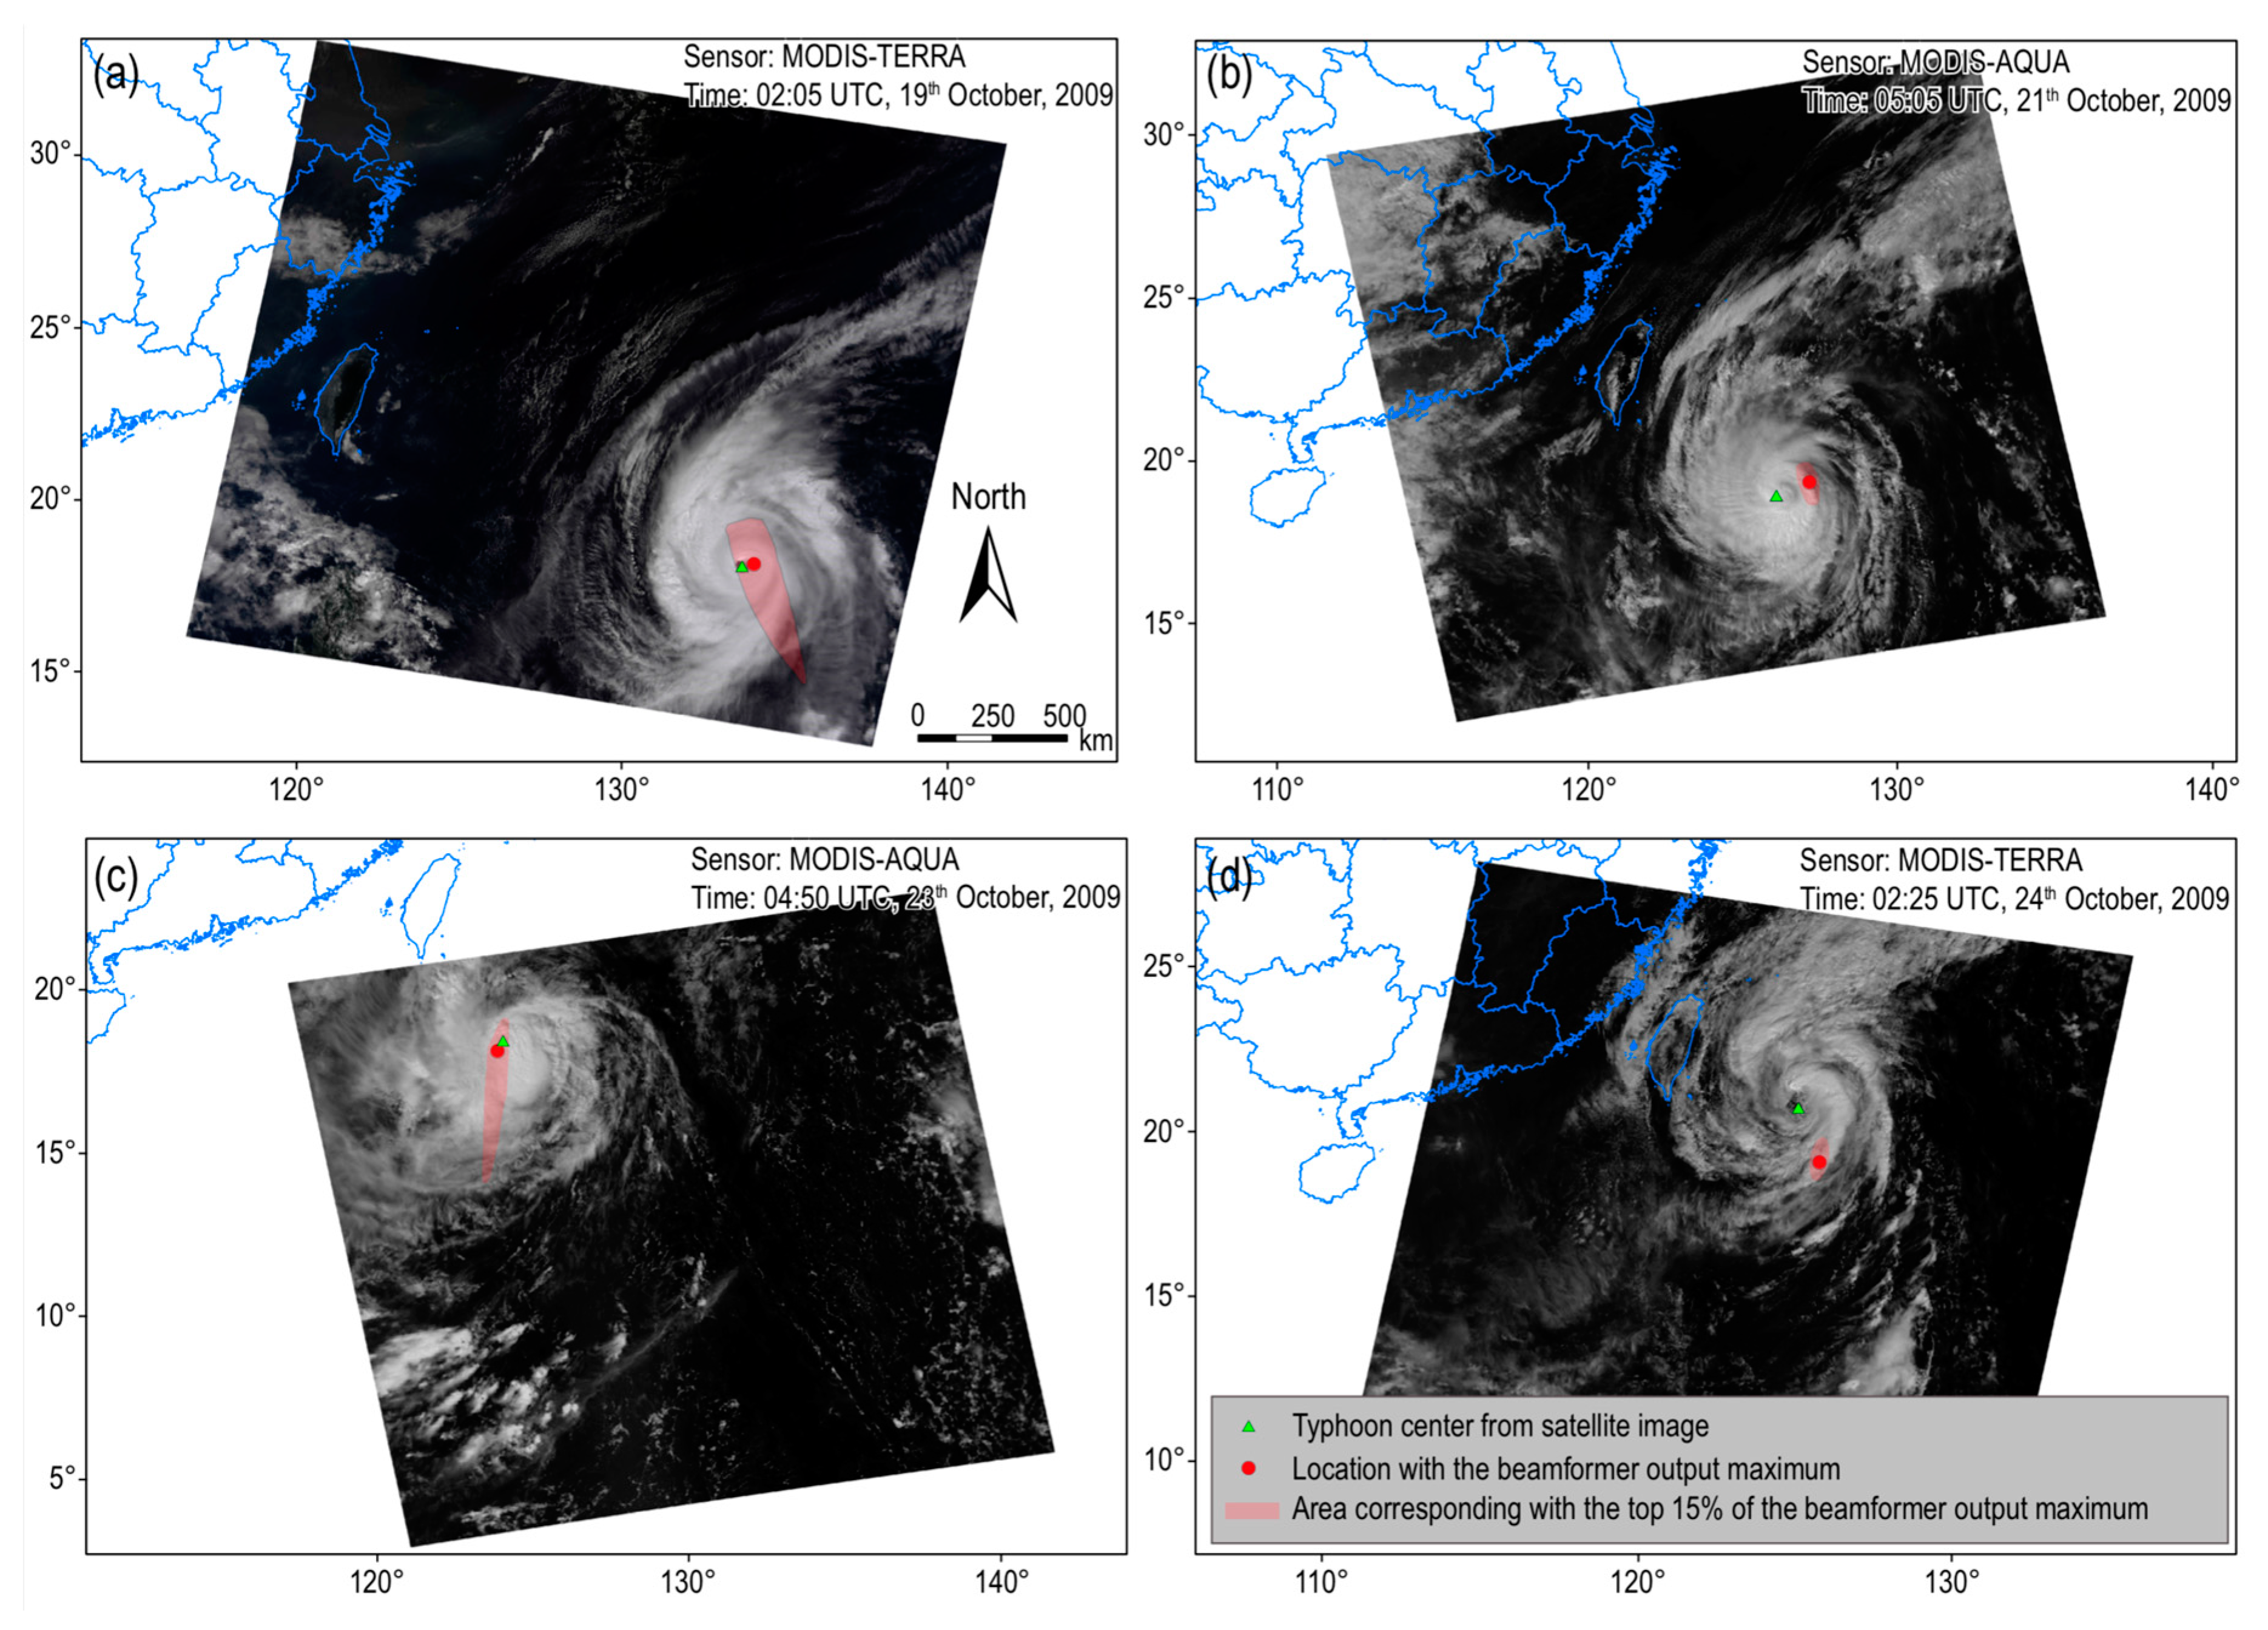
4.2. Localization Deviation
4.3. Causes of Localization Deviations
5. Conclusions
Supplementary Materials
Acknowledgments
Author Contributions
Conflicts of Interest
References
- Gerstoft, P.; Fehler, M.C.; Sabra, K.G. When Katrina hit California. Geophys. Res. Lett. 2006, 33, L17308. [Google Scholar] [CrossRef]
- Wilson, J.D.; Makris, N.C. Ocean acoustic hurricane classification. J. Acoust. Soc. Am. 2006, 119, 168–181. [Google Scholar] [CrossRef] [PubMed]
- Wilson, J.D.; Makris, N.C. Quantifying hurricane destructive power, wind speed, and air-sea material exchange with natural undersea sound. Geophys. Res. Lett. 2008, 35, L10603. [Google Scholar] [CrossRef]
- Chi, W.C.; Chen, W.J.; Kuo, B.Y.; Dolenc, D. Seismic monitoring of western Pacific typhoons. Mar. Geophys. Res. 2010, 31, 239–251. [Google Scholar] [CrossRef]
- Chan, H.C.; Chen, C.F. Underwater acoustic sensing applied to estimation of typhoon wind speed. Int. J. Remote Sens. 2012, 33, 7398–7412. [Google Scholar] [CrossRef]
- Sun, T.H.Z.; Xue, M.; Le, K.P.; Zhang, Y.W.; Xu, H.P. Signatures of ocean storms on seismic records in South China Sea and East China Sea. Mar. Geophys. Res. 2013, 34, 431–448. [Google Scholar] [CrossRef]
- Sufri, O.; Koper, K.D.; Burlacu, R.; Foy, B.D. Microseisms from Superstorm Sandy. Earth Planet. Sci. Lett. 2014, 402, 324–336. [Google Scholar] [CrossRef]
- Davy, C.; Barruol, G.; Fontaine, F.R.; Sigloch, K.; Stutzmann, E. Tracking major storms from microseismic and hydroacoustic observations on the seafloor. Geophys. Res. Lett. 2014, 41, 8825–8831. [Google Scholar] [CrossRef]
- Zhao, Z.X.; D’Asaro, E.A.; Nystuen, J.A. The sound of tropical cyclones. J. Phys. Oceanogr. 2014, 44, 2763–2778. [Google Scholar] [CrossRef]
- Longuet-Higgins, M.S. A theory of the Origin of Microseisms. Philos. Trans. R. Soc. Lond. Ser. A Math. Phys. Sci. 1950, 243, 1–35. [Google Scholar] [CrossRef]
- Lin, J.M.; Lin, J.; Xu, M. Microseisms generated by super typhoon Megi in the western Pacific Ocean. J. Geophys. Res. Oceans 2017, 122, 9518–9529. [Google Scholar] [CrossRef]
- Friedrich, A.; Kruger, F.; Klinge, K. Ocean generated microseismic noise located with the Grafenberg array. J. Seismol. 1998, 2, 47–64. [Google Scholar] [CrossRef]
- Bromirski, P.D. Vibrations from the “Perfect Storm”. Geochem. Geophy. Geosyst. 2001, 2, 1030. [Google Scholar] [CrossRef]
- Gerstoft, P.; Shearer, P.M.; Harmon, N.; Zhang, J. Global P, PP, and PKP wave microseisms observed from distant storms. Geophys. Res. Lett. 2008, 35, L23306. [Google Scholar] [CrossRef]
- Zhang, J.; Gerstoft, P.; Bromirski, P.D. Pelagic and coastal sources of P-wave microseisms: Generation under tropical cyclones. Geophys. Res. Lett. 2010, 37, L15301. [Google Scholar] [CrossRef]
- Hasselmann, K.A. Statistical analysis of the generation of microseisms. Rev. Geophys. 1963, 1, 177–210. [Google Scholar] [CrossRef]
- Haubrich, R.A.; McCamy, K. Microseisms: Coastal and pelagic sources. Rev. Geophys. 1969, 7, 539–571. [Google Scholar] [CrossRef]
- Webb, S.C. Broadband seismology and noise under the ocean. Rev. Geophys. 1998, 36, 105–142. [Google Scholar] [CrossRef]
- Ardhuin, F.; Gualtieri, L.; Stutzmann, E. How ocean waves rock the Earth: Two mechanisms explain microseisms with periods 3 to 300 s. Geophys. Res. Lett. 2015, 42, 765–772. [Google Scholar] [CrossRef]
- Ardhuin, F.; Stutzmann, E.; Schimmel, M.; Mangeney, A. Ocean wave sources of seismic noise. J. Geophys. Res. 2011, 116, C09004. [Google Scholar] [CrossRef]
- LaCoss, R.T.; Kelly, E.J.; Toksöz, M.N. Estimation of seismic noise using Arrays. Geophysics 1969, 34, 21–38. [Google Scholar] [CrossRef]
- Cessaro, R. Sources of primary and secondary microseisms. Bull. Seismol. Soc. Am. 1994, 84, 142–148. [Google Scholar]
- Bromirski, P.D.; Duennebier, F.K. The near-coastal microseism spectrum: Spatial and temporal wave climate relationships. J. Geophys. Res. 2002, 107, ESE 5-1–ESE 5-20. [Google Scholar] [CrossRef]
- Tanimoto, T.; Ishimaru, S.; Alvizuri, C. Seasonality in particle motion of microseisms. Geophys. J. Int. 2006, 166, 253–266. [Google Scholar] [CrossRef]
- Tanimoto, T. Excitation of microseisms. Geophys. Res. Lett. 2007, 34, L05308. [Google Scholar] [CrossRef]
- Gerstoft, P.; Tanimoto, T. A year of microseisms in southern California. Geophys. Res. Lett. 2007, 34, L20304. [Google Scholar] [CrossRef]
- Juretzek, C.; Hadziioannou, C. Where do ocean microseisms come from? A study of Love-to-Rayleigh wave ratios. J. Geophys. Res. Solid Earth 2016, 121, 1–16. [Google Scholar] [CrossRef]
- Koper, K.D.; Foy, B.D. Seasonal anisotropy of short-period seismic noise recorded in South Asia. Bull. Seismol. Soc. Am. 2008, 98, 3033–3045. [Google Scholar] [CrossRef]
- Koper, K.D.; Foy, B.D.; Benz, H. Composition and variation of noise recorded at the Yellowknife Seismic Array, 1991–2007. J. Geophys. Res. 2009, 114, B10310. [Google Scholar] [CrossRef]
- Landès, M.; Hubans, F.; Shapiro, N.M.; Paul, A.; Campillo, M. Origin of deep ocean microseisms by using teleseismic body waves. J. Geophys. Res. 2010, 115, B05302. [Google Scholar] [CrossRef]
- Ramirez, J.E. An experimental investigation of the nature and origin of microseisms at St. Louis, Missouri. Bull. Seismol. Soc. Am. 1940, 30, 35–84. [Google Scholar]
- Gilmore, M.H. Microseisms and ocean storms. Bull. Seismol. Soc. Am. 1946, 36, 89–119. [Google Scholar]
- Wilson, J.D. Quantifying Hurricane Wind Speed with Undersea Sound. Ph.D. Dissertation, Joint Program of Massachusetts Institute of Technology and Woods Hole Oceanographic Institution, Cambridge, MA, USA, 14 July 2006. [Google Scholar]
- Wang, J.Y.; Li, F.H. Preliminary study on underwater ambient noise generated by typhoons. Chin. Phys. Lett. 2015, 32, 044301. [Google Scholar] [CrossRef]
- Rost, S.; Thomas, C. Array seismology: Methods and applications. Rev. Geophys. 2002, 40, 1008. [Google Scholar] [CrossRef]
- Bensen, G.D.; Ritzwoller, M.H.; Barmin, M.P.; Levshin, A.L.; Lin, F.; Moschetti, M.P.; Shapiro, N.M.; Yang, Y. Processing seismic ambient noise data to obtain reliable broad-band surface wave dispersion measurements. Geophys. J. Int. 2007, 169, 1239–1260. [Google Scholar] [CrossRef]
- Kennett, B.L.N.; Engdahl, E.R.; Buland, R. Constraints on seismic velocities in the Earth from travel times. Geophys. J. Int. 1995, 122, 108–124. [Google Scholar] [CrossRef]
- Zambon, J.; He, R.; Warner, J. Investigation of hurricane Ivan using the coupled ocean-atmosphere-wave-sediment transport (COAWST) model. Ocean Dyn. 2014, 64, 1535–1554. [Google Scholar] [CrossRef]
- Holthuijsen, L.H.; Powell, M.D.; Pietrzak, J.D. Wind and waves in extreme hurricanes. J. Geophys. Res. 2012, 117, C09003. [Google Scholar] [CrossRef]
- Shao, W.Z.; Li, X.F.; Hwang, P.; Zhang, B.; Yang, X.F. Bridging the gap between cyclone wind and wave by C-band SAR measurements. J. Geophys. Res. Oceans 2017, 122, 6714–6724. [Google Scholar] [CrossRef]
- Harjes, H.P.; Henger, M. Array-Seismologie. Z. Geophs. 1973, 39, 865–905. [Google Scholar]
- Cathles, L.M., IV; Okal, E.A.; MacAyeal, D.R. Seismic observations of sea swell on the floating Ross Ice Shelf, Antarctic. J. Geophys. Res. 2009, 114, F02015. [Google Scholar] [CrossRef]
- Wessel, P.; Smith, W.H.F. New improved version of Generic Mapping Tools released. EOS Trans. AGU 1998, 79, 579. [Google Scholar] [CrossRef]


| Acquisition Date and Time (UTC) | Typhoon Eye Location | Satellite | p-wave DF Microseism Source Location | Localization Deviation (km) |
|---|---|---|---|---|
| 19 October 2009, 02:05 | 18.70° N, 133.86° E | TERRA | 18.75° N, 134.25° E | 41.54 |
| 21 October 2009, 05:05 | 19.65° N, 126.25° E | AQUA | 20.05° N, 127.35° E | 123.93 |
| 23 October 2009, 04:50 | 19.41° N, 123.72° E | AQUA | 19.05° N, 123.55° E | 43.42 |
| 24 October 2009, 02:25 | 21.67° N, 125.26° E | TERRA | 19.95° N, 125.95° E | 203.98 |
© 2018 by the authors. Licensee MDPI, Basel, Switzerland. This article is an open access article distributed under the terms and conditions of the Creative Commons Attribution (CC BY) license (http://creativecommons.org/licenses/by/4.0/).
Share and Cite
Lin, J.; Wang, Y.; Wang, W.; Li, X.; Fang, S.; Chen, C.; Zheng, H. Seismic Remote Sensing of Super Typhoon Lupit (2009) with Seismological Array Observation in NE China. Remote Sens. 2018, 10, 235. https://doi.org/10.3390/rs10020235
Lin J, Wang Y, Wang W, Li X, Fang S, Chen C, Zheng H. Seismic Remote Sensing of Super Typhoon Lupit (2009) with Seismological Array Observation in NE China. Remote Sensing. 2018; 10(2):235. https://doi.org/10.3390/rs10020235
Chicago/Turabian StyleLin, Jianmin, Yating Wang, Weitao Wang, Xiaofeng Li, Sunke Fang, Chao Chen, and Hong Zheng. 2018. "Seismic Remote Sensing of Super Typhoon Lupit (2009) with Seismological Array Observation in NE China" Remote Sensing 10, no. 2: 235. https://doi.org/10.3390/rs10020235
APA StyleLin, J., Wang, Y., Wang, W., Li, X., Fang, S., Chen, C., & Zheng, H. (2018). Seismic Remote Sensing of Super Typhoon Lupit (2009) with Seismological Array Observation in NE China. Remote Sensing, 10(2), 235. https://doi.org/10.3390/rs10020235